Soil Dynamics and Earthquake...
20
Experimental study of the dynamic interaction between the foundation of the NEES/UCSD Shake Table and the surrounding soil: Reaction block response J.E. Luco a,n , O. Ozcelik b , J.P. Conte a , L.H. Mendoza c a Department of Structural Engineering, University of California, San Diego, La Jolla, CA 92093-0085, USA b Civil Engineering Department, Dokuz Eylul University, Tinaztepe Yerleskesi, Buca/Izmir 35160, Turkey c Centro de Investigacion Cientifica y de Educacion Superior de Ensenada (CICESE), Ensenada, Baja California, Mexico article info Article history: Received 11 January 2010 Received in revised form 22 December 2010 Accepted 8 March 2011 Available online 3 April 2011 Keywords: Soil–foundation interaction Dynamics Forced vibration tests Experimental methods abstract An extensive experimental study of the dynamic interaction between the foundation block for the NEES/UCSD Large High Performance Outdoor Shake Table and the surrounding soil was conducted in 2003. The vibrations induced by the two NEES@UCLA large eccentric mass shakers were recorded at multiple stations within the reinforced concrete foundation block and on the surface of the surrounding soil up to distances of 270 m from the block. The present paper focuses on analysis of the data recorded within the reaction block including the average rigid body motion of the foundation and its dependence on frequency, and the deformation of the block for longitudinal (EW), transverse (NS), and torsional excitation. Comparison of the reaction block response during shaker induced vibrations with that for the much stronger actuator forces shows that linearity holds for the range of forces involved. Comparisons with analytical results for a simplified model of the foundation show good agreement between experimental and theoretical results. & 2011 Elsevier Ltd. All rights reserved. 1. Introduction The construction of the foundation block for the NEES/UCSD Large High Performance Outdoor Shake Table (Fig. 1), which is part of the George E. Brown, Jr. Network for Earthquake Engineer- ing Simulation (NEES) created a rare opportunity for an extensive experimental study of dynamic soil–foundation interaction effects. The large forces that the actuators of the shake table exert on the reaction block and the soil suggested the need to determine the induced ground motion in the vicinity of the table, as well as the need to evaluate the effects that any motion of the block itself would have on the control of the shake table. Although the shake table would operate initially with only longitudinal motion, it was designed to be readily upgradeable to six degrees of freedom. For this reason, it was necessary to estimate the response of the foundation block to at least longitudinal, trans- verse, and torsional excitation. To simulate the forces that the actuators would exert on the reaction block, the two large NEES/ UCLA MK-15 eccentric mass shakers with a maximum force capacity of 0.445 MN (100,000 lb) each were mounted on the block at locations near the intended supports of the actuators. In tests conducted in October 21–24, 2003, the three-dimensional dynamic response at 19 locations on the reaction block; at 12 points on the foundation of the adjacent auxiliary building; and at 33 locations on the surface of the ground surrounding the shake table up to distances of over 270 m were recorded for long- itudinal, transverse, and torsional excitation of the block with frequencies in the range from 0 to 20 Hz. The first objective of the overall experimental study was to obtain dynamic ground motion data, and by inference geotechni- cal data, which will prove invaluable in the development of a future virtual model of the complete NEES/UCSD Shake Table Facility including a soil island surrounding the shake table and the adjacent soil pit, the reinforced concrete foundation block, the steel platen, the actuators and control system, and the test specimens [1]. The second objective of the study was to develop a body of dynamic high-quality response data on the foundation and surrounding soil that can be used to test and validate soil– structure interaction analysis methods and computer codes. In particular, the data would offer experimental information on the coupling through the soil between adjacent foundations. The study would complement the limited number of existing full- scale experimental studies of soil–structure interaction listed in the comprehensive review presented by Trifunac et al. [2]. The final objective was to validate the unconventional design of the NEES@UCSD foundation block in terms of its overall dynamic Contents lists available at ScienceDirect journal homepage: www.elsevier.com/locate/soildyn Soil Dynamics and Earthquake Engineering 0267-7261/$ - see front matter & 2011 Elsevier Ltd. All rights reserved. doi:10.1016/j.soildyn.2011.03.003 n Corresponding author. E-mail address: [email protected] (J.E. Luco). Soil Dynamics and Earthquake Engineering 31 (2011) 954–973
Transcript of Soil Dynamics and Earthquake...
Soil Dynamics and Earthquake Engineering 31 (2011) 954–973
Contents lists available at ScienceDirect
Soil Dynamics and Earthquake Engineering
0267-72
doi:10.1
n Corr
E-m
journal homepage: www.elsevier.com/locate/soildyn
Experimental study of the dynamic interaction between the foundationof the NEES/UCSD Shake Table and the surrounding soil: Reactionblock response
J.E. Luco a,n, O. Ozcelik b, J.P. Conte a, L.H. Mendoza c
a Department of Structural Engineering, University of California, San Diego, La Jolla, CA 92093-0085, USAb Civil Engineering Department, Dokuz Eylul University, Tinaztepe Yerleskesi, Buca/Izmir 35160, Turkeyc Centro de Investigacion Cientifica y de Educacion Superior de Ensenada (CICESE), Ensenada, Baja California, Mexico
a r t i c l e i n f o
Article history:
Received 11 January 2010
Received in revised form
22 December 2010
Accepted 8 March 2011Available online 3 April 2011
Keywords:
Soil–foundation interaction
Dynamics
Forced vibration tests
Experimental methods
61/$ - see front matter & 2011 Elsevier Ltd. A
016/j.soildyn.2011.03.003
esponding author.
ail address: [email protected] (J.E. Luco).
a b s t r a c t
An extensive experimental study of the dynamic interaction between the foundation block for the
NEES/UCSD Large High Performance Outdoor Shake Table and the surrounding soil was conducted in
2003. The vibrations induced by the two NEES@UCLA large eccentric mass shakers were recorded at
multiple stations within the reinforced concrete foundation block and on the surface of the surrounding
soil up to distances of 270 m from the block. The present paper focuses on analysis of the data recorded
within the reaction block including the average rigid body motion of the foundation and its dependence
on frequency, and the deformation of the block for longitudinal (EW), transverse (NS), and torsional
excitation. Comparison of the reaction block response during shaker induced vibrations with that for
the much stronger actuator forces shows that linearity holds for the range of forces involved.
Comparisons with analytical results for a simplified model of the foundation show good agreement
between experimental and theoretical results.
& 2011 Elsevier Ltd. All rights reserved.
1. Introduction
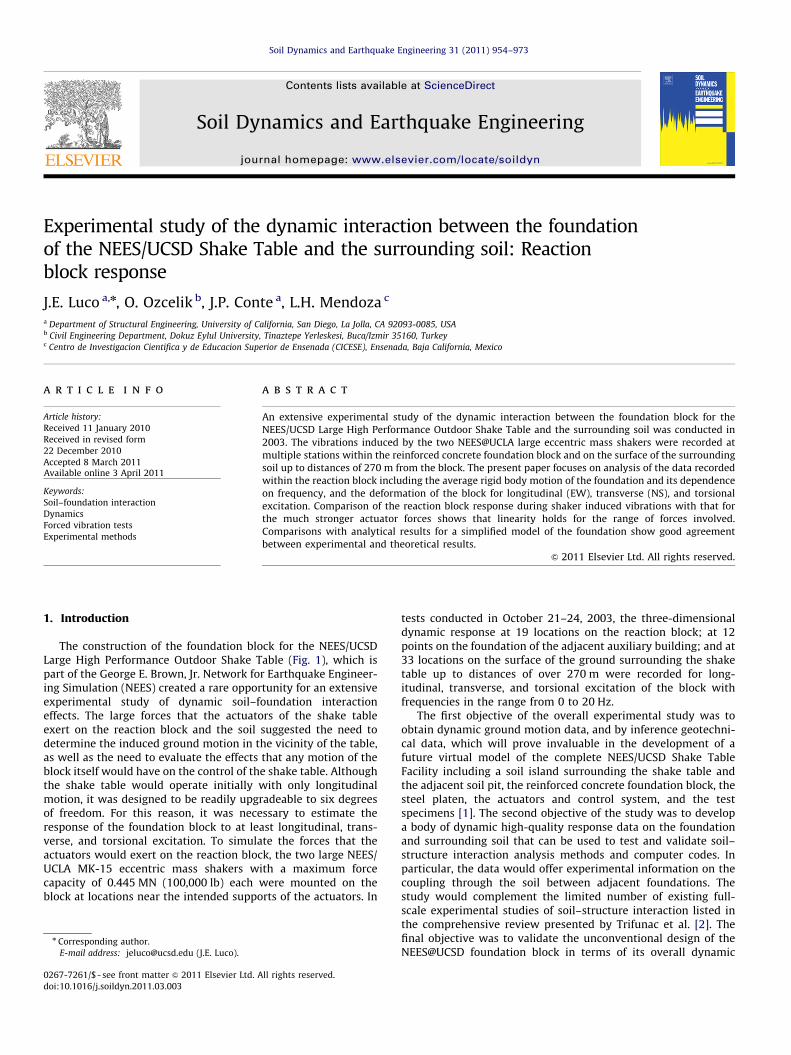
The construction of the foundation block for the NEES/UCSDLarge High Performance Outdoor Shake Table (Fig. 1), which ispart of the George E. Brown, Jr. Network for Earthquake Engineer-ing Simulation (NEES) created a rare opportunity for an extensiveexperimental study of dynamic soil–foundation interactioneffects. The large forces that the actuators of the shake tableexert on the reaction block and the soil suggested the need todetermine the induced ground motion in the vicinity of the table,as well as the need to evaluate the effects that any motion of theblock itself would have on the control of the shake table. Althoughthe shake table would operate initially with only longitudinalmotion, it was designed to be readily upgradeable to six degreesof freedom. For this reason, it was necessary to estimate theresponse of the foundation block to at least longitudinal, trans-verse, and torsional excitation. To simulate the forces that theactuators would exert on the reaction block, the two large NEES/UCLA MK-15 eccentric mass shakers with a maximum forcecapacity of 0.445 MN (100,000 lb) each were mounted on theblock at locations near the intended supports of the actuators. In
ll rights reserved.
tests conducted in October 21–24, 2003, the three-dimensionaldynamic response at 19 locations on the reaction block; at 12points on the foundation of the adjacent auxiliary building; and at33 locations on the surface of the ground surrounding the shaketable up to distances of over 270 m were recorded for long-itudinal, transverse, and torsional excitation of the block withfrequencies in the range from 0 to 20 Hz.
The first objective of the overall experimental study was toobtain dynamic ground motion data, and by inference geotechni-cal data, which will prove invaluable in the development of afuture virtual model of the complete NEES/UCSD Shake TableFacility including a soil island surrounding the shake table andthe adjacent soil pit, the reinforced concrete foundation block, thesteel platen, the actuators and control system, and the testspecimens [1]. The second objective of the study was to developa body of dynamic high-quality response data on the foundationand surrounding soil that can be used to test and validate soil–structure interaction analysis methods and computer codes. Inparticular, the data would offer experimental information on thecoupling through the soil between adjacent foundations. Thestudy would complement the limited number of existing full-scale experimental studies of soil–structure interaction listed inthe comprehensive review presented by Trifunac et al. [2]. Thefinal objective was to validate the unconventional design of theNEES@UCSD foundation block in terms of its overall dynamic
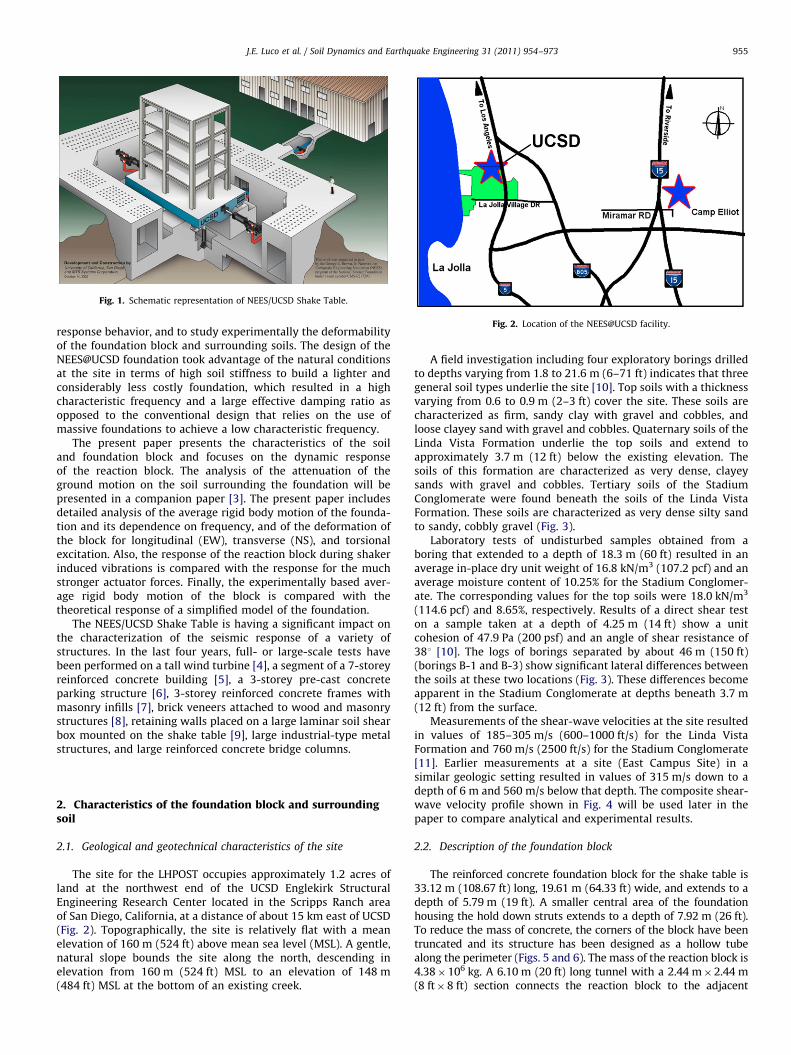
Fig. 1. Schematic representation of NEES/UCSD Shake Table.
Fig. 2. Location of the NEES@UCSD facility.
J.E. Luco et al. / Soil Dynamics and Earthquake Engineering 31 (2011) 954–973 955
response behavior, and to study experimentally the deformabilityof the foundation block and surrounding soils. The design of theNEES@UCSD foundation took advantage of the natural conditionsat the site in terms of high soil stiffness to build a lighter andconsiderably less costly foundation, which resulted in a highcharacteristic frequency and a large effective damping ratio asopposed to the conventional design that relies on the use ofmassive foundations to achieve a low characteristic frequency.
The present paper presents the characteristics of the soiland foundation block and focuses on the dynamic responseof the reaction block. The analysis of the attenuation of theground motion on the soil surrounding the foundation will bepresented in a companion paper [3]. The present paper includesdetailed analysis of the average rigid body motion of the founda-tion and its dependence on frequency, and of the deformation ofthe block for longitudinal (EW), transverse (NS), and torsionalexcitation. Also, the response of the reaction block during shakerinduced vibrations is compared with the response for the muchstronger actuator forces. Finally, the experimentally based aver-age rigid body motion of the block is compared with thetheoretical response of a simplified model of the foundation.
The NEES/UCSD Shake Table is having a significant impact onthe characterization of the seismic response of a variety ofstructures. In the last four years, full- or large-scale tests havebeen performed on a tall wind turbine [4], a segment of a 7-storeyreinforced concrete building [5], a 3-storey pre-cast concreteparking structure [6], 3-storey reinforced concrete frames withmasonry infills [7], brick veneers attached to wood and masonrystructures [8], retaining walls placed on a large laminar soil shearbox mounted on the shake table [9], large industrial-type metalstructures, and large reinforced concrete bridge columns.
2. Characteristics of the foundation block and surroundingsoil
2.1. Geological and geotechnical characteristics of the site
The site for the LHPOST occupies approximately 1.2 acres ofland at the northwest end of the UCSD Englekirk StructuralEngineering Research Center located in the Scripps Ranch areaof San Diego, California, at a distance of about 15 km east of UCSD(Fig. 2). Topographically, the site is relatively flat with a meanelevation of 160 m (524 ft) above mean sea level (MSL). A gentle,natural slope bounds the site along the north, descending inelevation from 160 m (524 ft) MSL to an elevation of 148 m(484 ft) MSL at the bottom of an existing creek.
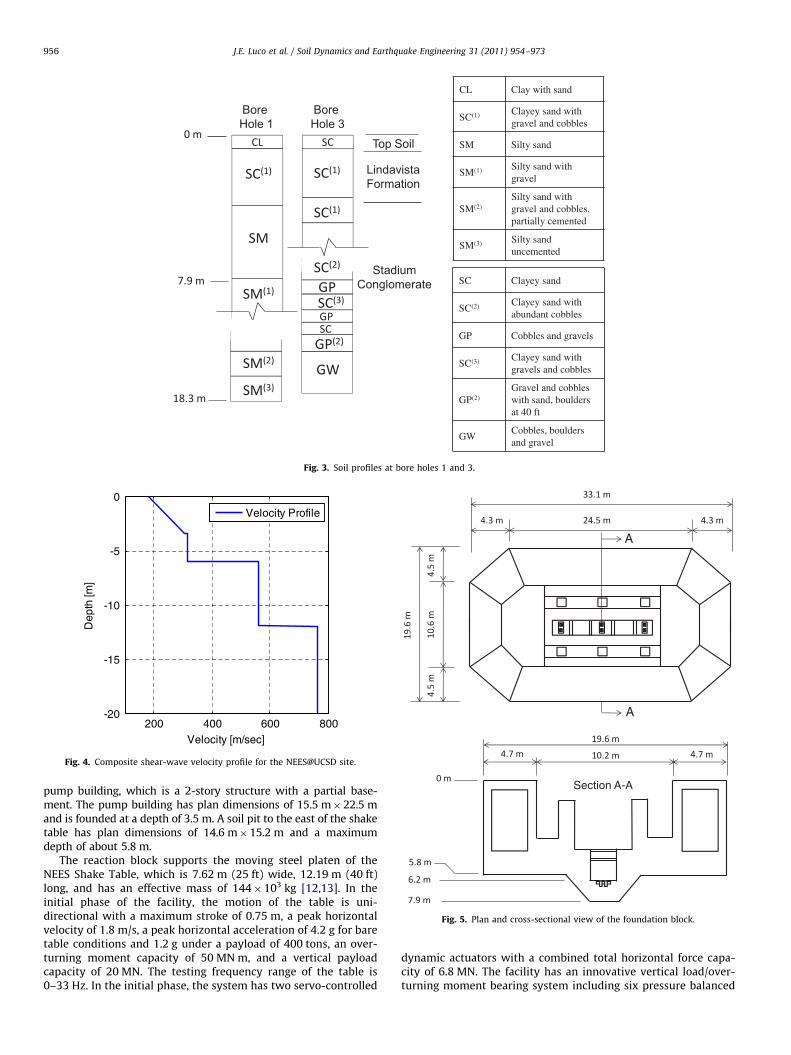
A field investigation including four exploratory borings drilledto depths varying from 1.8 to 21.6 m (6–71 ft) indicates that threegeneral soil types underlie the site [10]. Top soils with a thicknessvarying from 0.6 to 0.9 m (2–3 ft) cover the site. These soils arecharacterized as firm, sandy clay with gravel and cobbles, andloose clayey sand with gravel and cobbles. Quaternary soils of theLinda Vista Formation underlie the top soils and extend toapproximately 3.7 m (12 ft) below the existing elevation. Thesoils of this formation are characterized as very dense, clayeysands with gravel and cobbles. Tertiary soils of the StadiumConglomerate were found beneath the soils of the Linda VistaFormation. These soils are characterized as very dense silty sandto sandy, cobbly gravel (Fig. 3).
Laboratory tests of undisturbed samples obtained from aboring that extended to a depth of 18.3 m (60 ft) resulted in anaverage in-place dry unit weight of 16.8 kN/m3 (107.2 pcf) and anaverage moisture content of 10.25% for the Stadium Conglomer-ate. The corresponding values for the top soils were 18.0 kN/m3
(114.6 pcf) and 8.65%, respectively. Results of a direct shear teston a sample taken at a depth of 4.25 m (14 ft) show a unitcohesion of 47.9 Pa (200 psf) and an angle of shear resistance of381 [10]. The logs of borings separated by about 46 m (150 ft)(borings B-1 and B-3) show significant lateral differences betweenthe soils at these two locations (Fig. 3). These differences becomeapparent in the Stadium Conglomerate at depths beneath 3.7 m(12 ft) from the surface.
Measurements of the shear-wave velocities at the site resultedin values of 185–305 m/s (600–1000 ft/s) for the Linda VistaFormation and 760 m/s (2500 ft/s) for the Stadium Conglomerate[11]. Earlier measurements at a site (East Campus Site) in asimilar geologic setting resulted in values of 315 m/s down to adepth of 6 m and 560 m/s below that depth. The composite shear-wave velocity profile shown in Fig. 4 will be used later in thepaper to compare analytical and experimental results.
2.2. Description of the foundation block
The reinforced concrete foundation block for the shake table is33.12 m (108.67 ft) long, 19.61 m (64.33 ft) wide, and extends to adepth of 5.79 m (19 ft). A smaller central area of the foundationhousing the hold down struts extends to a depth of 7.92 m (26 ft).To reduce the mass of concrete, the corners of the block have beentruncated and its structure has been designed as a hollow tubealong the perimeter (Figs. 5 and 6). The mass of the reaction block is4.38�106 kg. A 6.10 m (20 ft) long tunnel with a 2.44 m�2.44 m(8 ft�8 ft) section connects the reaction block to the adjacent
BoreHole 1
BoreHole 3
Top Soil
LindavistaFormation
StadiumConglomerate
CL Clay with sand
SC(1) Clayey sand with gravel and cobbles
SM Silty sand
SM(1) Silty sand with gravel
SM(2)Silty sand with gravel and cobbles, partially cemented
SM(3) Silty sand uncemented
SC Clayey sand
SC(2) Clayey sand with abundant cobbles
GP Cobbles and gravels
SC(3) Clayey sand with gravels and cobbles
GP(2)Gravel and cobbles with sand, boulders at 40 ft
GWCobbles, boulders and gravel
Fig. 3. Soil profiles at bore holes 1 and 3.
200 400 600 800-20
-15
-10
-5
0
Velocity [m/sec]
Dep
th [m
]
Velocity Profile
Fig. 4. Composite shear-wave velocity profile for the NEES@UCSD site.
A
A
Section A-A
Fig. 5. Plan and cross-sectional view of the foundation block.
J.E. Luco et al. / Soil Dynamics and Earthquake Engineering 31 (2011) 954–973956
pump building, which is a 2-story structure with a partial base-ment. The pump building has plan dimensions of 15.5 m�22.5 mand is founded at a depth of 3.5 m. A soil pit to the east of the shaketable has plan dimensions of 14.6 m�15.2 m and a maximumdepth of about 5.8 m.
The reaction block supports the moving steel platen of theNEES Shake Table, which is 7.62 m (25 ft) wide, 12.19 m (40 ft)long, and has an effective mass of 144�103 kg [12,13]. In theinitial phase of the facility, the motion of the table is uni-directional with a maximum stroke of 0.75 m, a peak horizontalvelocity of 1.8 m/s, a peak horizontal acceleration of 4.2 g for baretable conditions and 1.2 g under a payload of 400 tons, an over-turning moment capacity of 50 MN m, and a vertical payloadcapacity of 20 MN. The testing frequency range of the table is0–33 Hz. In the initial phase, the system has two servo-controlled
dynamic actuators with a combined total horizontal force capa-city of 6.8 MN. The facility has an innovative vertical load/over-turning moment bearing system including six pressure balanced
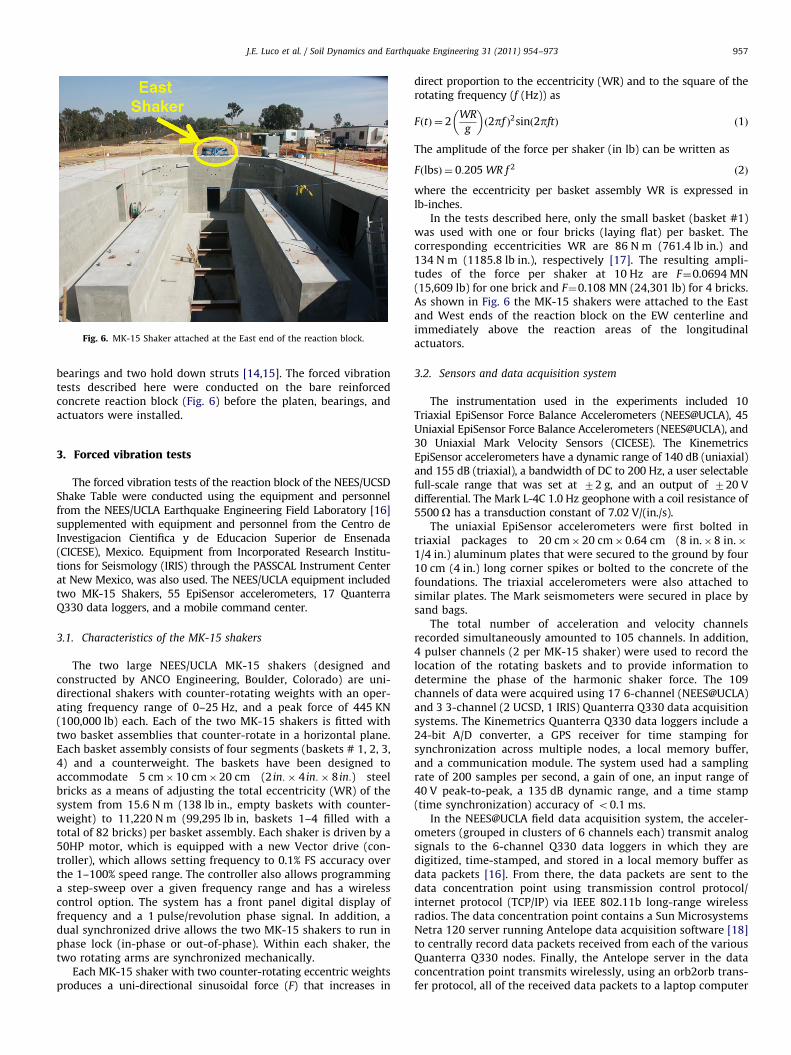
Fig. 6. MK-15 Shaker attached at the East end of the reaction block.
J.E. Luco et al. / Soil Dynamics and Earthquake Engineering 31 (2011) 954–973 957
bearings and two hold down struts [14,15]. The forced vibrationtests described here were conducted on the bare reinforcedconcrete reaction block (Fig. 6) before the platen, bearings, andactuators were installed.
3. Forced vibration tests
The forced vibration tests of the reaction block of the NEES/UCSDShake Table were conducted using the equipment and personnelfrom the NEES/UCLA Earthquake Engineering Field Laboratory [16]supplemented with equipment and personnel from the Centro deInvestigacion Cientifica y de Educacion Superior de Ensenada(CICESE), Mexico. Equipment from Incorporated Research Institu-tions for Seismology (IRIS) through the PASSCAL Instrument Centerat New Mexico, was also used. The NEES/UCLA equipment includedtwo MK-15 Shakers, 55 EpiSensor accelerometers, 17 QuanterraQ330 data loggers, and a mobile command center.
3.1. Characteristics of the MK-15 shakers
The two large NEES/UCLA MK-15 shakers (designed andconstructed by ANCO Engineering, Boulder, Colorado) are uni-directional shakers with counter-rotating weights with an oper-ating frequency range of 0–25 Hz, and a peak force of 445 KN(100,000 lb) each. Each of the two MK-15 shakers is fitted withtwo basket assemblies that counter-rotate in a horizontal plane.Each basket assembly consists of four segments (baskets # 1, 2, 3,4) and a counterweight. The baskets have been designed toaccommodate 5 cm�10 cm�20 cm (2 in:� 4 in:� 8 in:) steelbricks as a means of adjusting the total eccentricity (WR) of thesystem from 15.6 N m (138 lb in., empty baskets with counter-weight) to 11,220 N m (99,295 lb in, baskets 1–4 filled with atotal of 82 bricks) per basket assembly. Each shaker is driven by a50HP motor, which is equipped with a new Vector drive (con-troller), which allows setting frequency to 0.1% FS accuracy overthe 1–100% speed range. The controller also allows programminga step-sweep over a given frequency range and has a wirelesscontrol option. The system has a front panel digital display offrequency and a 1 pulse/revolution phase signal. In addition, adual synchronized drive allows the two MK-15 shakers to run inphase lock (in-phase or out-of-phase). Within each shaker, thetwo rotating arms are synchronized mechanically.
Each MK-15 shaker with two counter-rotating eccentric weightsproduces a uni-directional sinusoidal force (F) that increases in
direct proportion to the eccentricity (WR) and to the square of therotating frequency (f (Hz)) as
FðtÞ ¼ 2WR
g
� �ð2pf Þ2sinð2pftÞ ð1Þ
The amplitude of the force per shaker (in lb) can be written as
FðlbsÞ ¼ 0:205 WR f 2 ð2Þ
where the eccentricity per basket assembly WR is expressed inlb-inches.
In the tests described here, only the small basket (basket #1)was used with one or four bricks (laying flat) per basket. Thecorresponding eccentricities WR are 86 N m (761.4 lb in.) and134 N m (1185.8 lb in.), respectively [17]. The resulting ampli-tudes of the force per shaker at 10 Hz are F¼0.0694 MN(15,609 lb) for one brick and F¼0.108 MN (24,301 lb) for 4 bricks.As shown in Fig. 6 the MK-15 shakers were attached to the Eastand West ends of the reaction block on the EW centerline andimmediately above the reaction areas of the longitudinalactuators.
3.2. Sensors and data acquisition system
The instrumentation used in the experiments included 10Triaxial EpiSensor Force Balance Accelerometers (NEES@UCLA), 45Uniaxial EpiSensor Force Balance Accelerometers (NEES@UCLA), and30 Uniaxial Mark Velocity Sensors (CICESE). The KinemetricsEpiSensor accelerometers have a dynamic range of 140 dB (uniaxial)and 155 dB (triaxial), a bandwidth of DC to 200 Hz, a user selectablefull-scale range that was set at 72 g, and an output of 720 Vdifferential. The Mark L-4C 1.0 Hz geophone with a coil resistance of5500 O has a transduction constant of 7.02 V/(in./s).
The uniaxial EpiSensor accelerometers were first bolted intriaxial packages to 20 cm�20 cm�0.64 cm (8 in.�8 in.�1/4 in.) aluminum plates that were secured to the ground by four10 cm (4 in.) long corner spikes or bolted to the concrete of thefoundations. The triaxial accelerometers were also attached tosimilar plates. The Mark seismometers were secured in place bysand bags.
The total number of acceleration and velocity channelsrecorded simultaneously amounted to 105 channels. In addition,4 pulser channels (2 per MK-15 shaker) were used to record thelocation of the rotating baskets and to provide information todetermine the phase of the harmonic shaker force. The 109channels of data were acquired using 17 6-channel (NEES@UCLA)and 3 3-channel (2 UCSD, 1 IRIS) Quanterra Q330 data acquisitionsystems. The Kinemetrics Quanterra Q330 data loggers include a24-bit A/D converter, a GPS receiver for time stamping forsynchronization across multiple nodes, a local memory buffer,and a communication module. The system used had a samplingrate of 200 samples per second, a gain of one, an input range of40 V peak-to-peak, a 135 dB dynamic range, and a time stamp(time synchronization) accuracy of o0.1 ms.
In the NEES@UCLA field data acquisition system, the acceler-ometers (grouped in clusters of 6 channels each) transmit analogsignals to the 6-channel Q330 data loggers in which they aredigitized, time-stamped, and stored in a local memory buffer asdata packets [16]. From there, the data packets are sent to thedata concentration point using transmission control protocol/internet protocol (TCP/IP) via IEEE 802.11b long-range wirelessradios. The data concentration point contains a Sun MicrosystemsNetra 120 server running Antelope data acquisition software [18]to centrally record data packets received from each of the variousQuanterra Q330 nodes. Finally, the Antelope server in the dataconcentration point transmits wirelessly, using an orb2orb trans-fer protocol, all of the received data packets to a laptop computer
J.E. Luco et al. / Soil Dynamics and Earthquake Engineering 31 (2011) 954–973958
inside the mobile command center also running Antelope soft-ware. The laptop computer was used to observe the experiment inreal-time using the Antelope real-time monitoring (AntelopeRTM) system.
3.3. Instrumentation of the reaction block and adjacent foundations
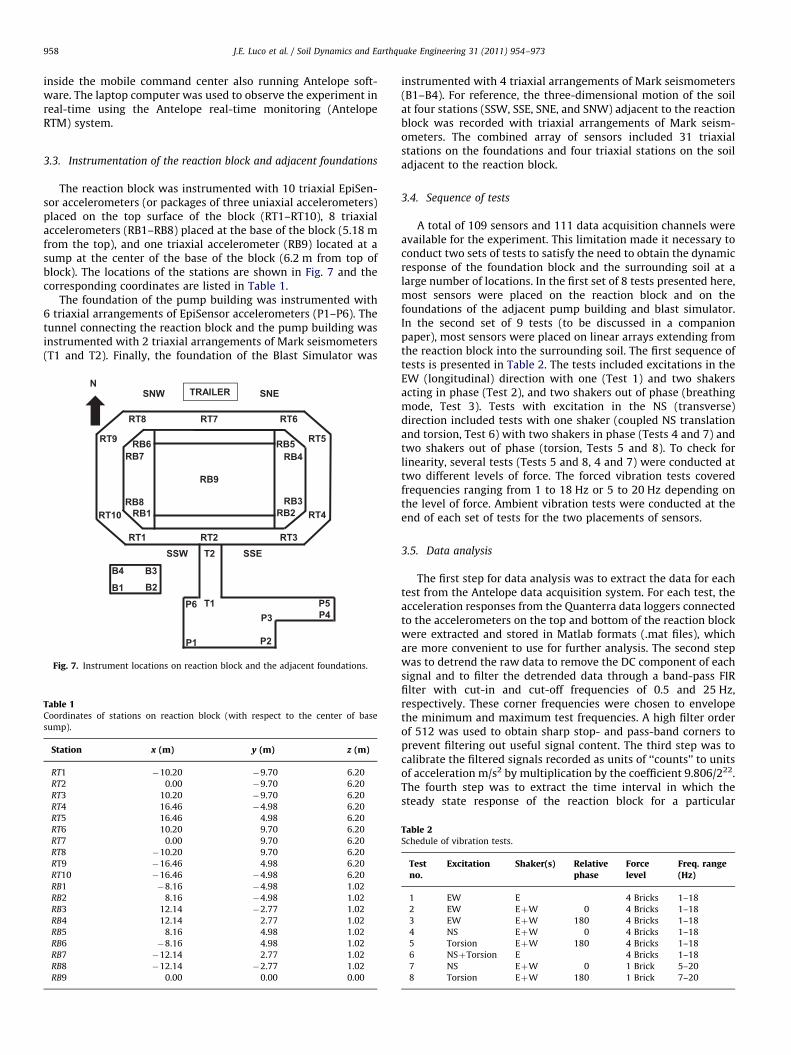
The reaction block was instrumented with 10 triaxial EpiSen-sor accelerometers (or packages of three uniaxial accelerometers)placed on the top surface of the block (RT1–RT10), 8 triaxialaccelerometers (RB1–RB8) placed at the base of the block (5.18 mfrom the top), and one triaxial accelerometer (RB9) located at asump at the center of the base of the block (6.2 m from top ofblock). The locations of the stations are shown in Fig. 7 and thecorresponding coordinates are listed in Table 1.
The foundation of the pump building was instrumented with6 triaxial arrangements of EpiSensor accelerometers (P1–P6). Thetunnel connecting the reaction block and the pump building wasinstrumented with 2 triaxial arrangements of Mark seismometers(T1 and T2). Finally, the foundation of the Blast Simulator was
RT7 6TR8TR
RT9
RT10
RT1 RT2 RT3
RT5
RT4RB1 RB2RB3
RB4RB5RB6
RB7
RB8
RB9
B3
B1 B2
B4
T2
P6 5P1T
P2
P3 P4
P1
NTRAILER
SSW SSE
ENSWNS
Fig. 7. Instrument locations on reaction block and the adjacent foundations.
Table 1Coordinates of stations on reaction block (with respect to the center of base
sump).
Station x (m) y (m) z (m)
RT1 �10.20 �9.70 6.20
RT2 0.00 �9.70 6.20
RT3 10.20 �9.70 6.20
RT4 16.46 �4.98 6.20
RT5 16.46 4.98 6.20
RT6 10.20 9.70 6.20
RT7 0.00 9.70 6.20
RT8 �10.20 9.70 6.20
RT9 �16.46 4.98 6.20
RT10 �16.46 �4.98 6.20
RB1 �8.16 �4.98 1.02
RB2 8.16 �4.98 1.02
RB3 12.14 �2.77 1.02
RB4 12.14 2.77 1.02
RB5 8.16 4.98 1.02
RB6 �8.16 4.98 1.02
RB7 �12.14 2.77 1.02
RB8 �12.14 �2.77 1.02
RB9 0.00 0.00 0.00
instrumented with 4 triaxial arrangements of Mark seismometers(B1–B4). For reference, the three-dimensional motion of the soilat four stations (SSW, SSE, SNE, and SNW) adjacent to the reactionblock was recorded with triaxial arrangements of Mark seism-ometers. The combined array of sensors included 31 triaxialstations on the foundations and four triaxial stations on the soiladjacent to the reaction block.
3.4. Sequence of tests
A total of 109 sensors and 111 data acquisition channels wereavailable for the experiment. This limitation made it necessary toconduct two sets of tests to satisfy the need to obtain the dynamicresponse of the foundation block and the surrounding soil at alarge number of locations. In the first set of 8 tests presented here,most sensors were placed on the reaction block and on thefoundations of the adjacent pump building and blast simulator.In the second set of 9 tests (to be discussed in a companionpaper), most sensors were placed on linear arrays extending fromthe reaction block into the surrounding soil. The first sequence oftests is presented in Table 2. The tests included excitations in theEW (longitudinal) direction with one (Test 1) and two shakersacting in phase (Test 2), and two shakers out of phase (breathingmode, Test 3). Tests with excitation in the NS (transverse)direction included tests with one shaker (coupled NS translationand torsion, Test 6) with two shakers in phase (Tests 4 and 7) andtwo shakers out of phase (torsion, Tests 5 and 8). To check forlinearity, several tests (Tests 5 and 8, 4 and 7) were conducted attwo different levels of force. The forced vibration tests coveredfrequencies ranging from 1 to 18 Hz or 5 to 20 Hz depending onthe level of force. Ambient vibration tests were conducted at theend of each set of tests for the two placements of sensors.
3.5. Data analysis
The first step for data analysis was to extract the data for eachtest from the Antelope data acquisition system. For each test, theacceleration responses from the Quanterra data loggers connectedto the accelerometers on the top and bottom of the reaction blockwere extracted and stored in Matlab formats (.mat files), whichare more convenient to use for further analysis. The second stepwas to detrend the raw data to remove the DC component of eachsignal and to filter the detrended data through a band-pass FIRfilter with cut-in and cut-off frequencies of 0.5 and 25 Hz,respectively. These corner frequencies were chosen to envelopethe minimum and maximum test frequencies. A high filter orderof 512 was used to obtain sharp stop- and pass-band corners toprevent filtering out useful signal content. The third step was tocalibrate the filtered signals recorded as units of ‘‘counts’’ to unitsof acceleration m/s2 by multiplication by the coefficient 9.806/222.The fourth step was to extract the time interval in which thesteady state response of the reaction block for a particular
Table 2Schedule of vibration tests.
Testno.
Excitation Shaker(s) Relativephase
Forcelevel
Freq. range(Hz)
1 EW E 4 Bricks 1–18
2 EW EþW 0 4 Bricks 1–18
3 EW EþW 180 4 Bricks 1–18
4 NS EþW 0 4 Bricks 1–18
5 Torsion EþW 180 4 Bricks 1–18
6 NSþTorsion E 4 Bricks 1–18
7 NS EþW 0 1 Brick 5–20
8 Torsion EþW 180 1 Brick 7–20
J.E. Luco et al. / Soil Dynamics and Earthquake Engineering 31 (2011) 954–973 959
excitation frequency was reached. For each frequency, thesesteady state portions were chosen to be at least 40 s long. Theexact steady-state response frequency for each test frequency(i.e., intended frequency) was obtained by finding the peakfrequency in the Fourier Amplitude Spectrum (FAS) plot of thatparticular response. Later, these exact response frequencies wereused in a least-squares fit algorithm to find the amplitudes andphases of the steady state responses at different reaction blocklocations. The least-squares fits were applied to at least 10 s longsignals processed by the data analysis procedure outlined above.
4. Response of the reaction block to longitudinal (EW)excitation
At the present time, the NEES/UCSD Shake Table operates one-directionally in the longitudinal (EW) direction. For this reason, itis important to consider first the response of the block to EWexcitation with the two shakers acting in phase. In the case of Test2 with four bricks in each basket, the combined harmonic totalforce exerted by the shakers at a frequency of 10 Hz has anamplitude of 0.216 MN (48,602 lb).
4.1. Accelerations at the top and base of the foundation block for EW
excitation
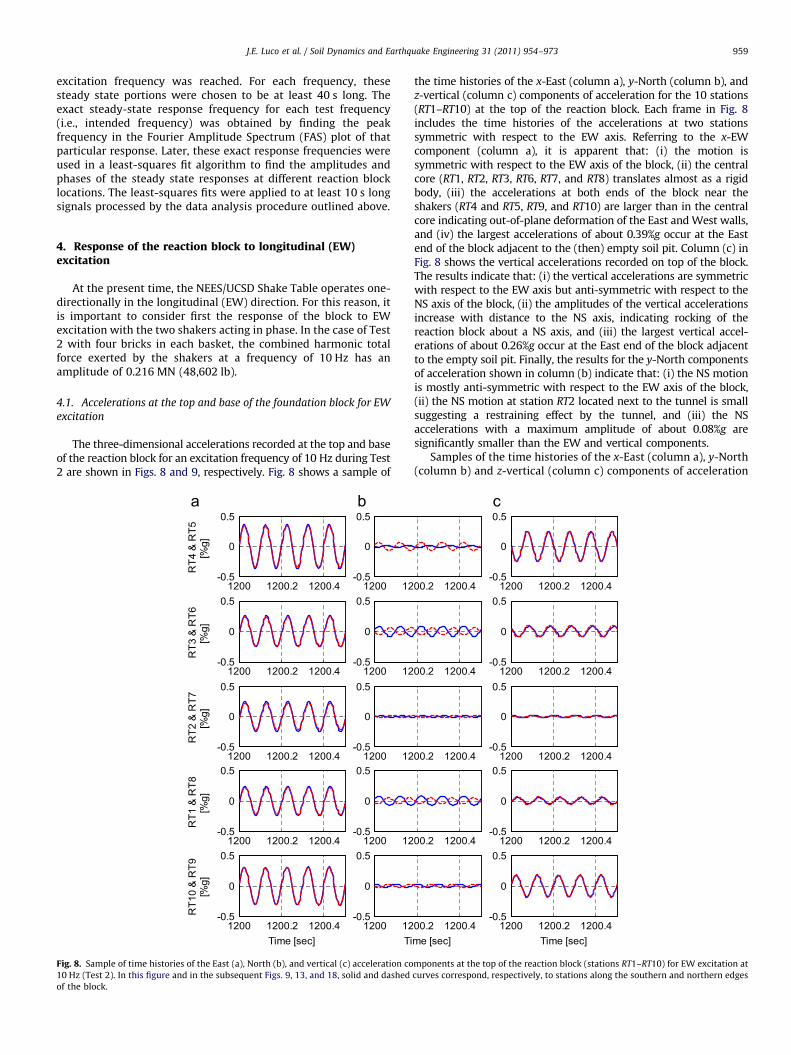
The three-dimensional accelerations recorded at the top and baseof the reaction block for an excitation frequency of 10 Hz during Test2 are shown in Figs. 8 and 9, respectively. Fig. 8 shows a sample of
1200 1200.2 1200.4-0.5
0
0.5
RT4
& R
T5
[%g]
1200 12-0.5
0
0.5
1200 1200.2 1200.4-0.5
0
0.5
RT3
& R
T6
[%g]
1200 12-0.5
0
0.5
1200 1200.2 1200.4-0.5
0
0.5
RT2
& R
T7
[%g]
1200 12-0.5
0
0.5
1200 1200.2 1200.4-0.5
0
0.5
RT1
& R
T8
[%g]
1200 12-0.5
0
0.5
1200 1200.2 1200.4-0.5
0
0.5
RT1
0 &
RT9
[%
g]
Time [sec]1200 12
-0.5
0
0.5
Ti
Fig. 8. Sample of time histories of the East (a), North (b), and vertical (c) acceleration co
10 Hz (Test 2). In this figure and in the subsequent Figs. 9, 13, and 18, solid and dashed
of the block.
the time histories of the x-East (column a), y-North (column b), andz-vertical (column c) components of acceleration for the 10 stations(RT1–RT10) at the top of the reaction block. Each frame in Fig. 8includes the time histories of the accelerations at two stationssymmetric with respect to the EW axis. Referring to the x-EWcomponent (column a), it is apparent that: (i) the motion issymmetric with respect to the EW axis of the block, (ii) the centralcore (RT1, RT2, RT3, RT6, RT7, and RT8) translates almost as a rigidbody, (iii) the accelerations at both ends of the block near theshakers (RT4 and RT5, RT9, and RT10) are larger than in the centralcore indicating out-of-plane deformation of the East and West walls,and (iv) the largest accelerations of about 0.39%g occur at the Eastend of the block adjacent to the (then) empty soil pit. Column (c) inFig. 8 shows the vertical accelerations recorded on top of the block.The results indicate that: (i) the vertical accelerations are symmetricwith respect to the EW axis but anti-symmetric with respect to theNS axis of the block, (ii) the amplitudes of the vertical accelerationsincrease with distance to the NS axis, indicating rocking of thereaction block about a NS axis, and (iii) the largest vertical accel-erations of about 0.26%g occur at the East end of the block adjacentto the empty soil pit. Finally, the results for the y-North componentsof acceleration shown in column (b) indicate that: (i) the NS motionis mostly anti-symmetric with respect to the EW axis of the block,(ii) the NS motion at station RT2 located next to the tunnel is smallsuggesting a restraining effect by the tunnel, and (iii) the NSaccelerations with a maximum amplitude of about 0.08%g aresignificantly smaller than the EW and vertical components.
Samples of the time histories of the x-East (column a), y-North(column b) and z-vertical (column c) components of acceleration
00.2 1200.4 1200 1200.2 1200.4-0.5
0
0.5
00.2 1200.4 1200 1200.2 1200.4-0.5
0
0.5
00.2 1200.4 1200 1200.2 1200.4-0.5
0
0.5
00.2 1200.4 1200 1200.2 1200.4-0.5
0
0.5
00.2 1200.4me [sec]
1200 1200.2 1200.4-0.5
0
0.5
Time [sec]
mponents at the top of the reaction block (stations RT1–RT10) for EW excitation at
curves correspond, respectively, to stations along the southern and northern edges
1200 1200.2 1200.4-0.5
0
0.5
RB
3 &
RB
4[%
g]
1200 1200.2 1200.4-0.5
0
0.5
1200 1200.2 1200.4-0.5
0
0.5
1200 1200.2 1200.4-0.5
0
0.5R
B2
& R
B5
[%g]
1200 1200.2 1200.4-0.5
0
0.5
1200 1200.2 1200.4-0.5
0
0.5
1200 1200.2 1200.4-0.5
0
0.5
RB
9 [%
g]
1200 1200.2 1200.4-0.5
0
0.5
1200 1200.2 1200.4-0.5
0
0.5
1200 1200.2 1200.4-0.5
0
0.5
RB
1 &
RB
6[%
g]
1200 1200.2 1200.4-0.5
0
0.5
1200 1200.2 1200.4-0.5
0
0.5
1200 1200.2 1200.4-0.5
0
0.5
RB
8 &
RB
7[%
g]
Time [sec]1200 1200.2 1200.4
-0.5
0
0.5
Time [sec]1200 1200.2 1200.4
-0.5
0
0.5
Time [sec]
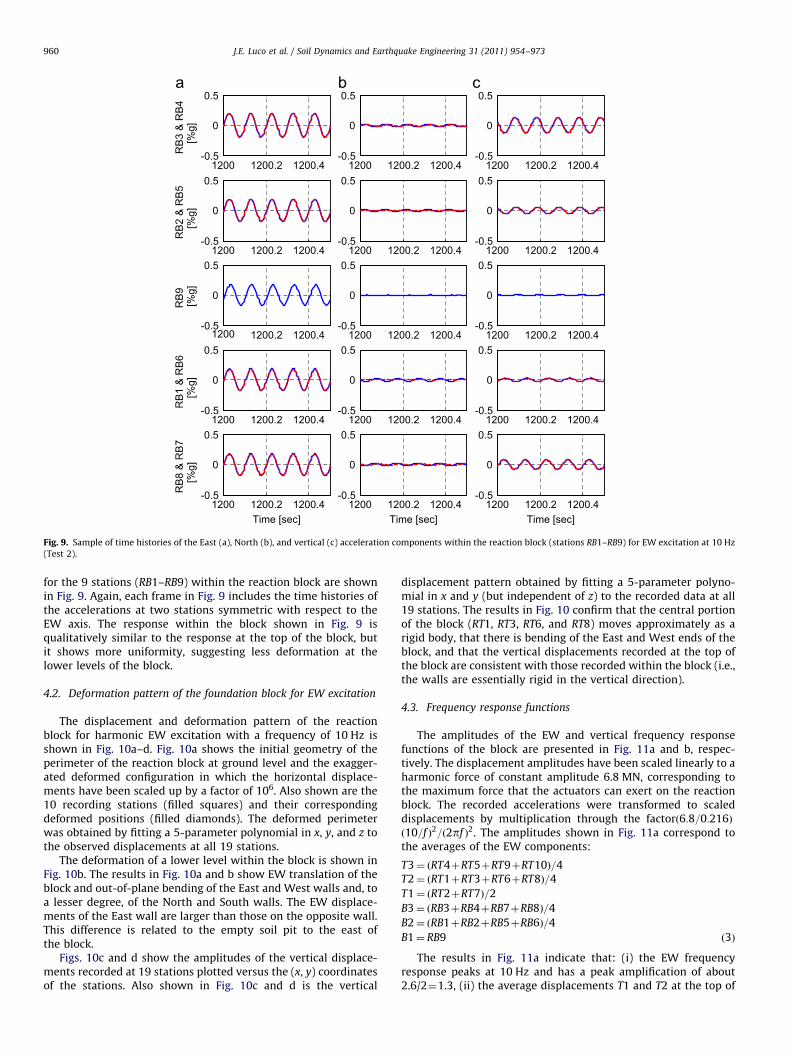
Fig. 9. Sample of time histories of the East (a), North (b), and vertical (c) acceleration components within the reaction block (stations RB1–RB9) for EW excitation at 10 Hz
(Test 2).
J.E. Luco et al. / Soil Dynamics and Earthquake Engineering 31 (2011) 954–973960
for the 9 stations (RB1–RB9) within the reaction block are shownin Fig. 9. Again, each frame in Fig. 9 includes the time histories ofthe accelerations at two stations symmetric with respect to theEW axis. The response within the block shown in Fig. 9 isqualitatively similar to the response at the top of the block, butit shows more uniformity, suggesting less deformation at thelower levels of the block.
4.2. Deformation pattern of the foundation block for EW excitation
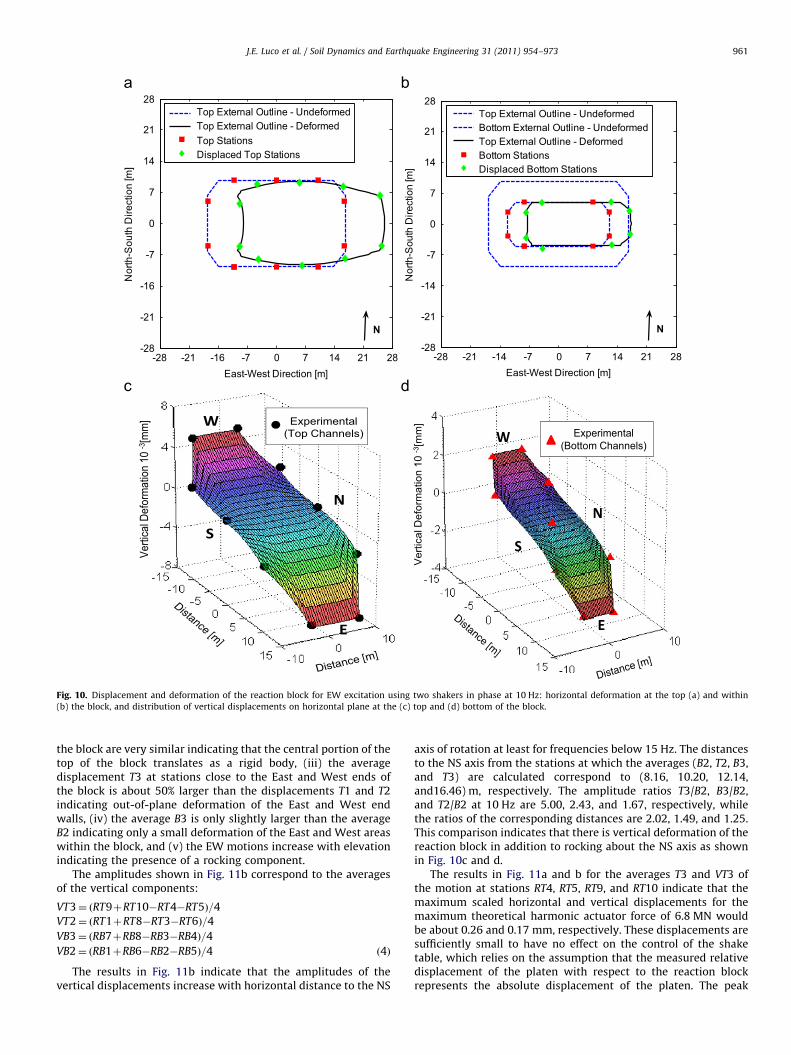
The displacement and deformation pattern of the reactionblock for harmonic EW excitation with a frequency of 10 Hz isshown in Fig. 10a–d. Fig. 10a shows the initial geometry of theperimeter of the reaction block at ground level and the exagger-ated deformed configuration in which the horizontal displace-ments have been scaled up by a factor of 106. Also shown are the10 recording stations (filled squares) and their correspondingdeformed positions (filled diamonds). The deformed perimeterwas obtained by fitting a 5-parameter polynomial in x, y, and z tothe observed displacements at all 19 stations.
The deformation of a lower level within the block is shown inFig. 10b. The results in Fig. 10a and b show EW translation of theblock and out-of-plane bending of the East and West walls and, toa lesser degree, of the North and South walls. The EW displace-ments of the East wall are larger than those on the opposite wall.This difference is related to the empty soil pit to the east ofthe block.
Figs. 10c and d show the amplitudes of the vertical displace-ments recorded at 19 stations plotted versus the (x, y) coordinatesof the stations. Also shown in Fig. 10c and d is the vertical
displacement pattern obtained by fitting a 5-parameter polyno-mial in x and y (but independent of z) to the recorded data at all19 stations. The results in Fig. 10 confirm that the central portionof the block (RT1, RT3, RT6, and RT8) moves approximately as arigid body, that there is bending of the East and West ends of theblock, and that the vertical displacements recorded at the top ofthe block are consistent with those recorded within the block (i.e.,the walls are essentially rigid in the vertical direction).
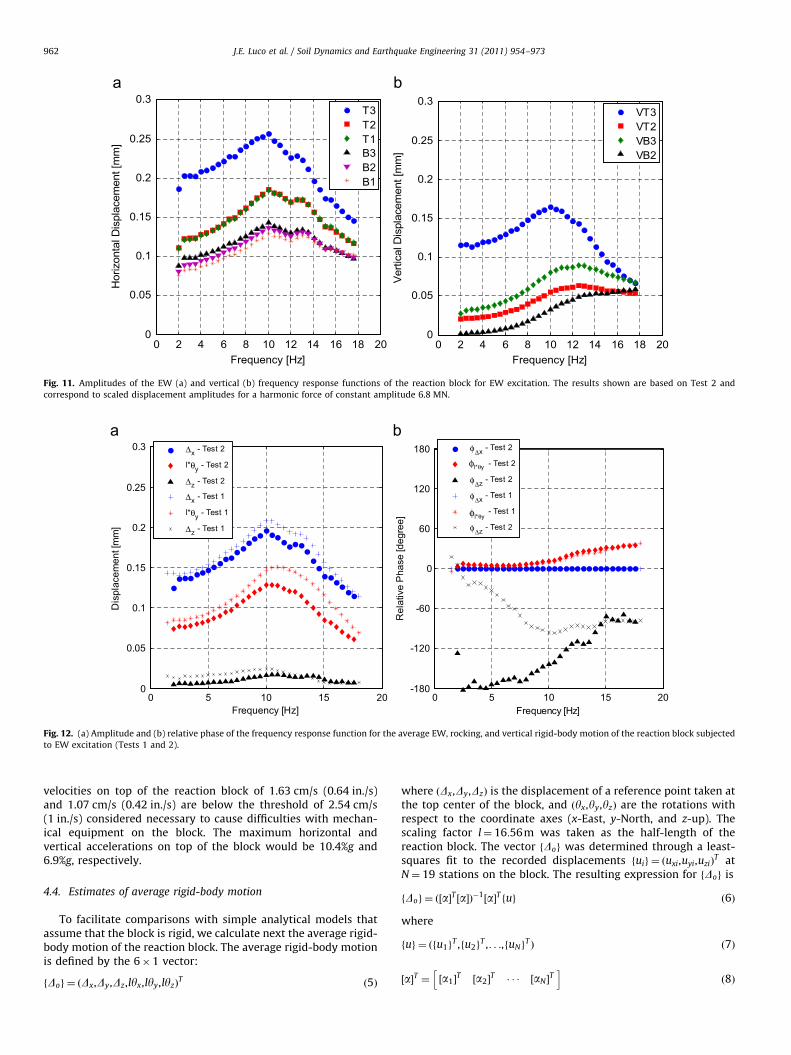
4.3. Frequency response functions
The amplitudes of the EW and vertical frequency responsefunctions of the block are presented in Fig. 11a and b, respec-tively. The displacement amplitudes have been scaled linearly to aharmonic force of constant amplitude 6.8 MN, corresponding tothe maximum force that the actuators can exert on the reactionblock. The recorded accelerations were transformed to scaleddisplacements by multiplication through the factorð6:8=0:216Þð10=f Þ2=ð2pf Þ2. The amplitudes shown in Fig. 11a correspond tothe averages of the EW components:
T3¼ ðRT4þRT5þRT9þRT10Þ=4T2¼ ðRT1þRT3þRT6þRT8Þ=4
T1¼ ðRT2þRT7Þ=2
B3¼ ðRB3þRB4þRB7þRB8Þ=4
B2¼ ðRB1þRB2þRB5þRB6Þ=4
B1¼ RB9 ð3Þ
The results in Fig. 11a indicate that: (i) the EW frequencyresponse peaks at 10 Hz and has a peak amplification of about2.6/2¼1.3, (ii) the average displacements T1 and T2 at the top of
-28 -21 -16 -7 0 7 14 21 28-28
-21
-16
-7
0
7
14
21
28
East-West Direction [m]
Nor
th-S
outh
Dire
ctio
n [m
]Top External Outline - UndeformedTop External Outline - DeformedTop StationsDisplaced Top Stations
N
-28 -21 -14 -7 0 7 14 21 28-28
-21
-14
-7
0
7
14
21
28
East-West Direction [m]
Nor
th-S
outh
Dire
ctio
n [m
]
Top External Outline - Undeformed Bottom External Outline - UndeformedTop External Outline - DeformedBottom StationsDisplaced Bottom Stations
N
Verti
cal D
efor
mat
ion
10 -3
[mm
] Experimental(Top Channels)
Ver
tical
Def
orm
atio
n 10
-3[m
m]
Experimental(Bottom Channels)
Fig. 10. Displacement and deformation of the reaction block for EW excitation using two shakers in phase at 10 Hz: horizontal deformation at the top (a) and within
(b) the block, and distribution of vertical displacements on horizontal plane at the (c) top and (d) bottom of the block.
J.E. Luco et al. / Soil Dynamics and Earthquake Engineering 31 (2011) 954–973 961
the block are very similar indicating that the central portion of thetop of the block translates as a rigid body, (iii) the averagedisplacement T3 at stations close to the East and West ends ofthe block is about 50% larger than the displacements T1 and T2indicating out-of-plane deformation of the East and West endwalls, (iv) the average B3 is only slightly larger than the averageB2 indicating only a small deformation of the East and West areaswithin the block, and (v) the EW motions increase with elevationindicating the presence of a rocking component.
The amplitudes shown in Fig. 11b correspond to the averagesof the vertical components:
VT3¼ ðRT9þRT10�RT4�RT5Þ=4
VT2¼ ðRT1þRT8�RT3�RT6Þ=4
VB3¼ ðRB7þRB8�RB3�RB4Þ=4
VB2¼ ðRB1þRB6�RB2�RB5Þ=4 ð4Þ
The results in Fig. 11b indicate that the amplitudes of thevertical displacements increase with horizontal distance to the NS
axis of rotation at least for frequencies below 15 Hz. The distancesto the NS axis from the stations at which the averages (B2, T2, B3,and T3) are calculated correspond to (8.16, 10.20, 12.14,and16.46) m, respectively. The amplitude ratios T3/B2, B3/B2,and T2/B2 at 10 Hz are 5.00, 2.43, and 1.67, respectively, whilethe ratios of the corresponding distances are 2.02, 1.49, and 1.25.This comparison indicates that there is vertical deformation of thereaction block in addition to rocking about the NS axis as shownin Fig. 10c and d.
The results in Fig. 11a and b for the averages T3 and VT3 ofthe motion at stations RT4, RT5, RT9, and RT10 indicate that themaximum scaled horizontal and vertical displacements for themaximum theoretical harmonic actuator force of 6.8 MN wouldbe about 0.26 and 0.17 mm, respectively. These displacements aresufficiently small to have no effect on the control of the shaketable, which relies on the assumption that the measured relativedisplacement of the platen with respect to the reaction blockrepresents the absolute displacement of the platen. The peak
0 2 4 6 8 10 12 14 16 18 200
0.05
0.1
0.15
0.2
0.25
0.3
Frequency [Hz]
Hor
izon
tal D
ispl
acem
ent [
mm
]
T3T2T1B3B2B1
0 2 4 6 8 10 12 14 16 18 200
0.05
0.1
0.15
0.2
0.25
0.3
Frequency [Hz]
Verti
cal D
ispl
acem
ent [
mm
]
VT3VT2VB3VB2
Fig. 11. Amplitudes of the EW (a) and vertical (b) frequency response functions of the reaction block for EW excitation. The results shown are based on Test 2 and
correspond to scaled displacement amplitudes for a harmonic force of constant amplitude 6.8 MN.
0 5 10 15 200
0.05
0.1
0.15
0.2
0.25
0.3
Frequency [Hz]
Dis
plac
emen
t [m
m]
Δx - Test 2
l*θy - Test 2
Δz - Test 2
Δx - Test 1
l*θy - Test 1
Δz - Test 1
0 5 10 15 20-180
-120
-60
0
60
120
180
Frequency [Hz]
Rel
ativ
e P
hase
[deg
ree]
φΔx - Test 2
φθy*l - Test 2
φΔz - Test 2
φΔx - Test 1
φθy*l - Test 1
φΔz - Test 2
θφl* y
l* yθφ
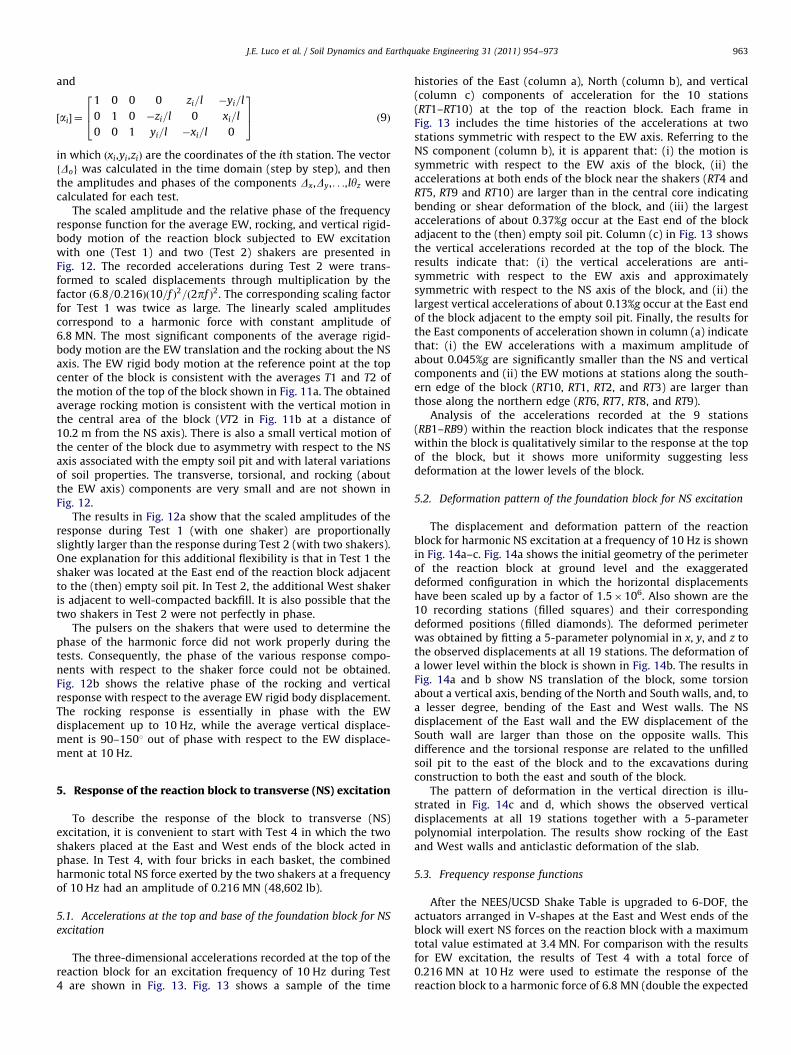
Fig. 12. (a) Amplitude and (b) relative phase of the frequency response function for the average EW, rocking, and vertical rigid-body motion of the reaction block subjected
to EW excitation (Tests 1 and 2).
J.E. Luco et al. / Soil Dynamics and Earthquake Engineering 31 (2011) 954–973962
velocities on top of the reaction block of 1.63 cm/s (0.64 in./s)and 1.07 cm/s (0.42 in./s) are below the threshold of 2.54 cm/s(1 in./s) considered necessary to cause difficulties with mechan-ical equipment on the block. The maximum horizontal andvertical accelerations on top of the block would be 10.4%g and6.9%g, respectively.
4.4. Estimates of average rigid-body motion
To facilitate comparisons with simple analytical models thatassume that the block is rigid, we calculate next the average rigid-body motion of the reaction block. The average rigid-body motionis defined by the 6�1 vector:
fDog ¼ ðDx,Dy,Dz,lyx,lyy,lyzÞT
ð5Þ
where ðDx,Dy,DzÞ is the displacement of a reference point taken atthe top center of the block, and ðyx,yy,yzÞ are the rotations withrespect to the coordinate axes (x-East, y-North, and z-up). Thescaling factor l¼ 16:56m was taken as the half-length of thereaction block. The vector fDog was determined through a least-squares fit to the recorded displacements fuig ¼ ðuxi,uyi,uziÞ
T atN¼ 19 stations on the block. The resulting expression for fDog is
fDog ¼ ð½a�T ½a�Þ�1½a�T fug ð6Þ
where
fug ¼ ðfu1gT ,fu2g
T ,. . .,fuNgT Þ ð7Þ
½a�T ¼ ½a1�T ½a2�
T � � � ½aN�T
h ið8Þ
J.E. Luco et al. / Soil Dynamics and Earthquake Engineering 31 (2011) 954–973 963
and
½ai� ¼
1 0 0 0 zi=l �yi=l
0 1 0 �zi=l 0 xi=l
0 0 1 yi=l �xi=l 0
264
375 ð9Þ
in which ðxi,yi,ziÞ are the coordinates of the ith station. The vectorfDog was calculated in the time domain (step by step), and thenthe amplitudes and phases of the components Dx,Dy,. . .,lyz werecalculated for each test.
The scaled amplitude and the relative phase of the frequencyresponse function for the average EW, rocking, and vertical rigid-body motion of the reaction block subjected to EW excitationwith one (Test 1) and two (Test 2) shakers are presented inFig. 12. The recorded accelerations during Test 2 were trans-formed to scaled displacements through multiplication by thefactor ð6:8=0:216Þð10=f Þ2=ð2pf Þ2. The corresponding scaling factorfor Test 1 was twice as large. The linearly scaled amplitudescorrespond to a harmonic force with constant amplitude of6.8 MN. The most significant components of the average rigid-body motion are the EW translation and the rocking about the NSaxis. The EW rigid body motion at the reference point at the topcenter of the block is consistent with the averages T1 and T2 ofthe motion of the top of the block shown in Fig. 11a. The obtainedaverage rocking motion is consistent with the vertical motion inthe central area of the block (VT2 in Fig. 11b at a distance of10.2 m from the NS axis). There is also a small vertical motion ofthe center of the block due to asymmetry with respect to the NSaxis associated with the empty soil pit and with lateral variationsof soil properties. The transverse, torsional, and rocking (aboutthe EW axis) components are very small and are not shown inFig. 12.
The results in Fig. 12a show that the scaled amplitudes of theresponse during Test 1 (with one shaker) are proportionallyslightly larger than the response during Test 2 (with two shakers).One explanation for this additional flexibility is that in Test 1 theshaker was located at the East end of the reaction block adjacentto the (then) empty soil pit. In Test 2, the additional West shakeris adjacent to well-compacted backfill. It is also possible that thetwo shakers in Test 2 were not perfectly in phase.
The pulsers on the shakers that were used to determine thephase of the harmonic force did not work properly during thetests. Consequently, the phase of the various response compo-nents with respect to the shaker force could not be obtained.Fig. 12b shows the relative phase of the rocking and verticalresponse with respect to the average EW rigid body displacement.The rocking response is essentially in phase with the EWdisplacement up to 10 Hz, while the average vertical displace-ment is 90–1501 out of phase with respect to the EW displace-ment at 10 Hz.
5. Response of the reaction block to transverse (NS) excitation
To describe the response of the block to transverse (NS)excitation, it is convenient to start with Test 4 in which the twoshakers placed at the East and West ends of the block acted inphase. In Test 4, with four bricks in each basket, the combinedharmonic total NS force exerted by the two shakers at a frequencyof 10 Hz had an amplitude of 0.216 MN (48,602 lb).
5.1. Accelerations at the top and base of the foundation block for NS
excitation
The three-dimensional accelerations recorded at the top of thereaction block for an excitation frequency of 10 Hz during Test4 are shown in Fig. 13. Fig. 13 shows a sample of the time
histories of the East (column a), North (column b), and vertical(column c) components of acceleration for the 10 stations(RT1–RT10) at the top of the reaction block. Each frame inFig. 13 includes the time histories of the accelerations at twostations symmetric with respect to the EW axis. Referring to theNS component (column b), it is apparent that: (i) the motion issymmetric with respect to the EW axis of the block, (ii) theaccelerations at both ends of the block near the shakers (RT4 andRT5, RT9 and RT10) are larger than in the central core indicatingbending or shear deformation of the block, and (iii) the largestaccelerations of about 0.37%g occur at the East end of the blockadjacent to the (then) empty soil pit. Column (c) in Fig. 13 showsthe vertical accelerations recorded at the top of the block. Theresults indicate that: (i) the vertical accelerations are anti-symmetric with respect to the EW axis and approximatelysymmetric with respect to the NS axis of the block, and (ii) thelargest vertical accelerations of about 0.13%g occur at the East endof the block adjacent to the empty soil pit. Finally, the results forthe East components of acceleration shown in column (a) indicatethat: (i) the EW accelerations with a maximum amplitude ofabout 0.045%g are significantly smaller than the NS and verticalcomponents and (ii) the EW motions at stations along the south-ern edge of the block (RT10, RT1, RT2, and RT3) are larger thanthose along the northern edge (RT6, RT7, RT8, and RT9).
Analysis of the accelerations recorded at the 9 stations(RB1–RB9) within the reaction block indicates that the responsewithin the block is qualitatively similar to the response at the topof the block, but it shows more uniformity suggesting lessdeformation at the lower levels of the block.
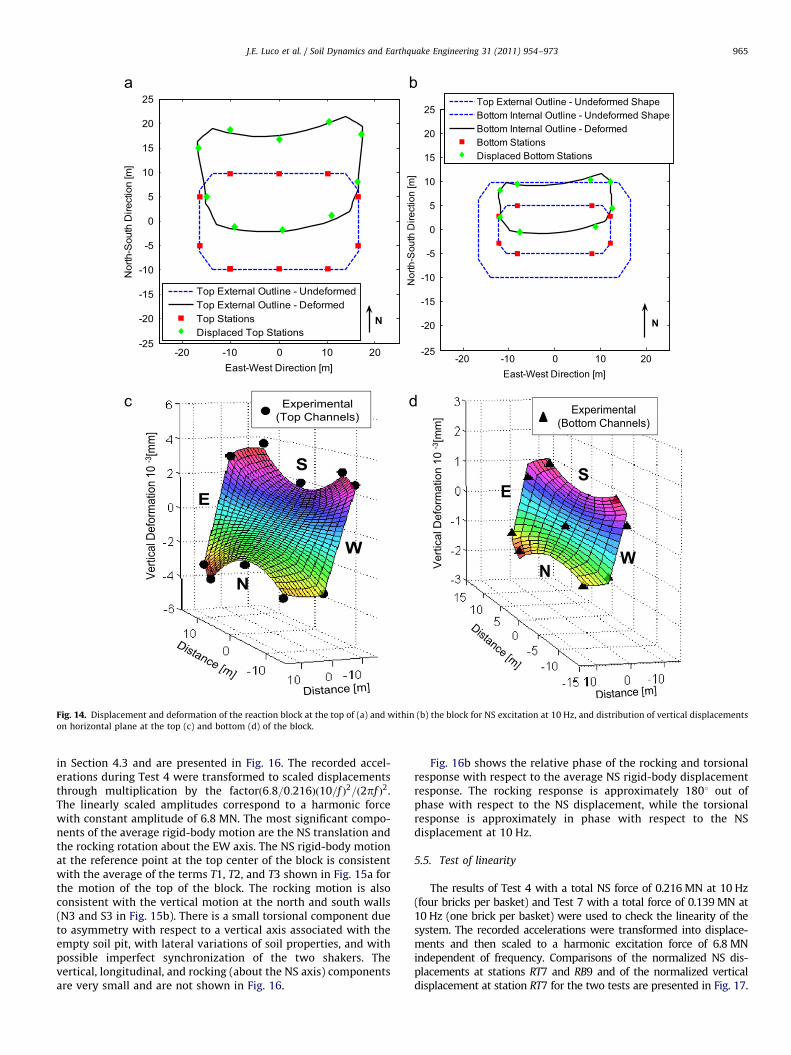
5.2. Deformation pattern of the foundation block for NS excitation
The displacement and deformation pattern of the reactionblock for harmonic NS excitation at a frequency of 10 Hz is shownin Fig. 14a–c. Fig. 14a shows the initial geometry of the perimeterof the reaction block at ground level and the exaggerateddeformed configuration in which the horizontal displacementshave been scaled up by a factor of 1.5�106. Also shown are the10 recording stations (filled squares) and their correspondingdeformed positions (filled diamonds). The deformed perimeterwas obtained by fitting a 5-parameter polynomial in x, y, and z tothe observed displacements at all 19 stations. The deformation ofa lower level within the block is shown in Fig. 14b. The results inFig. 14a and b show NS translation of the block, some torsionabout a vertical axis, bending of the North and South walls, and, toa lesser degree, bending of the East and West walls. The NSdisplacement of the East wall and the EW displacement of theSouth wall are larger than those on the opposite walls. Thisdifference and the torsional response are related to the unfilledsoil pit to the east of the block and to the excavations duringconstruction to both the east and south of the block.
The pattern of deformation in the vertical direction is illu-strated in Fig. 14c and d, which shows the observed verticaldisplacements at all 19 stations together with a 5-parameterpolynomial interpolation. The results show rocking of the Eastand West walls and anticlastic deformation of the slab.
5.3. Frequency response functions
After the NEES/UCSD Shake Table is upgraded to 6-DOF, theactuators arranged in V-shapes at the East and West ends of theblock will exert NS forces on the reaction block with a maximumtotal value estimated at 3.4 MN. For comparison with the resultsfor EW excitation, the results of Test 4 with a total force of0.216 MN at 10 Hz were used to estimate the response of thereaction block to a harmonic force of 6.8 MN (double the expected

1360 1360.2 1360.4-0.5
0
0.5
RT4
& R
T5[%
g]
1360 1360.2 1360.4-0.5
0
0.5
1360 1360.2 1360.4-0.5
0
0.5
1360 1360.2 1360.4-0.5
0
0.5R
T3 &
RT6
[%g]
1360 1360.2 1360.4-0.5
0
0.5
1360 1360.2 1360.4-0.5
0
0.5
1360 1360.2 1360.4-0.5
0
0.5
RT2
& R
T7[%
g]
1360 1360.2 1360.4-0.5
0
0.5
1360 1360.2 1360.4-0.5
0
0.5
1360 1360.2 1360.4-0.5
0
0.5
RT1
& R
T8[%
g]
1360 1360.5-0.5
0
0.5
1360 1360.2 1360.4-0.5
0
0.5
1360 1360.2 1360.4-0.5
0
0.5
RT1
0 &
RT9
[%g]
Time [sec]1360 1360.2 1360.4
-0.5
0
0.5
Time [sec]1360 1360.2 1360.4
-0.5
0
0.5
Time [sec]
Fig. 13. Sample of time histories of the East (a), North (b), and vertical (c) acceleration components at the top of the reaction block (stations RT1–RT10) for NS excitation at
10 Hz (Test 4).
J.E. Luco et al. / Soil Dynamics and Earthquake Engineering 31 (2011) 954–973964
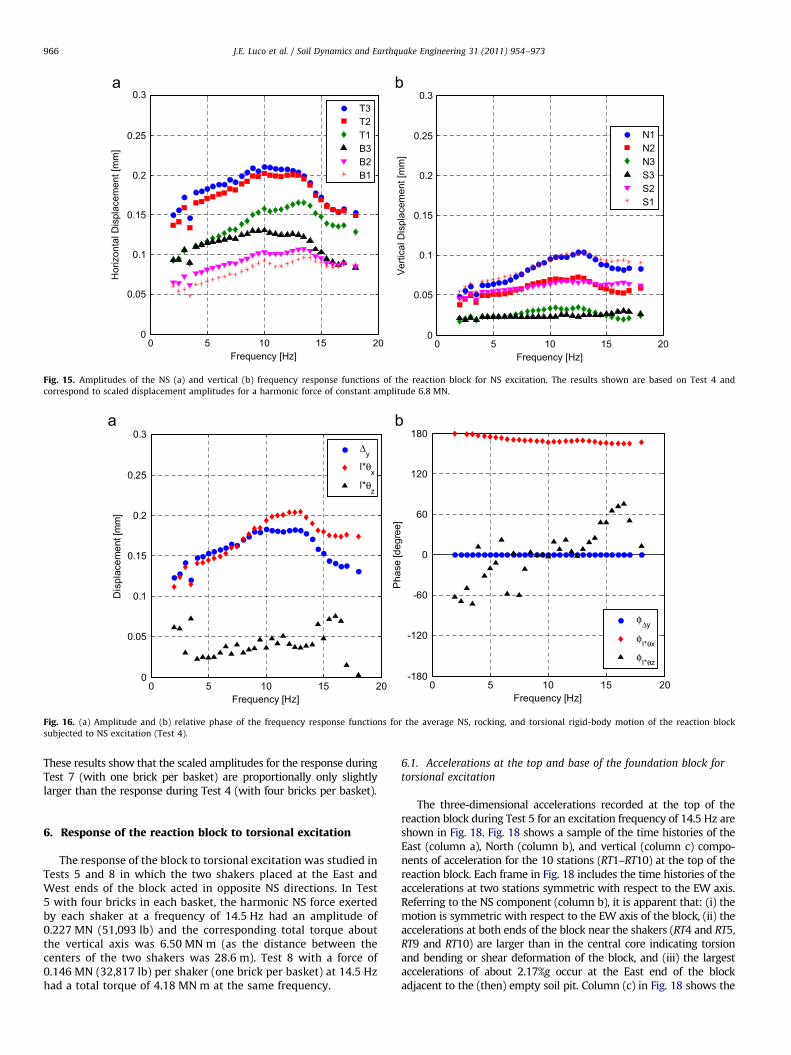
maximum NS force). For this purpose, the recorded accelerationswere transformed into displacements and then scaled to a NSexcitation force of 6.8 MN independent of frequency by use of thefactor ð6:8=0:216Þð10=f Þ2=ð2pf Þ2, where f is the cyclic frequency(Hz). The amplitudes of the resulting NS and vertical frequencyresponse at different locations in the block are presented inFig. 15a and b, respectively. The amplitudes shown in Fig. 15acorrespond to the averages of the NS components:
T3¼ ðRT4þRT5þRT9þRT10Þ=4T2¼ ðRT1þRT3þRT6þRT8Þ=4
T1¼ ðRT2þRT7Þ=2
B3¼ ðRB3þRB4þRB7þRB8Þ=4
B2¼ ðRB1þRB2þRB5þRB6Þ=4
B1¼ RB9 ð10Þ
The terms T1, T2, and T3 correspond to average NS motions at thetop of the block at distances of 0, 10.2, and 16.5 m from the NScenterline. The terms B1, B2, and B3 correspond to average NSmotions within the block at distances of 0, 8.2, and 12.1 m fromthe NS centerline.
The results in Fig. 15a indicate that: (i) the NS frequencyresponse near the East and West walls (T3) peaks at 10 Hz and hasa peak amplification of about 0.205/0.15¼1.4, (ii) near the NS axisof the block and at the bottom of the block there is a second peakat 14 Hz, (iii) the average displacements T2 and T3 at the top ofthe block are very different from T1 indicating localized deforma-tions at the east and west ends of the block, (iv) the averages atthe base of the block also show localized deformation near theEast and West walls, and (v) the NS motions increase with
elevation indicating the presence of a rocking component andbending of the North and South walls.
The amplitudes shown in Fig. 15b correspond to the averagesof the vertical components:
N1¼ ðRT6þRT7þRT8Þ=3N2¼ ðRT5þRB5þRB6þRT9Þ=4
N3¼ ðRB4þRB7Þ=2
S3¼ ðRB3þRB8Þ=2
S2¼ ðRT4þRB2þRB1þRT10Þ=4
S1¼ ðRT1þRT2þRT3Þ=3 ð11Þ
The terms N1–S1, N2–S2, and N3–S3 correspond to averages ofstations at distances of 9.70, 4.98, and 2.77 m from the EW axis ofthe block. The results in Fig. 15b indicate that the amplitudes ofthe vertical displacements increase with horizontal distance tothe EW axis of rotation, that the motions are approximately anti-symmetric with respect to the EW axis, and that the peakresponse occurs at about 13 Hz.
The results in Fig. 15a and b indicate that the maximum scaledhorizontal and vertical displacements for the maximum nominalharmonic actuator force of 3.4 MN would be 0.1 and 0.05 mm,respectively.
5.4. Estimates of average rigid-body motion
The scaled amplitude and the relative phase of the average NS,rocking, and vertical rigid-body motion of the reaction blocksubjected to NS excitation with two shakers with four bricksper basket (Test 4) were determined by the procedure described
-20 -10 0 10 20-25
-20
-15
-10
-5
0
5
10
15
20
25
East-West Direction [m]
Nor
th-S
outh
Dire
ctio
n [m
]
Top External Outline - UndeformedTop External Outline - DeformedTop StationsDisplaced Top Stations
N
-20 -10 0 10 20-25
-20
-15
-10
-5
0
5
10
15
20
25
East-West Direction [m]
Nor
th-S
outh
Dire
ctio
n [m
]
Top External Outline - Undeformed ShapeBottom Internal Outline - Undeformed ShapeBottom Internal Outline - DeformedBottom StationsDisplaced Bottom Stations
N
Verti
cal D
efor
mat
ion
10 -3
[mm
]
Experimental(Top Channels)
Ver
tical
Def
orm
atio
n 10
-3[m
m]
Experimental(Bottom Channels)
Fig. 14. Displacement and deformation of the reaction block at the top of (a) and within (b) the block for NS excitation at 10 Hz, and distribution of vertical displacements
on horizontal plane at the top (c) and bottom (d) of the block.
J.E. Luco et al. / Soil Dynamics and Earthquake Engineering 31 (2011) 954–973 965
in Section 4.3 and are presented in Fig. 16. The recorded accel-erations during Test 4 were transformed to scaled displacementsthrough multiplication by the factorð6:8=0:216Þð10=f Þ2=ð2pf Þ2.The linearly scaled amplitudes correspond to a harmonic forcewith constant amplitude of 6.8 MN. The most significant compo-nents of the average rigid-body motion are the NS translation andthe rocking rotation about the EW axis. The NS rigid-body motionat the reference point at the top center of the block is consistentwith the average of the terms T1, T2, and T3 shown in Fig. 15a forthe motion of the top of the block. The rocking motion is alsoconsistent with the vertical motion at the north and south walls(N3 and S3 in Fig. 15b). There is a small torsional component dueto asymmetry with respect to a vertical axis associated with theempty soil pit, with lateral variations of soil properties, and withpossible imperfect synchronization of the two shakers. Thevertical, longitudinal, and rocking (about the NS axis) componentsare very small and are not shown in Fig. 16.
Fig. 16b shows the relative phase of the rocking and torsionalresponse with respect to the average NS rigid-body displacementresponse. The rocking response is approximately 1801 out ofphase with respect to the NS displacement, while the torsionalresponse is approximately in phase with respect to the NSdisplacement at 10 Hz.
5.5. Test of linearity
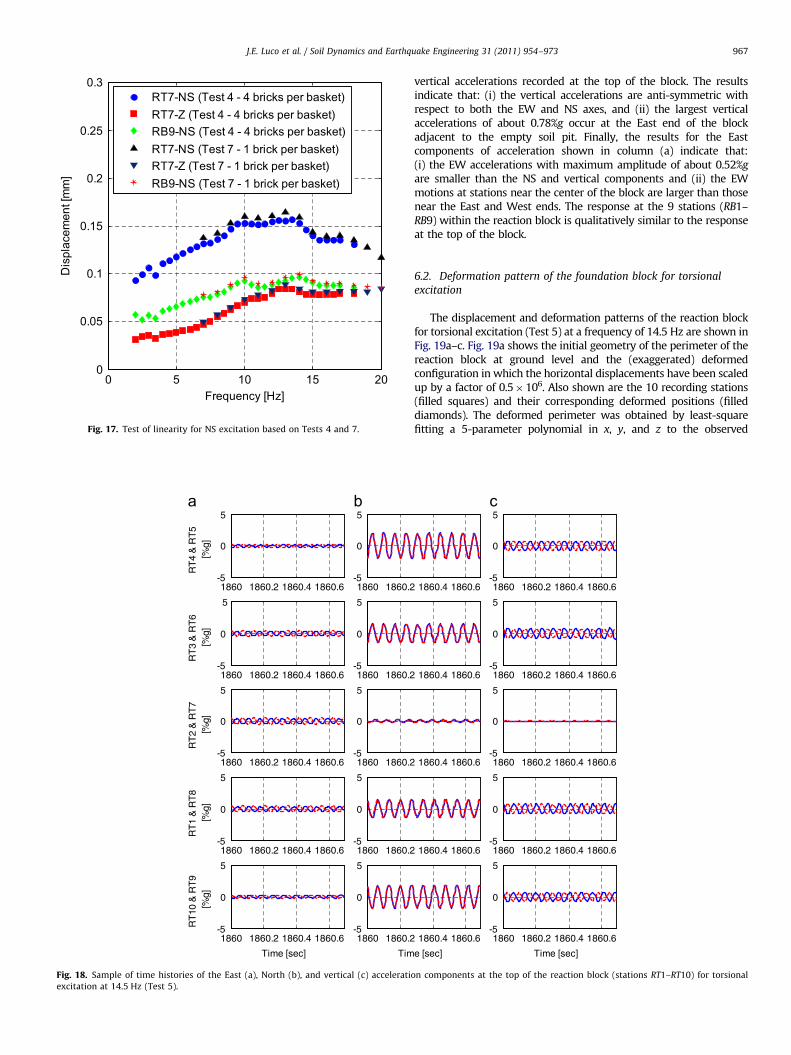
The results of Test 4 with a total NS force of 0.216 MN at 10 Hz(four bricks per basket) and Test 7 with a total force of 0.139 MN at10 Hz (one brick per basket) were used to check the linearity of thesystem. The recorded accelerations were transformed into displace-ments and then scaled to a harmonic excitation force of 6.8 MNindependent of frequency. Comparisons of the normalized NS dis-placements at stations RT7 and RB9 and of the normalized verticaldisplacement at station RT7 for the two tests are presented in Fig. 17.
0 5 10 15 200
0.05
0.1
0.15
0.2
0.25
0.3
Frequency [Hz]
Hor
izon
tal D
ispl
acem
ent [
mm
]
T3T2T1B3B2B1
0 5 10 15 200
0.05
0.1
0.15
0.2
0.25
0.3
Frequency [Hz]
Ver
tical
Dis
plac
emen
t [m
m]
N1N2N3S3S2S1
Fig. 15. Amplitudes of the NS (a) and vertical (b) frequency response functions of the reaction block for NS excitation. The results shown are based on Test 4 and
correspond to scaled displacement amplitudes for a harmonic force of constant amplitude 6.8 MN.
0 5 10 15 200
0.05
0.1
0.15
0.2
0.25
0.3
Frequency [Hz]
Dis
plac
emen
t [m
m]
Δy
l*θx
l*θz
0 5 10 15 20-180
-120
-60
0
60
120
180
Frequency [Hz]
Pha
se [d
egre
e]
φΔy
φl*θx
φl*θz
Fig. 16. (a) Amplitude and (b) relative phase of the frequency response functions for the average NS, rocking, and torsional rigid-body motion of the reaction block
subjected to NS excitation (Test 4).
J.E. Luco et al. / Soil Dynamics and Earthquake Engineering 31 (2011) 954–973966
These results show that the scaled amplitudes for the response duringTest 7 (with one brick per basket) are proportionally only slightlylarger than the response during Test 4 (with four bricks per basket).
6. Response of the reaction block to torsional excitation
The response of the block to torsional excitation was studied inTests 5 and 8 in which the two shakers placed at the East andWest ends of the block acted in opposite NS directions. In Test5 with four bricks in each basket, the harmonic NS force exertedby each shaker at a frequency of 14.5 Hz had an amplitude of0.227 MN (51,093 lb) and the corresponding total torque aboutthe vertical axis was 6.50 MN m (as the distance between thecenters of the two shakers was 28.6 m). Test 8 with a force of0.146 MN (32,817 lb) per shaker (one brick per basket) at 14.5 Hzhad a total torque of 4.18 MN m at the same frequency.
6.1. Accelerations at the top and base of the foundation block for
torsional excitation
The three-dimensional accelerations recorded at the top of thereaction block during Test 5 for an excitation frequency of 14.5 Hz areshown in Fig. 18. Fig. 18 shows a sample of the time histories of theEast (column a), North (column b), and vertical (column c) compo-nents of acceleration for the 10 stations (RT1–RT10) at the top of thereaction block. Each frame in Fig. 18 includes the time histories of theaccelerations at two stations symmetric with respect to the EW axis.Referring to the NS component (column b), it is apparent that: (i) themotion is symmetric with respect to the EW axis of the block, (ii) theaccelerations at both ends of the block near the shakers (RT4 and RT5,RT9 and RT10) are larger than in the central core indicating torsionand bending or shear deformation of the block, and (iii) the largestaccelerations of about 2.17%g occur at the East end of the blockadjacent to the (then) empty soil pit. Column (c) in Fig. 18 shows the
0 5 10 15 200
0.05
0.1
0.15
0.2
0.25
0.3
Frequency [Hz]
Dis
plac
emen
t [m
m]
RT7-NS (Test 4 - 4 bricks per basket)RT7-Z (Test 4 - 4 bricks per basket)RB9-NS (Test 4 - 4 bricks per basket)RT7-NS (Test 7 - 1 brick per basket)RT7-Z (Test 7 - 1 brick per basket)RB9-NS (Test 7 - 1 brick per basket)
Fig. 17. Test of linearity for NS excitation based on Tests 4 and 7.
1860 1860.2 1860.4 1860.6-5
0
5
RT
4 &
RT
5[%
g]
1860 1860.2-5
0
5
1860 1860.2 1860.4 1860.6-5
0
5
RT
3 &
RT
6[%
g]
1860 1860.2-5
0
5
1860 1860.2 1860.4 1860.6-5
0
5
RT
2 &
RT
7[%
g]
1860 1860.2-5
0
5
1860 1860.2 1860.4 1860.6-5
0
5
RT
1 &
RT
8[%
g]
1860 1860.2-5
0
5
1860 1860.2 1860.4 1860.6-5
0
5
RT
10 &
RT
9[%
g]
Time [sec]
1860 1860.2-5
0
5
Tim
Fig. 18. Sample of time histories of the East (a), North (b), and vertical (c) acceleratio
excitation at 14.5 Hz (Test 5).
J.E. Luco et al. / Soil Dynamics and Earthquake Engineering 31 (2011) 954–973 967
vertical accelerations recorded at the top of the block. The resultsindicate that: (i) the vertical accelerations are anti-symmetric withrespect to both the EW and NS axes, and (ii) the largest verticalaccelerations of about 0.78%g occur at the East end of the blockadjacent to the empty soil pit. Finally, the results for the Eastcomponents of acceleration shown in column (a) indicate that:(i) the EW accelerations with maximum amplitude of about 0.52%g
are smaller than the NS and vertical components and (ii) the EWmotions at stations near the center of the block are larger than thosenear the East and West ends. The response at the 9 stations (RB1–RB9) within the reaction block is qualitatively similar to the responseat the top of the block.
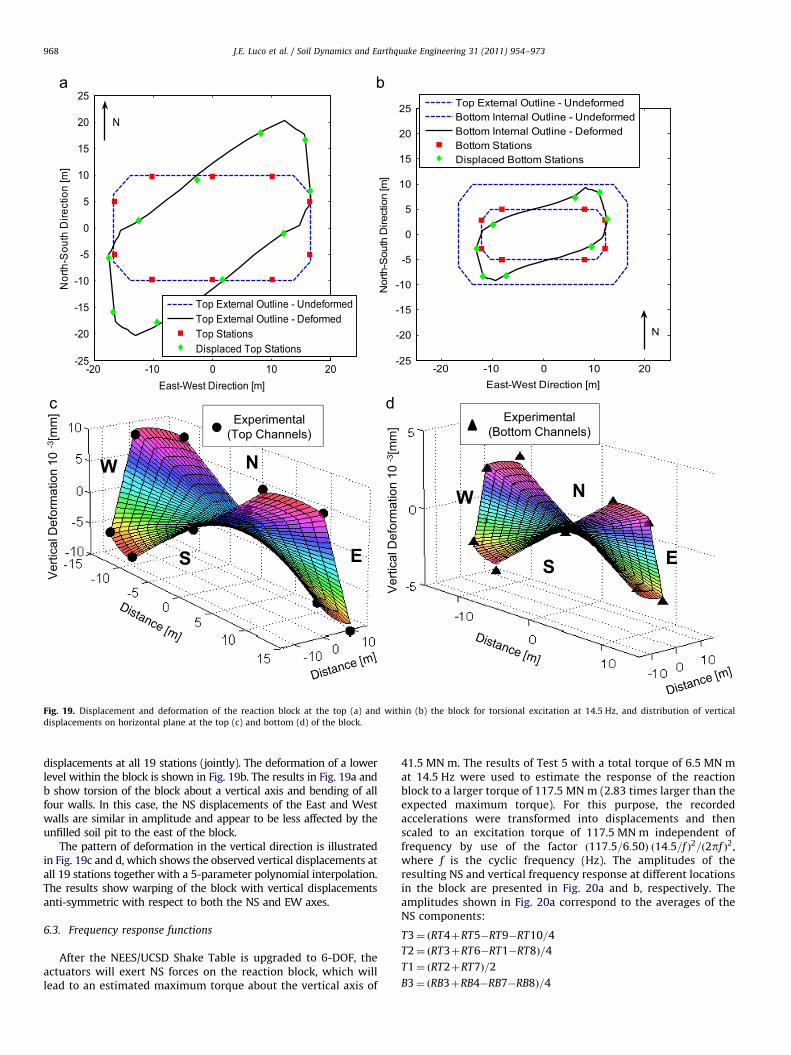
6.2. Deformation pattern of the foundation block for torsional
excitation
The displacement and deformation patterns of the reaction blockfor torsional excitation (Test 5) at a frequency of 14.5 Hz are shown inFig. 19a–c. Fig. 19a shows the initial geometry of the perimeter of thereaction block at ground level and the (exaggerated) deformedconfiguration in which the horizontal displacements have been scaledup by a factor of 0.5�106. Also shown are the 10 recording stations(filled squares) and their corresponding deformed positions (filleddiamonds). The deformed perimeter was obtained by least-squarefitting a 5-parameter polynomial in x, y, and z to the observed
1860.4 1860.6 1860 1860.2 1860.4 1860.6-5
0
5
1860.4 1860.6 1860 1860.2 1860.4 1860.6-5
0
5
1860.4 1860.6 1860 1860.2 1860.4 1860.6-5
0
5
1860.4 1860.6 1860 1860.2 1860.4 1860.6-5
0
5
1860.4 1860.6
e [sec]
1860 1860.2 1860.4 1860.6-5
0
5
Time [sec]
n components at the top of the reaction block (stations RT1–RT10) for torsional
-20 -10 0 10 20-25
-20
-15
-10
-5
0
5
10
15
20
25
East-West Direction [m]
Nor
th-S
outh
Dire
ctio
n [m
]
Top External Outline - UndeformedTop External Outline - DeformedTop StationsDisplaced Top Stations
N
-20 -10 0 10 20-25
-20
-15
-10
-5
0
5
10
15
20
25
East-West Direction [m]N
orth
-Sou
th D
irect
ion
[m]
Top External Outline - UndeformedBottom Internal Outline - UndeformedBottom Internal Outline - DeformedBottom StationsDisplaced Bottom Stations
N
N
Ver
tical
Def
orm
atio
n 10
-3[m
m]
S E
W
Experimental(Top Channels)
N
Ver
tical
Def
orm
atio
n 10
-3[m
m]
S E
W
Experimental(Bottom Channels)
Fig. 19. Displacement and deformation of the reaction block at the top (a) and within (b) the block for torsional excitation at 14.5 Hz, and distribution of vertical
displacements on horizontal plane at the top (c) and bottom (d) of the block.
J.E. Luco et al. / Soil Dynamics and Earthquake Engineering 31 (2011) 954–973968
displacements at all 19 stations (jointly). The deformation of a lowerlevel within the block is shown in Fig. 19b. The results in Fig. 19a andb show torsion of the block about a vertical axis and bending of allfour walls. In this case, the NS displacements of the East and Westwalls are similar in amplitude and appear to be less affected by theunfilled soil pit to the east of the block.
The pattern of deformation in the vertical direction is illustratedin Fig. 19c and d, which shows the observed vertical displacements atall 19 stations together with a 5-parameter polynomial interpolation.The results show warping of the block with vertical displacementsanti-symmetric with respect to both the NS and EW axes.
6.3. Frequency response functions
After the NEES/UCSD Shake Table is upgraded to 6-DOF, theactuators will exert NS forces on the reaction block, which willlead to an estimated maximum torque about the vertical axis of
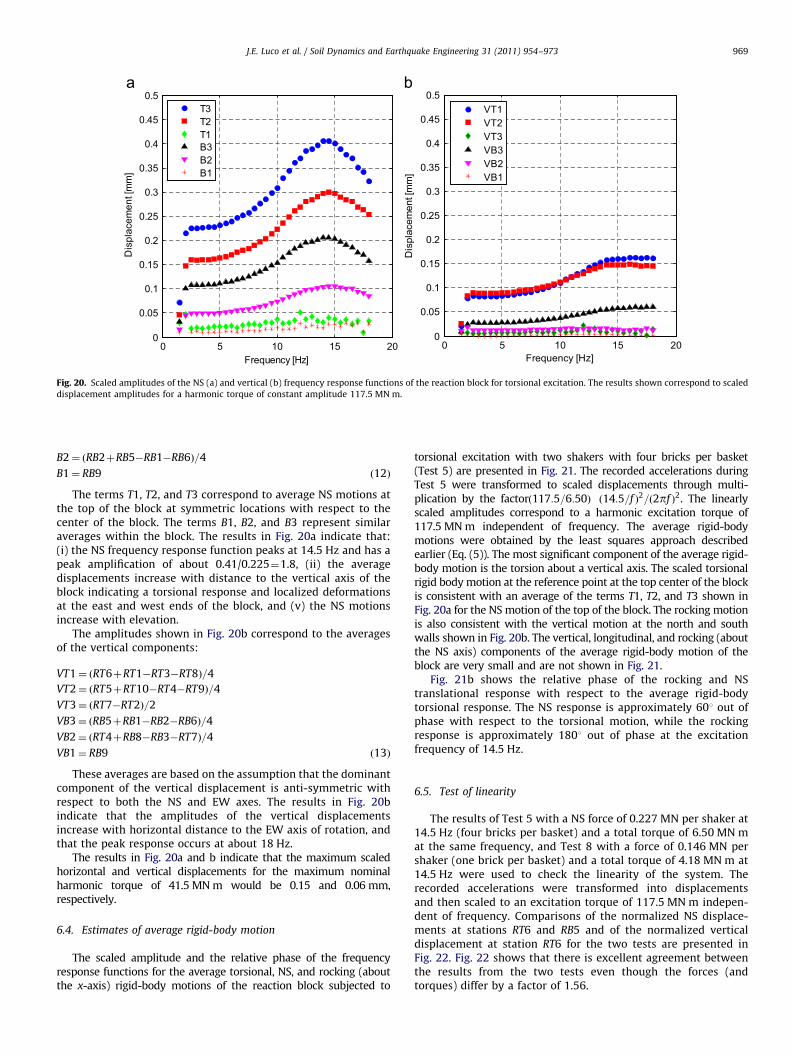
41.5 MN m. The results of Test 5 with a total torque of 6.5 MN mat 14.5 Hz were used to estimate the response of the reactionblock to a larger torque of 117.5 MN m (2.83 times larger than theexpected maximum torque). For this purpose, the recordedaccelerations were transformed into displacements and thenscaled to an excitation torque of 117.5 MN m independent offrequency by use of the factor ð117:5=6:50Þ ð14:5=f Þ2=ð2pf Þ2,where f is the cyclic frequency (Hz). The amplitudes of theresulting NS and vertical frequency response at different locationsin the block are presented in Fig. 20a and b, respectively. Theamplitudes shown in Fig. 20a correspond to the averages of theNS components:
T3¼ ðRT4þRT5�RT9�RT10=4
T2¼ ðRT3þRT6�RT1�RT8Þ=4
T1¼ ðRT2þRT7Þ=2
B3¼ ðRB3þRB4�RB7�RB8Þ=4
0 5 10 15 200
0.05
0.1
0.15
0.2
0.25
0.3
0.35
0.4
0.45
0.5
Frequency [Hz]
Dis
plac
emen
t [m
m]
T3T2T1B3B2B1
0 5 10 15 200
0.05
0.1
0.15
0.2
0.25
0.3
0.35
0.4
0.45
0.5
Frequency [Hz]
Dis
plac
emen
t [m
m]
VT1VT2VT3VB3VB2VB1
Fig. 20. Scaled amplitudes of the NS (a) and vertical (b) frequency response functions of the reaction block for torsional excitation. The results shown correspond to scaled
displacement amplitudes for a harmonic torque of constant amplitude 117.5 MN m.
J.E. Luco et al. / Soil Dynamics and Earthquake Engineering 31 (2011) 954–973 969
B2¼ ðRB2þRB5�RB1�RB6Þ=4
B1¼ RB9 ð12Þ
The terms T1, T2, and T3 correspond to average NS motions atthe top of the block at symmetric locations with respect to thecenter of the block. The terms B1, B2, and B3 represent similaraverages within the block. The results in Fig. 20a indicate that:(i) the NS frequency response function peaks at 14.5 Hz and has apeak amplification of about 0.41/0.225¼1.8, (ii) the averagedisplacements increase with distance to the vertical axis of theblock indicating a torsional response and localized deformationsat the east and west ends of the block, and (v) the NS motionsincrease with elevation.
The amplitudes shown in Fig. 20b correspond to the averagesof the vertical components:
VT1¼ ðRT6þRT1�RT3�RT8Þ=4
VT2¼ ðRT5þRT10�RT4�RT9Þ=4
VT3¼ ðRT7�RT2Þ=2
VB3¼ ðRB5þRB1�RB2�RB6Þ=4
VB2¼ ðRT4þRB8�RB3�RT7Þ=4
VB1¼ RB9 ð13Þ
These averages are based on the assumption that the dominantcomponent of the vertical displacement is anti-symmetric withrespect to both the NS and EW axes. The results in Fig. 20bindicate that the amplitudes of the vertical displacementsincrease with horizontal distance to the EW axis of rotation, andthat the peak response occurs at about 18 Hz.
The results in Fig. 20a and b indicate that the maximum scaledhorizontal and vertical displacements for the maximum nominalharmonic torque of 41.5 MN m would be 0.15 and 0.06 mm,respectively.
6.4. Estimates of average rigid-body motion
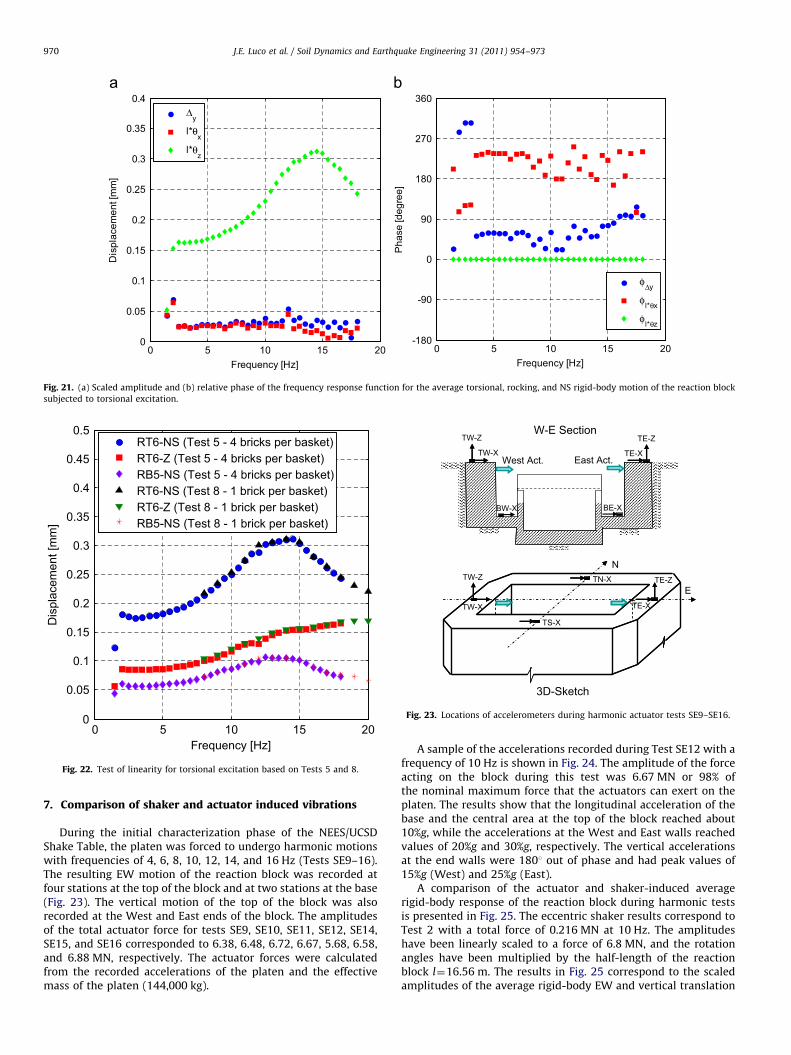
The scaled amplitude and the relative phase of the frequencyresponse functions for the average torsional, NS, and rocking (aboutthe x-axis) rigid-body motions of the reaction block subjected to
torsional excitation with two shakers with four bricks per basket(Test 5) are presented in Fig. 21. The recorded accelerations duringTest 5 were transformed to scaled displacements through multi-plication by the factorð117:5=6:50Þ ð14:5=f Þ2=ð2pf Þ2. The linearlyscaled amplitudes correspond to a harmonic excitation torque of117.5 MN m independent of frequency. The average rigid-bodymotions were obtained by the least squares approach describedearlier (Eq. (5)). The most significant component of the average rigid-body motion is the torsion about a vertical axis. The scaled torsionalrigid body motion at the reference point at the top center of the blockis consistent with an average of the terms T1, T2, and T3 shown inFig. 20a for the NS motion of the top of the block. The rocking motionis also consistent with the vertical motion at the north and southwalls shown in Fig. 20b. The vertical, longitudinal, and rocking (aboutthe NS axis) components of the average rigid-body motion of theblock are very small and are not shown in Fig. 21.
Fig. 21b shows the relative phase of the rocking and NStranslational response with respect to the average rigid-bodytorsional response. The NS response is approximately 601 out ofphase with respect to the torsional motion, while the rockingresponse is approximately 1801 out of phase at the excitationfrequency of 14.5 Hz.
6.5. Test of linearity
The results of Test 5 with a NS force of 0.227 MN per shaker at14.5 Hz (four bricks per basket) and a total torque of 6.50 MN mat the same frequency, and Test 8 with a force of 0.146 MN pershaker (one brick per basket) and a total torque of 4.18 MN m at14.5 Hz were used to check the linearity of the system. Therecorded accelerations were transformed into displacementsand then scaled to an excitation torque of 117.5 MN m indepen-dent of frequency. Comparisons of the normalized NS displace-ments at stations RT6 and RB5 and of the normalized verticaldisplacement at station RT6 for the two tests are presented inFig. 22. Fig. 22 shows that there is excellent agreement betweenthe results from the two tests even though the forces (andtorques) differ by a factor of 1.56.
0 5 10 15 200
0.05
0.1
0.15
0.2
0.25
0.3
0.35
0.4
0.45
0.5
Frequency [Hz]
Dis
plac
emen
t [m
m]
RT6-NS (Test 5 - 4 bricks per basket)RT6-Z (Test 5 - 4 bricks per basket)RB5-NS (Test 5 - 4 bricks per basket)RT6-NS (Test 8 - 1 brick per basket)RT6-Z (Test 8 - 1 brick per basket)RB5-NS (Test 8 - 1 brick per basket)
Fig. 22. Test of linearity for torsional excitation based on Tests 5 and 8.
W-E SectionTE-ZTW-Z
BW-X BE-X
N
E
3D-Sketch
TN-X
TS-X
TW-Z TE-Z
TW-X TE-X
TW-X
BW-X BE-X
TE-X
West Act. East Act.
Fig. 23. Locations of accelerometers during harmonic actuator tests SE9–SE16.
0 5 10 15 200
0.05
0.1
0.15
0.2
0.25
0.3
0.35
0.4
Frequency [Hz]
Dis
plac
emen
t [m
m]
Δy
l*θx
l*θz
0 5 10 15 20-180
-90
0
90
180
270
360
Frequency [Hz]
Pha
se [d
egre
e]
φΔy
φl*θx
φl*θz
Fig. 21. (a) Scaled amplitude and (b) relative phase of the frequency response function for the average torsional, rocking, and NS rigid-body motion of the reaction block
subjected to torsional excitation.
J.E. Luco et al. / Soil Dynamics and Earthquake Engineering 31 (2011) 954–973970
7. Comparison of shaker and actuator induced vibrations
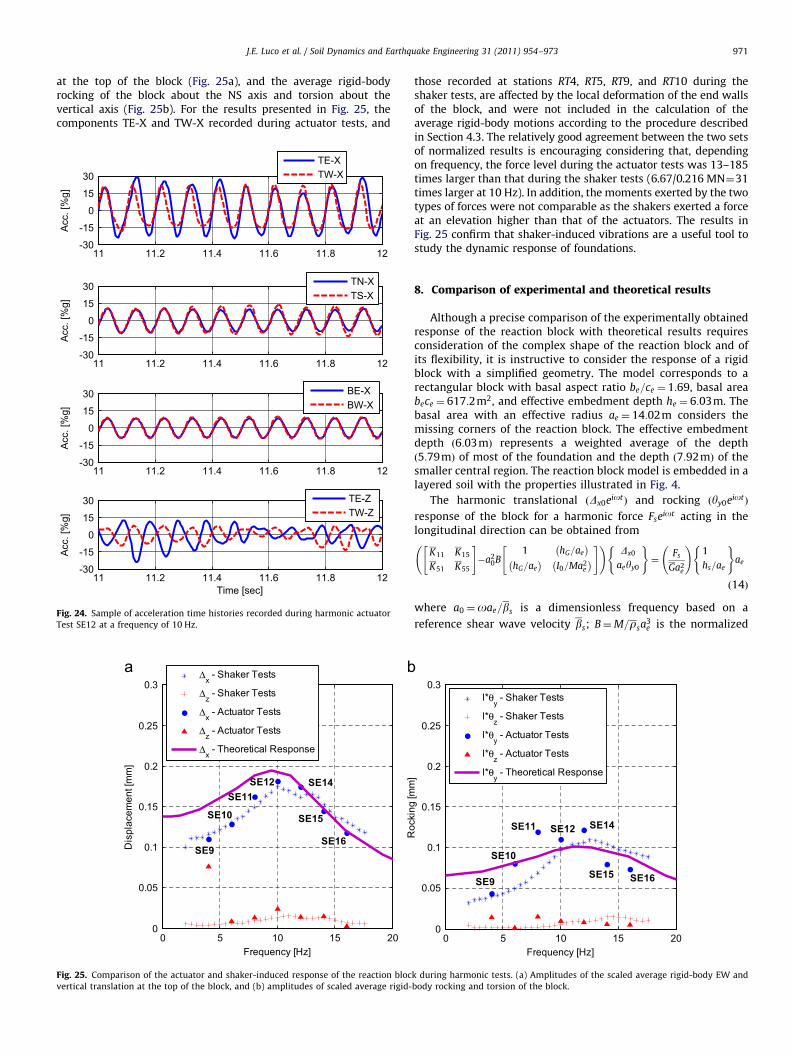
During the initial characterization phase of the NEES/UCSDShake Table, the platen was forced to undergo harmonic motionswith frequencies of 4, 6, 8, 10, 12, 14, and 16 Hz (Tests SE9–16).The resulting EW motion of the reaction block was recorded atfour stations at the top of the block and at two stations at the base(Fig. 23). The vertical motion of the top of the block was alsorecorded at the West and East ends of the block. The amplitudesof the total actuator force for tests SE9, SE10, SE11, SE12, SE14,SE15, and SE16 corresponded to 6.38, 6.48, 6.72, 6.67, 5.68, 6.58,and 6.88 MN, respectively. The actuator forces were calculatedfrom the recorded accelerations of the platen and the effectivemass of the platen (144,000 kg).
A sample of the accelerations recorded during Test SE12 with afrequency of 10 Hz is shown in Fig. 24. The amplitude of the forceacting on the block during this test was 6.67 MN or 98% ofthe nominal maximum force that the actuators can exert on theplaten. The results show that the longitudinal acceleration of thebase and the central area at the top of the block reached about10%g, while the accelerations at the West and East walls reachedvalues of 20%g and 30%g, respectively. The vertical accelerationsat the end walls were 1801 out of phase and had peak values of15%g (West) and 25%g (East).
A comparison of the actuator and shaker-induced averagerigid-body response of the reaction block during harmonic testsis presented in Fig. 25. The eccentric shaker results correspond toTest 2 with a total force of 0.216 MN at 10 Hz. The amplitudeshave been linearly scaled to a force of 6.8 MN, and the rotationangles have been multiplied by the half-length of the reactionblock l¼16.56 m. The results in Fig. 25 correspond to the scaledamplitudes of the average rigid-body EW and vertical translation
J.E. Luco et al. / Soil Dynamics and Earthquake Engineering 31 (2011) 954–973 971
at the top of the block (Fig. 25a), and the average rigid-bodyrocking of the block about the NS axis and torsion about thevertical axis (Fig. 25b). For the results presented in Fig. 25, thecomponents TE-X and TW-X recorded during actuator tests, and
11 11.2 11.4 11.6 11.8 12-30
-15
0
15
30
Acc
. [%
g]
TE-XTW-X
11 11.2 11.4 11.6 11.8 12-30
-15
0
15
30
Acc
. [%
g]
TN-XTS-X
11 11.2 11.4 11.6 11.8 12-30
-15
0
15
30
Acc
. [%
g]
BE-XBW-X
11 11.2 11.4 11.6 11.8 12-30
-15
0
15
30
Time [sec]
Acc
. [%
g]
TE-ZTW-Z
Fig. 24. Sample of acceleration time histories recorded during harmonic actuator
Test SE12 at a frequency of 10 Hz.
0 5 10 15 200
0.05
0.1
0.15
0.2
0.25
0.3
Frequency [Hz]
Dis
plac
emen
t [m
m]
Δx - Shaker Tests
Δz - Shaker Tests
Δx - Actuator Tests
Δz - Actuator Tests
Δx - Theoretical Response
SE10
SE11SE12 SE14
SE15
SE16SE9
Fig. 25. Comparison of the actuator and shaker-induced response of the reaction bloc
vertical translation at the top of the block, and (b) amplitudes of scaled average rigid-
those recorded at stations RT4, RT5, RT9, and RT10 during theshaker tests, are affected by the local deformation of the end wallsof the block, and were not included in the calculation of theaverage rigid-body motions according to the procedure describedin Section 4.3. The relatively good agreement between the two setsof normalized results is encouraging considering that, dependingon frequency, the force level during the actuator tests was 13–185times larger than that during the shaker tests (6.67/0.216 MN¼31times larger at 10 Hz). In addition, the moments exerted by the twotypes of forces were not comparable as the shakers exerted a forceat an elevation higher than that of the actuators. The results inFig. 25 confirm that shaker-induced vibrations are a useful tool tostudy the dynamic response of foundations.
8. Comparison of experimental and theoretical results
Although a precise comparison of the experimentally obtainedresponse of the reaction block with theoretical results requiresconsideration of the complex shape of the reaction block and ofits flexibility, it is instructive to consider the response of a rigidblock with a simplified geometry. The model corresponds to arectangular block with basal aspect ratio be=ce ¼ 1:69, basal areabece ¼ 617:2m2, and effective embedment depth he ¼ 6:03m. Thebasal area with an effective radius ae ¼ 14:02m considers themissing corners of the reaction block. The effective embedmentdepth ð6:03mÞ represents a weighted average of the depthð5:79mÞ of most of the foundation and the depth ð7:92mÞ of thesmaller central region. The reaction block model is embedded in alayered soil with the properties illustrated in Fig. 4.
The harmonic translational ðDx0eiotÞ and rocking ðyy0eiotÞ
response of the block for a harmonic force Fseiot acting in thelongitudinal direction can be obtained from
K11 K15
K51 K55
" #�a2
0B1 hG=ae
� �hG=ae
� �I0=Ma2
e
� �" # !
Dx0
aeyy0
( )¼
Fs
Ga2e
!1
hs=ae
( )ae
ð14Þ
where a0 ¼oae=bs is a dimensionless frequency based on a
reference shear wave velocity bs; B¼M=rsa3e is the normalized
0 5 10 15 200
0.05
0.1
0.15
0.2
0.25
0.3
Frequency [Hz]
Roc
king
[mm
]
l*θy - Shaker Tests
l*θz - Shaker Tests
l*θy - Actuator Tests
l*θz - Actuator Tests
l*θy - Theoretical Response
SE12
SE10
SE9
SE11 SE14
SE15 SE16
k during harmonic tests. (a) Amplitudes of the scaled average rigid-body EW and
body rocking and torsion of the block.
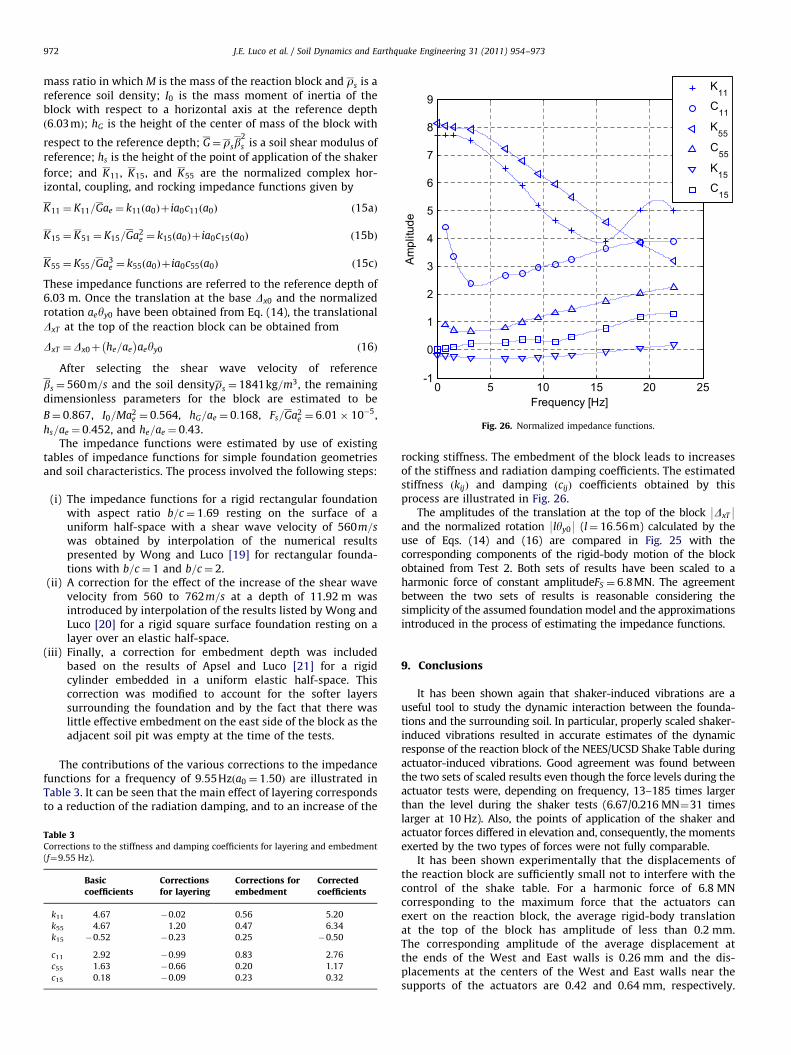
0 5 10 15 20 25-1
0
1
2
3
4
5
6
7
8
9
Frequency [Hz]A
mpl
itude
K11
C11
K55
C55
K15
C15
Fig. 26. Normalized impedance functions.
J.E. Luco et al. / Soil Dynamics and Earthquake Engineering 31 (2011) 954–973972
mass ratio in which M is the mass of the reaction block and rs is a
reference soil density; I0 is the mass moment of inertia of theblock with respect to a horizontal axis at the reference depth
ð6:03mÞ; hG is the height of the center of mass of the block with
respect to the reference depth; G¼ rsb2
s is a soil shear modulus of
reference; hs is the height of the point of application of the shaker
force; and K11, K15, and K55 are the normalized complex hor-izontal, coupling, and rocking impedance functions given by
K11 ¼ K11=Gae ¼ k11ða0Þþ ia0c11ða0Þ ð15aÞ
K15 ¼ K51 ¼ K15=Ga2e ¼ k15ða0Þþ ia0c15ða0Þ ð15bÞ
K55 ¼ K55=Ga3e ¼ k55ða0Þþ ia0c55ða0Þ ð15cÞ
These impedance functions are referred to the reference depth of6.03 m. Once the translation at the base Dx0 and the normalized
rotation aeyy0 have been obtained from Eq. (14), the translational
DxT at the top of the reaction block can be obtained from
DxT ¼Dx0þ he=ae
� �aeyy0 ð16Þ
After selecting the shear wave velocity of reference
bs ¼ 560m=s and the soil densityrs ¼ 1841kg=m3, the remaining
dimensionless parameters for the block are estimated to be
B¼ 0:867, I0=Ma2e ¼ 0:564, hG=ae ¼ 0:168, Fs=Ga2
e ¼ 6:01� 10�5,
hs=ae ¼ 0:452, and he=ae ¼ 0:43.The impedance functions were estimated by use of existing
tables of impedance functions for simple foundation geometriesand soil characteristics. The process involved the following steps:
(i)
TableCorre
(f¼9
k11
k55
k15
c11
c55
c15
The impedance functions for a rigid rectangular foundationwith aspect ratio b=c¼ 1:69 resting on the surface of auniform half-space with a shear wave velocity of 560m=s
was obtained by interpolation of the numerical resultspresented by Wong and Luco [19] for rectangular founda-tions with b=c¼ 1 and b=c¼ 2.
(ii)
A correction for the effect of the increase of the shear wavevelocity from 560 to 762m=s at a depth of 11.92 m wasintroduced by interpolation of the results listed by Wong andLuco [20] for a rigid square surface foundation resting on alayer over an elastic half-space.(iii)
Finally, a correction for embedment depth was includedbased on the results of Apsel and Luco [21] for a rigidcylinder embedded in a uniform elastic half-space. Thiscorrection was modified to account for the softer layerssurrounding the foundation and by the fact that there waslittle effective embedment on the east side of the block as theadjacent soil pit was empty at the time of the tests.The contributions of the various corrections to the impedancefunctions for a frequency of 9:55Hzða0 ¼ 1:50Þ are illustrated inTable 3. It can be seen that the main effect of layering correspondsto a reduction of the radiation damping, and to an increase of the
3ctions to the stiffness and damping coefficients for layering and embedment
.55 Hz).
Basiccoefficients
Correctionsfor layering
Corrections forembedment
Correctedcoefficients
4.67 �0.02 0.56 5.20
4.67 1.20 0.47 6.34
�0.52 �0.23 0.25 �0.50
2.92 �0.99 0.83 2.76
1.63 �0.66 0.20 1.17
0.18 �0.09 0.23 0.32
rocking stiffness. The embedment of the block leads to increasesof the stiffness and radiation damping coefficients. The estimatedstiffness ðkijÞ and damping ðcijÞ coefficients obtained by thisprocess are illustrated in Fig. 26.
The amplitudes of the translation at the top of the block 9DxT9and the normalized rotation 9lyy09 (l¼ 16:56m) calculated by theuse of Eqs. (14) and (16) are compared in Fig. 25 with thecorresponding components of the rigid-body motion of the blockobtained from Test 2. Both sets of results have been scaled to aharmonic force of constant amplitudeFS ¼ 6:8MN. The agreementbetween the two sets of results is reasonable considering thesimplicity of the assumed foundation model and the approximationsintroduced in the process of estimating the impedance functions.
9. Conclusions
It has been shown again that shaker-induced vibrations are auseful tool to study the dynamic interaction between the founda-tions and the surrounding soil. In particular, properly scaled shaker-induced vibrations resulted in accurate estimates of the dynamicresponse of the reaction block of the NEES/UCSD Shake Table duringactuator-induced vibrations. Good agreement was found betweenthe two sets of scaled results even though the force levels during theactuator tests were, depending on frequency, 13–185 times largerthan the level during the shaker tests (6.67/0.216 MN¼31 timeslarger at 10 Hz). Also, the points of application of the shaker andactuator forces differed in elevation and, consequently, the momentsexerted by the two types of forces were not fully comparable.
It has been shown experimentally that the displacements ofthe reaction block are sufficiently small not to interfere with thecontrol of the shake table. For a harmonic force of 6.8 MNcorresponding to the maximum force that the actuators canexert on the reaction block, the average rigid-body translationat the top of the block has amplitude of less than 0.2 mm.The corresponding amplitude of the average displacement atthe ends of the West and East walls is 0.26 mm and the dis-placements at the centers of the West and East walls near thesupports of the actuators are 0.42 and 0.64 mm, respectively.
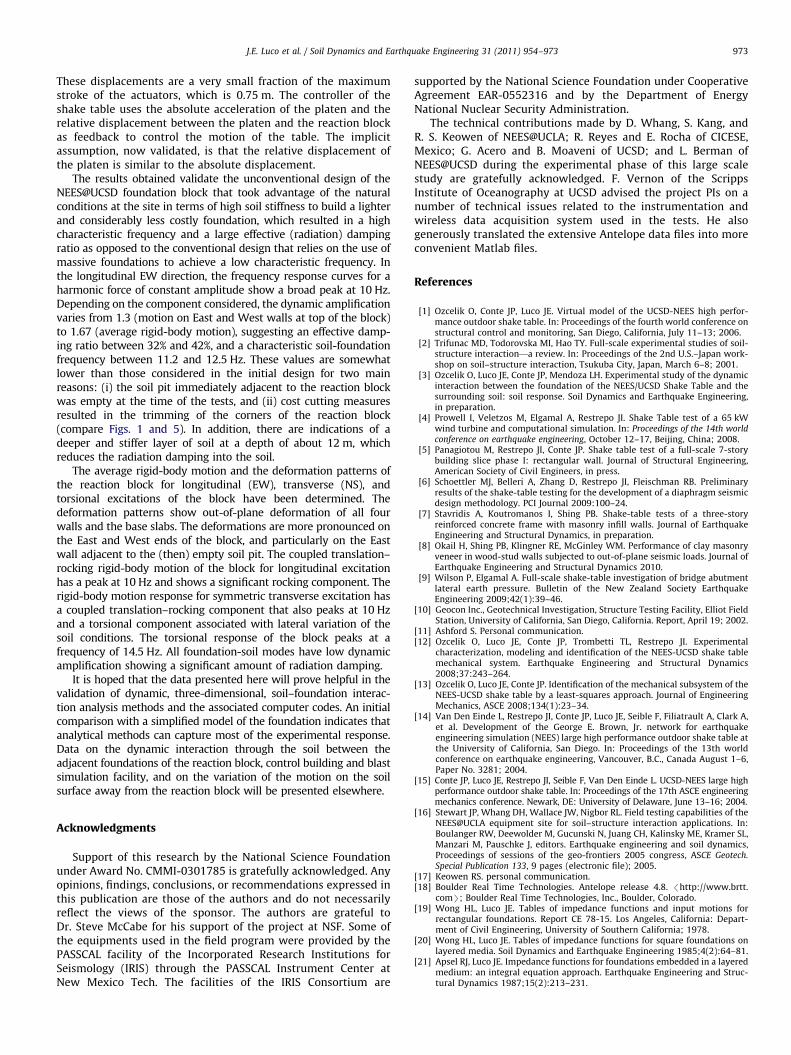
J.E. Luco et al. / Soil Dynamics and Earthquake Engineering 31 (2011) 954–973 973
These displacements are a very small fraction of the maximumstroke of the actuators, which is 0.75 m. The controller of theshake table uses the absolute acceleration of the platen and therelative displacement between the platen and the reaction blockas feedback to control the motion of the table. The implicitassumption, now validated, is that the relative displacement ofthe platen is similar to the absolute displacement.
The results obtained validate the unconventional design of theNEES@UCSD foundation block that took advantage of the naturalconditions at the site in terms of high soil stiffness to build a lighterand considerably less costly foundation, which resulted in a highcharacteristic frequency and a large effective (radiation) dampingratio as opposed to the conventional design that relies on the use ofmassive foundations to achieve a low characteristic frequency. Inthe longitudinal EW direction, the frequency response curves for aharmonic force of constant amplitude show a broad peak at 10 Hz.Depending on the component considered, the dynamic amplificationvaries from 1.3 (motion on East and West walls at top of the block)to 1.67 (average rigid-body motion), suggesting an effective damp-ing ratio between 32% and 42%, and a characteristic soil-foundationfrequency between 11.2 and 12.5 Hz. These values are somewhatlower than those considered in the initial design for two mainreasons: (i) the soil pit immediately adjacent to the reaction blockwas empty at the time of the tests, and (ii) cost cutting measuresresulted in the trimming of the corners of the reaction block(compare Figs. 1 and 5). In addition, there are indications of adeeper and stiffer layer of soil at a depth of about 12 m, whichreduces the radiation damping into the soil.
The average rigid-body motion and the deformation patterns ofthe reaction block for longitudinal (EW), transverse (NS), andtorsional excitations of the block have been determined. Thedeformation patterns show out-of-plane deformation of all fourwalls and the base slabs. The deformations are more pronounced onthe East and West ends of the block, and particularly on the Eastwall adjacent to the (then) empty soil pit. The coupled translation–rocking rigid-body motion of the block for longitudinal excitationhas a peak at 10 Hz and shows a significant rocking component. Therigid-body motion response for symmetric transverse excitation hasa coupled translation–rocking component that also peaks at 10 Hzand a torsional component associated with lateral variation of thesoil conditions. The torsional response of the block peaks at afrequency of 14.5 Hz. All foundation-soil modes have low dynamicamplification showing a significant amount of radiation damping.
It is hoped that the data presented here will prove helpful in thevalidation of dynamic, three-dimensional, soil–foundation interac-tion analysis methods and the associated computer codes. An initialcomparison with a simplified model of the foundation indicates thatanalytical methods can capture most of the experimental response.Data on the dynamic interaction through the soil between theadjacent foundations of the reaction block, control building and blastsimulation facility, and on the variation of the motion on the soilsurface away from the reaction block will be presented elsewhere.
Acknowledgments
Support of this research by the National Science Foundationunder Award No. CMMI-0301785 is gratefully acknowledged. Anyopinions, findings, conclusions, or recommendations expressed inthis publication are those of the authors and do not necessarilyreflect the views of the sponsor. The authors are grateful toDr. Steve McCabe for his support of the project at NSF. Some ofthe equipments used in the field program were provided by thePASSCAL facility of the Incorporated Research Institutions forSeismology (IRIS) through the PASSCAL Instrument Center atNew Mexico Tech. The facilities of the IRIS Consortium are
supported by the National Science Foundation under CooperativeAgreement EAR-0552316 and by the Department of EnergyNational Nuclear Security Administration.
The technical contributions made by D. Whang, S. Kang, andR. S. Keowen of NEES@UCLA; R. Reyes and E. Rocha of CICESE,Mexico; G. Acero and B. Moaveni of UCSD; and L. Berman ofNEES@UCSD during the experimental phase of this large scalestudy are gratefully acknowledged. F. Vernon of the ScrippsInstitute of Oceanography at UCSD advised the project PIs on anumber of technical issues related to the instrumentation andwireless data acquisition system used in the tests. He alsogenerously translated the extensive Antelope data files into moreconvenient Matlab files.
References
[1] Ozcelik O, Conte JP, Luco JE. Virtual model of the UCSD-NEES high perfor-mance outdoor shake table. In: Proceedings of the fourth world conference onstructural control and monitoring, San Diego, California, July 11–13; 2006.
[2] Trifunac MD, Todorovska MI, Hao TY. Full-scale experimental studies of soil-structure interaction—a review. In: Proceedings of the 2nd U.S.–Japan work-shop on soil–structure interaction, Tsukuba City, Japan, March 6–8; 2001.
[3] Ozcelik O, Luco JE, Conte JP, Mendoza LH. Experimental study of the dynamicinteraction between the foundation of the NEES/UCSD Shake Table and thesurrounding soil: soil response. Soil Dynamics and Earthquake Engineering,in preparation.
[4] Prowell I, Veletzos M, Elgamal A, Restrepo JI. Shake Table test of a 65 kWwind turbine and computational simulation. In: Proceedings of the 14th worldconference on earthquake engineering, October 12–17, Beijing, China; 2008.
[5] Panagiotou M, Restrepo JI, Conte JP. Shake table test of a full-scale 7-storybuilding slice phase I: rectangular wall. Journal of Structural Engineering,American Society of Civil Engineers, in press.
[6] Schoettler MJ, Belleri A, Zhang D, Restrepo JI, Fleischman RB. Preliminaryresults of the shake-table testing for the development of a diaphragm seismicdesign methodology. PCI Journal 2009:100–24.
[7] Stavridis A, Koutromanos I, Shing PB. Shake-table tests of a three-storyreinforced concrete frame with masonry infill walls. Journal of EarthquakeEngineering and Structural Dynamics, in preparation.
[8] Okail H, Shing PB, Klingner RE, McGinley WM. Performance of clay masonryveneer in wood-stud walls subjected to out-of-plane seismic loads. Journal ofEarthquake Engineering and Structural Dynamics 2010.
[9] Wilson P, Elgamal A. Full-scale shake-table investigation of bridge abutmentlateral earth pressure. Bulletin of the New Zealand Society EarthquakeEngineering 2009;42(1):39–46.
[10] Geocon Inc., Geotechnical Investigation, Structure Testing Facility, Elliot FieldStation, University of California, San Diego, California. Report, April 19; 2002.
[11] Ashford S. Personal communication.[12] Ozcelik O, Luco JE, Conte JP, Trombetti TL, Restrepo JI. Experimental
characterization, modeling and identification of the NEES-UCSD shake tablemechanical system. Earthquake Engineering and Structural Dynamics2008;37:243–264.
[13] Ozcelik O, Luco JE, Conte JP. Identification of the mechanical subsystem of theNEES-UCSD shake table by a least-squares approach. Journal of EngineeringMechanics, ASCE 2008;134(1):23–34.
[14] Van Den Einde L, Restrepo JI, Conte JP, Luco JE, Seible F, Filiatrault A, Clark A,et al. Development of the George E. Brown, Jr. network for earthquakeengineering simulation (NEES) large high performance outdoor shake table atthe University of California, San Diego. In: Proceedings of the 13th worldconference on earthquake engineering, Vancouver, B.C., Canada August 1–6,Paper No. 3281; 2004.
[15] Conte JP, Luco JE, Restrepo JI, Seible F, Van Den Einde L. UCSD-NEES large highperformance outdoor shake table. In: Proceedings of the 17th ASCE engineeringmechanics conference. Newark, DE: University of Delaware, June 13–16; 2004.
[16] Stewart JP, Whang DH, Wallace JW, Nigbor RL. Field testing capabilities of theNEES@UCLA equipment site for soil–structure interaction applications. In:Boulanger RW, Deewolder M, Gucunski N, Juang CH, Kalinsky ME, Kramer SL,Manzari M, Pauschke J, editors. Earthquake engineering and soil dynamics,Proceedings of sessions of the geo-frontiers 2005 congress, ASCE Geotech.Special Publication 133, 9 pages (electronic file); 2005.
[17] Keowen RS. personal communication.[18] Boulder Real Time Technologies. Antelope release 4.8. /http://www.brtt.
comS; Boulder Real Time Technologies, Inc., Boulder, Colorado.[19] Wong HL, Luco JE. Tables of impedance functions and input motions for
rectangular foundations. Report CE 78-15. Los Angeles, California: Depart-ment of Civil Engineering, University of Southern California; 1978.
[20] Wong HL, Luco JE. Tables of impedance functions for square foundations onlayered media. Soil Dynamics and Earthquake Engineering 1985;4(2):64–81.
[21] Apsel RJ, Luco JE. Impedance functions for foundations embedded in a layeredmedium: an integral equation approach. Earthquake Engineering and Struc-tural Dynamics 1987;15(2):213–231.