Soil Dynamics and Earthquake...
8
Contents lists available at ScienceDirect Soil Dynamics and Earthquake Engineering journal homepage: www.elsevier.com/locate/soildyn Dynamic characterization of a biogenic sand with a resonant column of fixed-partly fixed boundary conditions Kostas Senetakis a, ⁎ , Huan He b a City University of Hong Kong, Hong Kong SAR, China b University of New South Wales (UNSW), Sydney, Australia ABSTRACT The dynamic properties of sands, including the small-strain shear modulus (G max ) and the small-to-medium strain shear modulus (G) and shear damping (D s ) have been examined extensively in the literature. However, most works published over the past decades have focused on the behavior of soils subjected to isotropic stress paths. In the present study, the dynamic properties of a biogenic sand with origin from Western Australia were examined in the laboratory using a resonant column of fixed-partly fixed boundary conditions. This configuration allows the study of the small-strain shear modulus, the strain-dependent modulus and shear damping of samples subjected to stress anisotropy, which stress conditions may represent more effectively the in-situ state of a soil. For this purpose, proper calibrations of the resonant column were carried out in order to capture the rotational inertia of the apparatus in a wide range of cyclic frequencies covering, in this way, typical resonant frequencies of real soil samples. Basic geotechnical characterization of the biogenic sand was carried out quantifying the shape of the grains and conducting a series of monotonic triaxial tests capturing the peak and critical state friction angles. The dynamic test results indicated a more pronounced effect of the stress anisotropy on G max of the biogenic sand in comparison to the corresponding effect on quartz sands reported in the literature. For the limited set of experiments conducted in the study, the effect of stress anisotropy was found less pronounced for the small-to-medium strain shear modulus and shear damping, even though the results indicated a marked drop of shear damping at small strains when the samples were subjected to a deviatoric compressive load. 1. Introduction The dynamic properties of soils are essential parameters in earth- quake engineering studies, the geophysical characterization of sedi- ments, and the safe performance of engineering facilities including important structures such as nuclear plants and offshore infrastruc- ture. The particular interest in seismic ground response analysis studies are the small and small-to-medium strain ranges [1,2], where two important soil properties expressed with the shear modulus (G) and shear damping (D s ) are related to the propagation of shear waves through the soil mass. Propagated waves may be, for example, due to seismic or man-made activities such as machine vibrations and traffic loads. With respect to granular materials, there have been extensive studies in the literature investigating the small-to-medium strain dynamic properties, but most of these studies have focused on the application of isotropic stress state to the samples while conducting dynamic test measurements [3–9]. On the other hand, there has been relatively limited work on the dynamic behavior of sands under the application of stress anisotropy [10,11]. There is a general perception that the dynamic behavior of sand as well as that of clay is strongly dependent on the stresses applied in the directions of wave propagation and particle motion [12,13], even though the studies by Stokoe et al. [14], Viggiani and Atkinson [15] and Fam and Santamarina [16] have highlighted that the stress component in the direction of particle motion is the most important affecting the dynamic behavior of soils. To date, studies on the dynamic properties of sands under the application of stress anisotropy, expressed with the stress ratio (σ 1 '/ σ 3 ') or (q/p′), where σ 1 ' and σ 3 ' are the major and minor effective principal stresses, respectively, q and p′ are the deviatoric stress and mean effective confining pressure, respectively, have reported a relatively small effect of stress anisotropy on soil stiffness and damping particularly for values of the ratio (σ 1 '/σ 3 ') below 2–3 [10,17]. However a recent study by Payan et al. [11] on quartz sands showed that the effect of stress anisotropy, expressed as (q/p′), may be important, particularly for well-graded sands and sands of irregularly shaped http://dx.doi.org/10.1016/j.soildyn.2017.01.042 Received 23 October 2016; Received in revised form 25 December 2016; Accepted 31 January 2017 ⁎ Corresponding author. E-mail address: [email protected] (K. Senetakis). Soil Dynamics and Earthquake Engineering 95 (2017) 180–187 Available online 07 February 2017 0267-7261/ © 2017 Elsevier Ltd. All rights reserved. MARK
Transcript of Soil Dynamics and Earthquake...
Contents lists available at ScienceDirect
Soil Dynamics and Earthquake Engineering
journal homepage: www.elsevier.com/locate/soildyn
Dynamic characterization of a biogenic sand with a resonant column offixed-partly fixed boundary conditions
Kostas Senetakisa,⁎, Huan Heb
a City University of Hong Kong, Hong Kong SAR, Chinab University of New South Wales (UNSW), Sydney, Australia
A B S T R A C T
The dynamic properties of sands, including the small-strain shear modulus (Gmax) and the small-to-mediumstrain shear modulus (G) and shear damping (Ds) have been examined extensively in the literature. However,most works published over the past decades have focused on the behavior of soils subjected to isotropic stresspaths. In the present study, the dynamic properties of a biogenic sand with origin from Western Australia wereexamined in the laboratory using a resonant column of fixed-partly fixed boundary conditions. Thisconfiguration allows the study of the small-strain shear modulus, the strain-dependent modulus and sheardamping of samples subjected to stress anisotropy, which stress conditions may represent more effectively thein-situ state of a soil. For this purpose, proper calibrations of the resonant column were carried out in order tocapture the rotational inertia of the apparatus in a wide range of cyclic frequencies covering, in this way, typicalresonant frequencies of real soil samples. Basic geotechnical characterization of the biogenic sand was carriedout quantifying the shape of the grains and conducting a series of monotonic triaxial tests capturing the peakand critical state friction angles. The dynamic test results indicated a more pronounced effect of the stressanisotropy on Gmax of the biogenic sand in comparison to the corresponding effect on quartz sands reported inthe literature. For the limited set of experiments conducted in the study, the effect of stress anisotropy wasfound less pronounced for the small-to-medium strain shear modulus and shear damping, even though theresults indicated a marked drop of shear damping at small strains when the samples were subjected to adeviatoric compressive load.
1. Introduction
The dynamic properties of soils are essential parameters in earth-quake engineering studies, the geophysical characterization of sedi-ments, and the safe performance of engineering facilities includingimportant structures such as nuclear plants and offshore infrastruc-ture. The particular interest in seismic ground response analysisstudies are the small and small-to-medium strain ranges [1,2], wheretwo important soil properties expressed with the shear modulus (G)and shear damping (Ds) are related to the propagation of shear wavesthrough the soil mass. Propagated waves may be, for example, due toseismic or man-made activities such as machine vibrations and trafficloads.
With respect to granular materials, there have been extensivestudies in the literature investigating the small-to-medium straindynamic properties, but most of these studies have focused on theapplication of isotropic stress state to the samples while conductingdynamic test measurements [3–9]. On the other hand, there has been
relatively limited work on the dynamic behavior of sands under theapplication of stress anisotropy [10,11]. There is a general perceptionthat the dynamic behavior of sand as well as that of clay is stronglydependent on the stresses applied in the directions of wave propagationand particle motion [12,13], even though the studies by Stokoe et al.[14], Viggiani and Atkinson [15] and Fam and Santamarina [16] havehighlighted that the stress component in the direction of particlemotion is the most important affecting the dynamic behavior of soils.To date, studies on the dynamic properties of sands under theapplication of stress anisotropy, expressed with the stress ratio (σ1'/σ3') or (q/p′), where σ1' and σ3' are the major and minor effectiveprincipal stresses, respectively, q and p′ are the deviatoric stress andmean effective confining pressure, respectively, have reported arelatively small effect of stress anisotropy on soil stiffness and dampingparticularly for values of the ratio (σ1'/σ3') below 2–3 [10,17]. Howevera recent study by Payan et al. [11] on quartz sands showed that theeffect of stress anisotropy, expressed as (q/p′), may be important,particularly for well-graded sands and sands of irregularly shaped
http://dx.doi.org/10.1016/j.soildyn.2017.01.042Received 23 October 2016; Received in revised form 25 December 2016; Accepted 31 January 2017
⁎ Corresponding author.E-mail address: [email protected] (K. Senetakis).
Soil Dynamics and Earthquake Engineering 95 (2017) 180–187
Available online 07 February 20170267-7261/ © 2017 Elsevier Ltd. All rights reserved.
MARK
grains (i.e. grains of low sphericity and roundness). Perhaps, previousobservations and conclusions associated with the effect of the stressstate on the dynamic properties of sands were affected by the gradingand grain morphology characteristics of the soils under consideration.
In this study, the dynamic properties of a biogenic sand areexplored using a fixed-partly fixed resonant column, which allows theapplication of stress anisotropy while the sample is excited in torsionalmode of resonant column vibration. This configuration allows the studyof both soil stiffness and damping in a wide range of strains on samplessubjected to a deviatoric load as well as variable stress paths. The soilincluded in the study is of major interest in the offshore industry sincemany oil platform foundations and subsea structures may be found onbiogenic sand. It is important to notice that most works in the literaturehave focused on the dynamic behavior of quartz sands and theproperties of biogenic sands are highly unexplored [18–22], eventhough this type of soil is of major interest in geotechnical infrastruc-ture in many regions.
2. Materials, apparatus and methods
2.1. Biogenic sand used
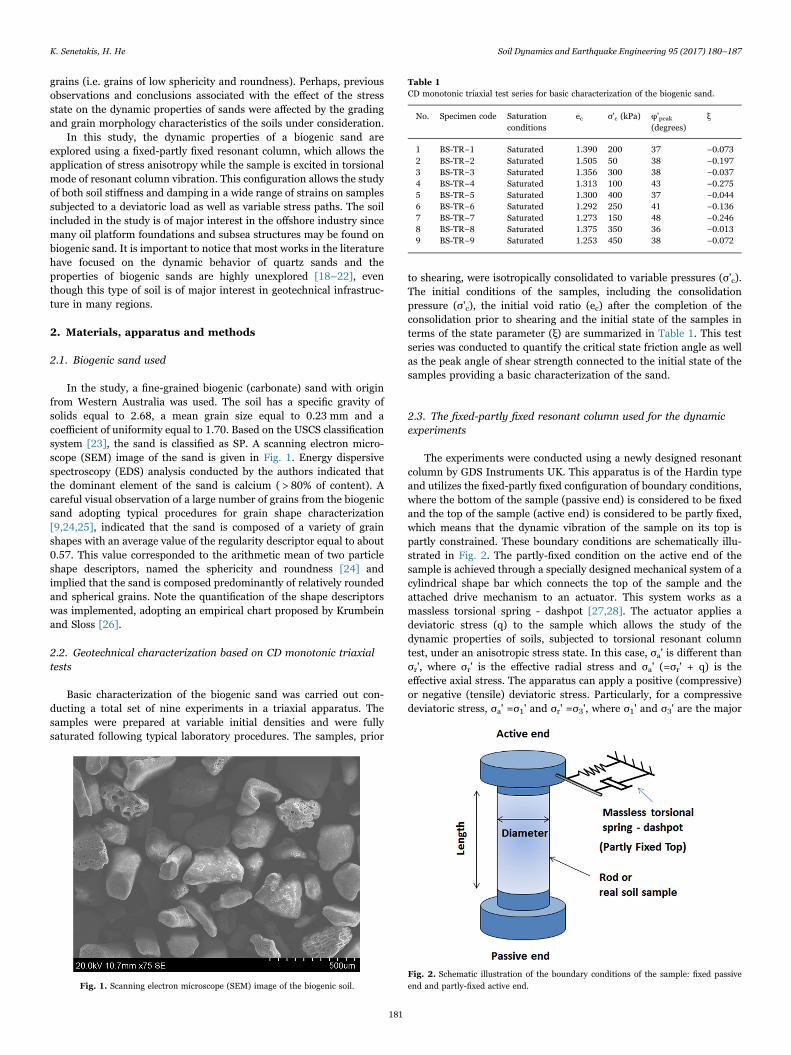
In the study, a fine-grained biogenic (carbonate) sand with originfrom Western Australia was used. The soil has a specific gravity ofsolids equal to 2.68, a mean grain size equal to 0.23 mm and acoefficient of uniformity equal to 1.70. Based on the USCS classificationsystem [23], the sand is classified as SP. A scanning electron micro-scope (SEM) image of the sand is given in Fig. 1. Energy dispersivespectroscopy (EDS) analysis conducted by the authors indicated thatthe dominant element of the sand is calcium ( > 80% of content). Acareful visual observation of a large number of grains from the biogenicsand adopting typical procedures for grain shape characterization[9,24,25], indicated that the sand is composed of a variety of grainshapes with an average value of the regularity descriptor equal to about0.57. This value corresponded to the arithmetic mean of two particleshape descriptors, named the sphericity and roundness [24] andimplied that the sand is composed predominantly of relatively roundedand spherical grains. Note the quantification of the shape descriptorswas implemented, adopting an empirical chart proposed by Krumbeinand Sloss [26].
2.2. Geotechnical characterization based on CD monotonic triaxialtests
Basic characterization of the biogenic sand was carried out con-ducting a total set of nine experiments in a triaxial apparatus. Thesamples were prepared at variable initial densities and were fullysaturated following typical laboratory procedures. The samples, prior
to shearing, were isotropically consolidated to variable pressures (σ'c).The initial conditions of the samples, including the consolidationpressure (σ'c), the initial void ratio (ec) after the completion of theconsolidation prior to shearing and the initial state of the samples interms of the state parameter (ξ) are summarized in Table 1. This testseries was conducted to quantify the critical state friction angle as wellas the peak angle of shear strength connected to the initial state of thesamples providing a basic characterization of the sand.
2.3. The fixed-partly fixed resonant column used for the dynamicexperiments
The experiments were conducted using a newly designed resonantcolumn by GDS Instruments UK. This apparatus is of the Hardin typeand utilizes the fixed-partly fixed configuration of boundary conditions,where the bottom of the sample (passive end) is considered to be fixedand the top of the sample (active end) is considered to be partly fixed,which means that the dynamic vibration of the sample on its top ispartly constrained. These boundary conditions are schematically illu-strated in Fig. 2. The partly-fixed condition on the active end of thesample is achieved through a specially designed mechanical system of acylindrical shape bar which connects the top of the sample and theattached drive mechanism to an actuator. This system works as amassless torsional spring - dashpot [27,28]. The actuator applies adeviatoric stress (q) to the sample which allows the study of thedynamic properties of soils, subjected to torsional resonant columntest, under an anisotropic stress state. In this case, σa' is different thanσr', where σr' is the effective radial stress and σa' (=σr' + q) is theeffective axial stress. The apparatus can apply a positive (compressive)or negative (tensile) deviatoric stress. Particularly, for a compressivedeviatoric stress, σa' =σ1' and σr' =σ3', where σ1' and σ3' are the major
Fig. 1. Scanning electron microscope (SEM) image of the biogenic soil.
Table 1CD monotonic triaxial test series for basic characterization of the biogenic sand.
No. Specimen code Saturationconditions
ec σ'c (kPa) φ'peak(degrees)
ξ
1 BS-TR−1 Saturated 1.390 200 37 −0.0732 BS-TR−2 Saturated 1.505 50 38 −0.1973 BS-TR−3 Saturated 1.356 300 38 −0.0374 BS-TR−4 Saturated 1.313 100 43 −0.2755 BS-TR−5 Saturated 1.300 400 37 −0.0446 BS-TR−6 Saturated 1.292 250 41 −0.1367 BS-TR−7 Saturated 1.273 150 48 −0.2468 BS-TR−8 Saturated 1.375 350 36 −0.0139 BS-TR−9 Saturated 1.253 450 38 −0.072
Fig. 2. Schematic illustration of the boundary conditions of the sample: fixed passiveend and partly-fixed active end.
K. Senetakis, H. He Soil Dynamics and Earthquake Engineering 95 (2017) 180–187
181
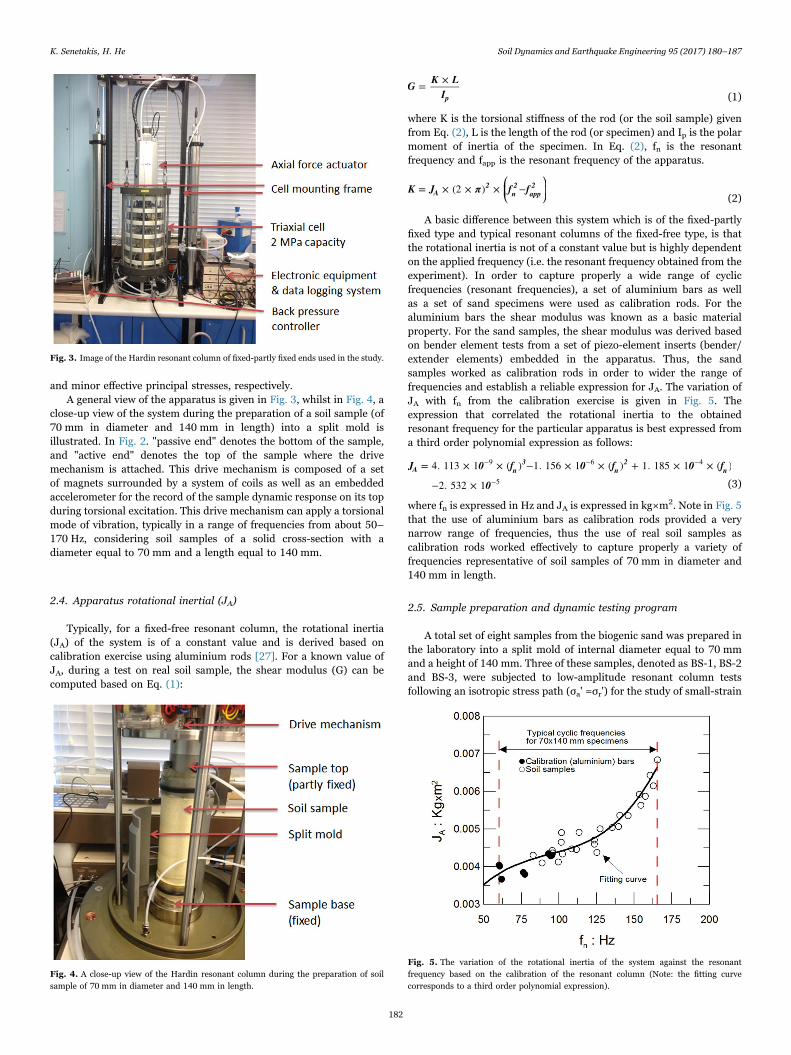
and minor effective principal stresses, respectively.A general view of the apparatus is given in Fig. 3, whilst in Fig. 4, a
close-up view of the system during the preparation of a soil sample (of70 mm in diameter and 140 mm in length) into a split mold isillustrated. In Fig. 2. "passive end" denotes the bottom of the sample,and "active end" denotes the top of the sample where the drivemechanism is attached. This drive mechanism is composed of a setof magnets surrounded by a system of coils as well as an embeddedaccelerometer for the record of the sample dynamic response on its topduring torsional excitation. This drive mechanism can apply a torsionalmode of vibration, typically in a range of frequencies from about 50–170 Hz, considering soil samples of a solid cross-section with adiameter equal to 70 mm and a length equal to 140 mm.
2.4. Apparatus rotational inertial (JA)
Typically, for a fixed-free resonant column, the rotational inertia(JA) of the system is of a constant value and is derived based oncalibration exercise using aluminium rods [27]. For a known value ofJA, during a test on real soil sample, the shear modulus (G) can becomputed based on Eq. (1):
G K LI
= ×p (1)
where K is the torsional stiffness of the rod (or the soil sample) givenfrom Eq. (2), L is the length of the rod (or specimen) and Ip is the polarmoment of inertia of the specimen. In Eq. (2), fn is the resonantfrequency and fapp is the resonant frequency of the apparatus.
⎛⎝⎜
⎞⎠⎟K J π f f= × (2 × ) × −A
2n2
app2
(2)
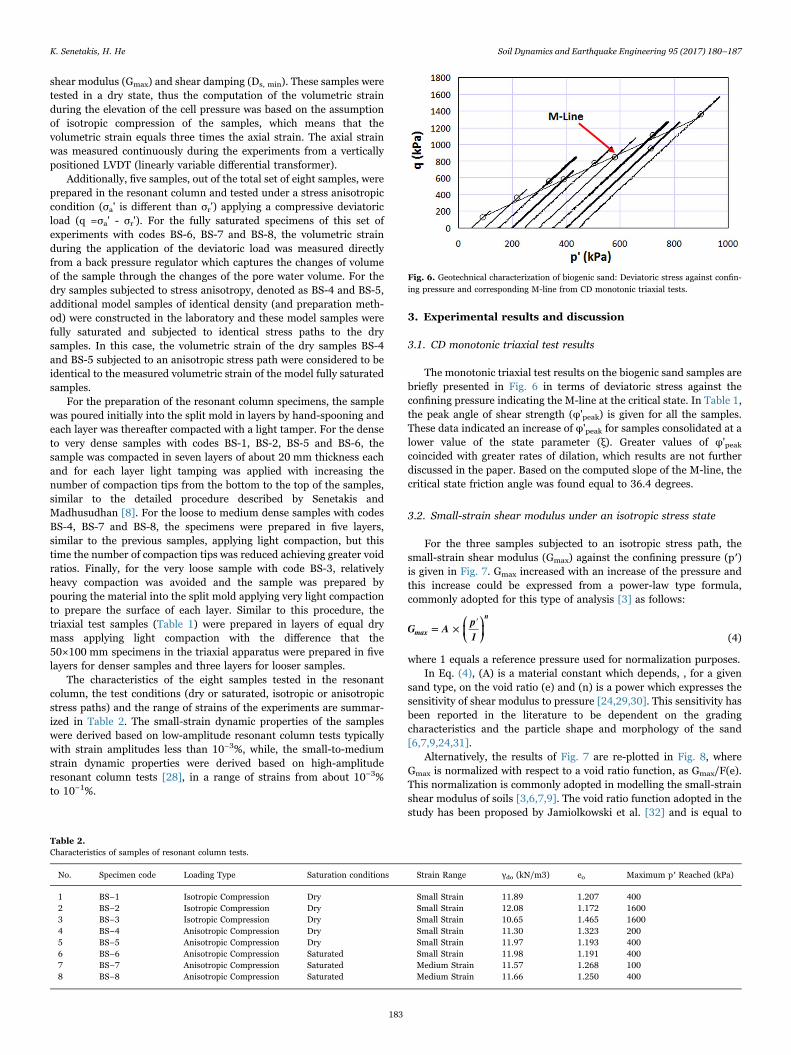
A basic difference between this system which is of the fixed-partlyfixed type and typical resonant columns of the fixed-free type, is thatthe rotational inertia is not of a constant value but is highly dependenton the applied frequency (i.e. the resonant frequency obtained from theexperiment). In order to capture properly a wide range of cyclicfrequencies (resonant frequencies), a set of aluminium bars as wellas a set of sand specimens were used as calibration rods. For thealuminium bars the shear modulus was known as a basic materialproperty. For the sand samples, the shear modulus was derived basedon bender element tests from a set of piezo-element inserts (bender/extender elements) embedded in the apparatus. Thus, the sandsamples worked as calibration rods in order to wider the range offrequencies and establish a reliable expression for JA. The variation ofJA with fn from the calibration exercise is given in Fig. 5. Theexpression that correlated the rotational inertia to the obtainedresonant frequency for the particular apparatus is best expressed froma third order polynomial expression as follows:
J 0 f 0 f 0 f
0
= 4. 113 × 1 × ( ) −1. 156 × 1 × ( ) + 1. 185 × 1 × ( )
−2. 532 × 1A n
3n
2n
−9 −6 −4
−5 (3)
where fn is expressed in Hz and JA is expressed in kg×m2. Note in Fig. 5that the use of aluminium bars as calibration rods provided a verynarrow range of frequencies, thus the use of real soil samples ascalibration rods worked effectively to capture properly a variety offrequencies representative of soil samples of 70 mm in diameter and140 mm in length.
2.5. Sample preparation and dynamic testing program
A total set of eight samples from the biogenic sand was prepared inthe laboratory into a split mold of internal diameter equal to 70 mmand a height of 140 mm. Three of these samples, denoted as BS-1, BS-2and BS-3, were subjected to low-amplitude resonant column testsfollowing an isotropic stress path (σa' =σr') for the study of small-strain
Fig. 3. Image of the Hardin resonant column of fixed-partly fixed ends used in the study.
Fig. 4. A close-up view of the Hardin resonant column during the preparation of soilsample of 70 mm in diameter and 140 mm in length.
Fig. 5. The variation of the rotational inertia of the system against the resonantfrequency based on the calibration of the resonant column (Note: the fitting curvecorresponds to a third order polynomial expression).
K. Senetakis, H. He Soil Dynamics and Earthquake Engineering 95 (2017) 180–187
182
shear modulus (Gmax) and shear damping (Ds, min). These samples weretested in a dry state, thus the computation of the volumetric strainduring the elevation of the cell pressure was based on the assumptionof isotropic compression of the samples, which means that thevolumetric strain equals three times the axial strain. The axial strainwas measured continuously during the experiments from a verticallypositioned LVDT (linearly variable differential transformer).
Additionally, five samples, out of the total set of eight samples, wereprepared in the resonant column and tested under a stress anisotropiccondition (σa' is different than σr') applying a compressive deviatoricload (q =σa' - σr'). For the fully saturated specimens of this set ofexperiments with codes BS-6, BS-7 and BS-8, the volumetric strainduring the application of the deviatoric load was measured directlyfrom a back pressure regulator which captures the changes of volumeof the sample through the changes of the pore water volume. For thedry samples subjected to stress anisotropy, denoted as BS-4 and BS-5,additional model samples of identical density (and preparation meth-od) were constructed in the laboratory and these model samples werefully saturated and subjected to identical stress paths to the drysamples. In this case, the volumetric strain of the dry samples BS-4and BS-5 subjected to an anisotropic stress path were considered to beidentical to the measured volumetric strain of the model fully saturatedsamples.
For the preparation of the resonant column specimens, the samplewas poured initially into the split mold in layers by hand-spooning andeach layer was thereafter compacted with a light tamper. For the denseto very dense samples with codes BS-1, BS-2, BS-5 and BS-6, thesample was compacted in seven layers of about 20 mm thickness eachand for each layer light tamping was applied with increasing thenumber of compaction tips from the bottom to the top of the samples,similar to the detailed procedure described by Senetakis andMadhusudhan [8]. For the loose to medium dense samples with codesBS-4, BS-7 and BS-8, the specimens were prepared in five layers,similar to the previous samples, applying light compaction, but thistime the number of compaction tips was reduced achieving greater voidratios. Finally, for the very loose sample with code BS-3, relativelyheavy compaction was avoided and the sample was prepared bypouring the material into the split mold applying very light compactionto prepare the surface of each layer. Similar to this procedure, thetriaxial test samples (Table 1) were prepared in layers of equal drymass applying light compaction with the difference that the50×100 mm specimens in the triaxial apparatus were prepared in fivelayers for denser samples and three layers for looser samples.
The characteristics of the eight samples tested in the resonantcolumn, the test conditions (dry or saturated, isotropic or anisotropicstress paths) and the range of strains of the experiments are summar-ized in Table 2. The small-strain dynamic properties of the sampleswere derived based on low-amplitude resonant column tests typicallywith strain amplitudes less than 10−3%, while, the small-to-mediumstrain dynamic properties were derived based on high-amplituderesonant column tests [28], in a range of strains from about 10−3%to 10−1%.
3. Experimental results and discussion
3.1. CD monotonic triaxial test results
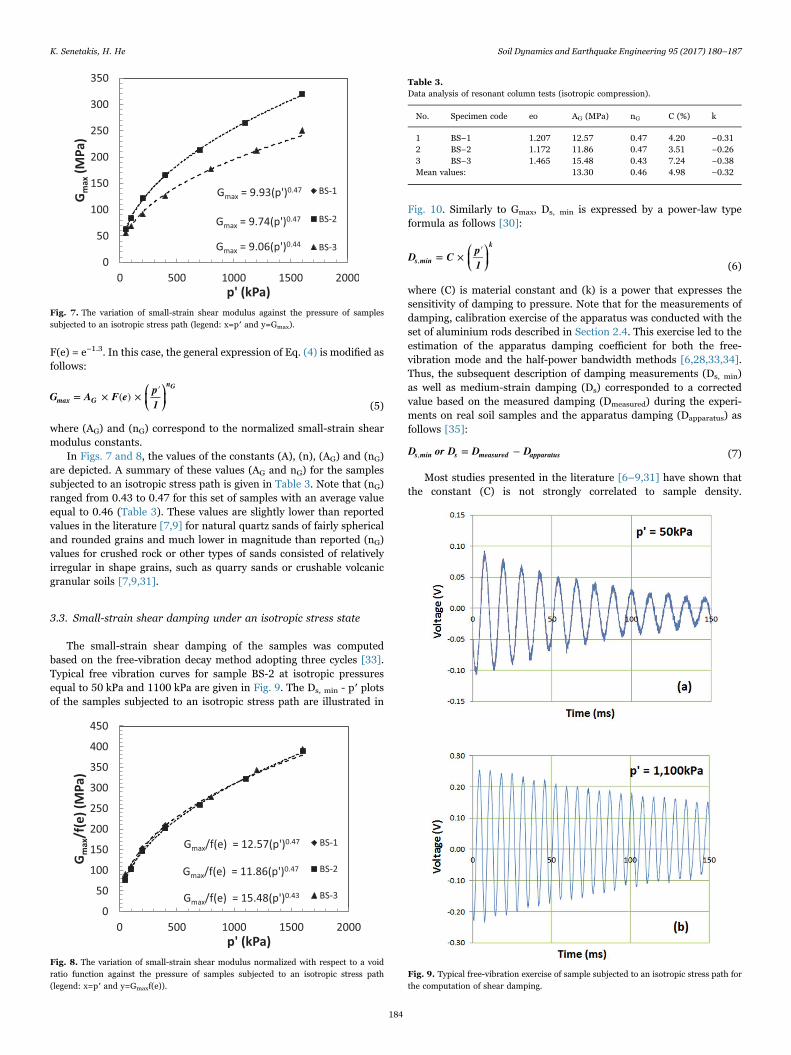
The monotonic triaxial test results on the biogenic sand samples arebriefly presented in Fig. 6 in terms of deviatoric stress against theconfining pressure indicating the M-line at the critical state. In Table 1,the peak angle of shear strength (φ'peak) is given for all the samples.These data indicated an increase of φ'peak for samples consolidated at alower value of the state parameter (ξ). Greater values of φ'peakcoincided with greater rates of dilation, which results are not furtherdiscussed in the paper. Based on the computed slope of the M-line, thecritical state friction angle was found equal to 36.4 degrees.
3.2. Small-strain shear modulus under an isotropic stress state
For the three samples subjected to an isotropic stress path, thesmall-strain shear modulus (Gmax) against the confining pressure (p′)is given in Fig. 7. Gmax increased with an increase of the pressure andthis increase could be expressed from a power-law type formula,commonly adopted for this type of analysis [3] as follows:
⎛⎝⎜
⎞⎠⎟G A p
1= × ′
max
n
(4)
where 1 equals a reference pressure used for normalization purposes.In Eq. (4), (A) is a material constant which depends, , for a given
sand type, on the void ratio (e) and (n) is a power which expresses thesensitivity of shear modulus to pressure [24,29,30]. This sensitivity hasbeen reported in the literature to be dependent on the gradingcharacteristics and the particle shape and morphology of the sand[6,7,9,24,31].
Alternatively, the results of Fig. 7 are re-plotted in Fig. 8, whereGmax is normalized with respect to a void ratio function, as Gmax/F(e).This normalization is commonly adopted in modelling the small-strainshear modulus of soils [3,6,7,9]. The void ratio function adopted in thestudy has been proposed by Jamiolkowski et al. [32] and is equal to
Table 2.Characteristics of samples of resonant column tests.
No. Specimen code Loading Type Saturation conditions Strain Range γdo (kN/m3) eo Maximum p′ Reached (kPa)
1 BS−1 Isotropic Compression Dry Small Strain 11.89 1.207 4002 BS−2 Isotropic Compression Dry Small Strain 12.08 1.172 16003 BS−3 Isotropic Compression Dry Small Strain 10.65 1.465 16004 BS−4 Anisotropic Compression Dry Small Strain 11.30 1.323 2005 BS−5 Anisotropic Compression Dry Small Strain 11.97 1.193 4006 BS−6 Anisotropic Compression Saturated Small Strain 11.98 1.191 4007 BS−7 Anisotropic Compression Saturated Medium Strain 11.57 1.268 1008 BS−8 Anisotropic Compression Saturated Medium Strain 11.66 1.250 400
Fig. 6. Geotechnical characterization of biogenic sand: Deviatoric stress against confin-ing pressure and corresponding M-line from CD monotonic triaxial tests.
K. Senetakis, H. He Soil Dynamics and Earthquake Engineering 95 (2017) 180–187
183
F(e) = e−1.3. In this case, the general expression of Eq. (4) is modified asfollows:
⎛⎝⎜
⎞⎠⎟G A F e p
1= × ( ) × ′
max G
nG
(5)
where (AG) and (nG) correspond to the normalized small-strain shearmodulus constants.
In Figs. 7 and 8, the values of the constants (A), (n), (AG) and (nG)are depicted. A summary of these values (AG and nG) for the samplessubjected to an isotropic stress path is given in Table 3. Note that (nG)ranged from 0.43 to 0.47 for this set of samples with an average valueequal to 0.46 (Table 3). These values are slightly lower than reportedvalues in the literature [7,9] for natural quartz sands of fairly sphericaland rounded grains and much lower in magnitude than reported (nG)values for crushed rock or other types of sands consisted of relativelyirregular in shape grains, such as quarry sands or crushable volcanicgranular soils [7,9,31].
3.3. Small-strain shear damping under an isotropic stress state
The small-strain shear damping of the samples was computedbased on the free-vibration decay method adopting three cycles [33].Typical free vibration curves for sample BS-2 at isotropic pressuresequal to 50 kPa and 1100 kPa are given in Fig. 9. The Ds, min - p′ plotsof the samples subjected to an isotropic stress path are illustrated in
Fig. 10. Similarly to Gmax, Ds, min is expressed by a power-law typeformula as follows [30]:
⎛⎝⎜
⎞⎠⎟D C p
1= × ′
s min
k
,(6)
where (C) is material constant and (k) is a power that expresses thesensitivity of damping to pressure. Note that for the measurements ofdamping, calibration exercise of the apparatus was conducted with theset of aluminium rods described in Section 2.4. This exercise led to theestimation of the apparatus damping coefficient for both the free-vibration mode and the half-power bandwidth methods [6,28,33,34].Thus, the subsequent description of damping measurements (Ds, min)as well as medium-strain damping (Ds) corresponded to a correctedvalue based on the measured damping (Dmeasured) during the experi-ments on real soil samples and the apparatus damping (Dapparatus) asfollows [35]:
D or D D D= −s min s measured apparatus, (7)
Most studies presented in the literature [6–9,31] have shown thatthe constant (C) is not strongly correlated to sample density.
Fig. 7. The variation of small-strain shear modulus against the pressure of samplessubjected to an isotropic stress path (legend: x=p′ and y=Gmax).
Fig. 8. The variation of small-strain shear modulus normalized with respect to a voidratio function against the pressure of samples subjected to an isotropic stress path(legend: x=p′ and y=Gmaxf(e)).
Table 3.Data analysis of resonant column tests (isotropic compression).
No. Specimen code eo AG (MPa) nG C (%) k
1 BS−1 1.207 12.57 0.47 4.20 −0.312 BS−2 1.172 11.86 0.47 3.51 −0.263 BS−3 1.465 15.48 0.43 7.24 −0.38Mean values: 13.30 0.46 4.98 −0.32
Fig. 9. Typical free-vibration exercise of sample subjected to an isotropic stress path forthe computation of shear damping.
K. Senetakis, H. He Soil Dynamics and Earthquake Engineering 95 (2017) 180–187
184
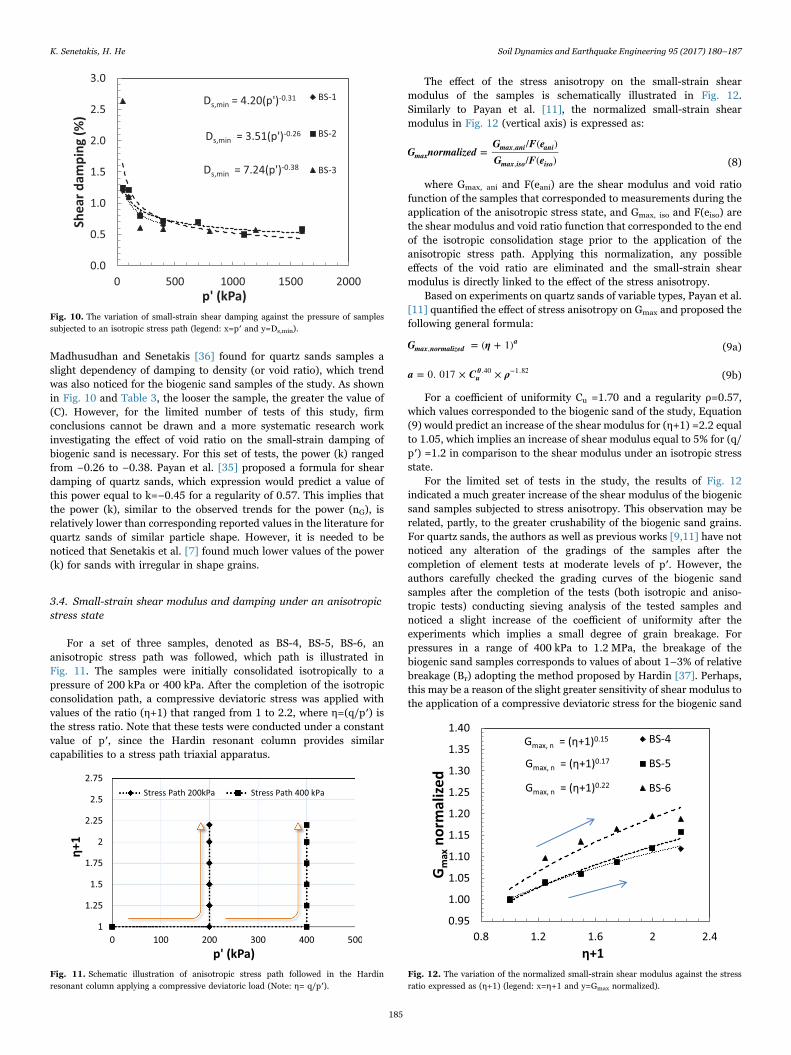
Madhusudhan and Senetakis [36] found for quartz sands samples aslight dependency of damping to density (or void ratio), which trendwas also noticed for the biogenic sand samples of the study. As shownin Fig. 10 and Table 3, the looser the sample, the greater the value of(C). However, for the limited number of tests of this study, firmconclusions cannot be drawn and a more systematic research workinvestigating the effect of void ratio on the small-strain damping ofbiogenic sand is necessary. For this set of tests, the power (k) rangedfrom −0.26 to −0.38. Payan et al. [35] proposed a formula for sheardamping of quartz sands, which expression would predict a value ofthis power equal to k=−0.45 for a regularity of 0.57. This implies thatthe power (k), similar to the observed trends for the power (nG), isrelatively lower than corresponding reported values in the literature forquartz sands of similar particle shape. However, it is needed to benoticed that Senetakis et al. [7] found much lower values of the power(k) for sands with irregular in shape grains.
3.4. Small-strain shear modulus and damping under an anisotropicstress state
For a set of three samples, denoted as BS-4, BS-5, BS-6, ananisotropic stress path was followed, which path is illustrated inFig. 11. The samples were initially consolidated isotropically to apressure of 200 kPa or 400 kPa. After the completion of the isotropicconsolidation path, a compressive deviatoric stress was applied withvalues of the ratio (η+1) that ranged from 1 to 2.2, where η=(q/p′) isthe stress ratio. Note that these tests were conducted under a constantvalue of p′, since the Hardin resonant column provides similarcapabilities to a stress path triaxial apparatus.
The effect of the stress anisotropy on the small-strain shearmodulus of the samples is schematically illustrated in Fig. 12.Similarly to Payan et al. [11], the normalized small-strain shearmodulus in Fig. 12 (vertical axis) is expressed as:
G normalizedG F eG F e
=/ ( )/ ( )max
max ani ani
max iso iso
,
, (8)
where Gmax, ani and F(eani) are the shear modulus and void ratiofunction of the samples that corresponded to measurements during theapplication of the anisotropic stress state, and Gmax, iso and F(eiso) arethe shear modulus and void ratio function that corresponded to the endof the isotropic consolidation stage prior to the application of theanisotropic stress path. Applying this normalization, any possibleeffects of the void ratio are eliminated and the small-strain shearmodulus is directly linked to the effect of the stress anisotropy.
Based on experiments on quartz sands of variable types, Payan et al.[11] quantified the effect of stress anisotropy on Gmax and proposed thefollowing general formula:
G η= ( + 1)max normalizeda
, (9a)
a C ρ= 0. 017 × ×u0.40 −1.82 (9b)
For a coefficient of uniformity Cu =1.70 and a regularity ρ=0.57,which values corresponded to the biogenic sand of the study, Equation(9) would predict an increase of the shear modulus for (η+1) =2.2 equalto 1.05, which implies an increase of shear modulus equal to 5% for (q/p′) =1.2 in comparison to the shear modulus under an isotropic stressstate.
For the limited set of tests in the study, the results of Fig. 12indicated a much greater increase of the shear modulus of the biogenicsand samples subjected to stress anisotropy. This observation may berelated, partly, to the greater crushability of the biogenic sand grains.For quartz sands, the authors as well as previous works [9,11] have notnoticed any alteration of the gradings of the samples after thecompletion of element tests at moderate levels of p′. However, theauthors carefully checked the grading curves of the biogenic sandsamples after the completion of the tests (both isotropic and aniso-tropic tests) conducting sieving analysis of the tested samples andnoticed a slight increase of the coefficient of uniformity after theexperiments which implies a small degree of grain breakage. Forpressures in a range of 400 kPa to 1.2 MPa, the breakage of thebiogenic sand samples corresponds to values of about 1–3% of relativebreakage (Br) adopting the method proposed by Hardin [37]. Perhaps,this may be a reason of the slight greater sensitivity of shear modulus tothe application of a compressive deviatoric stress for the biogenic sand
Fig. 11. Schematic illustration of anisotropic stress path followed in the Hardinresonant column applying a compressive deviatoric load (Note: η= q/p′).
Fig. 12. The variation of the normalized small-strain shear modulus against the stressratio expressed as (η+1) (legend: x=η+1 and y=Gmax normalized).
Fig. 10. The variation of small-strain shear damping against the pressure of samplessubjected to an isotropic stress path (legend: x=p′ and y=Ds,min).
K. Senetakis, H. He Soil Dynamics and Earthquake Engineering 95 (2017) 180–187
185
in comparison to previous studies on quartz granular soils, even thoughit is believed that the mechanisms behind these trends are not wellunderstood and further research is necessary in this direction.
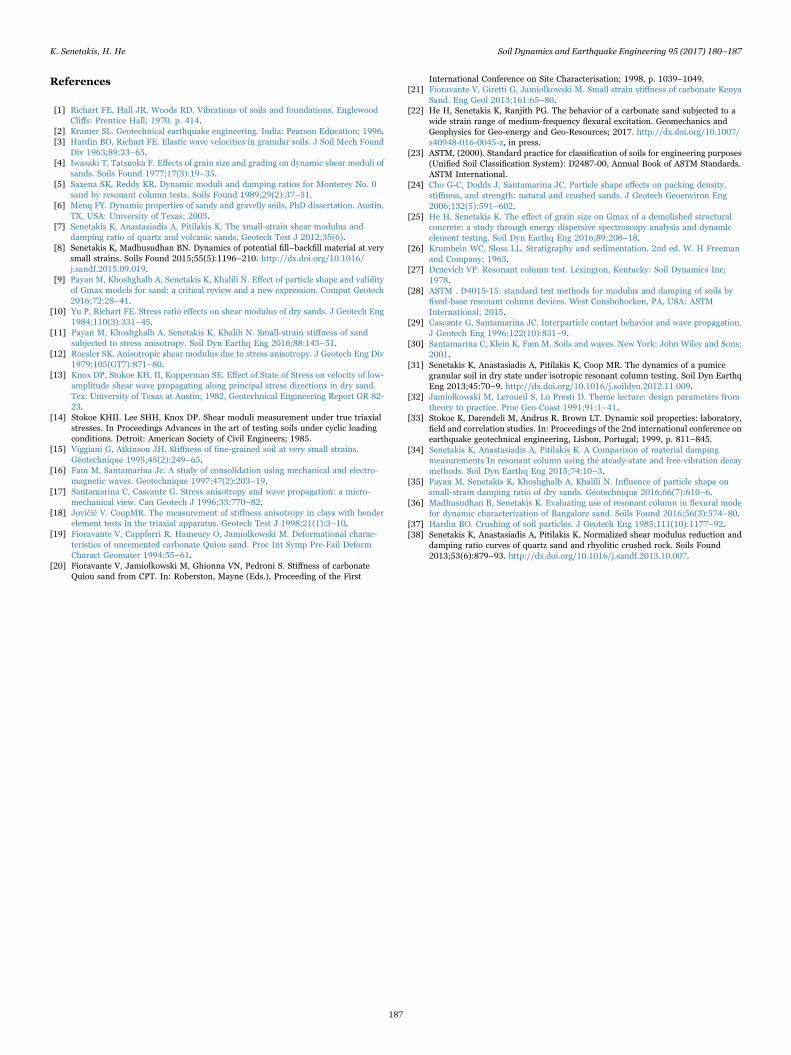
In Fig. 13, the small-strain shear damping (Ds, min) against the ratio(η+1) is plotted for three biogenic sand samples. It is interesting tonotice that particularly for samples BS-4 and BS-6 there was observed amarked reduction of Ds, min of the order 65–85% from the isotropicstage to a stress ratio (η+1) =2.2. This reduction in damping was lesspronounced for sample BS-5. These results imply that expressions forsmall-strain damping of sands based on isotropic resonant columntests may not be applicable for sands subjected to a stress anisotropy,particularly for crushable sands. However, due to the limited set ofexperiments in the study investigating the effect of stress anisotropy onstiffness and damping, it is believed that further systematic research isnecessary on the topic.
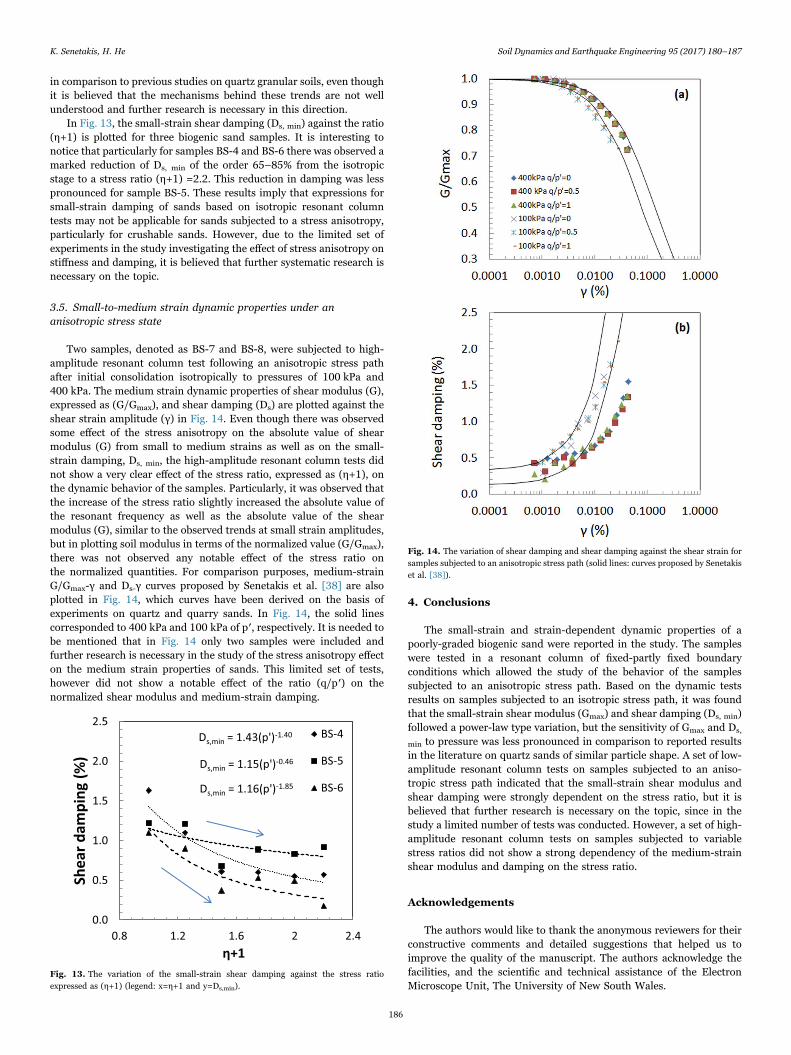
3.5. Small-to-medium strain dynamic properties under ananisotropic stress state
Two samples, denoted as BS-7 and BS-8, were subjected to high-amplitude resonant column test following an anisotropic stress pathafter initial consolidation isotropically to pressures of 100 kPa and400 kPa. The medium strain dynamic properties of shear modulus (G),expressed as (G/Gmax), and shear damping (Ds) are plotted against theshear strain amplitude (γ) in Fig. 14. Even though there was observedsome effect of the stress anisotropy on the absolute value of shearmodulus (G) from small to medium strains as well as on the small-strain damping, Ds, min, the high-amplitude resonant column tests didnot show a very clear effect of the stress ratio, expressed as (η+1), onthe dynamic behavior of the samples. Particularly, it was observed thatthe increase of the stress ratio slightly increased the absolute value ofthe resonant frequency as well as the absolute value of the shearmodulus (G), similar to the observed trends at small strain amplitudes,but in plotting soil modulus in terms of the normalized value (G/Gmax),there was not observed any notable effect of the stress ratio onthe normalized quantities. For comparison purposes, medium-strainG/Gmax-γ and Ds-γ curves proposed by Senetakis et al. [38] are alsoplotted in Fig. 14, which curves have been derived on the basis ofexperiments on quartz and quarry sands. In Fig. 14, the solid linescorresponded to 400 kPa and 100 kPa of p′, respectively. It is needed tobe mentioned that in Fig. 14 only two samples were included andfurther research is necessary in the study of the stress anisotropy effecton the medium strain properties of sands. This limited set of tests,however did not show a notable effect of the ratio (q/p′) on thenormalized shear modulus and medium-strain damping.
4. Conclusions
The small-strain and strain-dependent dynamic properties of apoorly-graded biogenic sand were reported in the study. The sampleswere tested in a resonant column of fixed-partly fixed boundaryconditions which allowed the study of the behavior of the samplessubjected to an anisotropic stress path. Based on the dynamic testsresults on samples subjected to an isotropic stress path, it was foundthat the small-strain shear modulus (Gmax) and shear damping (Ds, min)followed a power-law type variation, but the sensitivity of Gmax and Ds,
min to pressure was less pronounced in comparison to reported resultsin the literature on quartz sands of similar particle shape. A set of low-amplitude resonant column tests on samples subjected to an aniso-tropic stress path indicated that the small-strain shear modulus andshear damping were strongly dependent on the stress ratio, but it isbelieved that further research is necessary on the topic, since in thestudy a limited number of tests was conducted. However, a set of high-amplitude resonant column tests on samples subjected to variablestress ratios did not show a strong dependency of the medium-strainshear modulus and damping on the stress ratio.
Acknowledgements
The authors would like to thank the anonymous reviewers for theirconstructive comments and detailed suggestions that helped us toimprove the quality of the manuscript. The authors acknowledge thefacilities, and the scientific and technical assistance of the ElectronMicroscope Unit, The University of New South Wales.
Fig. 13. The variation of the small-strain shear damping against the stress ratioexpressed as (η+1) (legend: x=η+1 and y=Ds,min).
Fig. 14. The variation of shear damping and shear damping against the shear strain forsamples subjected to an anisotropic stress path (solid lines: curves proposed by Senetakiset al. [38]).
K. Senetakis, H. He Soil Dynamics and Earthquake Engineering 95 (2017) 180–187
186
References
[1] Richart FE, Hall JR, Woods RD. Vibrations of soils and foundations. EnglewoodCliffs: Prentice Hall; 1970. p. 414.
[2] Kramer SL. Geotechnical earthquake engineering. India: Pearson Education; 1996.[3] Hardin BO, Richart FE. Elastic wave velocities in granular soils. J Soil Mech Found
Div 1963;89:33–65.[4] Iwasaki T, Tatsuoka F. Effects of grain size and grading on dynamic shear moduli of
sands. Soils Found 1977;17(3):19–35.[5] Saxena SK, Reddy KR. Dynamic moduli and damping ratios for Monterey No. 0
sand by resonant column tests. Soils Found 1989;29(2):37–51.[6] Menq FY. Dynamic properties of sandy and gravelly soils, PhD dissertation. Austin,
TX, USA: University of Texas; 2003.[7] Senetakis K, Anastasiadis A, Pitilakis K. The small-strain shear modulus and
damping ratio of quartz and volcanic sands. Geotech Test J 2012;35(6).[8] Senetakis K, Madhusudhan BN. Dynamics of potential fill–backfill material at very
small strains. Soils Found 2015;55(5):1196–210. http://dx.doi.org/10.1016/j.sandf.2015.09.019.
[9] Payan M, Khoshghalb A, Senetakis K, Khalili N. Effect of particle shape and validityof Gmax models for sand: a critical review and a new expression. Comput Geotech2016;72:28–41.
[10] Yu P, Richart FE. Stress ratio effects on shear modulus of dry sands. J Geotech Eng1984;110(3):331–45.
[11] Payan M, Khoshghalb A, Senetakis K, Khalili N. Small-strain stiffness of sandsubjected to stress anisotropy. Soil Dyn Earthq Eng 2016;88:143–51.
[12] Roesler SK. Anisotropic shear modulus due to stress anisotropy. J Geotech Eng Div1979;105(GT7):871–80.
[13] Knox DP, Stokoe KH, II, Kopperman SE. Effect of State of Stress on velocity of low-amplitude shear wave propagating along principal stress directions in dry sand.Tex: University of Texas at Austin; 1982, Geotechnical Engineering Report GR 82-23.
[14] Stokoe KHII. Lee SHH, Knox DP. Shear moduli measurement under true triaxialstresses. In Proceedings Advances in the art of testing soils under cyclic loadingconditions. Detroit: American Society of Civil Engineers; 1985.
[15] Viggiani G, Atkinson JH. Stiffness of fine-grained soil at very small strains.Géotechnique 1995;45(2):249–65.
[16] Fam M, Santamarina Jc. A study of consolidation using mechanical and electro-magnetic waves. Geotechnique 1997;47(2):203–19.
[17] Santamarina C, Cascante G. Stress anisotropy and wave propagation: a micro-mechanical view. Can Geotech J 1996;33:770–82.
[18] Jovičić V. CoopMR. The measurement of stiffness anisotropy in clays with benderelement tests in the triaxial apparatus. Geotech Test J 1998;21(1):3–10.
[19] Fioravante V, Cappferri R, Hameury O, Jamiolkowski M. Deformational charac-teristics of uncemented carbonate Quiou sand. Proc Int Symp Pre-Fail DeformCharact Geomater 1994:55–61.
[20] Fioravante V, Jamiolkowski M, Ghionna VN, Pedroni S. Stiffness of carbonateQuiou sand from CPT. In: Roberston, Mayne (Eds.), Proceeding of the First
International Conference on Site Characterisation; 1998, p. 1039–1049.[21] Fioravante V, Giretti G, Jamiolkowski M. Small strain stiffness of carbonate Kenya
Sand. Eng Geol 2013;161:65–80.[22] He H, Senetakis K, Ranjith PG. The behavior of a carbonate sand subjected to a
wide strain range of medium-frequency flexural excitation. Geomechanics andGeophysics for Geo-energy and Geo-Resources; 2017. http://dx.doi.org/10.1007/s40948-016-0045-z, in press.
[23] ASTM, (2000). Standard practice for classification of soils for engineering purposes(Unified Soil Classification System): D2487-00, Annual Book of ASTM Standards.ASTM International.
[24] Cho G-C, Dodds J, Santamarina JC. Particle shape effects on packing density,stiffness, and strength: natural and crushed sands. J Geotech Geoenviron Eng2006;132(5):591–602.
[25] He H, Senetakis K. The effect of grain size on Gmax of a demolished structuralconcrete: a study through energy dispersive spectroscopy analysis and dynamicelement testing. Soil Dyn Earthq Eng 2016;89:208–18.
[26] Krumbein WC, Sloss LL. Stratigraphy and sedimentation, 2nd ed. W. H Freemanand Company; 1963.
[27] Drnevich VP. Resonant column test. Lexington, Kentucky: Soil Dynamics Inc;1978.
[28] ASTM . D4015-15: standard test methods for modulus and damping of soils byfixed-base resonant column devices. West Conshohocken, PA, USA: ASTMInternational; 2015.
[29] Cascante G, Santamarina JC. Interparticle contact behavior and wave propagation.J Geotech Eng 1996;122(10):831–9.
[30] Santamarina C, Klein K, Fam M. Soils and waves. New York: John Wiley and Sons;2001.
[31] Senetakis K, Anastasiadis A, Pitilakis K, Coop MR. The dynamics of a pumicegranular soil in dry state under isotropic resonant column testing. Soil Dyn EarthqEng 2013;45:70–9. http://dx.doi.org/10.1016/j.soildyn.2012.11.009.
[32] Jamiolkowski M, Leroueil S, Lo Presti D. Theme lecture: design parameters fromtheory to practice. Proc Geo-Coast 1991;91:1–41.
[33] Stokoe K, Darendeli M, Andrus R. Brown LT. Dynamic soil properties: laboratory,field and correlation studies. In: Proceedings of the 2nd international conference onearthquake geotechnical engineering, Lisbon, Portugal; 1999, p. 811–845.
[34] Senetakis K, Anastasiadis A, Pitilakis K. A Comparison of material dampingmeasurements In resonant column using the steady-state and free-vibration decaymethods. Soil Dyn Earthq Eng 2015;74:10–3.
[35] Payan M, Senetakis K, Khoshghalb A, Khalili N. Influence of particle shape onsmall-strain damping ratio of dry sands. Géotechnique 2016;66(7):610–6.
[36] Madhusudhan B, Senetakis K. Evaluating use of resonant column in flexural modefor dynamic characterization of Bangalore sand. Soils Found 2016;56(3):574–80.
[37] Hardin BO. Crushing of soil particles. J Geotech Eng 1985;111(10):1177–92.[38] Senetakis K, Anastasiadis A, Pitilakis K. Normalized shear modulus reduction and
damping ratio curves of quartz sand and rhyolitic crushed rock. Soils Found2013;53(6):879–93. http://dx.doi.org/10.1016/j.sandf.2013.10.007.
K. Senetakis, H. He Soil Dynamics and Earthquake Engineering 95 (2017) 180–187
187