Soil Biology & Biochemistry - Ecossecoss.nau.edu/wp-content/uploads/2016/08/Bracho-et-al...James M....
14
Temperature sensitivity of organic matter decomposition of permafrost-region soils during laboratory incubations Rosvel Bracho a, b, * , Susan Natali c , Elaine Pegoraro a, d , Kathryn G. Crummer a, b , Christina Sch € adel a, d , Gerardo Celis a , Lauren Hale e , Liyou Wu e, f , Huaqun Yin e, f, k , James M. Tiedje g , Konstantinos T. Konstantinidis h , Yiqi Luo f , Jizhong Zhou e, f, i, j , Edward A.G. Schuur a, d a Department of Biology, University of Florida, Gainesville, FL 32611, USA b School of Forest Resources and Conservation, University of Florida, Gainesville, FL 32611, USA c Woods Hole Research Center, Falmouth, MA, USA d Center for Ecosystem Science and Society, Northern Arizona University, Flagstaff, AZ, USA e Institute for Environmental Genomics, University of Oklahoma, Norman, OK, USA f Department of Botany and Microbiology, University of Oklahoma, Norman, OK, USA g Center for Microbial Ecology, Michigan State University, East Lansing, MI, USA h School of Civil and Environmental Engineering and School of Biology, Georgia Institute of Technology, Atlanta, GA, USA i State Key Joint Laboratory of Environment Simulation and Pollution Control, School of Environment, Tsinghua University, Beijing 100084, China j Earth Science Division, Lawrence Berkeley National Laboratory, Berkeley, CA 94270, USA k School of Minerals Processing and Bioengineering, Central South University, Changsha, Hunan, China article info Article history: Received 23 September 2015 Received in revised form 16 February 2016 Accepted 18 February 2016 Available online 2 March 2016 Keywords: Temperature sensitivity (Q 10 ) Tundra Organic matter decomposition Carbon pools GeoChip abstract Permafrost soils contain more than 1300 Pg of carbon (C), twice the amount of C in the atmosphere. Temperatures in higher latitudes are increasing, inducing permafrost thaw and subsequent microbial decomposition of previously frozen C, which will most likely feed back to climate warming through release of the greenhouse gases CO 2 and CH 4 . Understanding the temperature sensitivity (Q 10 ) and dy- namics of soil organic matter (SOM) decomposition under warming is essential to predict the future state of the climate system. Alaskan tundra soils from the discontinuous permafrost zone were exposed to in situ experimental warming for two consecutive winters, increasing soil temperature by 2.3 C down to 40 cm in the soil profile. Soils obtained at three depths (0e15, 15e25 and 45e55 cm) from the exper- imental warming site were incubated under aerobic conditions at 15 C and 25 C over 365 days in the laboratory. Carbon fluxes were measured periodically and dynamics of SOM decomposition, C pool sizes, and decay rates were estimated. Q 10 was estimated using both a short-term temperature manipulation (Q 10-ST ) performed at 14, 100 and 280 days of incubation and via the equal C method (Q 10-EC , ratio of time taken for a soil to respire a given amount of C), calculated continuously. At the same time points, functional diversities of the soil microbial communities were monitored for all incubation samples using a microbial functional gene array, GeoChip 5.0. Each array contains over 80,000 probes targeting mi- crobial functional genes involved in biogeochemical cycling of major nutrients, remediation strategies, pathogenicity and other important environmental functions. Of these, over 20,000 probes target genes involved in the degradation of varying C substrates and can be used to quantify the relative gene abundances and functional gene diversities related to soil organic matter turnover. The slow decom- posing C pool (C S ), which represented close to 95% of total C in the top 25 cm soils, had a higher Q 10 than the fast decomposing C pool (C F ) and also dominated the total amount of C released by the end of the incubation. Overall, C S had temperature sensitivities of Q 10-ST ¼ 2.55 ± 0.03 and Q 10-EC ¼ 2.19 ± 0.13, while the C F had a temperature sensitivity of Q 10-EC ¼ 1.16 ± 0.30. In contrast to the 15 C incubations, the 25 C microbial communities showed reduced diversities of C-degradation functional genes in the early stage of the incubations. However, as the incubations continued the 25 C communities more closely paralleled the 15 C communities with respect to the detection of microbial genes utilized in the degradation of labile to recalcitrant C substrates. Two winter seasons of experimental warming did not affect the dynamics and temperature sensitivity of SOM decomposition or the microbial C-degradation * Corresponding author. School of Forest Resources and Conservation, University of Florida, Gainesville, FL 32611, USA. E-mail address: rbracho@ufl.edu (R. Bracho). Contents lists available at ScienceDirect Soil Biology & Biochemistry journal homepage: www.elsevier.com/locate/soilbio http://dx.doi.org/10.1016/j.soilbio.2016.02.008 0038-0717/© 2016 Elsevier Ltd. All rights reserved. Soil Biology & Biochemistry 97 (2016) 1e14
Transcript of Soil Biology & Biochemistry - Ecossecoss.nau.edu/wp-content/uploads/2016/08/Bracho-et-al...James M....
lable at ScienceDirect
Soil Biology & Biochemistry 97 (2016) 1e14
Contents lists avai
Soil Biology & Biochemistry
journal homepage: www.elsevier .com/locate/soi lb io
Temperature sensitivity of organic matter decomposition ofpermafrost-region soils during laboratory incubations
Rosvel Bracho a, b, *, Susan Natali c, Elaine Pegoraro a, d, Kathryn G. Crummer a, b,Christina Sch€adel a, d, Gerardo Celis a, Lauren Hale e, Liyou Wu e, f, Huaqun Yin e, f, k,James M. Tiedje g, Konstantinos T. Konstantinidis h, Yiqi Luo f, Jizhong Zhou e, f, i, j,Edward A.G. Schuur a, d
a Department of Biology, University of Florida, Gainesville, FL 32611, USAb School of Forest Resources and Conservation, University of Florida, Gainesville, FL 32611, USAc Woods Hole Research Center, Falmouth, MA, USAd Center for Ecosystem Science and Society, Northern Arizona University, Flagstaff, AZ, USAe Institute for Environmental Genomics, University of Oklahoma, Norman, OK, USAf Department of Botany and Microbiology, University of Oklahoma, Norman, OK, USAg Center for Microbial Ecology, Michigan State University, East Lansing, MI, USAh School of Civil and Environmental Engineering and School of Biology, Georgia Institute of Technology, Atlanta, GA, USAi State Key Joint Laboratory of Environment Simulation and Pollution Control, School of Environment, Tsinghua University, Beijing 100084, Chinaj Earth Science Division, Lawrence Berkeley National Laboratory, Berkeley, CA 94270, USAk School of Minerals Processing and Bioengineering, Central South University, Changsha, Hunan, China
a r t i c l e i n f o
Article history:Received 23 September 2015Received in revised form16 February 2016Accepted 18 February 2016Available online 2 March 2016
Keywords:Temperature sensitivity (Q10)TundraOrganic matter decompositionCarbon poolsGeoChip
* Corresponding author. School of Forest ResourcesE-mail address: [email protected] (R. Bracho).
http://dx.doi.org/10.1016/j.soilbio.2016.02.0080038-0717/© 2016 Elsevier Ltd. All rights reserved.
a b s t r a c t
Permafrost soils contain more than 1300 Pg of carbon (C), twice the amount of C in the atmosphere.Temperatures in higher latitudes are increasing, inducing permafrost thaw and subsequent microbialdecomposition of previously frozen C, which will most likely feed back to climate warming throughrelease of the greenhouse gases CO2 and CH4. Understanding the temperature sensitivity (Q10) and dy-namics of soil organic matter (SOM) decomposition under warming is essential to predict the future stateof the climate system. Alaskan tundra soils from the discontinuous permafrost zone were exposed to insitu experimental warming for two consecutive winters, increasing soil temperature by 2.3 �C down to40 cm in the soil profile. Soils obtained at three depths (0e15, 15e25 and 45e55 cm) from the exper-imental warming site were incubated under aerobic conditions at 15 �C and 25 �C over 365 days in thelaboratory. Carbon fluxes were measured periodically and dynamics of SOM decomposition, C pool sizes,and decay rates were estimated. Q10 was estimated using both a short-term temperature manipulation(Q10-ST) performed at 14, 100 and 280 days of incubation and via the equal C method (Q10-EC, ratio of timetaken for a soil to respire a given amount of C), calculated continuously. At the same time points,functional diversities of the soil microbial communities were monitored for all incubation samples usinga microbial functional gene array, GeoChip 5.0. Each array contains over 80,000 probes targeting mi-crobial functional genes involved in biogeochemical cycling of major nutrients, remediation strategies,pathogenicity and other important environmental functions. Of these, over 20,000 probes target genesinvolved in the degradation of varying C substrates and can be used to quantify the relative geneabundances and functional gene diversities related to soil organic matter turnover. The slow decom-posing C pool (CS), which represented close to 95% of total C in the top 25 cm soils, had a higher Q10 thanthe fast decomposing C pool (CF) and also dominated the total amount of C released by the end of theincubation. Overall, CS had temperature sensitivities of Q10-ST ¼ 2.55 ± 0.03 and Q10-EC ¼ 2.19 ± 0.13,while the CF had a temperature sensitivity of Q10-EC ¼ 1.16 ± 0.30. In contrast to the 15 �C incubations, the25 �C microbial communities showed reduced diversities of C-degradation functional genes in the earlystage of the incubations. However, as the incubations continued the 25 �C communities more closelyparalleled the 15 �C communities with respect to the detection of microbial genes utilized in thedegradation of labile to recalcitrant C substrates. Two winter seasons of experimental warming did notaffect the dynamics and temperature sensitivity of SOM decomposition or the microbial C-degradation
and Conservation, University of Florida, Gainesville, FL 32611, USA.
R. Bracho et al. / Soil Biology & Biochemistry 97 (2016) 1e142
genes during incubation. However, under the projected sustained warming attributable to climatechange, we might expect increased contribution of CS to organic matter decomposition. Because of thehigher Q10 and the large pool size of CS, increased soil organic matter release under warmer temperatureswill contribute towards accelerating climate change.
© 2016 Elsevier Ltd. All rights reserved.
1. Introduction
Permafrost zone soils contain approximately 1330e1580 Pg oforganic C, which is twice the amount of atmospheric C (Schuuret al., 2008; Tarnocai et al., 2009; Hugelius et al., 2014; Schuuret al., 2015). Though they cover less than 15% of global soil area,permafrost zone soils store about one-third of total global soil C to3 m depth (Schuur et al., 2015). Temperatures in high latitude re-gions are increasing faster than in the rest of the world (Hassol,2004; Fyfe et al., 2013) and future climate projections indicate apotential increase between 7 and 8 �C by the end of the 21st cen-tury (Trenberth et al., 2007; IPCC, 2013). Sustained warming thawspermafrost (Romanovsky et al., 2010; Smith et al., 2010; Kovenet al., 2013), leading to a thicker seasonal active layer that ex-poses a large pool of previously frozen organic C to microbialdecomposition (Harden et al., 2012). The release of CO2 and CH4from this newly thawed C by increased microbial activity could addsignificant quantities of C to the atmosphere. Recent efforts tomodel permafrost C in response to warming project a shift from a Csink to a source in the arctic and sub-arctic regions by the end of the21st century, leading to a positive feedback to a warming climate(Koven et al., 2011; Schaefer et al., 2011, 2014).
Soil organic matter is composed of a continuum of C compounds.For simplicity, it is often conceptualized as fast, slow, or passivelydecomposing C pools (Trumbore, 1997; Amundson, 2001; Sch€adelet al., 2014). In permafrost zone soils, the fast C pool, with turnovertimes of a few days to weeks at laboratory temperatures (Sch€adelet al., 2014), represents less than 10% of total soil C, while the ma-jority belongs to the slow C pool, with turnover times from years todecades (Knoblauch et al., 2013; Sch€adel et al., 2014) Since slow C is alarge proportion of total soil C and has a long residence time, it willdominate the long term response of permafrost soil C decompositionto warming (Schuur et al., 2007; Sistla et al., 2013, 2014).
Soil organic matter decomposition in arctic and subarctic eco-systems undergoing permafrost thaw is controlled by a complex ofbiophysical interactions including soil temperature, soil moisture,physical and chemical protection, C quality, changes in microbialbiomass and microbial communities, and the dominant plantcommunity composition (Hirsch et al., 2002; Wickland and Neff,2008; Karhu et al., 2010; Waldrop et al., 2010; O'Donnell et al.,2011; Schmidt et al., 2011; Hugelius et al., 2012; Sistla et al., 2013,2014). Changes in the biophysical factors that control SOMdecomposition will likely be reflected most rapidly in the abun-dance and structure of the microbial communities as they adapt totheir new physical and chemical environment (Deslippe et al., 2011;Rinnan et al., 2011; Sistla et al., 2013, 2014). Functional adaptationsof microbial communities to seasonal environmental changes havebeen documented in alpine and arctic tundra soils; winter micro-bial biomass is fungus dominated, while growing season microbialbiomass is bacteria dominated (Schadt et al., 2003; Wallensteinet al., 2007; Buckeridge et al., 2013). New dominant microbialcommunities and the C substrates they decompose may havedifferent temperature sensitivities, and small changes could have asignificant effect on the C balance of permafrost soils (Davidson andJanssens, 2006; Fan et al., 2008).
Field warming experiments often show an initial burst ofrespiration after the application of the warming manipulationassociated with consumption of the fast C pool, followed by adecline in C release rates as slow C increasingly dominates respi-ration (Kirschbaum, 1995, 2004; Melillo et al., 2002; Eliasson et al.,2005; Knorr et al., 2005; Hartley et al., 2007, 2009; Streit et al.,2014). In these field warming experiments, microbes can accli-mate to warming by adjusting their metabolism to the new tem-perature regime, thus reducing their respiration rate at a giventemperature and improving their carbon use efficiency (CUE) (Luoet al., 2001; Barcenas-Moreno et al., 2009). Microbial communitiesmay also shift in composition as a new C balance is establishedperhaps reflecting the changes in the environment as well as in Cavailability. Experimental field warming in arctic and low arcticecosystems have been shown to shift microbial communities to-ward dominance of fungi over bacteria leading towards increaseduse of more recalcitrant slow decomposing C and change in theplantemicrobial associations that accompany shifts in plant com-munity composition and productivity (Deslippe and Simard, 2011;Deslippe et al., 2011, 2012; Natali et al., 2011; Natali et al., 2012;Sistla et al., 2013, 2014).
Accurate measurements of the turnover rates and temperaturesensitivity of fast and slow C decomposition are difficult in fieldconditions. Field studies measure only the apparent temperaturesensitivity because of environmental constraints and the con-founding effects of different C pools' contribution to total respira-tion (Davidson and Janssens, 2006; Kirschbaum, 2013). Laboratorysoil incubations are a valuable means for estimating the long-termpotential for C release from thawing permafrost soils becauseenvironmental constraints over SOM decomposition can be care-fully controlled (Holland et al., 2000; Reichstein et al., 2000; Duttaet al., 2006). Continuous C loss measurements from long-term in-cubation experiments provide information on potential C release,kinetics of soil organic matter decomposition, separation ofdifferent C pools comprising the SOM, their decay rates and tem-perature sensitivities, and the composition and abundance ofassociated microbial populations (Dutta et al., 2006; Karhu et al.,2010; Lavoie et al., 2011).
While many connections between microbial community com-positions and ecosystem functions have been made, it has beenrecently suggested that ecosystem processes may be more depen-dent on the abundance and diversity of related functional genesrather than the phylogenetic structures of communities (Philippotet al., 2013; Paula et al., 2014). The utilization of the GeoChipfunctional gene array provides a platform in which a variety ofimportant functional genes, including critical genes for C-turnover,can be detected even when present at low abundances. The sensi-tivity of the GeoChip arrays was reported previously over half ofprobes producing positive signal with 10 or fewer pg of DNA tem-plate (He, 2007). It is also specific as probe design accounts forminimal-to-no cross-hybridization of sequences with less than 90%similarity and was designated a quantitative tool inwhich R2 valuesaveraged 0.93 for signal intensity and DNA concentration correla-tions (Liebich et al., 2006; Wu et al., 2006; Zhou et al., 2010, 2012).These arrays allowed for comparison of samples throughout the
R. Bracho et al. / Soil Biology & Biochemistry 97 (2016) 1e14 3
incubation process with respect to microbial functional diversity,which is the variety of functional genes detected in each sample.We used all functional genes covered on the arrays to broadlycompare communities. For analyses centered on traits involved intundra C degradation we focused on 20,000 probes targetinghundreds of bacterial and fungal genes involved in the degradationof various C substrates.
The main objectives of this incubation study of permafrost zonesoils were: (1) to assess the effects of in situ experimental soilwarming on initial soil C pools, and to estimate C pool sizes andtheir relative turnover rates, (2) to characterize the relative abun-dance and structure of microbial functional genes associated withfast and slow C pool decomposition, as well as the response to fieldwarming, (3) to determine the temperature sensitivity of SOMmicrobial decomposition (Q10) for the fast and the slow C pools, andto characterize how Q10 responds to field warming. We expectedwarming-induced changes inmicrobial community functional geneabundances and diversities to accompany changes in the kinetics ofSOM decomposition. On this matter, we hypothesized that both theabundances and diversities of genes involved in the degradation offast decomposing C would decrease as these C pools were depletedover the course of the incubation study, whereas genes involved inslow decomposing C would show a relative increase. We also ex-pected that there could be differential temperature sensitivities,with a higher Q10 for the slow C pool compared to the fast C pool.
2. Materials and methods
2.1. Site description and experimental design
The Carbon in Permafrost Experimental Heating Researchproject (CiPEHR) was established in September 2008 (Natali et al.,2012, 2014) on moist acidic subarctic tundra within the EightMile Lake research watershed (63�5205900N, 149�1303200W) (Schuuret al., 2007, 2009). Vascular plant cover is dominated by thetussock-forming sedge Eriophorum vaginatum and the deciduousshrubs Betula nana and Vaccinium uliginosum, non-vascularbiomass is dominated by mosses and lichens (Natali et al., 2012).Soils are Gelisols (Soil Survey Staff, 1999) with a thick organic ho-rizon (0.45e0.65 m) on top of cryoturbated mineral soil and a Ccontent between 50 and 70 kg m�2 down to 1 m depth (Pries et al.,2012). Long-term mean annual temperature is �1.0 �C; meangrowing season (MayeSeptember) air temperature is 11.2 �C andmonthly averages range from þ15 �C in July to �16 �C in December(Schuur et al., 2009). Average annual precipitation is 378mmwith agrowing season mean of 245 mm (National Climatic data center,NOAA). The soil warming treatment was applied by increasingsnow cover behind snow fences during winter time, coupled withearly spring snow removal to keep water input and snow melttiming similar to control plots (Natali et al., 2011). As a result of thistreatment, soil warming plots reached an average of �3.9 �C in thesoil profile (5e40 cm depth) during the winter time, 2.3 �C warmerthan control plots, this warming effect continued into the growingseason when temperature at 40 cm reached 2.9 �C in warmed soilsand 1.6 �C in control soils.
2.2. Soil sampling and preparation
Soil cores were collected frozen from control (n ¼ 6) and fieldwarmed (n ¼ 6) plots in May 2010 after exposure to two consec-utive winter warming seasons (winters of 2008e2009 and2009e2010) and one full summer growing season (2009), and keptfrozen until further processing. Soil cores were separated in the labinto three depth increments for incubation: 0e15 cm, a fibric Oi-Oehorizon, with a lot of litter and coarse roots, 15e25 cm, Oe-Oa
horizon with less coarse roots and more decomposed soil, and45e55 cm, soils with a mineral-organic mix located just above thesurface permafrost because the surface soil thaws each summer toabout 55e65 cm and refreezes in the winter. Each soil layerincrement was split longitudinally into four sections: one for eachlab incubation temperature (15 �C and 25 �C), one for microbialanalysis, and one for soil physical characterization. Soil moisturecontent, bulk density, and mass-based nitrogen (N) and C content(ECS 4010, Costech Analytical, Valencia, CA) were measured foreach soil increment (Table 1).
2.3. Incubation design and soil carbon fluxes
Each incubation sample was further divided into 8 subsamplesof the same wet weight (~10 g). Each subsample was kept largelyintact and placed into a perforated foil cup over a bed of 3 mm glassbeads to allow drainage and maintain the soils at field capacity soilmoisture. Each incubation sample thus consisted of eight 30 cm3
vials inside a 1 L mason jar. Each jar was covered with a perforatedlid to allow air exchange while minimizing contamination. Controland field warmed soils were aerobically incubated at each of twolaboratory incubation temperatures (15 �C and 25 �C) for 365 days.Optimal temperature for field microbial growth is well above themean annual air temperature and can be considered as the averagehighest temperature during the year (Rousk and Baath, 2011),except for when Q10 was being assessed. Soil temperature at theresearch site can reach up to 25 �C in the surface few centimeters ofsoils exposed to direct sunlight during the growing season; labo-ratory temperatures were chosen to span the soil temperaturesfound in the soil profile while keeping them warm enough toobserve changing dynamics through time.
Jars were placed in a water bath set to the incubation temper-ature and connected to an automatic soil incubation system (ASIS).Air from each sequential jar was circulated by a pump through aninfrared gas analyzer (IRGA, Li-820 Licor, Lincoln, Nebraska) at0.9 L min�1. A mass flow controller (Mass Flowmeter GFM, AalborgInstruments & Control) maintained a constant flow, while CO2concentration and pressure inside each jar were measured by theIRGA and recorded every three seconds by a datalogger (CR1000,Campbell Scientific, Logan UT) over 8 min. Jars were flushed withCO2-free air at any point when CO2 concentration in the jar headspace reached 10,000 ppm in order to avoid suppression of mi-crobial activity due to oxygen deprivation. Carbon fluxes (Fc) werecalculated as the rate of CO2 increase in the headspace of the jarsover time after at least four cycles of eight and an half hours each,and expressed in micrograms of C per gram of initial soil C per day(mgC gCinitial
�1 d�1). Fluxes were measured every 48 h during the firsttwo weeks of incubation in order to capture the initial phase ofSOM decomposition, then twice aweek up to 45 days of incubation,biweekly up to 180 days, and at least once per month up to one yearof total incubation time. Total amount of Crespired (CR) at any mea-surement point was estimated by linear interpolation betweenmeasurement points.
Total Crespired (CR, mgC gCinitial�1 ) through time (t) up to 365 days
was fitted with a two-pool C model (Andren and Paustian, 1987)(Proc NLIN, SAS 9.3. SAS Institute Inc. North Carolina):
CRðtÞ ¼ CF�1� e�kFt
�þ CS
�1� e�kSt
�(1)
where CF and CS are the sizes of the fast and slow decomposing Cpools relative to the initial C content (mgC gCinitial
�1 ), and kF, and kSare the first order kinetic decomposition rate constants for the fastand slow decomposing C pools (day�1). This model assumes that CFand CS sum to 1000 mg C per gram of initial C and kF > 0 and >kS.
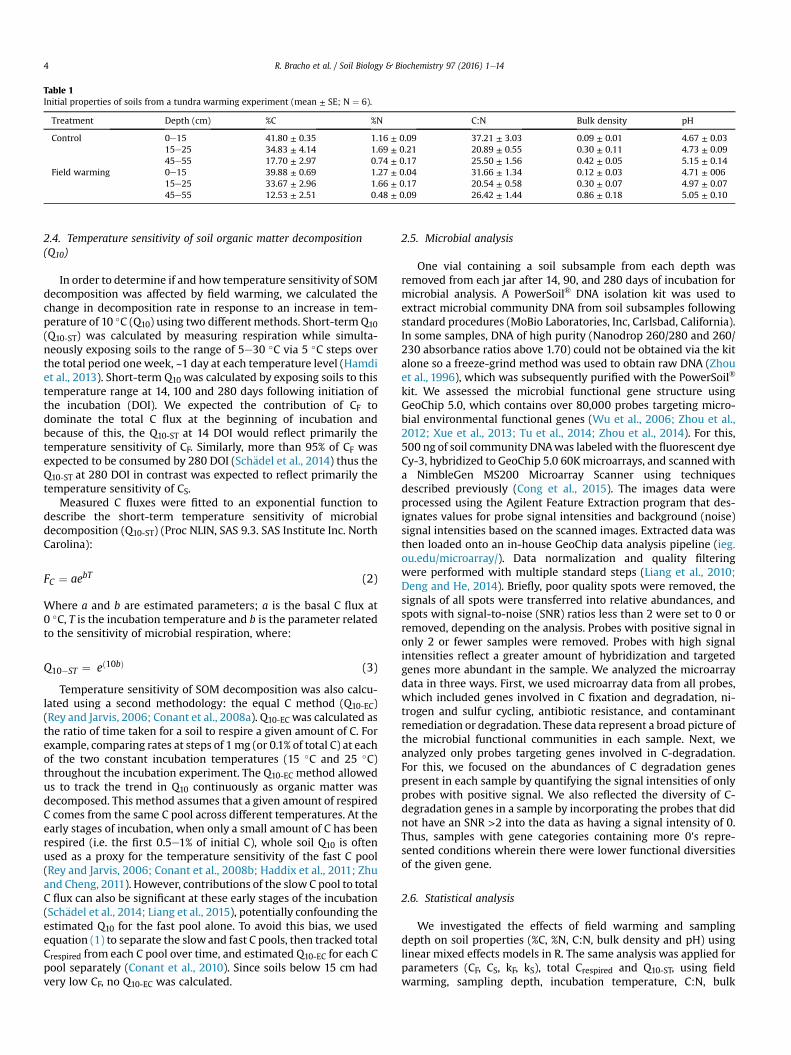
Table 1Initial properties of soils from a tundra warming experiment (mean ± SE; N ¼ 6).
Treatment Depth (cm) %C %N C:N Bulk density pH
Control 0e15 41.80 ± 0.35 1.16 ± 0.09 37.21 ± 3.03 0.09 ± 0.01 4.67 ± 0.0315e25 34.83 ± 4.14 1.69 ± 0.21 20.89 ± 0.55 0.30 ± 0.11 4.73 ± 0.0945e55 17.70 ± 2.97 0.74 ± 0.17 25.50 ± 1.56 0.42 ± 0.05 5.15 ± 0.14
Field warming 0e15 39.88 ± 0.69 1.27 ± 0.04 31.66 ± 1.34 0.12 ± 0.03 4.71 ± 00615e25 33.67 ± 2.96 1.66 ± 0.17 20.54 ± 0.58 0.30 ± 0.07 4.97 ± 0.0745e55 12.53 ± 2.51 0.48 ± 0.09 26.42 ± 1.44 0.86 ± 0.18 5.05 ± 0.10
R. Bracho et al. / Soil Biology & Biochemistry 97 (2016) 1e144
2.4. Temperature sensitivity of soil organic matter decomposition(Q10)
In order to determine if and how temperature sensitivity of SOMdecomposition was affected by field warming, we calculated thechange in decomposition rate in response to an increase in tem-perature of 10 �C (Q10) using two different methods. Short-term Q10(Q10-ST) was calculated by measuring respiration while simulta-neously exposing soils to the range of 5e30 �C via 5 �C steps overthe total period one week, ~1 day at each temperature level (Hamdiet al., 2013). Short-term Q10 was calculated by exposing soils to thistemperature range at 14, 100 and 280 days following initiation ofthe incubation (DOI). We expected the contribution of CF todominate the total C flux at the beginning of incubation andbecause of this, the Q10-ST at 14 DOI would reflect primarily thetemperature sensitivity of CF. Similarly, more than 95% of CF wasexpected to be consumed by 280 DOI (Sch€adel et al., 2014) thus theQ10-ST at 280 DOI in contrast was expected to reflect primarily thetemperature sensitivity of CS.
Measured C fluxes were fitted to an exponential function todescribe the short-term temperature sensitivity of microbialdecomposition (Q10-ST) (Proc NLIN, SAS 9.3. SAS Institute Inc. NorthCarolina):
FC ¼ aebT (2)
Where a and b are estimated parameters; a is the basal C flux at0 �C, T is the incubation temperature and b is the parameter relatedto the sensitivity of microbial respiration, where:
Q10�ST ¼ eð10bÞ (3)
Temperature sensitivity of SOM decomposition was also calcu-lated using a second methodology: the equal C method (Q10-EC)(Rey and Jarvis, 2006; Conant et al., 2008a). Q10-EC was calculated asthe ratio of time taken for a soil to respire a given amount of C. Forexample, comparing rates at steps of 1mg (or 0.1% of total C) at eachof the two constant incubation temperatures (15 �C and 25 �C)throughout the incubation experiment. The Q10-EC method allowedus to track the trend in Q10 continuously as organic matter wasdecomposed. This method assumes that a given amount of respiredC comes from the same C pool across different temperatures. At theearly stages of incubation, when only a small amount of C has beenrespired (i.e. the first 0.5e1% of initial C), whole soil Q10 is oftenused as a proxy for the temperature sensitivity of the fast C pool(Rey and Jarvis, 2006; Conant et al., 2008b; Haddix et al., 2011; Zhuand Cheng, 2011). However, contributions of the slow C pool to totalC flux can also be significant at these early stages of the incubation(Sch€adel et al., 2014; Liang et al., 2015), potentially confounding theestimated Q10 for the fast pool alone. To avoid this bias, we usedequation (1) to separate the slowand fast C pools, then tracked totalCrespired from each C pool over time, and estimated Q10-EC for each Cpool separately (Conant et al., 2010). Since soils below 15 cm hadvery low CF, no Q10-EC was calculated.
2.5. Microbial analysis
One vial containing a soil subsample from each depth wasremoved from each jar after 14, 90, and 280 days of incubation formicrobial analysis. A PowerSoil® DNA isolation kit was used toextract microbial community DNA from soil subsamples followingstandard procedures (MoBio Laboratories, Inc, Carlsbad, California).In some samples, DNA of high purity (Nanodrop 260/280 and 260/230 absorbance ratios above 1.70) could not be obtained via the kitalone so a freeze-grind method was used to obtain raw DNA (Zhouet al., 1996), which was subsequently purified with the PowerSoil®
kit. We assessed the microbial functional gene structure usingGeoChip 5.0, which contains over 80,000 probes targeting micro-bial environmental functional genes (Wu et al., 2006; Zhou et al.,2012; Xue et al., 2013; Tu et al., 2014; Zhou et al., 2014). For this,500 ng of soil community DNAwas labeledwith the fluorescent dyeCy-3, hybridized to GeoChip 5.0 60Kmicroarrays, and scannedwitha NimbleGen MS200 Microarray Scanner using techniquesdescribed previously (Cong et al., 2015). The images data wereprocessed using the Agilent Feature Extraction program that des-ignates values for probe signal intensities and background (noise)signal intensities based on the scanned images. Extracted data wasthen loaded onto an in-house GeoChip data analysis pipeline (ieg.ou.edu/microarray/). Data normalization and quality filteringwere performed with multiple standard steps (Liang et al., 2010;Deng and He, 2014). Briefly, poor quality spots were removed, thesignals of all spots were transferred into relative abundances, andspots with signal-to-noise (SNR) ratios less than 2 were set to 0 orremoved, depending on the analysis. Probes with positive signal inonly 2 or fewer samples were removed. Probes with high signalintensities reflect a greater amount of hybridization and targetedgenes more abundant in the sample. We analyzed the microarraydata in three ways. First, we used microarray data from all probes,which included genes involved in C fixation and degradation, ni-trogen and sulfur cycling, antibiotic resistance, and contaminantremediation or degradation. These data represent a broad picture ofthe microbial functional communities in each sample. Next, weanalyzed only probes targeting genes involved in C-degradation.For this, we focused on the abundances of C degradation genespresent in each sample by quantifying the signal intensities of onlyprobes with positive signal. We also reflected the diversity of C-degradation genes in a sample by incorporating the probes that didnot have an SNR >2 into the data as having a signal intensity of 0.Thus, samples with gene categories containing more 0's repre-sented conditions wherein there were lower functional diversitiesof the given gene.
2.6. Statistical analysis
We investigated the effects of field warming and samplingdepth on soil properties (%C, %N, C:N, bulk density and pH) usinglinear mixed effects models in R. The same analysis was applied forparameters (CF, CS, kF, kS), total Crespired and Q10-ST, using fieldwarming, sampling depth, incubation temperature, C:N, bulk
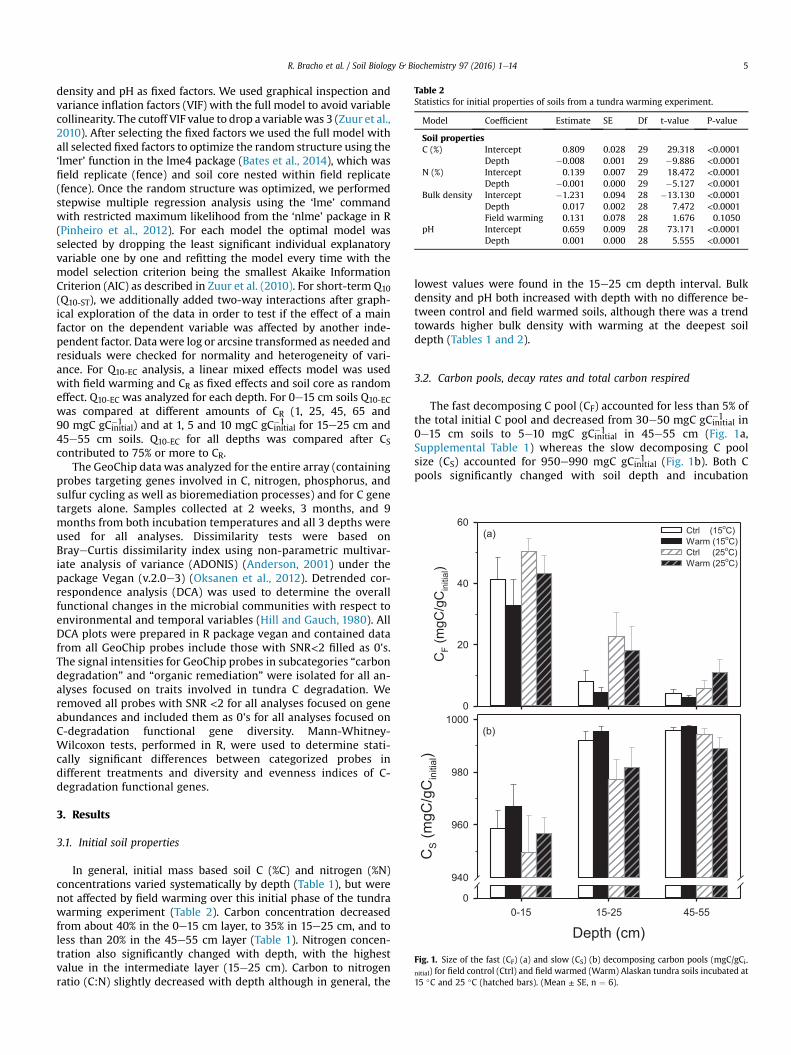
Table 2Statistics for initial properties of soils from a tundra warming experiment.
Model Coefficient Estimate SE Df t-value P-value
Soil propertiesC (%) Intercept 0.809 0.028 29 29.318 <0.0001
Depth �0.008 0.001 29 �9.886 <0.0001N (%) Intercept 0.139 0.007 29 18.472 <0.0001
Depth �0.001 0.000 29 �5.127 <0.0001Bulk density Intercept �1.231 0.094 28 �13.130 <0.0001
Depth 0.017 0.002 28 7.472 <0.0001Field warming 0.131 0.078 28 1.676 0.1050
pH Intercept 0.659 0.009 28 73.171 <0.0001Depth 0.001 0.000 28 5.555 <0.0001
(a)
CF
Cg/Cg
m(in
itial)
0
20
40
60Ctrl (15oC)Warm (15oC)Ctrl (25oC)Warm (25oC)
(b)
Depth (cm)0-15 15-25 45-55
CS
Cg/Cg
m(laitini)
0
940
960
980
1000
Fig. 1. Size of the fast (CF) (a) and slow (CS) (b) decomposing carbon pools (mgC/gCi-
nitial) for field control (Ctrl) and field warmed (Warm) Alaskan tundra soils incubated at15 �C and 25 �C (hatched bars). (Mean ± SE, n ¼ 6).
R. Bracho et al. / Soil Biology & Biochemistry 97 (2016) 1e14 5
density and pH as fixed factors. We used graphical inspection andvariance inflation factors (VIF) with the full model to avoid variablecollinearity. The cutoff VIF value to drop a variablewas 3 (Zuur et al.,2010). After selecting the fixed factors we used the full model withall selected fixed factors to optimize the random structure using the‘lmer’ function in the lme4 package (Bates et al., 2014), which wasfield replicate (fence) and soil core nested within field replicate(fence). Once the random structure was optimized, we performedstepwise multiple regression analysis using the ‘lme’ commandwith restricted maximum likelihood from the ‘nlme’ package in R(Pinheiro et al., 2012). For each model the optimal model wasselected by dropping the least significant individual explanatoryvariable one by one and refitting the model every time with themodel selection criterion being the smallest Akaike InformationCriterion (AIC) as described in Zuur et al. (2010). For short-term Q10(Q10-ST), we additionally added two-way interactions after graph-ical exploration of the data in order to test if the effect of a mainfactor on the dependent variable was affected by another inde-pendent factor. Datawere log or arcsine transformed as needed andresiduals were checked for normality and heterogeneity of vari-ance. For Q10-EC analysis, a linear mixed effects model was usedwith field warming and CR as fixed effects and soil core as randomeffect. Q10-EC was analyzed for each depth. For 0e15 cm soils Q10-EC
was compared at different amounts of CR (1, 25, 45, 65 and90 mgC gCinitial�1 ) and at 1, 5 and 10 mgC gCinitial
�1 for 15e25 cm and45e55 cm soils. Q10-EC for all depths was compared after CScontributed to 75% or more to CR.
The GeoChip data was analyzed for the entire array (containingprobes targeting genes involved in C, nitrogen, phosphorus, andsulfur cycling as well as bioremediation processes) and for C genetargets alone. Samples collected at 2 weeks, 3 months, and 9months from both incubation temperatures and all 3 depths wereused for all analyses. Dissimilarity tests were based onBrayeCurtis dissimilarity index using non-parametric multivar-iate analysis of variance (ADONIS) (Anderson, 2001) under thepackage Vegan (v.2.0e3) (Oksanen et al., 2012). Detrended cor-respondence analysis (DCA) was used to determine the overallfunctional changes in the microbial communities with respect toenvironmental and temporal variables (Hill and Gauch, 1980). AllDCA plots were prepared in R package vegan and contained datafrom all GeoChip probes include those with SNR<2 filled as 0's.The signal intensities for GeoChip probes in subcategories “carbondegradation” and “organic remediation” were isolated for all an-alyses focused on traits involved in tundra C degradation. Weremoved all probes with SNR <2 for all analyses focused on geneabundances and included them as 0's for all analyses focused onC-degradation functional gene diversity. Mann-Whitney-Wilcoxon tests, performed in R, were used to determine stati-cally significant differences between categorized probes indifferent treatments and diversity and evenness indices of C-degradation functional genes.
3. Results
3.1. Initial soil properties
In general, initial mass based soil C (%C) and nitrogen (%N)concentrations varied systematically by depth (Table 1), but werenot affected by field warming over this initial phase of the tundrawarming experiment (Table 2). Carbon concentration decreasedfrom about 40% in the 0e15 cm layer, to 35% in 15e25 cm, and toless than 20% in the 45e55 cm layer (Table 1). Nitrogen concen-tration also significantly changed with depth, with the highestvalue in the intermediate layer (15e25 cm). Carbon to nitrogenratio (C:N) slightly decreased with depth although in general, the
lowest values were found in the 15e25 cm depth interval. Bulkdensity and pH both increased with depth with no difference be-tween control and field warmed soils, although there was a trendtowards higher bulk density with warming at the deepest soildepth (Tables 1 and 2).
3.2. Carbon pools, decay rates and total carbon respired
The fast decomposing C pool (CF) accounted for less than 5% ofthe total initial C pool and decreased from 30e50 mgC gCinitial
�1 in0e15 cm soils to 5e10 mgC gCinitial
�1 in 45e55 cm (Fig. 1a,Supplemental Table 1) whereas the slow decomposing C poolsize (CS) accounted for 950e990 mgC gCinitial
�1 (Fig. 1b). Both Cpools significantly changed with soil depth and incubation
(b)
Depth (cm)0-15 15-25 45-55
k S01
x-4
yad(-1
)
0
2
4
6
8
(a)
k F01
x-2
yad(-1
)
0
2
4
6
8
Ctrl (15oC) Warm (15oC)Ctrl (25oC)Warm (25oC)
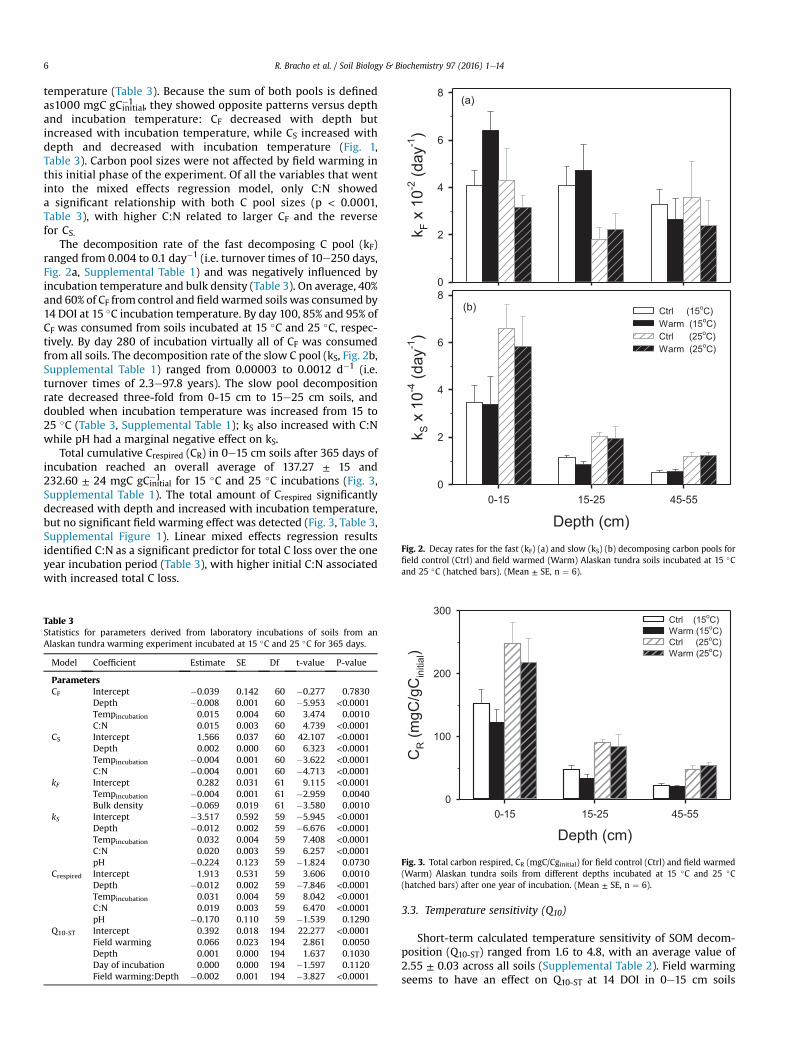
Fig. 2. Decay rates for the fast (kF) (a) and slow (kS) (b) decomposing carbon pools forfield control (Ctrl) and field warmed (Warm) Alaskan tundra soils incubated at 15 �Cand 25 �C (hatched bars). (Mean ± SE, n ¼ 6).
R. Bracho et al. / Soil Biology & Biochemistry 97 (2016) 1e146
temperature (Table 3). Because the sum of both pools is definedas1000 mgC gCinitial
�1 , they showed opposite patterns versus depthand incubation temperature: CF decreased with depth butincreased with incubation temperature, while CS increased withdepth and decreased with incubation temperature (Fig. 1,Table 3). Carbon pool sizes were not affected by field warming inthis initial phase of the experiment. Of all the variables that wentinto the mixed effects regression model, only C:N showeda significant relationship with both C pool sizes (p < 0.0001,Table 3), with higher C:N related to larger CF and the reversefor CS.
The decomposition rate of the fast decomposing C pool (kF)ranged from 0.004 to 0.1 day�1 (i.e. turnover times of 10e250 days,Fig. 2a, Supplemental Table 1) and was negatively influenced byincubation temperature and bulk density (Table 3). On average, 40%and 60% of CF from control and field warmed soils was consumed by14 DOI at 15 �C incubation temperature. By day 100, 85% and 95% ofCF was consumed from soils incubated at 15 �C and 25 �C, respec-tively. By day 280 of incubation virtually all of CF was consumedfrom all soils. The decomposition rate of the slow C pool (kS, Fig. 2b,Supplemental Table 1) ranged from 0.00003 to 0.0012 d�1 (i.e.turnover times of 2.3e97.8 years). The slow pool decompositionrate decreased three-fold from 0-15 cm to 15e25 cm soils, anddoubled when incubation temperature was increased from 15 to25 �C (Table 3, Supplemental Table 1); kS also increased with C:Nwhile pH had a marginal negative effect on kS.
Total cumulative Crespired (CR) in 0e15 cm soils after 365 days ofincubation reached an overall average of 137.27 ± 15 and232.60 ± 24 mgC gCinitial
�1 for 15 �C and 25 �C incubations (Fig. 3,Supplemental Table 1). The total amount of Crespired significantlydecreased with depth and increased with incubation temperature,but no significant field warming effect was detected (Fig. 3, Table 3,Supplemental Figure 1). Linear mixed effects regression resultsidentified C:N as a significant predictor for total C loss over the oneyear incubation period (Table 3), with higher initial C:N associatedwith increased total C loss.
Table 3Statistics for parameters derived from laboratory incubations of soils from anAlaskan tundra warming experiment incubated at 15 �C and 25 �C for 365 days.
Model Coefficient Estimate SE Df t-value P-value
ParametersCF Intercept �0.039 0.142 60 �0.277 0.7830
Depth �0.008 0.001 60 �5.953 <0.0001Tempincubation 0.015 0.004 60 3.474 0.0010C:N 0.015 0.003 60 4.739 <0.0001
CS Intercept 1.566 0.037 60 42.107 <0.0001Depth 0.002 0.000 60 6.323 <0.0001Tempincubation �0.004 0.001 60 �3.622 <0.0001C:N �0.004 0.001 60 �4.713 <0.0001
kF Intercept 0.282 0.031 61 9.115 <0.0001Tempincubation �0.004 0.001 61 �2.959 0.0040Bulk density �0.069 0.019 61 �3.580 0.0010
kS Intercept �3.517 0.592 59 �5.945 <0.0001Depth �0.012 0.002 59 �6.676 <0.0001Tempincubation 0.032 0.004 59 7.408 <0.0001C:N 0.020 0.003 59 6.257 <0.0001pH �0.224 0.123 59 �1.824 0.0730
Crespired Intercept 1.913 0.531 59 3.606 0.0010Depth �0.012 0.002 59 �7.846 <0.0001Tempincubation 0.031 0.004 59 8.042 <0.0001C:N 0.019 0.003 59 6.470 <0.0001pH �0.170 0.110 59 �1.539 0.1290
Q10-ST Intercept 0.392 0.018 194 22.277 <0.0001Field warming 0.066 0.023 194 2.861 0.0050Depth 0.001 0.000 194 1.637 0.1030Day of incubation 0.000 0.000 194 �1.597 0.1120Field warming:Depth �0.002 0.001 194 �3.827 <0.0001
Depth (cm)0-15 15-25 45-55
CR
Cg/Cg
m(lai tin i)
0
100
200
300Ctrl (15oC)Warm (15oC)Ctrl (25oC) Warm (25oC)
Fig. 3. Total carbon respired, CR (mgC/Cginitial) for field control (Ctrl) and field warmed(Warm) Alaskan tundra soils from different depths incubated at 15 �C and 25 �C(hatched bars) after one year of incubation. (Mean ± SE, n ¼ 6).
3.3. Temperature sensitivity (Q10)
Short-term calculated temperature sensitivity of SOM decom-position (Q10-ST) ranged from 1.6 to 4.8, with an average value of2.55 ± 0.03 across all soils (Supplemental Table 2). Field warmingseems to have an effect on Q10-ST at 14 DOI in 0e15 cm soils
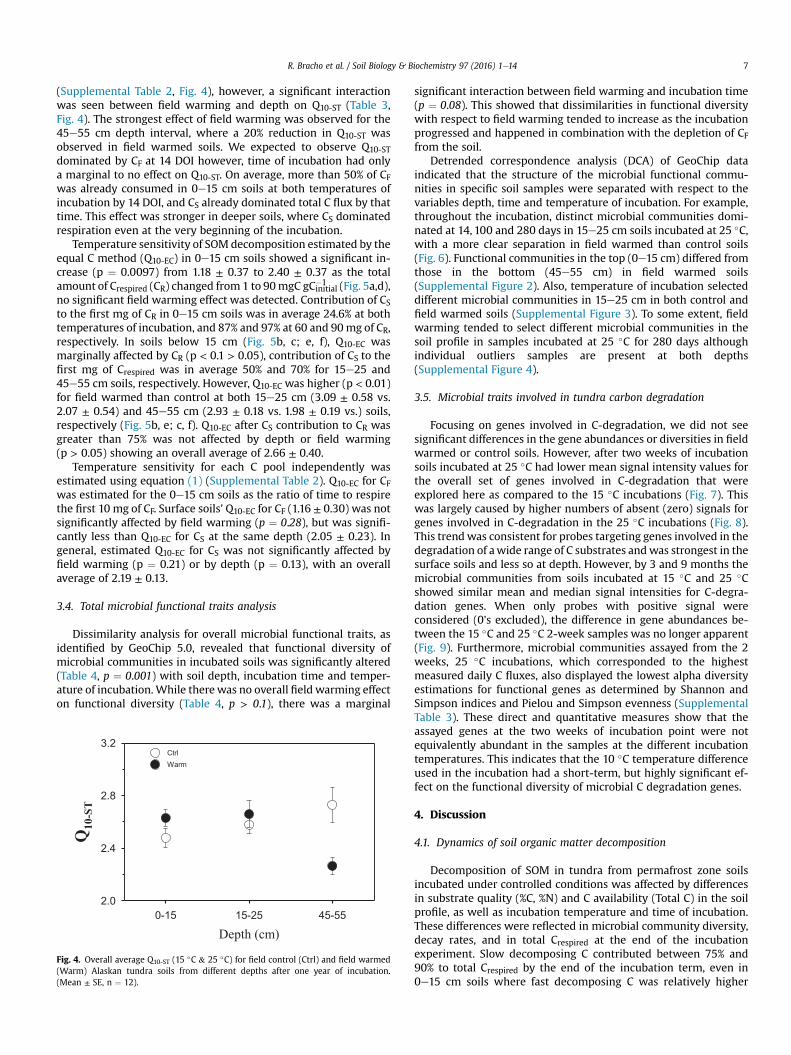
R. Bracho et al. / Soil Biology & Biochemistry 97 (2016) 1e14 7
(Supplemental Table 2, Fig. 4), however, a significant interactionwas seen between field warming and depth on Q10-ST (Table 3,Fig. 4). The strongest effect of field warming was observed for the45e55 cm depth interval, where a 20% reduction in Q10-ST wasobserved in field warmed soils. We expected to observe Q10-STdominated by CF at 14 DOI however, time of incubation had onlya marginal to no effect on Q10-ST. On average, more than 50% of CFwas already consumed in 0e15 cm soils at both temperatures ofincubation by 14 DOI, and CS already dominated total C flux by thattime. This effect was stronger in deeper soils, where CS dominatedrespiration even at the very beginning of the incubation.
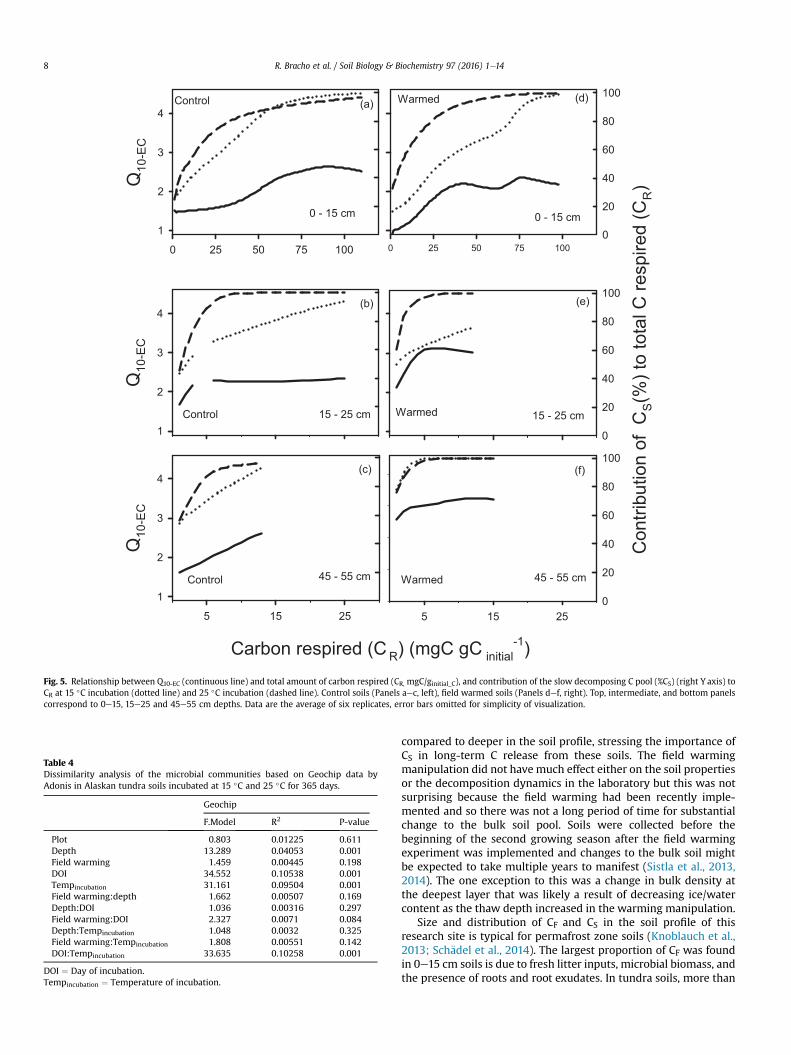
Temperature sensitivity of SOM decomposition estimated by theequal C method (Q10-EC) in 0e15 cm soils showed a significant in-crease (p ¼ 0.0097) from 1.18 ± 0.37 to 2.40 ± 0.37 as the totalamount of Crespired (CR) changed from 1 to 90mgC gCinitial
�1 (Fig. 5a,d),no significant field warming effect was detected. Contribution of CSto the first mg of CR in 0e15 cm soils was in average 24.6% at bothtemperatures of incubation, and 87% and 97% at 60 and 90mg of CR,respectively. In soils below 15 cm (Fig. 5b, c; e, f), Q10-EC wasmarginally affected by CR (p < 0.1 > 0.05), contribution of CS to thefirst mg of Crespired was in average 50% and 70% for 15e25 and45e55 cm soils, respectively. However, Q10-EC was higher (p < 0.01)for field warmed than control at both 15e25 cm (3.09 ± 0.58 vs.2.07 ± 0.54) and 45e55 cm (2.93 ± 0.18 vs. 1.98 ± 0.19 vs.) soils,respectively (Fig. 5b, e; c, f). Q10-EC after CS contribution to CR wasgreater than 75% was not affected by depth or field warming(p > 0.05) showing an overall average of 2.66 ± 0.40.
Temperature sensitivity for each C pool independently wasestimated using equation (1) (Supplemental Table 2). Q10-EC for CFwas estimated for the 0e15 cm soils as the ratio of time to respirethe first 10 mg of CF. Surface soils' Q10-EC for CF (1.16 ± 0.30) was notsignificantly affected by field warming (p ¼ 0.28), but was signifi-cantly less than Q10-EC for CS at the same depth (2.05 ± 0.23). Ingeneral, estimated Q10-EC for CS was not significantly affected byfield warming (p ¼ 0.21) or by depth (p ¼ 0.13), with an overallaverage of 2.19 ± 0.13.
3.4. Total microbial functional traits analysis
Dissimilarity analysis for overall microbial functional traits, asidentified by GeoChip 5.0, revealed that functional diversity ofmicrobial communities in incubated soils was significantly altered(Table 4, p ¼ 0.001) with soil depth, incubation time and temper-ature of incubation.While there was no overall field warming effecton functional diversity (Table 4, p > 0.1), there was a marginal
Depth (cm)0-15 15-25 45-55
Q10-ST
2.0
2.4
2.8
3.2CtrlWarm
Fig. 4. Overall average Q10-ST (15 �C & 25 �C) for field control (Ctrl) and field warmed(Warm) Alaskan tundra soils from different depths after one year of incubation.(Mean ± SE, n ¼ 12).
significant interaction between field warming and incubation time(p ¼ 0.08). This showed that dissimilarities in functional diversitywith respect to field warming tended to increase as the incubationprogressed and happened in combination with the depletion of CFfrom the soil.
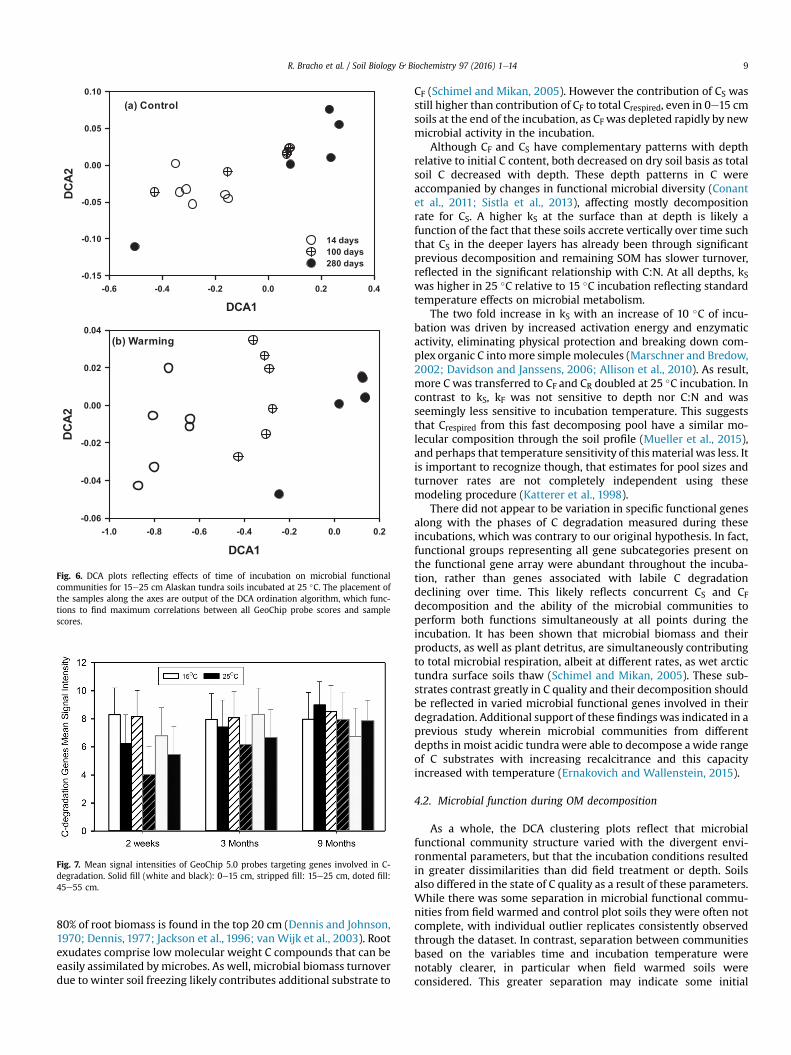
Detrended correspondence analysis (DCA) of GeoChip dataindicated that the structure of the microbial functional commu-nities in specific soil samples were separated with respect to thevariables depth, time and temperature of incubation. For example,throughout the incubation, distinct microbial communities domi-nated at 14, 100 and 280 days in 15e25 cm soils incubated at 25 �C,with a more clear separation in field warmed than control soils(Fig. 6). Functional communities in the top (0e15 cm) differed fromthose in the bottom (45e55 cm) in field warmed soils(Supplemental Figure 2). Also, temperature of incubation selecteddifferent microbial communities in 15e25 cm in both control andfield warmed soils (Supplemental Figure 3). To some extent, fieldwarming tended to select different microbial communities in thesoil profile in samples incubated at 25 �C for 280 days althoughindividual outliers samples are present at both depths(Supplemental Figure 4).
3.5. Microbial traits involved in tundra carbon degradation
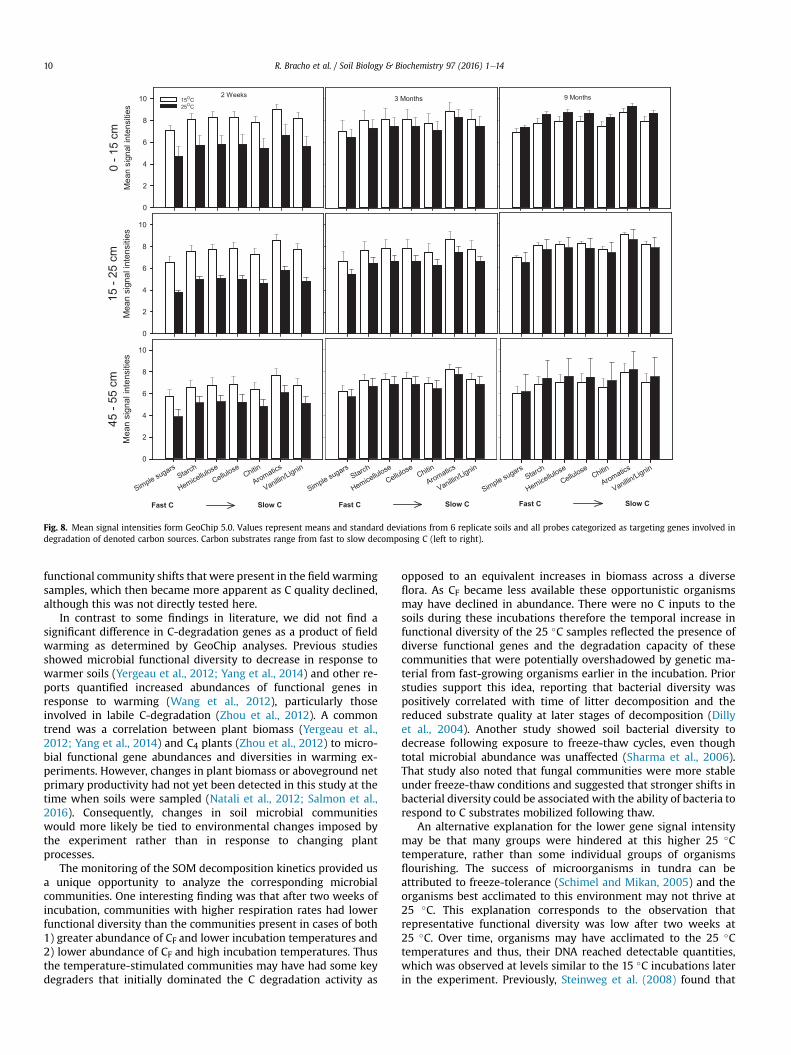
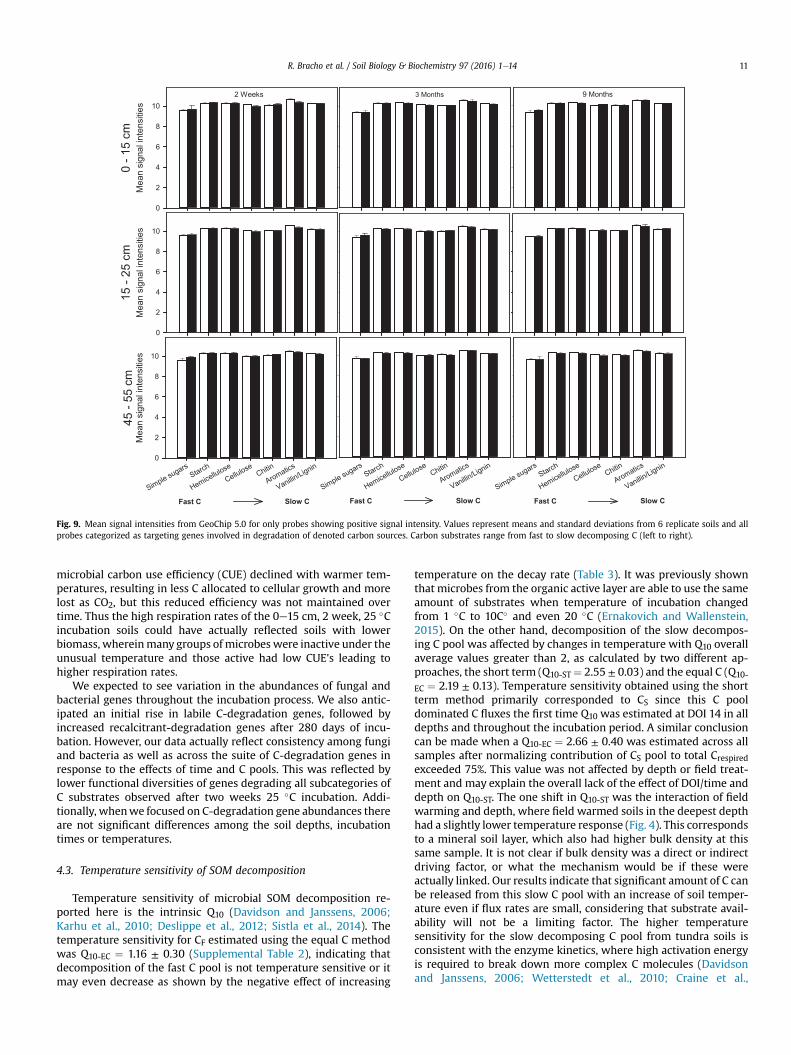
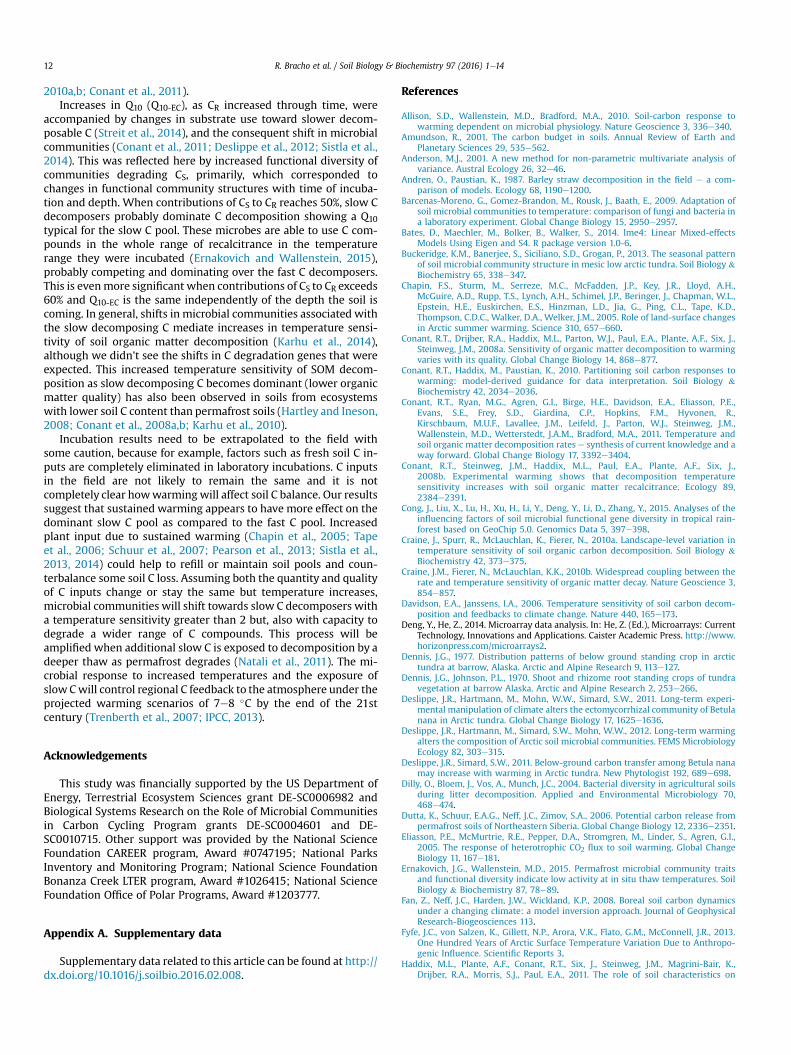
Focusing on genes involved in C-degradation, we did not seesignificant differences in the gene abundances or diversities in fieldwarmed or control soils. However, after two weeks of incubationsoils incubated at 25 �C had lower mean signal intensity values forthe overall set of genes involved in C-degradation that wereexplored here as compared to the 15 �C incubations (Fig. 7). Thiswas largely caused by higher numbers of absent (zero) signals forgenes involved in C-degradation in the 25 �C incubations (Fig. 8).This trend was consistent for probes targeting genes involved in thedegradation of awide range of C substrates andwas strongest in thesurface soils and less so at depth. However, by 3 and 9 months themicrobial communities from soils incubated at 15 �C and 25 �Cshowed similar mean and median signal intensities for C-degra-dation genes. When only probes with positive signal wereconsidered (0's excluded), the difference in gene abundances be-tween the 15 �C and 25 �C 2-week samples was no longer apparent(Fig. 9). Furthermore, microbial communities assayed from the 2weeks, 25 �C incubations, which corresponded to the highestmeasured daily C fluxes, also displayed the lowest alpha diversityestimations for functional genes as determined by Shannon andSimpson indices and Pielou and Simpson evenness (SupplementalTable 3). These direct and quantitative measures show that theassayed genes at the two weeks of incubation point were notequivalently abundant in the samples at the different incubationtemperatures. This indicates that the 10 �C temperature differenceused in the incubation had a short-term, but highly significant ef-fect on the functional diversity of microbial C degradation genes.
4. Discussion
4.1. Dynamics of soil organic matter decomposition
Decomposition of SOM in tundra from permafrost zone soilsincubated under controlled conditions was affected by differencesin substrate quality (%C, %N) and C availability (Total C) in the soilprofile, as well as incubation temperature and time of incubation.These differences were reflected in microbial community diversity,decay rates, and in total Crespired at the end of the incubationexperiment. Slow decomposing C contributed between 75% and90% to total Crespired by the end of the incubation term, even in0e15 cm soils where fast decomposing C was relatively higher
(a)
0 25 50 75 100
Q10
-EC
1
2
3
4
(b)
Q10
-EC
1
2
3
4
(c)
Carbon respired (C R) (mgC gC initial-1)
5 15 25
Q10
-EC
1
2
3
4
(d)
0 25 50 75 1000
20
40
60
80
100
(e)
Con
tribu
tion
of C
S(%
) to
tota
l C re
spire
d (C
R)
0
20
40
60
80
100
(f)
5 15 250
20
40
60
80
100
Control Warmed
0 - 15 cm 0 - 15 cm
15 - 25 cm 15 - 25 cm
45 - 55 cm 45 - 55 cm
Control
demraWlortnoC
Warmed
Fig. 5. Relationship between Q10-EC (continuous line) and total amount of carbon respired (CR, mgC/ginitial_C), and contribution of the slow decomposing C pool (%CS) (right Y axis) toCR at 15 �C incubation (dotted line) and 25 �C incubation (dashed line). Control soils (Panels aec, left), field warmed soils (Panels def, right). Top, intermediate, and bottom panelscorrespond to 0e15, 15e25 and 45e55 cm depths. Data are the average of six replicates, error bars omitted for simplicity of visualization.
Table 4Dissimilarity analysis of the microbial communities based on Geochip data byAdonis in Alaskan tundra soils incubated at 15 �C and 25 �C for 365 days.
Geochip
F.Model R2 P-value
Plot 0.803 0.01225 0.611Depth 13.289 0.04053 0.001Field warming 1.459 0.00445 0.198DOI 34.552 0.10538 0.001Tempincubation 31.161 0.09504 0.001Field warming:depth 1.662 0.00507 0.169Depth:DOI 1.036 0.00316 0.297Field warming:DOI 2.327 0.0071 0.084Depth:Tempincubation 1.048 0.0032 0.325Field warming:Tempincubation 1.808 0.00551 0.142DOI:Tempincubation 33.635 0.10258 0.001
DOI ¼ Day of incubation.Tempincubation ¼ Temperature of incubation.
R. Bracho et al. / Soil Biology & Biochemistry 97 (2016) 1e148
compared to deeper in the soil profile, stressing the importance ofCS in long-term C release from these soils. The field warmingmanipulation did not have much effect either on the soil propertiesor the decomposition dynamics in the laboratory but this was notsurprising because the field warming had been recently imple-mented and so there was not a long period of time for substantialchange to the bulk soil pool. Soils were collected before thebeginning of the second growing season after the field warmingexperiment was implemented and changes to the bulk soil mightbe expected to take multiple years to manifest (Sistla et al., 2013,2014). The one exception to this was a change in bulk density atthe deepest layer that was likely a result of decreasing ice/watercontent as the thaw depth increased in the warming manipulation.
Size and distribution of CF and CS in the soil profile of thisresearch site is typical for permafrost zone soils (Knoblauch et al.,2013; Sch€adel et al., 2014). The largest proportion of CF was foundin 0e15 cm soils is due to fresh litter inputs, microbial biomass, andthe presence of roots and root exudates. In tundra soils, more than
(a) Control
DCA1-0.6 -0.4 -0.2 0.0 0.2 0.4
DC
A2
-0.15
-0.10
-0.05
0.00
0.05
0.10
14 days100 days280 days
(b) Warming
DCA1-1.0 -0.8 -0.6 -0.4 -0.2 0.0 0.2
DC
A2
-0.06
-0.04
-0.02
0.00
0.02
0.04
Fig. 6. DCA plots reflecting effects of time of incubation on microbial functionalcommunities for 15e25 cm Alaskan tundra soils incubated at 25 �C. The placement ofthe samples along the axes are output of the DCA ordination algorithm, which func-tions to find maximum correlations between all GeoChip probe scores and samplescores.
Fig. 7. Mean signal intensities of GeoChip 5.0 probes targeting genes involved in C-degradation. Solid fill (white and black): 0e15 cm, stripped fill: 15e25 cm, doted fill:45e55 cm.
R. Bracho et al. / Soil Biology & Biochemistry 97 (2016) 1e14 9
80% of root biomass is found in the top 20 cm (Dennis and Johnson,1970; Dennis, 1977; Jackson et al., 1996; van Wijk et al., 2003). Rootexudates comprise lowmolecular weight C compounds that can beeasily assimilated bymicrobes. As well, microbial biomass turnoverdue to winter soil freezing likely contributes additional substrate to
CF (Schimel and Mikan, 2005). However the contribution of CS wasstill higher than contribution of CF to total Crespired, even in 0e15 cmsoils at the end of the incubation, as CF was depleted rapidly by newmicrobial activity in the incubation.
Although CF and CS have complementary patterns with depthrelative to initial C content, both decreased on dry soil basis as totalsoil C decreased with depth. These depth patterns in C wereaccompanied by changes in functional microbial diversity (Conantet al., 2011; Sistla et al., 2013), affecting mostly decompositionrate for CS. A higher kS at the surface than at depth is likely afunction of the fact that these soils accrete vertically over time suchthat CS in the deeper layers has already been through significantprevious decomposition and remaining SOM has slower turnover,reflected in the significant relationship with C:N. At all depths, kSwas higher in 25 �C relative to 15 �C incubation reflecting standardtemperature effects on microbial metabolism.
The two fold increase in kS with an increase of 10 �C of incu-bation was driven by increased activation energy and enzymaticactivity, eliminating physical protection and breaking down com-plex organic C intomore simple molecules (Marschner and Bredow,2002; Davidson and Janssens, 2006; Allison et al., 2010). As result,more C was transferred to CF and CR doubled at 25 �C incubation. Incontrast to kS, kF was not sensitive to depth nor C:N and wasseemingly less sensitive to incubation temperature. This suggeststhat Crespired from this fast decomposing pool have a similar mo-lecular composition through the soil profile (Mueller et al., 2015),and perhaps that temperature sensitivity of thismaterial was less. Itis important to recognize though, that estimates for pool sizes andturnover rates are not completely independent using thesemodeling procedure (Katterer et al., 1998).
There did not appear to be variation in specific functional genesalong with the phases of C degradation measured during theseincubations, which was contrary to our original hypothesis. In fact,functional groups representing all gene subcategories present onthe functional gene array were abundant throughout the incuba-tion, rather than genes associated with labile C degradationdeclining over time. This likely reflects concurrent CS and CFdecomposition and the ability of the microbial communities toperform both functions simultaneously at all points during theincubation. It has been shown that microbial biomass and theirproducts, as well as plant detritus, are simultaneously contributingto total microbial respiration, albeit at different rates, as wet arctictundra surface soils thaw (Schimel and Mikan, 2005). These sub-strates contrast greatly in C quality and their decomposition shouldbe reflected in varied microbial functional genes involved in theirdegradation. Additional support of these findings was indicated in aprevious study wherein microbial communities from differentdepths in moist acidic tundra were able to decompose a wide rangeof C substrates with increasing recalcitrance and this capacityincreased with temperature (Ernakovich and Wallenstein, 2015).
4.2. Microbial function during OM decomposition
As a whole, the DCA clustering plots reflect that microbialfunctional community structure varied with the divergent envi-ronmental parameters, but that the incubation conditions resultedin greater dissimilarities than did field treatment or depth. Soilsalso differed in the state of C quality as a result of these parameters.While there was some separation in microbial functional commu-nities from field warmed and control plot soils they were often notcomplete, with individual outlier replicates consistently observedthrough the dataset. In contrast, separation between communitiesbased on the variables time and incubation temperature werenotably clearer, in particular when field warmed soils wereconsidered. This greater separation may indicate some initial
2 Weeks
0 - 1
5 cm
Mea
n si
gnal
inte
nsiti
es
0
2
4
6
8
10 15 C25 C
3 Months 9 Months
15 -
25 c
mM
ean
sign
al in
tens
ities
0
2
4
6
8
10
Simple sugarsStarch
Hemicellulose
CelluloseChitin
Aromatics
Vanillin/Lignin
45 -
55 c
mM
ean
sign
al in
tens
ities
0
2
4
6
8
10
Fast C
Simple sugarsStarch
Hemicellulose
CelluloseChitin
Aromatics
Vanillin/Lignin
Slow C
Simple sugarsStarch
Hemicellulose
CelluloseChitin
Aromatics
Vanillin/Lignin
Fast C Slow C Fast C Slow C
Fig. 8. Mean signal intensities form GeoChip 5.0. Values represent means and standard deviations from 6 replicate soils and all probes categorized as targeting genes involved indegradation of denoted carbon sources. Carbon substrates range from fast to slow decomposing C (left to right).
R. Bracho et al. / Soil Biology & Biochemistry 97 (2016) 1e1410
functional community shifts that were present in the field warmingsamples, which then became more apparent as C quality declined,although this was not directly tested here.
In contrast to some findings in literature, we did not find asignificant difference in C-degradation genes as a product of fieldwarming as determined by GeoChip analyses. Previous studiesshowed microbial functional diversity to decrease in response towarmer soils (Yergeau et al., 2012; Yang et al., 2014) and other re-ports quantified increased abundances of functional genes inresponse to warming (Wang et al., 2012), particularly thoseinvolved in labile C-degradation (Zhou et al., 2012). A commontrend was a correlation between plant biomass (Yergeau et al.,2012; Yang et al., 2014) and C4 plants (Zhou et al., 2012) to micro-bial functional gene abundances and diversities in warming ex-periments. However, changes in plant biomass or aboveground netprimary productivity had not yet been detected in this study at thetime when soils were sampled (Natali et al., 2012; Salmon et al.,2016). Consequently, changes in soil microbial communitieswould more likely be tied to environmental changes imposed bythe experiment rather than in response to changing plantprocesses.
The monitoring of the SOM decomposition kinetics provided usa unique opportunity to analyze the corresponding microbialcommunities. One interesting finding was that after two weeks ofincubation, communities with higher respiration rates had lowerfunctional diversity than the communities present in cases of both1) greater abundance of CF and lower incubation temperatures and2) lower abundance of CF and high incubation temperatures. Thusthe temperature-stimulated communities may have had some keydegraders that initially dominated the C degradation activity as
opposed to an equivalent increases in biomass across a diverseflora. As CF became less available these opportunistic organismsmay have declined in abundance. There were no C inputs to thesoils during these incubations therefore the temporal increase infunctional diversity of the 25 �C samples reflected the presence ofdiverse functional genes and the degradation capacity of thesecommunities that were potentially overshadowed by genetic ma-terial from fast-growing organisms earlier in the incubation. Priorstudies support this idea, reporting that bacterial diversity waspositively correlated with time of litter decomposition and thereduced substrate quality at later stages of decomposition (Dillyet al., 2004). Another study showed soil bacterial diversity todecrease following exposure to freeze-thaw cycles, even thoughtotal microbial abundance was unaffected (Sharma et al., 2006).That study also noted that fungal communities were more stableunder freeze-thaw conditions and suggested that stronger shifts inbacterial diversity could be associated with the ability of bacteria torespond to C substrates mobilized following thaw.
An alternative explanation for the lower gene signal intensitymay be that many groups were hindered at this higher 25 �Ctemperature, rather than some individual groups of organismsflourishing. The success of microorganisms in tundra can beattributed to freeze-tolerance (Schimel and Mikan, 2005) and theorganisms best acclimated to this environment may not thrive at25 �C. This explanation corresponds to the observation thatrepresentative functional diversity was low after two weeks at25 �C. Over time, organisms may have acclimated to the 25 �Ctemperatures and thus, their DNA reached detectable quantities,which was observed at levels similar to the 15 �C incubations laterin the experiment. Previously, Steinweg et al. (2008) found that
2 Weeks
0 - 1
5 cm
Mea
n si
gnal
inte
nsiti
es
0
2
4
6
8
103 Months 9 Months
15 -
25 c
mM
ean
sign
al in
tens
ities
0
2
4
6
8
10
Simple sugarsStarch
Hemicellulose
CelluloseChitin
Aromatics
Vanillin/Lignin
45 -
55 c
mM
ean
sign
al in
tens
ities
0
2
4
6
8
10
Simple sugarsStarch
Hemicellulose
CelluloseChitin
Aromatics
Vanillin/Lignin
Simple sugarsStarch
Hemicellulose
CelluloseChitin
Aromatics
Vanillin/Lignin
Fast C Slow C Fast C Slow C Fast C Slow C
Fig. 9. Mean signal intensities from GeoChip 5.0 for only probes showing positive signal intensity. Values represent means and standard deviations from 6 replicate soils and allprobes categorized as targeting genes involved in degradation of denoted carbon sources. Carbon substrates range from fast to slow decomposing C (left to right).
R. Bracho et al. / Soil Biology & Biochemistry 97 (2016) 1e14 11
microbial carbon use efficiency (CUE) declined with warmer tem-peratures, resulting in less C allocated to cellular growth and morelost as CO2, but this reduced efficiency was not maintained overtime. Thus the high respiration rates of the 0e15 cm, 2 week, 25 �Cincubation soils could have actually reflected soils with lowerbiomass, whereinmany groups of microbes were inactive under theunusual temperature and those active had low CUE's leading tohigher respiration rates.
We expected to see variation in the abundances of fungal andbacterial genes throughout the incubation process. We also antic-ipated an initial rise in labile C-degradation genes, followed byincreased recalcitrant-degradation genes after 280 days of incu-bation. However, our data actually reflect consistency among fungiand bacteria as well as across the suite of C-degradation genes inresponse to the effects of time and C pools. This was reflected bylower functional diversities of genes degrading all subcategories ofC substrates observed after two weeks 25 �C incubation. Addi-tionally, whenwe focused on C-degradation gene abundances thereare not significant differences among the soil depths, incubationtimes or temperatures.
4.3. Temperature sensitivity of SOM decomposition
Temperature sensitivity of microbial SOM decomposition re-ported here is the intrinsic Q10 (Davidson and Janssens, 2006;Karhu et al., 2010; Deslippe et al., 2012; Sistla et al., 2014). Thetemperature sensitivity for CF estimated using the equal C methodwas Q10-EC ¼ 1.16 ± 0.30 (Supplemental Table 2), indicating thatdecomposition of the fast C pool is not temperature sensitive or itmay even decrease as shown by the negative effect of increasing
temperature on the decay rate (Table 3). It was previously shownthat microbes from the organic active layer are able to use the sameamount of substrates when temperature of incubation changedfrom 1 �C to 10C� and even 20 �C (Ernakovich and Wallenstein,2015). On the other hand, decomposition of the slow decompos-ing C pool was affected by changes in temperature with Q10 overallaverage values greater than 2, as calculated by two different ap-proaches, the short term (Q10-ST¼ 2.55 ± 0.03) and the equal C (Q10-
EC ¼ 2.19 ± 0.13). Temperature sensitivity obtained using the shortterm method primarily corresponded to CS since this C pooldominated C fluxes the first time Q10 was estimated at DOI 14 in alldepths and throughout the incubation period. A similar conclusioncan be made when a Q10-EC ¼ 2.66 ± 0.40 was estimated across allsamples after normalizing contribution of CS pool to total Crespiredexceeded 75%. This value was not affected by depth or field treat-ment and may explain the overall lack of the effect of DOI/time anddepth on Q10-ST. The one shift in Q10-ST was the interaction of fieldwarming and depth, where field warmed soils in the deepest depthhad a slightly lower temperature response (Fig. 4). This correspondsto a mineral soil layer, which also had higher bulk density at thissame sample. It is not clear if bulk density was a direct or indirectdriving factor, or what the mechanism would be if these wereactually linked. Our results indicate that significant amount of C canbe released from this slow C pool with an increase of soil temper-ature even if flux rates are small, considering that substrate avail-ability will not be a limiting factor. The higher temperaturesensitivity for the slow decomposing C pool from tundra soils isconsistent with the enzyme kinetics, where high activation energyis required to break down more complex C molecules (Davidsonand Janssens, 2006; Wetterstedt et al., 2010; Craine et al.,
R. Bracho et al. / Soil Biology & Biochemistry 97 (2016) 1e1412
2010a,b; Conant et al., 2011).Increases in Q10 (Q10-EC), as CR increased through time, were
accompanied by changes in substrate use toward slower decom-posable C (Streit et al., 2014), and the consequent shift in microbialcommunities (Conant et al., 2011; Deslippe et al., 2012; Sistla et al.,2014). This was reflected here by increased functional diversity ofcommunities degrading CS, primarily, which corresponded tochanges in functional community structures with time of incuba-tion and depth. When contributions of CS to CR reaches 50%, slow Cdecomposers probably dominate C decomposition showing a Q10typical for the slow C pool. These microbes are able to use C com-pounds in the whole range of recalcitrance in the temperaturerange they were incubated (Ernakovich and Wallenstein, 2015),probably competing and dominating over the fast C decomposers.This is evenmore significant when contributions of CS to CR exceeds60% and Q10-EC is the same independently of the depth the soil iscoming. In general, shifts in microbial communities associated withthe slow decomposing C mediate increases in temperature sensi-tivity of soil organic matter decomposition (Karhu et al., 2014),although we didn't see the shifts in C degradation genes that wereexpected. This increased temperature sensitivity of SOM decom-position as slow decomposing C becomes dominant (lower organicmatter quality) has also been observed in soils from ecosystemswith lower soil C content than permafrost soils (Hartley and Ineson,2008; Conant et al., 2008a,b; Karhu et al., 2010).
Incubation results need to be extrapolated to the field withsome caution, because for example, factors such as fresh soil C in-puts are completely eliminated in laboratory incubations. C inputsin the field are not likely to remain the same and it is notcompletely clear howwarming will affect soil C balance. Our resultssuggest that sustained warming appears to have more effect on thedominant slow C pool as compared to the fast C pool. Increasedplant input due to sustained warming (Chapin et al., 2005; Tapeet al., 2006; Schuur et al., 2007; Pearson et al., 2013; Sistla et al.,2013, 2014) could help to refill or maintain soil pools and coun-terbalance some soil C loss. Assuming both the quantity and qualityof C inputs change or stay the same but temperature increases,microbial communities will shift towards slow C decomposers witha temperature sensitivity greater than 2 but, also with capacity todegrade a wider range of C compounds. This process will beamplified when additional slow C is exposed to decomposition by adeeper thaw as permafrost degrades (Natali et al., 2011). The mi-crobial response to increased temperatures and the exposure ofslow Cwill control regional C feedback to the atmosphere under theprojected warming scenarios of 7e8 �C by the end of the 21stcentury (Trenberth et al., 2007; IPCC, 2013).
Acknowledgements
This study was financially supported by the US Department ofEnergy, Terrestrial Ecosystem Sciences grant DE-SC0006982 andBiological Systems Research on the Role of Microbial Communitiesin Carbon Cycling Program grants DE-SC0004601 and DE-SC0010715. Other support was provided by the National ScienceFoundation CAREER program, Award #0747195; National ParksInventory and Monitoring Program; National Science FoundationBonanza Creek LTER program, Award #1026415; National ScienceFoundation Office of Polar Programs, Award #1203777.
Appendix A. Supplementary data
Supplementary data related to this article can be found at http://dx.doi.org/10.1016/j.soilbio.2016.02.008.
References
Allison, S.D., Wallenstein, M.D., Bradford, M.A., 2010. Soil-carbon response towarming dependent on microbial physiology. Nature Geoscience 3, 336e340.
Amundson, R., 2001. The carbon budget in soils. Annual Review of Earth andPlanetary Sciences 29, 535e562.
Anderson, M.J., 2001. A new method for non-parametric multivariate analysis ofvariance. Austral Ecology 26, 32e46.
Andren, O., Paustian, K., 1987. Barley straw decomposition in the field e a com-parison of models. Ecology 68, 1190e1200.
Barcenas-Moreno, G., Gomez-Brandon, M., Rousk, J., Baath, E., 2009. Adaptation ofsoil microbial communities to temperature: comparison of fungi and bacteria ina laboratory experiment. Global Change Biology 15, 2950e2957.
Bates, D., Maechler, M., Bolker, B., Walker, S., 2014. lme4: Linear Mixed-effectsModels Using Eigen and S4. R package version 1.0-6.
Buckeridge, K.M., Banerjee, S., Siciliano, S.D., Grogan, P., 2013. The seasonal patternof soil microbial community structure in mesic low arctic tundra. Soil Biology &Biochemistry 65, 338e347.
Chapin, F.S., Sturm, M., Serreze, M.C., McFadden, J.P., Key, J.R., Lloyd, A.H.,McGuire, A.D., Rupp, T.S., Lynch, A.H., Schimel, J.P., Beringer, J., Chapman, W.L.,Epstein, H.E., Euskirchen, E.S., Hinzman, L.D., Jia, G., Ping, C.L., Tape, K.D.,Thompson, C.D.C., Walker, D.A., Welker, J.M., 2005. Role of land-surface changesin Arctic summer warming. Science 310, 657e660.
Conant, R.T., Drijber, R.A., Haddix, M.L., Parton, W.J., Paul, E.A., Plante, A.F., Six, J.,Steinweg, J.M., 2008a. Sensitivity of organic matter decomposition to warmingvaries with its quality. Global Change Biology 14, 868e877.
Conant, R.T., Haddix, M., Paustian, K., 2010. Partitioning soil carbon responses towarming: model-derived guidance for data interpretation. Soil Biology &Biochemistry 42, 2034e2036.
Conant, R.T., Ryan, M.G., Agren, G.I., Birge, H.E., Davidson, E.A., Eliasson, P.E.,Evans, S.E., Frey, S.D., Giardina, C.P., Hopkins, F.M., Hyvonen, R.,Kirschbaum, M.U.F., Lavallee, J.M., Leifeld, J., Parton, W.J., Steinweg, J.M.,Wallenstein, M.D., Wetterstedt, J.A.M., Bradford, M.A., 2011. Temperature andsoil organic matter decomposition ratese synthesis of current knowledge and away forward. Global Change Biology 17, 3392e3404.
Conant, R.T., Steinweg, J.M., Haddix, M.L., Paul, E.A., Plante, A.F., Six, J.,2008b. Experimental warming shows that decomposition temperaturesensitivity increases with soil organic matter recalcitrance. Ecology 89,2384e2391.
Cong, J., Liu, X., Lu, H., Xu, H., Li, Y., Deng, Y., Li, D., Zhang, Y., 2015. Analyses of theinfluencing factors of soil microbial functional gene diversity in tropical rain-forest based on GeoChip 5.0. Genomics Data 5, 397e398.
Craine, J., Spurr, R., McLauchlan, K., Fierer, N., 2010a. Landscape-level variation intemperature sensitivity of soil organic carbon decomposition. Soil Biology &Biochemistry 42, 373e375.
Craine, J.M., Fierer, N., McLauchlan, K.K., 2010b. Widespread coupling between therate and temperature sensitivity of organic matter decay. Nature Geoscience 3,854e857.
Davidson, E.A., Janssens, I.A., 2006. Temperature sensitivity of soil carbon decom-position and feedbacks to climate change. Nature 440, 165e173.
Deng, Y., He, Z., 2014. Microarray data analysis. In: He, Z. (Ed.), Microarrays: CurrentTechnology, Innovations and Applications. Caister Academic Press. http://www.horizonpress.com/microarrays2.
Dennis, J.G., 1977. Distribution patterns of below ground standing crop in arctictundra at barrow, Alaska. Arctic and Alpine Research 9, 113e127.
Dennis, J.G., Johnson, P.L., 1970. Shoot and rhizome root standing crops of tundravegetation at barrow Alaska. Arctic and Alpine Research 2, 253e266.
Deslippe, J.R., Hartmann, M., Mohn, W.W., Simard, S.W., 2011. Long-term experi-mental manipulation of climate alters the ectomycorrhizal community of Betulanana in Arctic tundra. Global Change Biology 17, 1625e1636.
Deslippe, J.R., Hartmann, M., Simard, S.W., Mohn, W.W., 2012. Long-term warmingalters the composition of Arctic soil microbial communities. FEMS MicrobiologyEcology 82, 303e315.
Deslippe, J.R., Simard, S.W., 2011. Below-ground carbon transfer among Betula nanamay increase with warming in Arctic tundra. New Phytologist 192, 689e698.
Dilly, O., Bloem, J., Vos, A., Munch, J.C., 2004. Bacterial diversity in agricultural soilsduring litter decomposition. Applied and Environmental Microbiology 70,468e474.
Dutta, K., Schuur, E.A.G., Neff, J.C., Zimov, S.A., 2006. Potential carbon release frompermafrost soils of Northeastern Siberia. Global Change Biology 12, 2336e2351.
Eliasson, P.E., McMurtrie, R.E., Pepper, D.A., Stromgren, M., Linder, S., Agren, G.I.,2005. The response of heterotrophic CO2 flux to soil warming. Global ChangeBiology 11, 167e181.
Ernakovich, J.G., Wallenstein, M.D., 2015. Permafrost microbial community traitsand functional diversity indicate low activity at in situ thaw temperatures. SoilBiology & Biochemistry 87, 78e89.
Fan, Z., Neff, J.C., Harden, J.W., Wickland, K.P., 2008. Boreal soil carbon dynamicsunder a changing climate: a model inversion approach. Journal of GeophysicalResearch-Biogeosciences 113.
Fyfe, J.C., von Salzen, K., Gillett, N.P., Arora, V.K., Flato, G.M., McConnell, J.R., 2013.One Hundred Years of Arctic Surface Temperature Variation Due to Anthropo-genic Influence. Scientific Reports 3.
Haddix, M.L., Plante, A.F., Conant, R.T., Six, J., Steinweg, J.M., Magrini-Bair, K.,Drijber, R.A., Morris, S.J., Paul, E.A., 2011. The role of soil characteristics on
R. Bracho et al. / Soil Biology & Biochemistry 97 (2016) 1e14 13
temperature sensitivity of soil organic matter. Soil Science Society of AmericaJournal 75, 56e68.
Hamdi, S., Moyano, F., Sall, S., Bernoux, M., Chevallier, T., 2013. Synthesis analysis ofthe temperature sensitivity of soil respiration from laboratory studies in rela-tion to incubation methods and soil conditions. Soil Biology & Biochemistry 58,115e126.
Harden, J.W., Koven, C.D., Ping, C.-L., Hugelius, G., McGuire, A.D., Camill, P.,Jorgenson, T., Kuhry, P., Michaelson, G.J., O'Donnell, J.A., Schuur, E.A.G.,Tarnocai, C., Johnson, K., Grosse, G., 2012. Field information links permafrostcarbon to physical vulnerabilities of thawing. Geophysical Research Letters 39.
Hartley, I.P., Heinemeyer, A., Ineson, P., 2007. Effects of three years of soil warmingand shading on the rate of soil respiration: substrate availability and notthermal acclimation mediates observed response. Global Change Biology 13,1761e1770.
Hartley, I.P., Hopkins, D.W., Garnett, M.H., Sommerkorn, M., Wookey, P.A., 2009. Noevidence for compensatory thermal adaptation of soil microbial respiration inthe study of Bradford et al. (2008). Ecology Letters 12, E12eE14.
Hartley, I.P., Ineson, P., 2008. Substrate quality and the temperature sensitivity ofsoil organic matter decomposition. Soil Biology & Biochemistry 40, 1567e1574.
Hassol, S.J., 2004. Impacts of a Warming Arctic: Arctic Climate Impact Assessment,vol. I-III, pp. 1e139.
He, Z., 2007. GeoChip: a comprehensive microarray for investigating biogeochem-ical, ecological and environmental processes. The ISME Journal 1, 67e77.
Hill, M.O., Gauch, H.G., 1980. Detrended correspondence-analysis e an improvedordination technique. Vegetatio 42, 47e58.
Hirsch, A.I., Trumbore, S.E., Goulden, M.L., 2002. Direct measurement of the deepsoil respiration accompanying seasonal thawing of a boreal forest soil. Journalof Geophysical Research-Atmospheres 108.
Holland, E.A., Neff, J.C., Townsend, A.R., McKeown, B., 2000. Uncertainties in thetemperature sensitivity of decomposition in tropical and subtropical ecosys-tems: implications for models. Global Biogeochemical Cycles 14, 1137e1151.
Hugelius, G., Routh, J., Kuhry, P., Crill, P., 2012. Mapping the degree of decompositionand thaw remobilization potential of soil organic matter in discontinuouspermafrost terrain. Journal of Geophysical Research-Biogeosciences 117.
Hugelius, G., Strauss, J., Zubrzycki, S., Harden, J.W., Schuur, E.A.G., Ping, C.L.,Schirrmeister, L., Grosse, G., Michaelson, G.J., Koven, C.D., O'Donnell, J.A.,Elberling, B., Mishra, U., Camill, P., Yu, Z., Palmtag, J., Kuhry, P., 2014. Estimatedstocks of circumpolar permafrost carbon with quantified uncertainty rangesand identified data gaps. Biogeosciences 11, 6573e6593.
IPCC, 2013. Annex I: Atlas of global and regional climate projections [van Old-enborgh, G.J., M. Collins, J. Arblaster, J.H. Christensen, J. Marotzke, S.B. Power, M.Rummukainen and T. Zhou (eds.)]. In: Stocker, T.F., Qin, D., Plattner, G.-K.,Tignor, M., Allen, S.K., Boschung, J., Nauels, A., Xia, Y., Bex, V., Midgley, P.M.(Eds.), Climate Change 2013: The Physical Science Basis. Contribution ofWorking Group I to the Fifth Assessment Report of the Intergovernmental Panelon Climate Change. Cambridge University Press, Cambridge, United Kingdomand New York, NY, USA.
Jackson, R.B., Canadell, J., Ehleringer, J.R., Mooney, H.A., Sala, O.E., Schulze, E.D., 1996.A global analysis of root distributions for terrestrial biomes. Oecologia 108,389e411.
Karhu, K., Auffret, M.D., Dungait, J.A.J., Hopkins, D.W., Prosser, J.I., Singh, B.K.,Subke, J.-A., Wookey, P.A., Agren, G.I., Sebastia, M.-T., Gouriveau, F., Bergkvist, G.,Meir, P., Nottingham, A.T., Salinas, N., Hartley, I.P., 2014. Temperature sensitivityof soil respiration rates enhanced by microbial community response. Nature513, 81e84.
Karhu, K., Fritze, H., Tuomi, M., Vanhala, P., Spetz, P., Kitunen, V., Liski, J., 2010.Temperature sensitivity of organic matter decomposition in two boreal forestsoil profiles. Soil Biology & Biochemistry 42, 72e82.
Katterer, T., Reichstein, M., Andren, O., Lomander, A., 1998. Temperature depen-dence of organic matter decomposition: a critical review using literature dataanalyzed with different models. Biology and Fertility of Soils 27, 258e262.
Kirschbaum, M.U.F., 1995. The temperature-dependence of soil organic-matterdecomposition, and the effect of global warming on soil organic-c storage.Soil Biology & Biochemistry 27, 753e760.
Kirschbaum, M.U.F., 2004. Soil respiration under prolonged soil warming: are ratereductions caused by acclimation or substrate loss? Global Change Biology 10,1870e1877.
Kirschbaum, M.U.F., 2013. Seasonal variations in the availability of labile substrateconfound the temperature dependence of organic matter decomposition. SoilBiology & Biochemistry 57, 568e576.
Knoblauch, C., Beer, C., Sosnin, A., Wagner, D., Pfeiffer, E.-M., 2013. Predicting long-term carbon mineralization and trace gas production from thawing permafrostof Northeast Siberia. Global Change Biology 19, 1160e1172.
Knorr, W., Prentice, I.C., House, J.I., Holland, E.A., 2005. Long-term sensitivity of soilcarbon turnover to warming. Nature 433, 298e301.
Koven, C.D., Riley, W.J., Stern, A., 2013. Analysis of permafrost thermal dynamics andresponse to climate change in the CMIP5 earth system models. Journal ofClimate 26, 1877e1900.
Koven, C.D., Ringeval, B., Friedlingstein, P., Ciais, P., Cadule, P., Khvorostyanov, D.,Krinner, G., Tarnocai, C., 2011. Permafrost carbon-climate feedbacks accelerateglobal warming. Proceedings of the National Academy of Sciences of the UnitedStates of America 108, 14769e14774.
Lavoie, M., Mack, M.C., Schuur, E.A.G., 2011. Effects of elevated nitrogen and tem-perature on carbon and nitrogen dynamics in Alaskan arctic and boreal soils.Journal of Geophysical Research-Biogeosciences 116.
Liang, Y.T., He, Z.H., Wu, L.Y., Deng, Y., Li, G.H., Zhou, J.-Z., 2010. Development of acommon oligonucleotide reference standard for microarray data normalizationand comparison across different microbial communities. Applied and Envi-ronmental Microbiology 76 (4), 1088e1094.
Liang, J., Li, D., Shi, Z., Tiedje, J.M., Zhou, J., Schuur, E.A.G., Konstantinidis, K.T., Luo, Y.,2015. Methods for estimating temperature sensitivity of soil organic matterbased on incubation data: a comparative evaluation. Soil Biology & Biochem-istry 80, 127e135.
Liebich, J., Schadt, C.W., Chong, S.C., He, Z.L., Rhee, S.K., Zhou, J.Z., 2006. Improve-ment of oligonucleotide probe design criteria for functional gene microarrays inenvironmental applications. Applied and Environmental Microbiology 72,1688e1691.
Luo, Y.Q., Wan, S.Q., Hui, D.F., Wallace, L.L., 2001. Acclimatization of soil respirationto warming in a tall grass prairie. Nature 413, 622e625.
Marschner, B., Bredow, A., 2002. Temperature effects on release and ecologicallyrelevant properties of dissolved organic carbon in sterilised and biologicallyactive soil samples. Soil Biology & Biochemistry 34, 459e466.
Melillo, J.M., Steudler, P.A., Aber, J.D., Newkirk, K., Lux, H., Bowles, F.P., Catricala, C.,Magill, A., Ahrens, T., Morrisseau, S., 2002. Soil warming and carbon-cyclefeedbacks to the climate system. Science 298, 2173e2176.
Mueller, C.W., Rethemeyer, J., Kao-Kniffin, J., Loeppmann, S., Hinkel, K.M., GBockheim, J., 2015. Large amounts of labile organic carbon in permafrost soils ofnorthern Alaska. Global Change Biology 21, 2804e2817.
Natali, S.M., Schuur, E.A.G., Rubin, R.L., 2012. Increased plant productivity in Alaskantundra as a result of experimental warming of soil and permafrost. Journal ofEcology 100, 488e498.
Natali, S.M., Schuur, E.A.G., Trucco, C., Pries, C.E.H., Crummer, K.G., Lopez, A.F.B.,2011. Effects of experimental warming of air, soil and permafrost on carbonbalance in Alaskan tundra. Global Change Biology 17, 1394e1407.
Natali, S.M., Schuur, E.A.G., Webb, E.E., Pries, C.E.H., Crummer, K.G., 2014. Permafrostdegradation stimulates carbon loss from experimentally warmed tundra.Ecology 95, 602e608.
O'Donnell, J.A., Harden, J.W., McGuire, A.D., Romanovsky, V.E., 2011. Exploring thesensitivity of soil carbon dynamics to climate change, fire disturbance andpermafrost thaw in a black spruce ecosystem. Biogeosciences 8, 1367e1382.
Oksanen, J., Blanchet, F.G., Kindt, R., Legendre, P., Minchin, P.R., O'Hara, R.B.,Simpson, G.L., Solymos, P., Stevens, M.H.H., Wagner, H., 2012. Vegan: Commu-nity Ecology Package. R package version 2.0-3.
Paula, F.S., Rodrigues, J.L.M., Zhou, J., Wu, L., Mueller, R.C., Mirza, B.S.,Bohannan, B.J.M., Nuesslein, K., Deng, Y., Tiedje, J.M., Pellizari, V.H., 2014. Landuse change alters functional gene diversity, composition and abundance inAmazon forest soil microbial communities. Molecular Ecology 23, 2988e2999.
Pearson, R.G., Phillips, S.J., Loranty, M.M., Beck, P.S.A., Damoulas, T., Knight, S.J.,Goetz, S.J., 2013. Shifts in Arctic vegetation and associated feedbacks underclimate change. Nature Climate Change 3, 673e677.
Philippot, L., Spor, A., Henault, C., Bru, D., Bizouard, F., Jones, C.M., Sarr, A., Maron, P.-A., 2013. Loss in microbial diversity affects nitrogen cycling in soil. ISME Journal7, 1609e1619.
Pinheiro, J., Bates, D., DebRoy, S., Sarkar, D., Team, R.D.C., 2012. nlme: Linear andNonlinear Mixed Effects Models. R package version 3.1e105 ed.
Pries, C.E.H., Schuur, E.A.G., Crummer, K.G., 2012. Holocene carbon stocks and car-bon accumulation rates altered in soils undergoing permafrost thaw. Ecosys-tems 15.
Reichstein, M., Bednorz, F., Broll, G., Katterer, T., 2000. Temperature dependence ofcarbon mineralisation: conclusions from a long-term incubation of subalpinesoil samples. Soil Biology & Biochemistry 32, 947e958.
Rey, A., Jarvis, P., 2006. Modelling the effect of temperature on carbon minerali-zation rates across a network of European forest sites (FORCAST). Global ChangeBiology 12, 1894e1908.
Rinnan, R., Michelsen, A., Baath, E., 2011. Long-term warming of a subarctic heathdecreases soil bacterial community growth but has no effects on its tempera-ture adaptation. Applied Soil Ecology 47, 217e220.
Romanovsky, V.E., Drozdov, D.S., Oberman, N.G., Malkova, G.V., Kholodov, A.L.,Marchenko, S.S., Moskalenko, N.G., Sergeev, D.O., Ukraintseva, N.G.,Abramov, A.A., Gilichinsky, D.A., Vasiliev, A.A., 2010. Thermal state of permafrostin Russia. Permafrost and Periglacial Processes 21, 136e155.
Rousk, J., Baath, E., 2011. Growth of saprotrophic fungi and bacteria in soil. FemsMicrobiology Ecology 78, 17e30.
Salmon, V.G., Soucy, P., Mauritz, M., Celis, G., Natali, S.M., Mack, M.C., Schuur, E.A.G.,2016. Nitrogen availability increases in a tundra ecosystem during five years ofexperimental permafrost thaw. Global Change Biology. http://dx.doi.org/10.1111/gcb.13204.
Schadt, C.W., Martin, A.P., Lipson, D.A., Schmidt, S.K., 2003. Seasonal dynamics ofpreviously unknown fungal lineages in tundra soils. Science 301, 1359e1361.
Sch€adel, C., Schuur, E.A.G., Bracho, R., Elberling, B., Knoblauch, C., Lee, H., Luo, Y.,Shaver, G.R., Turetsky, M.R., 2014. Circumpolar assessment of permafrost Cquality and its vulnerability over time using long-term incubation data. GlobalChange Biology 20, 641e652.
Schaefer, K., Lantuit, H., Romanovsky, V.E., Schuur, E.A.G., Witt, R., 2014. The impactof the permafrost carbon feedback on global climate. Environmental ResearchLetters 9.
Schaefer, K., Zhang, T., Bruhwiler, L., Barrett, A.P., 2011. Amount and timing ofpermafrost carbon release in response to climate warming. Tellus Series B-Chemical and Physical Meteorology 63, 165e180.
Schimel, J.P., Mikan, C., 2005. Changing microbial substrate use in Arctic tundra soils
R. Bracho et al. / Soil Biology & Biochemistry 97 (2016) 1e1414
through a freeze-thaw cycle. Soil Biology & Biochemistry 37, 1411e1418.Schmidt, M.W.I., Torn, M.S., Abiven, S., Dittmar, T., Guggenberger, G., Janssens, I.A.,
Kleber, M., Koegel-Knabner, I., Lehmann, J., Manning, D.A.C., Nannipieri, P.,Rasse, D.P., Weiner, S., Trumbore, S.E., 2011. Persistence of soil organic matter asan ecosystem property. Nature 478, 49e56.
Schuur, E.A.G., Bockheim, J., Canadell, J.G., Euskirchen, E., Field, C.B.,Goryachkin, S.V., Hagemann, S., Kuhry, P., Lafleur, P.M., Lee, H., Mazhitova, G.,Nelson, F.E., Rinke, A., Romanovsky, V.E., Shiklomanov, N., Tarnocai, C.,Venevsky, S., Vogel, J.G., Zimov, S.A., 2008. Vulnerability of permafrost carbon toclimate change: implications for the global carbon cycle. Bioscience 58,701e714.
Schuur, E.A.G., Crummer, K.G., Vogel, J.G., Mack, M.C., 2007. Plant species compo-sition and productivity following permafrost thaw and thermokarst in Alaskantundra. Ecosystems 10, 280e292.
Schuur, E.A.G., McGuire, A.D., Sch€adel, C., Grosse, G., Harden, J.W., Hayes, D.J.,Hugelius, G., Koven, C.D., Kuhry, P., Lawrence, D.M., Natali, S.M., Olefeldt, D.,Romanovsky, V.E., Schaefer, K., Turetsky, M.R., Treat, C.C., Vonk, J.E., 2015.Climate change and the permafrost carbon feedback. Nature 520, 171e179.
Schuur, E.A.G., Vogel, J.G., Crummer, K.G., Lee, H., Sickman, J.O., Osterkamp, T.E.,2009. The effect of permafrost thaw on old carbon release and net carbon ex-change from tundra. Nature 459, 556e559.
Sharma, S., Szele, Z., Schilling, R., Munch, J.C., Schloter, M., 2006. Influence of freeze-thaw stress on the structure and function of microbial communities anddenitrifying populations in soil. Applied and Environmental Microbiology 72,2148e2154.
Sistla, S.A., Moore, J.C., Simpson, R.T., Gough, L., Shaver, G.R., Schimel, J.P., 2013.Long-term warming restructures Arctic tundra without changing net soil car-bon storage. Nature 497, 615e618.
Sistla, S.A., Rastetter, E.B., Schimel, J.P., 2014. Responses of a tundra system towarming using SCAMPS: a stoichiometrically coupled, acclimating microbe-plant-soil model. Ecological Monographs 84, 151e170.
Smith, S.L., Romanovsky, V.E., Lewkowicz, A.G., Burn, C.R., Allard, M., Clow, G.D.,Yoshikawa, K., Throop, J., 2010. Thermal state of permafrost in North America: acontribution to the international polar year. Permafrost and Periglacial Pro-cesses 21, 117e135.
Soil Survey Staff, 1999. Soil taxonomy: a basic system of soil classification formaking and interpreting soil surveys. U.S. Govt. Print. Off., Washington, D. C.
Steinweg, J.M., Plante, A.F., Conant, R.T., Paul, E.A., Tanaka, D.L., 2008. Patterns ofsubstrate utilization during long-term incubations at different temperatures.Soil Biology & Biochemistry 40, 2722e2728.
Streit, K., Hagedorn, F., Hiltbrunner, D., Portmann, M., Saurer, M., Buchmann, N.,Wild, B., Richter, A., Wipf, S., Siegwolf, R.T.W., 2014. Soil warming alters mi-crobial substrate use in alpine soils. Global Change Biology 20, 1327e1338.
Tape, K., Sturm, M., Racine, C., 2006. The evidence for shrub expansion in NorthernAlaska and the Pan-Arctic. Global Change Biology 12, 686e702.
Tarnocai, C., Canadell, J.G., Schuur, E.A.G., Kuhry, P., Mazhitova, G., Zimov, S., 2009.Soil organic carbon pools in the northern circumpolar permafrost region. GlobalBiogeochemical Cycles 23.
Trenberth, K.E., Jones, P.D., Ambenje, P., Bojariu, R., Easterling, D., Klein Tank, A.,Paker, D., Rahimzadeh, F., Rusticucci, M., Soden, B., Zhai, P., 2007. Observations:surface and atmospheric climate change. In: Solomon, S., Qin, D., Manning, M.,Chen, Z., Marquis, M., Averyt, K.B., Tignor, M., Miller, H.L. (Eds.), Climate Change2007: The Physical Science Basis. Contribution of Working Group I to the FourthAssessment Report of the Intergovernmental Panel on Climate Change. Cam-bridge University Press, Cambridge, United Kingdom and New York, NY, USA.
Trumbore, S.E., 1997. Potential responses of soil organic carbon to global environ-mental change. Proceedings of the National Academy of Sciences of the UnitedStates of America 94, 8284e8291.
Tu, Q., Yu, H., He, Z., Deng, Y., Wu, L., Van Nostrand, J.D., Zhou, A., Voordeckers, J.,Lee, Y.-J., Qin, Y., Hemme, C.L., Shi, Z., Xue, K., Yuan, T., Wang, A., Zhou, J., 2014.GeoChip 4: a functional gene-array-based high-throughput environmentaltechnology for microbial community analysis. Molecular Ecology Resources 14,914e928.
van Wijk, M.T., Williams, M., Gough, L., Hobbie, S.E., Shaver, G.R., 2003. Luxuryconsumption of soil nutrients: a possible competitive strategy in above-groundand below-ground biomass allocation and root morphology for slow-growingarctic vegetation? Journal of Ecology 91, 664e676.
Waldrop, M.P., Wickland, K.P., White III, R., Berhe, A.A., Harden, J.W.,Romanovsky, V.E., 2010. Molecular investigations into a globally importantcarbon pool: permafrost-protected carbon in Alaskan soils. Global ChangeBiology 16, 2543e2554.
Wallenstein, M.D., McMahon, S., Schimel, J., 2007. Bacterial and fungal communitystructure in Arctic tundra tussock and shrub soils. FEMS Microbiology Ecology59, 428e435.
Wang, H., He, Z., Lu, Z., Zhou, J., Van Nostrand, J.D., Xu, X., Zhang, Z., 2012. Geneticlinkage of soil carbon pools and microbial functions in subtropical freshwaterwetlands in response to experimental warming. Applied and EnvironmentalMicrobiology 78, 7652e7661.
Wetterstedt, J.A.M., Persson, T., Agren, G.I., 2010. Temperature sensitivity and sub-strate quality in soil organic matter decomposition: results of an incubationstudy with three substrates. Global Change Biology 16, 1806e1819.
Wickland, K.P., Neff, J.C., 2008. Decomposition of soil organic matter from borealblack spruce forest: environmental and chemical controls. Biogeochemistry 87,29e47.
Wu, L., Liu, X., Schadt, C.W., Zhou, J., 2006. Microarray-based analysis of subnano-gram quantities of microbial community DNAs by using whole-communitygenome amplification. Applied and Environmental Microbiology 72,4931e4941.
Xue, K., Wu, L., Deng, Y., He, Z., Van Nostrand, J., Robertson, P.G., Schmidt, T.M.,Zhou, J., 2013. Functional gene differences in soil microbial communities fromconventional, low-input, and organic farmlands. Applied and EnvironmentalMicrobiology 79, 1284e1292.
Yang, Y., Gao, Y., Wang, S., Xu, D., Yu, H., Wu, L., Lin, Q., Hu, Y., Li, X., He, Z., Deng, Y.,Zhou, J., 2014. The microbial gene diversity along an elevation gradient of theTibetan grassland. Isme Journal 8, 430e440.
Yergeau, E., Bokhorst, S., Kang, S., Zhou, J., Greer, C.W., Aerts, R., Kowalchuk, G.A.,2012. Shifts in soil microorganisms in response to warming are consistentacross a range of Antarctic environments. ISME Journal 6, 692e702.
Zhou, J., Deng, Y., Zhang, P., Xue, K., Liang, Y., Van Nostrand, J.D., Yang, Y., He, Z.,Wu, L., Stahl, D.A., Hazen, T.C., Tiedje, J.M., Arkin, A.P., 2014. Stochasticity, suc-cession, and environmental perturbations in a fluidic ecosystem. Proceedings ofthe National Academy of Sciences of the United States of America 111,E836eE845.
Zhou, J., Xue, K., Xie, J., Deng, Y., Wu, L., Cheng, X., Fei, S., Deng, S., He, Z., VanNostrand, J.D., Luo, Y., 2012. Microbial mediation of carbon-cycle feedbacks toclimate warming. Nature Climate Change 2, 106e110.
Zhou, J., He, Z., Van Nostrand, J.D., Wu, L.Y., Deng, Y., 2010. Applying GeoChipanalysis to disparate microbial communities. Microbes 5, 60e65.
Zhou, J.Z., Bruns, M.A., Tiedje, J.M., 1996. DNA recovery from soils of diversecomposition. Applied and Environmental Microbiology 62, 316e322.
Zhu, B., Cheng, W., 2011. Constant and diurnally-varying temperature regimes leadto different temperature sensitivities of soil organic carbon decomposition. SoilBiology & Biochemistry 43, 866e869.
Zuur, A.F., Ieno, E.N., Walker, N.J., Saveliev, A.A., Smith, G.M., 2010. Mixed EffectsModels and Extensions in Ecology with R. Springer, N.Y.