

Soil and Tissue Analysis for Corn Potassium Management
43
http://gmoanswers.com/sites/default/files/corntatt.jpg/ Soil and Tissue Analysis for Corn Potassium Management Robert O. Miller Tim J. Smith Colorado State University Fort Collins, CO Crop Smith Inc. Monticello, IL Craig Struve Soil View , Paulina, IA South Dakota Agronomy Conference Sioux Falls, SD December 11, 2019
Transcript of Soil and Tissue Analysis for Corn Potassium Management

http://gmoanswers.com/sites/default/files/corntatt.jpg/
Soil and Tissue Analysis for Corn Potassium Management
Robert O. Miller Tim J. Smith Colorado State University Fort Collins, CO Crop Smith Inc. Monticello, IL
Craig StruveSoil View, Paulina, IA
South Dakota Agronomy Conference Sioux Falls, SD December 11, 2019

My background
5th Generation farm family in eastern Nebraska – 500 acres corn and soybeans
Affiliate Professor Colorado State University. - Extension Soil Specialist UC Davis - Ph.D. Montana State University
Direct the Agricultural Laboratory Proficiency (ALP) Program, 138 labs. Conduct Regional Research in Soil Sampling, Soil Fertility, Lab Analysis and Crop Nutrition.
Miller, 2010

Nutrient management
Miller, 2011
An evaluation of nutrient availability based on the probability of crop yield response utilizing a laboratory chemical extraction. It has little to do with total nutrient uptake or crop requirement.
Soil
Soil testing
Tissue testingIs an assessment of leaf/plant nutrient concentration based on a standard norm and historical observations.
Gerwing, Gelderman and Bly, 2003
Miller et al, 2019

Overview
• Potassium trends: soil and tissue
• Corn K nutrition
• Field K studies
• STK, ear leaf K and Yield
• Fertility management
Miller et al, 2019

Changes in STK North America
Observations
http://soiltest.ipni.net/maps/Median
Miller et al, 2019

US Maize ProductionSoil test K – South Dakota
Miller et al, 2019
0
100
200
300
400
500
600
700
800
900
25 75 125 175 225 275 325 375 425 475 525
Freq
uenc
y
Soil Test K (ppm)
1 Source: Ag Lab Express, Sioux Falls, SD, 2019, 8740 samples.
STK ppm %
< 90 1.3< 120 11.2< 150 36.8< 175 62.4> 200 20.1
One third of sites have high probability of K response, based on LGU recommendations.
What Does Plant Analysis
Show
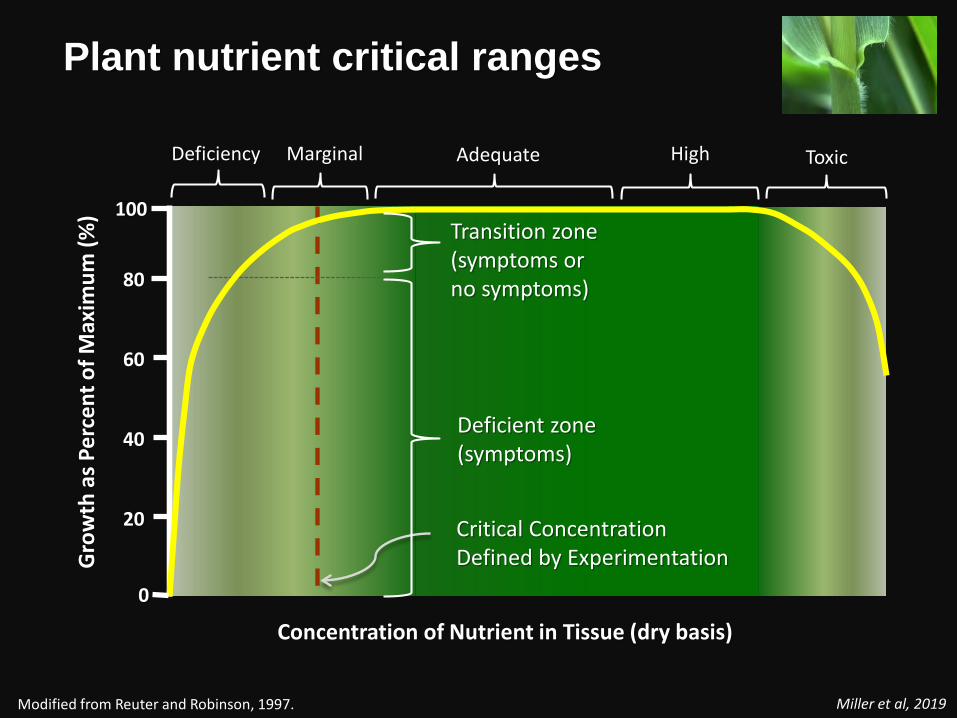
Concentration of Nutrient in Tissue (dry basis)
Gro
wth
as P
erce
nt o
f Max
imum
(%)
80
20
40
60
Deficient zone(symptoms)
Transition zone(symptoms or no symptoms)
Adequate Toxic
Critical ConcentrationDefined by Experimentation
0
Deficiency High Marginal
Modified from Reuter and Robinson, 1997.
Plant nutrient critical ranges
100
Miller et al, 2019

NutrientDeficiency threshold 1 Percent of samples deficient 2
< Less Than 2010 2011 2012 2013 2014 2015
N (%) < 2.90 9.7 8.9 41.3 18.0 23.6 51.4
P (%) < 0.30 8.3 12.1 49.2 15.3 8.1 36.5
K (%) < 1.90 41.5 30.8 67.0 32.0 36.2 16.7
S (%) < 0.16 0.5 0.2 8.1 2.4 3.7 30.1
1 Critical Nutrient level based on: https://www.extension.purdue.edu/extmedia/AY/AY-9-32.pdf Extension Bulletin E-2567 (New), July 1995
Ear leaf R1-R2, 3670 samples, six years
2 Corn ear leaf GS R1-R2.
37.4 %
25.5 %
Six year Average
Source: Betsy Bower, Ceres Solutions, Lafayette, IN
Corn nutrient deficiencies - Indiana
Miller et al, 2019

NutrientDeficiency threshold 1
Percent of samples deficient 2013 – 2015 2
< Less Than Nebraska Wisconsin Minnesota
N (%) < 2.90 42.9 31.1 40.4
P (%) < 0.30 28.6 24.4 31.5
K (%) < 1.90 32.5 53.8 54.5
S (%) < 0.16 16.7 3.6 11.7
Zn (ppm) < 20 49.3 7.0 51.1
1 Critical Nutrient level based on: https://www.extension.purdue.edu/extmedia/AY/AY-9-32.pdf Extension Bulletin E-2567 (New), July 1995
Ear leaf R1-R2, 25,432 samples, three years, upper Midwest
2 Corn leaf GS R1-R2.
46.9 %
38.1 %
Three year Average
Corn nutrient deficiencies
Miller et al, 2019

Corn K fertility
You can’t resolve a problem unless you know its cause.
Robert Lustig UCSF, CA
SoilFertility
Grain Yield
CornNutrition
Root Cause Analysis
Miller et al, 2019

Plant potassium nutrition
Crop Demand Soil Supply
• Plant Nutrition
• Phenology of Uptake
• Plant Population
• Soil Chemistry
• Nutrient Transport
• Stratification
Miller et al, 2019

0
50
100
150
200
250
300
350
K lb
s/ac
GDD
Corn Yield: 314 bu/ac
Potassium accumulation: Karlen et. al. 1988 1
1 Calculated from: Karlen and Flannery. 1988. Agron J. 80:232-242.
*above ground
68% of Total Uptake
Miller et al, 2019
Total lbs/ac
N 348K 330P 62S 32

-2
0
2
4
6
8
10
12
14
Days After Planting
K lb
s/ac
/day
K UptakePeaks
*above ground
1 Calculated from: Karlen and Flannery. 1988. Agron J. 80:232-242.
Corn potassium accumulation rate 1
www.udel.edu
Miller et al, 2019
lbs/ac/day
N 7 - 8
P 0.9 – 1.1
K 13 – 15
Corn Yield: 314 bu/ac

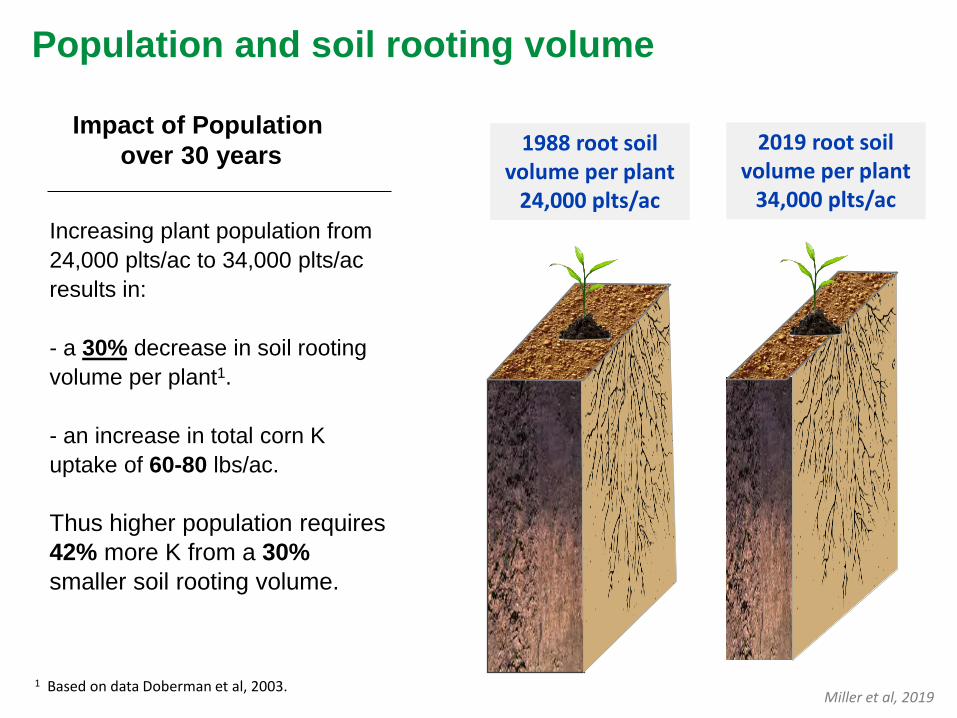
Population and soil rooting volume
1988 root soil volume per plant
24,000 plts/ac
2019 root soil volume per plant
34,000 plts/acIncreasing plant population from 24,000 plts/ac to 34,000 plts/ac results in:
- a 30% decrease in soil rooting volume per plant1.
- an increase in total corn K uptake of 60-80 lbs/ac.
Thus higher population requires 42% more K from a 30%smaller soil rooting volume.
Impact of Population over 30 years
1 Based on data Doberman et al, 2003. Miller et al, 2019

Plant potassium nutrition
Crop Demand Soil Supply
• Plant Nutrition
• Plant Population
• Phenology of Uptake
• Soil Chemistry
• Nutrient Transport
• Stratification
Miller et al, 2019
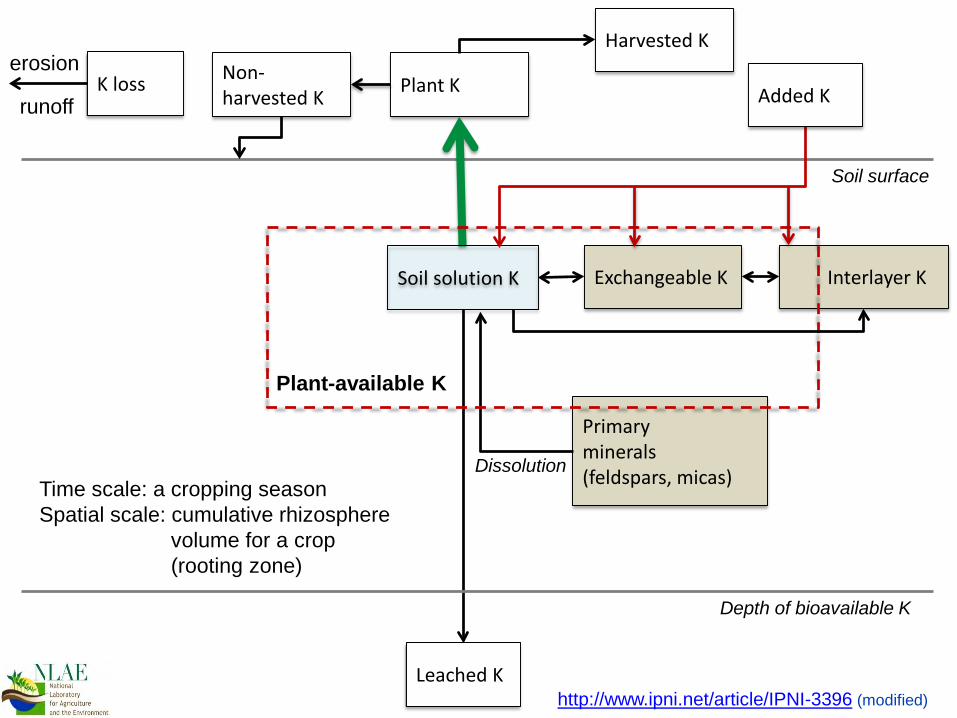
Non-harvested K Plant K
Interlayer KExchangeable K
Soil surface
Leached K
Primaryminerals(feldspars, micas)
Soil solution K
Depth of bioavailable K
DissolutionTime scale: a cropping seasonSpatial scale: cumulative rhizosphere
volume for a crop(rooting zone)
K losserosion
runoff
Harvested K
Plant-available K
http://www.ipni.net/article/IPNI-3396 (modified)
Added K

Soil root zone K transport
Root Interception
Mass Flow
Diffusion
Direct root contact with soil K, 1-2% of total uptake.
Soil solution K acquired through mass flow of soil water to plant root, 10-20% of total.
K movement down the concentration gradient from bulk soil to root surface, explains 70-80% of uptake. Decreases with lower soil moisture.
1 Jungk and Claassen, 1986. Z. Pflanzenernaehr. Bodenk
http://plantsinaction.science.uq.edu.au/sites/plantsinaction.science.uq.edu.au/files/4.1-Ch-Fig-4.3.png
Miller et al, 2019

STK root zone stratification
Miller, 2015
Decreased tillage has resulted in consistent STK stratification at surface, 96% of sites.
Standard soil sampling, provides no information on root zone K stratification.
0-2” 242
2-4” 126
4-6” 78
6-8” 48
8-12” 32
FRI-15 Depth STK (ppm)
1 Source: KRx research site Hubbard, IA, 2014.
KRx Site STK (ppm) 2
0 - 8” 2 - 8”
Monroe, SD 224 136
O’Neil, NE 84 60
Pipestone, MN 182 982 KRx research sites 2016-2019, limited tillage.
Miller et al, 2019

Impact on corn K nutrition
Miller, 2015
A corn plant population of 34,000 with a yield goal of 250 bu/ac will have a K uptake1 of 280 lbs/ac, of which 190 lbs is accumulated during GS V4-V12.
Thus soil K diffusion (estimated 80%) must provide a max 7 - 9 lbs/ac/day from a stratified root zone. Limited soil moisture reduces K diffusion, and uptake.
2 Calculation based on data of Karlen et al (1987) and estimates of soil diffusive supply.
-2
0
2
4
6
8
10
12
14
Miller et al, 2019
Miller, et al., 2019
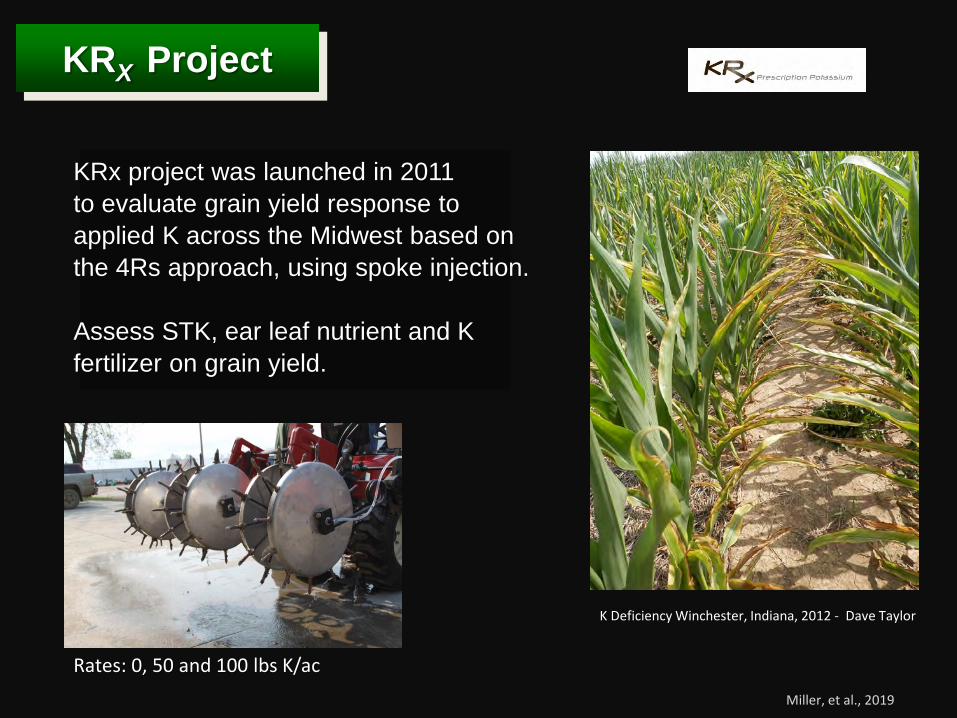
KRX Project
KRx project was launched in 2011 to evaluate grain yield response to applied K across the Midwest based on the 4Rs approach, using spoke injection.
Assess STK, ear leaf nutrient and K fertilizer on grain yield.
K Deficiency Winchester, Indiana, 2012 - Dave Taylor
Rates: 0, 50 and 100 lbs K/ac

KRX corn yield response
Site STK Check +K 1 IncreaseCty / State ppm bu/ac
Merrick, NE 151 169 170 + 1Cherokee, IA 290 218 227 +9Piatt, IL 305 141 154 + 13*Sullivan, IN 116 94 110 + 16*Warsaw, IN 198 73 67 - 6
KRx project results 2012, NE, IA, IL and IN. Applied V3-V5 rate 50 lbs K / ac
Check
+ K
K effect on ear size
K increased yield on a soil STK > 300 ppm ?
134
1641 Yield significant at the 0.10 level, corn 15.5% moisture.
Miller et al, 2019

KRX STK vs corn yield – five years
STK 75 to 150 - 56% STK 150 to 200 - 50%STK 200 to 300 - 36%STK 300 to 600 - 14%
Probability of yield response
A K application1 improved grain yield at 33 of 82 locations over 5 years.
Yield increase8 - 33 bu/ac
1 Yield increase to side dress application of 50 lbs/ac K at V3-V5.
Drought sites, yield < 140 bu/ac-15
-10
-5
0
5
10
15
20
25
30
35
40
0 100 200 300 400 500 600
Incr
ease
d Yi
eld
(bu/
ac)
STK (ppm)
20112012201320142015
Miller et al, 2019

Impact of applied K on ear leaf K
Number of sites where ear leaves shown a significant increase in leaf K with an application1 of 100 lbs/ac K side dressed at GS V3-V4.
1 K applied as KCl, KSO4 ,or K acetate using spoke wheel applicator, 3 inches off row at 3 inch depth.
90% of sites show no increase of ear leaf K with applied K fertilizer.
Question did fertilizer correct a corn K deficiency?
Year SitesNumber of sites
with an increase of ear leaf K from fertilizer
2011 24 1 2012 22 3 2013 18 2
2014 16 2
2015 8 0
Miller et al, 2019

Questions
Does soil test K influence yield? Ear leaf K?
Does ear leaf K impact yield?
Due Soil factors (pH, SOM. CEC etc.) effect leaf K nutrition?
STK vs corn yield
ww
w.h
ear.o
rg/s
tarr
/imag
es/im
age/
?q=0
8091
4-99
18&
o=pl
ants
Miller et al, 2019

2011-2015, 82 site studies were conducted in grower corn fields across 8 states. Check plot data: soil (pH, P, K, Ca, Mg, SOM, CEC - 0-8”); ear leaf R1-R2 nutrients1; population, grain yield; replicated. 2016 - 2019, 116 observation sites were added. Cluster analysis and regression modeling.
Sites diverse in soil types, properties, hybrids, management, crop history, irrigation and weather.
KRX Research database
1 Lab Analysis: Ward Labs, LGI, Solum Laboratory and Sure Tech Labs.
Minimum Maximum
pH 4.9 7.6STK ppm 71 605SOM % 1.1 5.4CEC cmo/kg 2.6 32.0
15 ft
40 ft
Check plot diagramFour per site
Ear LeafTissuen = 30
Grain HarvestArea
1 Data 2016-2019 sites, eight states.
Miller et al, 2019

2014, 16 observation sites, 5 states. Data collected on STK, ear leaf nutrients and yield, STK sorted low to high.
1 Cluster analysis contrasting five lowest sites and five highest sites for Mehlich 3 K 0-8” response variable grain yield, 8 reps per site.
ww
w.h
ear.o
rg/s
tarr
/imag
es/im
age/
?q=0
8091
4-99
18&
o=pl
antsCluster analysis: STK vs grain yield
STK (ppm) Yield (bu/ac)90 161
100 234116 222122 162126 208128 131139 174141 183146 182151 188158 187163 128186 199187 237187 219189 235
Lowest
Highest
STK Yield
Mean 111 197Stdev 16 34
STK Yield
Mean 182 204Stdev 11 45
STK Cluster
1 2
Yiel
d (b
u/ac
)
120
140
160
180
200
220
240
260
Low High
111mg kg-1
182mg kg-1
2014 Soil STK
Box Whisker Plot
mean
10th perc
90th perc
median
75th perc
25th perc
Miller et al, 2019
STK Cluster
1 2
Yie
ld (b
u/ac
)
160
180
200
220
240
260
280
300
Low High
STK Cluster
1 2
Yie
ld (b
u/ac
)
100
120
140
160
180
200
220
240
260
Low High
STK Cluster
1 2
Yie
ld (b
u/ac
)
80
100
120
140
160
180
200
220
240
260
Low High
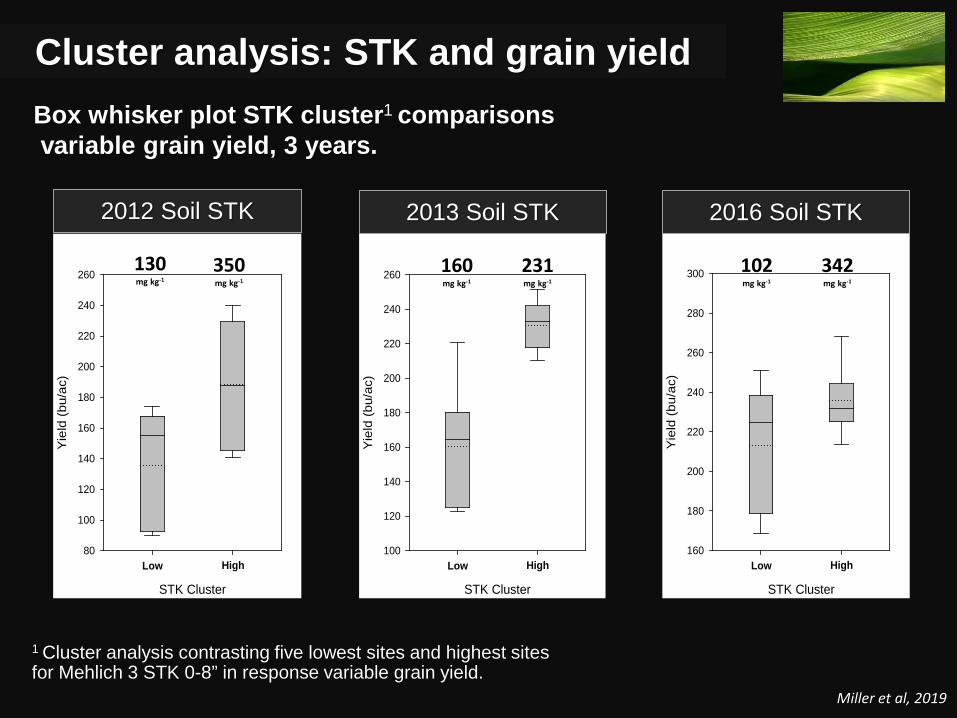
Box whisker plot STK cluster1 comparisonsvariable grain yield, 3 years.
1 Cluster analysis contrasting five lowest sites and highest sites for Mehlich 3 STK 0-8” in response variable grain yield.
160mg kg-1
231mg kg-1
2013 Soil STK2012 Soil STK
130mg kg-1
350mg kg-1
Cluster analysis: STK and grain yield
2016 Soil STK
102mg kg-1
342mg kg-1
Miller et al, 2019

Soil STK Cluster1 2
Leaf
K (%
)
1.2
1.4
1.6
1.8
2.0
2.2
2.4
2.6
Low High
Soil STK Cluster1 2
Leaf
K (%
)
1.2
1.4
1.6
1.8
2.0
2.2
2.4
2.6
2.8
3.0
Low High
Soil STK Cluster1 2
Leaf
K (%
)
1.2
1.4
1.6
1.8
2.0
2.2
2.4
2.6
2.8
3.0
3.2
3.4
Low High
Cluster analysis: STK vs ear leaf K Box whisker plot soil STK cluster1 comparisons forvariable ear leaf K for three years.
1 Cluster analysis contrasting five lowest sites and highest sites for Mehlich 3 K 0-8” response variable corn ear leaf K R1-R2.
102mg kg-1
342mg kg-1
2016 Soil STK
ww
w.h
ear.o
rg/s
tarr
/imag
es/im
age/
?q=0
8091
4-99
18&
o=pl
ants
2011 Soil STK
134mg kg-1
331mg kg-1
111mg kg-1
182mg kg-1
2014 Soil STK
Miller et al, 2019

Leaf N Cluster1 2
Yie
ld (b
u/ac
)
120
140
160
180
200
220
240
260
Low High
Leaf K Cluster
1 2
Yie
ld (b
u/ac
)
120
140
160
180
200
220
240
260
Low High
2014 Ear leaf nutrients cluster analysis
Box whisker plot nutrient cluster1 comparisonsVariable grain yield – 2014, 16 sites, cluster size 5 sites each
1 Cluster analysis based on five lowest sites and highest sites for each test parameter (Leaf N, K and K:Mg), response variable grain yield, 8 reps per site.
Leaf K
1.60 %
2.17%
Leaf N
ww
w.h
ear.o
rg/s
tarr
/imag
es/im
age/
?q=0
8091
4-99
18&
o=pl
ants
2.52%
3.30%
Leaf K:Mg
0.22 %
0.38 %
Leaf K:Mg Ratio Clusters
1 2
Yie
ld (b
u/ac
)
120
140
160
180
200
220
240
Low High
4.3 11.1
Miller et al, 2019

R² = 0.992
0.00
0.10
0.20
0.30
0.40
0.50
1.0 1.5 2.0 2.5 3.0
Mea
n Ea
r Lea
f Mg
(%)
Ear Leaf K (%) 1
Stdev
Corn ear leaf K vs Mg
1 Data: Betsey Bower Ceres Solutions, IN, 2011 ear leaf GS R1-R2, 851 samples, data sorted by K, uncertainty K ± 0.05%.
An extensive six year survey of Midwest corn ear leaves shows as ear leaf K decreases below 2.0 %, ear leaf Mg increases exponentially.
K deficiencies during stalk development results in supra–optimal ear leaf Mg and a low K:Mg ratio, < 8, normal is 10 - 14.
K:Mg ratios concur with those of Elwali et al. (1985) Agron J. for corn in the southeastern US and decreased grain yields.
Miller et al, 2019

Year Mean Ear Leaf Low K cluster 1
Mean Ear Leaf High K cluster
K % K:Mg K % K:Mg
2011 1.77 * 5.9 * 2.64 11.1
2012 1.52 3.2 * 1.91 6.7
2013 1.67 3.0 * 1.95 8.3
2014 1.60 * 4.8 * 2.17 10.2
2015 - - - -
2016 2 1.47 * 3.6 * 2.93 14.21 Check plot clusters comparisons five sites in 2011, 2012 and 2014; four in 2013; and eight 2016. Insufficient data 2015, five sites. * values are significant at the 0.05 level.
Summary: Ear leaf K cluster analysis131 sites, 2011 – 2016 cluster mean comparisons
45.2 Five year average
Cluster comparisons show mean leaf K and K:Mg ratios are different.
Cluster yield differences were consistent.
2 2016 Data based on 46 sites, seven states.
Yield Difference
Bu/ac
40.5
58.2 *
34.6
49.5 *
-
44.1 *
Miller et al, 2019

Soil SOM-LOI1 2
Leaf
K (%
)
1.2
1.4
1.6
1.8
2.0
2.2
2.4
2.6
2.8
3.0
3.2
3.4
Low HighSoil CEC
1 2
Leaf
K (%
)
1.2
1.4
1.6
1.8
2.0
2.2
2.4
2.6
2.8
3.0
3.2
3.4
Low High
Soil K Base Sat.1 2
Leaf
K (%
)
1.2
1.4
1.6
1.8
2.0
2.2
2.4
2.6
2.8
3.0
3.2
3.4
Low High
Cluster analysis soil properties 2016Box whisker plot soil test parameters1 comparisonsVariable ear leaf K, cluster size - 8 sites each
1 Cluster analysis contrasting eight lowest sites and highest sites for soil variables 0-8” depth, response variable ear leaf K R1-R2. (CEC by summation).
2.01 % 4.53 %
SOM-LOI 2 CEC
8.0cmol kg-1
24.6cmol kg-1
K Base Sat.
1.2 % 6.8 %
http://corn.agronomy.w
isc.edu/Managem
ent/L011.aspx
2 Regression of CEC = 5.6 x (SOM-LOI) - 1.0, R2 0.864
mean meanmean meanmean mean
Miller et al, 2019

Soil K Base Sat. cluster analysis
Variable1 Soil K Base Saturation (%)
Low Cluster High Cluster
Mean Mean
K Base Sat (%) 1.2 6.8 *
CEC (cmol kg-1) 23.4 11.7 *SOM (%) 4.28 2.40 *Soil K:Mg (meq) 0.05 0.43 *
K Base Sat. cluster comparisons - 2016 Sites
1 Forty-six sites across seven states, K base sat cluster size eight sites each.2 * Mean values are significant at the 0.05 level.
Leaf K (%) 1.50 2.62 *Leaf K:Mg 4.6 13.2 *Stalk K (%) 0.97 2.51 *
Grain (bu/ac) 202 240
Cluster analysis of soil K Base Sat. shows significant differences for soil CEC, SOM, K:Mg ratio.
Low soil K Base Sat. was associated with low leaf K, low K:Mg, low stalk K and lower grain yields.
Grain yield, although associated with higher leaf K, is a function of factors impacting grain fill (moisture, N, Pest, Temp etc).
http://extension.missouri.edu/explore/im
ages/ipm1007crabgrasslarge01.jpg
Miller et al, 2019

Soil K Base Sat. vs STK
Soils with STK of 190 ppm with a CEC > 30 cmol/kg are highly probable to have ear leaf K deficiency, < 2 %.
Whereas, soils with 90 ppm K with CEC of 5-6 cmol/kg have low probability of ear leaf K deficient, < 2 %.
< 1.5% 1.5 – 2.0%2.0 – 3.0%
3.0 – 5.0%
> 5.0%
1 2016, 46 field sites, each K base sat range represent 7-9 observations sites, soil sample 0-8” depth collected spring 2016, ear leaves collected at GS R1-R2.
Miller et al, 2019

Soil K Base Sat. Ranges 2016
Soil K Base Sat. Range Parameter
(%) Percent of ear leaves < 2.0% K
Average grain Yield (bu/ac)
< 1.5 100 % 2051.5 – 2.0 70 % 2222.0 – 3.0 54 % 2363.0 – 5.0 33 % 244
> 5.0 12 % 2451 2016, 46 field sites, each K base sat range represent 7-9 observations sites, soil sample 0-8” depth collected spring 2016, ear leaves collected at GS R1-R2.
Cluster analysis of soil K Base Sat. shows significant impact on ear leaf K concentration and average grain yield.
Note data is diverse as it represents 46 observations collected across seven states ranging in soil types, weather, management and hybrids.
Miller et al, 2019

STK does not address corn K availability, K Base Sat is a better estimator.
Soil K Base Saturation 2017
TestParameter
STK (ppm)
CEC (cmol/kg)
K Base Sat (%)
Leaf N (%)
Leaf K (%)
Leaf K:Mg
Stalk K (%)
Yield (bu/ac)
KRx Data 2017: Each site four replications, ear leaf samples collected R1-R2. Plant populations and corn maturity identical. All parameters except leaf N significantly different at 0.05 level.
Miller et al, 2019
Leaf K:Mg ratio and stalk K are highly associated with K base saturation. Kana site ear leaf K < 2.0% and K:Mg < 8.0.
Yield difference 28.1 bu/ac
O’ NeilNebraska
682.66.82.452.5416.1 1.48
248.3
SteenMinnesota
161 32.2 1.22.381.482.7 0.42
220.2

Management tools
Soil analysis Assess K Base Sat: < 2.0 %; K:Mg < 0.12
Tissue analysis - nutritionEar leaf K < 2.0 % and K:Mg < 8, K deficient. Track four grid points/field, assess Mgt.
Stalk analysisStalk K < 1.5%, corn K deficiency.
SoilFertility
Grain Yield
CornNutrition
Root Cause Analysis
Miller et al, 2019
Ag Lab Express data, Sioux Falls, SD, of 8740 samples in 2019 indicates KBase < 2.0 % occurred on 59 % of soils tested.

Corn potassium nutrition
Drivers of crop K demand
Factors limiting soil K supply
Higher plant populations
Increased nitrogen fertility
High air temperatures, during V4-R1, mean daily > 85F
Low soil K Base Sat.
Low sub soil STK, 2-8”
Limited soil moisture, > 2 bar, ET > Precip.
Miller et al, 2019
A 50% soil moisture deficit during GS V5-V10 will decrease K diffusion > 80%, facilitating Mg uptake.

Soil Analysis
K Base< 2.5%
No Yes
High Probability of Leaf K
Deficiency
- Avoid K surface broadcast on no till. Not effective.
- Broadcast and incorporation, required.
- Deep banding, 2x2, 2x4 at 50-100 lbs K/ac.
- Side dress shallow banding, 50 lbs K/ac
- Irrigation, 10-15 lbs K /ac per circle, GS V4-V12.
Annually assess ear leaf nutrition and fertilizer effectiveness with tissue testing, four grid points per field.
Cost < $0.60/ac for a 160 ac field
Fertility recommendations
Miller et al, 2019

Thanks to our Grower Cooperators, Students and Staff who have assisted with this project.
Research continues in 2020
Miller et al, 2019

Sponsors
Mike Lindaman, LGI Lab, IA retiredTom McGraw, MISS, MN retiredBetsey Bower, Ceres Solutions, INLarry May, Lincoln, NERandy Brown, Winfield United, NEGreg Binford, Wilbur Ellis, INJodi Jaynes, Sure-Tech Laboratories, INNick Koshnick, Climate Corp, CADave Mowers, Consulting, ILRobert Beck, Winfield United, IL retiredTommy Roach, Nachurs, TXTim Eyrich, Agri-Trend, SCRay McDonald, Can Grow, ONScott Fleming, Rock River Labs, WI
Acknowledgements


![Formation muconaldehyde, of An · Carbonyl-free benzene, phenol, corn oil, HPLC grade monobasic potassium phosphate, and sodium dithionate wereobtainedfromFisher. [14C]Benzenewasobtainedfrom](https://static.fdocuments.net/doc/165x107/606f0f3463be031cfe1f3ca1/formation-muconaldehyde-of-an-carbonyl-free-benzene-phenol-corn-oil-hplc-grade.jpg)