
Software Testing [email protected]. Content Essence Terminology Classification –Unit,...
173
Software Testing [email protected]
-
Upload
eileen-king -
Category
Documents
-
view
223 -
download
0
Transcript of Software Testing [email protected]. Content Essence Terminology Classification –Unit,...
Content
• Essence• Terminology• Classification
– Unit, System …– BlackBox, WhiteBox
• Debugging• IEEE Standards

Definition
• Glen Myers– Testing is the process of executing a
program with the intent of finding errors

Objective explained
• Paul Jorgensen– Testing is obviously concerned with
errors, faults, failures and incidents. A test is the act of exercising software with test cases with an objective of• Finding failure• Demonstrate correct execution

A Testing Life Cycle
RequirementSpecs
Design
Coding
Testing
Fault Resolution
FaultIsolation
FaultClassification
Error
Fault
Fault
Fault
Error
Error
incident
Fix

Terminology• Error
– Represents mistakes made by people• Fault
– Is result of error. May be categorized as• Fault of Commission – we enter something
into representation that is incorrect• Fault of Omission – Designer can make error
of omission, the resulting fault is that something is missing that should have been present in the representation
Cont…• Failure
– Occurs when fault executes. • Incident
– Behavior of fault. An incident is the symptom(s) associated with a failure that alerts user to the occurrence of a failure
• Test case– Associated with program behavior. It
carries set of input and list of expected output
Cont…
• Verification– Process of determining whether
output of one phase of development conforms to its previous phase.
• Validation– Process of determining whether a
fully developed system conforms to its SRS document
Verification versus Validation
• Verification is concerned with phase containment of errors
• Validation is concerned about the final product to be error free

Relationship – program behaviors
Program Behaviors
Specified(expected)Behavior
Programmed(observed)BehaviorFault
OfOmission
FaultOfCommission
Correct portion

Classification of Test
• There are two levels of classification– One distinguishes at granularity level
• Unit level• System level• Integration level
– Other classification (mostly for unit level) is based on methodologies• Black box (Functional) Testing• White box (Structural) Testing
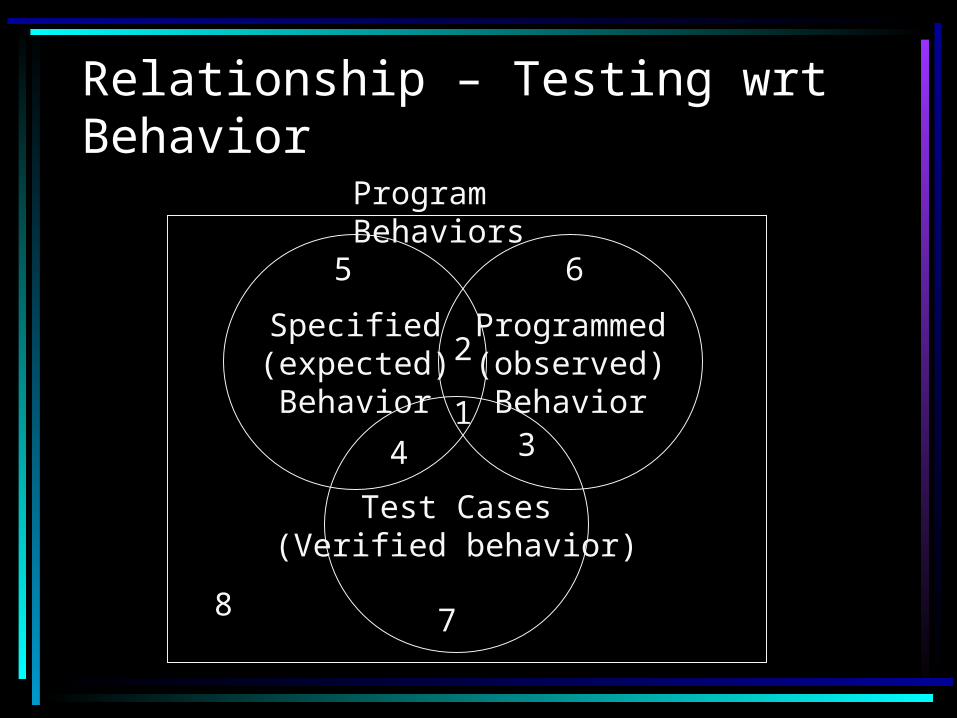
Relationship – Testing wrt Behavior
Program Behaviors
Specified(expected)Behavior
Programmed(observed)Behavior
Test Cases(Verified behavior)
8 7
5 6
14 3
2

Cont…
• 2, 5– Specified behavior that are not tested
• 1, 4– Specified behavior that are tested
• 3, 7– Test cases corresponding to
unspecified behavior

Cont…
• 2, 6– Programmed behavior that are not
tested
• 1, 3– Programmed behavior that are tested
• 4, 7– Test cases corresponding to un-
programmed behaviors

Inferences
• If there are specified behaviors for which there are no test cases, the testing is incomplete
• If there are test cases that correspond to unspecified behaviors– Either such test cases are unwarranted– Specification is deficient (also implies
that testers should participate in specification and design reviews)

Test methodologies
• Functional (Black box) inspects specified behavior
• Structural (White box) inspects programmed behavior

Functional Test cases
Specified Programmed
TestCases

Structural Test cases
Specified Programmed
TestCases

When to use what• Few set of guidelines available• A logical approach could be
– Prepare functional test cases as part of specification. However they could be used only after unit and/or system is available.
– Preparation of Structural test cases could be part of implementation/code phase.
– Unit, Integration and System testing are performed in order.

Unit testing – essence
• Applicable to modular design– Unit testing inspects individual
modules
• Locate error in smaller region– In an integrated system, it may not be
easier to determine which module has caused fault
– Reduces debugging efforts

Test cases and Test suites
• Test case is a triplet [I, S, O] where– I is input data– S is state of system at which data will
be input– O is the expected output
• Test suite is set of all test cases• Test cases are not randomly
selected. Instead even they need to be designed.

Need for designing test cases
• Almost every non-trivial system has an extremely large input data domain thereby making exhaustive testing impractical
• If randomly selected then test case may loose significance since it may expose an already detected error by some other test case

Design of test cases
• Number of test cases do not determine the effectiveness
• To detect error in following codeif(x>y) max = x; else max = x;
• {(x=3, y=2); (x=2, y=3)} will suffice• {(x=3, y=2); (x=4, y=3); (x=5, y = 1)}
will falter• Each test case should detect different
errors

Black box testing
• Equivalence class partitioning• Boundary value analysis• Comparison testing• Orthogonal array testing• Decision Table based testing
– Cause Effect Graph

Equivalence Class Partitioning
• Input values to a program are partitioned into equivalence classes.
• Partitioning is done such that:– program behaves in similar ways
to every input value belonging to an equivalence class.
Why define equivalence classes?
• Test the code with just one representative value from each equivalence class: – as good as testing using any other
values from the equivalence classes.
Equivalence Class Partitioning
• How do you determine the equivalence classes?– examine the input data. – few general guidelines for
determining the equivalence classes can be given

Equivalence Class Partitioning
• If the input data to the program is specified by a range of values:– e.g. numbers between 1 to 5000. – one valid and two invalid equivalence
classes are defined.
1 5000

Equivalence Class Partitioning
• If input is an enumerated set of values: – e.g. {a,b,c}– one equivalence class for valid input
values – another equivalence class for invalid
input values should be defined.

Example
• A program reads an input value in the range of 1 and 5000:– computes the square root of the input
number
SQRT

Example (cont.)
• There are three equivalence classes: – the set of negative integers, – set of integers in the range of 1 and
5000, – integers larger than 5000.
1 5000
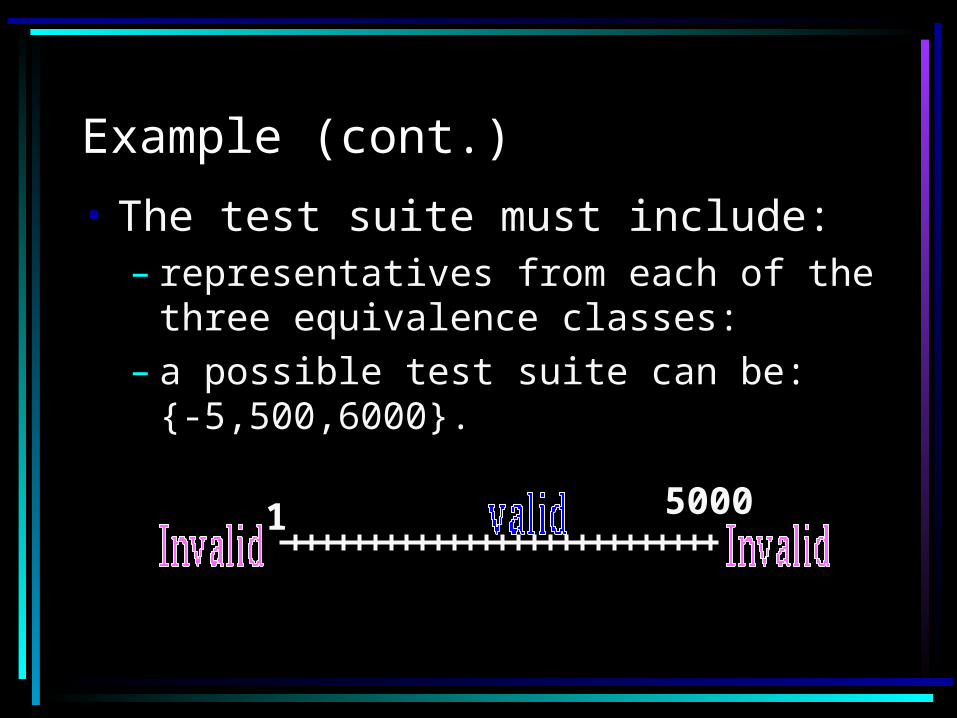
Example (cont.)
• The test suite must include:– representatives from each of the
three equivalence classes:– a possible test suite can be:
{-5,500,6000}.
1 5000

Boundary Value Analysis
• Some typical programming errors occur: – at boundaries of equivalence classes – might be purely due to psychological
factors.
• Programmers often fail to see:– special processing required at the
boundaries of equivalence classes.

Boundary Value Analysis
• Programmers may improperly use < instead of <=
• Boundary value analysis:– select test cases at the boundaries of
different equivalence classes.

Example
• For a function that computes the square root of an integer in the range of 1 and 5000:– test cases must include the values:
{0,1,5000,5001}.
1 5000
Cause and Effect Graphs
• Testing would be a lot easier:– if we could automatically generate
test cases from requirements.
• Work done at IBM:– Can requirements specifications be
systematically used to design functional test cases?
Cause and Effect Graphs
• Examine the requirements:– restate them as logical relation
between inputs and outputs.– The result is a Boolean graph
representing the relationships • called a cause-effect graph.

Cause and Effect Graphs
• Convert the graph to a decision table:– each column of the decision table
corresponds to a test case for functional testing.

Steps to create cause-effect graph
• Study the functional requirements.• Mark and number all causes and
effects.• Numbered causes and effects:
– become nodes of the graph.

Steps to create cause-effect graph
• Draw causes on the LHS• Draw effects on the RHS• Draw logical relationship between
causes and effects – as edges in the graph.
• Extra nodes can be added – to simplify the graph

Drawing Cause-Effect Graphs
A B
If A then B
AC
If (A and B)then C
B

Drawing Cause-Effect Graphs
AC
If (A or B) then C
B
AC
If (not(A and B)) then C
B~

Drawing Cause-Effect Graphs
AC
If (not (A or B))then C
B
A B
If (not A) then B
~
~
Example
• Refer “On the Experience of Using Cause-Effect Graphs for Software Specification and Test Generation” by Amit Paradkar. ACM Publications
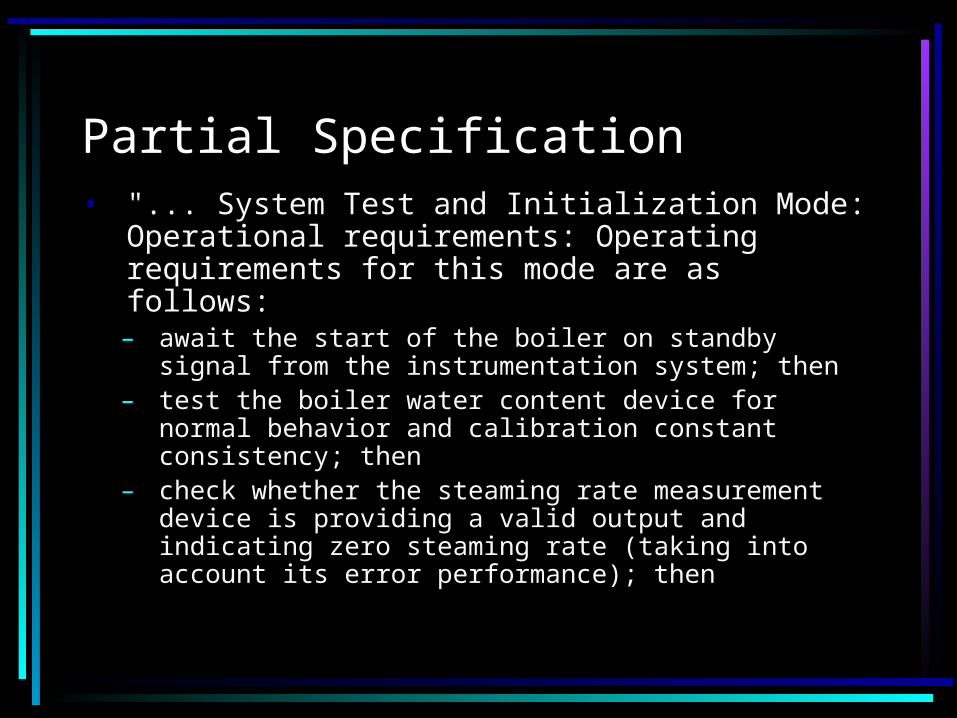
Partial Specification• "... System Test and Initialization Mode:
Operational requirements: Operating requirements for this mode are as follows:– await the start of the boiler on standby signal
from the instrumentation system; then– test the boiler water content device for normal
behavior and calibration constant consistency; then
– check whether the steaming rate measurement device is providing a valid output and indicating zero steaming rate (taking into account its error performance); then
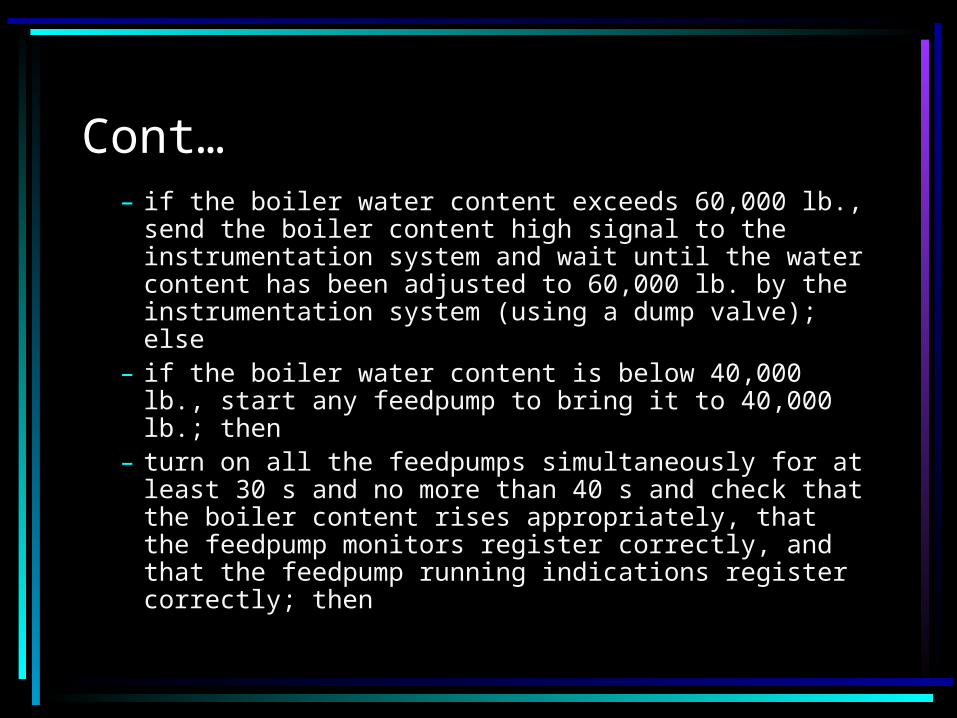
Cont…– if the boiler water content exceeds 60,000 lb.,
send the boiler content high signal to the instrumentation system and wait until the water content has been adjusted to 60,000 lb. by the instrumentation system (using a dump valve); else
– if the boiler water content is below 40,000 lb., start any feedpump to bring it to 40,000 lb.; then
– turn on all the feedpumps simultaneously for at least 30 s and no more than 40 s and check that the boiler content rises appropriately, that the feedpump monitors register correctly, and that the feedpump running indications register correctly; then

Cont…
– turn feedpumps off and on if needed to determine which feedpumps, feedpump monitors, or feedpump running indications are faulty.
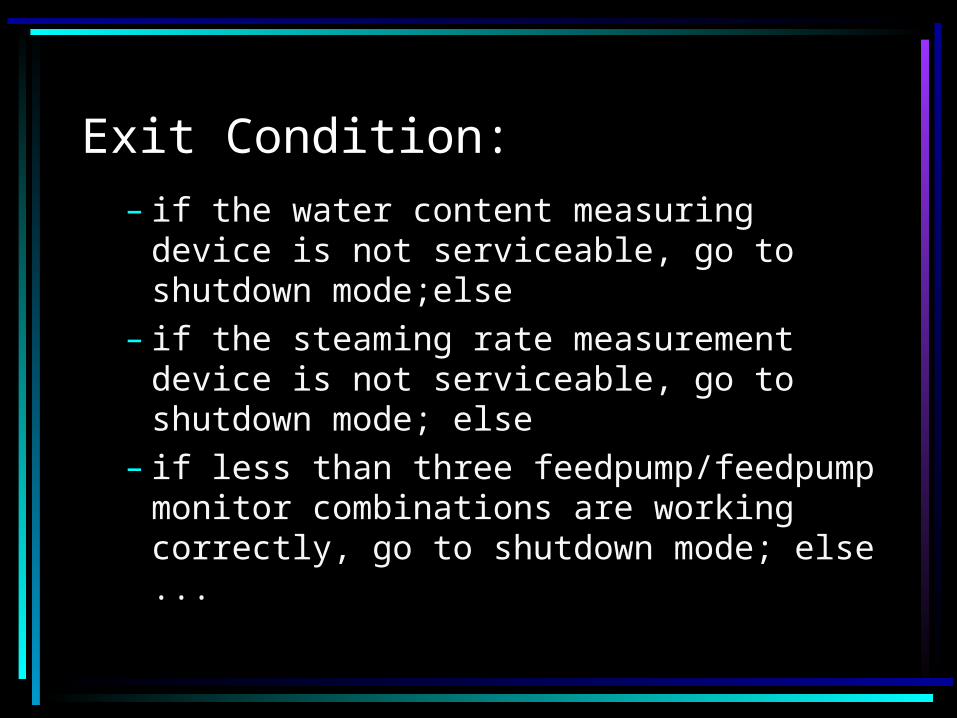
Exit Condition:– if the water content measuring device is
not serviceable, go to shutdown mode;else
– if the steaming rate measurement device is not serviceable, go to shutdown mode; else
– if less than three feedpump/feedpump monitor combinations are working correctly, go to shutdown mode; else...

causes:• C221 - externally initiated (Either
Operator or Instrumentation system)• C220 - internally initiated• C202 - operator initiated• C203 - instrumentation system initiated• C201 - bad startup• C200 - operational failure• C197 - confirmed keystroke entry• C198 - confirmed "shutnow" message

Cont…• C196 - multiple pumps failure (more
than one)• C195 - water level meter failure during
startup• C194 - steam rate meter failure during
startup• C193 - communication link failure• C192 - instrumentation system failure• C191 - C180 and C181
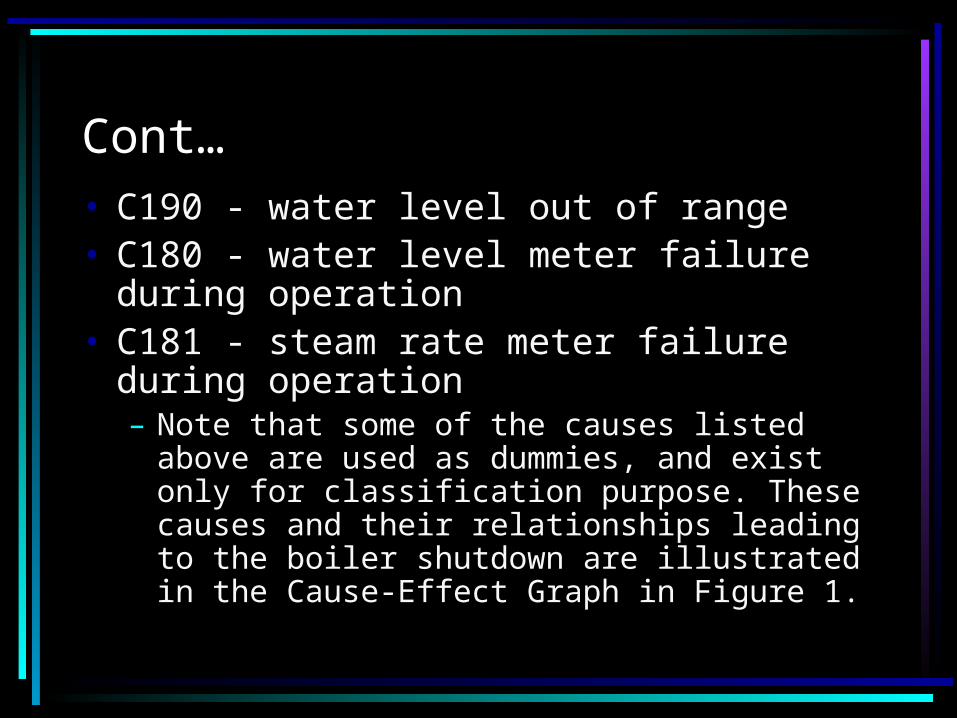
Cont…• C190 - water level out of range• C180 - water level meter failure during
operation• C181 - steam rate meter failure during
operation– Note that some of the causes listed above
are used as dummies, and exist only for classification purpose. These causes and their relationships leading to the boiler shutdown are illustrated in the Cause-Effect Graph in Figure 1.

Cause Effect Graph

Decision Table
• Two dimensional mapping of condition against actions to be performed– Conditions evaluate to Boolean– Action corresponds to expected activity
• They can be derived from Cause Effect graph too– Map cause as condition– Map effect as action

Cause effect graph- Decision tableCause 1
Cause 2
Cause 3
Cause 4
Cause 5
Effect 1
Effect 2
Effect 3
Test 1 Test 2 Test 3 Test 4 Test 5I I I
I
I
I I
S I
X S
S
SS
S
P P
S
I
S
A A A
AAP
PP
A
A
A
A A
X
XX
X
XXI

Cause effect graph- Example
• Put a row in the decision table for each cause or effect:– in the example, there are five rows
for causes and three for effects.

Cause effect graph- Example
• The columns of the decision table correspond to test cases.
• Define the columns by examining each effect:– list each combination of causes that
can lead to that effect.

Cause effect graph- Example
• We can determine the number of columns of the decision table– by examining the lines flowing into
the effect nodes of the graph.

Cause effect graph- Example
• Theoretically we could have generated 25=32 test cases.– Using cause effect graphing
technique reduces that number to 5.
Cause effect graph
• Not practical for systems which:– include timing aspects– feedback from processes is used for
some other processes.
White-Box Testing
• Statement coverage• Branch coverage• Path coverage• Condition coverage• Mutation testing• Data flow-based testing

Statement Coverage
• Statement coverage methodology:– design test cases so that every
statement in a program is executed at least once.
• The principal idea: – unless a statement is executed, we
have no way of knowing if an error exists in that statement

Statement coverage criterion
• Observing that a statement behaves properly for one input value:– no guarantee that it will behave
correctly for all input values.
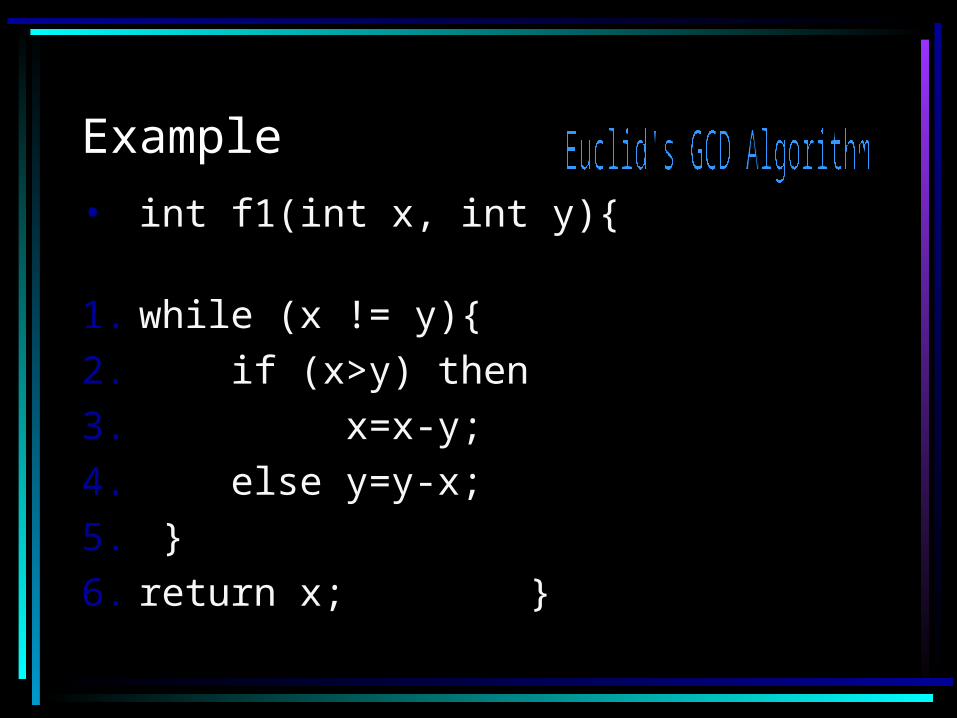
Example
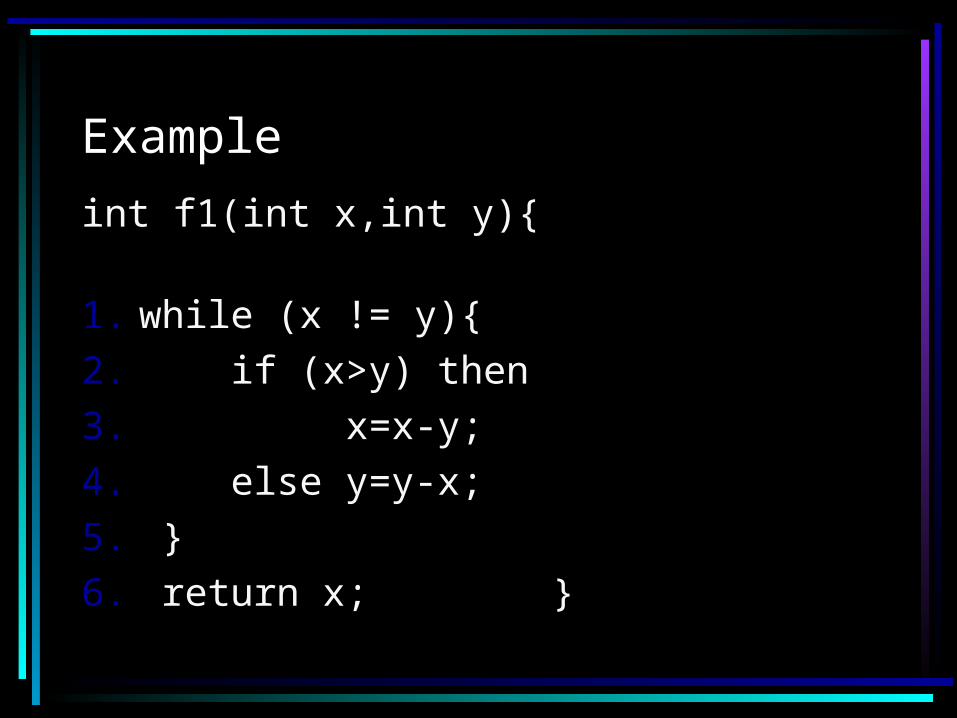
• int f1(int x, int y){ 1. while (x != y){2. if (x>y) then 3. x=x-y;4. else y=y-x;5. }6. return x; }

Euclid's GCD computation algorithm
• By choosing the test set{(x=3,y=3),(x=4,y=3), (x=3,y=4)}– all statements are executed at least
once.

Branch Coverage
• Test cases are designed such that:– different branch conditions is given
true and false values in turn.
• Branch testing guarantees statement coverage:– a stronger testing compared to the
statement coverage-based testing.

Example
• Test cases for branch coverage can be:{(x=3,y=3), (x=4,y=3), (x=3,y=4)}
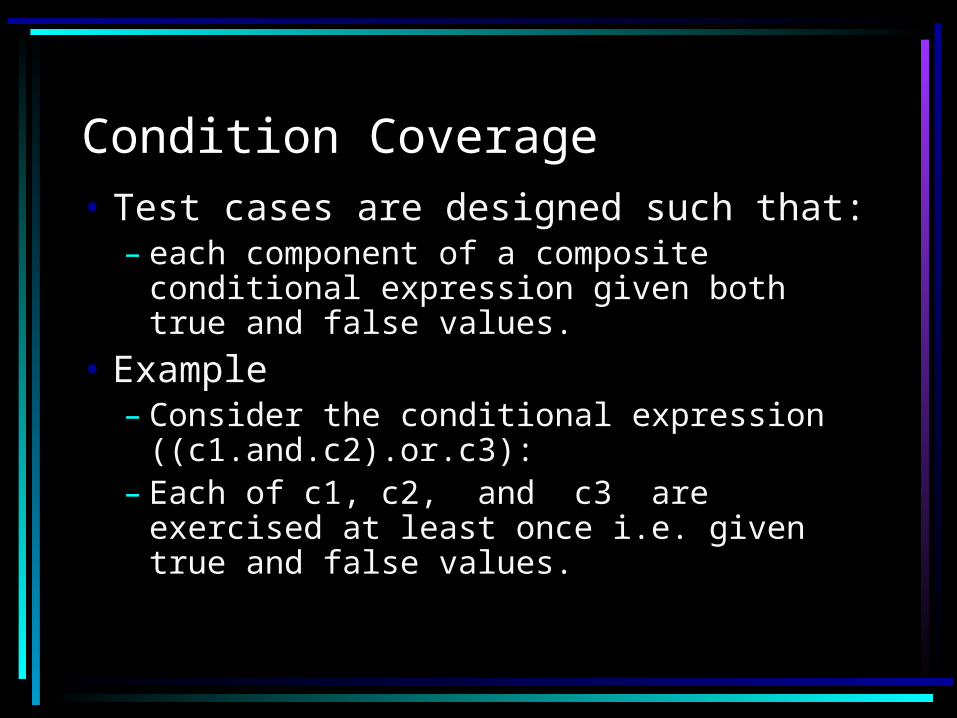
Condition Coverage• Test cases are designed such that:
– each component of a composite conditional expression given both true and false values.
• Example– Consider the conditional expression
((c1.and.c2).or.c3):– Each of c1, c2, and c3 are exercised
at least once i.e. given true and false values.

Branch testing
• Branch testing is the simplest condition testing strategy
• compound conditions appearing in different branch statements are given true and false values.

Branch testing
• Condition testing– stronger testing than branch testing:
• Branch testing – stronger than statement coverage
testing.
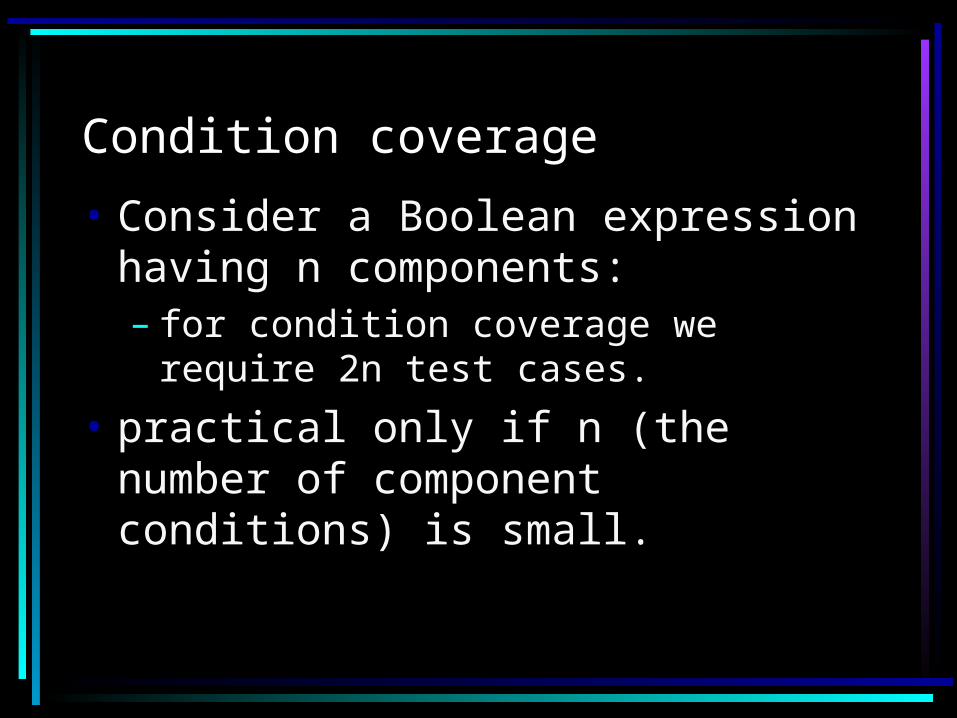
Condition coverage
• Consider a Boolean expression having n components: – for condition coverage we require 2n
test cases.
• practical only if n (the number of component conditions) is small.

Path Coverage
• Design test cases such that:– all linearly independent paths in the
program are executed at least once.
• Defined in terms of– control flow graph (CFG) of a
program.

Control flow graph (CFG)
• A control flow graph (CFG) describes: – the sequence in which different
instructions of a program get executed.
– the way control flows through the program.

How to draw Control flow graph?• Number all the statements of a
program. • Numbered statements:
– represent nodes of the control flow graph.
• An edge from one node to another node exists: – if execution of the statement
representing the first node can result in transfer of control to the other node.
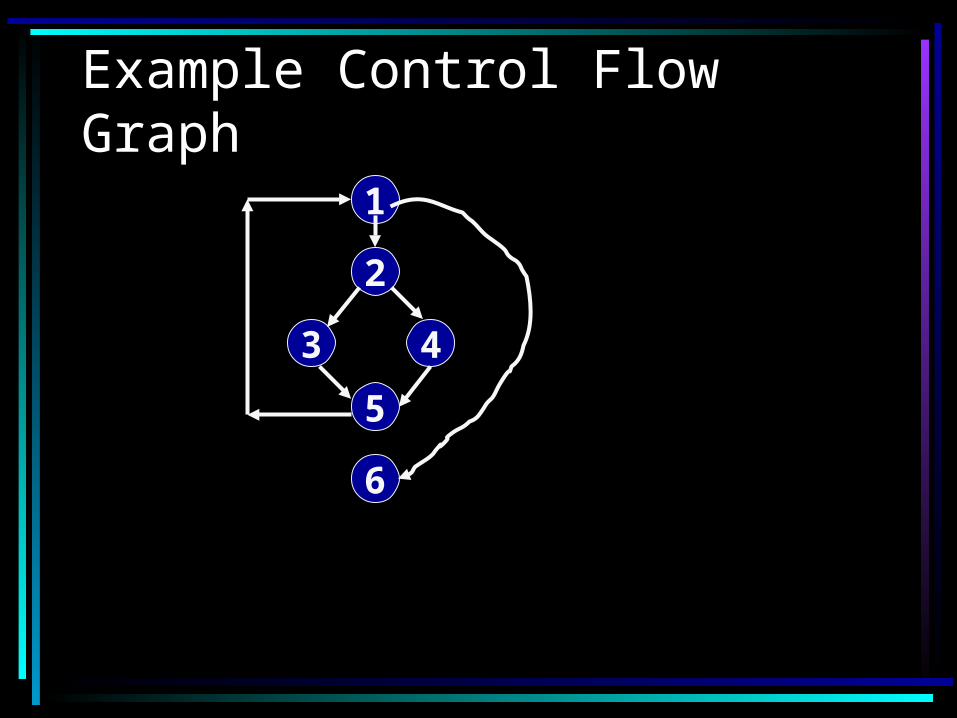
Example
int f1(int x,int y){ 1. while (x != y){2. if (x>y) then 3. x=x-y;4. else y=y-x;5. }6. return x; }

Example Control Flow Graph1
2
3 4
5
6

Path
• A path through a program:– A node and edge sequence from the
starting node to a terminal node of the control flow graph.
– There may be several terminal nodes for program.

Independent path• Any path through the program:
– introducing at least one new node that is not included in any other independent paths.
• It may be straight forward to identify linearly independent paths of simple programs. However For complicated programs it is not so easy to determine the number of independent paths.

McCabe's cyclomatic metric
• An upper bound: – for the number of linearly
independent paths of a program
• Provides a practical way of determining: – the maximum number of linearly
independent paths in a program.

McCabe's cyclomatic metric
• Given a control flow graph G,cyclomatic complexity V(G): – V(G)= E-N+2
• N is the number of nodes in G• E is the number of edges in G
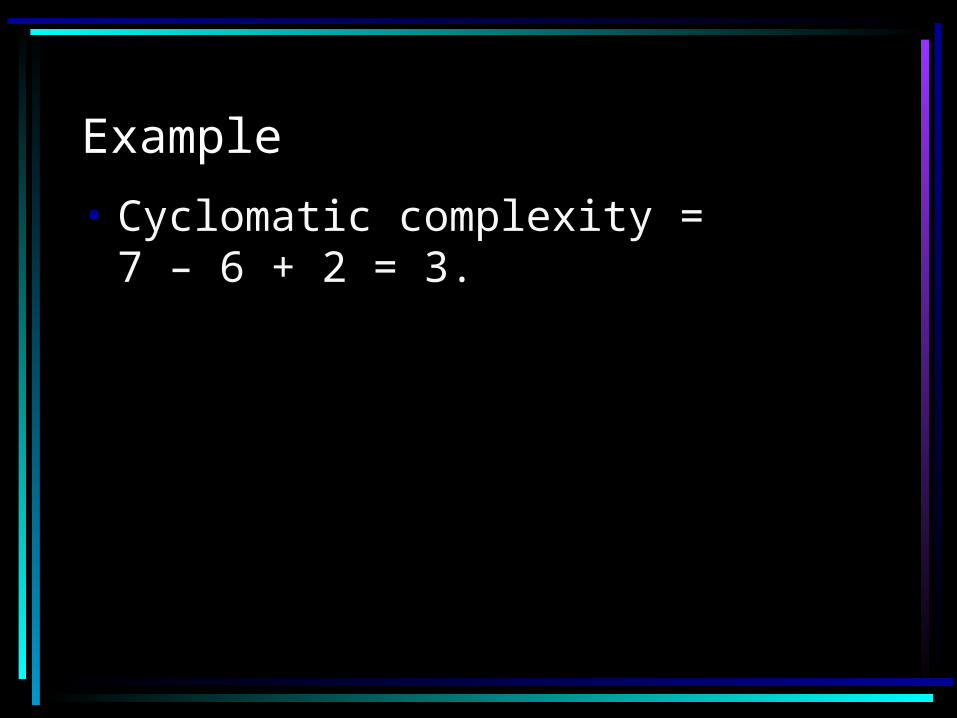
Example
• Cyclomatic complexity = 7 – 6 + 2 = 3.

Cyclomatic complexity
• Another way of computing cyclomatic complexity: – determine number of bounded areas
in the graph• Any region enclosed by a nodes and
edge sequence.
• V(G) = Total number of bounded areas + 1

Example
• From a visual examination of the CFG:– the number of bounded areas is 2. – cyclomatic complexity = 2+1=3.

Cyclomatic complexity
• McCabe's metric provides:– a quantitative measure of estimating
testing difficulty – Amenable to automation
• Intuitively, – number of bounded areas increases
with the number of decision nodes and loops.

Cyclomatic complexity
• The cyclomatic complexity of a program provides:– a lower bound on the number of test
cases to be designed– to guarantee coverage of all linearly
independent paths.

Cyclomatic complexity
• Defines the number of independent paths in a program.
• Provides a lower bound:– for the number of test cases for path
coverage.
• only gives an indication of the minimum number of test cases required.
Path testing
• The tester proposes initial set of test data using his experience and judgement.
Path testing
• A testing tool such as dynamic program analyzer, then may be used: – to indicate which parts of the
program have been tested– the output of the dynamic analysis
used to guide the tester in selecting additional test cases.

Derivation of Test Cases
• Draw control flow graph.• Determine V(G).• Determine the set of linearly
independent paths.• Prepare test cases:
– to force execution along each path
Example Control Flow Graph1
2
3 4
5
6

Derivation of Test Cases
• Number of independent paths: 3– 1, 6 test case (x=1, y=1)– 1, 2, 3, 5, 1, 6 test case(x=1, y=2)– 1, 2, 4, 5, 1, 6 test case(x=2, y=1)

An interesting application of cyclomatic complexity
• Relationship exists between:– McCabe's metric– the number of errors existing in the
code, – the time required to find and correct
the errors.
Cyclomatic complexity
• Cyclomatic complexity of a program: – also indicates the psychological
complexity of a program. – difficulty level of understanding the
program.

Cyclomatic complexity
• From maintenance perspective, – limit cyclomatic complexity
• of modules to some reasonable value.
– Good software development organizations: • restrict cyclomatic complexity of
functions to a maximum of ten or so.

Data Flow-Based Testing
• Selects test paths of a program: – according to the locations of
definitions and uses of different variables in a program.

Data Flow-Based Testing
• For a statement numbered S, – DEF(S) = {X/statement S contains a
definition of X} – USES(S)= {X/statement S contains a
use of X}– Example: 1: a=b; DEF(1)={a},
USES(1)={b}.– Example: 2: a=a+b; DEF(1)={a},
USES(1)={a,b}.

Data Flow-Based Testing
• A variable X is said to be live at statement S1, if– X is defined at a statement S: – there exists a path from S to S1 not
containing any definition of X.

Definition-use chain (DU chain)
• [X,S,S1], – S and S1 are statement numbers, – X in DEF(S)– X in USES(S1), and – the definition of X in the statement S
is live at statement S1.
Data Flow-Based Testing
• One simple data flow testing strategy: – every DU chain in a program be
covered at least once.

Data Flow-Based Testing
• Data flow testing strategies:– useful for selecting test paths of a
program containing nested if and loop statements

1 X(){2 B1; /* Defines variable a */3 While(C1) { 4 if (C2) 5 if(C4) B4; /*Uses variable a */
6 else B5;7 else if (C3) B2; 8 else B3; }9 B6 }
Data Flow-Based Testing

Data Flow-Based Testing
• [a,1,5]: a DU chain.• Assume:
– DEF(X) = {B1, B2, B3, B4, B5} – USED(X) = {B2, B3, B4, B5, B6}– There are 25 DU chains.
• However only 5 paths are needed to cover these chains.

Mutation Testing
• The software is first tested:– using an initial testing method based on
white-box strategies we already discussed.
• After the initial testing is complete,– mutation testing is taken up.
• The idea behind mutation testing: – make a few arbitrary small changes to a
program at a time.

Mutation Testing
• Each time the program is changed, – it is called a mutated program – the change is called a mutant.

Mutation Testing
• A mutated program:– tested against the full test suite of the
program.
• If there exists at least one test case in the test suite for which:– a mutant gives an incorrect result,
then the mutant is said to be dead.

Mutation Testing
• If a mutant remains alive: – even after all test cases have been
exhausted, the test suite is enhanced to kill the mutant.
• The process of generation and killing of mutants: – can be automated by predefining a
set of primitive changes that can be applied to the program.

Mutation Testing
• The primitive changes can be:– altering an arithmetic operator, – changing the value of a constant, – changing a data type, etc.

Mutation Testing
• A major disadvantage of mutation testing:– computationally very expensive, – a large number of possible mutants
can be generated.
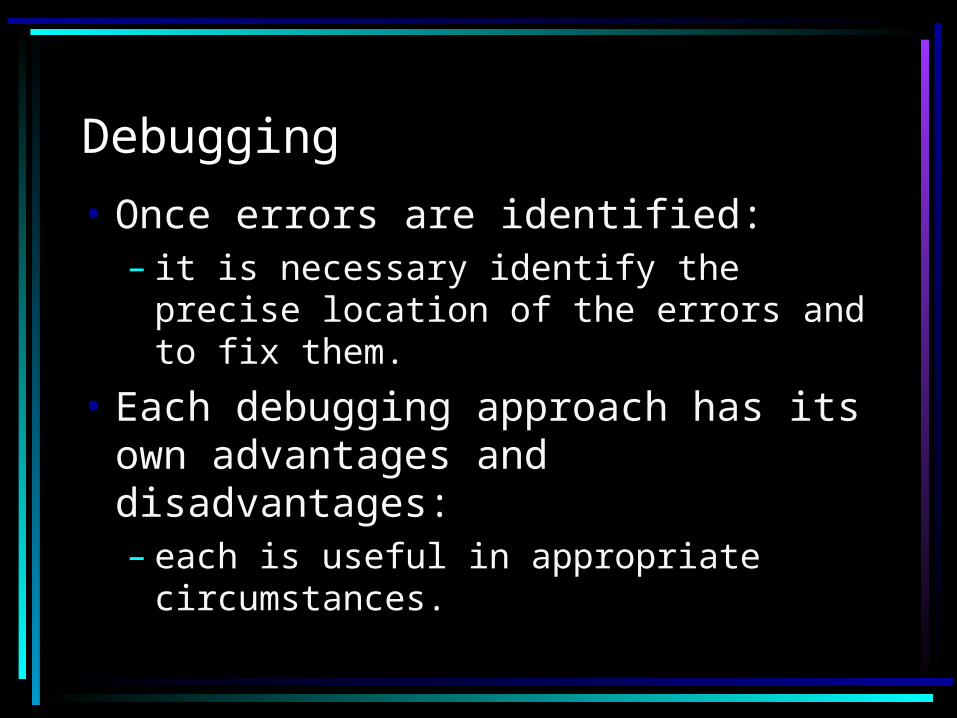
Debugging
• Once errors are identified:– it is necessary identify the precise
location of the errors and to fix them.
• Each debugging approach has its own advantages and disadvantages:– each is useful in appropriate
circumstances.

Brute-force method
• This is the most common method of debugging: – least efficient method. – program is loaded with print
statements – print the intermediate values – hope that some of printed values will
help identify the error.

Symbolic Debugger
• Brute force approach becomes more systematic:– with the use of a symbolic debugger, – symbolic debuggers get their name
for historical reasons– early debuggers let you only see
values from a program dump:• determine which variable it corresponds
to.

Symbolic Debugger
• Using a symbolic debugger:– values of different variables can be
easily checked and modified– single stepping to execute one
instruction at a time– break points and watch points can be
set to test the values of variables.

Backtracking
• This is a fairly common approach. • Beginning at the statement where
an error symptom has been observed: – source code is traced backwards until
the error is discovered.
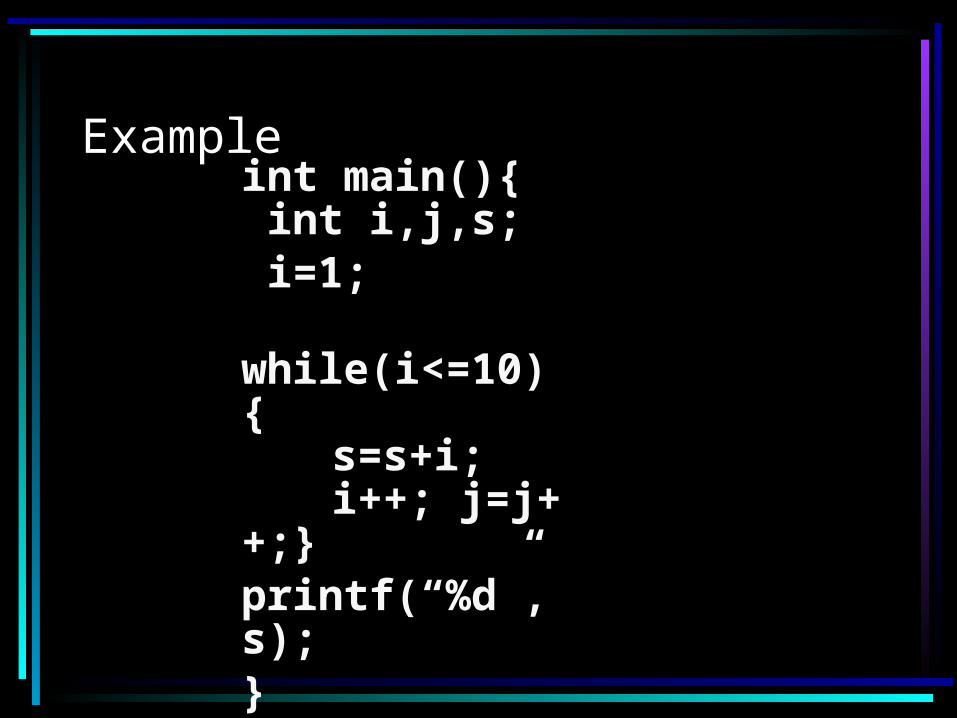
Exampleint main(){ int i,j,s; i=1; while(i<=10){
s=s+i;i++; j=j++;}
printf(“%d”,s);}

Backtracking
• Unfortunately, as the number of source lines to be traced back increases, – the number of potential backward
paths increases– becomes unmanageably large for
complex programs.
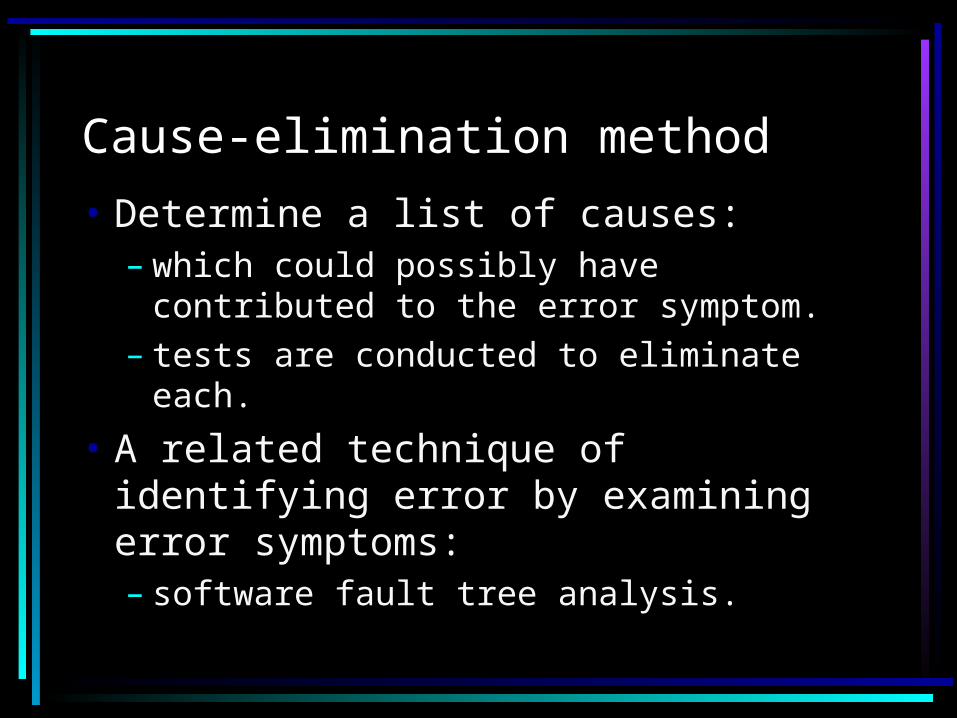
Cause-elimination method
• Determine a list of causes:– which could possibly have contributed
to the error symptom.– tests are conducted to eliminate each.
• A related technique of identifying error by examining error symptoms: – software fault tree analysis.

Program Slicing
• This technique is similar to back tracking.
• However, the search space is reduced by defining slices.
• A slice is defined for a particular variable at a particular statement: – set of source lines preceding this
statement which can influence the value of the variable.

Exampleint main(){ int i,s; i=1; s=1; while(i<=10){
s=s+i;i++;}
printf(“%d”,s);printf(“%d”,i);}

Debugging Guidelines
• Debugging usually requires a thorough understanding of the program design.
• Debugging may sometimes require full redesign of the system.
• A common mistake novice programmers often make:– not fixing the error but the error
symptoms.

Debugging Guidelines
• Be aware of the possibility:– an error correction may introduce
new errors.
• After every round of error-fixing: – regression testing must be carried
out.

Program Analysis Tools
• An automated tool:– takes program source code as input – produces reports regarding several
important characteristics of the program,
– such as size, complexity, adequacy of commenting, adherence to programming standards, etc.

Program Analysis Tools
• Some program analysis tools: – produce reports regarding the
adequacy of the test cases.
• There are essentially two categories of program analysis tools:– Static analysis tools– Dynamic analysis tools

Static Analysis Tools
• Static analysis tools: – assess properties of a program
without executing it. – Analyze the source code
• provide analytical conclusions.

Static Analysis Tools
• Whether coding standards have been adhered to?– Commenting is adequate?
• Programming errors such as:– Un-initialized variables – mismatch between actual and formal
parameters. – Variables declared but never used, etc.

Static Analysis Tools
• Code walk through and inspection can also be considered as static analysis methods: – however, the term static program
analysis is generally used for automated analysis tools.
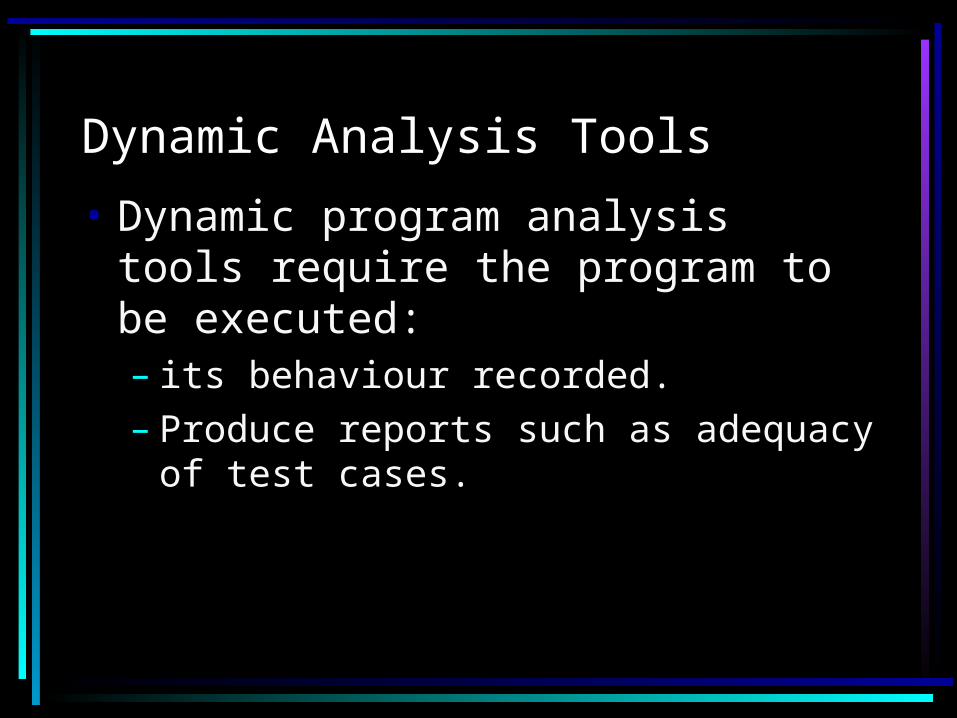
Dynamic Analysis Tools
• Dynamic program analysis tools require the program to be executed: – its behaviour recorded. – Produce reports such as adequacy of
test cases.

Integration testing
• After different modules of a system have been coded and unit tested: – modules are integrated in steps
according to an integration plan– partially integrated system is tested
at each integration step.

System Testing
• System testing involves:– validating a fully developed system
against its requirements.

Integration Testing
• Develop the integration plan by examining the structure chart :– big bang approach– top-down approach– bottom-up approach– mixed approach

Example Structured Designroot
Get-good-data Compute-solution Display-solution
Get-data Validate
-data
Valid-numbersValid-numbers
rmsrms

Big bang Integration Testing
• Big bang approach is the simplest integration testing approach:– all the modules are simply put
together and tested. – this technique is used only for very
small systems.

Big bang Integration Testing
• Main problems with this approach: – if an error is found:
• it is very difficult to localize the error• the error may potentially belong to any of
the modules being integrated.
– debugging errors found during big bang integration testing are very expensive to fix.

Bottom-up Integration Testing
• Integrate and test the bottom level modules first.
• A disadvantage of bottom-up testing:– when the system is made up of a
large number of small subsystems. – This extreme case corresponds to the
big bang approach.

Top-down integration testing
• Top-down integration testing starts with the main routine: – and one or two subordinate routines in
the system.
• After the top-level 'skeleton’ has been tested:– immediate subordinate modules of the
'skeleton’ are combined with it and tested.

Mixed integration testing
• Mixed (or sandwiched) integration testing: – uses both top-down and bottom-up
testing approaches. – Most common approach

Integration Testing
• In top-down approach:– testing waits till all top-level modules
are coded and unit tested.
• In bottom-up approach:– testing can start only after bottom
level modules are ready.
Phased versus Incremental Integration Testing
• Integration can be incremental or phased.
• In incremental integration testing, – only one new module is added to the
partial system each time.

Phased versus Incremental Integration Testing
• In phased integration, – a group of related modules are added
to the partially integrated system each time.
• Big-bang testing: – a degenerate case of the phased
integration testing.

Phased versus Incremental Integration Testing• Phased integration requires less
number of integration steps:– compared to the incremental
integration approach. • However, when failures are
detected, – it is easier to debug if using
incremental testing • since errors are very likely to be in the
newly integrated module.

System Testing
• There are three main kinds of system testing:– Alpha Testing– Beta Testing– Acceptance Testing

Alpha Testing
• System testing is carried out by the test team within the developing organization.

Beta Testing
• System testing performed by a select group of friendly customers.
Acceptance Testing
• System testing performed by the customer himself: – to determine whether the system
should be accepted or rejected.

Stress Testing
• Stress testing (aka endurance testing):– impose abnormal input to stress the
capabilities of the software. – Input data volume, input data rate,
processing time, utilization of memory, etc. are tested beyond the designed capacity.
Performance Testing
• Addresses non-functional requirements.– May sometimes involve testing
hardware and software together.– There are several categories of
performance testing.

Stress testing
• Evaluates system performance – when stressed for short periods of
time.
• Stress testing– also known as endurance testing.
Stress testing
• Stress tests are black box tests: – designed to impose a range of
abnormal and even illegal input conditions
– so as to stress the capabilities of the software.

Stress Testing
• If the requirements is to handle a specified number of users, or devices:– stress testing evaluates system
performance when all users or devices are busy simultaneously.
Stress Testing
• If an operating system is supposed to support 15 multiprogrammed jobs, – the system is stressed by attempting to
run 15 or more jobs simultaneously.
• A real-time system might be tested – to determine the effect of simultaneous
arrival of several high-priority interrupts.
Stress Testing
• Stress testing usually involves an element of time or size, – such as the number of records
transferred per unit time, – the maximum number of users active
at any time, input data size, etc.
• Therefore stress testing may not be applicable to many types of systems.

Volume Testing
• Addresses handling large amounts of data in the system:– whether data structures (e.g. queues,
stacks, arrays, etc.) are large enough to handle all possible situations
– Fields, records, and files are stressed to check if their size can accommodate all possible data volumes.

Configuration Testing
• Analyze system behaviour:– in various hardware and software
configurations specified in the requirements
– sometimes systems are built in various configurations for different users
– for instance, a minimal system may serve a single user, • other configurations for additional users.

Compatibility Testing
• These tests are needed when the system interfaces with other systems:– check whether the interface functions
as required.

Compatibility testingExample
• If a system is to communicate with a large database system to retrieve information:– a compatibility test examines speed
and accuracy of retrieval.
Recovery Testing
• These tests check response to:– presence of faults or to the loss of
data, power, devices, or services– subject system to loss of resources
• check if the system recovers properly.

Maintenance Testing
• Diagnostic tools and procedures:– help find source of problems.– It may be required to supply
• memory maps• diagnostic programs• traces of transactions, • circuit diagrams, etc.
Maintenance Testing
• Verify that: – all required artefacts for maintenance
exist– they function properly

Documentation tests
• Check that required documents exist and are consistent:– user guides, – maintenance guides, – technical documents

Documentation tests
• Sometimes requirements specify:– format and audience of specific
documents– documents are evaluated for
compliance
Usability tests
• All aspects of user interfaces are tested:– Display screens– messages– report formats– navigation and selection problems

Environmental test• These tests check the system’s ability to
perform at the installation site.• Requirements might include tolerance for
– heat– humidity– chemical presence– portability– electrical or magnetic fields– disruption of power, etc.

Test Summary Report
• Generated towards the end of testing phase.
• Covers each subsystem:– a summary of tests which have been
applied to the subsystem.

Test Summary Report
• Specifies: – how many tests have been applied to a
subsystem, – how many tests have been successful, – how many have been unsuccessful, and the
degree to which they have been unsuccessful,
• e.g. whether a test was an outright failure • or whether some expected results of the test
were actually observed.

Regression Testing
• Does not belong to either unit test, integration test, or system test. – In stead, it is a separate dimension to
these three forms of testing.

Regression testing
• Regression testing is the running of test suite:– after each change to the system or
after each bug fix – ensures that no new bug has been
introduced due to the change or the bug fix.

Regression testing
• Regression tests assure: – the new system’s performance is at
least as good as the old system– always used during phased system
development.

How many errors are still remaining?
• Seed the code with some known errors:– artificial errors are introduced into the
program. – Check how many of the seeded errors
are detected during testing.

Error Seeding
• Let:– N be the total number of errors in the
system – n of these errors be found by testing. – S be the total number of seeded
errors,– s of the seeded errors be found
during testing.
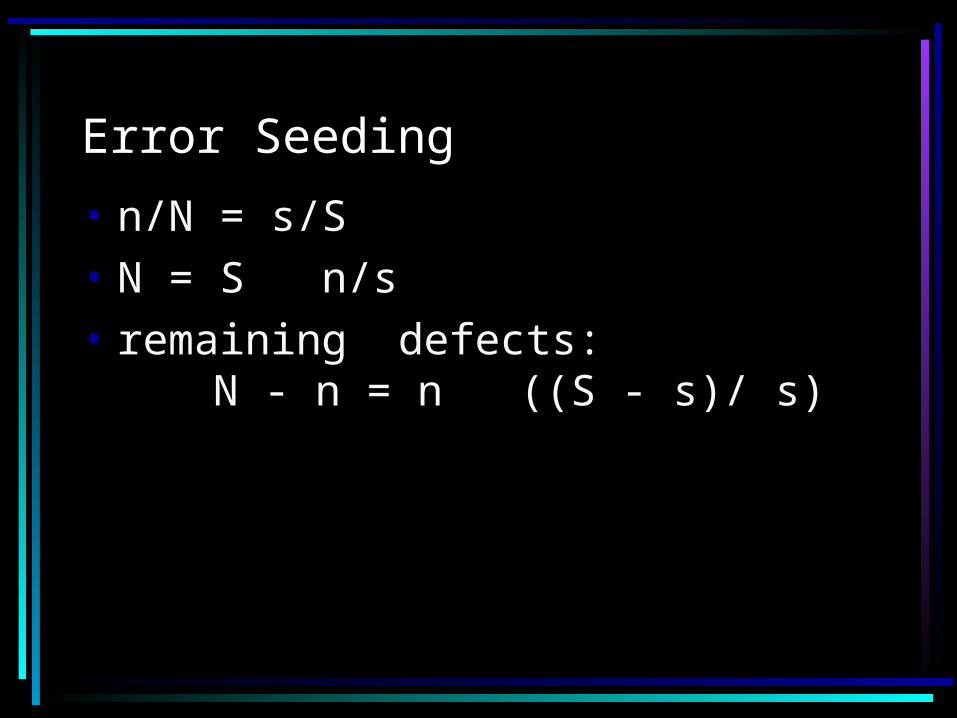
Error Seeding
• n/N = s/S • N = S n/s• remaining defects:
N - n = n ((S - s)/ s)

Example
• 100 errors were introduced. • 90 of these errors were found
during testing• 50 other errors were also found.• Remaining errors=
50 (100-90)/90 = 6

Error Seeding
• The kind of seeded errors should match closely with existing errors:– However, it is difficult to predict the
types of errors that exist.
• Categories of remaining errors:– can be estimated by analyzing
historical data from similar projects.

IEEE Standard 829 - 1998• Test plan identifier• Introduction• Test Items• Features to be tested• Features not to be tested• Approach• Item pass/fail criteria• Suspension criteria and resumption
requirements

Cont…
• Test deliverables• Testing tasks• Environment needs• Responsibilities• Staffing and training needs• Risk and contingencies• Approvals
References
• Software Testing, A craftsman’s approach– Paul Jorgensen
• Fundamental of Software Engineering– Rajib Mall
• Software Engineering, A practitioner’s approach– Roger Pressman
• Communication of ACM, Sep 1994 edition