![Normkonzept Murten 2012.ppt [Kompatibilit tsmodus]ffffffff-d876-e341-ffff... · 2018. 6. 19. · Murtener Gesetzgebungsseminare 2012 Grundlagenseminar I: Rechtsetzungsmethodik Zentrum](https://static.fdocuments.net/doc/165x107/6099143ac76e631aab165838/normkonzept-murten-2012ppt-kompatibilit-tsmodus-ffffffff-d876-e341-ffff.jpg)
Software Reliability and Safety CSE 8317 — Spring...
39
Software Reliability and Safety CSE 8317 (SRE.2) 1 Software Reliability and Safety CSE 8317 — Spring 2015 Prof. Jeff Tian, [email protected] CSE, SMU, Dallas, TX 75275 (214) 768-2861; Fax: (214) 768-3085 www.engr.smu.edu/∼tian/class/8317.15s SRE.2: TBRMs & Integrated SRE • Environment and needs • Experience with existing approaches • TBRMs: Tree-based reliability Models • Integrated SRE using TBRMs & others Prof. Jeff Tian Spring 2015
-
Upload
hoangquynh -
Category
Documents
-
view
216 -
download
0
Transcript of Software Reliability and Safety CSE 8317 — Spring...

Software Reliability and Safety CSE 8317 (SRE.2) 1
Software Reliability and Safety
CSE 8317 — Spring 2015
Prof. Jeff Tian, [email protected], SMU, Dallas, TX 75275
(214) 768-2861; Fax: (214) 768-3085www.engr.smu.edu/∼tian/class/8317.15s
SRE.2: TBRMs & Integrated SRE
• Environment and needs
• Experience with existing approaches
• TBRMs: Tree-based reliability Models
• Integrated SRE using TBRMs & others
Prof. Jeff Tian Spring 2015

Software Reliability and Safety CSE 8317 (SRE.2) 2
Overview
• Reliability: Prob(failure-free operations)
⊲ time domain: for a specific period.
⇒ reliability growth models.
⊲ input domain: for a specific input set.
⇒ repeated sampling models.
• A new integrated approach: TBRMs
⊲ tree-based reliability models (TBRMs)
⊲ both input/time domain information.
⊲ data driven/sensitive partitions.
⊲ method: tree-based modeling (TBM).
⊲ risk focusing and remedial actions.
⊲ details: AIC paper (Tian 1998)
Prof. Jeff Tian Spring 2015

Software Reliability and Safety CSE 8317 (SRE.2) 3
Product Environment
• Large (medium-reliable) products:
⊲ Commercial: RDBMS, compilers, soft-
ware tools and computing environments.
⊲ Telecommunication products too.
⊲ Size: Up to millions of LOC.
⊲ Widely distributed/large user population.
⊲ No precise operational profile.
⊲ Process: roughly waterfall.
• Overall testing:
⊲ Long testing period (2 ∼ 18 months).
⊲ Different testing sub-phases.
⊲ System testing focuses on reliability.
⊲ Test-until-it-breaks commonly used.
⊲ Staffing level variations.
⊲ Code base stability.
Prof. Jeff Tian Spring 2015

Software Reliability and Safety CSE 8317 (SRE.2) 4
Testing Environment
• Scenario-based testing.
⊲ Shifting focus: learning/dependency.
⊲ Functionality-based scenario classes:
– randomized workload
– progression: complexity & intensity ↑
– defect fixing and related runs
– division among testers.
• Specific reliability analysis issues:
⊲ Scenario-based ∼ random testing
– due to parallelism and interleaving
⊲ Defect fixing effect:
– no long-term dependency
– short-term dependency ⇒ grouping (later)
⊲ Uneven faults ⇒ TBRMs
Prof. Jeff Tian Spring 2015
Software Reliability and Safety CSE 8317 (SRE.2) 5
Needs and Constraints
• Need assessment and analysis:
⊲ Track test effort, progress and defect.
⊲ Reliability assessment and prediction.
⊲ Effective defect detection and removal.
⊲ Process and quality improvement.
• Environmental constraints:
⊲ Minimize cost & schedule risks.
⊲ Data availability and affordability.
⊲ Process refinement.
⊲ Maximize data utilization.
• Recommendation:
new, evolutionary approach, with support.
Prof. Jeff Tian Spring 2015

Software Reliability and Safety CSE 8317 (SRE.2) 6
Overall Solution
• Combine SRGMs and IDRMs into TBRMs.
• Analysis and control:
⊲ SRGMs (s/w rel. growth models).
⊲ TBRMs: tree-based reliability models.
⊲ Progress monitoring & exit criteria.
• Problem identification and correction:
⊲ Use of input domain information
– IDRMs (input domain rel. models)
– identify high risk areas
⊲ Automatic partitioning via TBRMs.
⊲ Remedial actions for improvement.
Prof. Jeff Tian Spring 2015

Software Reliability and Safety CSE 8317 (SRE.2) 7
Applications: Overview
• Product coverage:
⊲ Commercial products from IBM.
⊲ Improvement over original process.
⊲ Evolutionary approach:
1. individual techniques.
2. integration and refinement.
⊲ Recent work with Nortel Networks.
• Scope of Engagement:
⊲ Data definition and collection.
⊲ Data visualization and analysis.
⊲ Test progress tracking.
⊲ Reliability tracking with SRGMs.
⊲ Reliability improvement with TBRMs.
Prof. Jeff Tian Spring 2015

Software Reliability and Safety CSE 8317 (SRE.2) 8
Applications: Testing & Data
• Data and tracking:
⊲ Integration with schedule information.
⊲ Normalization effect.
⊲ Summary reports and visualization.
⊲ Consistency checking automation.
• Customer usage information gathering
– Operational profile construction.
• Coverage and input-domain analysis:
⊲ Functionality/function/static/dynamic.
⊲ Different levels of coverage for different
testing phases.
⊲ Focused coverage through TBRM.
Prof. Jeff Tian Spring 2015

Software Reliability and Safety CSE 8317 (SRE.2) 9
SRGMs: Application Experience
• Time measurements: Fig.2 (Tian 1998)
⊲ calendar time.
⊲ execution time: Musa models.
⊲ logical time: runs, transactions, etc.
f f ffffff f f f fffffffffffffffffff
fffffff fffffff
ffff fffff fffff fffffffffffffffffffff fffffffffffffffffff fffff fffff ffffffffffff
Cumulative Testing Days
Cum
ulat
ive
Wor
kloa
d or
Fai
lure
s
0 50 100 150
020
040
060
0
184 days, 453 runs, 1293047422 transactions, 835530 execution minutes, 130 failures.
cumulative transactionscumulative execution minutescumulative runs
f cumulative failures
Prof. Jeff Tian Spring 2015

Software Reliability and Safety CSE 8317 (SRE.2)10
SRGMs: Application Experience
• Model applicability and effectiveness:
⊲ calendar time models useless.
⊲ products A, B, and C: Fig.3 (Tian 1998)
Cumulative Days/Total System Testing Days
Cum
ulat
ive
Fai
lure
s/T
otal
Fai
lure
s in
Sys
tem
Tes
ting
0.0 0.2 0.4 0.6 0.8 1.0
0.0
0.2
0.4
0.6
0.8
1.0
Product AProduct BProduct C
Prof. Jeff Tian Spring 2015

Software Reliability and Safety CSE 8317 (SRE.2)11
SRGMs: Application Experience
• Model applicability and effectiveness:
⊲ exec. time models costly & sensitive.
⊲ product B Fig.6b (Tian 1998)
•••• •••
•••••••• • • •••
•• ••••••••••••••••••••••••••••••••••••••••••
•••• •••
••••• •••
• • •• •••••••••••••••• •• •••
• •••• • •••• • •••
•••••••••••••••
•• ••••••
• ••••
Cumulative Execution Time (Minutes)
Cum
ulat
ive
Fai
lure
s
0 5000 10000 15000
020
4060
8010
012
014
0
• ActualGeoMusaMO
Prof. Jeff Tian Spring 2015

Software Reliability and Safety CSE 8317 (SRE.2)12
SRGMs: Application Experience
• Model applicability and effectiveness:
⊲ runs suitable for some products.
⊲ product B: Fig.6a (Tian 1998)
••••••••••••••••••
••••••••••••••••••••••••••••••
• ••••• ••••••••••••
••••••••••••
••••••••••••••
••••••• • ••••••••
••••••••••••••••••
••••••••••••
••••••••••••••••••••••••
••••••••••••••••••
••••••••••••
••••••••••••
••••••••••••
•• ••• ••• • •••••••• ••••••
••••••••••••••
••••••••••••
• •••••••• ••••
Cumulative Runs
Cum
ulat
ive
Fai
lure
s
0 100 200 300 400
050
100
150
200
250
• ActualGeoMusaLVMO
Prof. Jeff Tian Spring 2015

Software Reliability and Safety CSE 8317 (SRE.2)13
SRGMs: Application Experience
• Model applicability and effectiveness:
⊲ runs suitable for some products.
⊲ product D: Fig.8a (Tian 1998)
••••••••••••
••••
•••••••
••• •
•••••••
• •••••
•••••••
•••••
••••••••
•••
••• •• •••••••
••••••••••••••••••••••••
• • ••• • • • • ••• • • •• ••• •• •••••••• ••••
cumulative runs
cum
ulat
ive
failu
res
0 1000 2000 3000
020
040
060
080
010
00
• ActualSGO
Prof. Jeff Tian Spring 2015

Software Reliability and Safety CSE 8317 (SRE.2)14
SRGMs: Application Experience
• Model applicability and effectiveness:
⊲ runs suitable some products.
⊲ product D: Fig.8b (Tian 1998)
•••••
•
•
•
•
•
•
•
•
•
•
••
•
•
•
•
•
•
•
•
•
•
•
•
•
•
•
• •
•
•
•
•
•
•
•
•
•
•
•
•
•
•
•
•
•
•
•
•
•
•
•
•
•
•
•
•
•
•
•
•
•
••
•
•
•
•
•
••
•
•
•
•
•
•
•
•
••
•
•
•
•
••••
•
••
•
•
••
•
••
•
•
•
• •
•
•• •
•
••
••
•
•••••
•
•
•
•••••
cumulative runs
failu
re d
ensi
ty (
failu
res/
runs
)
0 1000 2000 3000
0.0
0.2
0.4
0.6
0.8
1.0
• ActualSGO
Prof. Jeff Tian Spring 2015

Software Reliability and Safety CSE 8317 (SRE.2)15
SRGMs: Application Experience
• Model applicability and effectiveness:
⊲ transactions for other products.
⊲ product E: Fig.9 (Tian 1998)
•••••••••••••••• • ••
••••••
••••••••••••••• •
•••••••••••••••••••••• •••
••••• ••••••• •• •••••••• • • •
••• • • •• • • • • ••• • • • •••• • • • •
cumulative transactions
cum
ulat
ive
failu
res
0 2*10^8 4*10^8 6*10^8 8*10^8 10^9 1.2*10^9
020
4060
8010
012
0 • ActualGO (exponential)
GO (exponential) Model Summary:==============
cum.fails = N (1 - exp(-b*cum.trans)) N= 132.687308548754
b= 3.02393592011337e-09 ==============
failure rate: 7.73653023265131e-09 MTBF: 129256911.034819
SSQ(residuals): 6328.96105568968
Prof. Jeff Tian Spring 2015

Software Reliability and Safety CSE 8317 (SRE.2)16
SRGMs: Application Experience
• Model applicability and effectiveness:
⊲ time measurement comparison
⊲ product E: Fig.5 (Tian 1998)
Normalized time (transactions/runs/days)
Cum
ulat
ive
failu
res
0.0 0.2 0.4 0.6 0.8 1.0
020
4060
8010
012
0
Failures vs. transactionsFailures vs. test runsFailures vs. testing days
Prof. Jeff Tian Spring 2015
Software Reliability and Safety CSE 8317 (SRE.2)17
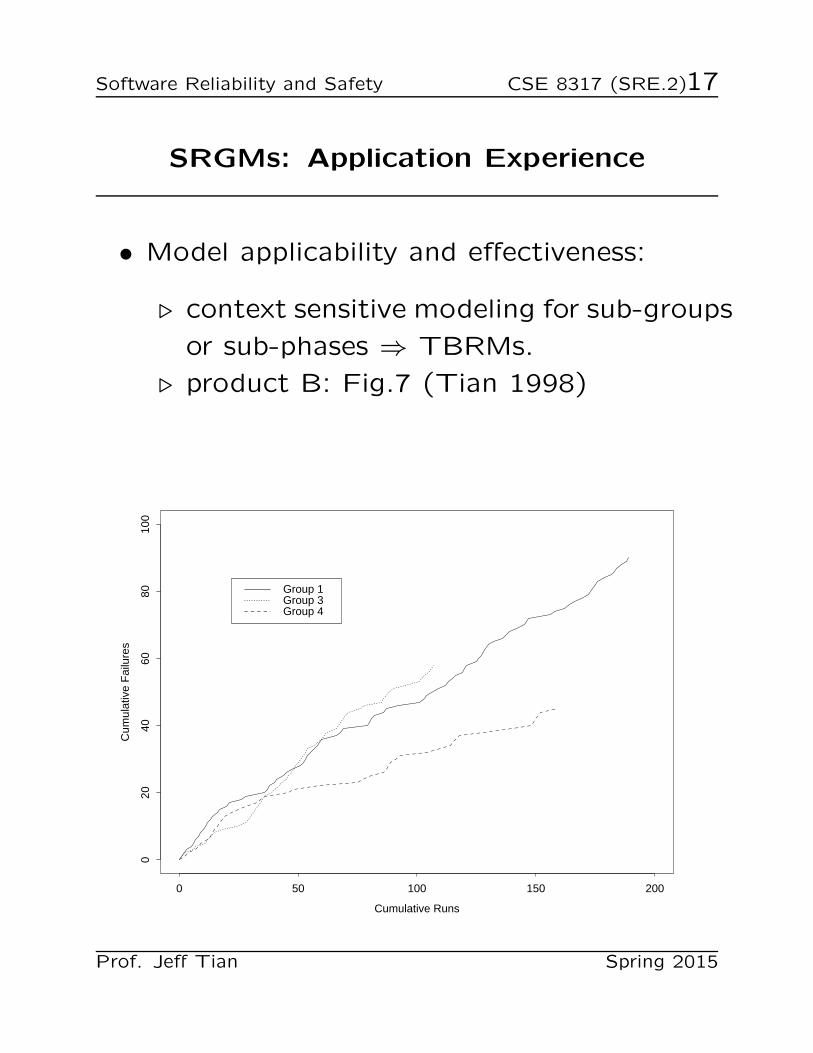
SRGMs: Application Experience
• Model applicability and effectiveness:
⊲ context sensitive modeling for sub-groups
or sub-phases ⇒ TBRMs.
⊲ product B: Fig.7 (Tian 1998)
Cumulative Runs
Cum
ulat
ive
Fai
lure
s
0 50 100 150 200
020
4060
8010
0
Group 1Group 3Group 4
Prof. Jeff Tian Spring 2015
Software Reliability and Safety CSE 8317 (SRE.2)18
SRGM Conclusions
• Modeling result interpretation:
⊲ Accuracy of models:
– assessment, model goodness-of-fit.
– prediction: training & testing sets
⊲ Product purity at exit.
⊲ Bounded estimations: multiple models.
⊲ Convergence of modeling results.
• Evolving to usage-based data/model:
⊲ Assurance of homogeneity:
– if ‘yes’, run-based data/model;
– if ‘no’, transaction measurement.
⊲ Suitable for input domain analysis.
⊲ Also as cross validation for TBRMs.
Prof. Jeff Tian Spring 2015
Software Reliability and Safety CSE 8317 (SRE.2)19
Assessing Existing Approaches
• Time domain reliability analysis:
⊲ Customer perspective.
⊲ Overall assessment and prediction.
⊲ Ability to track reliability change.
⊲ Problem: how to improve reliability?
• Input domain reliability analysis:
⊲ Explicit operational profile.
⊲ Better input state definition.
⊲ Hard to handle change/evolution.
⊲ Problem: realistic reliability assessment
and handling numerous data sets/partitions?
Prof. Jeff Tian Spring 2015

Software Reliability and Safety CSE 8317 (SRE.2)20
An Integrated Approach
• Combine strengths of the two.
• Using TBRM for individual modeling:
⊲ Input state: categorical information.
⊲ Each run as a data point.
⊲ Time cutoff for partitions too.
⊲ Data sensitive partitioning
⇒ Nelson models for subsets.
• Integrated reliability analyses:
⊲ TBRM: partitioned subset reliability.
⊲ Use both input and timing information.
⊲ Monitoring changes in trees.
⊲ Enhanced exit criteria.
⊲ SRGM: overall reliability near exit.
⊲ Integrate into the testing process.
Prof. Jeff Tian Spring 2015

Software Reliability and Safety CSE 8317 (SRE.2)21
TBM: Technique for Integration
• Basic ideas:
⊲ TBM: tree-based models.
⊲ Tree: nodes=data-set, edges=decision.
⊲ Data: 1 response variable Y
and n predictor variables X1, . . . , Xn.
⊲ Construction: recursive partitioning.
(controlled growth vs growing&pruning)
• Usage and applications:
⊲ Basic usage: Y = Tree(X1, . . . , Xn)
⊲ Applicability: mixed-types of data.
⊲ Past applications: social sciences
⊲ In SE: risk identification by Selby & Porter,
Tian & Troster, etc.
• Details: Tian/SQE book Ch.21.
Prof. Jeff Tian Spring 2015

Software Reliability and Safety CSE 8317 (SRE.2)22
TBRM Simple Example
• 1 categorical predictor and 1 response:
⊲ Binary grouping for partitioning
⊲ Example: Fig 10 (Tian 1998)
log:abfgjk log:cdehil
s= 0.675 n= 3331
s= 0.474 n= 1864
s= 0.930 n= 1467
log:fj log:abgk
s= 0.474 n= 1864
s= 0.276 n= 156
s= 0.492 n= 1708
log:abk log:g
s= 0.492 n= 1708
s= 0.476 n= 1499
s= 0.608 n= 209
log:ci log:dehl
s= 0.930 n= 1467
s= 0.883 n= 223
s= 0.938 n= 1244
log:ehl log:d
s= 0.938 n= 1244
s= 0.934 n= 1060
s= 0.962 n= 184
attr: cat.list attr: cat.list
Legend: s= succ rate n= # of runs
Prof. Jeff Tian Spring 2015

Software Reliability and Safety CSE 8317 (SRE.2)23
TBRM Simple Example
• 1 numerical predictor and 1 response:
⊲ Binary operator (≥) for partitioning
⊲ Example: Fig 15 (Tian 1998)
rsn<1487.5 rsn>1487.5
s= 0.675 n= 3331
s= 0.407 n= 1487
s= 0.890 n= 1844
rsn<519.5 rsn>519.5
s= 0.407 n= 1487
s= 0.320 n= 519
s= 0.454 n= 968
rsn<309.5 rsn>309.5
s= 0.320 n= 519
s= 0.417 n= 309
s= 0.176 n= 210
rsn<137.5 rsn>137.5
s= 0.417 n= 309
s= 0.241 n= 137
s= 0.558 n= 172
rsn<1850.5 rsn>1850.5
s= 0.890 n= 1844
s= 0.730 n= 363
s= 0.930 n= 1481
attr<cutoff attr>cutoff
Legend: s= succ rate n= # of runs
Prof. Jeff Tian Spring 2015

Software Reliability and Safety CSE 8317 (SRE.2)24
TBRM Simple Example
• 1 categorical predictor and 1 response:
⊲ Interpretation as piecewise linear model
⊲ Example continued: Fig 14 (Tian 1998)
••••••••••••
••••
•••••••
••• •
•••••••
• •••••
•••••••
•••••
••••••••
•••
••• •• •••••••
••••••••••••••••••••••••
• • ••• • • • • ••• • • •• ••• •• •••••••• ••••
Cumulative Runs
Cum
ulat
ive
Fai
lure
s
0 1000 2000 3000
020
040
060
080
010
00 piecewise linear modelGoel-Okumoto model
• actual data
Prof. Jeff Tian Spring 2015

Software Reliability and Safety CSE 8317 (SRE.2)25
TBRM Example
• n mixed predictors and 1 response:
⊲ full TBRM
⊲ Example: Fig 11 (Tian 1998)
rsn<1487.5 rsn>1487.5
s= 0.675 n= 3331
s= 0.407 n= 1487
s= 0.890 n= 1844
tester:cfjlnpq tester:abikmr
s= 0.407 n= 1487
s= 0.243 n= 569
s= 0.509 n= 918
rsn<519.5 rsn>519.5
s= 0.509 n= 918
s= 0.351 n= 350
s= 0.606 n= 568
log:ak log:g
s= 0.351 n= 350
s= 0.239 n= 238
s= 0.589 n= 112
rsn<1850.5 rsn>1850.5
s= 0.890 n= 1844
s= 0.730 n= 363
s= 0.930 n= 1481
attr<cutoff {or}
attr: cat.list
attr>cutoff {or}
attr: cat.list
Legend: s= succ rate n= # of runs
Prof. Jeff Tian Spring 2015

Software Reliability and Safety CSE 8317 (SRE.2)26
TBRM in Integrated Analysis
• Tree-based reliability models (TBRMs)
using all information:
⊲ Input domain partitioning information.
⊲ Testing results.
⊲ Timing information.
⊲ Each run as a data point.
• Model construction:
⊲ Response: Result indicator.
– 1 for success, 0 for failure.
⇒ Nelson model for subsets.
– Mapping to failure rate or MTBF.
⊲ Predictor: Timing and input states.
– Data sensitive partitioning.
– Key factors affecting reliability.
– Homogeneity of product reliability.
Prof. Jeff Tian Spring 2015

Software Reliability and Safety CSE 8317 (SRE.2)27
Using Integrated Analysis
• Interpretation of trees:
⊲ Predicted response: success rate.
(Nelson reliability estimate.)
⊲ Time predictor: reliability change.
⊲ State predictor: risk identification.
• Monitoring reliability change:
⊲ Change in predicted response.
⊲ Through tree structural change.
• Risk identification and remedies:
⊲ Identify high risk input state.
⊲ Additional analysis.
⊲ Enhanced test cases.
⊲ Remedies for components.
Prof. Jeff Tian Spring 2015
Software Reliability and Safety CSE 8317 (SRE.2)28
TBRMs in Integrated Analysis
• Treatment of product bundles:
⊲ TBRM for individual products.
⊲ Dynamic change w.r.t. process needs.
⊲ SRGM (& TBRM) for bundle near exit.
• Risk identification:
⊲ High risk input sub-domains.
⊲ Additional analysis for the identified.
⊲ Guide for remedial actions.
• Results interpretation:
⊲ Progression of trees & tree types.
⊲ Usage as exit criteria.
Prof. Jeff Tian Spring 2015

Software Reliability and Safety CSE 8317 (SRE.2)29
TBRMs at Different Times
SC:abcefgijklm SC:dh
s= 0.420 n= 100
s= 0.378 n= 90
s= 0.800 n= 10
SN<16.5 SN>16.5
s= 0.378 n= 90
s= 0.398 n= 83
s= 0.143 n= 7
SN<11.5 SN>11.5
s= 0.398 n= 83
s= 0.366 n= 71
s= 0.583 n= 12
SC:ai SC:bcefgjklm
s= 0.366 n= 71
s= 0.167 n= 12
s= 0.407 n= 59
• Fig 12a (Tian 1998): an early TBRM.
⊲ high-risk areas identified by input
⊲ early actions to improve reliability
Prof. Jeff Tian Spring 2015

Software Reliability and Safety CSE 8317 (SRE.2)30
TBRMs at Different Times
tday<37.5 tday>37.5
s= 0.606 n= 208
s= 0.526 n= 156
s= 0.846 n= 52
day<27.5 day>27.5
s= 0.526 n= 156
s= 0.550 n= 149
s= 0.000 n= 7
tday<31.5 tday>31.5
s= 0.550 n= 149
s= 0.598 n= 127
s= 0.273 n= 22
SC:h SC:abcdefgijklm
s= 0.598 n= 127
s= 0.000 n= 5
s= 0.623 n= 122
SC:bfgjl SC:cdm
s= 0.273 n= 22
s= 0.118 n= 17
s= 0.800 n= 5
attr<cutoff {or}
attr: cat.list
attr>cutoff {or}
attr: cat.list
Legend: s= succ rate n= # of runs
• Fig 12b (Tian 1998): a late TBRM.
⊲ high-risk areas ≈ early runs
⊲ uniformly reliable ⇒ ready for release
Prof. Jeff Tian Spring 2015

Software Reliability and Safety CSE 8317 (SRE.2)31
Cross Validation
• Consistency with macro models:
⇒ Effects on cost, schedule, quality.
• Validate with reliability growth models:
⊲ Trend of reliability growth.
⊲ Stability of failure arrivals.
⊲ Estimated reliability.
⊲ Product purity level at exit.
• Process changes & improvements:
⊲ Failure detection and fault removal.
⊲ Long term effect on development.
• Ultimate test: in-field problems.
Prof. Jeff Tian Spring 2015

Software Reliability and Safety CSE 8317 (SRE.2)32
TBRM Result Comparison
Cumulative Runs / Total Runs
Cum
ulat
ive
Fai
lure
s / T
otal
Fai
lure
s
0.0 0.2 0.4 0.6 0.8 1.0
0.0
0.2
0.4
0.6
0.8
1.0
ProductABCD
• Fig 22.6 (p.384): TBRMs used in D
⊲ better reliability growth in D
⊲ compare to A, B, and C (no TBRMs)
Prof. Jeff Tian Spring 2015

Software Reliability and Safety CSE 8317 (SRE.2)33
TBRM Result Comparison
• Table 22.3 (p.384):
quantitative comparison with ρ
Purification ProductLevel ρ A B C D
maximum 0.715 0.527 0.542 0.990median 0.653 0.525 0.447 0.940
minimum 0.578 0.520 0.351 0.939
Where: ρ =λ0 − λT
λ0
= 1 −λT
λ0λ0: failure rate at start of testingλT : failure rate at end of testing
Prof. Jeff Tian Spring 2015

Software Reliability and Safety CSE 8317 (SRE.2)34
Integrated Approach: Implementation
• Modified testing process: Fig 18 (Tian 1998)
⊲ Additional link for data analysis.
⊲ Process change and remedial actions.
Test planingTestcase construction/ selection
Test Execution/Data Gathering
GraphicalTracking
SRGMAnalysis
TBRMAnalysis
ExitCriteriaMet?
Other Management Activities (schedule, effort, resource ...)
YES
NO
NextStage
MetEntryCriteria
PreviousStage Remedial
Actions &Adjustments
Test Tracking/AnalysisDefectHandling
Prof. Jeff Tian Spring 2015

Software Reliability and Safety CSE 8317 (SRE.2)35
Integrated Approach: Implementation
• Tool support: Fig 20 (Tian 1998)
⊲ different types of tools
⊲ I/O and interconnection
Reports
Result
and Analysis
Visualization
Data
Input state
Execution
Result Reliability Growth Modeling
Regression analysis
Reliability growth modeling
Tree-based test data analysis
Tree-based design/code quality analysis
Data visualization
Result presentation
Tree exploration
S-PLUS and associated S programs
Test Logs
Test case
and
Execution
Information
ExplorationResults
SMERFS Tree Browser
Tree exploration
Data Capturing Tools Analysis Tools Presentation Tools
Defect Logs
Detailed Logs
DetailedExecutionInformation
Prof. Jeff Tian Spring 2015

Software Reliability and Safety CSE 8317 (SRE.2)36
Integrated Approach: Implementation
• Activities and Responsibilities:
⊲ Evolutionary, stepwise refinement.
⊲ Collaboration: project & quality orgs.
⊲ Experience factory prototype (Basili).
• Implementation:
⊲ Passive tracking and active guidance.
⊲ Periodic and event-triggered.
⊲ S/W tool support
Prof. Jeff Tian Spring 2015

Software Reliability and Safety CSE 8317 (SRE.2)37
Implementation Support
• Types of tool support:
⊲ Data capturing
– mostly existing logging tools
– modified to capture new data
⊲ Analysis and modeling
– SMERFS modeling tool
– S-PLUS and related programs
⊲ Presentation/visualization and feedback
– S-PLUS and Tree-Browser
• Implementation of tool support:
⊲ Existing (IBM+others) tools: cost ↓
⊲ New tools and utility programs
⊲ Tool integration
– loosely coupled suite of tools
– connectors/utility programs
– common depository: S-PLUS
Prof. Jeff Tian Spring 2015

Software Reliability and Safety CSE 8317 (SRE.2)38
Application Summary
• Tracking and input-domain analysis:
⊲ Effectiveness of visualization.
⊲ Problems with input-domain assessment.
• Time-domain analysis refinement:
⊲ Data normalization by runs/trans best.
⊲ Context sensitive modeling promising.
• Integrated approach using TBRM:
⊲ Guidance as well as assessment.
⊲ Risk focusing ⇒ reliability improvement.
⊲ Progression of trees.
⊲ Usage as exit criteria.
⊲ Cross validation.
Prof. Jeff Tian Spring 2015

Software Reliability and Safety CSE 8317 (SRE.2)39
Future Directions
• Implementation and deployment:
⊲ Data: automated data capturing.
⊲ OP: evolutionary approach.
⊲ Integration: analysis and improvement.
⊲ Use in different industrial environments.
• Exploration and improvement:
⊲ Customize time/transaction measurement.
⊲ Early indicators/predictive modeling.
⊲ Customer environment/OP refinement.
⊲ Integrate to life-cycle quality models.
⊲ Management and cost modeling.
⊲ Refinement of modeling techniques.
• Continued research at SMU and
collaboration with our industrial partners.
Prof. Jeff Tian Spring 2015