Software Process Improvement Impacting the Bottom Line by using Powerful “Solutions” David F....
43
Software Process Improvement Impacting the Bottom Line by using Powerful “Solutions” David F. Rico
-
Upload
bridget-powers -
Category
Documents
-
view
216 -
download
0
Transcript of Software Process Improvement Impacting the Bottom Line by using Powerful “Solutions” David F....

Software Process Improvement
Impacting the Bottom Lineby using Powerful “Solutions”
David F. Rico

2
Software Process Improvement
Characterizing, measuring, & improving software processes, leading to:
• Greater product innovation
• Higher product quality
• Faster cycle times
• Lower costs

3
Topics
• Benefactors• Alternative SPI Models• Powerful SPI “Solutions”• How much does SPI Cost ???• How do you measure Quality ???• Myths & Misconceptions• Model Corporate Culture• Use Powerful “Solutions”

4
Benefactors
Motorola
IBM
Hewlett Packard
Raytheon
NEC

5
Motorola
Level 1
Software Capability Maturity Model® (CMM®) Maturity
Level 2 Level 3 Level 4 Level 5
1
2
3
4
5
6
7
8
9
10Productivity Increase
Defect Reduction
Cycle Time Reduction
Diaz, M., & Sligo, J. (1997). How software process improvement helped motorola. IEEE Software, 14(5), 75-81.® Capability Maturity Model and CMM are registered in the U.S. Patent and Trademark Office.

6
Motorola
InspectionDefects
TestDefects
FieldedDefects
TotalDefects
SLOCProject
Total 575
139
17
20
79
20
9
12
0
29
15
34
1
2
0
69
47
69
13
1
0
0
0
0
0
0
0
0
0
0
1
0
0
0
0
0
0
0
136
50
3
1
27
2
2
2
0
2
2
0
0
0
0
22
8
10
5
438
89
14
19
52
18
7
10
0
27
13
33
1
2
0
47
39
59
8
25,114
3,494
467
1,270
2,075
3,894
720
620
7
364
114
2,081
1
22
5
3,381
1,571
4,565
463
14
15
16
17
18
13
12
11
10
9
8
7
6
5
4
3
2
1
Appraisal/Failure Ratio
Inspection Efficiency
Test Efficiency
Defect Insertion Rate
Defect Removal Efficiency =
=
=
=
= 3.22 : 1
76.2 %
99.3 %
4.4 %
99.8 %
Personal Software Process SM (PSP SM ) Results
Ferguson, P., Humphrey, W. S., Khajenoori, S., Macke, S., & Matvya, A. (1997). Results of applying the personal software process. IEEE Computer, 30(5), 24-31.
Personal Software Process and PSP are service marks of Carnegie Mellon University.

7
IBM
76 77 78 79 80 81 82 83 84 85 86 87 89 90 91 92 9388
Incremental Life Cycle
Design Stabilization
Automated Testing
Inspection Process
Statistical Process Control
Defect Prevention
InformalEra
FormalEra
0
1
2
3
4
5
6
7
8
Defectsper
KSLOC
ChallengerDisaster
FirstFlight
CMMLevel 5
Billings, C., Clifton, J., Kolkhorst, B., Lee, E., & Wingert, W. B. (1994). Journey to a mature software process. IBM Systems Journal, 33(1), 4-19.

8
IBM
Quality Estimation Accuracy
Project Size Language Spec
A 680K Jovial
B 30K PL/1
C 70K BAL
D 1,700K Jovial
E 290K Ada
F 70K --
G 540K Ada
H 700K Ada
Design CodeUnitTest
CompTest
SystemTest
FirstYear
ProductLife
EstimateAccuracy
4
2
6
4
4
1
2
6
--
7
25
10
8
2
5
7
13
14
6
15
13
4
12
14
0.6
6.0
0.3
0.9
0.7
2.1
1.1
0.4
0.6
6.0
0.4
0.8
0.6
2.2
1.2
0.4
0.3
3.0
0.2
0.4
0.3
1.1
0.6
0.2
2
--
0.5
3
0.1
0.9
1.8
0.4
4
7
2
3
8
5
4
1
5
9
3
4
--
6
12
3
Kan, S. H. (1995). Metrics and models in software quality engineering. Reading, MA: Addison-Wesley.
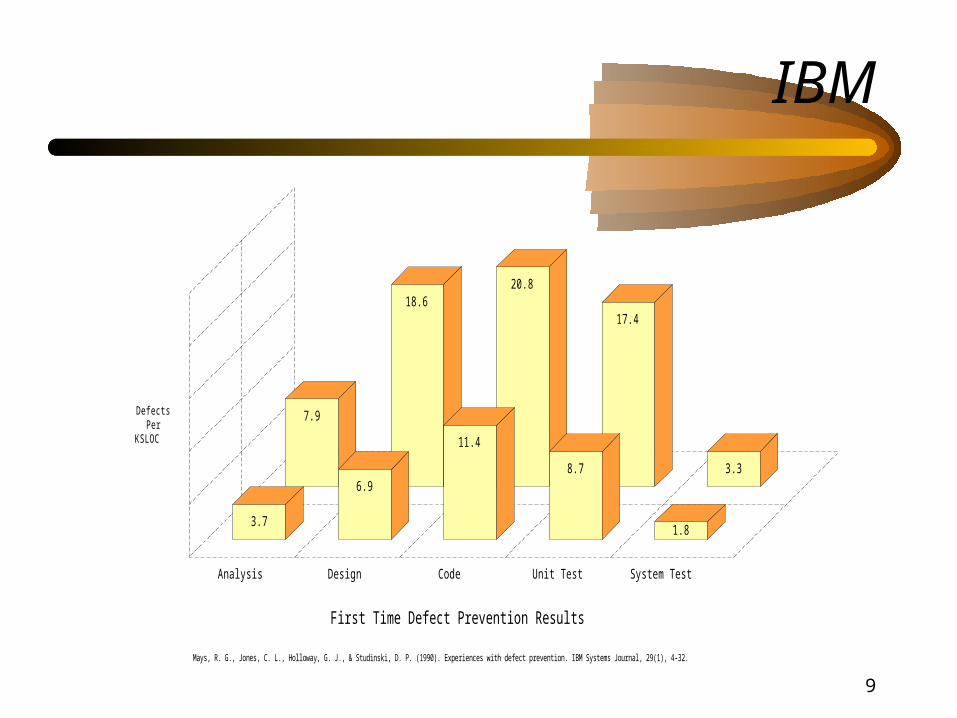
9
IBM
1.83.7
7.9
6.9
18.617.4
8.7 3.3
Analysis Design Code Unit Test System Test
DefectsPer
KSLOC
20.8
11.4
First Time Defect Prevention Results
Mays, R. G., Jones, C. L., Holloway, G. J., & Studinski, D. P. (1990). Experiences with defect prevention. IBM Systems Journal, 29(1), 4-32.
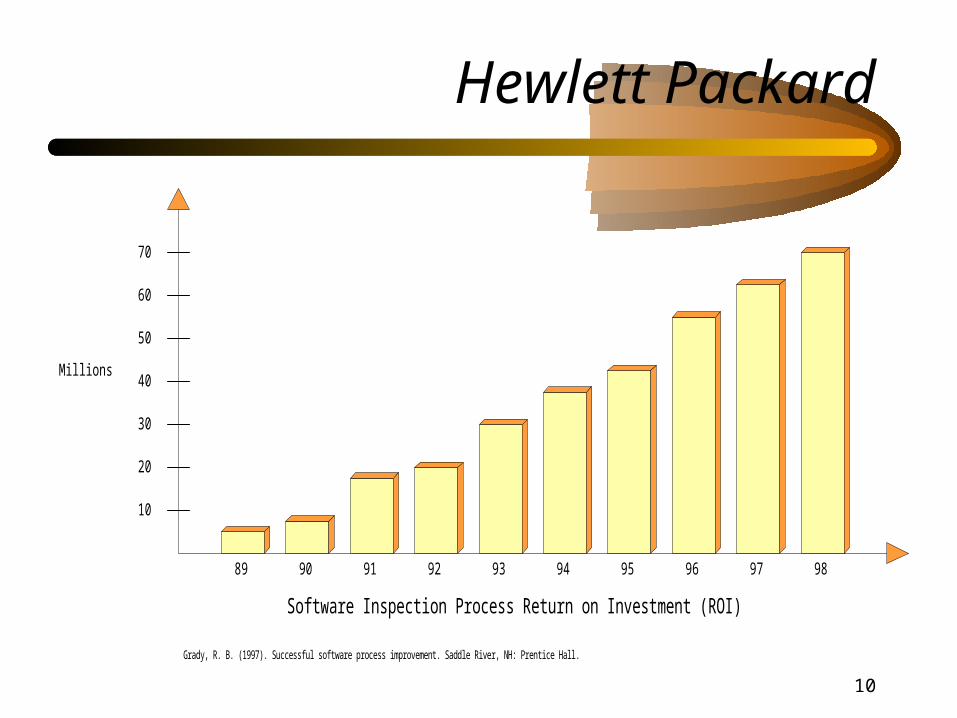
10
Hewlett Packard
89
Millions
90 91 92 93 94 95 96 97 98
10
20
30
40
50
60
70
Software Inspection Process Return on Investment (ROI)
Grady, R. B. (1997). Successful software process improvement. Saddle River, NH: Prentice Hall.
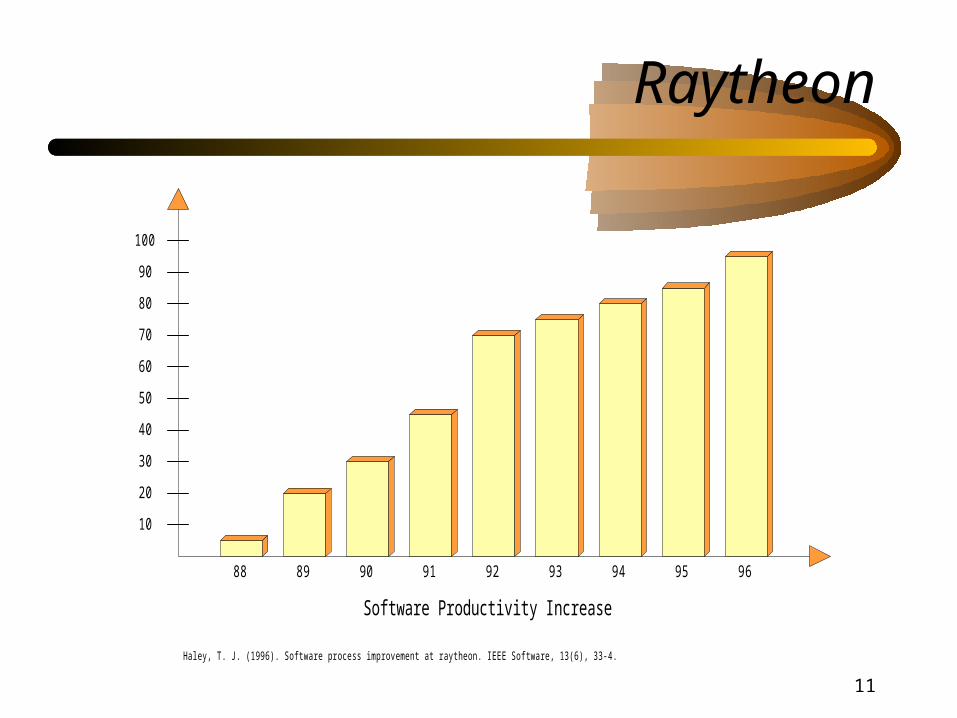
11
Raytheon
88 89 90 91 92 93 94 95 96
10
20
30
40
50
60
70
Software Productivity Increase
80
90
100
Haley, T. J. (1996). Software process improvement at raytheon. IEEE Software, 13(6), 33-4.

12
NEC
84
Defects
85 86 87 88 89 90 91 92 93
20
40
60
80
Defect Prevention Results (Corporate-Wide)
100
Kajihara, J., Amamiya, G, & Saya, T. (1993). Learning from bugs. IEEE Software, 10(5), 46-54.

13
High Maturity
1989-95
CMM
Lev
el 4
and
5 Bu
sines
s Uni
ts
10
20
30
40
1996 1997 1998 1999 2000 2001 2002
74
6
9
3432
35
3
Year "Certified" at High Maturity
Software Engineering Institute. (March 27/2002). Software engineering community's compiled list of published maturity levels [WWW document]. URL http://www.sei.cmu.edu/sema/pub_ml.html
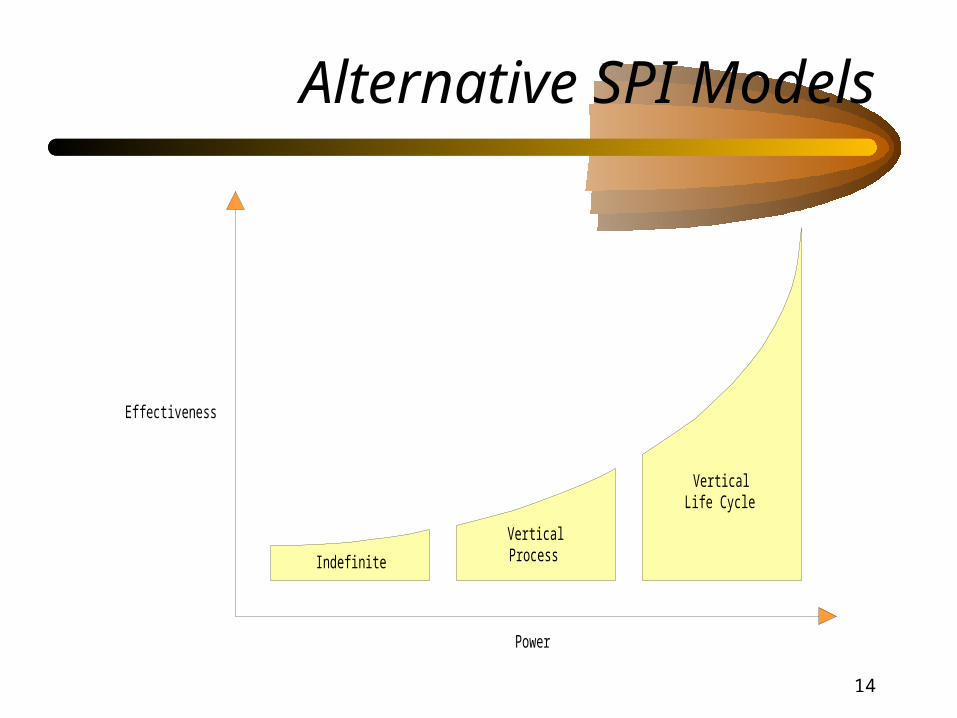
14
Alternative SPI Models
Power
Effectiveness
VerticalLife Cycle
VerticalProcessIndefinite

15
Indefinite
KaizenISO
9000Experience
Factory
GoalQuestion
Metric
TotalQuality
Management
CapabilityMaturity
Model
BusinessProcess
Reengineering
Power
Effectiveness

16
Vertical Process
ConfigurationManagement
Test InspectionQuality
Estimation
StatisticalProcessControl
DefectClassification
DefectPrevention
Power
Effectiveness

17
Vertical Life Cycle
Power
Effectiveness
PersonalSoftwareProcess
DefectRemoval
Model
ProductLine
Management

18
Powerful SPI “Solutions”
SPCDefect
Classification
DefectPrevention
PersonalSoftwareProcess
DefectRemoval
Model
Inspection
Power
Effectiveness
DesignManagement

19
Design Management
CompetitionEvaluation
Management
TechnologyTrend
Management
TechnologySelection
Management
PrototypeManagement
DesignVariation
Management
DesignClassificationManagement
ProductLine
Management
Power
Effectiveness
20
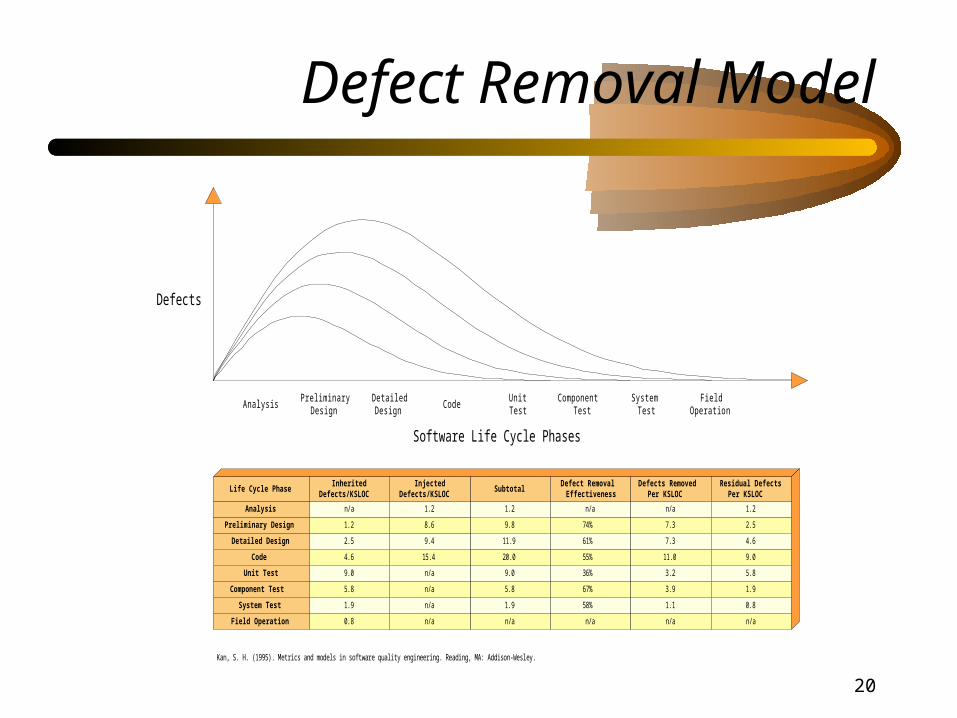
Defect Removal Model
AnalysisPreliminary
DesignDetailedDesign
UnitTest
SystemTest
FieldOperation
ComponentTest
Defects
Software Life Cycle Phases
Code
Detailed Design
Code
Component Test
System Test
Field Operation
Unit Test
Preliminary Design
Analysis
55%
67%
58%
n/a
36%
74%
61%
n/a
Defect RemovalEffectiveness
1.2
20.0
5.8
1.9
n/a
9.0
9.8
11.9
Subtotal
9.4
15.4
8.6
1.2
n/a
n/a
n/a
n/a
InjectedDefects/KSLOC
2.5
4.6
5.8
1.9
0.8
9.0
1.2
n/a
InheritedDefects/KSLOC
11.0
3.9
1.1
n/a
3.2
7.3
7.3
n/a
Defects RemovedPer KSLOC
9.0
1.9
0.8
n/a
5.8
2.5
4.6
1.2
Residual DefectsPer KSLOC
Life Cycle Phase
Kan, S. H. (1995). Metrics and models in software quality engineering. Reading, MA: Addison-Wesley.

21
Personal Software Process
PlanningPhase
AnalysisPhase
DesignPhase
CodePhase
TestPhase
CompilePhase
InspectionDefects
BaseLOC
DeletedLOC
ModifiedLOC
AddedLOC
ReusedLOC
New & ChangedLOC
TotalLOC
Total NewReused
InterruptionTime
DeltaTime
Planned TimeIn Phase
Actual TimeIn Phase
TotalTime
Time InPhase To Date
Total TimeTo Date
Time InPhase To Date %
CompileTime
TestTime
Defect
DefectType
FixTime
LOC/Hour
EstimatingAccuracy
Test DefectsPer KSLOC
Compile DefectsPer KSLOC
Total DefectsPer KSLOC
Yield
AppraisalTime
FailureTime
Cost ofQuality (COQ)
COQ Appraisal/Failure Ratio (A/FR)
ReviewRate
DefectInsertion Rate
Defect RemovalEfficiency
InspectionEfficiency
Personal Software Process (PSP) Metrics
Hayes, W., & Over, J. W. (1997). The personal software process (PSP): An empirical study of the impact of PSP on individual engineers (CMU/SEI-97-TR-001). Pitt sburg, PA: SoftwareEngineering Institute.
22
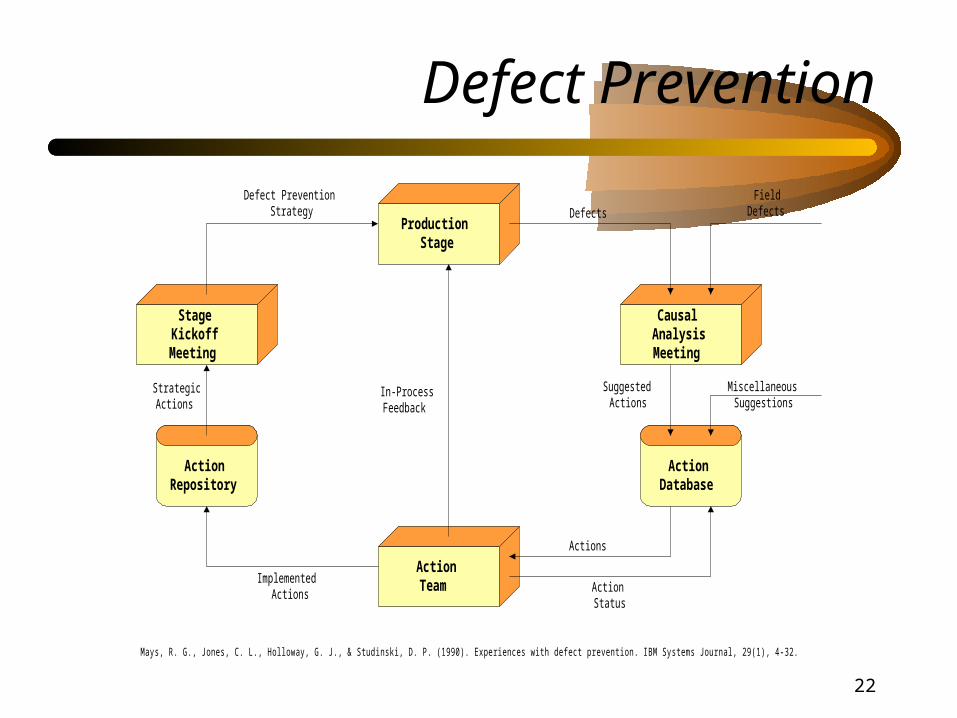
Defect Prevention
CausalAnalysisMeeting
ActionTeam
StageKickoffMeeting
ProductionStage
ActionDatabase
ActionRepository
DefectsField
Defects
SuggestedActions
MiscellaneousSuggestions
Actions
ActionStatus
ImplementedActions
StrategicActions
Defect PreventionStrategy
In-ProcessFeedback
Mays, R. G., Jones, C. L., Holloway, G. J., & Studinski, D. P. (1990). Experiences with defect prevention. IBM Systems Journal, 29(1), 4-32.

23
Defect Classification
Stage Orthogonality
Objectivity
Production Cycle
Analysis Design Code Test
Stage Stage Stage Stage
Rapid Analysis
Rapid Feedback Automated
Fix Classify
Type1
Type2
Typen
Planning Overview Preparation Inspection Rework Followup
Substage Substage Substage Substage Substage Substage
Inspection Process
DefectDatabase
Chillarege, R., Bhandari, I. S., Chaar, J. K., Halliday, M. J., Moebus, D. S., Ray, B. K., & Wong, M. Y. (1992). Orthogonal defectclassification-A concept for in-process measurements. IEEE Transactions on Software Engineering, 18(11), 943-956.

24
Statistical Process Control
Defects
Time
Burr, A., & Owen, M. (1996). Statistical methods for software quality: Using metrics for process improvement. Boston, MA: International Thomson Publishing.
25
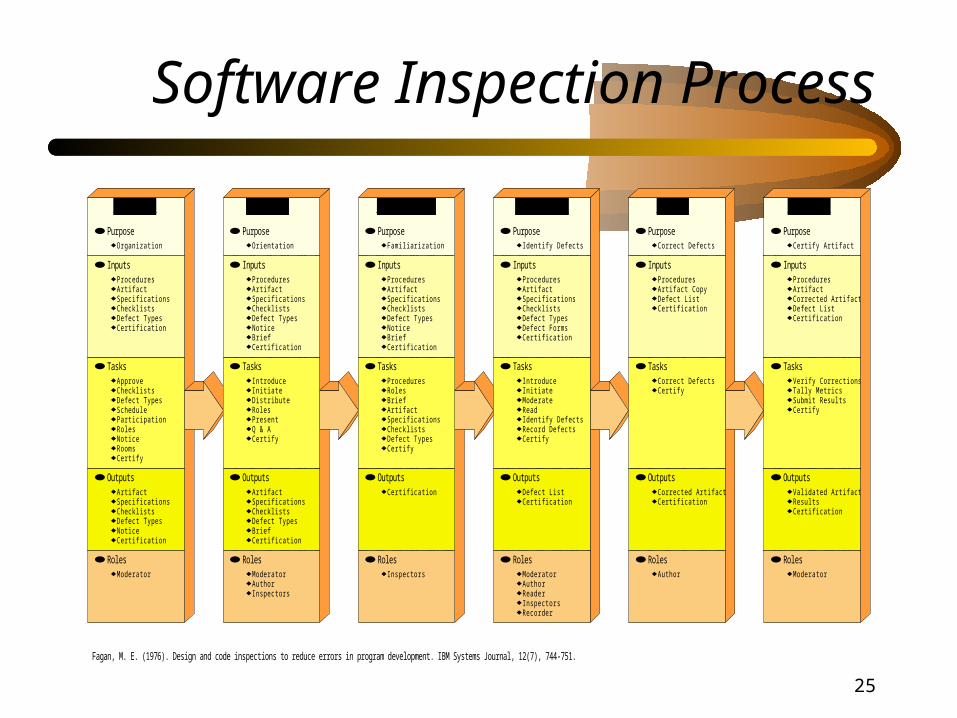
Software Inspection Process
Planning
Organization
ArtifactSpecificationsChecklists
Approve
ScheduleParticipation
NoticeRoomsCertify
ArtifactSpecificationsChecklists
Certification
Moderator
Purpose
Inputs
Tasks
Outputs
Roles
Overview
Orientation
ArtifactSpecificationsChecklistsDefect Types
IntroduceInitiate
Artifact
ModeratorAuthorInspectors
Purpose
Inputs
Tasks
Outputs
Roles
Preparation
Familiarization
ArtifactSpecificationsChecklistsDefect Types
Procedures
Certification
Inspectors
Purpose
Inputs
Tasks
Outputs
Roles
Inspection
Identify Defects
ArtifactSpecificationsChecklistsDefect TypesDefect Forms
IntroduceInitiate
ReadIdentify DefectsRecord Defects
Defect ListCertification
ModeratorAuthorReaderInspectorsRecorder
Purpose
Inputs
Tasks
Outputs
Roles
Rework
Correct Defects
Artifact CopyDefect ListCertification
Correct DefectsCertify
Corrected ArtifactCertification
Author
Purpose
Inputs
Tasks
Outputs
Roles
Followup
Certify Artifact
ArtifactCorrected ArtifactDefect ListCertification
Verify CorrectionsTally Metrics
Certify
Validated ArtifactResultsCertification
Moderator
Purpose
Inputs
Tasks
Outputs
Roles
Specifications
Present
Checklists
Certification
Q & ACertify
BriefCertification
Distribute
Defect TypesCertification
Checklists
Defect TypesNotice
Defect Types
Defect TypesBrief
BriefCertification
Procedures
Roles
Notice
Roles
Procedures Procedures
Notice
RolesBriefArtifactSpecificationsChecklistsDefect TypesCertify
Procedures
Certification
Moderate
Certify
Procedures Procedures
Submit Results
Fagan, M. E. (1976). Design and code inspections to reduce errors in program development. IBM Systems Journal, 12(7), 744-751.

26
How much does SPI Cost ?
• Personal Software Process
• Software Inspection Process
• Hewlett Packard
• Software Productivity Research
• Rome Labs
• Software Engineering Institute

27
Personal Software Process
Empirical Cost Models
100
Days
Source Lines of Code (SLOC)
1,000 10,000
50
0
25
=
=
=
PSP Hours
PSP Days
PSP Weeks
SLOC / 25
SLOC / 200
SLOC / 1,000
0.5
5
50
Hayes, W., & Over, J. W. (1997). The personal software process (PSP): An empirical study of the impact of PSP on individual engineers (CMU/SEI-97-TR-001). Pittsburg, PA: Software Engineering Institute.

28
Software Inspection Process
0.5
1.0
1.5
2.0
Hours
0.5 * M 1.0 * P 1.0 * I
Hours = Product Size / ( Inspection Rate * 2 ) * ( Team Size * 4 + 1)
+ +
OverviewSubstage
2.0 * P 1.0 * C 0.5 * M+ + +
PlanningSubstage
FollowupSubstage
10,000 Lines
People180 SLOCPer Hour
120 SLOCPer Hour
60 SLOCPer Hour
4 1,417 708 472
5 1,750 875 583
6 2,083 1,042 694
7 2,417 1,208 806
100,000 Lines
180 SLOCPer Hour
120 SLOCPer Hour
60 SLOCPer Hour
1,000,000 Lines
180 SLOCPer Hour
120 SLOCPer Hour
60 SLOCPer Hour
20,833
17,500
14,167
24,167
10,417
8,750
7,083
12,083
6,944
5,833
4,722
8,056
208,333
175,000
141,667
241,667
104,167
87,500
70,833
120,833
69,444
58,333
47,222
80,556
PreparationSubstage
InspectionSubstage
ReworkSubstage
Russell, G. W. (1991). Experience with inspection in ultralarge-scale developments. IEEE Software, 8(1), 25-31.
29
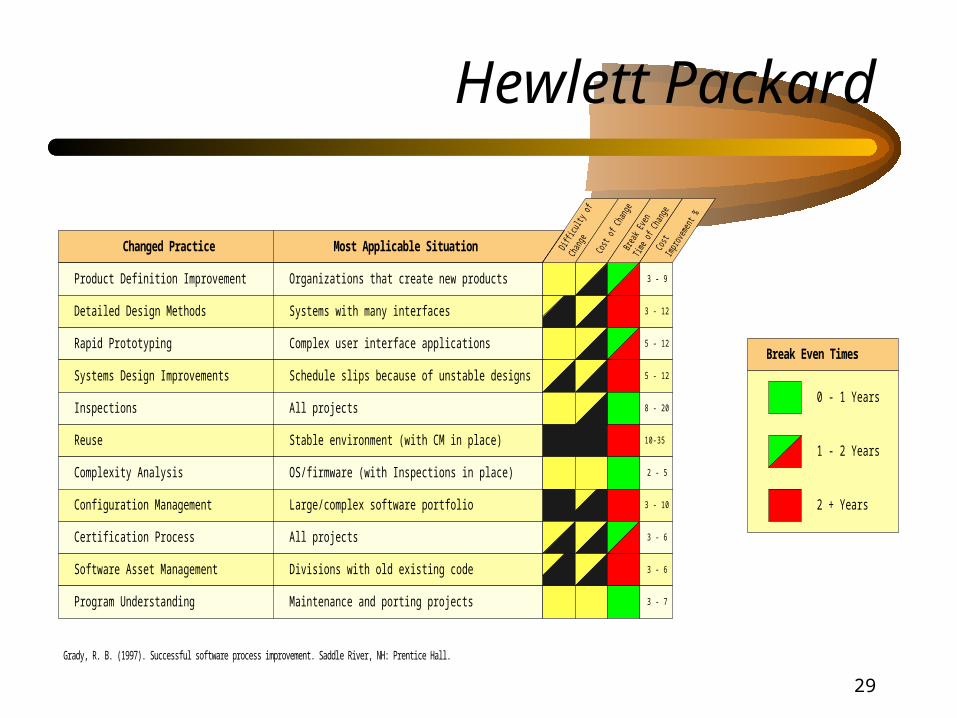
Hewlett Packard
Most Applicable Situation
Organizations that create new products
Systems with many interfaces
Complex user interface applications
Schedule slips because of unstable designs
All projects
Stable environment (with CM in place)
OS/firmware (with Inspections in place)
Large/complex software portfolio
All projects
Divisions with old existing code
Maintenance and porting projects
Changed Practice Diffi
culty
ofCh
ange
Cost
of C
hang
eBr
eak E
ven
Time o
f Cha
nge
Product Definition Improvement
Detailed Design Methods
Rapid Prototyping
Systems Design Improvements
Inspections
Reuse
Complexity Analysis
Configuration Management
Certification Process
Software Asset Management
Program Understanding
3 - 9
3 - 12
5 - 12
5 - 12
8 - 20
10-35
2 - 5
3 - 10
3 - 6
3 - 6
3 - 7
Cost
Impr
ovem
ent %
0 - 1 Years
1 - 2 Years
2 + Years
Break Even Times
Grady, R. B. (1997). Successful software process improvement. Saddle River, NH: Prentice Hall.
30
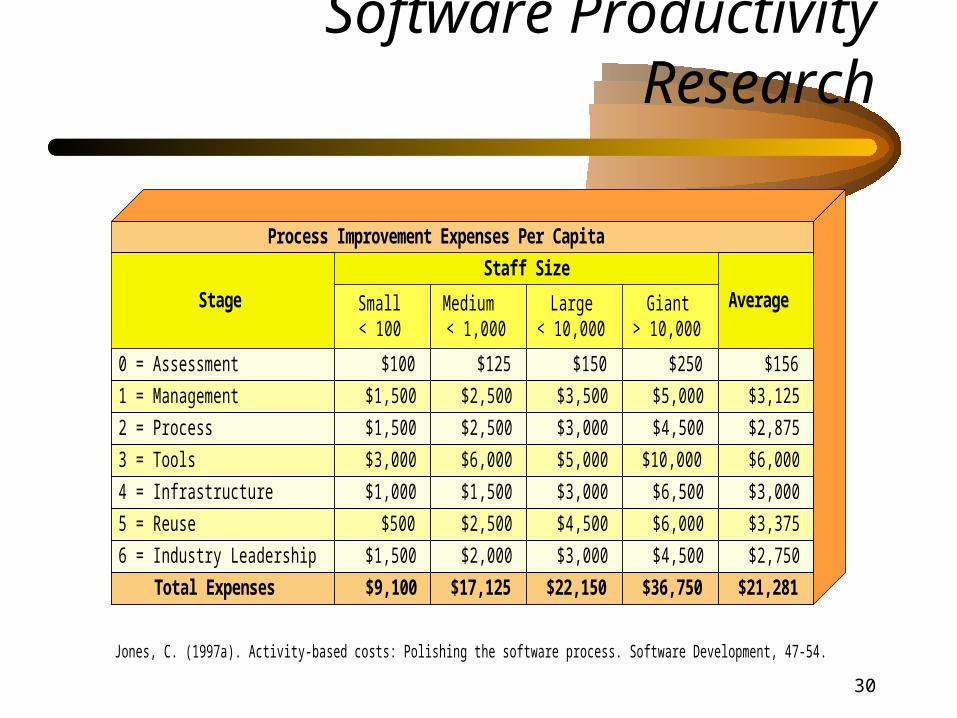
Software Productivity Research
$100 $125 $150 $250
$1,500 $2,500 $3,500 $5,000
$1,500 $2,500 $3,000 $4,500
$3,000 $6,000 $5,000 $10,000
$1,000 $1,500 $3,000 $6,500
$500 $2,500 $4,500 $6,000
$1,500 $2,000 $3,000 $4,500
$9,100 $17,125 $22,150 $36,750
Small< 100
Medium< 1,000
Large< 10,000
Giant> 10,000
Staff Size
Process Improvement Expenses Per Capita
0 = Assessment
1 = Management
2 = Process
3 = Tools
4 = Infrastructure
5 = Reuse
6 = Industry Leadership
Total Expenses
Stage
$156
$3,125
$2,875
$6,000
$3,000
$3,375
$2,750
$21,281
Average
Jones, C. (1997a). Activity-based costs: Polishing the software process. Software Development, 47-54.

31
Software Productivity Research
2.00 2.00 3.00 4.00
3.00 6.00 9.00 12.00
4.00 6.00 9.00 15.00
4.00 6.00 9.00 12.00
3.00 4.00 9.00 12.00
4.00 6.00 12.00 16.00
6.00 8.00 9.00 12.00
26.00 38.00 60.00 83.00
Small< 100
Medium< 1,000
Large< 10,000
Giant> 10,000
Staff Size
Process Improvement Stages in Calendar Months
16.90 26.60 43.20 61.42
0 = Assessment
1 = Management
2 = Process
3 = Tools
4 = Infrastructure
5 = Reuse
6 = Industry Leadership
Sum (worst case)
Stage
Overlap (best case)
2.75
7.50
8.50
7.75
7.00
9.50
8.75
51.75
Average
33.64
Jones, C. (1997a). Activity-based costs: Polishing the software process. Software Development, 47-54.

32
Rome Labs
0 = Assessment
1 = Management
2 = Process
3 = Tools
4 = Infrastructure
5 = Reuse
6 = Industry Leadership
$2,823
$42,346
$42,346
$141,152
$28,230
$14,115
$42,346
2
3
4
4
3
4
6
279.77
251.79
125.90
113.31
107.64
16.15
15.34
5 LOC/Day
5 LOC/Day
6 LOC/Day
8 LOC/Day
9 LOC/Day
15 LOC/Day
16 LOC/Day
23
21
18
15
15
7
7
$2,493,920
$2,493,920
$1,995,136
$1,447,879
$1,343,526
$814,258
$775,484
$409,159
$368,243
$184,121
$165,709
$157,424
$23,614
$22,433
N/A
0.92 : 1
8.27 : 1
5.51 : 1
5.46 : 1
7.62 : 1
6.72 : 1
Pre-SPI N/A N/A 279.77 5 LOC/Day 23 $2,493,920 $409,159 N/A
Stage
$313,358 2695%
Reduction222%
Increase71%
Reduction69%
Reduction95%
Reduction630%
Increase
Cost toReach Stage
Months toReach Stage
DefectLevels
ProductivityProjectLengths
ProjectCosts
Costs toMaintain
ROI
Total Impact
McGibbon, T. (1996). A business case for software process improvement (Contract Number F30602-92-C-0158). Rome, NY: Air Force Research Laboratory-Information Directorate (AFRL/IF), Data and Analysis Center for Software (DACS).

33
Software Engineering Institute
$49,000 to $1,202,000 $245,000
1 to 9 3.5
$490 to $2,004 $1,375
9% to 67 % 35%
6% to 25% 22%
15% to 23% 19%
10% to 94% 39%
4 : 1 to 9 : 1 5 : 1
Total Yearly Cost of SPI Activities
Years Engaged in SPI
Cost of SPI Per Software Engineer
Productivity Gain Per Year
Pre-Test Defect Detection Gain Per Year
Yearly Cycle Time Reduction
Yearly Post Release Defect Reduction
SPI Return on Investment
Category Range Median
Herbsleb, J., Carleton, A., Rozum, J., Siegel, J., & Zubrow, D. (1994). Benefits of CMM-based softwareprocess improvement: Initial results (CMU/SEI-94-TR-013). Pittsburg, PA: Software Engineering Institute.
34
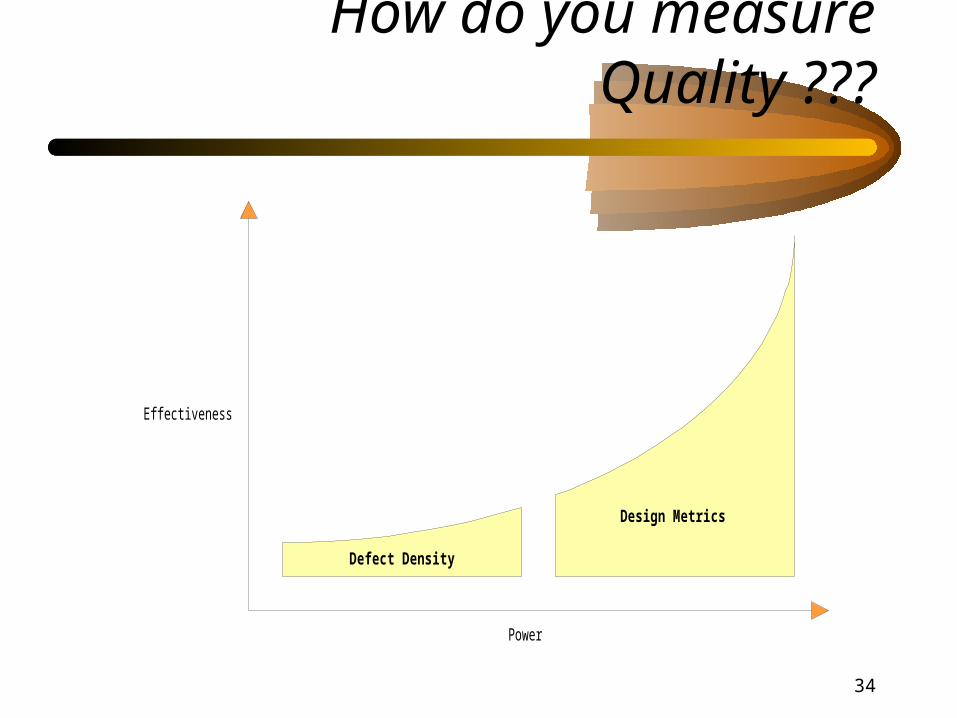
How do you measure Quality ???
Power
Effectiveness
Design Metrics
Defect Density

35
Defect Density
Defect Density
Defect Removal Effectiveness
Early Detection Percentage
Defects
KSLOC
Effectiveness
Inspection Defects
Inserted Defectsx 100 %
Major Inspection Defects
Inserted Defectsx 100 %
Defects
Current Phase + Post Phasex 100 %
Total Defect Containment EffectivenessPre-Release Defects
Pre-Release + Post-Release Defects
Phase Containment EffectivenessPhase Errors
Phase Errors + Phase Defects
Metric Name Metric Algorithm
IEEE
IBM (Michael Fagan)
IBM (NASA Space Shuttle)
Conte
Motorola
Motorola
Source
IEEE standard dictionary of measures to produce reliable software (IEEE Std 982.1-1988). New York, NY: Institute of Electrical and Electronic Engineers, Inc.Fagan, M. E. (1976). Design and code inspections to reduce errors in program development. IBM Systems Journal, 12(7), 744-751.Billings, C., Clifton, J., Kolkhorst, B., Lee, E., & Wingert, W. B. (1994). Journey to a mature software process. IBM Systems Journal, 33(1), 4-19.Conte, S. D., Dunsmore, H. E., Shen, V. Y. (1986). Software engineering metrics and models. Menlo Park, CA: Benjamin/Cummings.Daskalantonakis, M. K. (1992). A practical view of software measurement and implementation experiences within motorola. IEEE Transactions on SoftwareEngineering, 18(11), 998-1010.

36
Universal Design Metrics
Number of calls from a module
Number of module dependencies on other modules
Historical number of removed and residual defects
Current number of removed and residual defects
Historical number of design changes
Number of calls to a module
McCabe's structural complexity of a module
Number of individual paths through a module
Number of modules, dependencies, and database elements
Information flow through structures, procedures, and modules
Number of edges and nodes in software
Halstead's software program complexity
Storage, time, and logic complexity of software
Number of periodic invocations and returns in software
Fan Out
Dependencies
Historical Defectiveness
Current Defectiveness
Design Changes
Fan In
Cyclomatic Complexity
Static Graph Theoretic Complexity
Unit Test Case Determination
Design Structure
Data Flow Complexity
Software Science
Generalized Graph Theoretic Complexity
Dynamic Graph Theoretic Complexity
Universal Metric DefinitionUniversal Metric
Kan, S. H. (1995). Metrics and models in software quality engineering. Reading, MA: Addison-Wesley.

37
Object Oriented Design Metrics
Number of Independent Classes
Number of Single Inheritance
Number of Internal Classes
Number of Abstract Classes
Number of Multiple Inheritance
Number of Hierarchies
System Size in Classes
Average Depth of Inheritance
Measure of Functional Abstraction
Measure of Attribute Abstraction
Data Access Metric
Number of Leaf Classes
Average Width of Inheritance
Average Number of Ancestors
Object Oriented Metric
Operation Access Metric
Class Interface Size
Number of Attributes
Number of Abstract Data Types
Class Size in Bytes
Number of Methods
Number of Inline Methods
Number of Polymorphic Methods
Direct Class Coupling
Direct Attribute Based Coupling
5
66
12
3
0
1
72
1.68
0.065
0.638
0.614
54
0.917
1.68
1.0
0.786
44.6
3.82
0.125
22
56.5
34.7
6.83
6.03
0.139
7
84
18
9
0
1
92
2.11
0.352
0.625
0.484
66
0.913
2.11
2.0
0.737
75.6
5.84
0.728
38.1
102
50.2
18.2
7.59
0.185
14
117
26
8
0
1
132
2.45
0.428
0.634
0.538
91
0.886
2.45
3.0
0.752
95
9.86
1.05
60.6
126
59.5
19.3
9.02
0.333
27
174
34
14
0
5
206
2.33
0.497
0.621
0.563
140
0.845
2.33
4.0
0.757
114
13.7
1.06
89.3
150
53.2
28.3
9.33
0.32
33
194
44
13
0
6
233
2.3
0.494
0.61
0.579
150
0.833
2.3
5.0
0.755
109
13.2
1.12
84.8
144
50.4
28.6
8.94
0.326
27
34
11
2
9
12
82
0.78
0.43
0.4
0.71
32
0.52
1
4.0
0.81
28
5.6
0.26
26
30
8.2
1.9
1.9
0.11
57
56
18
4
13
16
142
0.81
0.39
0.36
0.66
51
0.49
0.96
4.5
0.73
24
6.1
0.46
28
29
8.2
3.1
2.3
0.24
96
202
56
13
30
29
357
1.4
0.45
0.49
0.62
176
0.65
1.6
5.0
0.67
37
12
1
46
56
22
7
4.7
0.38
Microsoft Foundation ClassesBorland
Object Windows Library
Bansiya, J. (1997). Automated metrics and object oriented development. Dr. Dobbs Journal, 16 (12), 42-48 .

38
Relational Design Metrics
Unnecessary use of secondary keys
Necessary use of index on foreign keys
Erroneous, multiple paths between two tables
Erroneous, coincidental existence of cycle or database loop
Unnecessary use of secondary keys
Utilization of domain capability
Consistent use of similar attribute semantics
Failure to use foreign keys and indexes
Too many, redundant indexes on a table
Presence of unused indexes
Redundant attributes, tables, and information
Unnecessary use of foreign keys from dependent tables
Improperly defined use of multiple indexes
Absence of index on child record
Unnecessary Keys
Foreign Key Indexes
Relationships (Multiple Paths)
Relationships (Infinite Loops)
Keys on Similar Attributes
Use of Domains
Attribute Consistency
Unnecessary Denormalization
Missing Indexes (Implied Relationships)
Excessive Indexes
Unnecessary Indexes
Relationships (Implied)
Index Consistency
Missing Indexes (Defined Relationships)
Unique index without a NOT NULL declaration
Table doesn't have mechanism for enforcing uniqueness
Use of similarly named but semantically unique attributes
Use of surrogate keys as primary keys
Erroneous, coincidental presence of redundant attributes
Presence of unnecessary repeating groups
Unique Constraint
No Unique Identifier
Use of Surrogate Keys
Homonym Attributes
Redundant Attributes
Repeating groups
Unrecommended use of controlled and real redundancy
Use of dissimilarly named but semantically identical attributes
Presence of coincidental definition of incorrect relationships
Missing table from database design
Inconsistent Attribute Definition
Inconsistent Constraint Definition
Incorrect Relationship Definition
Missing Tables
Presence of disabled constraints (intentional or coincidental)Disabled Constraints
Relational Metric DefinitionRelational Metric
Siqueira, L. C. (n.d./1997). The impact of design flaws [WWW document]. URL http://www.dbesoftware.com/docs/ImpactDesignFlaws.pdf
39
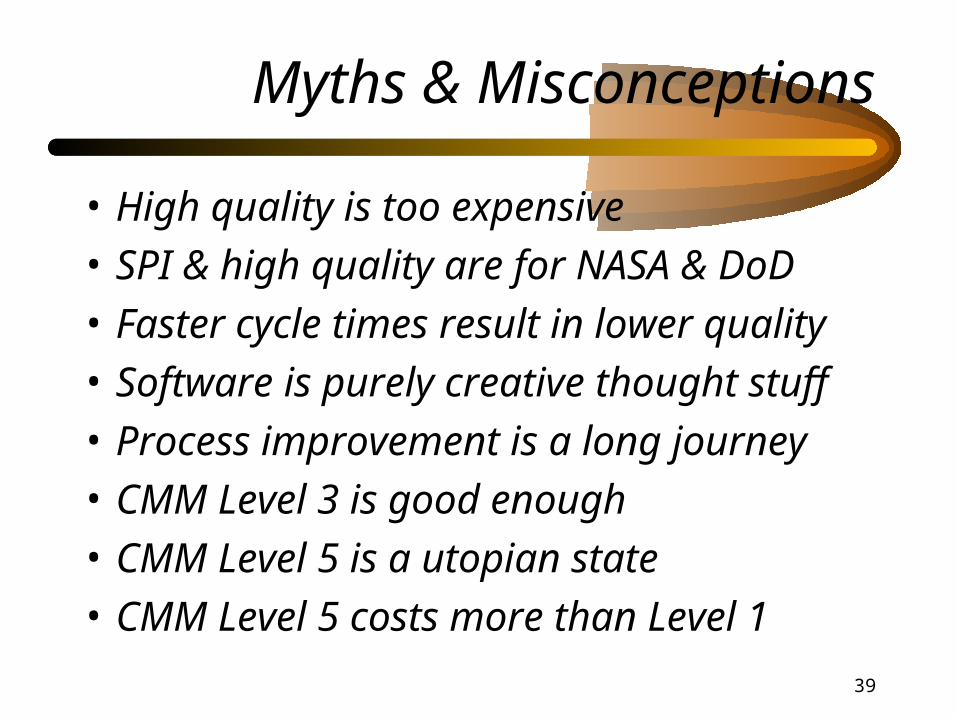
Myths & Misconceptions
• High quality is too expensive• SPI & high quality are for NASA & DoD• Faster cycle times result in lower quality• Software is purely creative thought stuff• Process improvement is a long journey• CMM Level 3 is good enough• CMM Level 5 is a utopian state• CMM Level 5 costs more than Level 1

40
Myths & Misconceptions
• SPI is just a fad• SPI doesn’t affect the bottom line• Metrics are too hard & irrelevant• Quality can’t be measured• SPI is too expensive• CMM is too heavy & complex• CMM certification without change• ISO 9000 certification without change

41
Myths & Misconceptions
• Pervasive myth of partial implementation
• What part of the house can you live without ?
CMM Level 2 (Project Planning)
CMM Level 3(Verification & Validation)
Roof
Foundation
Walls
Utilities (electricity, phone, plumbing)
CMM Level 5(Software Process Improvement)
CMM Level 4(Measurement)

42
Model Corporate Culture
• CEO committed to SPI
• Executives committed to SPI
• Senior management committed to SPI
• Line management committed to SPI
• Staff committed to SPI
• Organization hires people with SPI skills
• Organization cultivates SPI skills

43
Use Powerful “Solutions”
• Learn that SPI affects the “bottom line”
• Aggressively achieve SPI
• Make SPI #1 goal (Ichiban)
• Choose powerful SPI “solutions”
• Create SPI vision, strategy, & tactical plan
• Manage directly to SPI vision
• Reap benefits inexpensively on day one