Software Interface Specification for HiRISE Reduced Data Record
37
1 Mars Reconnaissance Orbiter JPL Document Number D-32006 Software Interface Specification for HiRISE Reduced Data Record Products Version 1.0 May 15, 2007 Prepared by: Eric Eliason, Bradford Castalia University of Arizona Kris Becker, Jeff Anderson, Stuart Sides United States Geological Survey SIS For HiRISE RDR Products Approved by: __________________________________________________________ Alfred McEwen, Principal Investigator, HiRISE ___________________________________________________________ Lisa Gaddis, PDS Imaging Node Manager ___________________________________________________________ Edwin Grayzeck, PDS Project Manager
Transcript of Software Interface Specification for HiRISE Reduced Data Record

1
Mars Reconnaissance Orbiter JPL Document Number D-32006
Software Interface Specification for
HiRISE Reduced Data Record
Products
Version 1.0
May 15, 2007
Prepared by:
Eric Eliason, Bradford Castalia
University of Arizona
Kris Becker, Jeff Anderson, Stuart Sides United States Geological Survey
SIS For HiRISE RDR Products Approved by: __________________________________________________________ Alfred McEwen, Principal Investigator, HiRISE ___________________________________________________________ Lisa Gaddis, PDS Imaging Node Manager ___________________________________________________________ Edwin Grayzeck, PDS Project Manager

2
Document Change Control
Date Who Sections Descriptions 12/01/2006 Eric E. All Draft version 03/15/2007 Eric E. All Updated document per draft reviewer comments 05/01/2007 Eric E. All Updated document from RDR SIS Peer Review TBD Items Section Description

3
Table of Contents
ACRONYMS AND ABBREVIATIONS .................................................................. 4 1 Introduction..................................................................................................... 5
1.1 Purpose & Scope ..................................................................................... 5 1.2 What are RDR Products?......................................................................... 5 1.3 What are EDR Products?......................................................................... 6 1.4 Applicable Documents and References ................................................... 6 1.5 Configuration Management and SIS Review ........................................... 8 1.6 Relationship with Other Interfaces ........................................................... 8
2 Instrument Overview....................................................................................... 8 3 Standards Used in Generating Products ...................................................... 10
3.1 PDS Standards ...................................................................................... 10 3.2 JPEG2000 Standard .............................................................................. 10
3.2.1 UUID List ......................................................................................... 11 3.2.2 JPEG2000 Codestream................................................................... 11 3.2.3 JPIP................................................................................................. 12 3.2.4 JPEG2000 Software ........................................................................ 13
3.3 Data Storage Conventions ..................................................................... 13 3.4 Time Standards...................................................................................... 13 3.5 Cartographic Standards ......................................................................... 14
3.5.1 Equirectangular Projection............................................................... 14 3.5.2 Polar Stereographic Projection ........................................................ 17
4 RDR Product Specification ........................................................................... 18 4.1 Data Processing..................................................................................... 18
4.1.1 Radiometric Calibration Correction.................................................. 21 4.1.2 Converting DN to I/F........................................................................ 22 4.1.3 Geometric Processing ..................................................................... 22
4.2 Data Volumes......................................................................................... 25 4.3 Data Validation....................................................................................... 25 4.4 RDR File Naming Convention ................................................................ 26 4.5 PDS labels ............................................................................................. 27
Appendix A – PDS Label Definitions .................................................................. 30

4
ACRONYMS AND ABBREVIATIONS CCD Charge Couple Device CK Instrument pointing kernel (C-matrix) CRISM Compact Reconnaissance Imaging Spectrometer for Mars DARWG Data Archive Working Group DN Density Number EDR Experimental Data Record FELICS Fast and Efficient Lossless Image Compression System HiRISE High Resolution Imaging Science Experiment HiROC HiRISE Operations Center IEC International Electotechnical Commission I/F Intensity/Flux ISIS Integrated Software for Imagers and Spectrometers ISO International Standards Organization JPEG2000 JPEG2000 is a wavelet-based image compression standard
created by the Joint Photographic Experts Group committee. LUT Lookup Table MOLA Mars Orbiter Laser Altimeter MRO Mars Reconnaissance Orbiter NAIF Navigation and Ancillary Information Facility ODL Object Descriptor Language PDS Planetary Data System PLT Packet Length Tags PSP Primary Mapping Phase RDR Reduced Data Record RSDS Raw Science Data Server SCLK Spacecraft clock used to coordinate spacecraft activities SPICE Acronym for Space, Planet, Instrument, C-matrix, Event SPK Spacecraft ephemeris kernel SIS Software Interface Specification TDI Time Delay Integration TRA Transition Orbit Phase UTC Coordinated Universal Time URL Uniform Resource Locator UUID Universally Unique Identifier XML Extended Markup Language
5
1 Introduction
1.1 Purpose & Scope The High Resolution Imaging Science Experiment (HiRISE) is one of the remote sensing instruments on the Mars Reconnaissance Orbiter (MRO) spacecraft that acquires orbital observations of the Martian surface during a two earth-year primary mapping phase. MRO, successfully launched in August 2005, arrived at Mars in March 2006. Following orbit insertion the spacecraft went into an aerobraking period to achieve a 250 x 315 kilometer near-polar orbit suitable for the Primary Science Phase (PSP) mapping that started in November 2006. Since the start of PSP, HiRISE has been continuously operating acquiring 10-20 observations per day. The HiRISE team is responsible for maintaining an updated dataset of the best version of its science data until meaningful changes in data calibration no longer occur and to release data in an appropriate manner for public access including their final deposition to NASA's Planetary Data System (PDS) [1, 2]. In carrying out these responsibilities, the HiRISE team creates two types of standard data products: 1) Experiment Data Record (EDR) products and 2) Reduced Data Record (RDR) Products. This document describes the RDR standard products.
1.2 What are RDR Products? RDR products are radiometrically-corrected images resampled to a standard map projection. They are formatted and organized according to the standards of the PDS [6, 7, 8]. A RDR image is stored in the JPEG2000 (Joint Photographic Experts Group) format recently adopted by the PDS. The JPEG2000 images are accompanied by a PDS detached label (described in section 4.5) providing supporting information about the observation. There will typically be two RDR standard products per HiRISE observation a single-color RDR product built from the operating red-filter CCDs, and a three-color RDR product if the blue-green and near-infrared CCDs were additionally operating. The three-color RDR products will be released a time later then the release of the red-filter RDR products. The radiometric-correction (described in section 4.1.1) corrects for instrument offset, dark current, and gain then converts the image pixels to I/F reflectance. Geometric processing corrects for optical distortion and projects the image from spacecraft viewing to a map coordinate system. The Equirectangular map projection is employed for images observed in the latitude range -65 to 65 degrees. Images above 65 degrees to the poles use the Polar Stereographic projection. This Software Interface Specification (SIS) document provides a description of the RDR products. It is intended to provide enough information to enable users to read and understand the RDR products. The users for whom this SIS is intended

6
are software developers, engineers, and scientists interested in accessing and using these products. The SIS also provides a specification of the products to be delivered to the Planetary Data System (PDS). The SIS describes how the HiRISE team processes, formats, labels, and uniquely identifies the RDR products. The document describes standards used in generating the products. The data product structure and organization are described in sufficient detail to enable a user to develop software for reading the RDR products. Finally, examples of the product labels are provided. The RDR SIS acts as a companion to the HiRISE EDR Data Product SIS [3] and the HiRISE EDR & RDR Volume SIS [4] documents. The Volume SIS describes the ancillary data that accompany the HiRISE imaging products as well as the contents and organization of the data volumes.
1.3 What are EDR Products? EDR products [3], briefly mentioned here, are companion products to the RDRs and are the permanent record of the raw images obtained by HiRISE. The EDRs have the properties of unprocessed and unrectified imaging maintaining the original spacecraft viewing orientation and optical distortion properties. As part of the EDR generation process, FELICS-compressed [10] (FELICS stands for Fast and Efficient Lossless image compression System) images are decompressed and organized as raster images. EDRs are organized at the channel level with two EDRs needed for each operating CCD (Charge Couple Device). Up to 28 EDR products are needed to capture a single HiRISE observation. Maintaining an archive of EDR products enables reprocessing of the raw science observations as calibration and geometry processing routines improve. Investigators interested in applying advanced calibration methods or needing to understand the properties of the raw imaging will find the EDRs a useful product. However, most science investigators will be interested in using the RDR products as geometry and radiometric processing has been applied to these products.
1.4 Applicable Documents and References The RDR Product SIS is responsive to the following MRO project documents:
1. Mars Exploration Program Data Management Plan, R. E. Arvidson and S. Slavney, Rev. 2, Nov. 2, 2000.
2. Mars Reconnaissance Orbiter Project Data Archive Generation, Validation and Transfer Plan, R. E. Arvidson, S. Noland and S. Slavney, March, 2005
3. Software Interface Specification for HiRISE Experimental Data Record Products, JPL D-32004, March 17, 2006

7
4. HiRISE EDR & RDR Archive Volumes Software Interface Specification, JPL D-32005, June 1, 2006
5. JPEG 2000 image coding system: Core coding system, ISO/IEC 15444-1 September 15, 2004
The SIS is also consistent with the following Planetary Data System (PDS) documents:
6. Planetary Data System Data Preparation Workbook, Version 3.1, JPL D-7669, Part 1, February 1, 1995.
7. Planetary Data System Data Standards Reference, Version 3.7, JPL D-7669, Part 2, March 20, 2006,
8. Planetary Science Data Dictionary Document, JPL D-7116, Rev. E, August 28, 2002.
Additional References: 9. McEwen, A. S., E. M. Eliason, J. W. Bergstrom, N. T. Bridges, W. A.
Delamere, J. A. Grant, V. C. Gulick, K. E. Herkenhoff, L. Keszthelyi, R. L. Kirk, M. T. Mellon, S. W. Squyres, N. Thomas, C. M. Weitz, (2007), MRO's High Resolution Imaging Science Experiment (HiRISE). J. Geophys. Res. (in press).
10. Howard, P.G. and J.S. Vitter, (1994), "Fast progressive lossless image compression," Proc. IST/SPIE Int'l Symp. On Electronic Imaging Science and Technology
11. Snyder, J.P. (1987) Map Projections U.S. Geological Survey Professional Paper 1395.
12. Becker, K. J., J.A. Anderson, S.C. Sides, E.A. Miller, E.M. Eliason, and L.P. Keszthelyi, (2007), Processing HiRISE Images Using ISIS3, LPSC XXXVIII, Abstract #1779.
13. E. G. Keys, (1981), Cubic Convolution Interpolation For Digital Image Processing, IEEE Trans. Acoustics, Speech, and Signal Processing, 29(6): 1153–1160.
14. Neumann, G. A., F. G. Lemoine, D. E. Smith, M. T. Zuber, (2003), The Mars Orbiter Laser Altimeter Archive: Final Precision Final Precision Experiment Data Record Release and Status of Radiometry, LPSC XXXIV, Abstract #1978.
15. Castalia, B., (2006), Conductor: Managing Processing Pipelines, LPSC XXXVII, Abstract # 2159.
16. Schaller, C. J., (2006), Automated HiRISE Data Processing: Conductor in Action, (2006), LPSC XXXVII, Abstract # 2134
17. Acton, Jr., C.H., (1996), Ancillary data services of NASA’s Navigation and Ancillary Information Facility, Planet. Space Sci., Vol. 44, No. 1, .pp 65-70.

8
1.5 Configuration Management and SIS Review The HiRISE Software Development Team controls this document. Requests for changes to the scope and contents of this document are made to the HiRISE Ground Data System Manager, Eric M Eliason ([email protected]). An engineering change request will be evaluated against its impact on the HiRISE ground data processing system before acceptance. The RDR SIS has been through a peer review process required by the PDS. The products described in the document have been determined to meet PDS data product standards. Members from the PDS Geosciences, Imaging, and Engineering Nodes were on the review panel with additional members from the Planetary Science community.
1.6 Relationship with Other Interfaces HiRISE RDR products have been radiometrically and geometrically processed and will be used by the HiRISE Science Team and remote sensing scientists in data analysis activities. Changes to this SIS may impact the tools and methods employed by end users. The RDR products are derived from EDR products. Changes to the EDR SIS [3] may impact the ground processing systems leading up to the generation of RDR products. The Mars Exploration Program Data Management Plan [1] defines the overarching processes and goals for generation, validation, and delivery of data products from Mars flight projects to the PDS in complete, well-documented, permanent archives in a timely fashion. The “MRO Data Archive Generation, Validation, and Transfer Plan” [2] provides project-wide details for MRO’s interface activities with the PDS.
2 Instrument Overview HiRISE is a “pushbroom” imaging system featuring a 0.5 m aperture telescope with a 12 m effective focal length and 14 CCD detectors capable of generating images of up to 20,048 crosstrack pixels (exclusive of overlap pixels) and 63,000 unbinned downtrack lines for 14-bit pixel imaging or 126,000 scan lines for 8-bit data. HiRISE samples the Martian surface at 25-32 cm/pixel depending on spacecraft altitude and off nadir roll angle. Observations can be acquired in three spectral wavelengths: blue-green (~536 nm), red (~692), and near-infrared (~874 nm). Ten detectors are employed for red-filter imaging and two detectors each for the blue-green and near-infrared filters. See Figure 2.0 for a layout of the CCD arrays located on the focal plane. At 300km orbital altitude the crosstrack aerial coverage is ~6.0 km for red-filter imaging and ~1.2 km for three-color imaging. Downtrack coverage depends on the number of scan lines commanded, varying from a few kilometers to a maximum of ~39.0 km (126,000 lines) for unbinned images. A key instrument design feature employs detectors with up to 128 lines of Time Delay and Integration (TDI) to create high signal-to-noise ratio (up to 300:1).

9
Several data compression methods can be employed to optimize data return. Pixel binning (permitted values: 1,2,3,4,8,16) is used to reduce data volume but increases the pixel scale (m/pixel). A second data compression method employs a lookup table (LUT) to convert the 14-bit data dynamic range (16-bit/pixel storage) to 8-bit pixels thereby reducing the data volume by half. A third data compression method employs FELICS [10] lossless data compression providing compression ratios of about 2.4:1 for most HiRISE observations. To maximize aerial coverage for the available downlink most HiRISE images are acquired using 8-bit LUT imaging with FELICS compression. The 14 CCD detector arrays can be independently commanded offering flexibility on how an observation is acquired. Any combination of CCDs can be commanded to acquire imaging. Often, center red-filter CCDs are commanded for bin 1 while the blue-green, near-infrared and peripheral red-filter CCDs are commanded for higher binning. A detailed instrument overview and operating capabilities of the HiRISE instrument can be found in the EDR SIS companion document [3] and the HiRISE Instrument paper [9].
Blue-Green & NIR
Active Length of Red Array
CCD Active Area
24.6 mm
Active Length of a DCAFPA Substrate
DCA Substrate
14 CCDs (2048 x 128 pixels): 10 CCDs Form Red Channel (20,264 pixels) 2 CCDs Form Blue-Green Channel (4048 pixels) 2 CCDs Form NIR Channel (4048 pixels) HiRISE power supply enables simultaneous operation of at least 10 CCDs. Figure 2.0 - Focal Plane Array
RED0 RED1
RED2 RED3
RED4 RED5
RED6 RED7
RED8 RED9
IR10 IR11
BG12 BG13

10
3 Standards Used in Generating Products
3.1 PDS Standards The HiRISE RDR products comply with the PDS standards for file formats and labels, specifically using the PDS image object definition [6, 7, 8]. The RDR image files, formatted according to the JPEG2000 standard, use "JP2" as their filename extension. They are accompanied by PDS labels; files that have the same name as the image data file but use "LBL" for their filename extension. The label file provides image data characterization and science metadata information about the observation (see Section 4.5). Additionally, the ancillary data files that accompany the RDR products and the archive volume structure are in conformance with PDS standards [7].
3.2 JPEG2000 Standard RDR image data are stored in the JPEG2000 ISO/IEC Part 1 standard [5] format (http://www.jpeg.org/jpeg2000/), which was accepted as a PDS Standard in October 2005 [7, Appendix I]. The JPEG2000 standard offers benefits with distinct advantages for storage of and access to very large images. With HiRISE RDR products exceeding 30,000 x 100,000 pixels, the use of JPEG2000 was recognized as a suitable solution for the storage and distribution of these data products. Advantages include excellent compression performance, multiple resolution levels from a single image data set, progressive decompression quality layers, lossless and lossy compression (HiRISE RDR products use lossless compression), pixel datum precision up to 38 bits, multiple image components (or bands), and selective image area access. These features are achieved by the use of a sophisticated image coding system based on discrete wavelet transforms (DWT) combined with other coding techniques to generate a JPEG2000 codestream that can be rendered to image raster format using inverse transform algorithms. The PDS Standard specifies that a JPEG2000 codestream will be stored in a “JP2” file as described by the JPEG2000 Part 1 standard [5, Appendix I]. This file format encapsulates one or more codestreams plus characterizing metadata in a contiguous sequence of binary data “boxes”. The first two boxes of a JP2 file must be Signature and File Type specification boxes that uniquely identify the file as a JP2 file. This must be followed by a JP2 Header box that contains sub-boxes that characterize the Codestream box that follows with information such as the image dimensions, pixel datum precision, compression technique and color space mapping for image display purposes. The JP2 file may also contain additional boxes that contain UUID (universally unique identifier) signatures, URL (uniform resource locator) references, and XML (extended markup language) sequences that can be used as desired by the data provider.

11
3.2.1 UUID List HiRISE RDR JP2 data product files contain a UUID Information box that includes a UUID List box and a Data Entry URL box. The UUID List box has a single entry with the value (16 binary bytes here represented as a 36 character hexadecimal string) 2b0d7e97-aa2e-317d-9133-e53161a2f7d0” which is a version 3 UUID signature based on the URL namespace string “ http://hirise.lpl.arizona.edu/”. This signature is intended to uniquely identify the JP2 file as containing a HiRISE data product. Other HiRISE data products, in addition to RDRs, are expected to use the same UUID. The Data Entry URL box contains a relative file URL string that identifies the external PDS label file for the data product. The basename of the PDS label file is expected to be the same as the basename of the JP2 image data file; thus for the image data file “TRA_000823_1720.JP2” the URL would be “TRA_000823_1720.LBL”. This provides a reference from the image data file to the PDS label file containing the science metadata for the image data product. Data users may change filenames, of course, so the URL also ensures that the HiRISE observation ID – the filename without its extension and leading delimiter - will be provided in the JP2 file.
3.2.2 JPEG2000 Codestream All of the information necessary to successfully decompress JPEG2000 image data is contained in the JPEG2000 Codestream box of the JP2 file. The flexibility of the format, however, allows for significant variability in how the codestream is structured which can have a significant impact on the performance of client software accessing the codestream during rendering operations. While the JPEG2000 standard supports an exceptionally efficient lossy image coding technique, to ensure the preservation of the science information of the image data the PDS requires that only lossless image compression be used. Therefore HiRISE RDR image data are compressed using the JPEG2000 5-3 reversible transform. The JPEG2000 codestream may be partitioned into quality layers to enable rendering software to provide progressing quality displays. HiRISE RDR image data are compressed with a single quality layer. Perhaps the most significant data structure decision is whether to organize the codestream into image area tiles. Some client software may render full resolution image data for a relatively small display area of a large image more quickly if the codestream is tiled; other client software may render low resolution image data for the entire image more quickly if the codestream is not tiled. The HiRISE RDR image data are not tiled in the JPEG2000 codestream (the entire codestream is a single tile). To assist client software in locating selective sub-areas of the codestream called precincts, which contain codestream packets, HiRISE RDR image data files include Packet Length Markers (PLT) in the JPEG2000 codestream.

12
Another obvious data structure decision is the number of resolution levels to provide in the codestream. The DWT image coding technique naturally partitions the image information into powers of two resolution levels; i.e. starting with the full (1:1) resolution level the next resolution level will result in an image having dimensions half that of the full resolution image, and so forth for subsequent additional resolution levels. Image rendering proceeds from the lowest resolution level and incrementally adds image information from higher resolution levels; image data rendering may stop at any selected level to provide pixel rasters suitable for display. A maximum of 32 resolution levels are possible, but too many resolution levels can result in storage and rendering inefficiencies depending on the image dimensions. Therefore the number of resolution levels in HiRISE JPEG2000 codestreams is determined dynamically such that the minimum dimension of the image at the lowest resolution is not less than 64. The order in which codestream information is stored may have some affect on software rendering performance, depending on the intended application. HiRISE RDR codestreams are organized in resolution, position (image area), component (image band), and layer (quality) order. The JPEG2000 image coding techniques are sensitive to byte ordering (for multi-byte data) and signedness of the image data. HiRISE RDR image data are MSB ordered and unsigned.
3.2.3 JPIP Part 9 of the JPEG2000 standard specifies a JPEG2000 Internet Protocol (JPIP) for the network communication of JP2 file contents by a JPIP server to a client in response to client requests. The client requests provide selective access to the source file's metadata and image data in the component (bands), area, resolution and quality dimensions. In addition, the client may establish a session relationship with the server in which the server maintains a record of what parts of the source JP2 file are already in the client’s possession so that only those parts of the file that the client does not have are sent in response to a request from the server. For example, a client requesting that portion of the codestream to render a specified image area at some low resolution level may then request the codestream to render the same image area at full resolution in which case the server will respond to the second request by only sending that portion of the codestream for the additional resolution levels beyond that already sent in response to the first request. This takes advantage of the incremental rendering of the image data and results in significantly reduced data network bandwidth requirements. As a result users of JPIP capable client software should be able to efficiently pan and zoom throughout the entire large HiRISE RDR image without requiring that the entire large image be transmitted and rendered. HiRISE RDR image data JP2 files will be made available via JPIP. Both the JP2 image data files and the PDS label files will also be made available via HTTP and other delivery methods.

13
3.2.4 JPEG2000 Software Part 5 of the JPEG2000 offers reference software implementations of the Part 1 core-coding standard. The JasPer Project provides a C language API and demonstration applications (http://www.ece.uvic.ca/~mdadams/jasper/). JJ2000 (http://jj2000.epfl.ch/) provides pure Java classes. Both of these implementations are employed in two J2K plugins for the Image I/O Tools from Sun Microsystems’ Java Advanced imaging (JAI). (http://java.sun.com/javase/6/docs/technotes/guides/imageio/) (http://java.sun.com/javase/technologies/desktop/media/jai/) Dr. David Taubman, one of the principle JPEG2000 standard developers, implemented the Kakadu software. Kakadu offers a full range of application utilities and highly optimized C++ classes (http://www.kakadusoftware.com/). The JP2_Info utility, in the Image_Tools package of the PIRL Java Packages (http://pirlwww.lpl.arizona.edu/software/PIRL_Java_Packages.shtml) provides a detailed report on the contents of a JP2 file. The HiRISE Team offers a freely available JPIP Client, IAS-Viewer that allows efficient access to the HiRISE image collection through Internet resources. For more information on how to obtain the viewer go to the team’s web site at (http://hirise.lpl.arizona.edu).
3.3 Data Storage Conventions The HiRISE RDR products contain binary data. Image pixel values are stored within the JPEG2000 framework as 10-bit values with a dynamic range of 0-1023. When rendered as an image array they are stored as unsigned 16-bit pixel values but still maintaining the range 0-1023. The PDS label sections are stored as ASCII character strings conforming to the requirements defined in the PDS Standards Reference. The storage order is most significant byte (MSB) first. MSB ordering is the order used on the MRO spacecraft and the HiRISE instrument.
3.4 Time Standards Two time-related standards are used in HiRISE RDR labels: Spacecraft clock (SCLK); Coordinated Universal time (UTC). The spacecraft clock (SCLK) is the fundamental clock on MRO for initiating spacecraft events and coordinating spacecraft activities. The SCLK has a high precision counting unit of 1/(216) seconds for each tick of its sub-seconds field. Thus there are 65,536 SCLK ticks per second (a time interval of 15.2588
14
microseconds). The RDR product labels provide the start and stop SCLK time for an observation. The labels additionally include a start and stop time in Coordinated Universal Time (UTC). The UTC has uniform seconds defined by the International Atomic Time, with leap seconds announced at irregular intervals to compensate for the Earth's slowing rotation and other discrepancies. Processing at the HiRISE Operations Center (HiROC) converts SCLK to UTC time using the SPICE NAIF toolkit [17].
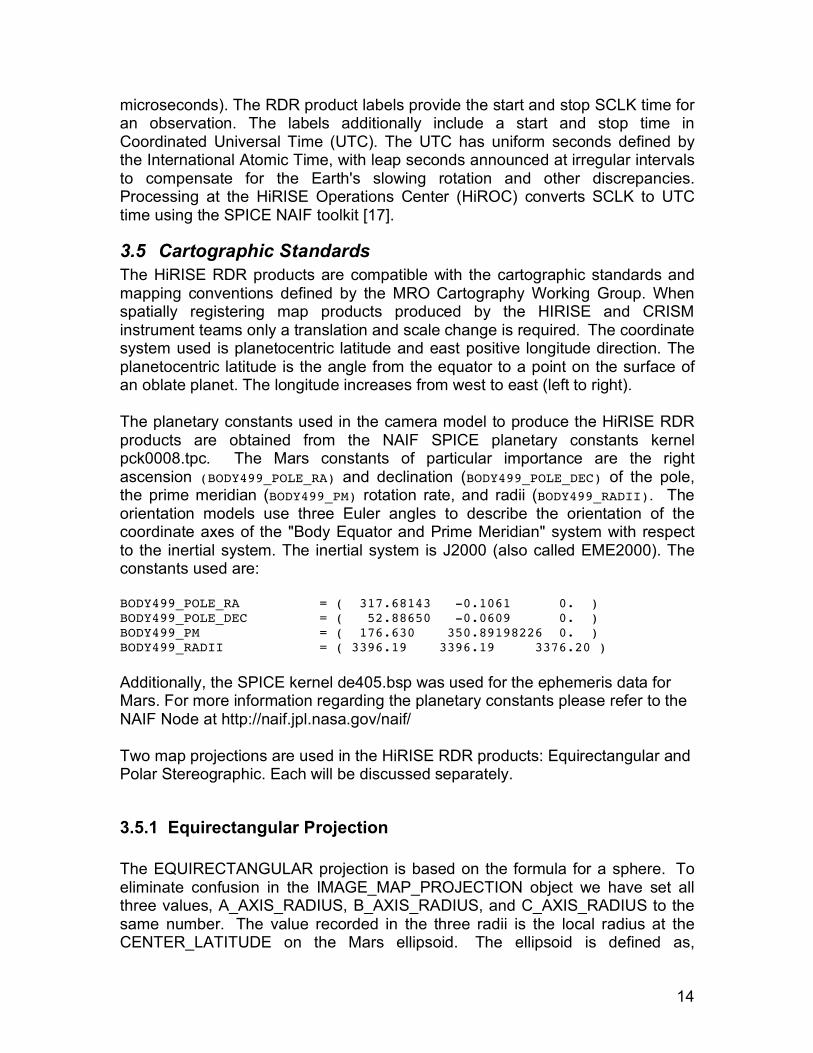
3.5 Cartographic Standards The HiRISE RDR products are compatible with the cartographic standards and mapping conventions defined by the MRO Cartography Working Group. When spatially registering map products produced by the HIRISE and CRISM instrument teams only a translation and scale change is required. The coordinate system used is planetocentric latitude and east positive longitude direction. The planetocentric latitude is the angle from the equator to a point on the surface of an oblate planet. The longitude increases from west to east (left to right). The planetary constants used in the camera model to produce the HiRISE RDR products are obtained from the NAIF SPICE planetary constants kernel pck0008.tpc. The Mars constants of particular importance are the right ascension (BODY499_POLE_RA) and declination (BODY499_POLE_DEC) of the pole, the prime meridian (BODY499_PM) rotation rate, and radii (BODY499_RADII). The orientation models use three Euler angles to describe the orientation of the coordinate axes of the "Body Equator and Prime Meridian" system with respect to the inertial system. The inertial system is J2000 (also called EME2000). The constants used are: BODY499_POLE_RA = ( 317.68143 -0.1061 0. ) BODY499_POLE_DEC = ( 52.88650 -0.0609 0. ) BODY499_PM = ( 176.630 350.89198226 0. ) BODY499_RADII = ( 3396.19 3396.19 3376.20 ) Additionally, the SPICE kernel de405.bsp was used for the ephemeris data for Mars. For more information regarding the planetary constants please refer to the NAIF Node at http://naif.jpl.nasa.gov/naif/ Two map projections are used in the HiRISE RDR products: Equirectangular and Polar Stereographic. Each will be discussed separately.
3.5.1 Equirectangular Projection The EQUIRECTANGULAR projection is based on the formula for a sphere. To eliminate confusion in the IMAGE_MAP_PROJECTION object we have set all three values, A_AXIS_RADIUS, B_AXIS_RADIUS, and C_AXIS_RADIUS to the same number. The value recorded in the three radii is the local radius at the CENTER_LATITUDE on the Mars ellipsoid. The ellipsoid is defined as,

15
equatorial radius of 3396.190000 km and polar radius of 3376.200000 kilometers. Using the local radius of the ellipsoid implies that the MAP_SCALE and MAP_RESOLUTION are true at the CENTER_LATITUDE The Equirectangular projection [11], used in observations whose center latitude of the observation is in the range -65 to 65 degrees latitude, is a simple projection providing a linear relationship between the geographic coordinates of latitude and longitude and the Cartesian space of the map. In continuous form, the equations relating map coordinates (x, y) to geographic coordinates (Lat, Lon) are: x = R·(Lon-LonP)·COS(LatP) y = R·Lat where LonP is the center longitude of the map projection, LatP is the center latitude of the projection at which scale is given, and R the radius of the body at the center latitude. The Re and Rp parameters refer to equatorial and polar radius respectively. R = Re · Rp / SQRT(a2 + b2) a = Rp · COS(LatP) b = Re · SIN(LatP) The inverse formulas for Lat and Lon from x and y position in the projection are: Lat = y/R Lon = LonP + x/(R·COS(LatP)) The Conversion from (x, y) map coordinates to image array coordinates (sample, line) is standard for all map projections and is: x = (Sample-S0)·Scale y = (-L0-Line)·Scale where Scale is the map resolution in km/pixel (located at the center planetocentric latitude of the projection). Line and Sample are the coordinates of the image array, and line (L0) and sample offsets (S0) are the respective image coordinate displacements from pixel (1,1) to the origin of the projection (x,y) = (0,0). Please note, pixel (1,1) is spatially located in the upper-left corner of the image array. The equations from (x, y) to (Sample, Line) are:

16
Sample = x/Scale+S0+1 Line = -y/Scale-L0+1 The equation from (Sample, Line) to (Lat, Lon) is: Lat = y/R y = (1-L0-Line)·Scale Lat = (1-L0-Line)·Scale/R Lon = LonP + x/(R·COS(LatP)) x = (Sample-S0-1)·Scale Lon = LonP + (Sample-S0-1)·Scale/(R·COS(LatP)) The keywords corresponding to the Equirectangular projection parameters are located in the IMAGE_MAP_PROJECTION object found in the PDS labels. The keywords for each equation parameter are shown in table 3.5.0.
Table 3.5.0 – PDS Keywords for corresponding Equirectangular projection equation parameters
Equation Keyword LonP CENTER_LONGITUDE LatP CENTER_LATITUDE L0 LINE_PROJECTION_OFFSET S0 SAMPLE_PROJECTION_OFFSET Scale MAP_SCALE Re A_AXIS_RADIUS Rp C_AXIS_RADIUS
The HiRISE RDR products mapped with the Equirectangular projection use different center latitudes of projection for every five-degree latitude bin from the equator to the 65 degrees latitude as shown in Table 3.5.1 This choice of center latitudes reduces the total size of the dataset and reduces scale distortions. Note that the center latitude of the map projection is generally not the same as the center latitude of the observation.
Table 3.5.1 – Center latitude of projection for image centers falling in five-degree latitude bins Latitude Range
Center Latitude of Projection
Latitude Range
Center Latitude of Projection
90 to 65 Polar Stereo.
-90 to -65 Polar Stereo.
70 to 65 65 -70 to -65 -65

17
65 to 60 60 -65 to -60 -60 60 to 55 55 -60 to -55 -55 55 to 50 50 -55 to -50 -50 50 to 45 45 -50 to -45 -45 45 to 40 40 -45 to -40 -40 40 to 35 35 -40 to -35 -35 35 to 30 30 -35 to -30 -30 30 to 25 25 -30 to -25 -25 25 to 20 20 -25 to -20 -20 20 to 15 15 -20 to -15 -15 15 to 10 10 -15 to -10 -10
10 to 5 5 -10 to -5 -5 5 to 0 0 -5 to 0 0
3.5.2 Polar Stereographic Projection The Polar Stereographic projection [11], used in observations whose center latitude of the observation is greater than 65 or less than -65 degrees latitude, is ideally suited for observations near the poles as shape and scale distortion are minimized. The HiRISE RDR products with Polar Stereographic projection use the ellipsoid form of the equations. However, most cartographic processing software cannot support planetocentric coordinates for this projection with the ellipsoid equation. The fallback is to use the spherical equations. The error between the spherical and ellipsoidal equations is highest at 60 and -60 degrees latitude and is approximately 26 meters or about 100 HiRISE pixels. The error is less than the accuracy of the camera pointing, approximately 100m, and can be ignored. In continuous form, the spherical equations relating map coordinates (x, y) to planetocentric coordinates (Lat, Lon) are:
North Polar Stereographic x = 2·Rp·TAN(Pi/4-Lat/2)·SIN(Lon-LonP) y = -2·Rp·TAN(Pi/4-Lat/2)·COS(Lon-LonP)
South Polar Stereographic x = 2·Rp·TAN(Pi/4+Lat/2)·SIN(Lon-LonP) y = 2·Rp·TAN(Pi/4+Lat/2)·COS(Lon-LonP)
Where LonP is the central longitude, LatP is the latitude of true scale and is always 90 or -90, and Rp is the polar radius of Mars or 3376.2 km. The spherical inverse formulas for Lat and Lon from X and Y position in the image array are: Lat = ARCSIN[COS(C)·SIN(LatP)+y·SIN(C)·COS(LatP)/P]

18
North Polar Stereographic
Lon = LonP + ARCTAN[x/(-y)]
South Polar Stereographic Lon = LonP + ARCTAN[x/y] where: P = SQRT(x2 + y2) C =2·ARCTAN(P/2*Rp) recall: x = (Sample-S0-1)·Scale y = (1-L0-Line)·Scale The keywords corresponding to the equation parameters for the Polar Stereographic projection are located in the IMAGE_MAP_PROJECTION object found in the PDS labels. The keywords for each equation parameter are shown in table 3.5.0.
4 RDR Product Specification
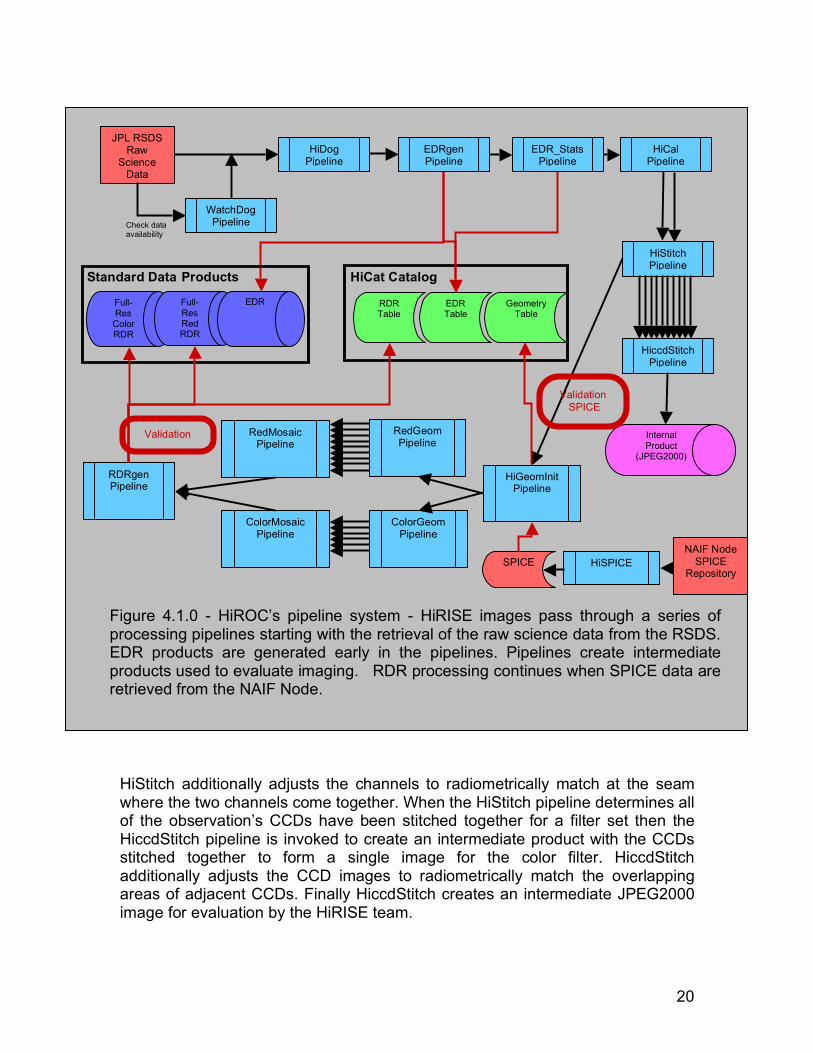
4.1 Data Processing Science data from the MRO payload experiments are packetized on the spacecraft, transmitted to Earth through the Deep Space Network, and sent to the Jet Propulsion Laboratory (JPL) through ground communications. The JPL Multi-Mission Operations Facility converts the packetized data back to the original science data format as produced by the instruments. For HiRISE observations, a raw science product is created for each CCD/Channel involved in the observation. The data are stored at JPL's Raw Science Data Server (RSDS) for access by the science teams. At HiROC we have developed a ground data system that provides automated methods for retrieving and processing our images. Science data are automatically retrieved from the RSDS and passed to a series of pipeline procedures managed under the Conductor environment [15, 16] (http://pirlwww.lpl.arizona.edu/software). The pipelines generate intermediate products used for image evaluation and standard data products for science analysis. Additionally, the pipelines populate HiRISE catalog’s EDR and RDR product tables and observation geometry tables with relevant metadata (see Figure 4.1.0). The product and geometry tables are used to generate index tables provided as part of the product distribution to the PDS [4]. The HiRISE team verifies observations were properly acquired and science objectives

19
achieved. Missed targets or observations with poor viewing conditions are flagged for reacquisition at a later time. HiROC uses the Integrated Software for Imagers and Spectrometers (ISIS) system [12] in the pipeline processing. ISIS contains a wide range of tools including radiometric calibration and cartographic processing procedures. The ISIS components applicable to HiRISE include radiometric calibration, map projection transformation, image mosaicking, camera pointing correction, and general image enhancement, display, and analysis tools. For more information on this freely available image analysis package, see the ISIS web site (http://isis.astrogeology.usgs.gov/). HiROC’s pipeline processing starts when the WatchDog procedure, responsible for periodically monitoring the RSDS, determines a raw science data file is ready to be downloaded from the RSDS and passes the name of the product to the HiDog pipeline (Downlink Organizer). The HiDog pipeline retrieves the data product then submits the file name to the EDRgen pipeline (EDR generator) for creating the EDR product and populating the EDR product table with metadata about the product. The EDR_Stats pipeline creates an ISIS file and generates image statistics that are placed in the EDR products table. The HiCal pipeline performs the radiometric correction (see Section 4.1.1), and generates a browse and thumbnail image of the EDR product to be used by the HiRISE and PDS Imaging Node data-distribution web services. When the HiCal pipeline determines two channel files of a CCD have been calibrated the file names are passed on to the HiStitch pipeline for creating an intermediate CCD image file.
20
HiStitch additionally adjusts the channels to radiometrically match at the seam where the two channels come together. When the HiStitch pipeline determines all of the observation’s CCDs have been stitched together for a filter set then the HiccdStitch pipeline is invoked to create an intermediate product with the CCDs stitched together to form a single image for the color filter. HiccdStitch additionally adjusts the CCD images to radiometrically match the overlapping areas of adjacent CCDs. Finally HiccdStitch creates an intermediate JPEG2000 image for evaluation by the HiRISE team.
HiDog Pipeline
EDRgen Pipeline
EDR_Stats Pipeline
JPL RSDS Raw
Science Data
Repository
WatchDog Pipeline Check data
availability
HiStitch Pipeline
HiccdStitch Pipeline
RedGeom Pipeline
ColorGeom Pipeline
ColorMosaic Pipeline
RDRgen Pipeline
Internal Product
(JPEG2000)
EDR Table
HiCal Pipeline
RedMosaic Pipeline
Full-Res Color RDR
Full-Res Red RDR
RDR Table
EDR Geometry Table
Standard Data Products
HiGeomInit Pipeline
NAIF Node SPICE
Repository HiSPICE SPICE
Validation SPICE Pause
Validation Release
HiCat Catalog
Figure 4.1.0 - HiROC’s pipeline system - HiRISE images pass through a series of processing pipelines starting with the retrieval of the raw science data from the RSDS. EDR products are generated early in the pipelines. Pipelines create intermediate products used to evaluate imaging. RDR processing continues when SPICE data are retrieved from the NAIF Node.

21
At this point in the processing the EDR-validation step occurs (see Section 4.3). To continue the pipeline processing the reconstructed SPK and CK SPICE kernels [17], providing information about the observing viewing geometry and spacecraft ephemerides, need to be retrieved from the NAIF Node though HiROC’s HiSPICE subsystem. Reconstructed SPICE kernels are generally provided to the MRO science teams one to two weeks after the observation was acquired. The HiGeomInit pipeline extracts the spacecraft ephemeris kernel (SPK) and C-matrix pointing kernel (CK) data from the SPICE files and transfers the data to the CCD image files for geometry processing by the pipelines that follow. Additionally HiGeomInit populates the observation geometry table with viewing geometry and coordinate metadata. See [4] for more information about the contents of the observation geometry table. The RedGeom and ColorGeom pipelines perform geometric processing on individual CCD images (see Section 4.1.2). The RedMosaic and ColorMosaic pipelines mosaic the projected CCD images to form an observational image (see Figure 4.1.1). Additionally these pipelines create RDR-product browse and thumbnail jpeg images for HiRISE and PDS Imaging Node web-based distribution services. The last pipeline step, RDRgen, creates the JPEG2000 image accompanied by a PDS detached label and populates the RDR product table with information about the product. Following a final validation step the EDR and RDR products are releasable to the PDS and science community.
4.1.1 Radiometric Calibration Correction The radiometric calibration-correction procedure is described here at a high level. A detailed description will be provided in a future HiRISE calibration paper. The radiometric calibration correction is performed on each individual HiRISE channel file (EDR) correcting for instrument offset, dark current, and gain then converting to I/F reflectance. The first step in the calibration, carried out by the ISIS hiclean program, corrects for instrument dark current and offset. The hiclean program uses the ancillary calibration data (dark and mask pixels) [3] that accompany the science data to compute corrections in both the column (sample) and row (line) directions. The mask pixels, positioned at the start of the instrument output, provide dark current information for each column. The dark pixels, positioned at the end of each image row, capture the time dependent dark current and offset instrument drift. The ISIS hical program then applies an intra-channel B0 (additive dark current matrix) and A0 (multiplicative gain matrix) correction for each column in the image array. The hical then converts the pixel values to I/F (intensity/flux, I/F = 1 for a 100% ideal lambertian reflector viewed normal to the surface) as described below:

22
For:
H = dark current and offset corrected image, output of hiclean B0 = intra-channel dark current correction (TDI & BIN dependent) A0 = intra-channel gain correction (TDI and BIN dependent) G = global gain correction, normalizes CCD/channels L = observation line time I = I/F conversion factor at Sun-Target distance of 1.5 AU AU = Mars-to-Sun distance (AU) at time of observation Z = radiometrically corrected image in I/F units
The correction is: Z = ([H-(B0•L)]/L)•A0•G*I*(1.5/AU)2 Instrument instabilities result in radiometric mismatches requiring additional corrections for the varying column-to-column, channel-to-channel, and CCD-to-CCD sensitivities. Residual column-to-column variations are corrected by first computing the mean value for each column in an image array. The mean-value one-dimensional array is then high-pass filtered to eliminate low-frequency information due to scene content. The result of the high pass filter is then subtracted from the image array. CCD channels are adjusted to radiometrically match at the seam where the two channels come together (performed by the HiStitch pipeline). The CCDs are then radiometrically matched one to the other by matching the overlapping areas of adjacent CCDs (performed in the HiccdStitch pipeline).
4.1.2 Converting DN to I/F There are two keywords in the PDS label (see section 4.5) that provide a mechanism to translate the DN integer value of the RDR image to I/F. The SCALING_FACTOR and OFFSET values in the IMAGE object are used for the conversion. The equation is as follows: I/F = (DN * SCALING_FACTOR) + OFFSET
4.1.3 Geometric Processing The geometric processing [12] corrects for the optical distortion and projects the observation from spacecraft viewing orientation to a map coordinate system. For RDR products the Equirectangular or Polar Stereographic projections are used (see Section 3.5). The geometry processing, carried out by ISIS program cam2map, uses cubic convolution resampling [13]. Geometry processing employs the NAIF toolkit (http://naif.jpl.nasa.gov) and uses reconstructed SPICE

23
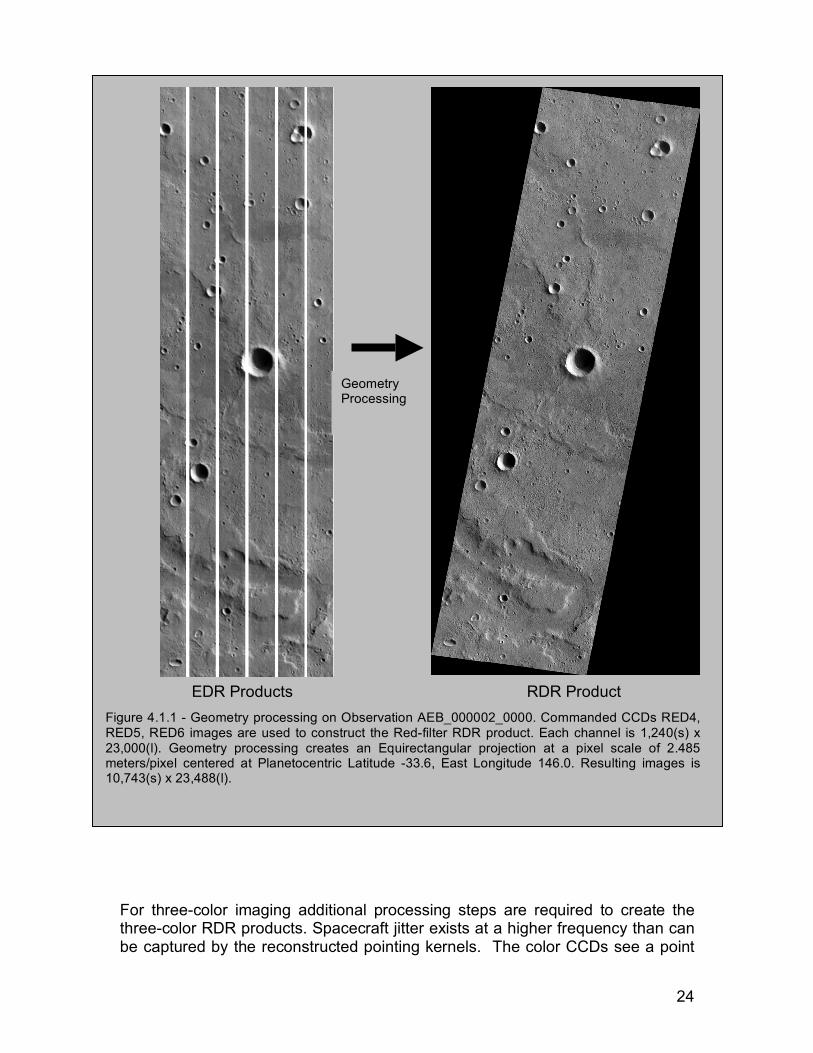
kernels generated by the MRO project. The geometry processing uses the MOLA Digital Terrain Model [14] to improve the camera pointing intercept position on the Martian surface. In the geometric processing, individual channel images are stitched together to form CCD images using the ISIS program histitch. The spiceinit program searches through the available NAIF kernel set and applies planet and spacecraft ephemeris data to establish geometric properties of each CCD image. CCD images are then individually map projected with cam2map and mosaicked together using himos forming an image of the entire observation. Resulting image maps vary in size depending on the number of CCDs commanded, number of lines acquired and the binning mode of the images. RDR products can be very large, at times exceeding 40,000 x 100,000 pixels. Observations with mixed binning modes are resampled to the same pixel scale depending on the minimum binning used in the observation. For the Transition Orbit Phase (TRA) and Primary Science Phase (PSP), observations with unbinned imaging are uniformly mapped to a constant 0.25 m/pixel resolution (0.50 m/pixel for minimum binning 2 and 1.0 for binning 4). The Aerobraking phase images (AEB) are mapped to a pixel scale depending on the spacecraft altitude and the minimum binning. Figure 4.1.1 shows the geometry processing on Aerobraking-observation AEB_000002_0000, commanded to acquire imaging with CCDs RED4, RED5, and RED6, and the blue-green and near-infrared CCDS resulting in 14 EDR products, one for each channel. The single-color RDR is identified as product AEB_000002_0000_RED.
24
For three-color imaging additional processing steps are required to create the three-color RDR products. Spacecraft jitter exists at a higher frequency than can be captured by the reconstructed pointing kernels. The color CCDs see a point
EDR Products RDR Product
Geometry Processing
Figure 4.1.1 - Geometry processing on Observation AEB_000002_0000. Commanded CCDs RED4, RED5, RED6 images are used to construct the Red-filter RDR product. Each channel is 1,240(s) x 23,000(l). Geometry processing creates an Equirectangular projection at a pixel scale of 2.485 meters/pixel centered at Planetocentric Latitude -33.6, East Longitude 146.0. Resulting images is 10,743(s) x 23,488(l).

25
on the planet surface separated by ~120 milliseconds resulting in jitter-induced pointing misalignments not captured by the reconstructed pointing matrix. To minimize color misregistration the blue-green and near-infrared filters are spatially matched through a two-step empirical approach. In the first step the blue-green and near-infrared filter CCD images (usually acquired at a higher binning level than the red-filter CCDs) are scaled to match the binning of the red-filter CCD imaging. Next, an ISIS program, hijitreg, applies an image coregistration process constructing a control network that spatially maps the blue-green and near-infrared filter imaging to the red filter imaging. The control network is provided to the second step responsible for resampling the blue-green and near-infrared filter images to the red. The program, slither, performs a one-dimensional cubic-spline transformation performing translational shifts on otherwise undistorted individual lines. Once the blue-green and near-infrared images are spatially registered to match the red imaging, the images go through the same geometric processing to create a map-projected image as described above. The CENTER_FILTER_WAVELENGTH keyword provides information about the spectral center wavelength (see Section 4.5 and Appendix A). The storage order for the three-color products is near-infrared (band 1), red (band 2), and blue-green (band 3).
4.2 Data Volumes Approximately 10,000 observations will be acquired during the two-year Primary Science Phase. Each observation will typically have a RED and COLOR RDR product. The total volume for the RDR products is estimated to be 18,000 gigabytes (see [4] for more information about data product volumes).
4.3 Data Validation The MRO Data Archive Working Group (DARWG) oversees and coordinates the validation of instrument team data products for release to the PDS [2] in a process by which the science teams and the PDS participate. HiROC’s HiVali subsystem enables the HiRISE team to validate EDR and RDR products. EDR product validation is mostly limited to verifying that the image data are properly formatted, the PDS label is properly constructed, and the metadata describing the observation is accurate. If an EDR can successfully be created then it is released to the PDS. There may be rare exceptions where the commanding was improperly provided and the resulting observation contained a data stream devoid of science data. Large data gaps or data scrambling from telemetry transmission may also prevent an EDR product from being created and released.

26
As RDR products are intended for science analysis, a more rigorous validation process occurs. The EDR products are inspected to determine the quality of the observation before committing it to RDR processing. For example, if a CCD channel were improperly commanded, resulting in an image that had significant saturation and was not useful then the EDR would not be included in the RDR processing. As another example, the IR10 Channel 1 image is unstable and often produces a product that is not useful for science analysis. These EDRs are not included in the RDR products. As with EDRs, the RDR products are also checked to verify the imaging data are properly formatted and the PDS label is properly constructed.
4.4 RDR File Naming Convention HiRISE Observation IDs are 15 characters in length containing three fields: a mission phase Identification, orbit number (or sequence code for Aerobraking images), and target code. The mission phase identification is a three-character abbreviation. For Mars orbit observations these identifications are: AEB - Aerobraking Phase TRA - Transition Orbit Phase PSP - Primary Science Phase REL - Relay Phase (if needed) E01 - 1st Extended Mission Phase (if needed) Exx - Any possible extended mission phase (if needed) The orbit number is a six-digit, zero-padded number (example “001000”). For Aerobraking images (only 8 images were acquired during this phase) the field represents a sequence identification chronologically ordered. The target code is a four-digit zero-padded chronologically ordered number within an orbit. For values 0000 – 3595, it is the angle between the nighttime equator (starting position of an MRO orbit) and the latitude of the center of the observation, multiplied by 10. It is measured to the nearest half-degree. The nighttime equator is 0000, the South Pole is 0900, the daytime equator is 1800, and the North Pole is 2700. If the target code is between 9000 and 9303, it indicates an off-planet observation such as Deimos, Phobos, or a star. As an example, the Observation ID: PSP_002170_0990, is a Primary Science Phase observation, acquired on orbit 2170. The observation was acquired near the South Pole. The RDR product file names are constructed by appending “_RED” or “_COLOR” to the Observation ID. The “_RED” designation is a single-band image compiled

27
from the Red-filter images operating during the observation. The “_COLOR” designation is a three-color image complied from the overlapping blue-green, red, and near-infrared detectors. There are two files associated with each product differentiated by a file name extension. A file extension “JP2” is the JPEG2000 image, “.LBL” is the detached PDS label file (see Section 4.5). The RDR products are organized in a directory structure described in [4]. Example RDR product files names are: TRA_000823_1720_RED.JP2 – The JPEG2000 image containing a single band of the red-filter CCDs. The detached label has the same file name but with extension “.LBL”. This is a Transition Orbit Phase image acquired in orbit 823 with the target code 1720. PSP_001333_2485_COLOR.JP2 – The JPEG2000 image containing three-color bands generated from the overlapping blue-green, red, and near-infrared CCDs. The detached label has the same file name but with extension “.LBL”. This is a Primary Science Phase image acquired in orbit 1333 with the target code 2485.
4.5 PDS labels The PDS label shown below is an example from a RDR product. The PDS label for a RDR product is detached from the JPEG2000 file. Appendix A provides a definition of each keyword listed in the PDS label. *************************** Example PDS Label **************************** PDS_VERSION_ID = PDS3 /* Identification Information */ NOT_APPLICABLE_CONSTANT = -9998 DATA_SET_ID = "MRO-M-HIRISE-3-RDR-V1.0" DATA_SET_NAME = "MRO MARS HIGH RESOLUTION IMAGE SCIENCE EXPERIMENT RDR V1.0" PRODUCER_INSTITUTION_NAME = "UNIVERSITY OF ARIZONA" PRODUCER_ID = "UA" PRODUCER_FULL_NAME = "ALFRED MCEWEN" OBSERVATION_ID = "TRA_000823_1720" PRODUCT_ID = "TRA_000823_1720_RED" PRODUCT_VERSION_ID = "1.0" INSTRUMENT_HOST_NAME = "MARS RECONNAISSANCE ORBITER" INSTRUMENT_HOST_ID = "MRO" INSTRUMENT_NAME = "HIGH RESOLUTION IMAGING SCIENCE EXPERIMENT" INSTRUMENT_ID = "HIRISE" TARGET_NAME = "MARS" MISSION_PHASE_NAME = "TRANSITION" ORBIT_NUMBER = 823 SOURCE_PRODUCT_ID = (TRA_000823_1720_RED0_1, TRA_000823_1720_RED0_0, TRA_000823_1720_RED1_1, TRA_000823_1720_RED1_0, TRA_000823_1720_RED2_1, TRA_000823_1720_RED2_0, TRA_000823_1720_RED3_1, TRA_000823_1720_RED3_0, TRA_000823_1720_RED4_1, TRA_000823_1720_RED4_0, TRA_000823_1720_RED5_1, TRA_000823_1720_RED5_0, TRA_000823_1720_RED6_1, TRA_000823_1720_RED6_0, TRA_000823_1720_RED7_1, TRA_000823_1720_RED7_0, TRA_000823_1720_RED8_1, TRA_000823_1720_RED8_0, TRA_000823_1720_RED9_1, TRA_000823_1720_RED9_0) RATIONALE_DESC = "First ITL image; Layered deposits in Iu Chasma floor"

28
SOFTWARE_NAME = "Isis 3.1.11 | 2007-04-20 hirdrgen" OBJECT = IMAGE_MAP_PROJECTION ^DATA_SET_MAP_PROJECTION = "DSMAP.CAT" MAP_PROJECTION_TYPE = "EQUIRECTANGULAR" PROJECTION_LATITUDE_TYPE = PLANETOCENTRIC /* NOTE: The EQUIRECTANGULAR projection is based on the formula */ /* for a sphere. To eliminate confusion in the */ /* IMAGE_MAP_PROJECTION object we have set all three radii, */ /* A_AXIS_RADIUS, B_AXIS_RADIUS, and C_AXIS_RADIUS to the same */ /* number. The value recorded in the three radii is the local */ /* radius at the CENTER_LATITUDE on the Mars ellipsoid. That is, */ /* equatorial radius of 3396.190000 km and polar radius of */ /* 3376.200000 kilometers. Using the local radius of the */ /* ellipsoid implies that the MAP_SCALE and MAP_RESOLUTION are */ /* true at the CENTER_LATITUDE. */ A_AXIS_RADIUS = 3396.036813 <KM> B_AXIS_RADIUS = 3396.036813 <KM> C_AXIS_RADIUS = 3396.036813 <KM> COORDINATE_SYSTEM_NAME = PLANETOCENTRIC POSITIVE_LONGITUDE_DIRECTION = EAST KEYWORD_LATITUDE_TYPE = PLANETOCENTRIC /* NOTE: CENTER_LATITUDE and CENTER_LONGITUDE describe the location */ /* of the center of projection, which is not necessarily equal to the */ /* location of the center point of the image. */ CENTER_LATITUDE = -5.000000 <DEG> CENTER_LONGITUDE = 279.497000 <DEG> LINE_FIRST_PIXEL = 1 LINE_LAST_PIXEL = 23520 SAMPLE_FIRST_PIXEL = 1 SAMPLE_LAST_PIXEL = 23707 MAP_PROJECTION_ROTATION = 0.000000 <DEG> MAP_RESOLUTION = 237088.095595 <PIX/DEG> MAP_SCALE = 0.2500 <METERS/PIXEL> MAXIMUM_LATITUDE = -7.692761 <DEG> MINIMUM_LATITUDE = -7.791952 <DEG> LINE_PROJECTION_OFFSET = -1823859.50000 <PIXEL> SAMPLE_PROJECTION_OFFSET = 11788.50000 <PIXEL> EASTERNMOST_LONGITUDE = 279.547459 <DEG> WESTERNMOST_LONGITUDE = 279.447099 <DEG> END_OBJECT = IMAGE_MAP_PROJECTION /* All xxx_COUNT values are for the MRO spacecraft clock (SCLK) */ /* in seconds:subseconds form. A subsecond tick = 15.2588 microseconds. */ /* All xxx_TIME values are referenced to UTC. */ GROUP = TIME_PARAMETERS /* Time when the observation first started */ MRO:OBSERVATION_START_TIME = 2006-09-29T15:16:33.204 /* Time of the first image line */ START_TIME = 2006-09-29T15:16:33.333 SPACECRAFT_CLOCK_START_COUNT = "844010212:09362" /* Time of the last image line */ STOP_TIME = 2006-09-29T15:16:35.047 SPACECRAFT_CLOCK_STOP_COUNT = "844010213:56143" /* Time when this RDR product was created */ PRODUCT_CREATION_TIME = 2007-05-17T20:03:20.0 END_GROUP = TIME_PARAMETERS GROUP = INSTRUMENT_SETTING_PARAMETERS MRO:CCD_FLAG = (ON, ON, ON, ON, ON, ON, ON, ON, ON, ON, ON, ON, ON, ON) MRO:BINNING = (2, 2, 2, 2, 1, 1, 1, 2, 2, 2, -9998, -9998, -9998, -9998) MRO:TDI = (64, 64, 64, 64, 128, 128, 128, 64, 64, 64, -9998, -9998, -9998, -9998) MRO:SPECIAL_PROCESSING_FLAG = (NOMINAL, NOMINAL, NOMINAL, NOMINAL, NOMINAL, NOMINAL, NOMINAL, NOMINAL, NOMINAL, NOMINAL, NULL, NULL, NULL, NULL) END_GROUP = INSTRUMENT_SETTING_PARAMETERS GROUP = VIEWING_PARAMETERS INCIDENCE_ANGLE = 59.635459 <DEG> EMISSION_ANGLE = 0.050510 <DEG> PHASE_ANGLE = 59.640054 <DEG> LOCAL_TIME = 15.48579 <LOCALDAY/24> SOLAR_LONGITUDE = 113.547466 <DEG> SUB_SOLAR_AZIMUTH = 212.278322 <DEG>

29
NORTH_AZIMUTH = 269.999999 <DEG> END_GROUP = VIEWING_PARAMETERS /* The JPEG2000 image data file associated with this label. */ OBJECT = COMPRESSED_FILE FILE_NAME = "TRA_000823_1720_RED.JP2" RECORD_TYPE = UNDEFINED ENCODING_TYPE = "JP2" ENCODING_TYPE_VERSION_NAME = "ISO/IEC15444-1:2004" INTERCHANGE_FORMAT = BINARY /* The name of the original source file. */ UNCOMPRESSED_FILE_NAME = "TRA_000823_1720_RED.IMG" /* The amount of original image data. */ REQUIRED_STORAGE_BYTES = 1115177280 <BYTES> ^DESCRIPTION = "JP2INFO.TXT" END_OBJECT = COMPRESSED_FILE /* The source image data definition. */ OBJECT = UNCOMPRESSED_FILE FILE_NAME = "TRA_000823_1720_RED.IMG" RECORD_TYPE = FIXED_LENGTH RECORD_BYTES = 47414 <BYTES> FILE_RECORDS = 23520 ^IMAGE = "TRA_000823_1720_RED.IMG" OBJECT = IMAGE DESCRIPTION = "HiRISE projected and mosaicked product" LINES = 23520 LINE_SAMPLES = 23707 BANDS = 1 SAMPLE_TYPE = MSB_UNSIGNED_INTEGER SAMPLE_BITS = 16 SAMPLE_BIT_MASK = 2#0000001111111111# /* NOTE: The conversion from DN to I/F (intensity/flux) is: */ /* I/F = (DN * SCALING_FACTOR) + OFFSET */ /* I/F is defined as the ratio of the observed radiance and */ /* the radiance of a 100% lambertian reflector with the sun */ /* and camera orthogonal to the observing surface. */ SCALING_FACTOR = 1.09905280703979e-04 OFFSET = 0.054890907183266 BAND_STORAGE_TYPE = BAND_SEQUENTIAL CORE_NULL = 0 CORE_LOW_REPR_SATURATION = 1 CORE_LOW_INSTR_SATURATION = 2 CORE_HIGH_REPR_SATURATION = 1023 CORE_HIGH_INSTR_SATURATION = 1022 CENTER_FILTER_WAVELENGTH = 700 <NM> MRO:MINIMUM_STRETCH = 3 MRO:MAXIMUM_STRETCH = 1021 FILTER_NAME = "RED" END_OBJECT = IMAGE END_OBJECT = UNCOMPRESSED_FILE END

30
Appendix A – PDS Label Definitions Table A – Definition of keywords used in the HiRISE Labels
Keyword Definition PDS_VERSION_ID The version number of the PDS standards documents
that is valid when the data product is created. PDS3 is used for HiRISE Products.
NOT_APPLICABLE_CONSTANT -9998 for HiRISE RDR lables. The not_applicable_constant element supplies the numeric value used to represent the figurative constant 'N/A'.'N/A' (Not Applicable) is defined as indicating when values within the domain of a particular data element do not apply in a specific instance.
DATA_SET_ID MRO-M-HIRSE-3-RDR-V1.0 The data_set_id element is a unique alphanumeric identifier for a data set or a data product. The data_set_id value for a given data set or product is constructed according to flight project naming conventions. In most cases the data_set_id is an abbreviation of the data_set_name.
DATA_SET_NAME MRO MARS HIGH RESOLUTION IMAGE SCIENCE EXPERIMENT RDR V1.0 The data_set_name element provides the full name given to a data set or a data product. The data_set_name typically identifies the instrument that acquired the data, the target of that instrument, and the processing level of the data.
PRODUCER_INSTITUTION_NAME UNIVERSITY OF ARIZONA The producer_institution_name element identifies university, research center, NASA center or other institution associated with the production of a data set. This would generally be an institution associated with the element producer_full_name.
PRODUCER_ID UA The producer_id element provides a short name or acronym for the producer or producing team/group of a dataset
PRODUCER_FULL_NAME The producer_full_name element provides the full_name of the individual mainly responsible for the production of a data set.
OBSERVATION_ID The observation_id element uniquely identifies a scientific observation within a data set.
PRODUCT_ID The product_id data element represents a permanent, unique identifier assigned to a data product by its producer. Note: In the PDS, the value assigned to product_id must be unique within its data set. Additional note: The product_id can describe the lowest-level data object that has a PDS label.
PRODUCT_VERSION_ID The product_version_id element identifies the version of an individual product within a data set. Note: This is not the same as the data set version that is an element of the data_set_id value.
INSTRUMENT_HOST_NAME MARS RECONNAISSANCE ORBITER The instrument_host_name element provides the full name of the host on which an instrument is based. This host can be either a spacecraft or an earth base.
INSTRUMENT_HOST_ID MRO The instrument_host_id element provides a unique

31
identifier for the host where an instrument is located. This host can be either a spacecraft or an earth base.
INSTRUMENT_NAME HIGH RESOLUTION IMAGING SCIENCE EXPERIMENT The instrument_name element provides the full name of an instrument.
INSTRUMENT_ID HIRISE The instrument_id element provides an abbreviated name or acronym that identifies an instrument.
TARGET_NAME MARS, SKY, CAL, MOON The target_name element identifies a target. The target may be a planet, satellite, ring, region, feature, asteroid or comet.
MISSION_PHASE_NAME The mission_phase_name element provides the commonly used identifier of a mission phase.
ORBIT_NUMBER The orbit_number element identifies the number of the orbital revolution of the spacecraft around a target body.
SOURCE_PRODUCT_ID The source_product_id data element identifies a product used as input to create a new product.
RATIONALE_DESC The rationale_desc element describes the rationale for performing a particular observation.
IMAGE_MAP_PROJECTION Object within label ^DATA_SET_MAP_PROJECTION The data_set_map_projection object is one of two
distinct objects that define the map projection used in creating the digital images in a PDS data set. The name of other associated object that completes the definition is called IMAGE_MAP_PROJECTION. The map projection information resides in these two objects, essentially to reduce data redundancy and at the same time allow the inclusion of elements needed to process the data at the image level. Static information applicable to the complete data set resides in the DATA_SET_MAP_PROJECTION object, while dynamic information that is applicable to the individual images reside in the IMAGE_MAP_PROJECTION object. The DATA_SET_MAP_PROJECTION object is to be included in an Archive Quality Data Product Label, and used to load the map projection catalog data into a PDS Catalog.
MAP_PROJECTION_TYPE EQUIRECTANGLAR, POLAR STEROGRAPHIC The map_projection_type element identifies the type of projection characteristic of a given map.
PROJECTION_LATITUDE_TYPE PLANETOCENTRIC For some map projections, identifies the type of latitude that is sampled in equal increments by successive image lines. These projections are sometimes known informally as 'database projections' because their simplicity and global applicability for storing data for an entire planet are of greater interest than their formal cartographic properties. The EQUIRECTANGULAR and SIMPLE CYLINDRICAL projections can exist with projection latitude types of PLANETOGRAPHIC or PLANETOCENTRIC projection) and do not require this keyword.
A_AXIS_RADIUS 3396.19 <KM> The a_axis_radius element provides the value of the semimajor axis of the ellipsoid that defines the approximate shape of a target body. 'A' is usually in the equatorial plane.
B_AXIS_RADIUS 3396.19 <KM> The b_axis_radius element provides the value of the

32
intermediate axis of the ellipsoid that defines the approximate shape of a target body. 'B' is usually in the equatorial plane.
C_AXIS_RADIUS 3376.2 <KM> The c_axis_radius element provides the value of the semiminor axis of the ellipsoid that defines the approximate shape of a target body. 'C' is normal to the plane defined by 'A' and 'B'.
COORDINATE_SYSTEM_NAME PLANETOCENTRIC The coordinate_system_name element provides the full name of the coordinate system to which the state vectors are referenced. PDS has currently defined body-fixed rotating coordinate systems. The Planetocentric system has an origin at the center of mass of the body. The planetocentric latitude is the angle between the equatorial plane and a vector connecting the point of interest and the origin of the coordinate system. Latitudes are defined to be positive in the northern hemisphere of the body, where north is in the direction of Earth's angular momentum vector, i.e., pointing toward the hemisphere north of the solar system invariant plane. Longitudes increase toward the east making the Planetocentric system right-handed. The Planetographic system has an origin at the center of mass of the body. The planetographic latitude is the angle between the equatorial plane and a vector through the point of interest, where the vector is normal to a biaxial ellipsoid reference surface. Planetographic longitude is defined to increase with time to an observer fixed in space above the object of interest. Thus, for prograde rotators (rotating counter clockwise as seen from a fixed observer located in the hemisphere to the north of the solar system invariant plane), planetographic longitude increases toward the west. For a retrograde rotator, planetographic longitude increases toward the east. Note: If this data element is not present in the PDS Image Map Projection Object (for pre-V3.1 PDS Standards), the default coordinate system is assumed to body-fixed rotating Planetographic.
POSITIVE_LONGITUDE_DIRECTION EAST The positive_longitude_direction element identifies the direction of longitude (e.g. EAST, WEST) for a planet. The IAU definition for direction of positive longitude is adopted. Typically, for planets with prograde rotations, positive longitude direction is to the WEST. For planets with retrograde rotations, positive longitude direction is to the EAST.
KEYWORD_LATITUDE_TYPE PLANETOCENTRIC Identifies the type of latitude (planetographic or planetocentric) used in the labels, e.g., for the maximum, minimum, center, reference, and standard-parallel latitudes. This can differ from the type of latitude that is equally sampled in certain database projections (see PROJECTION_LATITUDE_TYPE), though use of different values for the two keywords is not recommended. The IAU definition for direction of positive longitude should be adopted: for objects with prograde rotation, a positive longitude direction of west is used in conjunction with PLANETOGRAPHIC latitudes, whereas for objects with retrograde rotation positive east longitude is used with

33
PLANETOGRAPHIC latitudes. By IAU convention east longitude may be used with PLANETOCENTRIC latitude for any body. The keyword COORDINATE_SYSTEM_NAME describes these IAU-approved combinations of latitude and longitude definitions. The keywords KEYWORD_LATITUDE_TYPE and POSITIVE_LONGITUDE_DIRECTION separately specify the definitions for latitude and longitude and hence may be used to describe not only the IAU-approved combinations but also non-IAU-approved combinations as needed. Adherence to the IAU standard is recommended by the PDS.
CENTER_LATITUDE The center_latitude element provides a reference latitude of the map projection. The map_scale (or map_resolution) is typically defined at the center_latitude and center_longitude of the map projection.
CENTER_LONGITUDE The center_longitude element provides a reference longitude for certain map projections. For example, in an Orthographic projection, the center_longitude along with the center_latitude defines the point or tangency between the sphere of the planet and the plane of the projection. The map_scale (or map_resolution) is typically defined at the center_latitude and center_longitude. In unprojected images, center_longitude represents the longitude at the center of the image frame.
LINE_FIRST_PIXEL The line_first_pixel element provides the line (row) index for the first pixel that was physically recorded at the beginning of the image array. Note: In the PDS, for a fuller explanation on the use of this data element in the Image Map Projection Object, please refer to the PDS Standards Reference.
LINE_LAST_PIXEL The line_last_pixel element provides the line (rows) index for the last pixel that was physically recorded at the end of the image array. Note: In the PDS, for a fuller explanation on the use of this data element in the Image Map Projection Object, please refer to the PDS Standards Reference.
SAMPLE_FIRST_PIXEL The sample_first_pixel element provides the sample (column) index for the first pixel that was physically recorded at the beginning of the image array. Note: In the PDS, for a fuller explanation on the use of this data element in the Image Map Projection Object, please refer to the PDS Standards Reference.
SAMPLE_LAST_PIXEL The line_last_pixel element provides the sample (column) index for the last pixel that was physically recorded at the end of the image array. Note: In the PDS, for a fuller explanation on the use of this data element in the Image Map Projection Object, please refer to the PDS Standards Reference.
MAP_PROJECTION_ROTATION The map_projection_rotation element provides the clockwise rotation, in degrees, of the line and sample coordinates with respect to the map projection origin (line_projection_offset, line_projection_offset) This parameter is used to indicate where 'up' is in the projection. For example, in a polar stereographic projection does the zero meridian go center to bottom, center to top, center to left, or center to right? The polar projection is defined such that the zero meridian goes center to bottom. However, by rotating the map projection, the zero meridian can go in any direction. Note: 180 degrees is at the top of the North Pole and 0 degrees is at the top of the South Pole. For example, if 0 degrees is at the top of the North Pole than the map_projection_rotation would be 180 degrees.

34
MAP_RESOLUTION The map_resolution element identifies the scale of a given map. Please refer to the definition for map_scale for a more complete definition. Note: For HiRISE RDR products the map_resolution is expressed in meters/pixel.
MAP_SCALE The map_scale element identifies the scale of a given map in pixels/degree at the center latitude and longitude of the projection.
MAXIMUM_LATITUDE The maximum_latitude element specifies the northernmost latitude of a spatial area, such as a map, mosaic, bin, feature, or region.
MINIMUM_LATITUDE The minimum_latitude element specifies the southernmost latitude of a spatial area, such as a map, mosaic, bin, feature, or region.
LINE_PROJECTION_OFFSET The line_projection_offset element provides the line offset value of the map projection origin position from the line and sample 1,1 (line and sample 1,1 is considered the upper left corner of the digital array) Note: that the positive direction is to the right and down.
SAMPLE_PROJECTION_OFFSET The sample_projection_offset element provides the sample offset value of the map projection origin position from line and sample 1,1 (line and sample 1,1 is considered the upper left corner of the digital array). Note: that the positive direction is to the right and down.
EASTERNMOST_LONGITUDE The following definitions describe easternmost longitude for the body-fixed, rotating coordinate systems: For Planetocentric coordinates and for Planetographic coordinates in which longitude increases toward the east, the easternmost (rightmost) longitude of a spatial area (e.g., a map, mosaic, bin, feature or region) is the maximum numerical value of longitude unless it crosses the Prime Meridian.
WESTERNMOST_LONGITUDE The following definitions describe westernmost longitude for the body-fixed, rotating coordinate systems: For Planetocentric coordinates and for Planetographic coordinates in which longitude increases toward the east, the westernmost (leftmost) longitude of a spatial area (e.g., a map, mosaic, bin, feature or region) is the minimum numerical value of longitude unless it crosses the Prime Meridian.
TIME_PARAMETERS Group within label MRO:OBSERVATION_START_TIME UTC start time of observation. This value indicates
when the instrument flight software began the image acquisition sequence.
START_TIME UTC time of the first image line in the observation.
SPACECRAFT_CLOCK_START_COUNT Spacecraft clock count of first image line of the image observation.
STOP_TIME UTC time of the last image line in image observation.
PRODUCT_CREATION_TIME The product_creation_time element defines the UTC system format time when a product was created. Formation rule: YYYY-MM-DDThh:mm:ss[.fff]
INSTRUMENT_SETTING_PARAMETERS Group within label MRO:CCD_FLAG ON, OFF
The mro:ccd_flag element defines the HiRISE CCDs that were operating at the time of the observation. The order for the set is RED0, RED1, RED2, RED3, RED4, RED5, RED6, RED7, RED8, RED9, IR10, IR11, BG12, BG13.
MRO:BINNING 0, 1, 2, 3, 4, 8, 16

35
The mro:binning element identifies the binning mode of each operating CCD. A 0 value indicates the CCD was not operating. The order for the set is RED0, RED1, RED2, RED3, RED4, RED5, RED6, RED7, RED8, RED9, IR10, IR11, BG12, and BG13.
MRO:TDI 0, 8, 32, 64, 128 The mro:tdi element identifies the tdi mode of each operating CCD. A 0 value indicates the CCD was not operating. The order for the set is RED0, RED1, RED2, RED3, RED4, RED5, RED6, RED7, RED8, RED9, IR10, IR11, BG12, and BG13.
MRO:SPECIAL_PROCESSING_FLAG The mro:special_processing_flag element indicates if special calibration processing was applied to a HiRISE CCD image. The HiRISE instrument may experience instability problems or a low-signal image may have been poorly calibrated requiring an alternate calibration strategy. There is a special processing flag for each CCD used in the observation. The ordering for the values is RED0, RED1, RED2, RED3, RED4, RED5, RED6, RED7, RED8, RED9, IR10, IR11, BG12, and BG13. Values are as follows: NOMINAL = the standard calibration processing was used for the CCD image. CUBENORM = the calibration processing used a columnar gain correction based on columnar statistics of the image. NULL = the CCD was not operating or was missing for this observation."
VIEWING_PARAMETERS Group within label INCIDENCE_ANGLE The incidence_angle element provides a measure of
the lighting condition at the intercept center of the image. Incidence angle is the angle between the local vertical at the intercept point (surface) and a vector from the intercept point to the sun. The incidence_angle varies from 0 degrees when the intercept point coincides with the sub_solar point to 90 degrees when the intercept point is at the terminator (i.e., in the shadowed or dark portion of the target body). Thus, higher values of incidence_angle indicate the existence of a greater number of surface shadows.
EMISSION_ANGLE The emission_angle element provides the value of the angle between the surface normal vector at the image center and a vector from the intercept point to the spacecraft. The emission_angle varies from 0 degrees when the spacecraft is viewing the subspacecraft point (nadir viewing) to 90 degrees when the intercept is tangent to the surface of the target body. Thus, higher values of emission_angle indicate more oblique viewing of the target. Values in the range of 90 to 180 degrees are possible for ring data.
PHASE_ANGLE The phase_angle element provides a measure of the relationship between the instrument viewing position and incident illumination (such as solar light). Phase_angle is measured at the target; it is the angle between a vector to the illumination source and a vector to the instrument. If not specified, the target is assumed to be at the center of the instrument field of view. If illumination is from behind the instrument, phase_angle will be small.
LOCAL_TIME The local_time element provides the local time of day at the center of the field of view of an instrument, measured in local hours from midnight.

36
A local hour is defined as one twenty fourth of a local solar day.
SOLAR_LONGITUDE The solar_longitude element provides the value of the angle between the body_Sun line at the time of interest and the body_sun line at the vernal equinox. This provides a measure of season on a target body, with values of 0 to 90 degrees representing northern spring, 90 to 180 degrees representing northern summer, 180 to 270 degrees representing northern autumn and 270 to 360 degrees representing northern winter.
SUB_SOLAR_AZIMUTH The sub_solar_azimuth element provides the value of the angle between the line from the center of an image to the subsolar point and a horizontal reference line (in the image plane) extending from the image center to the middle right edge of the image. The values of this angle increase in a clockwise direction. This angle a relative to the RDR product described by the label.
NORTH_AZIMUTH The north_azimuth element provides the value of the angle between the line from the center of an image to the north pole and a horizontal reference line (in the image plane) extending from the image center to the middle right edge of the image. The values of this angle increase in a clockwise direction. This angle a relative to the RDR product described by the label.
COMPRESSED_FILE Object within label FILE_NAME File name of the compressed file.
The file_name element provides the location independent name of a file. To promote portability across multiple platforms, PDS requires the file_name to be limited to a 27-character basename, a full stop (. period), and a 3-character extension. Valid characters include capital letters A - Z, numerals 0 - 9, and the underscore character (_).
RECORD_TYPE UNDEFINED Designated record type of the compressed file.
ENCODING_TYPE JP2 Encoding type of the compressed file. The JP2 designation indicates JPEG2000 standard JP2 file format.
ENCODING_TYPE_VERSION_NAME ISO/IEC15444-1:2004 The ISO/IEC Standard version designation
INTERCHANGE_FORMAT BINARY The compressed file is a binary file
UNCOMPRESSED_FILE_NAME The name of the uncompressed file used to construct the compressed file.
REQUIRED_STORAGE_BYTES Total number of bytes that make up the compressed file.
^DESCRIPTION JP2INFO.TXT File containing supplemental information about the JPEG2000 file. This file can be found in the DOCUMENT directory of the PDS volume housing the RDR product.
UNCOMPRESSED_FILE Object within label FILE_NAME File name of the source uncompressed file. RECORD_TYPE FIXED_LENGTH
Record type of uncompressed image file
RECORD_BYTES Number of bytes per record ^IMAGE The ^image element provides the location of the
image object of the uncompressed file.

37
IMAGE Object within label DESCRIPTION Description of the RDR product. Always contains:
HiRISE projected and mosaicked product LINES Number of image lines (rows) in the image object LINE_SAMPLES Number of samples (columns) per image line. This
dimension is the fasted varying dimension of the image array.
BANDS Number of bands SAMPLE_TYPE MSB_UNSIGNED_INTEGER
Sample or pixel type.
SAMPLE_BITS Always 16, number of bits per sample or pixel SAMPLE_BIT_MASK Examples: 2#0000001111111111#
The sample_bit_mask element identifies the active bits in each sample. Note: In the PDS, the domain of sample_bit_mask is dependent upon the currently described value in the sample_bits element and only applies to integer values.
SCALING_FACTOR The scaling_factor and offset elements provides the constant values by which the stored pixel values are converted to I/F. Note: Expressed as an equation: true value (I/F) = offset value + (scaling factor x stored value).
OFFSET See scaling_factor keyword above BAND_STORAGE_TYPE BAND_SEQUENTIAL
The band_storage_type element indicates the storage sequence of lines, samples and bands in an image. The values describe, for example, how different samples are interleaved in image lines, or how samples from different bands are arranged sequentially. Example values: BAND SEQUENTIAL, SAMPLE INTERLEAVED, LINE INTERLEAVED.
CENTER_FILTER_WAVELENGTH The center_filter_wavelength element provides the mid_point wavelength value between the minimum and maximum instrument filter wavelength values.
CORE_NULL The core_null element identifies a special value whose presence indicates missing data.
CORE_LOW_REPR_SATURATION The core_low_repr_saturation element identifies a special value whose presence indicates the true value cannot be represented in the chosen data type and length.
CORE_LOW_INSTR_SATURATION The core_low_instr_saturation element identifies a special value whose presence indicates the measuring instrument was saturated at the low end.
CORE_HIGH_REPR_SATURATION The core_high_repr_saturation element identifies a special value whose presence indicates the true value cannot be represented in the chosen data type and length.
CORE_HIGH_INSTR_SATURATION The core_high_instr_saturation element identifies a special value whose presence indicates the measuring instrument was saturated at the high end.
MRO:MINIMUM_STRETCH This element provides contrast stretch values to be used in the display of a HiRISE Image. The parameter is the minimum DN value to map to the 0 DN (Black) value of the display. For color images, there will be three values, one for each color.
MRO:MAXIMUM_STRETCH This element provides a contrast stretch value to be used in the display of a HiRISE Image. The parameter specifies the DN value to map to the 255 DN value of the display. For color images, there will be three values, one for each color.
FILTER_NAME RED, BLUE-GREEN, NEAR-INFRARED The filter_name element provides the commonly used name of the instrument filter through which an image or measurement was acquired or which is associated with a given instrument mode.