
Software as a Service (SaaS) Report Spring 2021
56
Software as a Service (SaaS) Report Spring 2021
Transcript of Software as a Service (SaaS) Report Spring 2021
Software as a Service (SaaS) Report Spring 2021
2REDEYE - SAAS REPORT 2021
AGENDA APRIL 14 2021
08:30 Redeye Report & Intro with Redeye analyst
08:40 Speqta – Fredrik Lindros, CEO
09:00 Safeture – Magnus Hultman CEO
Enterprise Resource Planning
09:20 Briox – Johan Nordqvist, CEO
09:35 24SevenOffice – Ståle Risa, CEO
09:50 Admicom – Petri Aho, CFO
10:05 Panel discussion
Digital In-store
10:20 ZetaDisplay – Per Mandorf, CEO
10:35 Vertiseit – Johan Lind, CEO
10:50 Panel discussion
11:00 XM Reality – Jörgen Remmelg, CEO
11:20 Artificial Solutions – Per Ottosson, CEO & Fredrik Törgren, CFO
11:40 Zutec – Gustave Geisendorf, CEO
12:00 LeadDesk – Olli Nokso-Koivisto, CEO
eHealth Solutions
12:20 Carasent – Dennis Höjer, CEO
12:35 PatientSky – Johan Zetterström, CEO & Laust Wilster Axelsen, CPO
12:50 Panel discussion
13:00 Mercell – Terje Wibe, CEO & Fredrik Eeg, CFO
13:20 Agillic – Emre Gürsoy, CEO
13:40 Formpipe – Christian Sundin, CEO
14:00 Compodium – Charlotte Berg, CEO
14:20 Sharespine – Fredrik Runar Wahlgren, CEO
14:40 DecideAct – Flemming Videriksen, CEO
15:00 Penneo – Nicolaj Hojer Nielsen, Interim CEO
15:30 The End
3REDEYE - SAAS REPORT 2021
SAAS REPORT 2021
About Redeye 4
Redeye Technology Team 5
Transactions 8
Why invest in SaaS & the Cloud 10 The BIG one: The shift to the Cloud 11 Consumerization of IT 11 The rise of subscription economy 11 Investors and recurring revenue 11
Software Overview 12 Large variations in SaaS adoption rates 12 Only 30% of IT spend heading for the Cloud 12 Solid growth trend expected to continue 13 Rule of 40 – when the best metrics are missing 13
SaaS Companies and Economic Downturns 20 ARR Through the Corona Crisis 22 SaaS Metrics 23 Nordic Public Metrics Benchmarks 24
Covered Companies 26
Currently not covered companies at the event 50
Disclaimer 55
Table of contents
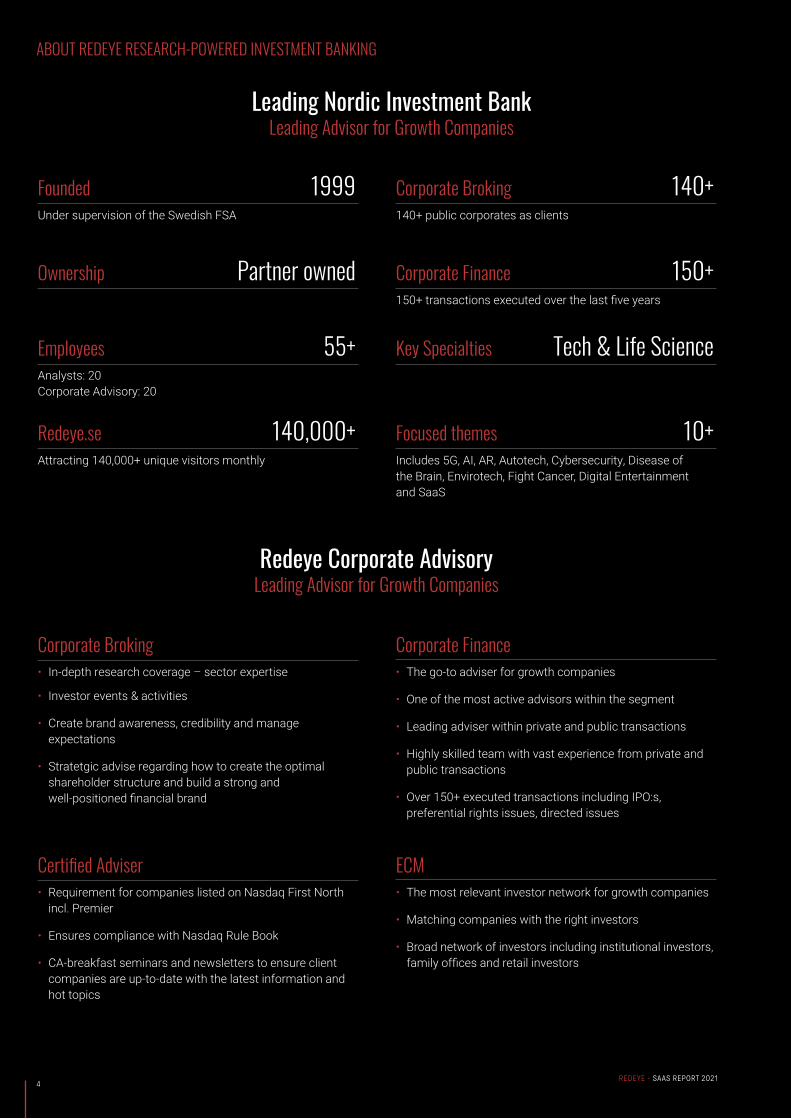
ABOUT REDEYE RESEARCH-POWERED INVESTMENT BANKING
Leading Nordic Investment BankLeading Advisor for Growth Companies
Founded 1999Under supervision of the Swedish FSA
Employees 55+Analysts: 20 Corporate Advisory: 20
Ownership Partner owned
Redeye.se 140,000+Attracting 140,000+ unique visitors monthly
Corporate Broking 140+140+ public corporates as clients
Key Specialties Tech & Life Science
Corporate Finance 150+150+ transactions executed over the last five years
Focused themes 10+Includes 5G, AI, AR, Autotech, Cybersecurity, Disease of the Brain, Envirotech, Fight Cancer, Digital Entertainment and SaaS
Redeye Corporate AdvisoryLeading Advisor for Growth Companies
Corporate Broking• In-depth research coverage – sector expertise
• Investor events & activities
• Create brand awareness, credibility and manage expectations
• Stratetgic advise regarding how to create the optimal shareholder structure and build a strong and well-positioned financial brand
Certified Adviser• Requirement for companies listed on Nasdaq First North incl. Premier
• Ensures compliance with Nasdaq Rule Book
• CA-breakfast seminars and newsletters to ensure client companies are up-to-date with the latest information and hot topics
Corporate Finance• The go-to adviser for growth companies
• One of the most active advisors within the segment
• Leading adviser within private and public transactions
• Highly skilled team with vast experience from private and public transactions
• Over 150+ executed transactions including IPO:s, preferential rights issues, directed issues
ECM• The most relevant investor network for growth companies
• Matching companies with the right investors
• Broad network of investors including institutional investors, family offices and retail investors
4REDEYE - SAAS REPORT 2021
w
5REDEYE - SAAS REPORT 2021
THE REDEYE TECHNOLOGY TEAM
Erik KrammingClient Manager & Head of Technology
Erik has a Master of Science in finance from Stockholm University. His previous work has included a position at Handelsbanken Capital Markets. At Redeye, Erik works with Corporate Broking for the Technology team.
Greger JohanssonClient Manager & Co-head Technology
Greger has a background from the telecom industry, both from large companies as well as from entrepreneurial companies in Sweden (Telia and Ericsson) and USA (Metricom). He also spent 15+ years in investment banking (Nordea and Redeye). Furthermore, at Redeye Greger advise growth companies within the technology sector on financing, equity storytelling and getting the right shareholders/investors (Corporate Broking). Coder for two published C64-games. M.Sc.EE and M.Sc.Econ.
Johan EkströmClient Manager
Johan has a Master of Science in finance from the Stockholm School of Economics, and has studied e-com-merce and marketing at the MBA Haas School of Business, University of California, Berkeley. Johan has worked as an equity portfolio manager at Alfa Bank and Gazprombank in Moscow, as a hedge fund manager at EME Partners, and as an analyst and portfolio manager at Swedbank Robur. At Redeye, Johan works in the Corporate Broking team with fundamental analysis and advisory in the tech sector.
Erik RolanderClient Manager
Erik has a Master’s degree in finance from Linköpings Universitet. He has previously worked at Remium as a tech analyst and product manager for the equity research platform Introduce.se, which today is owned by ABG Sundal Collier. At Redeye, Erik works with Corporate Broking for the Technology team.
Niklas BlumenthalClient Manager
Niklas has studied business administration at Uppsala University and has over 20 years of experience in the financial market. He has previously worked as client manager at Nordnet, CMC Markets, Remium and ABG Sundal Collier. At Redeye, Niklas works with Corporate Broking in both Technology and Life Science teams.
6REDEYE - SAAS REPORT 2021
THE REDEYE TECHNOLOGY TEAM
Mattias EhrenborgAnalyst
Mattias is an equity analyst within Redeye’s technology team, focusing on the renewable energy & cleantech sector. He holds a BSc in Business and Economics from Uppsala University. Mattias has previously worked at ABG Sundal Collier as a part of the Capital Goods team, primarily focusing on the renewable energy & cleantech sector.
Jonas AmnestenAnalyst
Jonas is an equity analyst within Redeye’s technology team, with focus on the online gambling industry. He holds a Master’s degree in Finance from Stockholm University, School of Business. He has more than 6 years’ experience from the online gambling industry, working in both Sweden and Malta as Business Controller within the Cherry Group.
Henrik AlveskogAnalyst
Henrik has an MBA from Stockholm University. He started his career in the industry in the mid-1990s. After working for a couple of investment banks he came to Redeye, where he has celebrated 10 years as an analyst.
Forbes Goldman Analyst
Forbes is an equity analyst within the technology team at Redeye. He holds a BSc in Business and Economics from the Stockholm School of Economics and has also completed an academic exchange semester in Mexico City.
Douglas Forsling Analyst
Douglas is an equity analyst in the technology team with a focus on the online gambling sector and fintech sec-tor. He holds a Bachelor’s degree in finance and an unfinished Master’s degree in Operational Management and Control from Stockholm University, School of Business. In addition, he has studied abroad in Hong Kong, Beijing, and Oxford. He has had positions in SEB, Nordic Capital, and Danone. He has also produced a finance podcast for nearly two years.
Tomas OtterbeckHead of Research
Tomas gained a Master’s degree in Business and Economics at Stockholm University. He also studied Computing and Systems Science at the KTH Royal Institute of Technology. Tomas was previously responsible for Redeye’s website for six years, during which time he developed its blog and community and was editor of its digital stock exchange journal, Trends. Tomas also worked as a Business Intelligence consultant for over two years.

7REDEYE - SAAS REPORT 2021
THE REDEYE TECHNOLOGY TEAM
Jesper HenriksonAnalyst
Jesper is an equity analyst in the technology team with a focus on telecom, automotive tech and more. He holds a Master’s degree in Industrial Engineering and Management from Lund University, institute of technol-ogy. In addition, he has studied abroad in Madrid. He has previously worked as an entrepreneur, management consultant and business development manager at a B2B SaaS company. He has also run a stock-research blog for nearly five years.
Danesh Zare Analyst
Danesh has a Master’s degree in mechanical engineering from the Royal Institute of Technology. He has previously worked as a Calculation Engineer for more than 6 years, holding positions at both Scania and Volvo Trucks. He also produced a finance podcast for nearly two years. Danesh joined Redeye in 2020 and works as an equity research analyst, covering companies in the tech-sector, with a focus on gaming companies
Viktor WestmanAnalyst
Viktor read a Master’s degree in Business and Economics, Finance, at Stockholm University, where he also sat his Master of Laws. Viktor previously worked at the Swedish Financial Supervisory Authority and as a writer at Redeye. He today works with equity research at Redeye and covers companies in IT, telecoms and technology.
Mark Siöstedt Analyst
Mark has a Master’s degree in Accounting and Finance from Lund University. He has a dual role within Redeye as an editor (quality assurance and Top Picks) and as an equity analyst on the technology team.
Mats HyttingeAnalyst
Mats is an equity analyst in the technology & life science team at Redeye. He has an MBA and Bachelor degree in Finance from USE in Monaco.
Fredrik NilssonAnalyst
Fredrik is an equity analyst within Redeye’s technology team. He has an MSc in Finance from University of Gothenburg and has previously worked as a tech-focused equity analyst at Remium.

Technology Selected Transactions
8REDEYE - SAAS REPORT 2021
9REDEYE - SAAS REPORT 2021
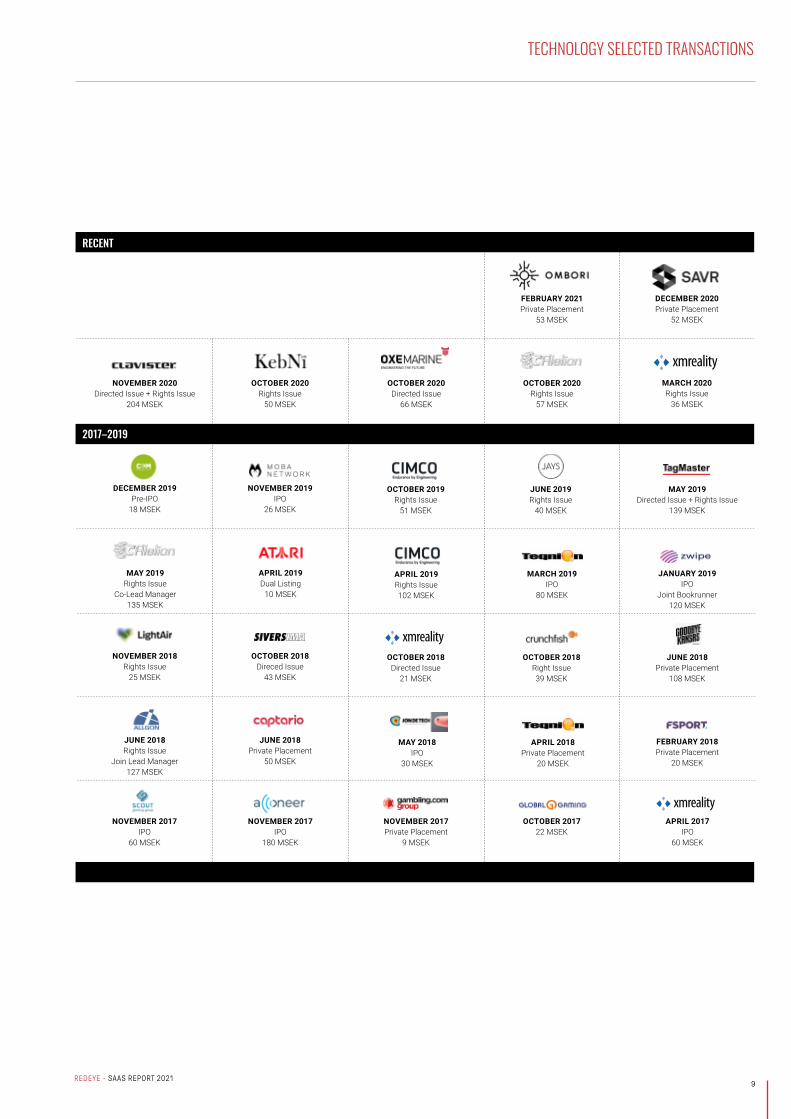
TECHNOLOGY SELECTED TRANSACTIONS
2017–2019
FEBRUARY 2018Private Placement
20 MSEK
APRIL 2018 Private Placement
20 MSEK
MAY 2018 IPO
30 MSEK
JUNE 2018 Private Placement
50 MSEK
OCTOBER 2018 Direced Issue
43 MSEK
NOVEMBER 2018 Rights Issue
25 MSEK
JUNE 2018 Rights Issue
Join Lead Manager127 MSEK
JUNE 2018 Private Placement
108 MSEK
OCTOBER 2018 Right Issue39 MSEK
OCTOBER 2018 Directed Issue
21 MSEK
MARCH 2020Rights Issue
36 MSEK
DECEMBER 2020Private Placement
52 MSEK
MAY 2019 Rights Issue
Co-Lead Manager135 MSEK
OCTOBER 2020 Rights Issue
57 MSEK
OCTOBER 2020Directed Issue
66 MSEK
OCTOBER 2020 Rights Issue
50 MSEK
NOVEMBER 2020 Directed Issue + Rights Issue
204 MSEK
NOVEMBER 2019 IPO
26 MSEK
DECEMBER 2019 Pre-IPO
18 MSEK
MAY 2019 Directed Issue + Rights Issue
139 MSEK
JUNE 2019 Rights Issue
40 MSEK
OCTOBER 2019 Rights Issue
51 MSEK
APRIL 2019 Dual Listing
10 MSEK
APRIL 2019Rights Issue102 MSEK
MARCH 2019 IPO
80 MSEK
JANUARY 2019 IPO
Joint Bookrunner 120 MSEK
NOVEMBER 2017 IPO
60 MSEK
NOVEMBER 2017 IPO
180 MSEK
NOVEMBER 2017 Private Placement
9 MSEK
OCTOBER 2017 22 MSEK
APRIL 2017 IPO
60 MSEK
RECENT
FEBRUARY 2021 Private Placement
53 MSEK
Why invest in SaaS & the Cloud
10REDEYE - SAAS REPORT 2021
In this report we dig deeper into:
• SaaS adoption rates by country and application vertical• Cloud IT spending percentage• Projected growth rates for SaaS• Public market valuation implications• The Corona crisis’s impact on ARR

11REDEYE - SAAS REPORT 2021
The BIG one: The shift to the CloudThe big trend that shapes the Cloud industry is the shift from on-premise software spend to Cloud. This is a secular shift that has been ongoing for many years; however, the transformation is still in the early days within some verticals. The Cloud service, with the most substantial revenue, is the application layer (SaaS).
Consumerization of ITAnother trend affecting the Cloud service industry is the consumerization of IT. That means that the applications used in work more resemble consumer tech products when it comes to usability, UX and UI. This has also led to another buying pattern within organizations as the buy decision many times have become decentralized where the end-user of the product might be the one who decides which service to use.
The rise of subscription economyIn many ways, Cloud technology is the enabler of the sub-scription economy, but the consumer and user behavior fuel the rise of subscription even further. The subscription economy is a trend both within B2C and B2B but is extremely apparent within the software market, where a focus has shifted from providing a product to an ongoing service.
WHY INVEST IN SAAS & THE CLOUD
SaaS and Cloud companies provide investors the opportunity to benefit from ongoing secular growth trends, including: Shift from on-premise enterprise infrastructure to the Cloud, Consumerization of IT, and the rise of the subscription economy and investors craving for recurring revenue.
YYeeaarr ‘‘1199 ‘‘2200EE ‘‘2211EE ‘‘2222EEBPaaS 45.21 44.74 47.52 50.34PaaS 37.51 43.82 55.49 68.96SaaS 102.06 101.48 117.77 138.26CLd. Mng & sec. 12.84 14.88 17.00 19.93
IaaS 44.46 51.42 65.26 82.23DaaS 0.62 1.20 1.95 2.54TToottaall 224422..7700 225577..5555 330066..9955 336622..2266Source: Gartner
GGlloobbaall CClloouudd SSeerrvviiccee RReevveennuuee ((bbnn$$))
Investors and recurring revenueWhat can be better than always starting with an almost full bucket every month? Well, according to investors, nothing is better than recurring revenue. The SaaS pricing model creates:
• Stability• Predictability• High margins• Lower business risk
All the above factors are the reason why investors crave recurring revenue companies and price them high. In the early days of SaaS, many market participants did not under-stand the model, with the argument that it’s better to have the money in the bank today than in the future. However, it has become apparent that the Life-time-value is much higher for the same type of service when people or companies pay on a recurring basis over a long time period. If the companies have the right type of structure on their offering, there will also be significant upsell possibilities per client, which can be compared to selling a one-time license to use a software with a small support fee.
Source: Gartner

12REDEYE - SAAS REPORT 2021
The difference in SaaS adoption among different types of software is even greater than the regional difference. Collaboration, Human Capital Management (HCM), and Customer Relationship Management (CRM) are estimated to have a SaaS penetration of 70-80% this year. Thus, these software segments are arguably close to reaching maturity in terms of SaaS penetration. At the bottom, with estimated SaaS adoption rates of below 10%, we find operations, manufacturing, and engineering-related software. Thus, industrial software is lagging in SaaS adoption.
Interestingly, the increase in penetration from 2015 to 2020 is, on average, expected to be larger in segments that had a high adoption level in 2015. Thus, similar to the regions, the gap between early adopters and laggards is expected to have increased since the mid-10s.
SOFTWARE OVERVIEW
Large variations in SaaS adoption ratesThe adoption of SaaS among businesses in Europe varies substantially from country to country. The Nordic countries are frontrunners in the migration towards SaaS. All Nordic countries had a penetration rate above 60% in 2018 – almost twice the EU-28 average of 36%. Italy has taken a significant leap in SaaS penetration since 2018 and is now just behind the Nordic countries. However, most southern European countries still have a penetration rate below 30%.
0%
10%
20%
30%
40%
50%
60%
70%
SaaS
pen
etra
tion
rate
Use of cloud computing services in Europe
2020 2018
81%
71% 69%
38% 36%
24% 24%
14%9%
5%
58% 60%
49%
25% 24%
12% 12%6% 6%
2%0%
10%
20%
30%
40%
50%
60%
70%
80%
90%
SaaS
pen
etra
tion
rate
Global SaaS penetrations rate 2015-2020, by application
2020E 2015
Source: Redeye Research, Eurostat
Source: Redeye Research, Statista, IDC
We have gathered Cloud service market data which highlights that in many areas, the shift to the Cloud is just in its early days, the transition will continue for many years to come.

13REDEYE - SAAS REPORT 2021
SOFTWARE OVERVIEW
31
4859
86
102 102
118
138
0
20
40
60
80
100
120
140
160
2015 2016 2017 2018 2019 2020E 2021E 2022E
SaaS
pen
etra
tion
rate
Global public cloud application services (SaaS) bn$
46%
20%
10%
20%
IT Spend
Other On-premises software SaaS IaaS/PaaS
Source: Redeye Research, Statista, GartneSource: Redeye Research, Flexera, Statista
Solid growth trend expected to continue
While Gartner expects a slowdown from an impressive CAGR of 34% 2015-2019 – although, from low levels, SaaS growth is expected to remain healthy, as Gartner forecasts a 11% CAGR 2019-2022.
Given a current SaaS adoption of +60% in several software segments and regions, SaaS has reached a more mature state and slower – although still substantial – overall market growth seems reasonable. However, in many software s egments and regions, the SaaS adoption rate is modest. As mentioned earlier, EU28 had a SaaS penetration rate of only 36% in 2020. The growth potential going forward is likely to vary substantially depending on the software segment and region.
Only 30% of IT spend heading for the Cloud
While the adoption of SaaS is significant in several regions and segments, as mentioned before, only 30% of IT spend is currently allocated to the cloud (SaaS and IaaS/PaaS), according to Flexera. For comparison, 20% of IT spend is allocated to On-premises software, suggesting that SaaS still can gain significant market shares.
14REDEYE - SAAS REPORT 2021
SOFTWARE OVERVIEW
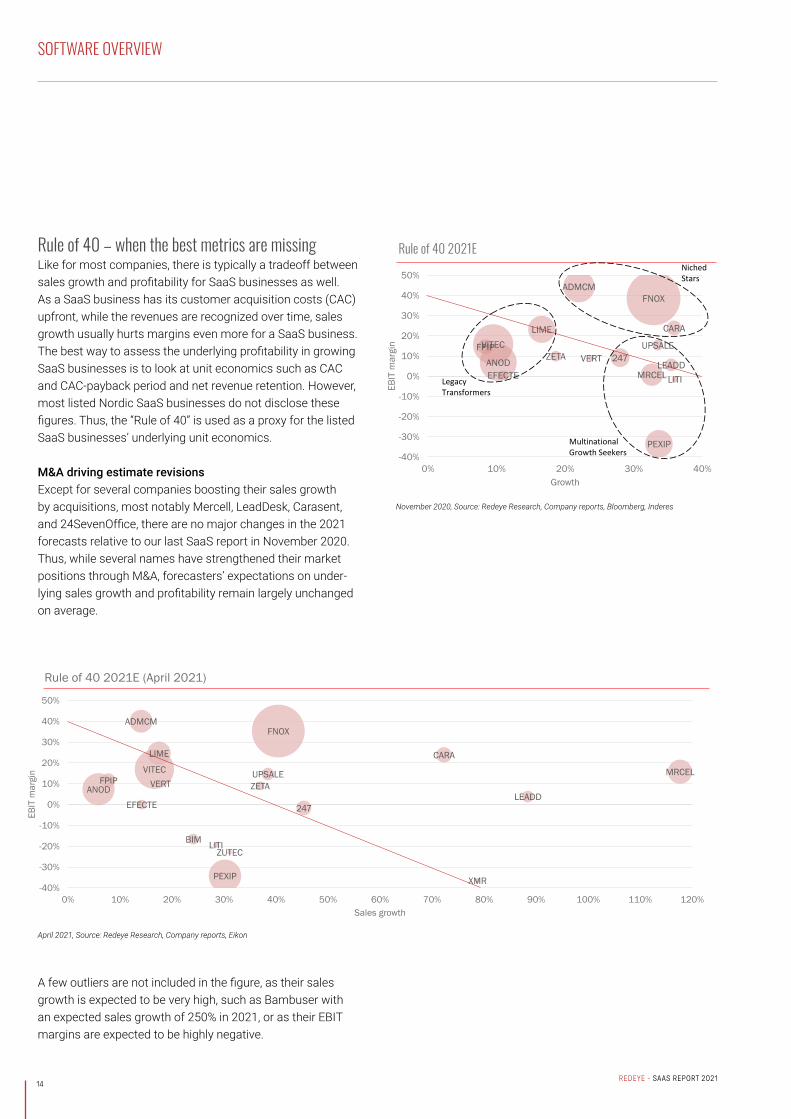
Rule of 40 – when the best metrics are missingLike for most companies, there is typically a tradeoff between sales growth and profitability for SaaS businesses as well. As a SaaS business has its customer acquisition costs (CAC) upfront, while the revenues are recognized over time, sales growth usually hurts margins even more for a SaaS business. The best way to assess the underlying profitability in growing SaaS businesses is to look at unit economics such as CAC and CAC-payback period and net revenue retention. However, most listed Nordic SaaS businesses do not disclose these figures. Thus, the “Rule of 40” is used as a proxy for the listed SaaS businesses’ underlying unit economics.
M&A driving estimate revisionsExcept for several companies boosting their sales growth by acquisitions, most notably Mercell, LeadDesk, Carasent, and 24SevenOffice, there are no major changes in the 2021 forecasts relative to our last SaaS report in November 2020. Thus, while several names have strengthened their market positions through M&A, forecasters’ expectations on under-lying sales growth and profitability remain largely unchanged on average.
247ANOD
ADMCM
CARA
EFECTE
FPIP
FNOX
LEADD
LIME
LITIMRCEL
PEXIP
UPSALEVERT
VITECZETA
-40%
-30%
-20%
-10%
0%
10%
20%
30%
40%
50%
0% 10% 20% 30% 40%
EBIT
mar
gin
Growth
Rule of 40 2021ENiched Stars
LegacyTransformers
Multinational Growth Seekers
247
ANOD
ADMCM
BIM
CARA
EFECTE
FPIP
FNOX
LEADD
LIME
LITI
MRCEL
PEXIP
UPSALEVERT
VITEC
XMR
ZETA
ZUTEC
-40%
-30%
-20%
-10%
0%
10%
20%
30%
40%
50%
0% 10% 20% 30% 40% 50% 60% 70% 80% 90% 100% 110% 120%
EBIT
mar
gin
Sales growth
Rule of 40 2021E (April 2021)
November 2020, Source: Redeye Research, Company reports, Bloomberg, Inderes
April 2021, Source: Redeye Research, Company reports, Eikon
A few outliers are not included in the figure, as their sales growth is expected to be very high, such as Bambuser with an expected sales growth of 250% in 2021, or as their EBIT margins are expected to be highly negative.

15REDEYE - SAAS REPORT 2021
SOFTWARE OVERVIEW
2022E – A better proxy for underlying performanceAs the 2022 forecasts, unlike 2021E, do not include any significant contribution from acquisitions, we believe it is a better proxy for the expectations on the companies’ under-lying sales growth and their performance relative to Rule of 40. Interestingly, but not very surprising as analysts, including ourselves, tend to be optimistic, forecasters expect basically all companies to improve their underlying performance in 2022 relative to 2021. Also, estimates suggest BIMobject and Litium, both coming from a rather soft position in 2021, will achieve the greatest performance improvements relative to this year.
247
ANOD
ADMCM
BIM
CARA
EFECTE
FPIP
FNOX
LEADD
LIME
LITI
MRCEL
PEXIP SFTR
UPSALEVERT
VITEC
XMR
ZETA
ZUTEC
-40%
-30%
-20%
-10%
0%
10%
20%
30%
40%
50%
0% 10% 20% 30% 40% 50%
EBIT
mar
gin
Sales growth
Rule of 40 2022E (April 2021)
April 2021, Source: Redeye Research, Company reports, Eikon
In our November 2020 SaaS report, we identified three clusters sharing many characteristics. The “Niched Stars”, including Fortnox, Admicom, and Carasent, are expected to remain at the top of listed Nordics SaaS businesses also in 2022. However, forecasters expect some companies in the “Multinational Growth Seekers” cluster, such as Mercell and Upsales, to approach the “Niched Stars” cluster, mostly thanks to higher margin levels.
Regarding the “Legacy Transformers”, forecasters do not expect any significant changes in 2022 relative to 2021. We find that reasonable as these companies typically have a significant revenue share from professional services, which are generally slow-moving with low scalability.
Also, for 2022, Bambuser, with an expected sales growth of 110% and an EBIT margin of -69%, is an outlier and not included in our figure.

16REDEYE - SAAS REPORT 2021
247
ANOD
ADMCM
CARA
EFECTE FPIP
FNOX
LEADD
LIME
LITI
MRCELPEXIP
UPSALE
VERT
VITEC
ZETA0
5
10
15
20
25
0% 20% 40% 60% 80%
EV/S
ales
Sales growth + EBIT margin
EV/S vs Sales Growth + EBIT margin 2021E
247
ANOD
ADMCM
BIM
CARA
EFECTEFPIP
FNOX
LEADD
LIME
LITI
MRCEL
PEXIP
SFTR
UPSALE
VERT
VITEC
XMR
ZETA
ZUTEC
0
5
10
15
20
25
30
-10% 10% 30% 50% 70% 90% 110% 130%
EV/S
ales
Sales growth + EBIT margin
EV/S vs Growth + EBIT margin 2021E (April 2021)
November 2020, Source: Redeye Research, Company reports, Bloomberg, Inderes
April 2021, Source: Redeye Research, Company reports, Eikon
2021E valuations remain intact
While underlying forecasts (excluding M&A) have remained largely unchanged, as mentioned earlier, valuations have increased slightly relative to November 2020 for most com-panies. However, as we are now in April and closer to the 2021 cash flows, a slight increase in valuations is expected, everything else being equal. Thus, regarding underlying
estimates and valuations, the situation remains largely unchanged compared to our last SaaS report in November 2020.
Note that Bambuser, with an EV/S of ~40x, is excluded from the 2021E figure.
SOFTWARE OVERVIEW
17REDEYE - SAAS REPORT 2021
247
ANOD
ADMCM
BUSER
BIM
CARA
EFECTEFPIP
FNOX
LEADD
LIME
LITI
MRCEL
PEXIP
SFTR
UPSALE
VERT
VITEC
XMR
ZETA
ZUTEC
0
5
10
15
20
0% 20% 40% 60% 80%
EV/S
ales
Sales growth + EBIT margin
EV/S vs Growth + EBIT m. 2022E (April 2021)
247
ANOD
ADMCM
BIM
CARA
EFECTEFPIP
FNOX
LEADD
LIME
LITI
MRCEL
PEXIP
SFTR
UPSALE
VERT
VITEC
XMR
ZETA
ZUTEC
0
5
10
15
20
0% 10% 20% 30% 40% 50%
EV/S
ales
Sales growth
EV/S vs Growth 2022E (April 2021)
April 2021, Source: Redeye Research, Company reports, Eikon
April 2021, Source: Redeye Research, Company reports, Eikon
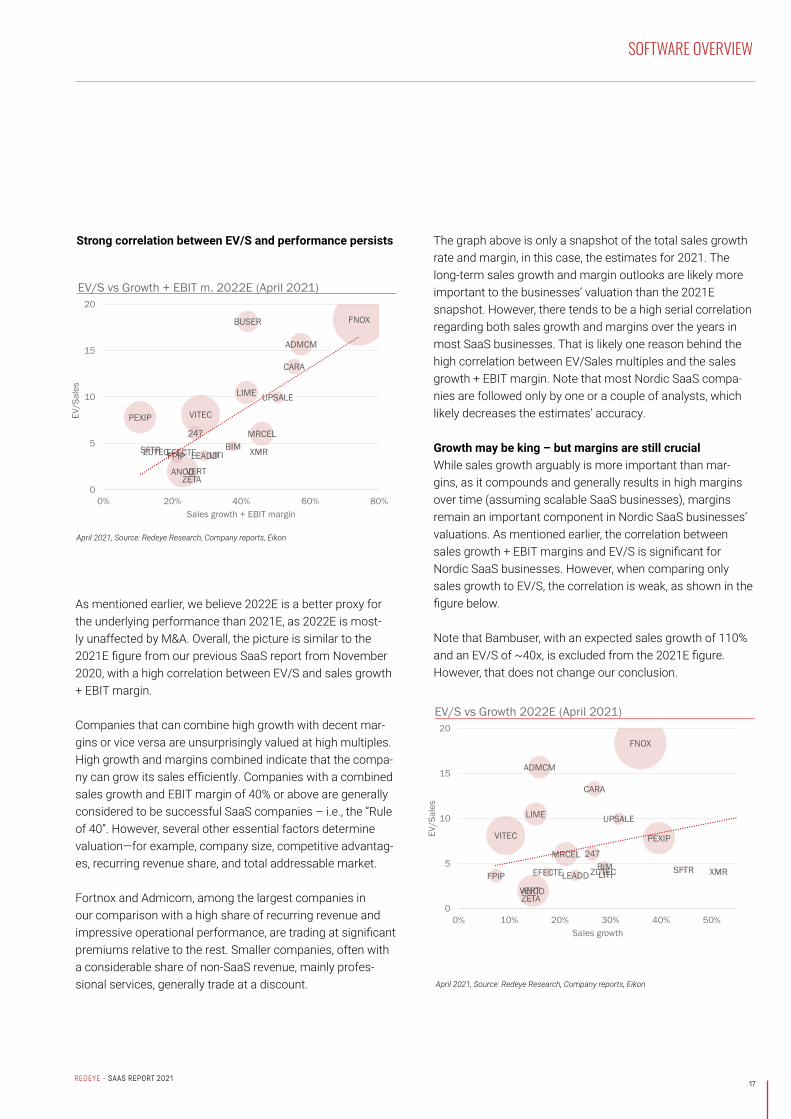
Strong correlation between EV/S and performance persists
As mentioned earlier, we believe 2022E is a better proxy for the underlying performance than 2021E, as 2022E is most-ly unaffected by M&A. Overall, the picture is similar to the 2021E figure from our previous SaaS report from November 2020, with a high correlation between EV/S and sales growth + EBIT margin.
Companies that can combine high growth with decent mar-gins or vice versa are unsurprisingly valued at high multiples. High growth and margins combined indicate that the compa-ny can grow its sales efficiently. Companies with a combined sales growth and EBIT margin of 40% or above are generally considered to be successful SaaS companies – i.e., the “Rule of 40”. However, several other essential factors determine valuation—for example, company size, competitive advantag-es, recurring revenue share, and total addressable market.
Fortnox and Admicom, among the largest companies in our comparison with a high share of recurring revenue and impressive operational performance, are trading at significant premiums relative to the rest. Smaller companies, often with a considerable share of non-SaaS revenue, mainly profes-sional services, generally trade at a discount.
The graph above is only a snapshot of the total sales growth rate and margin, in this case, the estimates for 2021. The long-term sales growth and margin outlooks are likely more important to the businesses’ valuation than the 2021E snapshot. However, there tends to be a high serial correlation regarding both sales growth and margins over the years in most SaaS businesses. That is likely one reason behind the high correlation between EV/Sales multiples and the sales growth + EBIT margin. Note that most Nordic SaaS compa-nies are followed only by one or a couple of analysts, which likely decreases the estimates’ accuracy.
Growth may be king – but margins are still crucialWhile sales growth arguably is more important than mar-gins, as it compounds and generally results in high margins over time (assuming scalable SaaS businesses), margins remain an important component in Nordic SaaS businesses’ valuations. As mentioned earlier, the correlation between sales growth + EBIT margins and EV/S is significant for Nordic SaaS businesses. However, when comparing only sales growth to EV/S, the correlation is weak, as shown in the figure below.
Note that Bambuser, with an expected sales growth of 110% and an EV/S of ~40x, is excluded from the 2021E figure. However, that does not change our conclusion.
SOFTWARE OVERVIEW
18REDEYE - SAAS REPORT 2021
SOFTWARE OVERVIEW
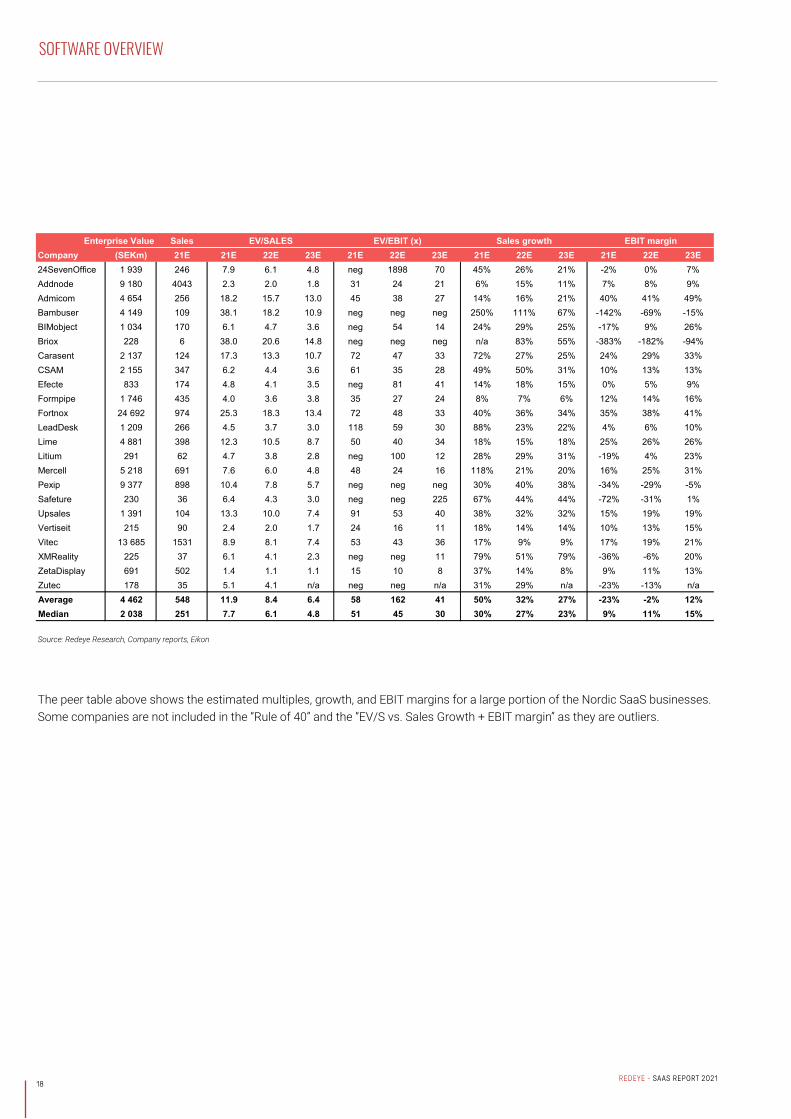
Enterprise Value SalesCompany (SEKm) 21E 21E 22E 23E 21E 22E 23E 21E 22E 23E 21E 22E 23E24SevenOffice 1 939 246 7.9 6.1 4.8 neg 1898 70 45% 26% 21% -2% 0% 7%Addnode 9 180 4043 2.3 2.0 1.8 31 24 21 6% 15% 11% 7% 8% 9%Admicom 4 654 256 18.2 15.7 13.0 45 38 27 14% 16% 21% 40% 41% 49%Bambuser 4 149 109 38.1 18.2 10.9 neg neg neg 250% 111% 67% -142% -69% -15%BIMobject 1 034 170 6.1 4.7 3.6 neg 54 14 24% 29% 25% -17% 9% 26%Briox 228 6 38.0 20.6 14.8 neg neg neg n/a 83% 55% -383% -182% -94%Carasent 2 137 124 17.3 13.3 10.7 72 47 33 72% 27% 25% 24% 29% 33%CSAM 2 155 347 6.2 4.4 3.6 61 35 28 49% 50% 31% 10% 13% 13%Efecte 833 174 4.8 4.1 3.5 neg 81 41 14% 18% 15% 0% 5% 9%Formpipe 1 746 435 4.0 3.6 3.8 35 27 24 8% 7% 6% 12% 14% 16%Fortnox 24 692 974 25.3 18.3 13.4 72 48 33 40% 36% 34% 35% 38% 41%LeadDesk 1 209 266 4.5 3.7 3.0 118 59 30 88% 23% 22% 4% 6% 10%Lime 4 881 398 12.3 10.5 8.7 50 40 34 18% 15% 18% 25% 26% 26%Litium 291 62 4.7 3.8 2.8 neg 100 12 28% 29% 31% -19% 4% 23%Mercell 5 218 691 7.6 6.0 4.8 48 24 16 118% 21% 20% 16% 25% 31%Pexip 9 377 898 10.4 7.8 5.7 neg neg neg 30% 40% 38% -34% -29% -5%Safeture 230 36 6.4 4.3 3.0 neg neg 225 67% 44% 44% -72% -31% 1%Upsales 1 391 104 13.3 10.0 7.4 91 53 40 38% 32% 32% 15% 19% 19%Vertiseit 215 90 2.4 2.0 1.7 24 16 11 18% 14% 14% 10% 13% 15%Vitec 13 685 1531 8.9 8.1 7.4 53 43 36 17% 9% 9% 17% 19% 21%XMReality 225 37 6.1 4.1 2.3 neg neg 11 79% 51% 79% -36% -6% 20%ZetaDisplay 691 502 1.4 1.1 1.1 15 10 8 37% 14% 8% 9% 11% 13%Zutec 178 35 5.1 4.1 n/a neg neg n/a 31% 29% n/a -23% -13% n/aAverage 4 462 548 11.9 8.4 6.4 58 162 41 50% 32% 27% -23% -2% 12%Median 2 038 251 7.7 6.1 4.8 51 45 30 30% 27% 23% 9% 11% 15%Source: Redeye, Company reports, Eikon
EV/SALES EV/EBIT (x) Sales growth EBIT margin
The peer table above shows the estimated multiples, growth, and EBIT margins for a large portion of the Nordic SaaS businesses. Some companies are not included in the “Rule of 40” and the “EV/S vs. Sales Growth + EBIT margin” as they are outliers.
Source: Redeye Research, Company reports, Eikon

19REDEYE - SAAS REPORT 2021

REDEYE - SAAS REPORT 2021
20
SaaS Companies and Economic Downturns
21REDEYE - SAAS REPORT 2021
SAAS COMPANIES AND ECONOMIC DOWNTURNS
Robert Smith, CEO and founder of Vista Equity Partners, famously said: “Software contracts are better than first-lien debt.” In the coming months, this claim will certainly be put to the test. We assume that software contracts will at best be comparable to first-lien debt and should by no means be im-mune to economic downturns, due to the following reasons:
• Software payment terms will change significantly as fewer customers will pay cash upfront and payment terms should lengthen, impacting working capital. Accompanied by growth slowdown, it will have a big impact on SaaS companies.
• Bankruptcies among SMBs are already a fact and the number is likely to increase, and this group will not be paying their software bills. Also, businesses that are effectively shut down (i.e., retailers, hotels, airlines, etc.) will probably not be paying their software bills on time.
• To help customers and to reduce churn, discounting will probably go up.
• More broadly, software contracts will be adjusted to reflect lower utilization rates and fewer seats.
• Usage-based models billed in arrears were gaining ground at the expense of multi-year subscription models billed upfront. The current recession will accelerate this transition, which will impact working capital and cash flow.
As of this writing, we are hopefully past the worst of the corona crisis. While the virus continues to spread the stock markets and particularly SaaS-shares have recovered sharply. In our Redeye Nordic SaaS report (April 2020), we discussed SaaS and economic downturns, looking mainly at the outcome wof the financial crisis in 2008. This time, we examine how the Corona crisis has affected the listed Nordic SaaS businesses so far.
The overall impact (or cyclicality) will be a multivariate output of different variables, we highlight some of them below:
• Customer size: large companies (i.e., customers) will be much more resilient than SMBs.
• Industry mix: i.e., travel-related companies are going to be under much more pressure than companies benefiting from working from home such as SVOD, gaming, etc.
• Go to market: a company that has a true enterprise sales motion is going to be challenged, while those that have freemium or e-commerce-like distribution models are going to be advantaged. Net revenue retention has always been one of the important software metrics — but it will be even more critical over the next months.
• ROI: This will differ by customer, by industry and by where each software company sits in the “stack” for each customer and industry. We will find out which software companies actually are “systems of record” without which companies cannot function.
Pricing model: It is hard to frame the impact by pricing mod-el but it will ultimately come down to utilization. Seat based, transactional and workload based pricing models should be more cyclical — one way or another.

22REDEYE - SAAS REPORT 2021
SAAS COMPANIES AND ECONOMIC DOWNTURNS
ARR Through the Corona Crisis
Relative to Q4 2019, where the Coronavirus was not an issue, the listed Nordic SaaS businesses have, on average, con-tinued to grow their annual recurring revenue (ARR) during 2020. The median ARR growth during 2020 was 16% which is in line with the median growth in 2019 of ~17%. Thus, there has not been any notable impact from the Corona crisis on the ARR for the median Nordic SaaS businesses.
While there are a few outliers, 12 out of 15 businesses grew their ARR during 2020. Two of the outliers, Agillic and ZetaDisplay, suffered from their exposure to retail and travel & leisure, resulting in falling ARRs during the first half of 2020. However, most of the declines were related to transac-tional revenue due to frozen subscriptions, as some of their customers had to shut down their businesses temporarily. Interestingly, all three outliers increased their ARR during Q4, indicating a rebound in demand for SaaS in sectors negative-ly affected by the Corona crisis.
The third negative outlier is Addnode, where PLM’s exposure to the automotive industry resulted in lowered demand. The lower volumes result from customers reducing their num-ber of active licenses and not a consequence of customer
churn. Note that regarding Addnode, we exclude the recurring revenue from Design Management in our ARR calculation. As Design Management recognizes its revenue upfront, we cannot estimate an ARR based on reported revenue.
Admicom stands out on the positive side, and we see two reasons behind its outperformance. First, during Q1 2020, Admicom acquired Tocoman Oy, adding about 20% in sales. Second, Admicom reports its share of recurring revenue – which we have based the ARR on – as yearly averages. Thus, we likely overestimate the ARR in quarters with above-aver-age non-recurring revenue – like Q2, for example – and vice versa. Also, Carasent saw a very solid development during Q4, which was boosted by the acquisition of Avans Soma.
Our conclusion is that most Nordic SaaS businesses have not seen any significant negative impact from the Corona crisis so far. However, some businesses with substantial exposure to the most affected sectors like retail and travel & leisure have seen a decline in their recurring revenues. Thus, in most cases, recurring revenues have remained recurring during this crisis.
60
70
80
90
100
110
120
130
140
150
Q1 Q2 Q3 Q4 Q1 Q2 Q3 Q4
2019 2020
ARR
Q4 2
019
= In
dex
100
ARR Growth 2019 - 2020
24SevenOffice Admicom Agillic Briox Formpipe Fortnox
Lime Litium Qbank Upsales Vertiseit Vitec
ZetaDisplay Median Carasent Addnode
23REDEYE - SAAS REPORT 2021
SAAS METRICS
REDEYE Equity Research Redeye SaaS report 2020 14 April 2020
13
MMeettrriicc DDeeffiinniittiioonn CCaallccuullaattiioonn
MMRRRR = Number of customers * (ARPU / Month)IImmpplliieedd AARRRR = Actual MRR * 12
CCuussttoommeerr AAccqquuiissiittiioonn CCoosstt ((CCAACC)) All S&M costs for new customers. S&M / Number of new customers
CCuussttoommeerr LLiiffeettiimmee VVaalluuee ((CCLLTTVV))
CLTV is the net present value of the recurring profit streams of a given customer less the acquisition cost. (ARPU * Gross margin) / Churn
CCuussttoommeerr AAccqquuiissiittiioonn CCoosstt PPaayybbaacckk PPeerriioodd
The CAC payback period is a statement in months, of the time to fully payback sales and marketing investment.
Total S&M costs last quarter / (New MRR added last quarter * Gross margin)
CCuussttoommeerr GGrroossss//LLooggoo CChhuurrnn
This is a percentage calculation of all customer names (“logos”) that have churned over the measured time period.
Customers lost over time period / Customers at the beginning of time period
GGrroossss DDoollllaarr RReetteennttiioonn:: Looks at how much of the customer ARR are kept over the measured time period. As such it’s always below 100%. ARR – downgrades – churn / Beginning ARR
NNeett DDoollllaarr RReetteennttiioonn:: As above, but including upgrades. As such it’s can be higher than 100% (and should be for a healthy business). (ARR + upgrades – downgrades – churn) / Beginning ARR
Source: Redeye Research
RReetteennttiioonn
MMRRRR && IImmpplliieedd AARRRR Measurment of monthly/annual recurring revenue.
KKeeyy SSaaaaSS MMeettrriiccss
SSMMBB MMiiddmmaarrkkeett EEnntteerrpprriissee
AARRRR ggrroowwtthh 4400--5500%%++ 5500--6600%%++ 3300--5500%%++
GGrroossss RReetteennttiioonn 7700--8800%% 8800--9900%% 9900%%++
NNeett RReetteennttiioonn 8800--110000%% 9900--112200%% 111100%%++
LLTTVV//CCAACC 33--55xx 44--66xx 44--66xx
CCAACC PPaayybbaacckk PPeerriioodd 33--66 MMooss 1122 MMooss 1188--2244 MMooss
GGrroossss MMaarrggiinn
Source: Redeye Research
5500--7755%%++
SSaaaaSS MMeettrriiccss ffoorr ddiiffffeerreenntt ccuussttoommeerr sseeggmmeennttss
BBeesssseemmeerr VVeennttuurree PPaarrttnneerrss EEffffiicciieennccyy SSccoorree ((<< $$3300 mmiilllliioonn AARRRR))
Source: Bessemer Venture Partners
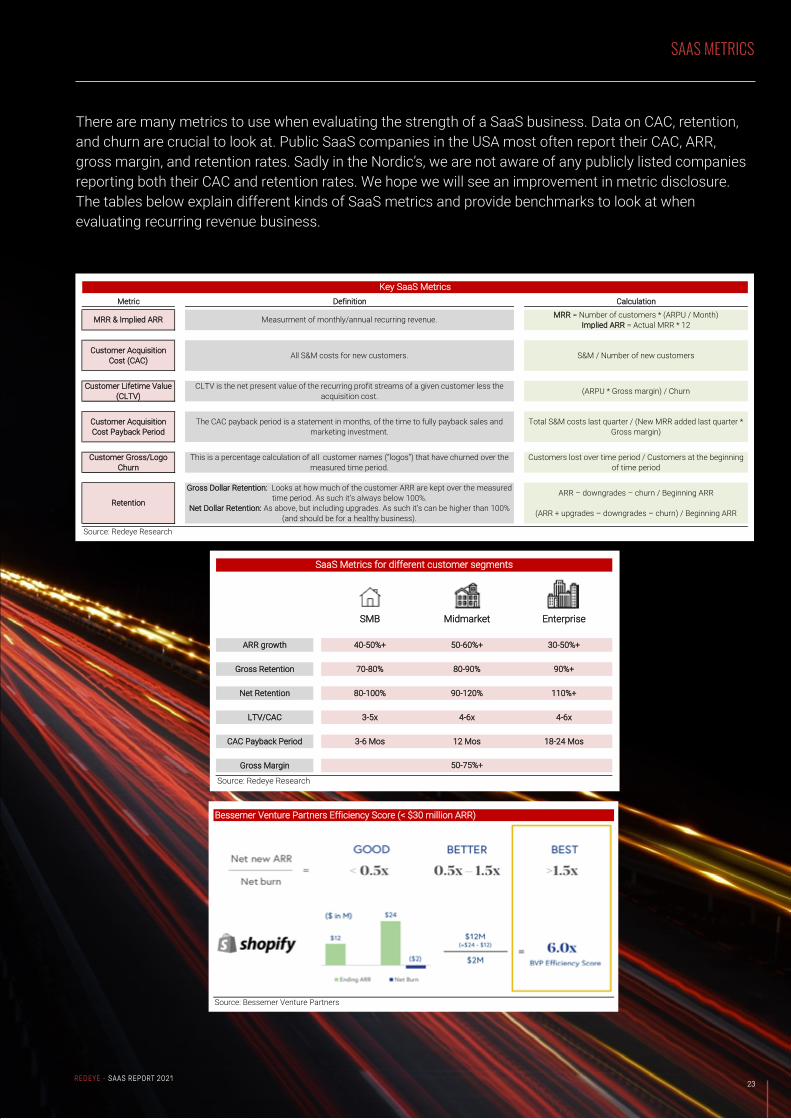
SaaS Metrics There are many metrics to use when evaluating the strength of a SaaS business. Data on CAC, retention, and churn are crucial to look at. Public SaaS companies in the USA most often report their CAC, ARR, gross margin, and retention rates. Sadly in the Nordic’s only one, Agillic (AGILIC:CHP) of the publicly listed companies report both their CAC and retention rates. We hope we will see an improvement in metric disclosure. In the tables below we explain different kinds of SaaS metrics and provide benchmarks to look at when evaluating recurring revenue business.
REDEYE Equity Research Redeye SaaS report 2020 14 April 2020
13
MMeettrriicc DDeeffiinniittiioonn CCaallccuullaattiioonn
MMRRRR = Number of customers * (ARPU / Month)IImmpplliieedd AARRRR = Actual MRR * 12
CCuussttoommeerr AAccqquuiissiittiioonn CCoosstt ((CCAACC)) All S&M costs for new customers. S&M / Number of new customers
CCuussttoommeerr LLiiffeettiimmee VVaalluuee ((CCLLTTVV))
CLTV is the net present value of the recurring profit streams of a given customer less the acquisition cost. (ARPU * Gross margin) / Churn
CCuussttoommeerr AAccqquuiissiittiioonn CCoosstt PPaayybbaacckk PPeerriioodd
The CAC payback period is a statement in months, of the time to fully payback sales and marketing investment.
Total S&M costs last quarter / (New MRR added last quarter * Gross margin)
CCuussttoommeerr GGrroossss//LLooggoo CChhuurrnn
This is a percentage calculation of all customer names (“logos”) that have churned over the measured time period.
Customers lost over time period / Customers at the beginning of time period
GGrroossss DDoollllaarr RReetteennttiioonn:: Looks at how much of the customer ARR are kept over the measured time period. As such it’s always below 100%. ARR – downgrades – churn / Beginning ARR
NNeett DDoollllaarr RReetteennttiioonn:: As above, but including upgrades. As such it’s can be higher than 100% (and should be for a healthy business). (ARR + upgrades – downgrades – churn) / Beginning ARR
Source: Redeye Research
RReetteennttiioonn
MMRRRR && IImmpplliieedd AARRRR Measurment of monthly/annual recurring revenue.
KKeeyy SSaaaaSS MMeettrriiccss
SSMMBB MMiiddmmaarrkkeett EEnntteerrpprriissee
AARRRR ggrroowwtthh 4400--5500%%++ 5500--6600%%++ 3300--5500%%++
GGrroossss RReetteennttiioonn 7700--8800%% 8800--9900%% 9900%%++
NNeett RReetteennttiioonn 8800--110000%% 9900--112200%% 111100%%++
LLTTVV//CCAACC 33--55xx 44--66xx 44--66xx
CCAACC PPaayybbaacckk PPeerriioodd 33--66 MMooss 1122 MMooss 1188--2244 MMooss
GGrroossss MMaarrggiinn
Source: Redeye Research
5500--7755%%++
SSaaaaSS MMeettrriiccss ffoorr ddiiffffeerreenntt ccuussttoommeerr sseeggmmeennttss
BBeesssseemmeerr VVeennttuurree PPaarrttnneerrss EEffffiicciieennccyy SSccoorree ((<< $$3300 mmiilllliioonn AARRRR))
Source: Bessemer Venture Partners
SaaS Metrics There are many metrics to use when evaluating the strength of a SaaS business. Data on CAC, retention, and churn are crucial to look at. Public SaaS companies in the USA most often report their CAC, ARR, gross margin, and retention rates. Sadly in the Nordic’s only one, Agillic (AGILIC:CHP) of the publicly listed companies report both their CAC and retention rates. We hope we will see an improvement in metric disclosure. In the tables below we explain different kinds of SaaS metrics and provide benchmarks to look at when evaluating recurring revenue business.
There are many metrics to use when evaluating the strength of a SaaS business. Data on CAC, retention, and churn are crucial to look at. Public SaaS companies in the USA most often report their CAC, ARR, gross margin, and retention rates. Sadly in the Nordic’s, we are not aware of any publicly listed companies reporting both their CAC and retention rates. We hope we will see an improvement in metric disclosure. The tables below explain different kinds of SaaS metrics and provide benchmarks to look at when evaluating recurring revenue business.
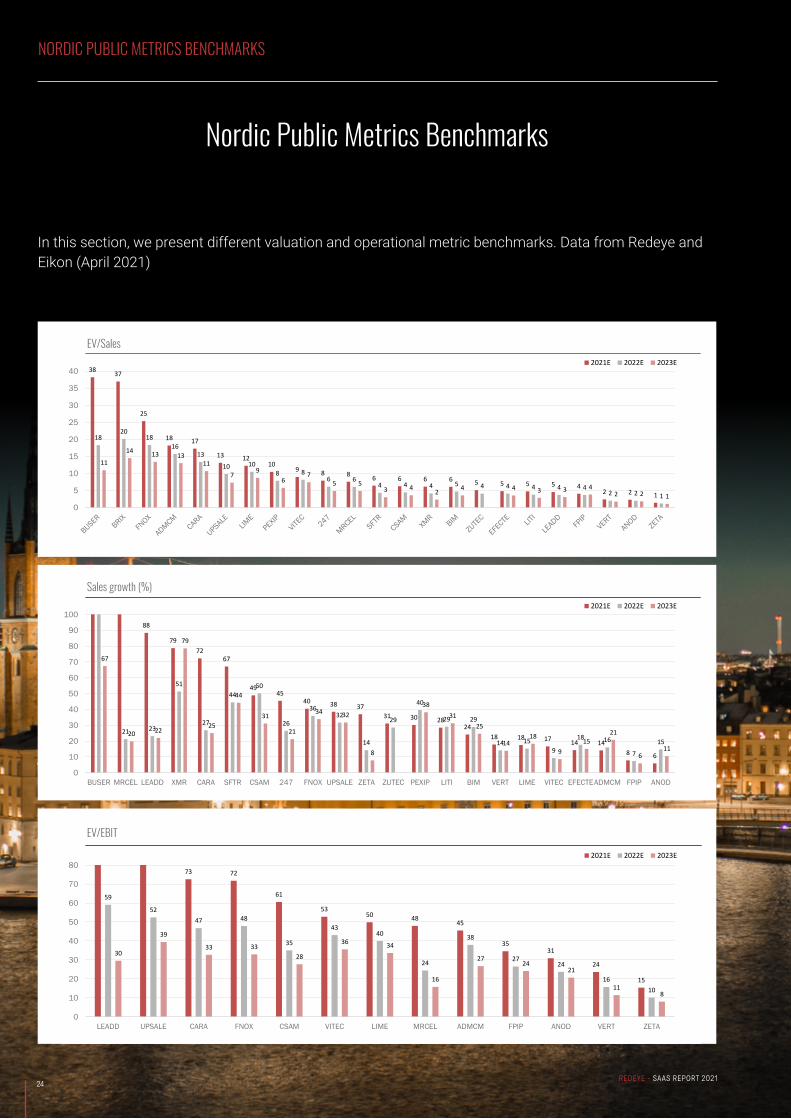
In this section, we present different valuation and operational metric benchmarks. Data from Redeye and Eikon (April 2021)
Nordic Public Metrics Benchmarks
24REDEYE - SAAS REPORT 2021
NORDIC PUBLIC METRICS BENCHMARKS
38 37
25
18 17
13 1210
9 8 8 6 6 6 6 5 5 5 5 42 2 1
1820
1816
13
10 108 8
6 64 4 4 5 4 4 4 4 4
2 2 1
11
14 13 1311
7 96
75 5
3 4 2 4 4 3 3 42 2 1
0
5
10
15
20
25
30
35
40
EV/Sales2021E 2022E 2023E
88
7972
67
4945
40 38 3731 30 28
2418 18 17 14 14
8 6
21 23
51
27
4450
26
3632
14
29
40
29 29
14 159
18 16
715
67
20 22
79
25
44
31
21
34 32
8
3831
25
1418
915
21
611
0
10
20
30
40
50
60
70
80
90
100
BUSER MRCEL LEADD XMR CARA SFTR CSAM 247 FNOX UPSALE ZETA ZUTEC PEXIP LITI BIM VERT LIME VITEC EFECTEADMCM FPIP ANOD
Sales growth (%)2021E 2022E 2023E
73 72
61
5350 48 45
3531
24
15
59
5247 48
35
4340
24
38
2724
1610
30
39
33 3328
36 34
16
2724
21
118
0
10
20
30
40
50
60
70
80
LEADD UPSALE CARA FNOX CSAM VITEC LIME MRCEL ADMCM FPIP ANOD VERT ZETA
EV/EBIT2021E 2022E 2023E
25REDEYE - SAAS REPORT 2021
NORDIC PUBLIC METRICS BENCHMARKS
40
35
25 24
17 16 1512 10 10 9 7
4
4138
2629
19
25
19
14 13 13 118
6 59
4
49
41
26
33
21
31
1916
1315 13
9 10 97
2623
0
5
10
15
20
25
30
35
40
45
50
ADMCM FNOX LIME CARA VITEC MRCEL UPSALE FPIP CSAM VERT ZETA ANOD LEADD EFECTE 247 BIM LITI
EBIT margin (%)2021E 2022E 2023E
133
108
96 92
76
5954 53
46 44 42 4234
2819
14 13 9 8 8
46 42
55
29
74
6357
51
26 27
45 41
28 2721 23 23
33
15
38
11 14
51 5358
32
75
44
69
50
2128
99
44
29 2922 24
19
54 51
33
46
0102030405060708090100110120130140
MRCEL BUSER CARA LEADD FNOX CSAM ADMCMUPSALE ZETA 247 XMR LIME VITEC VERT FPIP EFECTE ANOD LITI ZUTEC BIM PEXIP SFTR
G+P Ratio (%)2021E 2022E 2023E
123
9079 76
66
5347 44
37 36 3323 23 21 20 19 16 14 13 9 6
25 24
4635
56 56
2637
16
3829 27
20 24
11 1625
1823
816
26 23
4035
55
36
21
39
9
74
3035
2532
1016
2716
7 11
0102030405060708090100110120130
MRCEL LEADD BUSER CARA FNOX CSAM 247 UPSALE ZETA XMR PEXIP ADMCM LIME LITI VITEC VERT BIM EFECTE ZUTEC FPIP ANOD
Growth Efficiency (%) 2021E 2022E 2023E
713
561 553
206160
123 100 99 8659 51 33 29 24 18 5
0
200
400
600
800
PEXIP MRCEL FNOX LIME ZETA LEADD BIM EFECTE UPSALE FPIP LITI VERT BUSER SFTR XMR BRIX
ARR Q4 2020 (SEKm)
Sales growth + EBIT margin
Absolute OPEX divided by absolute net sales growth

Covered Companies
26REDEYE - SAAS REPORT 2021
Addnode Group 28
Artificial Solutions 30
BIMobject 32
Carasent 34
Formpipe Software 36
Fortnox 38
Speqta 40
Vertaseit 42
XMReality 44
ZetaDisplay 46
27REDEYE - SAAS REPORT 2021
COVERED COMPANIES
28REDEYE - SAAS REPORT 2021
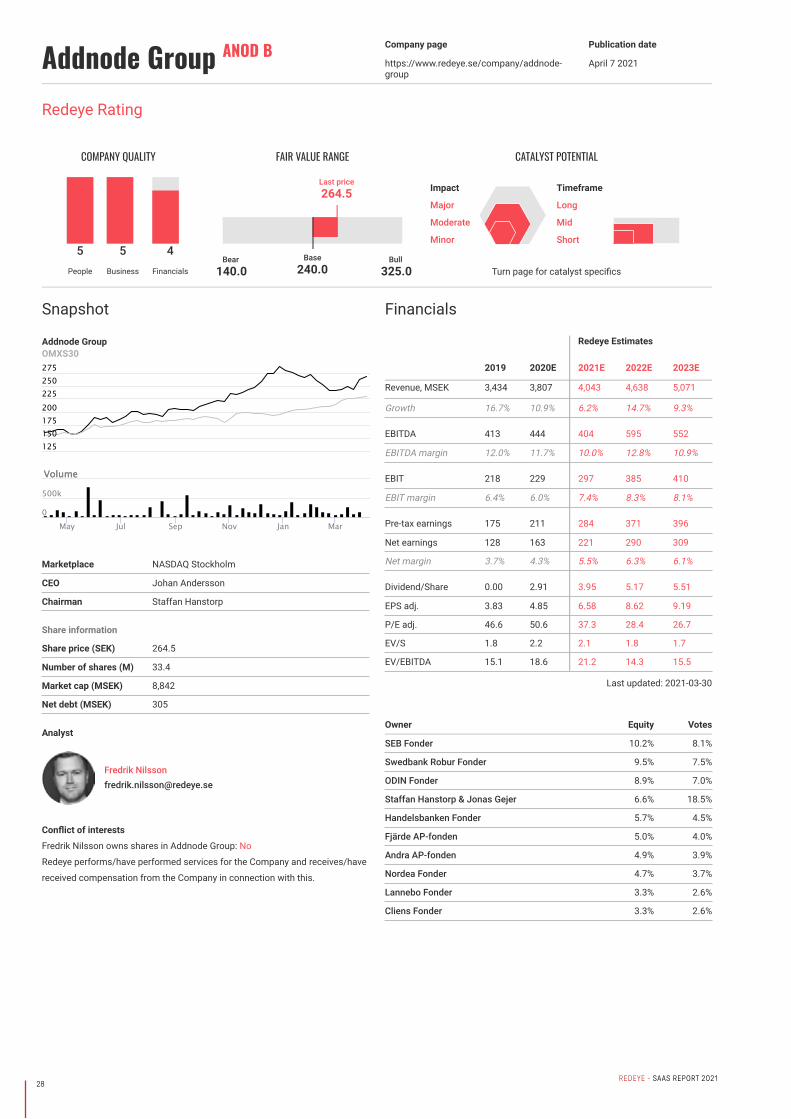
Addnode Group ANOD B Company page
https://www.redeye.se/company/addnode-group
Publication date
April 7 2021
Analyst
Fredrik [email protected]
Conflict of interests
Fredrik Nilsson owns shares in Addnode Group: No
Redeye performs/have performed services for the Company and receives/have
received compensation from the Company in connection with this.
Snapshot
Addnode GroupOMXS30
Marketplace NASDAQ Stockholm
CEO Johan Andersson
Chairman Staffan Hanstorp
Share information
Share price (SEK) 264.5
Number of shares (M) 33.4
Market cap (MSEK) 8,842
Net debt (MSEK) 305
Financials
Redeye Estimates
2019 2020E 2021E 2022E 2023E
Revenue, MSEK 3,434 3,807 4,043 4,638 5,071
Growth 16.7% 10.9% 6.2% 14.7% 9.3%
EBITDA 413 444 404 595 552
EBITDA margin 12.0% 11.7% 10.0% 12.8% 10.9%
EBIT 218 229 297 385 410
EBIT margin 6.4% 6.0% 7.4% 8.3% 8.1%
Pre-tax earnings 175 211 284 371 396
Net earnings 128 163 221 290 309
Net margin 3.7% 4.3% 5.5% 6.3% 6.1%
Dividend/Share 0.00 2.91 3.95 5.17 5.51
EPS adj. 3.83 4.85 6.58 8.62 9.19
P/E adj. 46.6 50.6 37.3 28.4 26.7
EV/S 1.8 2.2 2.1 1.8 1.7
EV/EBITDA 15.1 18.6 21.2 14.3 15.5
Last updated: 2021-03-30
Owner Equity Votes
SEB Fonder 10.2% 8.1%
Swedbank Robur Fonder 9.5% 7.5%
ODIN Fonder 8.9% 7.0%
Staffan Hanstorp & Jonas Gejer 6.6% 18.5%
Handelsbanken Fonder 5.7% 4.5%
Fjärde AP-fonden 5.0% 4.0%
Andra AP-fonden 4.9% 3.9%
Nordea Fonder 4.7% 3.7%
Lannebo Fonder 3.3% 2.6%
Cliens Fonder 3.3% 2.6%
Redeye Rating
COMPANY QUALITY
5People
5Business
4Financials
FAIR VALUE RANGE
Base240.0
Bear140.0
Bull325.0
Last price264.5
Turn page for catalyst specifics
CATALYST POTENTIAL
Impact
Major
Moderate
Minor
Timeframe
Long
Mid
Short
VolumeVolume
May Jul Sep Nov Jan Mar
125150175200225250275
0
500k

29REDEYE - SAAS REPORT 2021
Company descriptionAddnode Group was established in 2003 and is listed on Nasdaq OMX
Stockholm. In 2019 Addnode had a turnover of SEK 3.4 billion, with an EBITA
of SEK 327million. Addnode Group is divided into three divisions: Design
Management, Product Lifecycle Management, Process Managemen. The
business segments operate in different regions with about 25 different brands.
Operating margin varies considerably between the various business areas
where the most profitable can perform up to 20 percent. Addnode Group uses
a very decentralized management model where the individual subsidiaries are
run by management teams to maintain an entrepreneurial spirit. A key growth
strategy in Addnode Group is to grow through acquisitions, which they
managed to do successfully in recent years. The company's own financial
goals is to reach a growth of 10% per year (both organically and through
acquisitions), an EBITA margin of 10% and at least 50% of profit after tax
will be distributed to shareholders.
Investment case• Has evolved into becoming a software company
• Interesting acquisition history
• Well-diversified in three different divisions
Investment case
Has evolved into becoming a software company. Today, only about 30% of
Addnode’s sales are related to services, and most of these services are related
to the implementation of the company’s software solutions. Moreover, the
company has a strong focus on recurring revenues, and today more than 50%
of sales are recurring revenues. These qualities make us believe the company
should be valued at a premium compared to the IT-consultants. More precisely,
we claim Addnode should be valued in line with comparable software
companies.
Interesting acquisition history. Addnode has for a long been one of ourfavorites in its sector. The company has a successful acquisition history, which
driven by its focus on fair price, good people, and management in place. As a
result of the completed acquisitions, Addnode has increased its debt. However,
we claim that the leverage is healthy and that the acquisitions have been value-
creating. Since 2013, Addnode has acquired about 30 businesses, adding a
total of over SEK 2 000m in sales. Historically, the company has acquired at
6x EBITA, way below Addnode’s valuation. We believe the prospects for
additional value-adding acquisitions is good, however, it is partly already
priced in according to us.
Well-diversified in three different divisions. To sum up, Addnode is well
diversified in three different divisions with interesting niches. Further, the
company has taken a leading Nordic position in most of its niches, which
also is the ambition for all of its business areas.
Counter-Thesis – Bear points
Dependent on the economy and the willingness to invest
In recent years, Addnode has had a favorable demand from manufacturing
industries, as well as the construction and property sector. During the last
quarters, some smaller and specialized companies in the real estate industry
appear to have problems. However, Addnode’s direct exposure to housing
developers is low, and it should therefore not be concluded that Addnode
will face lower demand in the coming quarters. Even so, we will follow the
development of the Design Management business area as well as the
underlying industry.
Acquisition-led growth always risky
Organic growth can be slow, international expansion is complex andacquisitions tend to be difficult. Despite Addnode’s successful acquisition
history, acquiring companies takes time and poses a risk. Nevertheless,
wehave confidence in the management team.
Catalyst types
AcquisitionsThe company has a successful acquisition history, which driven by its focus
on fair price, good people, and management in place. Since 2013, Addnode
has acquired about 30 businesses, adding a total of over SEK 2 000m in sales.
Historically, the company has acquired at 6x EBITA, way below Addnode’s
valuation. We believe the prospects for additional value-adding acquisitions
is good, however, it is partly already priced in according to us.
International expansionContinued international expansion. Addnode acquired their first company
in GB, in 2014 and Germany during 2015. The announcement of additional
acquisitions in GB, Germany or other markets may potentially increase general
market exposure and growth opportunities.
Economic downturn
While we believe Addnode diversification in terms of markets and regions as
well as the digitalization help making the company rather resilient to economic
downturns, software revenue is generally related to the number of users. Thus,
layoff of engineers likely has a negative effect on Addnode’s revenue and profit.
COVERED COMPANIES
30REDEYE - SAAS REPORT 2021
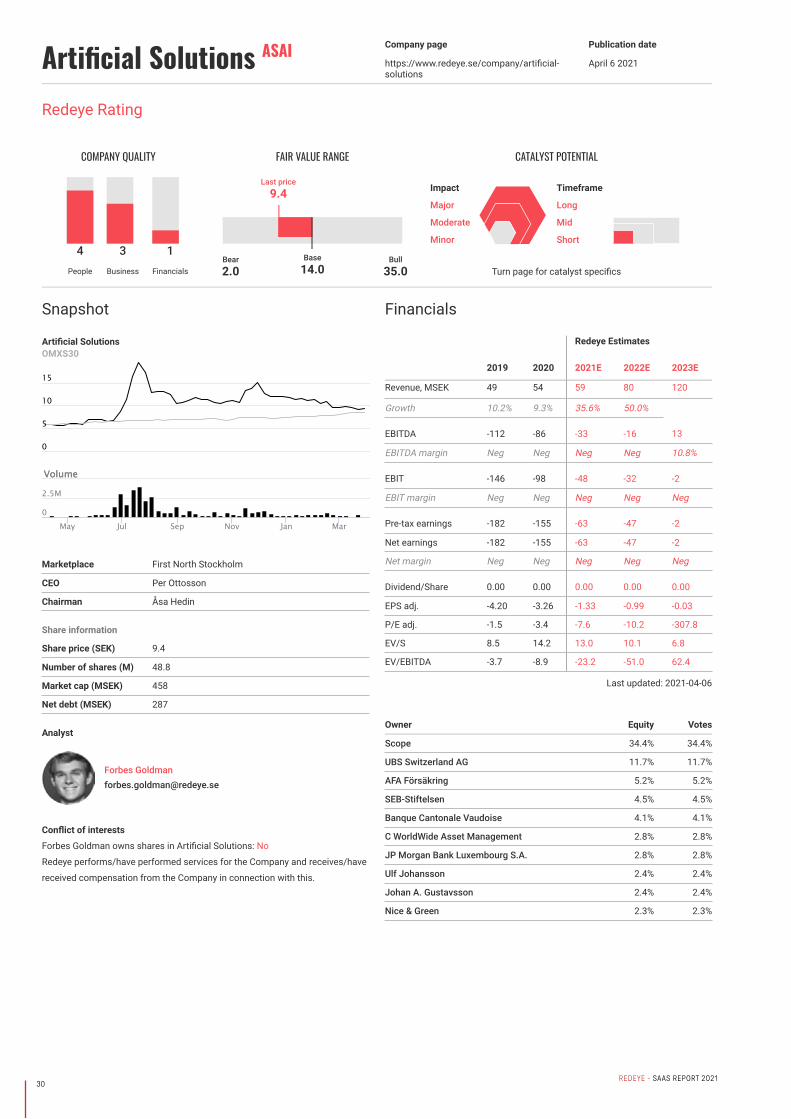
Artificial Solutions ASAI Company page
https://www.redeye.se/company/artificial-solutions
Publication date
April 6 2021
Analyst
Forbes [email protected]
Conflict of interests
Forbes Goldman owns shares in Artificial Solutions: No
Redeye performs/have performed services for the Company and receives/have
received compensation from the Company in connection with this.
Snapshot
Artificial SolutionsOMXS30
Marketplace First North Stockholm
CEO Per Ottosson
Chairman Åsa Hedin
Share information
Share price (SEK) 9.4
Number of shares (M) 48.8
Market cap (MSEK) 458
Net debt (MSEK) 287
Financials
Redeye Estimates
2019 2020 2021E 2022E 2023E
Revenue, MSEK 49 54 59 80 120
Growth 10.2% 9.3% 35.6% 50.0%
EBITDA -112 -86 -33 -16 13
EBITDA margin Neg Neg Neg Neg 10.8%
EBIT -146 -98 -48 -32 -2
EBIT margin Neg Neg Neg Neg Neg
Pre-tax earnings -182 -155 -63 -47 -2
Net earnings -182 -155 -63 -47 -2
Net margin Neg Neg Neg Neg Neg
Dividend/Share 0.00 0.00 0.00 0.00 0.00
EPS adj. -4.20 -3.26 -1.33 -0.99 -0.03
P/E adj. -1.5 -3.4 -7.6 -10.2 -307.8
EV/S 8.5 14.2 13.0 10.1 6.8
EV/EBITDA -3.7 -8.9 -23.2 -51.0 62.4
Last updated: 2021-04-06
Owner Equity Votes
Scope 34.4% 34.4%
UBS Switzerland AG 11.7% 11.7%
AFA Försäkring 5.2% 5.2%
SEB-Stiftelsen 4.5% 4.5%
Banque Cantonale Vaudoise 4.1% 4.1%
C WorldWide Asset Management 2.8% 2.8%
JP Morgan Bank Luxembourg S.A. 2.8% 2.8%
Ulf Johansson 2.4% 2.4%
Johan A. Gustavsson 2.4% 2.4%
Nice & Green 2.3% 2.3%
Redeye Rating
COMPANY QUALITY
4People
3Business
1Financials
FAIR VALUE RANGE
Base14.0
Bear2.0
Bull35.0
Last price9.4
Turn page for catalyst specifics
CATALYST POTENTIAL
Impact
Major
Moderate
Minor
Timeframe
Long
Mid
Short
VolumeVolume
May Jul Sep Nov Jan Mar
10
0
5
15
0
2.5M
31REDEYE - SAAS REPORT 2021
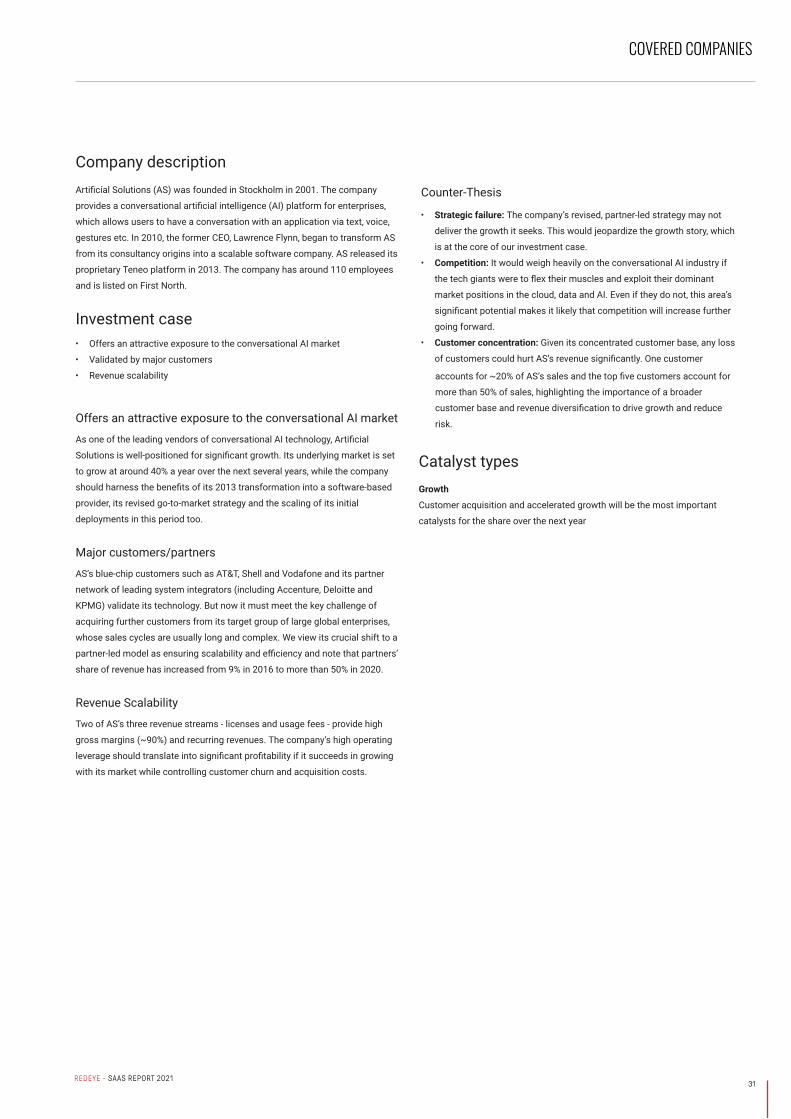
Company descriptionArtificial Solutions (AS) was founded in Stockholm in 2001. The company
provides a conversational artificial intelligence (AI) platform for enterprises,
which allows users to have a conversation with an application via text, voice,
gestures etc. In 2010, the former CEO, Lawrence Flynn, began to transform AS
from its consultancy origins into a scalable software company. AS released its
proprietary Teneo platform in 2013. The company has around 110 employees
and is listed on First North.
Investment case• Offers an attractive exposure to the conversational AI market
• Validated by major customers
• Revenue scalability
Offers an attractive exposure to the conversational AI market
As one of the leading vendors of conversational AI technology, Artificial
Solutions is well-positioned for significant growth. Its underlying market is set
to grow at around 40% a year over the next several years, while the company
should harness the benefits of its 2013 transformation into a software-based
provider, its revised go-to-market strategy and the scaling of its initial
deployments in this period too.
Major customers/partners
AS’s blue-chip customers such as AT&T, Shell and Vodafone and its partner
network of leading system integrators (including Accenture, Deloitte and
KPMG) validate its technology. But now it must meet the key challenge of
acquiring further customers from its target group of large global enterprises,
whose sales cycles are usually long and complex. We view its crucial shift to a
partner-led model as ensuring scalability and efficiency and note that partners’
share of revenue has increased from 9% in 2016 to more than 50% in 2020.
Revenue Scalability
Two of AS’s three revenue streams - licenses and usage fees - provide high
gross margins (~90%) and recurring revenues. The company’s high operating
leverage should translate into significant profitability if it succeeds in growing
with its market while controlling customer churn and acquisition costs.
Counter-Thesis
• Strategic failure: The company’s revised, partner-led strategy may not
deliver the growth it seeks. This would jeopardize the growth story, which
is at the core of our investment case.
• Competition: It would weigh heavily on the conversational AI industry if
the tech giants were to flex their muscles and exploit their dominant
market positions in the cloud, data and AI. Even if they do not, this area’s
significant potential makes it likely that competition will increase further
going forward.
• Customer concentration: Given its concentrated customer base, any loss
of customers could hurt AS’s revenue significantly. One customer
accounts for ~20% of AS’s sales and the top five customers account for
more than 50% of sales, highlighting the importance of a broader
customer base and revenue diversification to drive growth and reduce
risk.
Catalyst typesGrowth
Customer acquisition and accelerated growth will be the most important
catalysts for the share over the next year
COVERED COMPANIES
32REDEYE - SAAS REPORT 2021
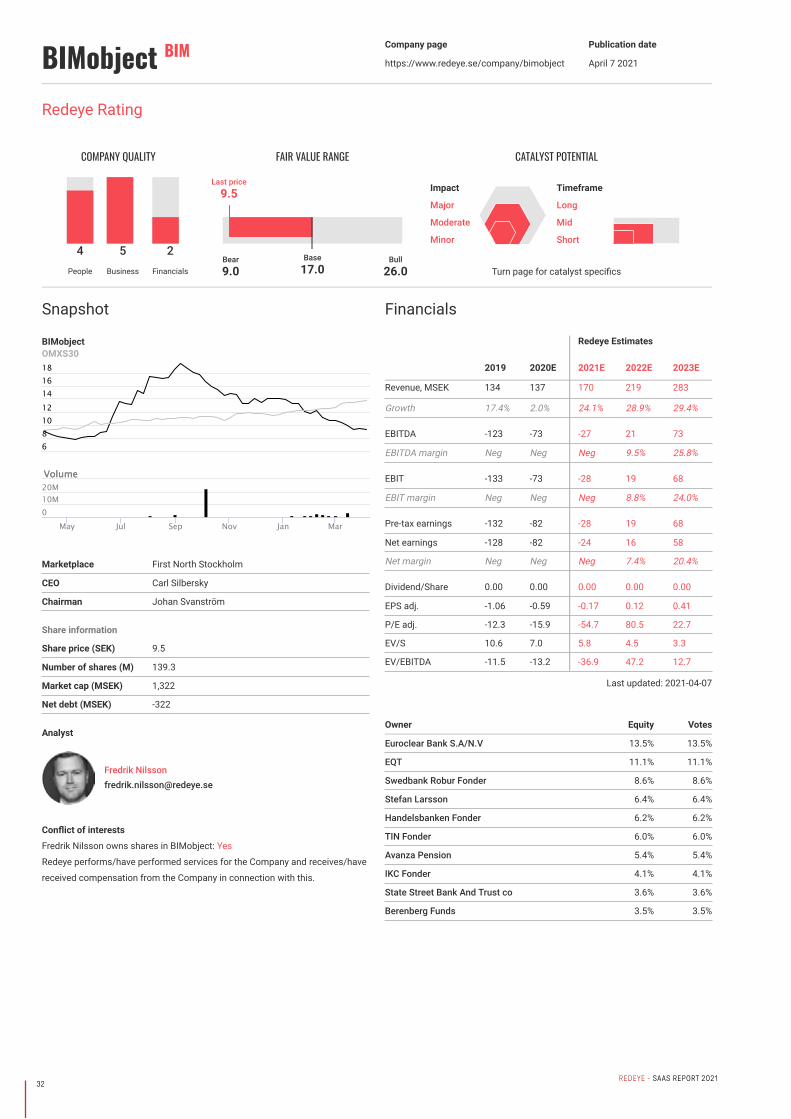
BIMobject BIM Company page
https://www.redeye.se/company/bimobject
Publication date
April 7 2021
Analyst
Fredrik [email protected]
Conflict of interests
Fredrik Nilsson owns shares in BIMobject: Yes
Redeye performs/have performed services for the Company and receives/have
received compensation from the Company in connection with this.
Snapshot
BIMobjectOMXS30
Marketplace First North Stockholm
CEO Carl Silbersky
Chairman Johan Svanström
Share information
Share price (SEK) 9.5
Number of shares (M) 139.3
Market cap (MSEK) 1,322
Net debt (MSEK) -322
Financials
Redeye Estimates
2019 2020E 2021E 2022E 2023E
Revenue, MSEK 134 137 170 219 283
Growth 17.4% 2.0% 24.1% 28.9% 29.4%
EBITDA -123 -73 -27 21 73
EBITDA margin Neg Neg Neg 9.5% 25.8%
EBIT -133 -73 -28 19 68
EBIT margin Neg Neg Neg 8.8% 24.0%
Pre-tax earnings -132 -82 -28 19 68
Net earnings -128 -82 -24 16 58
Net margin Neg Neg Neg 7.4% 20.4%
Dividend/Share 0.00 0.00 0.00 0.00 0.00
EPS adj. -1.06 -0.59 -0.17 0.12 0.41
P/E adj. -12.3 -15.9 -54.7 80.5 22.7
EV/S 10.6 7.0 5.8 4.5 3.3
EV/EBITDA -11.5 -13.2 -36.9 47.2 12.7
Last updated: 2021-04-07
Owner Equity Votes
Euroclear Bank S.A/N.V 13.5% 13.5%
EQT 11.1% 11.1%
Swedbank Robur Fonder 8.6% 8.6%
Stefan Larsson 6.4% 6.4%
Handelsbanken Fonder 6.2% 6.2%
TIN Fonder 6.0% 6.0%
Avanza Pension 5.4% 5.4%
IKC Fonder 4.1% 4.1%
State Street Bank And Trust co 3.6% 3.6%
Berenberg Funds 3.5% 3.5%
Redeye Rating
COMPANY QUALITY
4People
5Business
2Financials
FAIR VALUE RANGE
Base17.0
Bear9.0
Bull26.0
Last price9.5
Turn page for catalyst specifics
CATALYST POTENTIAL
Impact
Major
Moderate
Minor
Timeframe
Long
Mid
Short
VolumeVolume
May Jul Sep Nov Jan Mar
681012141618
010M20M
33REDEYE - SAAS REPORT 2021
Company descriptionBIMobject's mission is to digitalize construction for a more sustainable future.
It's a global marketplace for the construction industry that provides architects
and engineers with the information and inspiration they need to design
buildings faster, smarter and greener.
With 2000+ building product brands and 100 of the world’s top 100 architect
firms among its users, it power digital building design worldwide. In 2019, the
company had annual net sales of SEK 134 million.
Investment case• Set to capture market share
• Global potential
• Strategic shift – fueling path to black numbers
• High earnings potential
Set to capture market share
With slim margins, the construction industry is urging for increased efficiency
as it has been lagging significantly in the last decade compared to the rest of
the world. At the same time, we expect Building Information Modelling (BIM) to
be one of the main efficiency drivers in the industry going forward. In a
fragmented market with high underlying growth, we believe that BIMobject, as
the leading global BIM-library provider, is set to capture a significant market
share.
Global potential
Compared to most of the Swedish listed Software as a Service (SaaS)
companies, BIMobject has global potential and is on a good way to becoming
the global leader within its niche. The market, who yet is in the early stage,
offers solid growth prospects of >10% yearly with an estimated TAM larger
than SEK >3.2bn at this point.
Strategic shift – fueling path to black numbers
Historically, BIMobject has had an opportunistic strategic approach, not
utilizing its full potential as a software company. Its new management, which
shows a good understanding of the business and market, has put several new
strategic initiatives into place, adapting its strategy to SaaS-based metrics,
while having its own skin in the game further adds to our positive view.
The most important initiatives include;
• Restructuring of the sales team and processes to accelerate ARR growth,
decrease the CAC payback period, reducing lead times, and improve
onboarding
of new customers from 90 to 30 days
• Improving its product offer and changing its pricing to a value-based
model, which we expect will impact ARPB by around 12% for 2021, and
another 20% in 2022
• Establishing a customer success team to reduce churn and increase
customer satisfaction, reducing churn from historically high levels of
12%to <5%
• Implementing a cost reduction program, reducing yearly OPEX of
SEK 50m
High earnings potential
With i) attractive sales growth opportunities, ii) a competitive product offering
for manufacturers and iii) a scalable business model with a high degree of
recurring revenues, we argue that BIMobject is well-positioned for high
profitability in the long-term. As the global leading BIM-library provider, acting
as the market consolidator, growth will be the main focus in the next coming
years. We expect BIMobject to deliver a sales CAGR of 30% in the coming three
years, enabling breakeven already in 2021, resulting in an avg. EBIT margin of
18% for the same period, followed by an avg. EBIT of 40% in 2025-2028.
Catalyst typesContinued growth in recurring revenues
The recurring platform sales remain BIMobject's primary focus going forward.
The growth rate of ARR will be key to its path of market dominance and
profitability. Even if the indicator is lagging, we believe the metric will be critical
for the development of the stock. In the following quarterly reports, keep an eye
on the ARR but also on the net added manufacturers/brands to its client base,
which will be leading.
Profitable growth
Historically, BIMobject has been growing sales significantly but also raised its
OPEX at the same pace. The company is now at a point where increased sales
can emerge into improved profitability, and later on to black numbers. Turning
the trend around in a first step, and secondly reaching above breakeven should
increase the investor sentiment in the stock.
Value-adding M&A
BIMobject has an outspoken M&A strategy and has made several acquisitions
in the last years. Going forward, the focus will be acquisitions adding mainly to
its customer and user base in new geographic areas. While secondly,
BIMobject's will also consider acquisitions to strengthen its platform and
current product offering. We believe the company can acquire in the private
market below >5x sales, compared to BIM6object's current sales multiple
around 11x.
COVERED COMPANIES
34REDEYE - SAAS REPORT 2021
Carasent CARA Company page
https://www.redeye.se/company/carasent
Publication date
April 6 2021
Analyst
Mark Siö[email protected]
Conflict of interests
Mark Siöstedt owns shares in Carasent: Yes
Redeye performs/have performed services for the Company and receives/have
received compensation from the Company in connection with this.
Snapshot
CarasentOMXS30
Marketplace Oslo Børs
CEO Dennis Höjer
Chairman Johan Lindqvist
Share information
Share price (NOK) 42.5
Number of shares (M) 55.0
Market cap (MNOK) 2,339
Net debt (MNOK) -181
Financials
Redeye Estimates
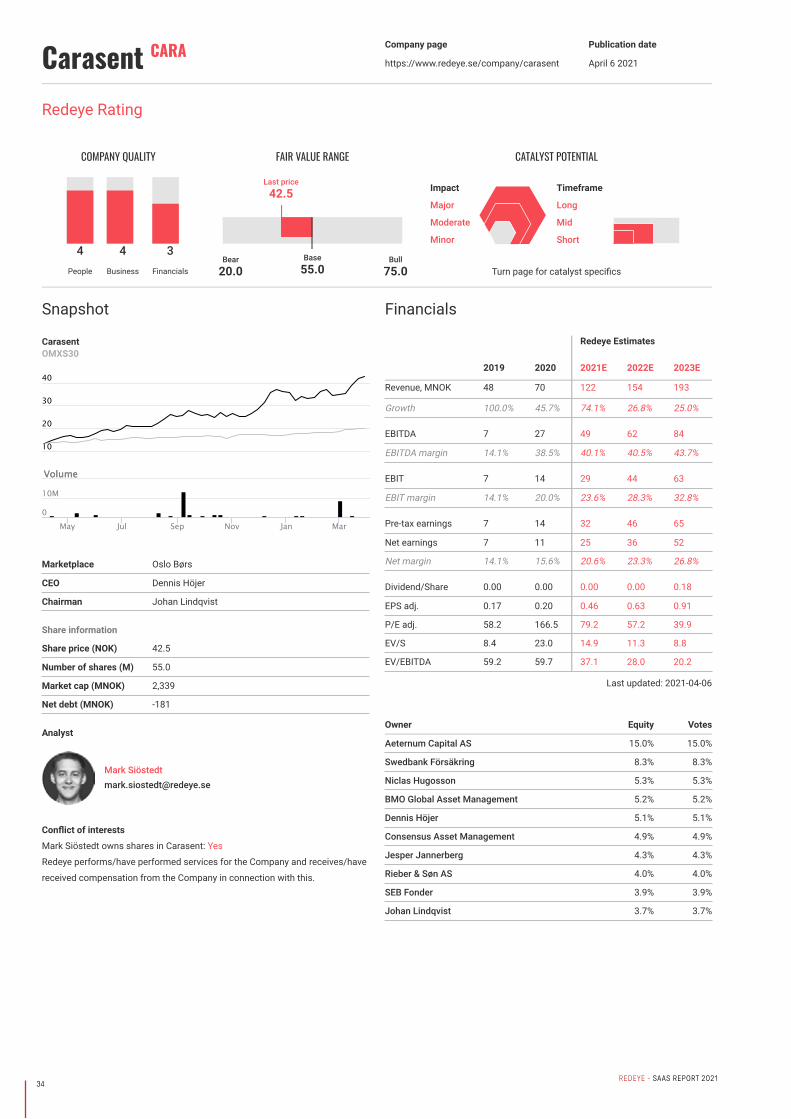
2019 2020 2021E 2022E 2023E
Revenue, MNOK 48 70 122 154 193
Growth 100.0% 45.7% 74.1% 26.8% 25.0%
EBITDA 7 27 49 62 84
EBITDA margin 14.1% 38.5% 40.1% 40.5% 43.7%
EBIT 7 14 29 44 63
EBIT margin 14.1% 20.0% 23.6% 28.3% 32.8%
Pre-tax earnings 7 14 32 46 65
Net earnings 7 11 25 36 52
Net margin 14.1% 15.6% 20.6% 23.3% 26.8%
Dividend/Share 0.00 0.00 0.00 0.00 0.18
EPS adj. 0.17 0.20 0.46 0.63 0.91
P/E adj. 58.2 166.5 79.2 57.2 39.9
EV/S 8.4 23.0 14.9 11.3 8.8
EV/EBITDA 59.2 59.7 37.1 28.0 20.2
Last updated: 2021-04-06
Owner Equity Votes
Aeternum Capital AS 15.0% 15.0%
Swedbank Försäkring 8.3% 8.3%
Niclas Hugosson 5.3% 5.3%
BMO Global Asset Management 5.2% 5.2%
Dennis Höjer 5.1% 5.1%
Consensus Asset Management 4.9% 4.9%
Jesper Jannerberg 4.3% 4.3%
Rieber & Søn AS 4.0% 4.0%
SEB Fonder 3.9% 3.9%
Johan Lindqvist 3.7% 3.7%
Redeye Rating
COMPANY QUALITY
4People
4Business
3Financials
FAIR VALUE RANGE
Base55.0
Bear20.0
Bull75.0
Last price42.5
Turn page for catalyst specifics
CATALYST POTENTIAL
Impact
Major
Moderate
Minor
Timeframe
Long
Mid
Short
VolumeVolume
May Jul Sep Nov Jan Mar
10
20
30
40
0
10M
35REDEYE - SAAS REPORT 2021
Company descriptionCarasent is a Norwegian investment management company with a special
focus on e-health solutions. The company has a single operating asset:
Evimeria EMR AB. Evimeria is a software as a service (SaaS) company selling
an electronic medical record (EMR) system and integrated services (partly from
third-party developers) to customers in the private Swedish healthcare sector.
Investment case• Evimeria has substantial headroom to grow by: i) continuing to win
market share in Sweden and becoming the dominant player, ii) launching
its Webdoc in neighboring countries, iii) moving into adjacent segments
such as dental care and veterinary services, and iv) developing more
integrated services.
• We believe investors underestimate the long growth runaway and
reinvestment opportunities, focusing too narrowly on current multiples
rather than the impact of long-term compounding.
• We argue that Carasent is a good “coffee can investment,” where time is
on the business’s side. We believe that every quarterly report, showing
stable profitable growth, will solidify Carasent’s reputation as a
qualitative investment. Compounders have time on their side.
We believe Evimeria’s Webdoc ecosystem is a cut above the competition, and
investors will be reminded of the qualitative aspects in every quarterly report.
With >90% recurring revenues, almost no customer churn, and excellent growth
prospects, Evimeria is set to compound heavily in the coming years.
Successful compounders always look expensive on current multiples. But we
do not think that investors should be too narrow when looking at Carasent.
Instead, we believe that a steady growth, accompanied by marginal expansion,
will elevate the share well above today’s levels. The management is building a
company for the long-term that can handle revenues above NOK 1bn a year.
Carasent can expand in three dimensions: geographically, segmentally, and
through new products/services. The three dimensions present great
reinvestment opportunities to attractive incremental returns on capital, allowing
Carasent (either through Evimeria or another subsidiary) to accomplish long-
term, sustainable growth. It is often an overlooked blessing to have clear
reinvestment opportunities without tampering with profitability.
Evimeria’s revenue-share model and integrated service offering are potent tools
when the customers are situated in a growing market. With a rising aging
population, increased outpatient healthcare, and a hard-pressed public sector
with long waiting lines, private healthcare clinics play an ever-increasing
important role. Evimeria is helping the clinics remove administrative bottle-
necks, with digitized integrated services and a slick EMR system, which frees
up time and allows caregivers to focus on the patients.
Carasent is owner-operated and all the senior managers own a significant
number of shares. The entrepreneurial spirit and the fleet-footed organizational
structure allow them to adapt and thrive in an ever-changing market. Carasent
is a visionary firm and the successful (and distinctive) business proposal vouch
for it.
Catalyst typesStable quarterly reports
We believe that every quarterly report, showing stable profitable growth, will
solidify Carasent’s reputation as a qualitative investment. Compounders have
time on their side.
M&A
Carasent has identified M&A targets in all three growth dimensions:
geographical, segmental, and adjacent product/service areas. In December
2020, it used some of the proceeds from the rights issue in September in order
to acquire the Norwegian company, Avans Soma. We believe more M&A activity
is to come, as Carasent still sits on a large cash position of NOK >200 million.
Stockholm regional EMR system procurement
Stockholm regional council’s procurement of a new public EMR system will
serve as a powerful catalyst for Carasent in either direction. If the region would
stay open for business or even loosening up on certain restrictions, Evimeria
would find plenty of growth. If the reverse happened, Evimeria’s total
addressable market would face a severe hit.
Norwegian Webdoc launch
In December 2020, Carasent acquired Avans Soma, a developer of leading
medical record systems and IT solutions in the Norwegian healthcare market.
Avans Soma has around 140 customers, mainly in the social care and mental
illness rehabilitation field. We believe Avans Soma will be of great help to
finalize the Norwegian Webdoc version, and also add profitable growth on top
of Evimeria’s. We expect a Norwegian Webdoc launch in late 2021 or early
2022.
COVERED COMPANIES

36REDEYE - SAAS REPORT 2021
Formpipe Software FPIP Company page
https://www.redeye.se/company/formpipe-software
Publication date
April 7 2021
Analyst
Fredrik [email protected]
Conflict of interests
Fredrik Nilsson owns shares in Formpipe Software: No
Redeye performs/have performed services for the Company and receives/have
received compensation from the Company in connection with this.
Snapshot
Formpipe SoftwareOMXS30
Marketplace NASDAQ Stockholm
CEO Christian Sundin
Chairman Bo Nordlander
Share information
Share price (SEK) 33.7
Number of shares (M) 53.5
Market cap (MSEK) 1,799
Net debt (MSEK) -65
Financials
Redeye Estimates
2019 2020E 2021E 2022E 2023E
Revenue, MSEK 394 403 435 476 490
Growth -3.1% 2.4% 7.9% 9.3% 3.0%
EBITDA 103 104 88 108 131
EBITDA margin 26.2% 25.9% 20.3% 22.7% 26.8%
EBIT 48 53 39 59 82
EBIT margin 12.1% 13.2% 8.9% 12.3% 16.7%
Pre-tax earnings 44 52 39 59 82
Net earnings 35 41 30 45 63
Net margin 8.9% 10.1% 6.9% 9.5% 12.9%
Dividend/Share 0.60 0.60 0.25 0.38 0.53
EPS adj. 0.66 0.76 0.56 0.85 1.19
P/E adj. 34.6 41.7 56.6 37.6 26.9
EV/S 3.2 4.2 3.8 3.3 3.1
EV/EBITDA 12.2 16.1 18.6 14.7 11.7
Last updated: 2021-02-17
Owner Equity Votes
Martin Gren (Grenspecialisten) 10.4% 10.4%
SEB Fonder 10.0% 10.0%
Alcur Fonder 7.8% 7.8%
Swedbank Robur Fonder 7.5% 7.5%
Nordea Fonder 7.2% 7.2%
Martin Bjäringer 6.9% 6.9%
Thomas Wernhoff 5.0% 5.0%
Humle Fonder 3.9% 3.9%
Avanza Pension 3.4% 3.4%
TIN Fonder 3.4% 3.4%
Redeye Rating
COMPANY QUALITY
4People
5Business
3Financials
FAIR VALUE RANGE
Base33.0
Bear19.0
Bull42.0
Last price33.7
Turn page for catalyst specifics
CATALYST POTENTIAL
Impact
Major
Moderate
Minor
Timeframe
Long
Mid
Short
VolumeVolume
May Jul Sep Nov Jan Mar
20
30
15
25
0
1M
37REDEYE - SAAS REPORT 2021
Company descriptionFormpipe Software provides ECM (Enterprise Content Management) solutions
to public sector clients in Sweden and Denmark as well as the global Life
Science industry.The company is since 2010 listed on the OMX Small Cap
stock exchange. Formpipe has around 220 employees and is headquartered in
Stockholm, but also has a big part of its workforce in Denmark. The company
has a turnover of over 400 MSEK with an EBIT-margin of around 16%.
The ECM market comprises systems that capture, process, store, archive and
deliver information in a systematic way. This allows companies, organizations
and public authorities to manage the continuously increasing flow of
information in a connected, digital world. Through using ECM solutions, they
can therefore increase their productivity, efficiency and even reduce risks in
their business.Formpipe's key market segments, the Swedish and Danish public
sector, are regarded as relatively advanced in their use of ECM solutions. They
are ahead of the private sector, mostly due to regulatory pressure.
Formpipe's key competitors in the Nordics are Software Innovation (NO, part of
Tieto Group), Ida Infront (SE, part of Addnode Group), KMD (DK), and SBYS
(DK). We see Formpipe however in a leading position in their key customer and
product segments.
Investment case• Stable customer base and a high proportion of recurring revenues
• Software-as-a-Service (SaaS) sales are increasing rapidly
• Diversified product portfolio
• High scalability in the business makes us optimistic about the future
Investment Case
Stable customer base and a high proportion of recurring revenues. Formpipe’s
solutions help its clients to manage an ever-increasing flow of information,
which is a strong underlying driver for the business. The firm has a stable
customer base which primarily consists of public sector actors in Sweden and
Denmark, with a strong base of recurring revenues creating stability in the
business. Growth opportunities exist both in existing as well as new markets,
such as the Life Science sector.
Software-as-a-Service sales are increasing rapidly. For example, today the
majority of the Lasernet orders are sold as SaaS, and Formpipe believes that
this trend will continue in the coming years. A SaaS order is accrued over the
contract period, meaning that sales and profitability will be more stable
compared to if the product is sold as a traditional license. However, during the
migration phase from traditional license to SaaS, both profitability and sales are
affected negatively in the short term. On the positive side, this indicates that
Formpipe’s underlying profitability is better than what it may look like at first
glance.
Diversified product portfolio. The company has a history of both developing
own software products, as well as acquiring products, market expertise, and
client relationships. While the biggest focus is on public services clients, the
different products offered to different public, and private sector customer
groups mean that the company has a diversified product and market portfolio,
and is not a "one-trick pony".
High scalability in the business makes us optimistic about the future. In
summary, we consider Formpipe as a stable company due to its steady growth
in recurring revenues. As a result of the high scalability, we believe the
company to increase its margin on a mid-term basis. Also, Formpipe’s solid
market position of many of its products, long contracts and the increasing
trend towards cloud-based software usage, makes us even more optimistic
about Formpipe’s future.
Counter-Thesis - Bear Points
Increased competition: Formpipe may face increased competition from both
local players as well as international firms, and players from consulting and
product backgrounds joining forces, like Tieto.
Lower investment interest: The public sector might face reduced budgets over
time and therefore might have the less economic freedom to invest in systems
such as Formpipe’s.
Lack of profitability improvement: According to the sensitivity analysis, the
market expects a profitability improvement on a mid-term basis. Therefore, it is
important that Formpipe continue to improve its EBIT margin.
Catalyst types
Increase in SaaS orders
The shift towards more SaaS orders may affect sales and earnings negatively
in the short run. However, we believe that the shift will have a positive impact
on profitability in the long term.
New acquisitions for geographic and/or product expansion
Formpipe has historically used M&A to grow. Net debt is at levels again
allowing for new M&A, which can boost geo and/or product based growth.
COVERED COMPANIES

38REDEYE - SAAS REPORT 2021
Fortnox FNOX Company page
https://www.redeye.se/company/fortnox
Publication date
April 7 2021
Analyst
Fredrik [email protected]
Conflict of interests
Fredrik Nilsson owns shares in Fortnox: Yes
Redeye performs/have performed services for the Company and receives/have
received compensation from the Company in connection with this.
Snapshot
FortnoxOMXS30
Marketplace Nordic SME
CEO Tommy Eklund
Chairman Olof Hallrup
Share information
Share price (SEK) 421.4
Number of shares (M) 60.8
Market cap (MSEK) 25,628
Net debt (MSEK) -612
Financials
Redeye Estimates
2019 2020E 2021E 2022E 2023E
Revenue, MSEK 532 694 974 1,324 1,773
Growth 42.1% 30.4% 40.5% 35.9% 33.8%
EBITDA 172 286 400 569 794
EBITDA margin 32.4% 41.3% 41.0% 43.0% 44.8%
EBIT 172 265 344 507 722
EBIT margin 32.4% 38.3% 35.3% 38.3% 38.3%
Pre-tax earnings 172 262 344 507 722
Net earnings 172 260 268 396 563
Net margin 32.3% 37.4% 27.5% 29.9% 31.8%
Dividend/Share 0.00 0.75 0.00 0.00 0.00
EPS adj. 2.88 4.24 4.38 6.46 9.20
P/E adj. 0.3 98.1 95.0 64.4 45.2
EV/S 0.4 36.3 25.5 18.2 13.0
EV/EBITDA 1.3 88.0 62.2 42.4 29.1
Last updated: 2021-04-07
Owner Equity Votes
Olof Hallrup 20.9% 20.9%
State Street Bank And Trust co 13.5% 13.5%
Capital Group 8.0% 8.0%
Swedbank Robur Fonder 5.8% 5.8%
Morgan Stanley & co Intl Plc 4.4% 4.4%
The Bank of New York Mellon SA/NV 3.5% 3.5%
Spiltan Fonder 2.2% 2.2%
Peder Klas-Åke Bengtsson 2.2% 2.2%
Miton Asset Management 2.1% 2.1%
Avanza Pension 2.1% 2.1%
Redeye Rating
COMPANY QUALITY
4People
5Business
5Financials
FAIR VALUE RANGE
Base520.0
Bear238.0
Bull832.0
Last price421.4
Turn page for catalyst specifics
CATALYST POTENTIAL
Impact
Major
Moderate
Minor
Timeframe
Long
Mid
Short
VolumeVolume
May Jul Sep Nov Jan Mar
200
300
400
500
100
0
1M
39REDEYE - SAAS REPORT 2021
Company descriptionFortnox is a Växjö-based provider of software as a service (SaaS) enterprise
resource planning (ERP) systems for micro and small-sized enterprises,
including accounting, invoicing, customer relationship management (CRM) and
quotation & order. The company was founded in 2001 by Jan Älmeby, who also
founded Scandinavia PC Systems or Visma SPCS as it was renamed after
being acquired by Visma. In addition to its software offering, Fortnox also
offers financial services through its subsidiaries Fortnox Finance and
insurances through the newly started Fortnox Insurance. With over 350 000
customers, Fortnox can count ~1/3 of all Swedish micro and small-sized
businesses as its clients, making it the market leader in Sweden.
Investment case• Riding the SaaS-migration a few more years
• Exploit the data
• Significant barriers to enter
Investment case
Riding the SaaS-migration a few more years
The migration towards SaaS acts as a trigger for micro and small-sized
businesses to reevaluate their accounting software. It has been going on for
many years and has served Fortnox well – the number of customers has grown
to over 350 000 since the company was founded in 2001. However, we believe
there are still several years to come before the migration is finished.
Exploiting data
Thanks to its software offering, Fortnox has access to its customers’
accounting data. Thus, with ~1/3 of all Swedish micro- and small-sized
businesses as customers and growing, we believe there is a vast potential
waiting to be utilized going forward. Currently, Fortnox Finance has just scratch
the surface, with a penetration rate of ~2% of Fortnox’ customer base and an
ARPC of SEK ~950. Consequently, the ARPC contribution is merely SEK ~19.
However, just a slight increase in penetration would cause a substantial rise in
ARPC contribution. Looking forward, we believe that Fortnox will strengthen its
competitive edge through the data it can access. Several financial services –
such as loans and factoring – can be price more efficiently by using not only
the customers’ data but also the customers’ customers’ data. Additionally,
marketing can be targeted towards businesses base on their accounting data.
The newly started Fortnox Insurance can similarly benefit from the accounting
data. The data will tell if a business has insurance or not and detect any
actions that could require insurance, such as a purchase of machinery.
Significant barriers to enter
As the market leader regarding SaaS in Sweden, we believe that Fortnox has
significant advantages that are hard to break; business schools are teaching it,
~1/4 of all Swedish micro and small-sized businesses are customers, ~15 000
accountants are using the software regularly, and central deals are in place
with all major accounting offices, whereof some – including Aspia – have
based their solution on Fortnox’ software. Although it is easy to transfer
data from one accounting software to another, many accounting offices,
accountants and business owners have invested significant time in learning
and integrating Fortnox’ software. Thus, a monthly fee of SEK ~100 is likely
insignificant compared to the cost of spending several hours learning a new
system.
Counter-thesis – Bear Points
The death of the accounting offices
Most of the new entrants either want to eliminate the accounting offices or
take over their role, while Fortnox, on the other hand, cooperates with them.
Thus, if the accounting offices would become marginalized, Fortnox will lose
one of its most important competitive edges.
A major accounting office leaving Fortnox
Some major accounting offices – Aspia for example – currently have solutions
based on Fortnox' software. These deals are significant regarding customers,
but the ARPC is low. The main risk, according to us, however, is that other
offices might question Fortnox, as a major player is leaving.
Absence of significant ARPC increases
Our estimates of continuously increasing ARPC might be too optimistic. Fewer
companies than expected may need additional modules, financial services, and
insurance, for several reasons. For example, most businesses are tiny and have
zero employees and may, thus, only need accounting and invoicing software.
Catalyst typesIncreased penetration rates in the subsidiaries
The penetration rate for both Fortnox Finance and Fortnox Insurance is
currently at below 3%. However, the ARPC of those customers are much higher
than for the group. Thus, slight increases in penetration rate has a large impact
in overall sales growth.
Increasing ARPC
We forecast the ARPC to continue to increase, mainly due to a higher
penetration for Fortnox Finance. However, small changes in the penetration
rate of lead to significant differences in ARPC and, thus, valuation. We believe
there is a possibility for the ARPC do deviate significantly both on the up- and
downside relative to our forecast. (Long term)
COVERED COMPANIES
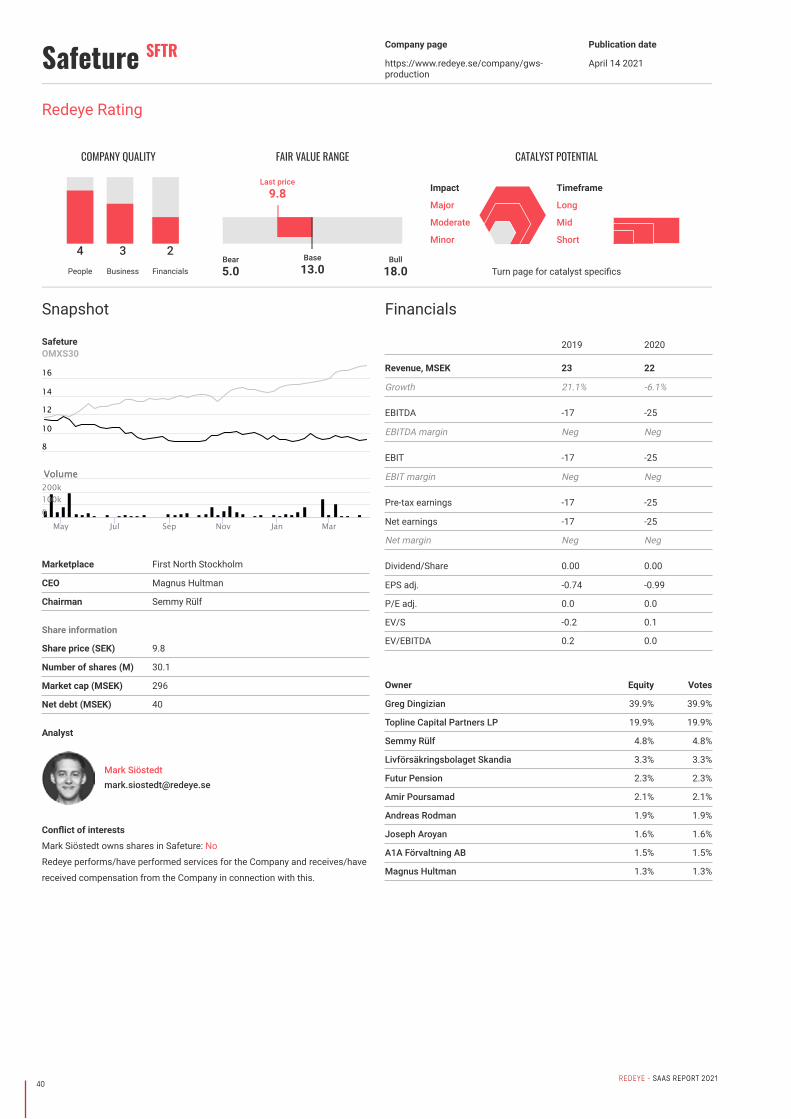
40REDEYE - SAAS REPORT 2021
Safeture SFTR Company page
https://www.redeye.se/company/gws-production
Publication date
April 14 2021
Analyst
Mark Siö[email protected]
Conflict of interests
Mark Siöstedt owns shares in Safeture: No
Redeye performs/have performed services for the Company and receives/have
received compensation from the Company in connection with this.
Snapshot
SafetureOMXS30
Marketplace First North Stockholm
CEO Magnus Hultman
Chairman Semmy Rülf
Share information
Share price (SEK) 9.8
Number of shares (M) 30.1
Market cap (MSEK) 296
Net debt (MSEK) 40
Financials
2019 2020
Revenue, MSEK 23 22
Growth 21.1% -6.1%
EBITDA -17 -25
EBITDA margin Neg Neg
EBIT -17 -25
EBIT margin Neg Neg
Pre-tax earnings -17 -25
Net earnings -17 -25
Net margin Neg Neg
Dividend/Share 0.00 0.00
EPS adj. -0.74 -0.99
P/E adj. 0.0 0.0
EV/S -0.2 0.1
EV/EBITDA 0.2 0.0
Owner Equity Votes
Greg Dingizian 39.9% 39.9%
Topline Capital Partners LP 19.9% 19.9%
Semmy Rülf 4.8% 4.8%
Livförsäkringsbolaget Skandia 3.3% 3.3%
Futur Pension 2.3% 2.3%
Amir Poursamad 2.1% 2.1%
Andreas Rodman 1.9% 1.9%
Joseph Aroyan 1.6% 1.6%
A1A Förvaltning AB 1.5% 1.5%
Magnus Hultman 1.3% 1.3%
Redeye Rating
COMPANY QUALITY
4People
3Business
2Financials
FAIR VALUE RANGE
Base13.0
Bear5.0
Bull18.0
Last price9.8
Turn page for catalyst specifics
CATALYST POTENTIAL
Impact
Major
Moderate
Minor
Timeframe
Long
Mid
Short
VolumeVolume
May Jul Sep Nov Jan Mar
8
10
12
14
16
0100k200k
41REDEYE - SAAS REPORT 2021
Company descriptionSafeture offers a cloud-based SaaS platform, managing risk, safety, and
crises involving employees. The service unifies employee communication,
information, and location in one tool. Safeture’s open platform architecture
allows customers to seamlessly integrate internal processes and features with
external suppliers, such as assistance providers, travel agencies or other
software, including internal employment databases or intranets.
Safeture’s platform offers a range of functions and components that can be
used off the shelf, such as mobile apps, travel tracking, flight updates, global
real-time alerts, e-learning, bulk messaging, country and medical information.
Companies can pick and choose the number of licenses and modules and
thereby create something that suits their specific need. The customizable
platform can be seamlessly integrated with current human resources/security/
assistance setups.
Investment case• Safeture is going from being an engineering-focused organization to a
SaaS business, with well-experienced management that has scaled
similar-sized companies before.
• Safeture's strong value proposition makes it a good partner, both for
larger companies seeking to have all employee safety tools under one
roof, and for assistance companies that want to focus on their core
competency, and outsource the technical platform.
• There is an ongoing consolidation in the market, where larger assistance/
security companies acquire smaller software providers, like Safeture. We
believe Safeture could be a possible target.
• Although Safeture is in a ‘land-grabbing phase’ where growth should be
paramount and profitability secondary, signs of scalability would greatly
boost the market’s confidence in the company and ease the possibility to
attract long-term and well-financed investors.
Large installed customer base with low churnSafeture is a category leader in a fast-growing (>10% a year) niche market.
It has a large installed base of >3,500 medium to large-sized corporations and
organizations. This has been accomplished despite its engineering-focused
legacy, which points toward a strong value proposition. Our channel checks
and the low churn do as well.
Safeture has an underappreciated market position in an area receiving more
attention after the Covid-19 pandemic. A record amount of proposal requests
indicates a potential ‘ketchup effect’ in the coming years, as more companies
look over their duty of care responsibilities.
Focus on selling
Safeture’s transformation to a SaaS business also coincides with a new focus
on selling. In 2020, the sales and marketing force increased from three people
to 15, which will greatly expand the lead generation, onboarding, and activation
of new customers.
Safeture’s total contract value increased by +400% in 2020, despite the
pandemic and ensuing economic turbulence, partly thanks to the larger
sales force.
Well-experienced managementSafeture’s management and board are full of experienced company-builders
that have scaled businesses before. CEO Magnus Hultman, for example, has
a long history of doing it, including SaaS companies. Safeture needs good
execution, and we believe the company is in the right hands.
Catalyst typesPartnership with a larger assistance/security company (partnership)Around 70% of net sales come from partnerships (including white label).
Should Safeture enter an agreement with a security company such as Securitas
(Pinkerton) or G4S, it would obtain access to a large customer base, fueling the
growth.
New contract with a sizeable customer (direct sales)
Safeture received orders from Siemens and International Paper in 2020, two
big corporations with ~300,000 and ~55,000 employees, respectively. Any
customer (or order value) in the same range would act as a positive catalyst
for the stock, and we expect such news in 2021.
Signs of scalability
Although Safeture is in a ‘land-grabbing phase’ where growth should be
paramount and profitability secondary, we still would like to see scalability
signs. It would greatly boost the market’s confidence in the company and ease
the possibility to attract long-term and well-financed investors. Safeture does
not necessarily have to become profitable but only be able to show that it
could, if wanted. This is often a significant catalyst for smaller, less followed
companies.
Acquisition target
There is an ongoing consolidation in the market, where larger assistance/
security companies acquire smaller software providers, like Safeture. We
believe Safeture could be a possible target.
COVERED COMPANIES
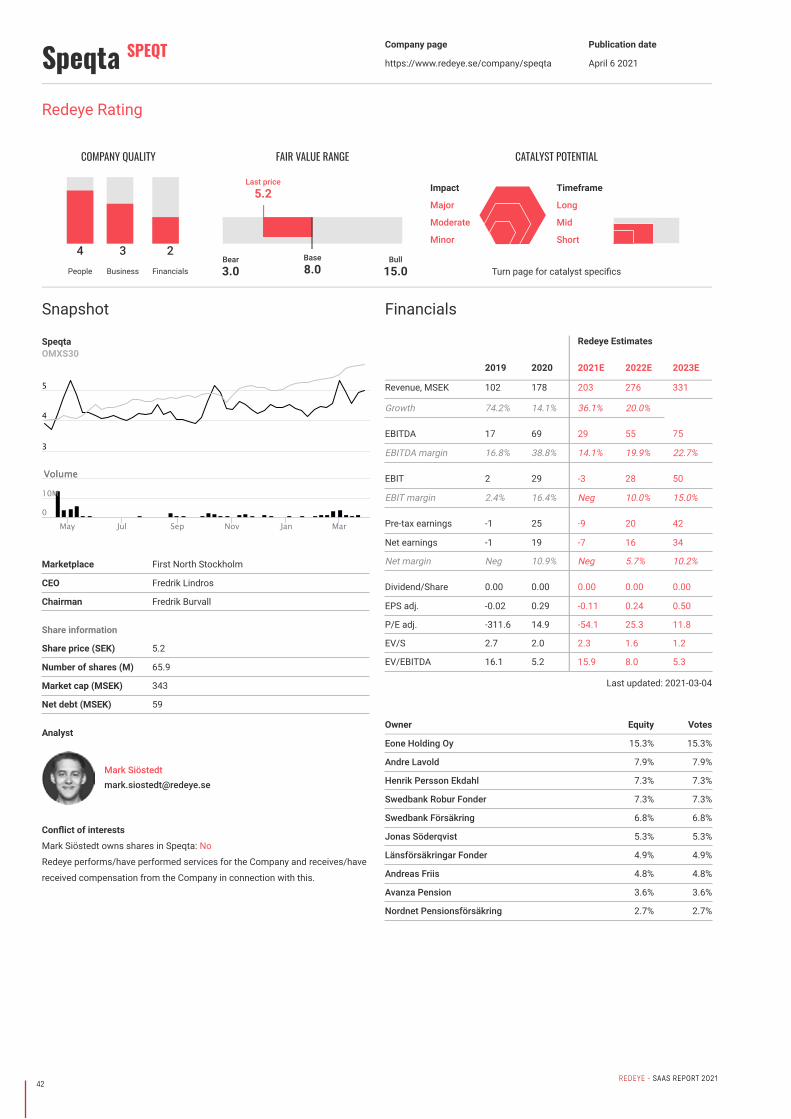
42REDEYE - SAAS REPORT 2021
Speqta SPEQT Company page
https://www.redeye.se/company/speqta
Publication date
April 6 2021
Analyst
Mark Siö[email protected]
Conflict of interests
Mark Siöstedt owns shares in Speqta: No
Redeye performs/have performed services for the Company and receives/have
received compensation from the Company in connection with this.
Snapshot
SpeqtaOMXS30
Marketplace First North Stockholm
CEO Fredrik Lindros
Chairman Fredrik Burvall
Share information
Share price (SEK) 5.2
Number of shares (M) 65.9
Market cap (MSEK) 343
Net debt (MSEK) 59
Financials
Redeye Estimates
2019 2020 2021E 2022E 2023E
Revenue, MSEK 102 178 203 276 331
Growth 74.2% 14.1% 36.1% 20.0%
EBITDA 17 69 29 55 75
EBITDA margin 16.8% 38.8% 14.1% 19.9% 22.7%
EBIT 2 29 -3 28 50
EBIT margin 2.4% 16.4% Neg 10.0% 15.0%
Pre-tax earnings -1 25 -9 20 42
Net earnings -1 19 -7 16 34
Net margin Neg 10.9% Neg 5.7% 10.2%
Dividend/Share 0.00 0.00 0.00 0.00 0.00
EPS adj. -0.02 0.29 -0.11 0.24 0.50
P/E adj. -311.6 14.9 -54.1 25.3 11.8
EV/S 2.7 2.0 2.3 1.6 1.2
EV/EBITDA 16.1 5.2 15.9 8.0 5.3
Last updated: 2021-03-04
Owner Equity Votes
Eone Holding Oy 15.3% 15.3%
Andre Lavold 7.9% 7.9%
Henrik Persson Ekdahl 7.3% 7.3%
Swedbank Robur Fonder 7.3% 7.3%
Swedbank Försäkring 6.8% 6.8%
Jonas Söderqvist 5.3% 5.3%
Länsförsäkringar Fonder 4.9% 4.9%
Andreas Friis 4.8% 4.8%
Avanza Pension 3.6% 3.6%
Nordnet Pensionsförsäkring 2.7% 2.7%
Redeye Rating
COMPANY QUALITY
4People
3Business
2Financials
FAIR VALUE RANGE
Base8.0
Bear3.0
Bull15.0
Last price5.2
Turn page for catalyst specifics
CATALYST POTENTIAL
Impact
Major
Moderate
Minor
Timeframe
Long
Mid
Short
VolumeVolume
May Jul Sep Nov Jan Mar
4
5
3
0
10M
43REDEYE - SAAS REPORT 2021
Company descriptionSpeqta is a digital media house headquartered in Stockholm, Sweden. The
company excels in constructing scalable and auto-generated web products.
The concepts behind the products are language independent, which means
they can be applied on a multinational level. Speqta was founded in 2003, and
the share is traded on Nasdaq Stockholm First North. Speqta has two divisions;
AdTech and Content & Comparison. The Group has a focus on performance-
based marketing and lead generation.
Investment case• Attractive exposure to e-commerce
• Acquired growth
• Innovations
• Scalability
Our investment case in Speqta is based on the vast opportunities within
performance-based marketing and e-commerce. The company has a strong
presence in the e-commerce market and expanding within the finance vertical.
Furthermore, the company is launching new and innovative, in-house developed
products like BidBrain.
Attractive exposure to e-commerce
The European e-commerce market is growing rapidly, and the COVID-19
pandemic has boosted the growth further. Speqta has an attractive exposure to
the European e-commerce industry that will help drive rapid growth for many
years to come.
Acquired growth
The e-commerce sector offers several exciting growth opportunities, and M&A
is one. The company has experience from several acquisitions and is backed
up by several wells capitalized owners. We believe that Speqta is in a strong
position to make value-adding acquisitions.
Innovations
Speqta continues to sow its innovative flair. We find the new product BidBrain
very interesting and things look promising. We believe that the company will
continue to innovate and add new attractive products to its offering.
Scalability
Speqta has a highly digital and scalable business. Therefore, we expect that the
growth efforts will lead to a strong and improving profit margin.
Bear points (Counterarguments to our thesis)
• To not overpay and achieve successful integration and performance of
acquisitions is often challenging. As Speqta scales up, acquisitions are
likely to increase in size. Optimizer Invest and the Chairman of the Board
have good track records and are adding crucial competencies, which
limits the risks.
• Acquisitions in general most often need a healthy financial market, a
downturn could lead to less possibilities to acquire more exciting
companies within the Shopping segment. The Nordea financing and
with Optimizer Invest on board, we believe the company is more likely
to attract capital and convince sellers even in a weaker market.
Catalyst typesAffiliJet expansion
The collaboration with Expressen develops well and has expanded from
performance-based marketing of discount coupons to loans and iGaming.Speqta has also acquired a similar collaboration with the Norwegian
newspaper Nettavisen as well as Aller Dagbladet. Large publishers are
searching for new income streams and AffiliJet is a flexible and profitable
solution. We believe that new deals are likely within the coming months,
both organically and through acquisitions.
Improved fundamental performance changing the market perception
The acquisitions within Content & Comparison should lead to gradually
enhanced growth and profitability. Speqta shows positive EBITDA results and
can the company demonstrate further profitability, we believe the market
perception and valuation will appreciate.
Value-adding acquisitions
The company is open with its high acquisition ambitions and thus, it should not
come as a surprise for the stock market. We still believe new M&A deals could
be positive catalysts as it would validate the strategy. We also have confidence
in Optimizer Invest's ability to negotiate attractive terms and thereby, create
shareholder value.
In-house product innovations
Speqta has a history of entrepreneurship and business creativity. The founders
are still active in the operations, and the company is adding interesting compe-
tence as it grows. We believe the innovative in-house organization will generate
new exciting products to capitalize on the opportunities within performance-
based marketing.
COVERED COMPANIES
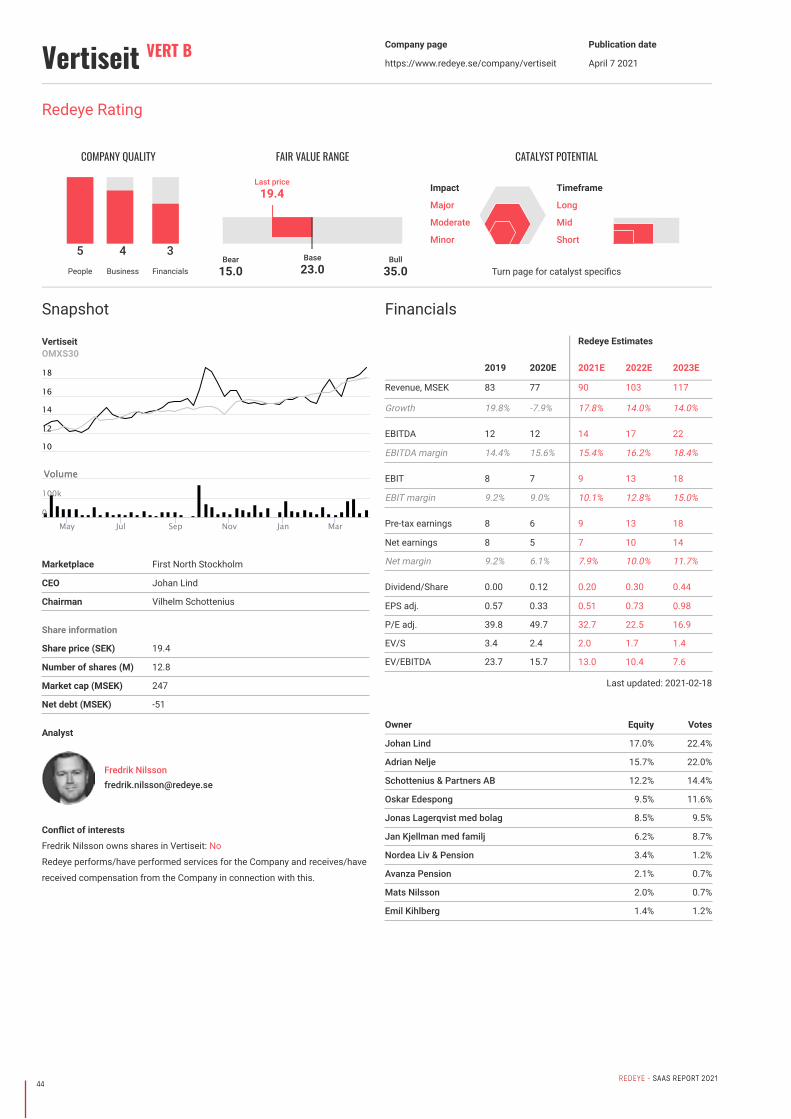
44REDEYE - SAAS REPORT 2021
Vertiseit VERT B Company page
https://www.redeye.se/company/vertiseit
Publication date
April 7 2021
Analyst
Fredrik [email protected]
Conflict of interests
Fredrik Nilsson owns shares in Vertiseit: No
Redeye performs/have performed services for the Company and receives/have
received compensation from the Company in connection with this.
Snapshot
VertiseitOMXS30
Marketplace First North Stockholm
CEO Johan Lind
Chairman Vilhelm Schottenius
Share information
Share price (SEK) 19.4
Number of shares (M) 12.8
Market cap (MSEK) 247
Net debt (MSEK) -51
Financials
Redeye Estimates
2019 2020E 2021E 2022E 2023E
Revenue, MSEK 83 77 90 103 117
Growth 19.8% -7.9% 17.8% 14.0% 14.0%
EBITDA 12 12 14 17 22
EBITDA margin 14.4% 15.6% 15.4% 16.2% 18.4%
EBIT 8 7 9 13 18
EBIT margin 9.2% 9.0% 10.1% 12.8% 15.0%
Pre-tax earnings 8 6 9 13 18
Net earnings 8 5 7 10 14
Net margin 9.2% 6.1% 7.9% 10.0% 11.7%
Dividend/Share 0.00 0.12 0.20 0.30 0.44
EPS adj. 0.57 0.33 0.51 0.73 0.98
P/E adj. 39.8 49.7 32.7 22.5 16.9
EV/S 3.4 2.4 2.0 1.7 1.4
EV/EBITDA 23.7 15.7 13.0 10.4 7.6
Last updated: 2021-02-18
Owner Equity Votes
Johan Lind 17.0% 22.4%
Adrian Nelje 15.7% 22.0%
Schottenius & Partners AB 12.2% 14.4%
Oskar Edespong 9.5% 11.6%
Jonas Lagerqvist med bolag 8.5% 9.5%
Jan Kjellman med familj 6.2% 8.7%
Nordea Liv & Pension 3.4% 1.2%
Avanza Pension 2.1% 0.7%
Mats Nilsson 2.0% 0.7%
Emil Kihlberg 1.4% 1.2%
Redeye Rating
COMPANY QUALITY
5People
4Business
3Financials
FAIR VALUE RANGE
Base23.0
Bear15.0
Bull35.0
Last price19.4
Turn page for catalyst specifics
CATALYST POTENTIAL
Impact
Major
Moderate
Minor
Timeframe
Long
Mid
Short
VolumeVolume
May Jul Sep Nov Jan Mar
12
14
16
18
10
0
100k
45REDEYE - SAAS REPORT 2021
Company descriptionVertiseit is a Swedish digital signage group founded in 2008, consisting of
Vertiseit, a full-service integrator, and Dise, a retail-focused CMS (Content
Management System) platform. Its headquarter is in Varberg with offices in
Karlstad, Stockholm, and London. In 2019, when the share was listed on First
North, the group had sales of SEK 83m with an EBIT margin of just below 10%.
The group has several well-known customers, including Skistar, Volvo, Lindex,
J Lindeberg M&S, and Lamborghini. Most of them combine Dise's platform with
Vertiseit's full-service integration. However, there are also examples of "pure"
Dise deals through partners such as M&S and Lamborghini.
Vertiseit generates three different revenue streams, SaaS, Agency, and
Systems. SaaS or Software as a Service consists of recurring revenue from
software subscriptions, surveillance, and support and maintenance paid
monthly per installed system. Agency consists of revenue from strategy and
concept development. Systems consist of revenue from hardware sales and
implementations.
Investment case• Corona mismatch creating an interesting opportunity
• Strong position in Sweden with a global footprint
• Low market penetration
Corona mismatch creating an interesting opportunity
During 2020, the Vertiseit share has declined by almost 30%. While a sharp
decline along with the stock market seemed reasonable in March, considering
Vertiseit's significant retail exposure, we believe that an unwarranted fear for
the resilience in Vertiseit's recurring revenues still holds the stock back. During
Q2, where retail was hit hard by the Corona crisis, Vertiseit managed to
increase its annual recurring revenues (ARR) by 3.2% QoQ – 13% on an
annualized basis. Considering Vertiseit's focus on retail and about 1/4 of
customers in the leisure industry, we find the increase in ARR during the Corona
crisis impressive, suggesting that Vertiseit's solutions are important to the
customers.
We believe that the mismatch in Vertiseit's operational performance, which we,
given the circumstances, believe is solid, and the share price creates an
interesting investment opportunity. The stock market, especially SaaS
companies, recovered fast from the Corona crisis, resulting in increased
multiples. While Vertiseit is not a pure SaaS business, we believe that the
Vertiseit share deserves a similar recovery.
We have a positive view on the Vertiseit share, and our Base case is SEK 22,
implying a ~40% upside potential.
Strong position in Sweden with a global footprint
Despite being a rather small business, Vertiseit is one of the leading digital
signage companies in Sweden with several well-known customers, such as
Volvo, Lindex, and Skistar Through its CMS platform Dise, Vertiseit reaches
well-known global brands such as M&S and Lamborghini. We believe that these
solid reference customers indicate that Vertiseit has one of the market-leading
digital signage solutions.
We like Vertiseit's strategy combing a Sweden/Nordics-focused full-service
integrator with a CMS platform with global ambitions. In the worst case, the
CMS platform, Dise, will just be Vertiseit's CMS provider. Still, if successful, Dise
can generate significant amounts of high-margin SaaS revenue from its partner
network. While we do not include a successful scenario in our Base case, we
like the low-risk/high-reward strategy. According to management, there are
ongoing discussions with large potential partners with a similar market
position as Vertiseit.
Low market penetration
Our field studies and market reports indicate that the penetration of digital
signage in Sweden is low, even as the Nordics is one of the most digitalizedregions. According to management, several of Vertiseit's customers have
digital signage solutions in 1/3 or less of their total stores. Thus, we see
significant growth potential in the current customer base. We also see the
potential for new customers who have not yet started the digitalization of
their stores. The Corona crisis could very well be a trigger for fewer but more
digitalized stores, which we believe would benefit Vertiseit.
Counter-thesis
Retail digitalization not taking off
Digital signage has been in focus for many years, but the penetration is still
low. The retailers who have implemented a digital signage solution have often
only digitalized a small share of its total stores. However, many retailers are in
the process of gradually digitalizing their stores as they are refurbished. Also,
we believe that the cost/benefit of digital signage solutions is well enough to
support further increases in penetration.
International players taking over
Vertiseit might lose deals to larger international players as the digital signage
market consolidates. The risk is likely higher regarding multinational retailers,
with a single concept in multiple countries. However, according to industry
experts, the concept part of digital signage still requires local know-how in
most cases, creating a hurdle for international players.
Long-term Corona impact on the leisure industryWith about 1/4 of its revenue generated from customers in the leisure industry,
prolonged corona restrictions, making many leisure activities impossible,
might cause substantial churn. However, we find it unlikely that the Corona
restrictions will last long enough for large players to reduce its presence for
good in a significant way.
Catalyst typesSubstantial deals
Additional substantial deals, such as the one with the Swedish Volvo dealers,
should have a positive impact on the share price, as it will result in a significant
increase in the ARR.
Adding more partners to DISE
While not included in our Base case, a significant amount of new DISE partners
will likely have a substantial impact on both SaaS revenue growth, profits, and
valuation.
M&A
Vertiseit has an outspoken M&A strategy, and since 2013, Vertiseit has
acquired seven companies, including smaller full-service integrators expanding
Vertiseit's customer base and product-driven acquisitions such as Dise. Going
forward, we believe Vertiseit will make fewer but larger acquisitions, as most
small players already have been consolidated. We believe that additional
acquisitions have a good chance of being value-creating mainly due to the
scalability in the SaaS revenues.
Continued growth in recurring revenues
The recurring SaaS revenues, with gross margins of 90-95%, is the key to
increase Vertiseit’s profits. If Vertiseit can continue to grow its SaaS revenues
at a steady pace – which we find likely – margins and profits will gradually
increase. While Vertiseit never becomes a pure SaaS business, we believe that
the market will reward the company with higher multiples as the SaaS revenue
grows.
COVERED COMPANIES

46REDEYE - SAAS REPORT 2021
XMReality XMR Company page
https://www.redeye.se/company/xmreality
Publication date
April 6 2021
Analyst
Forbes [email protected]
Conflict of interests
Forbes Goldman owns shares in XMReality: Yes
Redeye performs/have performed services for the Company and receives/have
received compensation from the Company in connection with this.
Snapshot
XMRealityOMXS30
Marketplace First North Stockholm
CEO Jörgen Remmelg
Chairman Björn Persson
Share information
Share price (SEK) 7.1
Number of shares (M) 40.9
Market cap (MSEK) 290
Net debt (MSEK) -8
Financials
Redeye Estimates
2019 2020 2021E 2022E 2023E
Revenue, MSEK 12 21 37 62 100
Growth 73.9% 76.1% 69.9% 61.3%
EBITDA -23 -20 -13 -2 24
EBITDA margin Neg Neg Neg Neg 23.9%
EBIT -27 -25 -17 -6 20
EBIT margin Neg Neg Neg Neg 20.0%
Pre-tax earnings -27 -25 -17 -6 20
Net earnings -27 -25 -17 -6 16
Net margin Neg Neg Neg Neg 15.7%
Dividend/Share 0.00 0.00 0.00 0.00 0.00
EPS adj. -1.60 -0.72 -0.50 -0.18 0.46
P/E adj. -2.3 -7.5 -17.0 -47.4 18.5
EV/S 4.6 8.0 7.7 4.8 2.8
EV/EBITDA -2.4 -8.4 -22.4 -187.4 11.8
Last updated: 2021-04-06
Owner Equity Votes
Investment AB Spiltan 25.0% 25.0%
Avanza Pension 6.5% 6.5%
Lars Svensson 5.8% 5.8%
Nordnet Pensionsförsäkring 4.9% 4.9%
Björn Persson 3.0% 3.0%
Christer Svensson 2.4% 2.4%
Göran Gustavsson 1.9% 1.9%
Euroclear Bank S.A/N.V 1.3% 1.3%
Peter Norman Eggers 1.3% 1.3%
SIX SIS AG 1.2% 1.2%
Redeye Rating
COMPANY QUALITY
4People
3Business
2Financials
FAIR VALUE RANGE
Base10.0
Bear3.0
Bull14.0
Last price7.1
Turn page for catalyst specifics
CATALYST POTENTIAL
Impact
Major
Moderate
Minor
Timeframe
Long
Mid
Short
VolumeVolume
May Jul Sep Nov Jan Mar
2
4
6
8
0
02.5M5M
47REDEYE - SAAS REPORT 2021
Company descriptionXMReality has developed and offered augmented reality solutions since 2007.
The company is offering software and hardware for remote guidance towards
field service companies where clients either implement the solution throughout
their internal service organization or in their service offering towards clients.
Investment case• Scalable business model: XMReality's solution is offered towards
customers that incorporate XMReality's solution in their own offering.
The company further faces fractional marginal costs of adding additional
users to the platform.
• The Corona crisis has sped up the market's adoption of new remote
solutions.
• Good potential for large roll-outs: We remain confident of its potential
among its list of customers, and expect the company to reveal this over
the coming year through announcements of larger orders (with software
values exceeding SEK 2m).
Highly scalable offering with potential customer lock-in. XMReality targets
industrial players that incorporate its software in their service offerings. The
company faces negligible marginal costs of adding additional licensed users
to the platform, and the potential to achieve high profitability is reflected by
the gross margins exceeding 90%. The use case further opens up for lock-in
effects as customers incorporate XMReality’s solution in their large-scale
service operations.
XMReality’s technique is unique in combining hand overlay, excellent
functionality in areas of weak network capacity, and that you can invite
customers to new sessions through a weblink, i.e., eliminating the need to run
sessions through an installed app on the customer side. Not having to
download software is an important feature mitigating the potential problem
of this new technique being perceived as complicated and complex. The
company launched this new feature rather recently, and with sales cycles often
exceeding a year, we believe that the full scope of this introduction is yet to be
seen.
Corona crisis accelerating AR adoption. XMReality has experienced an
explosion in customer interest since the onset of the Corona crisis. With the
pandemic increasing the interest in digital, remote technical solutions, the
company’s sales development has taken off. The crisis has increased the
speed at which the market is adopting the new technology, and we now see
a quickly maturing market.
In connection with the Corona crash, XMReality's share outperformed the
market and surged by more than 200%. With the company’s fundamental
performance quickly improving, the outlook going forward is excellent. We
currently see a significant upside to our base case of SEK 8 per share. We still
deem additional, and especially larger (>SEK 2m), software orders to be the
most critical share catalysts over the coming year as it would reveal the
potential within the rapidly growing customer base.
Counter Points
Slow adoption brings uncertainty. The adoption of Remote Guidance has so far
been slow. One of the reasons could be that the service personnel are reluctant
to change their way of working. The customers of XMReality’s customers may
also be unwilling to receive service through an AR-based solution that requires
some work by themselves, instead of someone physically coming over and
conducting all work for them.
New competitor(s) with superior solution. There is a risk of superior solutions
introduced by competitors emerging on the market. For the company to keep
its competitive edge, it is vital to continue to invest in R&D.
Price pressure. XMReality applies a premium price strategy that could be
difficult to retain if new competitors can offer solutions with a similar value
proposition as XMReality. It becomes even more relevant in the long run if the
technology becomes a standardized solution within industrial service
operations. It is, therefore, essential that XMReality retains its technological
advantage through continuing to develop its software.
Catalyst typesAnnouncement of large agreement
We see great potential in an extensive roll-out of XMReality’s Remote Guidance
solution throughout a large client’s service organization after running tests for
an extended period. Apart from yielding recurring revenues and high margins,
it would indicate that the industry truly is ready to adopt the solution and use it
on a larger scale.
New channel partner(s)
There is further potential for a new channel partner(s) that incorporate
XMReality’s solution in their offering toward clients. We, however, believe this to
be more relevant as the company has shown larger volumes of software sales.
COVERED COMPANIES
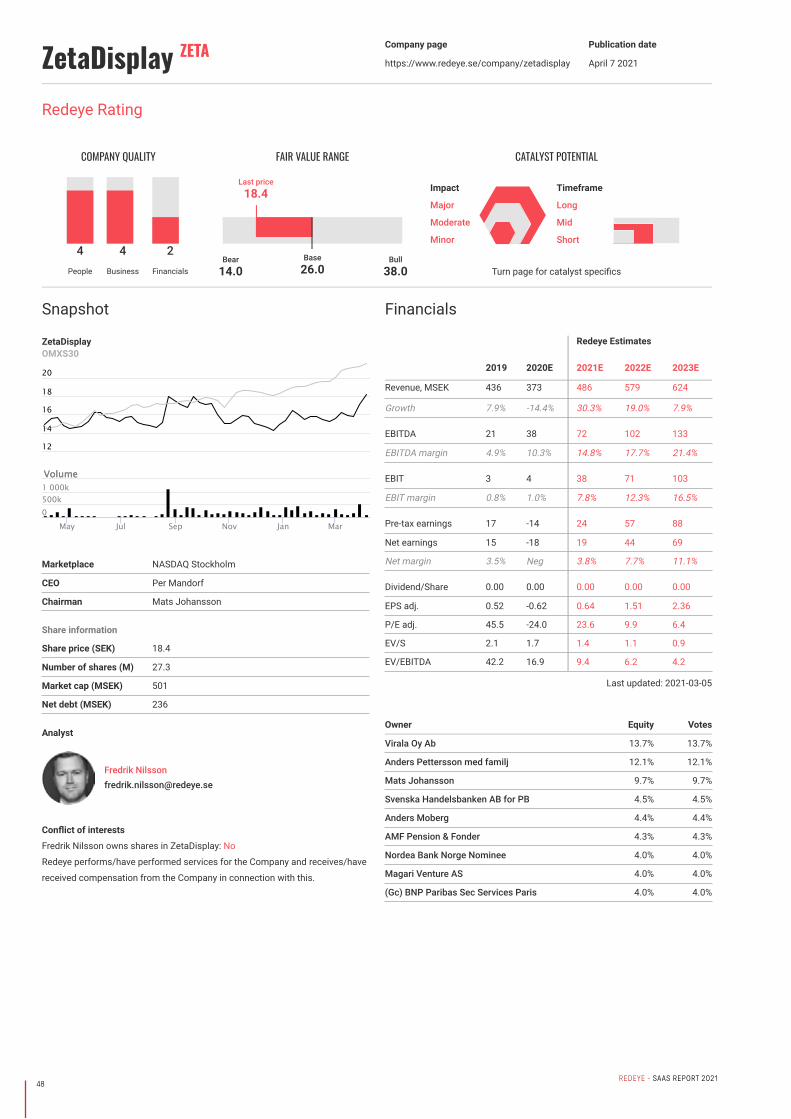
48REDEYE - SAAS REPORT 2021
ZetaDisplay ZETA Company page
https://www.redeye.se/company/zetadisplay
Publication date
April 7 2021
Analyst
Fredrik [email protected]
Conflict of interests
Fredrik Nilsson owns shares in ZetaDisplay: No
Redeye performs/have performed services for the Company and receives/have
received compensation from the Company in connection with this.
Snapshot
ZetaDisplayOMXS30
Marketplace NASDAQ Stockholm
CEO Per Mandorf
Chairman Mats Johansson
Share information
Share price (SEK) 18.4
Number of shares (M) 27.3
Market cap (MSEK) 501
Net debt (MSEK) 236
Financials
Redeye Estimates
2019 2020E 2021E 2022E 2023E
Revenue, MSEK 436 373 486 579 624
Growth 7.9% -14.4% 30.3% 19.0% 7.9%
EBITDA 21 38 72 102 133
EBITDA margin 4.9% 10.3% 14.8% 17.7% 21.4%
EBIT 3 4 38 71 103
EBIT margin 0.8% 1.0% 7.8% 12.3% 16.5%
Pre-tax earnings 17 -14 24 57 88
Net earnings 15 -18 19 44 69
Net margin 3.5% Neg 3.8% 7.7% 11.1%
Dividend/Share 0.00 0.00 0.00 0.00 0.00
EPS adj. 0.52 -0.62 0.64 1.51 2.36
P/E adj. 45.5 -24.0 23.6 9.9 6.4
EV/S 2.1 1.7 1.4 1.1 0.9
EV/EBITDA 42.2 16.9 9.4 6.2 4.2
Last updated: 2021-03-05
Owner Equity Votes
Virala Oy Ab 13.7% 13.7%
Anders Pettersson med familj 12.1% 12.1%
Mats Johansson 9.7% 9.7%
Svenska Handelsbanken AB for PB 4.5% 4.5%
Anders Moberg 4.4% 4.4%
AMF Pension & Fonder 4.3% 4.3%
Nordea Bank Norge Nominee 4.0% 4.0%
Magari Venture AS 4.0% 4.0%
(Gc) BNP Paribas Sec Services Paris 4.0% 4.0%
Redeye Rating
COMPANY QUALITY
4People
4Business
2Financials
FAIR VALUE RANGE
Base26.0
Bear14.0
Bull38.0
Last price18.4
Turn page for catalyst specifics
CATALYST POTENTIAL
Impact
Major
Moderate
Minor
Timeframe
Long
Mid
Short
VolumeVolume
May Jul Sep Nov Jan Mar
14
16
18
20
12
0500k1 000k
49REDEYE - SAAS REPORT 2021
Company descriptionZetaDisplay is a Swedish digital signage company, implementing
communication concepts based on standardized hardware - from leading
manufacturers such as LG, Philips and Samsung - and proprietary software
solutions sold as SaaS. The company is currently active in Sweden, Finland,
Norway, Denmark, Benelux and the Baltics.
Investment case• Leading European position in Digital Signage
• Growing market
• Successful acquisition history
Investment case
Leading European position in Digital Signage
ZetaDisplay drives digital transformation in physical environments. The
company's communication concept and software affect people's behavior at
the time of decision in-store and public environments as well as workplaces.
The solutions are known as Digital Signage, which the company develops and
offers as SaaS. ZetaDisplay has established itself as one of the three largest
players in the European Digital Signage market thanks to a series of successful
acquisitions and significant long-term customer contracts, for example with
ATG, IKEA, Hurtigruten, KPN, KeskoGroup, and Ekornes. The company is a
market leader in the Nordic countries, which is conceptually and technolo-
gically far ahead in an international comparison. The company implements
communication concepts based on standardized hardware - from leading
manufacturers such as LG, Philips and Samsung - and proprietary software
solutions. Most of the company's revenue today comes from the resale of
hardware and implementation. However, the value lies in the recurring SaaS
revenue, which already accounts for the majority of gross profit. If ZetaDisplay
succeeds in showing continued good growth in its SaaS revenues, we see
significant potential for higher margins over time. We believe that the
development of recurring revenue is the most important thing to focus on a
s an investor in ZetaDisplay.
Growing market
In 2018, the European Digital Signage market grew by 14%, and the drivers of
growth are the on-going digital transformation, new technological opportunities
and changing consumer behavior. ZetaDisplay's digital signage offer can be
divided into three different segments. The most significant segment is digital
store communication aimed at consumers. Retail environments are becoming
increasingly digital for a variety of reasons, such as smaller stores that need to
be more space-efficient and the retailer's desire to link online and offline
commerce. In addition to retail environments, ZetaDisplay also offers solutions
for internal digital communication for employees as well as digital commu-
nication in public environments aimed at the public. Common to all segments is
that new technology, changed behavior, and market conditions, as well as ever-
decreasing hardware prices, make Digital Signage more attractive compared to
analog solutions.
Successful acquisition history
In recent years, ZetaDisplay has made several acquisitions, which today form
the basis of ZetaDisplay's most profitable regions and which have contributed
to several significant agreements. ZetaDisplay has a stated ambition to
continue acquiring and consolidating the European market. The Digital Signage
market is fragmented and many of the companies today are only locally
established, which makes the market well suited for consolidation. Since
September 2019, Per Mandorf has been CEO; at the same time former CEO
Leif Liljebrunn took the role of acquisition manager, and the company has
issued a bond to enable cost-effective financing of further acquisitions. We
expect more acquisitions in the future, and given the company's good history,
we assess the likelihood that future acquisitions will be value-creating as high.
Counter-thesis
Financing cost of acquisitions (completed and future): The company has,
through its acquisition strategy, issued preference shares and raised loans.
Should it prove that the profitability of completed acquisitions differs from
expectations, this may be problematic for the company.
Acquisition risk: The company has a stated acquisition strategy, which means
potential acquisition risk. These risks include integration problems, an acquired
company failing to meet expectations, and the difficulty in finding acquisitions
that meet set requirements.
Lower growth than expected: Today's stock price assumes continued strong
growth. Therefore, it is important for the company to win new business while
retaining and establishing long-term relationships with existing customers.
Catalyst types
Additional acquisitions at attractive valuation
The company has a stated acquisitions strategy and another profitable
acquisitions at an attractive valuation would justify a higher value of the share
Communicates greater share of recurring revenues
The business model is based on three diferent revenue types: services,
software and licenses, and digital systems. The focus is on increasing
recurring revenues, and the company has succeeded. This increasingly gives
ZetaDisplay the character of a software company. The continued development
of recurring revenues will be interesting for investors to follow as we consdier it
to be the most important value driver in the company.
COVERED COMPANIES
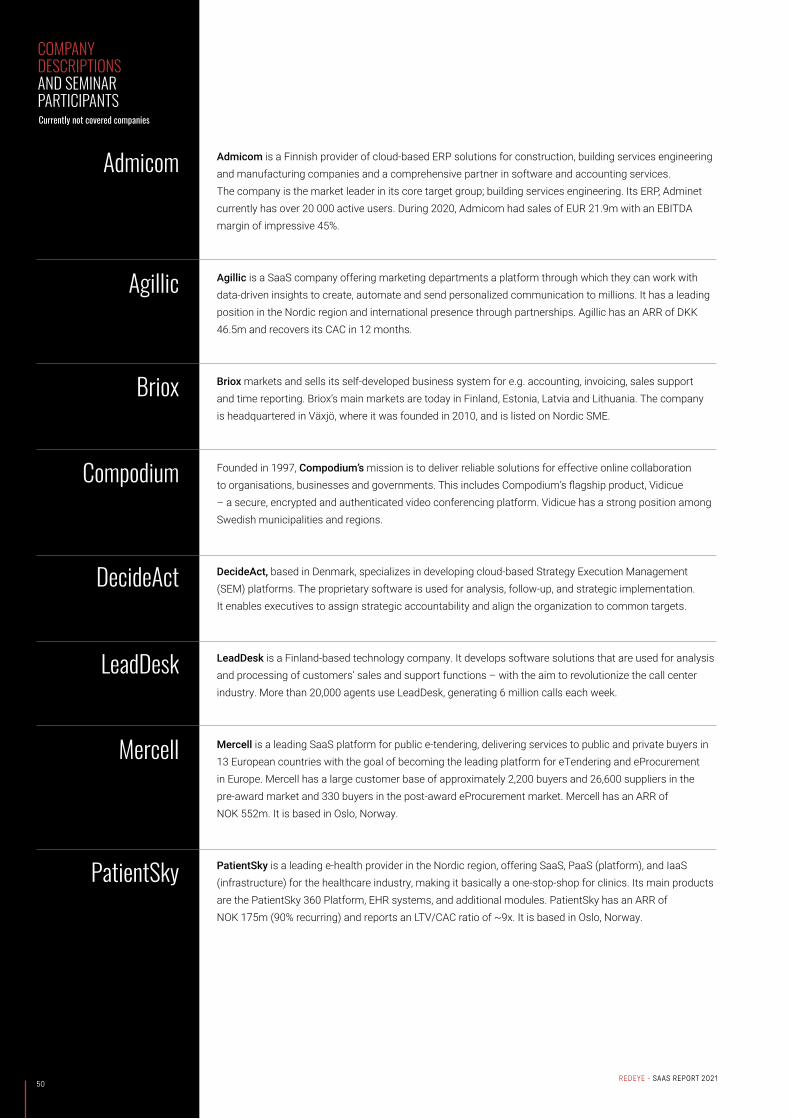
Admicom is a Finnish provider of cloud-based ERP solutions for construction, building services engineering and manufacturing companies and a comprehensive partner in software and accounting services. The company is the market leader in its core target group; building services engineering. Its ERP, Adminet currently has over 20 000 active users. During 2020, Admicom had sales of EUR 21.9m with an EBITDA margin of impressive 45%.
Agillic is a SaaS company offering marketing departments a platform through which they can work with data-driven insights to create, automate and send personalized communication to millions. It has a leading position in the Nordic region and international presence through partnerships. Agillic has an ARR of DKK 46.5m and recovers its CAC in 12 months.
Briox markets and sells its self-developed business system for e.g. accounting, invoicing, sales support and time reporting. Briox’s main markets are today in Finland, Estonia, Latvia and Lithuania. The company is headquartered in Växjö, where it was founded in 2010, and is listed on Nordic SME.
Founded in 1997, Compodium’s mission is to deliver reliable solutions for effective online collaboration to organisations, businesses and governments. This includes Compodium’s flagship product, Vidicue – a secure, encrypted and authenticated video conferencing platform. Vidicue has a strong position among Swedish municipalities and regions.
DecideAct, based in Denmark, specializes in developing cloud-based Strategy Execution Management (SEM) platforms. The proprietary software is used for analysis, follow-up, and strategic implementation. It enables executives to assign strategic accountability and align the organization to common targets.
LeadDesk is a Finland-based technology company. It develops software solutions that are used for analysis and processing of customers’ sales and support functions – with the aim to revolutionize the call center industry. More than 20,000 agents use LeadDesk, generating 6 million calls each week.
Mercell is a leading SaaS platform for public e-tendering, delivering services to public and private buyers in 13 European countries with the goal of becoming the leading platform for eTendering and eProcurement in Europe. Mercell has a large customer base of approximately 2,200 buyers and 26,600 suppliers in the pre-award market and 330 buyers in the post-award eProcurement market. Mercell has an ARR of NOK 552m. It is based in Oslo, Norway.
PatientSky is a leading e-health provider in the Nordic region, offering SaaS, PaaS (platform), and IaaS (infrastructure) for the healthcare industry, making it basically a one-stop-shop for clinics. Its main products are the PatientSky 360 Platform, EHR systems, and additional modules. PatientSky has an ARR of NOK 175m (90% recurring) and reports an LTV/CAC ratio of ~9x. It is based in Oslo, Norway.
COMPANY DESCRIPTIONS AND SEMINAR PARTICIPANTS
Agillic
Briox
Compodium
DecideAct
LeadDesk
Mercell
PatientSky
Admicom
Currently not covered companies
50REDEYE - SAAS REPORT 2021
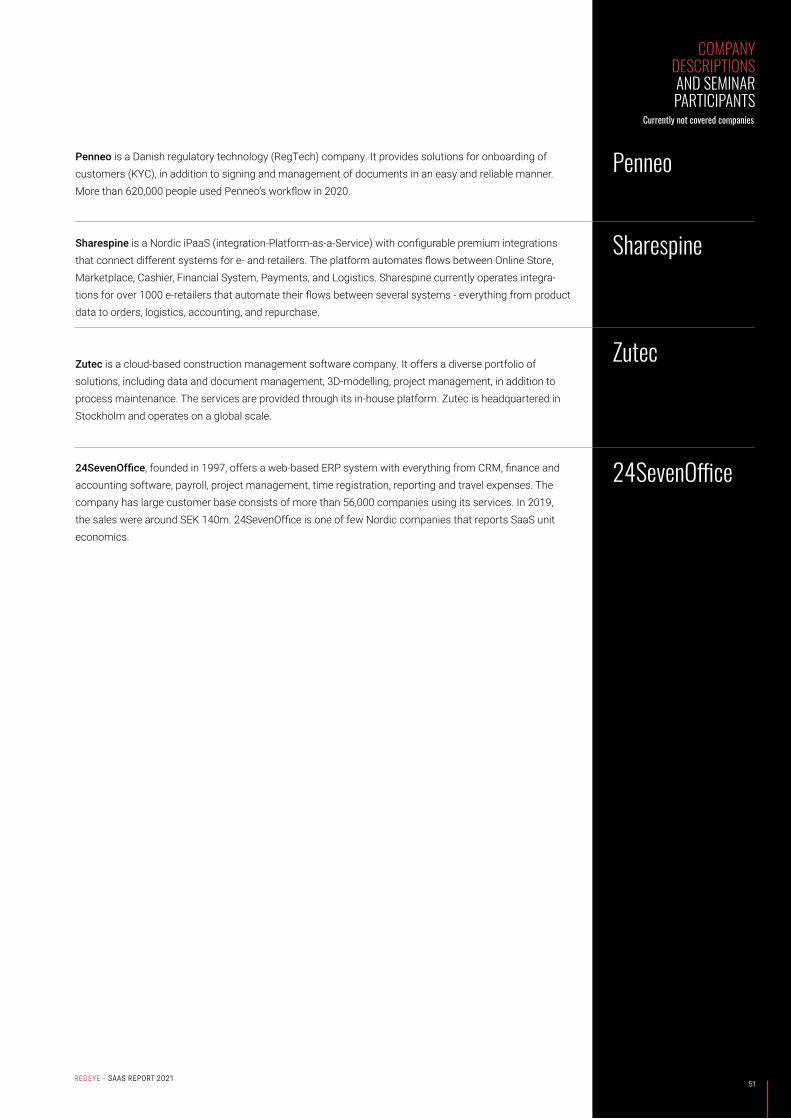
51REDEYE - SAAS REPORT 2021
COMPANY DESCRIPTIONS AND SEMINAR PARTICIPANTS
Sharespine
Zutec
24SevenOffice
Penneo
Currently not covered companies
Penneo is a Danish regulatory technology (RegTech) company. It provides solutions for onboarding of customers (KYC), in addition to signing and management of documents in an easy and reliable manner. More than 620,000 people used Penneo’s workflow in 2020.
Sharespine is a Nordic iPaaS (integration-Platform-as-a-Service) with configurable premium integrations that connect different systems for e- and retailers. The platform automates flows between Online Store, Marketplace, Cashier, Financial System, Payments, and Logistics. Sharespine currently operates integra-tions for over 1000 e-retailers that automate their flows between several systems - everything from product data to orders, logistics, accounting, and repurchase.
Zutec is a cloud-based construction management software company. It offers a diverse portfolio of solutions, including data and document management, 3D-modelling, project management, in addition to process maintenance. The services are provided through its in-house platform. Zutec is headquartered in Stockholm and operates on a global scale.
24SevenOffice, founded in 1997, offers a web-based ERP system with everything from CRM, finance and accounting software, payroll, project management, time registration, reporting and travel expenses. The company has large customer base consists of more than 56,000 companies using its services. In 2019, the sales were around SEK 140m. 24SevenOffice is one of few Nordic companies that reports SaaS unit economics.

52REDEYE - SAAS REPORT 2021

53REDEYE - SAAS REPORT 2021

54REDEYE - SAAS REPORT 2021
DISCLAIMER
Important information Redeye AB (“Redeye” or “the Company”) is a specialist financial advisory boutique that focuses on small and mid-cap growth companies in the Nordic region. We focus
on the technology and life science sectors. We provide services within Corporate Broking, Corporate Finance, equity research and investor relations. Our strengths are
our award-winning research department, experienced advisers, a unique investor network, and the powerful distribution channel redeye.se. Redeye was founded in
1999 and since 2007 has been subject to the supervision of the Swedish Financial Supervisory Authority.
Redeye is licensed to; receive and transmit orders in financial instruments, provide investment advice to clients regarding financial instruments, prepare and dissemi-
nate financial analyses/recommendations for trading in financial instruments, execute orders in financial instruments on behalf of clients, place financial instruments
without position taking, provide corporate advice and services within mergers and acquisition, provide services in conjunction with the provision of guarantees
regarding financial instruments and to operate as a Certified Advisory business (ancillary authorization).
Limitation of liability This document was prepared for information purposes for general distribution and is not intended to be advisory. The information contained in this analysis is based
on sources deemed reliable by Redeye. However, Redeye cannot guarantee the accuracy of the information. The forward-looking information in the analysis is based
on subjective assessments about the future, which constitutes a factor of uncertainty. Redeye cannot guarantee that forecasts and forward-looking statements will
materialize. Investors shall conduct all investment decisions independently. This analysis is intended to be one of a number of tools that can be used in making an
investment decision. All investors are therefore encouraged to supplement this information with additional relevant data and to consult a financial advisor prior to an
investment decision. Accordingly, Redeye accepts no liability for any loss or damage resulting from the use of this analysis..
Potential conflict of interest Redeye’s research department is regulated by operational and administrative rules established to avoid conflicts of interest and to ensure the objectivity and
independence of its analysts. The following applies:
• For companies that are the subject of Redeye’s research analysis, the applicable rules include those established by the Swedish Financial Supervisory Authority
pertaining to investment recommendations and the handling of conflicts of interest. Furthermore, Redeye employees are not allowed to trade in financial instruments
of the company in question, from the date Redeye publishes its analysis plus one trading day after this date.
• An analyst may not engage in corporate finance transactions without the express approval of management and may not receive any remuneration directly
linked to such transactions.
• Redeye may carry out an analysis upon commission or in exchange for payment from the company that is the subject of the analysis, or from an underwriting
institution in conjunction with a merger and acquisition (M&A) deal, new share issue or a public listing. Readers of these reports should assume that Redeye
may have received or will receive remuneration from the company/companies cited in the report for the performance of financial advisory services. Such
remuneration is of a predetermined amount and is not dependent on the content of the analysis.
Redeye’s research coverageRedeye’s research analyses consist of case-based analyses, which imply that the frequency of the analytical reports may vary over time. Unless otherwise expressly
stated in the report, the analysis is updated when considered necessary by the research department, for example in the event of significant changes in market
conditions or events related to the issuer/the financial instrument.
Recommendation structureRedeye does not issue any investment recommendations for fundamental analysis. However, Redeye has developed a proprietary analysis and rating model,
Redeye Rating, in which each company is analyzed and evaluated. This analysis aims to provide an independent assessment of the company in question,
its opportunities, risks, etc. The purpose is to provide an objective and professional set of data for owners and investors to use in their decision-making.
Redeye Rating (2021-04-08)Rating People Business Financials 5p 20 15 3
3p - 4p 96 77 36
0p - 2p 6 30 83
Company N 122 122 122
Duplication and distributionThis document may not be duplicated, reproduced or copied for purposes other than personal use. The document may not be distributed to physical or
legal entities that are citizens of or domiciled in any country in which such distribution is prohibited according to applicable laws or other regulations.
55REDEYE - SAAS REPORT 2021
redeye.se
Redeye is the next generation investment banking company, specialized in Life Science and Technology. Clients are innovative and fast-growing companies based in the Nordics but with a global reach. Redeye is a leading provider of Equity Research, Corporate Broking, and Corporate Finance in these sectors. The research is built on a value-based investment philosophy and with a unique Rating model. Redeye was founded in Stockholm 1999 and is regulated by the Swedish Financial Authority (Finansinspektionen).


