


Soft machines - Cloud computing and the software ascendancy - Ed Maguire
144
Soft machines Cloud computing and the software ascendancy Special report September 2013
-
Upload
edward-maguire -
Category
Software
-
view
290 -
download
4
Transcript of Soft machines - Cloud computing and the software ascendancy - Ed Maguire

Soft machines Cloud computing and the software ascendancy
Special report
September 2013
Global technology
2 [email protected] 20 September 2013
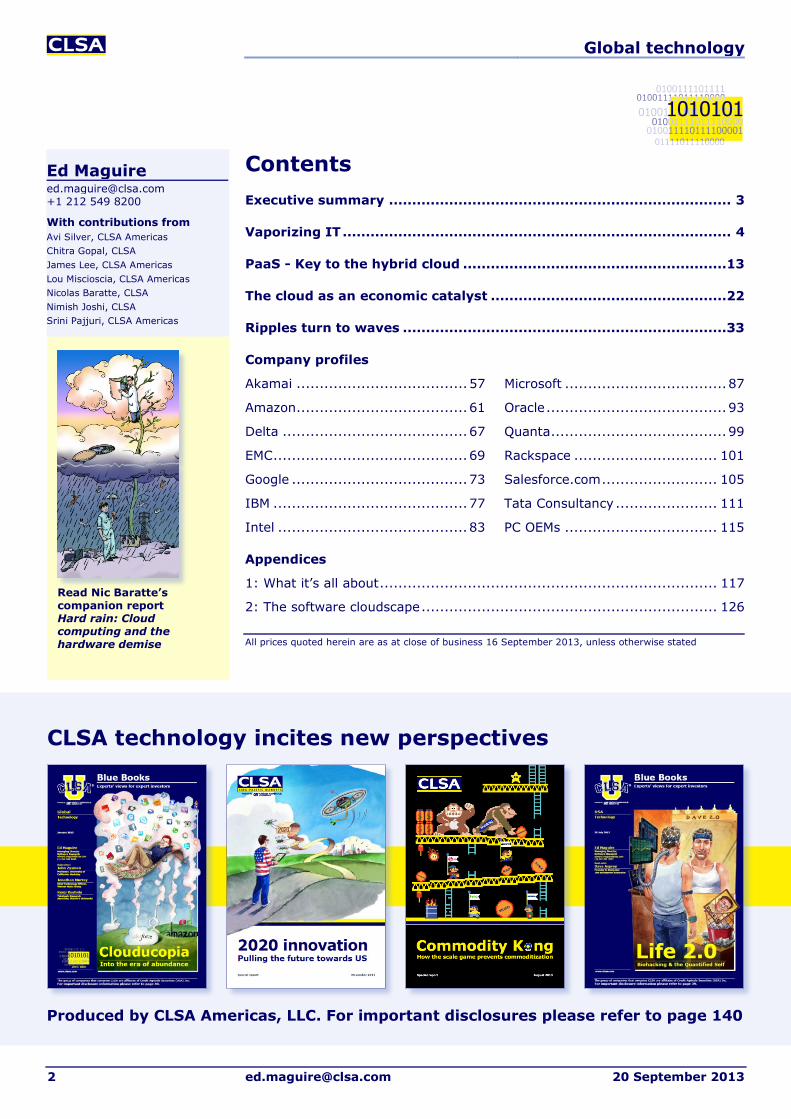
Contents Executive summary .......................................................................... 3
Vaporizing IT .................................................................................... 4
PaaS - Key to the hybrid cloud .........................................................13
The cloud as an economic catalyst ...................................................22
Ripples turn to waves ......................................................................33
Company profiles
Akamai ..................................... 57
Amazon ..................................... 61
Delta ........................................ 67
EMC .......................................... 69
Google ...................................... 73
IBM .......................................... 77
Intel ......................................... 83
Microsoft ................................... 87
Oracle ....................................... 93
Quanta ...................................... 99
Rackspace ............................... 101
Salesforce.com ......................... 105
Tata Consultancy ...................... 111
PC OEMs ................................. 115
Appendices 1: What it’s all about ......................................................................... 117 2: The software cloudscape ................................................................ 126
All prices quoted herein are as at close of business 16 September 2013, unless otherwise stated
Read Nic Baratte’s companion report Hard rain: Cloud computing and the hardware demise
CLSA technology incites new perspectives
Produced by CLSA Americas, LLC. For important disclosures please refer to page 140
Ed Maguire [email protected] +1 212 549 8200
With contributions from Avi Silver, CLSA Americas Chitra Gopal, CLSA James Lee, CLSA Americas Lou Miscioscia, CLSA Americas Nicolas Baratte, CLSA Nimish Joshi, CLSA Srini Pajjuri, CLSA Americas
Executive summary Global technology
20 September 2013 [email protected] 3
Soft machines The soft machines of cloud computing transform the technology landscape, economic models and strategies. The Platform-as-a-Service (PaaS) architecture will play a key role in unlocking applications from the components of infrastructure, which is subject to the forces of commoditization. As cloud computing disrupts the entrenched IT leaders, new innovations power emerging economic benefits. Open-source and services models exacerbate competitive pressures for infrastructure software and hardware vendors. We see value accruing towards Software as a Service (SaaS) and solutions. Salesforce.com, Akamai and Microsoft are our top picks.
Cloud computing changes IT from a bespoke to utility model. Commoditization of IT will accelerate demand and innovation. Adoption has passed the inflection and signs point to the hybrid public/private cloud as the preferred approach. As a wave of new social, mobile and analytic applications emerges, custom software development becomes a key competitive weapon.
The PaaS market is far smaller than SaaS and Infrastructure as a Service (IaaS), but size vastly understates its strategic consequence. PaaS promises code portability, the ability to swap out infrastructure components as a commodity. Microsoft, Pivotal, Google and Salesforce.com lead this highly fragmented landscape. We expect consolidation of smaller vendors to accelerate mainstream adoption.
Cloud computing alters the economic calculus of information technology via transition from products to services, from capex to opex. Quantifying ROI is elusive, as lower costs spur elastic demand. The broader benefits of cloud computing translate into innovation, net job creation and economic growth.
Cloud architecture amplifies competitive threats to middleware, database, operating-system and hardware vendors from open-source and service-delivery models. Storage should do better than networking, which should do better than servers (see Nicolas Baratte’s Hard rain report, which explores the shrinking hardware profit pool). IT services will see value churn as IaaS commoditizes outsourcing and automation displaces people-intensive tasks. As value accrues towards SaaS and solutions, our top cloud picks are Salesforce.com, Akamai and Microsoft. We also like cloud-service providers Amazon and Google, while Rackspace appears at risk. EMC is a cloud-infrastructure beneficiary, whereas HP, VMware, Oracle and Intel look vulnerable. Share performance across the software sector reflects this bifurcation of value creation.
Comparable valuations
(Local currency) Ticker Rating Analyst Curr Target Last close
EPS FY13
EPS FY14
PE (x) FY13
PE (x) FY14
Upside (%)
Akamai AKAM US BUY1 Ed Maguire US$ 66.0 51.37 1.96 2.32 26.3 22.3 28.5 Amazon AMZN US O-PF1 James Lee US$ 325.0 296.06 3.83 6.02 77.3 49.2 9.8 EMC EMC US O-PF1 Louis Miscioscia, CFA US$ 30.0 26.88 1.87 2.20 14.3 12.2 11.6 Google GOOG US BUY1 James Lee US$ 1,075.0 887.76 43.87 54.49 20.2 16.3 21.1 Hewlett Packard HPQ US U-PF1 Avi Silver US$ 23.0 21.74 3.55 3.40 6.1 6.4 5.8 IBM IBM US O-PF1 Ed Maguire US$ 225.0 193.15 16.57 18.72 11.7 10.3 16.5 Intel INTC US U-PF1 Srini Pajjuri US$ 22.5 23.39 1.89 1.82 12.4 12.9 (3.8) Microsoft MSFT US O-PF1 Ed Maguire US$ 38.0 32.79 2.58 2.72 12.7 12.1 15.9 Oracle ORCL US U-PF1 Ed Maguire US$ 35.0 32.97 2.68 2.88 12.3 11.5 6.2 Rackspace RAX US SELL1 Louis Miscioscia, CFA US$ 40.0 52.26 0.69 0.85 75.2 61.7 (23.5) Salesforce.com CRM US BUY1 Ed Maguire US$ 64.0 49.65 0.41 0.34 122.6 147.7 28.9 Delta 2308 TT O-PF2 Chitra Gopal, CFA NT$ 157.5 135.00 7.07 8.16 19.1 16.5 16.7 Quanta 2382 TT O-PF2 Chitra Gopal, CFA NT$ 75.2 68.00 4.82 5.02 14.1 13.5 10.6 Tata Consultancy TCS IB O-PF2 Nimish Joshi Rs 2,200.0 1,902.55 71.23 92.47 27.3 21.1 15.7 1Covered by CLSA Americas, 2CLSA. Source: CLSA Americas, CLSA
Cloud computing and the software ascendancy
Vaporizing IT: Commoditization
accelerates innovation
PaaS is a small but important catalyst for
technological disruption
Cloud as a net-positive economic catalyst
Ripples turn to waves
Nicolas Baratte’s Hard rain report

Section 1: Vaporizing IT Global technology
4 [email protected] 20 September 2013
Vaporizing IT Cloud computing is more than an architectural shift, it’s a massive wave with profound implications for strategies, business models and the technology landscape. A new architecture decouples applications from infrastructure, providing increased agility and immense scalability at declining cost. As these factors lower barriers to accelerate innovation in social business, mobile and analytics (Big Data) use cases, the corporate view of technology shifts from operating expense to strategic asset. Consequently, we expect aggregate IT spending to continue to grow while share of wallet moves away from a bespoke infrastructure towards applications and solutions that generate business value.
Cloud computing represents the transition of information technology to a utility model. A new architecture is emerging that lowers costs and stimulates innovation. Business adoption has hit an inflection point as the preferred deployment model evolves towards the hybrid cloud, embracing both the public and private clouds. As infrastructure becomes commoditized, value migrates upwards to applications as custom development gains increasing strategic importance.
Cloud computing commoditizes technology infrastructure “from the bottom up”. It’s increasingly difficult for proprietary hardware, storage, networking and software vendors to charge premium “rents” in the face of software-defined automation and open-source alternatives.
Declining costs will grow IT spending in aggregate. The Jevons Paradox refers to the proposition that technology advancements that improve the efficiency of resource usage will raise (rather than reduce) the rate of consumption of that resource. We believe this applies to cloud computing.
Adoption of cloud architecture accelerates “creative destruction”. Incumbent vendors face existential threats from disruptive models: alternative delivery approaches (everything as a service); economics (pay as you go/subscription); architecture (PaaS); and development and intellectual-property (IP) paradigms (open source).
Infrastructure becomes a commodity game. Providers of cloud compute infrastructure (compute, storage and networking) will compete on economies of scale and supply-chain efficiencies.
It’s all about business value. Value migrates upwards from platform to applications as infrastructure components become automated. When infrastructure is a commodity, a greater proportion of the value comes from solving business problems. Apps rule the day through specialized knowledge, domain expertise and process automation.
What’s old is new again . . . really new In recent years, cloud computing has been the subject of massive hype and speculation; however, the impact of this shift is profound for the technology sector and economic activity overall. In 2013, cloud computing is being broadly embraced by the mainstream.
There are many aspects of the cloud delivery model that are a natural reiteration of prior computing models such as the time-sharing and resource-pooling characteristic of the mainframe era. However, it is the combination of declining costs, open standards, easy availability, increasingly powerful
Cloud computing industrializes technology
as applications are engines of business value
The mainstream is embracing cloud
computing
Cloud computing is a massive wave with
profound implications

Section 1: Vaporizing IT Global technology
20 September 2013 [email protected] 5
development and management technologies, and above all, the enormous expansion of connected devices that accelerate the transformative impact on the technology landscape, industries of all types and the economy at large.
Commoditization of infrastructure is moving up the stack as technologies and cloud architecture mature. The first cloud wave of public IaaS adoption disrupted the server-hardware market. The adoption of maturing PaaS solutions will further commoditize infrastructure software, particularly application servers and related middleware.
A new cloud software architecture causes a shift away from the enterprise IT economic model built around tightly coupled systems, proprietary software & hardware and extensive IT implementation, development, monitoring and support services towards a more open model built for massive scale. It emphasizes commodity hardware, open-source software and more automated processes.
The decoupling of apps from the underlying infrastructure alters competitive dynamics as advantages for vendors of cloud-infrastructure components are derived from economies of scale and efficient delivery models.
Cloud computing also enables the decoupling of business processes from the underlying technology stack, with profound ramifications for companies across industries. Those businesses that are most able to harness the cloud economic model in their favor will prosper, while those that fail to adapt to disruption will struggle. A key capability is code portability - the ability to run applications on public or private clouds with minimal changes.
Cloud computing alters usage and consumption of IT resources by transforming the enterprise technology model from dedicated “silos” to a sharing architecture. The term cloud computing encompasses more than public infrastructure services providers. Cloud computing also refers to an emerging management model for organizing computing resources. This has implications for the vendors that provide the various components of infrastructure as well, not just their technologies but also their business models.
Like all major technology transitions, cloud computing gives rise to winners and losers, although it’s still early days. Beneficiaries include internet/ecommerce vendors, tech startups, application software companies, consumers and forward-thinking businesses across industries. At risk are incumbent vendors of enterprise hardware, infrastructure software, IT implementation and support services and businesses subject to competitive or secular disruption.
The cloud industrializes computing to a utility model The IT industry is undergoing a process of industrialization around cloud-computing architecture, as the cloud model allows resources to be easily provisioned and paid for on a per-use model. We have previously discussed why cloud computing matters and some of the key aspects of what is becoming arguably the most significant paradigm shift in technology since the introduction of the worldwide web. The benefits of cloud delivery models are helping organizations of all sizes scale their investments, enjoy increased flexibility and spur innovation.
Simon Wardley, researcher at Computer Sciences Corporation’s (CSC) Leading Edge Forum, developed a model that illustrates how activities in new markets evolved due to competition on both the demand (user) and supply (vendor)
IT industry is undergoing a process of
industrialization around cloud computing
Transforming the enterprise tech model
from dedicated silos to a sharing architecture
Moving towards a more open model built for
massive scale
Cloud computing gives rise to winners and losers
Section 1: Vaporizing IT Global technology
6 [email protected] 20 September 2013
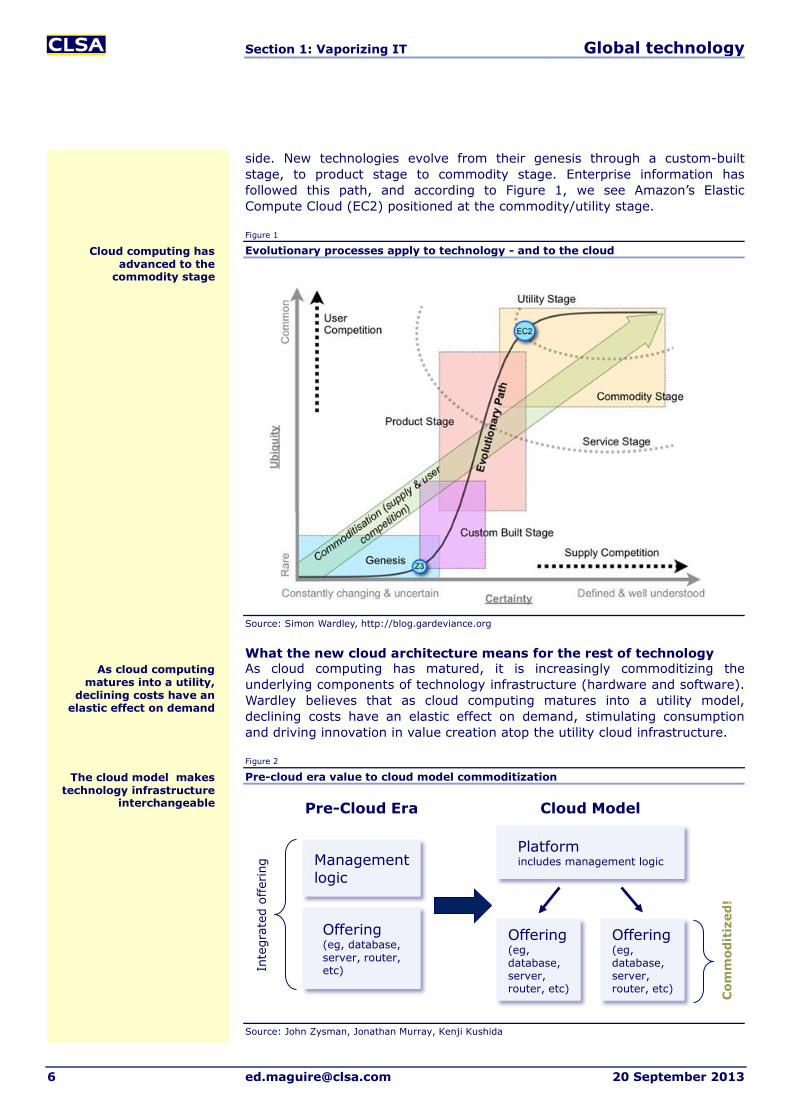
side. New technologies evolve from their genesis through a custom-built stage, to product stage to commodity stage. Enterprise information has followed this path, and according to Figure 1, we see Amazon’s Elastic Compute Cloud (EC2) positioned at the commodity/utility stage.
Figure 1
Evolutionary processes apply to technology - and to the cloud
Source: Simon Wardley, http://blog.gardeviance.org
What the new cloud architecture means for the rest of technology As cloud computing has matured, it is increasingly commoditizing the underlying components of technology infrastructure (hardware and software). Wardley believes that as cloud computing matures into a utility model, declining costs have an elastic effect on demand, stimulating consumption and driving innovation in value creation atop the utility cloud infrastructure.
Figure 2
Pre-cloud era value to cloud model commoditization
Source: John Zysman, Jonathan Murray, Kenji Kushida
Platformincludes management logic
Offering(eg, database, server, router, etc)
Management logic
Offering(eg, database, server, router, etc)
Offering(eg, database, server, router, etc)
Cloud ModelPre-Cloud Era
Inte
grat
ed o
ffer
ing
Com
mod
itiz
ed!
Cloud computing has advanced to the
commodity stage
As cloud computing matures into a utility,
declining costs have an elastic effect on demand
The cloud model makes technology infrastructure
interchangeable

Section 1: Vaporizing IT Global technology
20 September 2013 [email protected] 7
As we wrote with Jonathan Murray, John Zysman and Kenji Kushida in Clouducopia in January 2012: ‘Management functions within software are increasingly migrating to the platform rather than being encapsulated in individual components of datacenters, whether it be storage, networking or databases. This drives commoditization of the components.’
With industrialization comes commoditization, spurring innovation The evolution of the cloud-computing model reflects a steady process of maturity of enterprise IT. Commoditization occurs when users perceive competitive offerings as more or less similar commodities to be bought or sold - hence price becomes a determining factor in purchase decisions. Cloud-infrastructure services are increasingly commoditized, and a measure of this is the willingness to switch for small price differences. According to a Gartner survey in September 2012, buyers of public cloud services demonstrated early signs of price sensitivity particularly for IaaS. A survey of 556 organizations revealed that 19% of leading cloud adopters would change cloud providers for less than a 5% price difference.
As we discussed in our CLSA Blue Book Clouducopia, the rapid declines in the cost of compute power and storage give rise to a transition from eras of scarcity to an era of abundance, in the words of Jonathan Murray, EVP of strategy at Warner Music Group. When compute power was expensive and limited, and technical expertise at a premium, enterprise systems were typically custom built while software was architected to squeeze the maximum amount of performance out of hardware. With compute and storage costs declining, the abundance of resources allows a new generation of architecture to emerge. Over time this technology itself matures and fades from the foreground to become an enabling component of the next generation of applications.
Figure 3
Componentization of technologies
Source: Simon Wardley, http://blog.gardeviance.org
Computinginfrastructure
Electricity
Mechanicalcomponents
Large-scaleanalytics
IndustrialisedTransitionalUncharted
Genesis Custombuilt
Product(+ rental)
Commodity(+ utility)
Evolution
Invi
sib
leV
isib
le
Val
ue
chai
n
As the cloud commoditizes computing infrastructure,
this enables new types of apps to emerge
Buyers of public cloud services demonstrate
early signs of price sensitivity for IaaS
Management functions within software are
increasingly migrating to the platform
Section 1: Vaporizing IT Global technology
8 [email protected] 20 September 2013
The emerging cloud-computing architecture benefits from resource abundance, and software architectures can therefore afford to be more “wasteful”. Automation is typically highly process intensive, and with increasing computational power, it’s possible to perform higher-level functions and activities.
We’ve passed the inflection point There is growing evidence that cloud-computing adoption has experienced an inflection over the past year. CDW’s 2013 State of the Cloud Report found that 39% of organizations surveyed were implementing or maintaining cloud solutions in 2012, up from 28% in 2011. Much of this is anecdotal, as investors become increasingly aware of momentum around Amazon Web Services (AWS) on the IaaS side. SaaS vendors such as Salesforce.com, NetSuite and others continue to gain share of IT spending, while both Google Apps and Microsoft Office365 are seeing strong adoption trends. Below, we endeavor to frame the downstream impact of cloud computing.
Anecdotal evidence, a raft of recent surveys and industry commentary suggest that adoption of cloud-based services continues to see solid momentum. Cloud-computing adoption has accelerated over the past year, propelled by ongoing momentum in IaaS and virtualization as well as the personal use of cloud computing by IT professionals.
CDW’s report found that respondents expect to spend 23% of their organizations’ IT budgets using cloud resources and applications over the next year and 33% in four years. Seventy-three percent of IT professionals from companies that were implementing or maintaining clouds said their personal use of the cloud has influenced their recommendations about organizations moving to the cloud.
InformationWeek conducted its State of Cloud Computing Survey of 446 organizations with 50 or more employees in February 2013. Respondents reported increases from 2012 to 2013 in overall cloud usage from 33% to 40%, which was reflected in a jump in virtualization from 56% to 64% and IaaS from 27% to 30%. However, respondents reported a notable decline in the use of SaaS from 2012 to 2013 from 57% to 49% and in the use of PaaS from 42% to 36%. This survey suggests that enterprises are investing in cloud infrastructure, while backing off from early stage technologies like PaaS. However, more users report using PaaS than IaaS, reflecting ease of adoption. Mathew Lodge, VP of cloud services at VMware, noted roughly 40m virtual machines running on VMware as of February 2013 versus 2m IP addresses at AWS, according to InformationWeek.
From creative disruption, benefits emerge Cloud-computing infrastructure is disruptive on several levels. Virtualization improves hardware utilization and decouples workloads from the underlying physical hardware. Free open-source software is foundational to the cloud, often supplanting expensive proprietary software. The design of datacenters and servers is being open sourced and shared - Facebook has opened up its designs through Opencompute.org, where its cloud-computing peers and enterprises can freely benefit from best practices. We highlight the key aspects of cloud computing’s disruptive impact on the technology industry:
A wholesale economic model disrupts a bespoke industry. We point to the 2006 introduction of Amazon’s EC2 as the turning point where scalable compute and storage became available on a self-serve, pay-per-use model.
Even the design of datacenters and servers
is being open sourced and shared
Spending on the cloud is expected to increase as a proportion of IT budgets
There is growing evidence that cloud-computing
adoption has experienced an inflection
Businesses are investing in IaaS, but backing off PaaS until technologies
mature
The emerging cloud-computing architecture benefits from resource
abundance
Section 1: Vaporizing IT Global technology
20 September 2013 [email protected] 9
Open-source alternatives to proprietary technologies gain ground. The shift to cloud computing occurs as open source is increasingly viable for the enterprise.
Native cloud architecture commoditizes infrastructure hardware and software. A mature PaaS layer decouples the application logic from the underlying infrastructure and makes infrastructure components increasingly interchangeable and subject to the forces of commoditization.
Cloud computing facilitates a range of new use cases around social computing, mobile services and high-performance analytics, all of which have potential to create new economic value. Cloud computing reflects the industrialization of information technology. While this has disruptive effects on certain providers of infrastructure components and services, there are many beneficiaries of broad-based adoption of cloud computing.
Businesses benefit from lower costs for technology, IT staff and overhead, while gaining benefits of agility. Lowering the marginal cost of failure accelerates innovation and allows for rapid value creation. The extensible aspects of cloud computing allows businesses to scale online operations far more quickly than possible on their own, for less capital, with less risk.
Consumers benefit directly and indirectly from the availability of cloud-enabled applications. Cloud-enabled search, entertainment, information services, location-based services and applications democratize access to culture, knowledge and commerce. Dematerialization of physical goods (for instance, the digitization of books, music and video) into cloud-delivered services reduces friction around information flow.
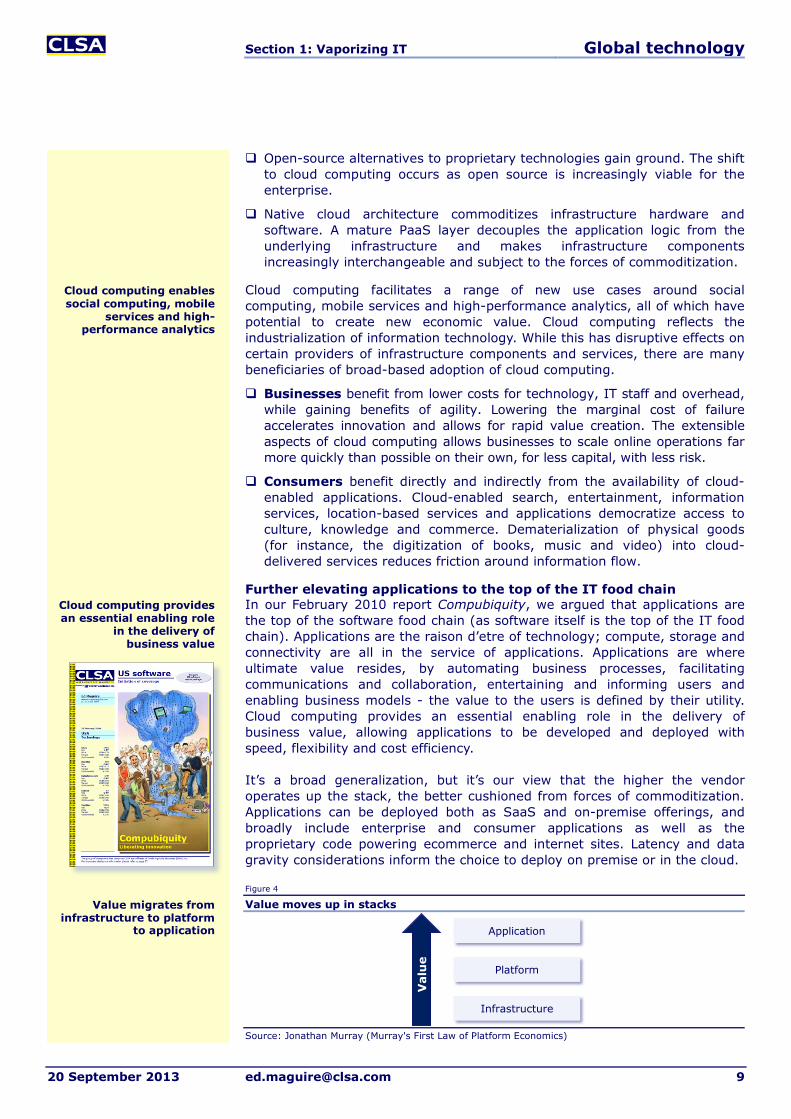
Further elevating applications to the top of the IT food chain In our February 2010 report Compubiquity, we argued that applications are the top of the software food chain (as software itself is the top of the IT food chain). Applications are the raison d’etre of technology; compute, storage and connectivity are all in the service of applications. Applications are where ultimate value resides, by automating business processes, facilitating communications and collaboration, entertaining and informing users and enabling business models - the value to the users is defined by their utility. Cloud computing provides an essential enabling role in the delivery of business value, allowing applications to be developed and deployed with speed, flexibility and cost efficiency.
It’s a broad generalization, but it’s our view that the higher the vendor operates up the stack, the better cushioned from forces of commoditization. Applications can be deployed both as SaaS and on-premise offerings, and broadly include enterprise and consumer applications as well as the proprietary code powering ecommerce and internet sites. Latency and data gravity considerations inform the choice to deploy on premise or in the cloud.
Figure 4
Value moves up in stacks
Source: Jonathan Murray (Murray's First Law of Platform Economics)
Application
Platform
Infrastructure
Val
ue
Cloud computing provides an essential enabling role
in the delivery of business value
Cloud computing enables social computing, mobile
services and high-performance analytics
Value migrates from infrastructure to platform
to application
Section 1: Vaporizing IT Global technology
10 [email protected] 20 September 2013
In many respects, infrastructure becomes a commodity. The interchangeability of compute, memory and storage changes industry dynamics for providers of infrastructure technologies. There are broader implications for the adoption of hybrid cloud strategies with a fully realized PaaS layer as this commoditizes higher levels of the software stack.
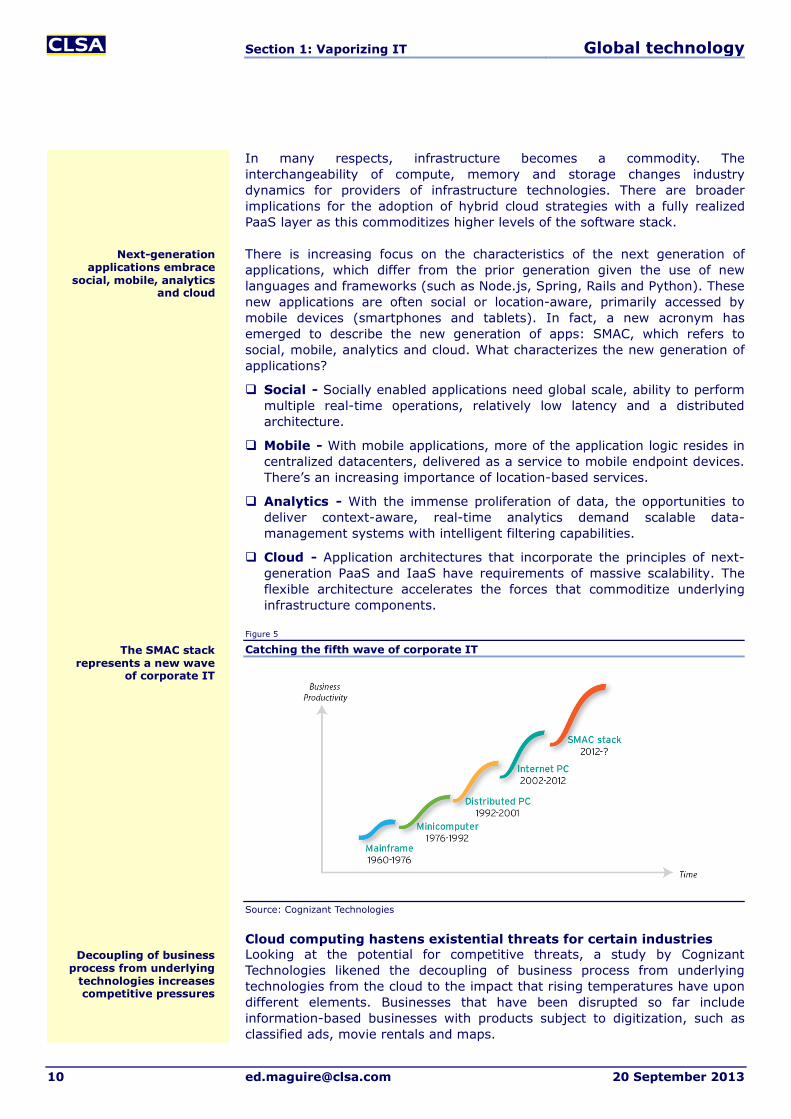
There is increasing focus on the characteristics of the next generation of applications, which differ from the prior generation given the use of new languages and frameworks (such as Node.js, Spring, Rails and Python). These new applications are often social or location-aware, primarily accessed by mobile devices (smartphones and tablets). In fact, a new acronym has emerged to describe the new generation of apps: SMAC, which refers to social, mobile, analytics and cloud. What characterizes the new generation of applications?
Social - Socially enabled applications need global scale, ability to perform multiple real-time operations, relatively low latency and a distributed architecture.
Mobile - With mobile applications, more of the application logic resides in centralized datacenters, delivered as a service to mobile endpoint devices. There’s an increasing importance of location-based services.
Analytics - With the immense proliferation of data, the opportunities to deliver context-aware, real-time analytics demand scalable data-management systems with intelligent filtering capabilities.
Cloud - Application architectures that incorporate the principles of next-generation PaaS and IaaS have requirements of massive scalability. The flexible architecture accelerates the forces that commoditize underlying infrastructure components.
Figure 5
Catching the fifth wave of corporate IT
Source: Cognizant Technologies
Cloud computing hastens existential threats for certain industries Looking at the potential for competitive threats, a study by Cognizant Technologies likened the decoupling of business process from underlying technologies from the cloud to the impact that rising temperatures have upon different elements. Businesses that have been disrupted so far include information-based businesses with products subject to digitization, such as classified ads, movie rentals and maps.
Next-generation applications embrace
social, mobile, analytics and cloud
The SMAC stack represents a new wave
of corporate IT
Decoupling of business process from underlying
technologies increases competitive pressures
Section 1: Vaporizing IT Global technology
20 September 2013 [email protected] 11
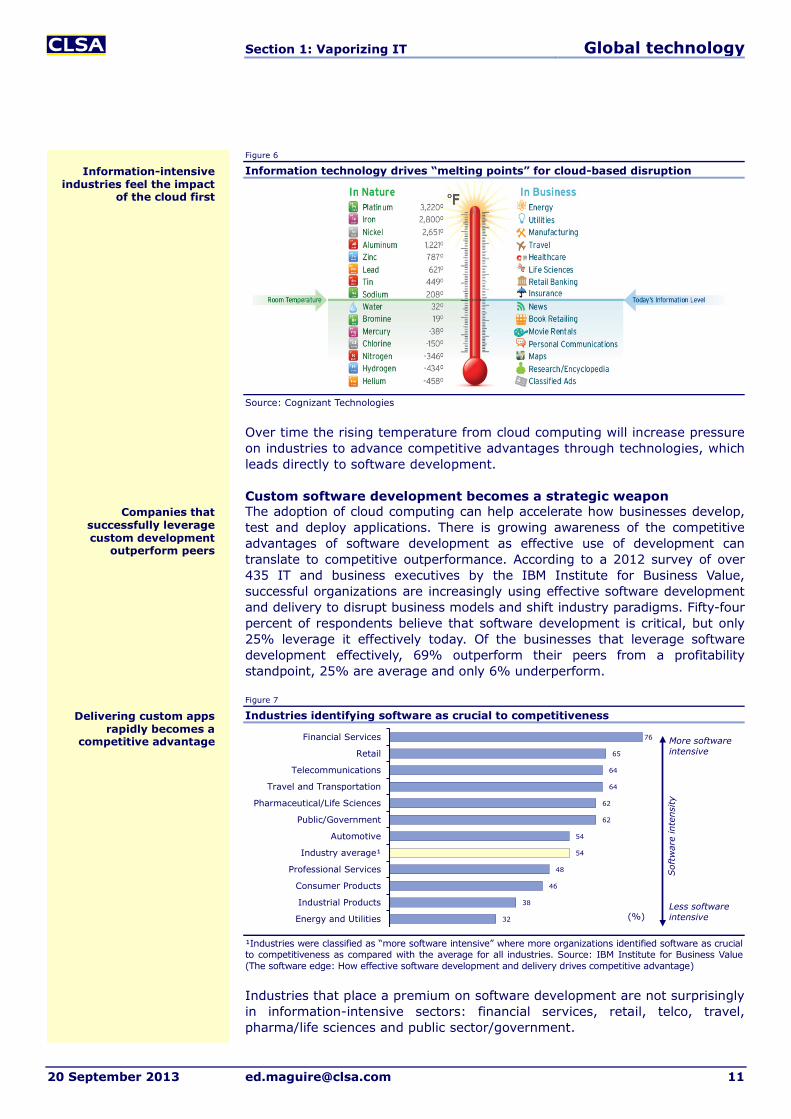
Figure 6
Information technology drives “melting points” for cloud-based disruption
Source: Cognizant Technologies
Over time the rising temperature from cloud computing will increase pressure on industries to advance competitive advantages through technologies, which leads directly to software development.
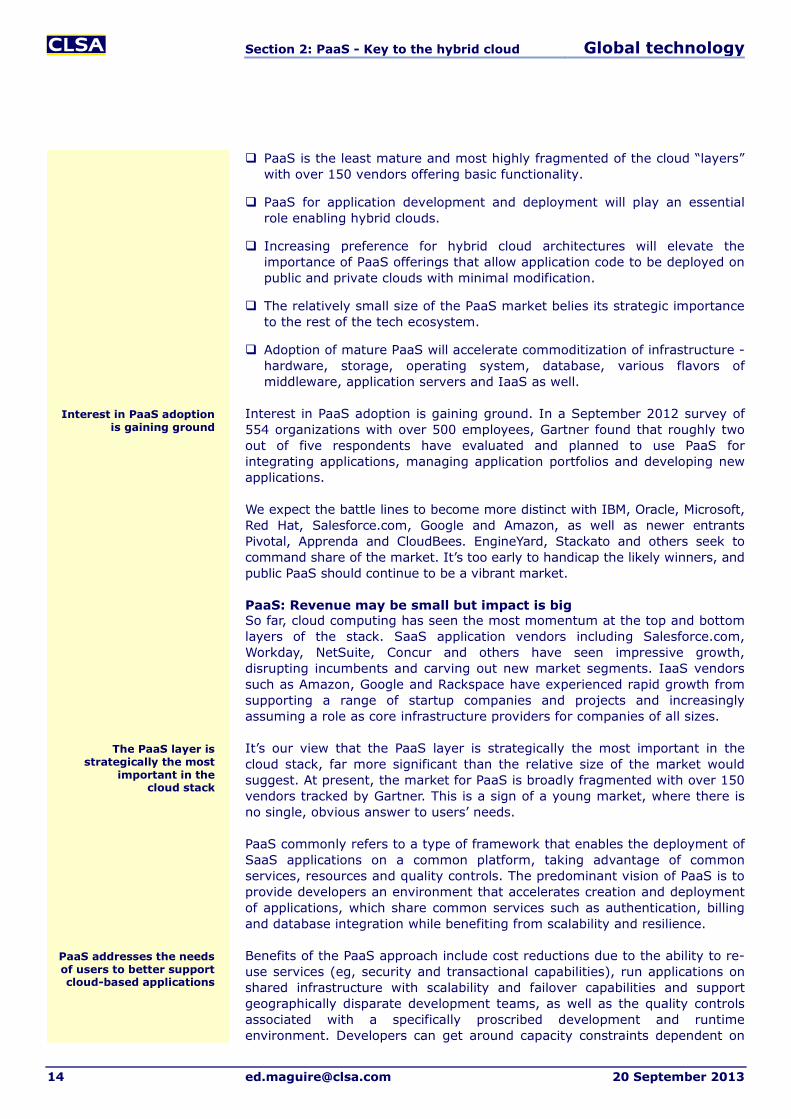
Custom software development becomes a strategic weapon The adoption of cloud computing can help accelerate how businesses develop, test and deploy applications. There is growing awareness of the competitive advantages of software development as effective use of development can translate to competitive outperformance. According to a 2012 survey of over 435 IT and business executives by the IBM Institute for Business Value, successful organizations are increasingly using effective software development and delivery to disrupt business models and shift industry paradigms. Fifty-four percent of respondents believe that software development is critical, but only 25% leverage it effectively today. Of the businesses that leverage software development effectively, 69% outperform their peers from a profitability standpoint, 25% are average and only 6% underperform.
Figure 7
Industries identifying software as crucial to competitiveness
¹Industries were classified as “more software intensive” where more organizations identified software as crucial to competitiveness as compared with the average for all industries. Source: IBM Institute for Business Value (The software edge: How effective software development and delivery drives competitive advantage)
Industries that place a premium on software development are not surprisingly in information-intensive sectors: financial services, retail, telco, travel, pharma/life sciences and public sector/government.
76
65
64
64
62
62
54
54
48
46
38
32
Financial Services
Retail
Telecommunications
Travel and Transportation
Pharmaceutical/Life Sciences
Public/Government
Automotive
Industry average¹
Professional Services
Consumer Products
Industrial Products
Energy and Utilities (%)
More software intensive
Less software intensive
Sof
twar
e in
tens
ity
Companies that successfully leverage custom development
outperform peers
Delivering custom apps rapidly becomes a
competitive advantage
Information-intensive industries feel the impact
of the cloud first

Section 1: Vaporizing IT Global technology
12 [email protected] 20 September 2013
The emergence of public cloud services like Amazon, Google AppEngine and others has also seen growing adoption of new programming languages and frameworks to support the next generation of applications. EMC, in a presentation in March 2013, forecast the number of applications built on the next-generation cloud architecture to increase from 6m in 2012 to almost 50m in 2016, while traditional applications will grow far more in absolute terms. It’s the new generation of applications that are poised for the most robust growth.
Figure 8
Next-generation cloud applications set to surge
Source: March 2013 EMC presentation citing IDC, Gartner, AWS Workload estimates
In a generational shift, traditional languages like C++, Java and JavaScript are being supplanted by Perl, Python, Ruby, Node.Js, Erlang and others. A notable aspect of the evolution of cloud stacks - the software that enables infrastructure as a service - is that leading technologies are mostly open source. OpenStack (a consortium of roughly 200 vendors spearheaded by RackSpace), CloudStack (purchased by Citrix and open sourced to the Apache Foundation), Eucalyptus and Amazon’s Elastic Beanstalk are open source. VMware remains the proprietary enterprise standard for cloud infrastructure.
A key consequence of adoption of the new cloud-computing architecture is that we will see more organizations elevate the importance of the software development function. We are seeing large investments pour into the development platforms for next-generation architecture. GE has invested US$100m in the EMC/VMware Pivotal spinout, which has brought together people (the Pivotal Labs development organization) with new technologies (the Spring framework, HAWQ database processing technology and Pivotal HD Hadoop distribution).
One of the most important players in the new paradigm is GitHub, a collaborative site for developers with over 3.4m users. The company has received US$100m from venture-capital firm Andreesen Horowitz, its largest single investment to date. GitHub was designed to make the processes around software code management (SCM) into a social, collaborative service. The site provides repositories and sharing functions that allow programmers to upload and download shareable open-source code that can be used to build and enhance applications and services. It is a cloud-based SCM service that helps teams of developers with the complexities and challenges of aggregating code, tracking changes and managing collaboration. Over the past couple of years, the site has become de riguer for startups and GitHub accounts are becoming the preeminent means for developers to show off their coding chops to the world. With a GitHub account, engineers have access to a cornucopia of open-source software, which when combined with low-cost cloud services provides a compelling catalyst for accelerating innovations.
It’s notable that leading cloud technologies are
mostly open source
It’s the new generation of applications that are
poised for the most robust growth
New generation of applications poised
for growth
One of the most important players in the new paradigm is GitHub
More organizations elevate the importance of the software development
function

Section 2: PaaS - Key to the hybrid cloud Global technology
20 September 2013 [email protected] 13
PaaS - Key to the hybrid cloud The Platform-as-a-Service market is far smaller than SaaS and IaaS, but size understates its strategic consequence. PaaS promises code portability, the ability to swap out infrastructure components as a commodity. It decouples applications and data from underlying infrastructure software and hardware, eroding the effective differentiation between vendors at lower levels of the stack. The market is highly fragmented, but has attracted growing focus from IT giants. Microsoft, Pivotal, Google and Salesforce.com lead this highly fragmented landscape and we expect consolidation of smaller vendors to accelerate mainstream adoption.
First-generation public clouds from Amazon, Google, Rackspace, Salesforce.com and Microsoft Azure have helped to validate viability of the model. Now traditional hosting companies, outsourcers and service providers target cloud-infrastructure services as a way to retain customers and drive new revenue growth. There is currently a battle over standards, as PaaS vendors battle for leadership in the critically important layer of the technology stack. Salesforce.com, VMware, Red Hat, Microsoft, Google, Amazon, IBM, Oracle and a host of private companies are all angling to capture a share of PaaS users, while ongoing debate and evolution of standards seek to balance ease of interoperability with “vendor lock-in.”
The distinction between public and private clouds has been meaningful in the early stages of the market, as most of what investors and users think of when they hear the term cloud computing is public clouds like Amazon’s EC2. Privately operated clouds that take advantage of the same architectural characteristic of extensibility, dynamic pooling of resources and massive scalability are the province of the largest, most leading-edge companies for now. Purely public or private cloud models can lend themselves to vendor lock-in because application code typically runs on a single IaaS.
Code portability defines the hybrid cloud Users and vendors are increasingly emphasizing the hybrid cloud model as the preferred model for businesses. The term applied loosely refers to deployment of applications on both public and private cloud infrastructure, but, in our view, the critical distinction of a hybrid model is the portability of application code to run on the private or public cloud with minimal modification.
When the application code can be shifted easily from across public clouds and into private clouds, this renders IaaS interchangeable. This commodifies the technology components that comprise IaaS, altering competitive market dynamics. A fully realized PaaS layer will be the key technology that renders IaaS a commodity, and it is here that we believe the most important (and most interesting) dynamics are at work. Investors should pay increasing attention to the merging PaaS market, with dynamics analogous to the application server/middleware wars at the early part of the last decade.
We highlight the critical role we believe PaaS will play in furthering the commoditization of infrastructure hardware, software and services. Investors may not fully appreciate the extent to which the competitive battles between PaaS vendors mirror prior battles over the application server. PaaS advances the decoupling of application logic from the underlying infrastructure - the benefits of PaaS include faster innovation, more efficient use of resources (developer, software and hardware) and better consistency across applications.
A critical distinction of a hybrid model is the
portability of application code
Purely public or private cloud model can lend themselves to vendor
lock-in
PaaS is a small but important catalyst for
technological disruption
First wave of public clouds sets the stage
for new battles
Section 2: PaaS - Key to the hybrid cloud Global technology
14 [email protected] 20 September 2013
PaaS is the least mature and most highly fragmented of the cloud “layers” with over 150 vendors offering basic functionality.
PaaS for application development and deployment will play an essential role enabling hybrid clouds.
Increasing preference for hybrid cloud architectures will elevate the importance of PaaS offerings that allow application code to be deployed on public and private clouds with minimal modification.
The relatively small size of the PaaS market belies its strategic importance to the rest of the tech ecosystem.
Adoption of mature PaaS will accelerate commoditization of infrastructure - hardware, storage, operating system, database, various flavors of middleware, application servers and IaaS as well.
Interest in PaaS adoption is gaining ground. In a September 2012 survey of 554 organizations with over 500 employees, Gartner found that roughly two out of five respondents have evaluated and planned to use PaaS for integrating applications, managing application portfolios and developing new applications.
We expect the battle lines to become more distinct with IBM, Oracle, Microsoft, Red Hat, Salesforce.com, Google and Amazon, as well as newer entrants Pivotal, Apprenda and CloudBees. EngineYard, Stackato and others seek to command share of the market. It’s too early to handicap the likely winners, and public PaaS should continue to be a vibrant market.
PaaS: Revenue may be small but impact is big So far, cloud computing has seen the most momentum at the top and bottom layers of the stack. SaaS application vendors including Salesforce.com, Workday, NetSuite, Concur and others have seen impressive growth, disrupting incumbents and carving out new market segments. IaaS vendors such as Amazon, Google and Rackspace have experienced rapid growth from supporting a range of startup companies and projects and increasingly assuming a role as core infrastructure providers for companies of all sizes.
It’s our view that the PaaS layer is strategically the most important in the cloud stack, far more significant than the relative size of the market would suggest. At present, the market for PaaS is broadly fragmented with over 150 vendors tracked by Gartner. This is a sign of a young market, where there is no single, obvious answer to users’ needs.
PaaS commonly refers to a type of framework that enables the deployment of SaaS applications on a common platform, taking advantage of common services, resources and quality controls. The predominant vision of PaaS is to provide developers an environment that accelerates creation and deployment of applications, which share common services such as authentication, billing and database integration while benefiting from scalability and resilience.
Benefits of the PaaS approach include cost reductions due to the ability to re-use services (eg, security and transactional capabilities), run applications on shared infrastructure with scalability and failover capabilities and support geographically disparate development teams, as well as the quality controls associated with a specifically proscribed development and runtime environment. Developers can get around capacity constraints dependent on
PaaS addresses the needs of users to better support cloud-based applications
Interest in PaaS adoption is gaining ground
The PaaS layer is strategically the most
important in the cloud stack
Section 2: PaaS - Key to the hybrid cloud Global technology
20 September 2013 [email protected] 15
having to forecast requirements accurately. Benefits include better utilization of infrastructure, significant reductions in hardware costs, notably improved uptime and the ability to leverage common components.
SaaS applications address horizontal disciplines (eg, sales or service), specialized functions (eg, expense management, HR, elearning or IT functions) or industry-specific needs (of which numerous examples abound among public and private vendors). SaaS applications are effectively a natural combination of the application and hosted-services market, but their value to customers lies in the efficacy of the solution based on business needs. As such, the complete value proposition is inextricably linked with business process and domain specialization. SaaS vendors manage all of the aspects of the technology stack for the customer, who accesses application functionality over the internet.
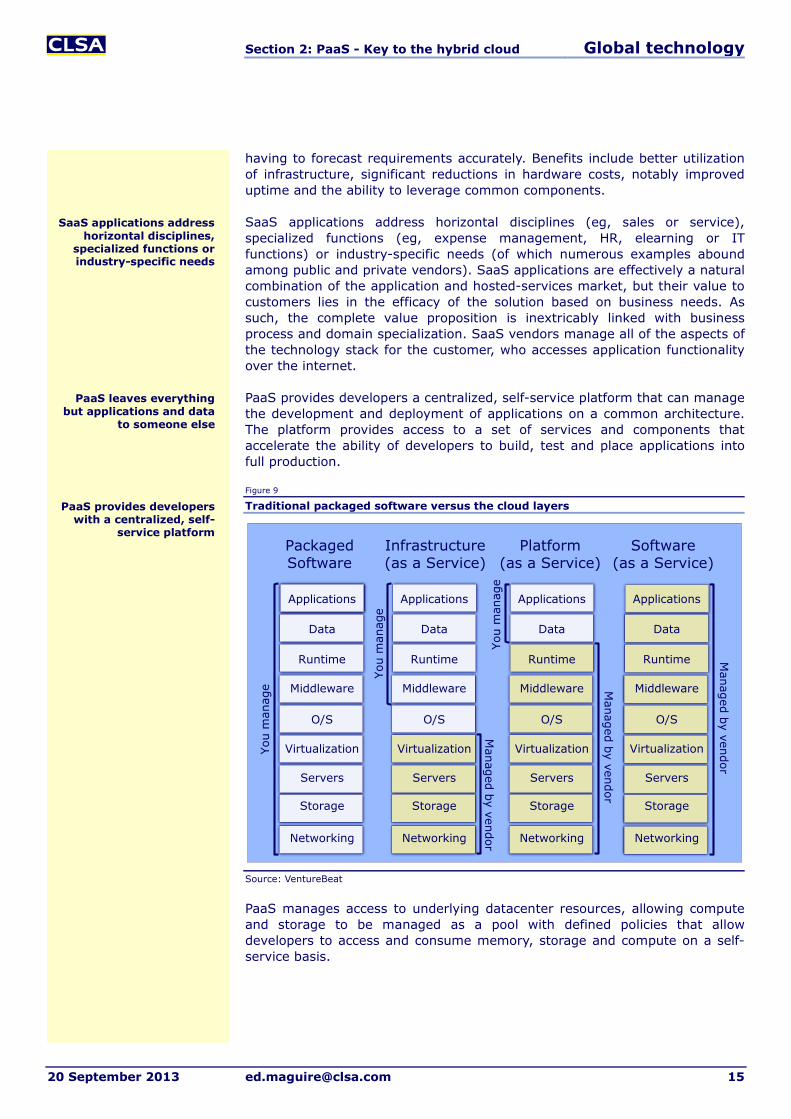
PaaS provides developers a centralized, self-service platform that can manage the development and deployment of applications on a common architecture. The platform provides access to a set of services and components that accelerate the ability of developers to build, test and place applications into full production.
Figure 9
Traditional packaged software versus the cloud layers
Source: VentureBeat
PaaS manages access to underlying datacenter resources, allowing compute and storage to be managed as a pool with defined policies that allow developers to access and consume memory, storage and compute on a self-service basis.
Applications
Data
Runtime
Middleware
O/S
Virtualization
Servers
Storage
Networking
You
man
age
Managed by vendor
Managed by vendor
Managed by vendor
PackagedSoftware
Infrastructure(as a Service)
Platform(as a Service)
Software(as a Service)
Applications
Data
Runtime
Middleware
O/S
Virtualization
Servers
Storage
Networking
Applications
Data
Runtime
Middleware
O/S
Virtualization
Servers
Storage
Networking
Applications
Data
Runtime
Middleware
O/S
Virtualization
Servers
Storage
Networking
You
man
age
You
man
age
SaaS applications address horizontal disciplines,
specialized functions or industry-specific needs
PaaS provides developers with a centralized, self-
service platform
PaaS leaves everything but applications and data
to someone else

Section 2: PaaS - Key to the hybrid cloud Global technology
16 [email protected] 20 September 2013
Figure 10
Characteristics of IaaS versus PaaS
IaaS PaaS
Virtual machines (VMs) and storage Middleware in the cloud
Rapid datacenter resource provisioning and delegated hardware management
Rapid application development, deployment and change; fully delegated datacenter responsibility
Coarse-grained elasticity and payment Fine-grained elasticity and payment
Developer responsible for platform and application stack as well as his code
Developer is responsible only for his code
Shared-hardware multitenancy Shared processing, shared database or shared-everything multitenancy
Portability at the VM level Little or no portability
You can run anything you want within VM (provided it is technically feasible and you can get a cloud license)
What you can run is restricted to what the PaaS provider offers
Source: Gartner
PaaS setups tend to sit on top of IaaS offerings. These can be maintained on platforms from the likes of Amazon, Google or Microsoft or on IaaS platforms like VMware’s VSphere or OpenStack.
Figure 11
Conceptual view of cloud-computing architecture
Source: Microsoft
An advantage of decoupling the application platform from the underlying infrastructure is that businesses can use different vendors for platform and infrastructure in many cases. For instance, Heroku and EngineYard run on AWS, while CloudFoundry and CloudBees enable developers to run their apps on either OpenStack or VMware VSphere despite being priced on a per-use basis. The cloud-computing models abstract resources and automate many of the functions that would previously require custom coding.
PaaS can provide self service, services
management, orchestration and
management
PaaS offers higher level functionality than IaaS,
with more restrictions on what runs on the platform
Businesses can use different vendors for
platform and infrastructure

Section 2: PaaS - Key to the hybrid cloud Global technology
20 September 2013 [email protected] 17
Developers are the key to the PaaS market In contrast to SaaS (which targets end users and business) and IaaS (which targets datacenter/infrastructure managers), the PaaS market targets developers. We see significant growth in the category as users seek to leverage increasing capabilities to support cloud-based applications, while providers (both IaaS and SaaS) seek to engage customers more deeply, achieving the practical objectives of lock-in without the negative implications.
Businesses are using PaaS in order to simplify the processes involved with managing hardware and software, so that they can develop and bring to market applications and innovation more quickly. Speed to market is the most important benefit of PaaS; companies that use PaaS are able to save time managing infrastructure and basic services to bring applications live in a fraction of the time.
A diverse, shifting landscape Gartner identifies over 150 vendors with offerings that directly or indirectly target different categories of PaaS. Gartner tracks over a dozen segments. These functions include application platform services, application lifecycle management services, integration services, analytic services, managed file transfer services, database services and others. Cloud application platform services (aPaaS) offer functions similar to application servers, which intermediate between application logic and infrastructure (server, storage and database). We are primarily concerned with application platform services that support custom applications.
Gartner estimates that worldwide PaaS revenue reached US$1.2bn in 2012, an increase from US$900m in 2011. It forecasts the market to reach US$3.5bn by 2017, a Cagr of 24%.
Figure 12
PaaS forecast, 2011-17
Note: AD - Application Development; AIM - Application Infrastructure and Middleware; BI - Business Intelligence Platform; DBMS - Database Management Systems. Source: Gartner
The number of vendors and fragmentation are an indication of a young market as there’s no obvious answer to the market need. At this point, the market for PaaS consists of a number of smaller subsegments including application development/application lifecycle management PaaS; application PaaS, business process management PaaS, integration PaaS and other
0.0
0.5
1.0
1.5
2.0
2.5
3.0
3.5
4.0
2011 2012 2013 2014 2015 2016 2017
(US$bn) AD AIM BI DBMS
The PaaS market targets developers
Gartner identifies over 150 vendors with
offerings that target different categories
of PaaS
Gartner estimates that worldwide PaaS revenue
reached US$1.2bn in 2012
Shakeouts and consolidation likely to
characterize the market in the near term
Section 2: PaaS - Key to the hybrid cloud Global technology
18 [email protected] 20 September 2013
functions. Over time we expect PaaS to be subsumed into broader offerings, which is likely to include PaaS suites and hosted development platforms.
Leading players in traditional application PaaS remain Salesforce.com (both Force.com and Heroku), Microsoft’s Windows Azure Services Platform and Google’s App Engine. There are also privately held providers including CloudBees, EngineYard, Stackato (based on Cloud Foundry), Apprenda (primarily .NET focused), Appistry (Hadoop analytics), AppFog (recently acquired by Savvis) and others. We would expect shakeouts and consolidation to characterize the market in the near term, as a crowded landscape typical of nascent markets is unsustainable over the medium term. We expect competition to remain fierce as cloud stack providers seek their own ways to lock in customers.
Users expect hybrid cloud model to predominate According to the North Bridge/Giga Om 2013 Future of Cloud Computing Survey, public cloud use is expected to decline relatively from 39% to 32% in five years, while hybrid clouds increase as a proportion of all uses from 27% to 43%. Today, public clouds account for 39% of usage, with 27% hybrid and 34% private, but in five years hybrid should be the most prominent model at 43% versus 32% public and 25% private.
The expectation that enterprises will increasingly prefer a hybrid cloud model over pure public or private approaches has a few key implications. Application portability (the ability to run applications on a public or private cloud depending on business requirements) will become a critical capability for hybrid PaaS offerings. This may leave public-IaaS-only vendors such as Heroku and Google App Engine at a modest disadvantage.
Public PaaS versus private PaaS - Towards hybrid PaaS The first generation of PaaS offerings was predominantly public - Heroku and Force.com (Salesforce.com), Engine Yard and Google App Engine all offered developers the ability to write applications without worrying about the underlying infrastructure. However, public PaaS failed to address enterprise concerns over security and governance, and hence did not see significant adoption. Deploying applications on a hybrid-enabled PaaS middleware layer allows users to move applications as they see fit - from one public cloud to another, or behind the firewall on a cloud-based architecture.
According to David Linthicum of GigaOm, advantages to private PaaS include:
A common self-service application development platform allows developers to design, test and deploy applications within an environment that provides consistency, control and quality assurance.
Developers can access datacenter resources more effectively. PaaS handles server utilization by helping to abstract the application logic from the underlying server and storage. This improves utilization and efficiency of hardware and results in more effective operations.
Developers can utilize their existing skill sets while taking advantage of new management capabilities around application management and datacenter resource services.
Initial PaaS products primarily supported application server capabilities, but the market has broadened to encompass other middleware functions. The conditions are in place for accelerating innovation in custom applications, as increasing sophistication and ease of use of development tools and backend
The barriers to develop, deploy and scale custom
applications have dramatically decreased
Hybrid clouds are expected to increase as a
proportion from 27% to 43% in five years
Applications on hybrid-enabled PaaS can more
easily move between public and private cloud

Section 2: PaaS - Key to the hybrid cloud Global technology
20 September 2013 [email protected] 19
services available from PaaS providers obviate the need for developers and startups to invest in their own IT infrastructure. Programming languages and tools continue to evolve and are more accessible. Various ROI studies for PaaS (most notably an IDC analysis of Force.com) have shown up to 75% reduction in development time and four-five times improvement in payback from hosted development and deployment models.
Balancing control and openness, focus and heterogeneity Among the various approaches to PaaS, users must weigh the benefits and disadvantages of closed versus open models. Salesforce.com’s Force.com leveraged the company’s underlying infrastructure and services, which included vetting of code to run on the platform (analogous to Apple’s AppStore process). The limitation was that developers had to use Salesforce.com’s Application Exchange (APEX) programming language, a variant of Java but a specialized skill set nonetheless. While the vision of an application exchange built on the Force.com platform was sound, the APEX requirements limited adoption by developers, leading Salesforce.com into a short-lived partnership with VMware to harness the Java developers that used its open-source SpringSource framework. The alliance fizzled; Salesforce.com bought Heroku, a Ruby-based platform that has since extended to other languages (eg, Java, Python, Node.js and others), while VMware launched CloudFoundry, an open-source platform that supports several languages.
Battle to control the platform - Legacy versus cloud native It is critically important to control the platform - the infrastructure, standards, etc. Every application is written to the middleware, and the PaaS layer is evolving to be a high-stakes battle for developer share.
Figure 13
On-premises application platforms - Magic Quadrant
Source: Gartner
In the late 1990s and early 2000s, there was a life and death battle between Microsoft, BEA Systems, IBM, Sun and others for the platform architecture. Microsoft had .NET and everyone else had a mix of Java, CORBA and object-request brokers. These vendors united around Java Enterprise Edition (JavaEE) to successfully build a common front against Microsoft.
Users must weigh the benefits and
disadvantages of closed versus open models
IBM, Oracle, Microsoft and Red Hat are on-premise application
platform incumbents
It is critically important to control the platform

Section 2: PaaS - Key to the hybrid cloud Global technology
20 [email protected] 20 September 2013
A new generation of innovation goes cloud native There is a subtle, but distinct difference in PaaS offerings between cloud based (where existing technologies are deployed on a cloud underneath) and cloud native (where middleware is designed for the cloud). Cloud-native technologies are engineered to be elastic, to use in-memory computing and other capabilities. Customers are migrating to the cloud because they expect high productivity and ease of use. However, existing languages like Java and C# programming have lower productivity in the cloud. Most of the innovation is no longer going to JavaEE or .NET, but these skill sets are still in short supply among traditional enterprises.
Initially the cloud-native platforms are all proprietary. Force.com. Rollbase and Zoho Creator are key examples of this. One vendor, LongJump, was similar to Force.com and has been acquired by Software AG. Rollbase is another cloud-native PaaS vendor acquired by Progress Software. Both LongJump and Rollbase are cloud-native platforms currently in the hands of vendors with more resources. They now have sales channels. Tibco is also moving in this direction, moving through organic development. IBM has been working on a strategic project with WebSphere to create a new technology stack designed specifically for the cloud, and in the interim has launched its own BlueMix project focused on building solutions around CloudFoundry and OpenStack. Google and Red Hat created a partnership around a project called CapeDwarf, which is focused on creating a standard for cloud-native platforms. This project aims to provide on-premise software running on JBoss with application program interfaces (APIs) compatible with AppEngine that can be modified to become more cloud native.
Cloud-enabled (and backward compatible) versus cloud native Over the past year, all of the major enterprise Java platform vendors have launched versions of PaaS. IBM, Oracle, SAP, Red Hat and VMware (through its Pivotal spinoff) have all launched cloud application infrastructure services based on core Java technologies. Oracle, SAP and Red Hat use Java and JavaEE as primary models, while CloudFoundry uses the Spring framework.
Red Hat’s OpenShift and Pivotal’s Cloud Foundry are squaring off to compete directly in the market as independent PaaS offerings. We see one of these two projects emerging as a potential challenge to the proprietary offerings seen elsewhere. Red Hat’s OpenShift is a PaaS offering that supports Java, Perl, PHP, Python and Ruby. The technology is not yet open sourced, but there are plans to open up the platform. For now, OpenShift is focused on public clouds, though there are plans to support on-premise deployments. VMware’s Cloud emerged from the company’s SpringSource acquisition, has been open sourced and currently supports Java, .NET, Ruby, Scala, Node.js, PHP and Python. At this point Cloud Foundry appears to be seeing the strongest momentum among the independent PaaS projects, but Red Hat is investing in technology and partners around its own project.
The key consideration for the Java-leading vendors (as well as Microsoft’s .NET-based Azure Platform Services) is backward compatibility, and this is largely a defensive measure. The leading vendors will be able to benefit from a “long tail” in business usage of Java, .NET, JBoss and WebSphere - these technologies will not go away before the CIOs retire.
Is backward-compatible PaaS the equivalent of “screen-scraping”? Our discussions with industry analysts reveal the view early on that cloud adoption is “radio on TV” – like old wine in new bottles. Older applications are in an introductory stage, like screen scraping, so backward compatibility is
Red Hat’s OpenShift and VMware’s Cloud Foundry
are squaring off
Initially the cloud-native platforms are all
proprietary
Existing languages like Java and C# programming
have lower productivity in the cloud

Section 2: PaaS - Key to the hybrid cloud Global technology
20 September 2013 [email protected] 21
essentially an emulation. It’s likely that over time we will see backward compatibility give way to a new architecture.
According to Gartner, PaaS vendors that are locked into supporting JavaEE will be challenged. IBM has four big customers, Oracle’s PaaS is now just generally available and the company’s focus is more on hosting, and Red Hat just recently became generally available. In terms of consolidation, it’s likely that the smaller companies will be acquired on the merits of their technology. The big vendors like HP, Dell and the telecoms will be acquirers of PaaS. Clearwire/Savvis acquired AppFog, which was reportedly close to a fire sale.
Cloud agnostic or integrated stack? Still evolving PaaS providers are distinguished by whether they are locked into an underlying IaaS platform (as is the case with Force.com, Google AppEngine, Amazon’s Elastic Beanstalk and Windows Azure) or cloud agnostic (in the case of VMware/Pivotal’s CloudFoundry, Red Hat’s OpenShift and independent providers such as CloudBees and others). There are advantages to each approach: offerings tied to an underlying platform provide better integration with underlying compute, management and storage services, while the cloud-agnostic platforms theoretically provide users the option to choose the most appropriate IaaS provider.
Even more so than with IaaS, lock-in concerns around PaaS are top of mind for users. In many respects, there is no way to get around reliance on proprietary programming languages or service interfaces; this is inherent to the nature of applications. Additionally, the ability to shift applications between platforms is limited in many cases. That said, this dynamic is not that much different from the on-premises development model (where .NET and Java development platforms have competed). However, the cost and reliability benefits offered by leading PaaS providers nevertheless provide an attractive solution in light of the economic downturn.
ISV success will determine the winners in PaaS Success with independent software vendors (ISVs) will be a key indicator of traction. To be a leader, the PaaS provider needs a healthy SaaS ecosystem and one of the predictors for success is the ability to attract a healthy ecosystem of partners and applications running on the platform. Salesforce.com was early to the market with Force.com and its proprietary platform. We note that Salesforce.com already has several companies running on its platforms that are writing large checks, with management alluding on recent earnings calls that some may potentially be considering IPOs. However, we’d note that Salesforce.com’s technology does not work on premises and this could limit relevance as a broad platform provider. AWS currently supports a broad range of startups and established companies running on its services, including FourSquare, Pinterest and Netflix.
An emerging concern over PaaS is potential for
vendor lock-in
Success with ISVs will be a key indicator
of traction
PaaS vendors that are locked into supporting
JavaEE will be challenged
Section 3: The cloud as an economic catalyst Global technology
22 [email protected] 20 September 2013
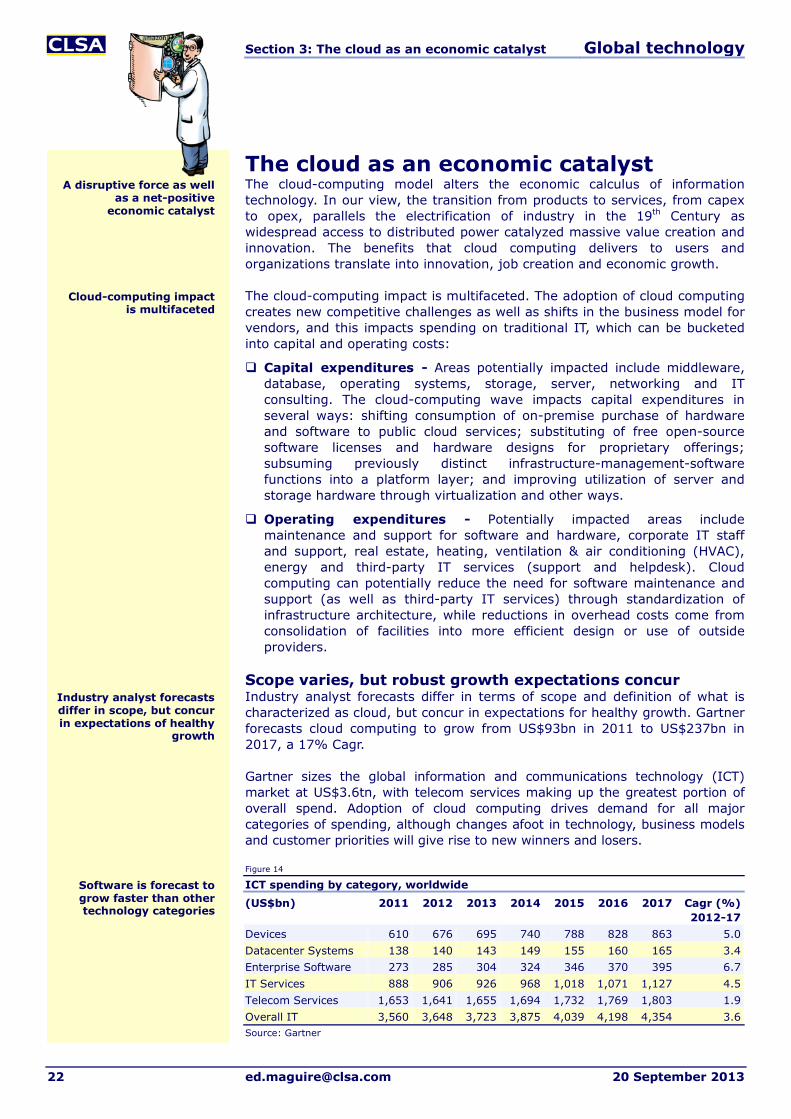
The cloud as an economic catalyst The cloud-computing model alters the economic calculus of information technology. In our view, the transition from products to services, from capex to opex, parallels the electrification of industry in the 19th Century as widespread access to distributed power catalyzed massive value creation and innovation. The benefits that cloud computing delivers to users and organizations translate into innovation, job creation and economic growth.
The cloud-computing impact is multifaceted. The adoption of cloud computing creates new competitive challenges as well as shifts in the business model for vendors, and this impacts spending on traditional IT, which can be bucketed into capital and operating costs:
Capital expenditures - Areas potentially impacted include middleware, database, operating systems, storage, server, networking and IT consulting. The cloud-computing wave impacts capital expenditures in several ways: shifting consumption of on-premise purchase of hardware and software to public cloud services; substituting of free open-source software licenses and hardware designs for proprietary offerings; subsuming previously distinct infrastructure-management-software functions into a platform layer; and improving utilization of server and storage hardware through virtualization and other ways.
Operating expenditures - Potentially impacted areas include maintenance and support for software and hardware, corporate IT staff and support, real estate, heating, ventilation & air conditioning (HVAC), energy and third-party IT services (support and helpdesk). Cloud computing can potentially reduce the need for software maintenance and support (as well as third-party IT services) through standardization of infrastructure architecture, while reductions in overhead costs come from consolidation of facilities into more efficient design or use of outside providers.
Scope varies, but robust growth expectations concur Industry analyst forecasts differ in terms of scope and definition of what is characterized as cloud, but concur in expectations for healthy growth. Gartner forecasts cloud computing to grow from US$93bn in 2011 to US$237bn in 2017, a 17% Cagr.
Gartner sizes the global information and communications technology (ICT) market at US$3.6tn, with telecom services making up the greatest portion of overall spend. Adoption of cloud computing drives demand for all major categories of spending, although changes afoot in technology, business models and customer priorities will give rise to new winners and losers.
Figure 14
ICT spending by category, worldwide (US$bn) 2011 2012 2013 2014 2015 2016 2017 Cagr (%)
2012-17 Devices 610 676 695 740 788 828 863 5.0 Datacenter Systems 138 140 143 149 155 160 165 3.4 Enterprise Software 273 285 304 324 346 370 395 6.7 IT Services 888 906 926 968 1,018 1,071 1,127 4.5 Telecom Services 1,653 1,641 1,655 1,694 1,732 1,769 1,803 1.9 Overall IT 3,560 3,648 3,723 3,875 4,039 4,198 4,354 3.6 Source: Gartner
A disruptive force as well as a net-positive
economic catalyst
Industry analyst forecasts differ in scope, but concur in expectations of healthy
growth
Cloud-computing impact is multifaceted
Software is forecast to grow faster than other technology categories
Section 3: The cloud as an economic catalyst Global technology
20 September 2013 [email protected] 23
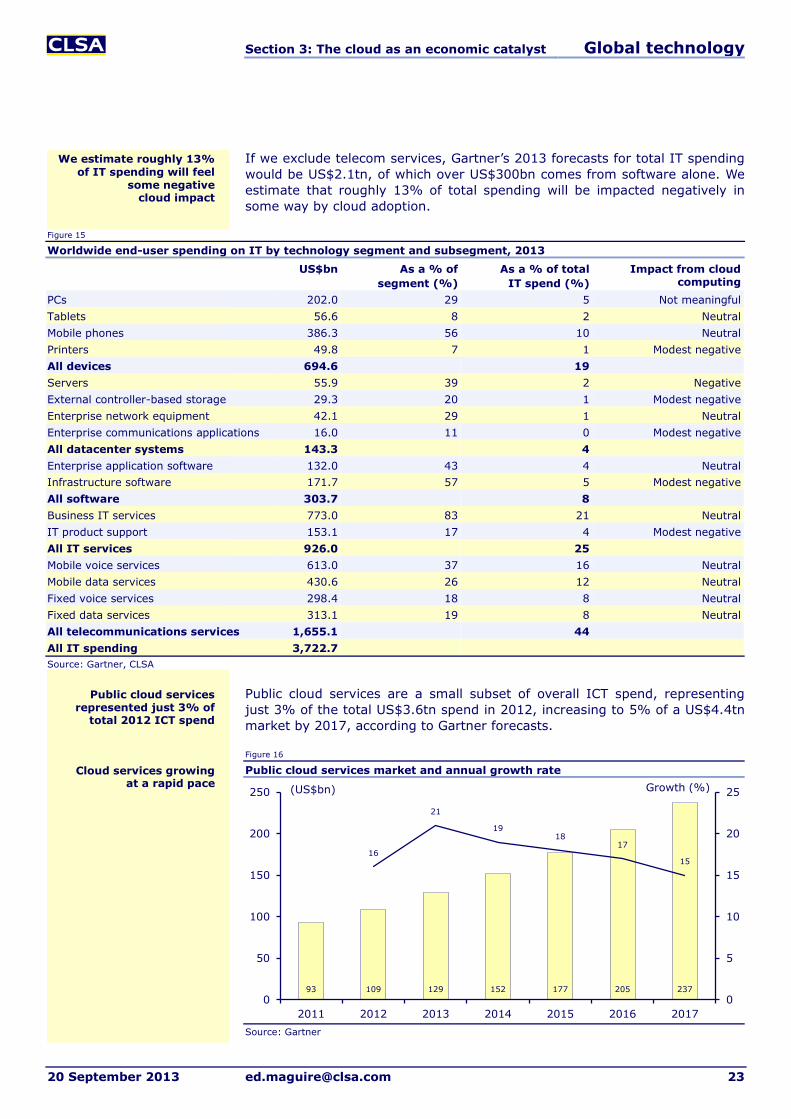
If we exclude telecom services, Gartner’s 2013 forecasts for total IT spending would be US$2.1tn, of which over US$300bn comes from software alone. We estimate that roughly 13% of total spending will be impacted negatively in some way by cloud adoption.
Figure 15
Worldwide end-user spending on IT by technology segment and subsegment, 2013
US$bn As a % of segment (%)
As a % of total IT spend (%)
Impact from cloud computing
PCs 202.0 29 5 Not meaningful Tablets 56.6 8 2 Neutral Mobile phones 386.3 56 10 Neutral Printers 49.8 7 1 Modest negative All devices 694.6 19 Servers 55.9 39 2 Negative External controller-based storage 29.3 20 1 Modest negative Enterprise network equipment 42.1 29 1 Neutral Enterprise communications applications 16.0 11 0 Modest negative All datacenter systems 143.3 4 Enterprise application software 132.0 43 4 Neutral Infrastructure software 171.7 57 5 Modest negative All software 303.7 8 Business IT services 773.0 83 21 Neutral IT product support 153.1 17 4 Modest negative All IT services 926.0 25 Mobile voice services 613.0 37 16 Neutral Mobile data services 430.6 26 12 Neutral Fixed voice services 298.4 18 8 Neutral Fixed data services 313.1 19 8 Neutral All telecommunications services 1,655.1 44 All IT spending 3,722.7 Source: Gartner, CLSA
Public cloud services are a small subset of overall ICT spend, representing just 3% of the total US$3.6tn spend in 2012, increasing to 5% of a US$4.4tn market by 2017, according to Gartner forecasts.
Figure 16
Public cloud services market and annual growth rate
Source: Gartner
93 109 129 152 177 205 237
16
21
1918
17
15
0
5
10
15
20
25
0
50
100
150
200
250
2011 2012 2013 2014 2015 2016 2017
(US$bn) Growth (%)
Public cloud services represented just 3% of
total 2012 ICT spend
We estimate roughly 13% of IT spending will feel
some negative cloud impact
Cloud services growing at a rapid pace

Section 3: The cloud as an economic catalyst Global technology
24 [email protected] 20 September 2013
Cloud application services (SaaS) will continue to be the largest proportion of public cloud services, forecast to grow from US$16.2bn in 2012 to US$27.8bn in 2017. CRM, enterprise resource planning (ERP) and collaboration applications are the largest SaaS segment, with the most robust growth expected from digital content creation, office suites and business intelligence platforms. As the most mature segment of cloud services, SaaS in 2012 accounted for 69% of the public cloud services market; Gartner expects this to decline to 53% by 2017 as IaaS becomes a larger portion of the market (and custom-build applications increasingly go into production).
Figure 17
Market-size forecast for IaaS, PaaS and SaaS
Source: Gartner
Gartner expects cloud application infrastructure services (PaaS) to grow in line with the market, increasing from US$1.2bn in 2012 to US$3.6bn in 2017, a Cagr of 23.5%. Overall PaaS is likely to remain roughly 5% of public cloud services through 2017. Cloud system infrastructure services (IaaS) should grow at the most robust rate, increasing from US$6.2bn in 2012 to US$30.6bn in 2017, a Cagr of 37.8%. IaaS should jump from 26% of public cloud services in 2012 to 43% by 2017.
Measuring return on the cloud Quantifying the economics of cloud computing is an inexact discipline; there are so many variable inputs that defining payback is necessarily situation-specific. Calculations need to incorporate not just cost factors, but also the creation of incremental value (whether in the form of additional revenue, new innovation, competitive advantages, etc). Nonetheless, there are a few key measures that businesses in particular must assess to determine the economic rationale for a cloud investment.
According to CDW’s 2013 State of the Cloud Report Survey (comprising 1,242 IT professionals including 479 organizations implementing or maintaining cloud computing), respondents are currently saving an average of 13% of their organizations’ IT budgets using cloud resources and applications, with savings expected to increase to 17% in one year and 25% in four years.
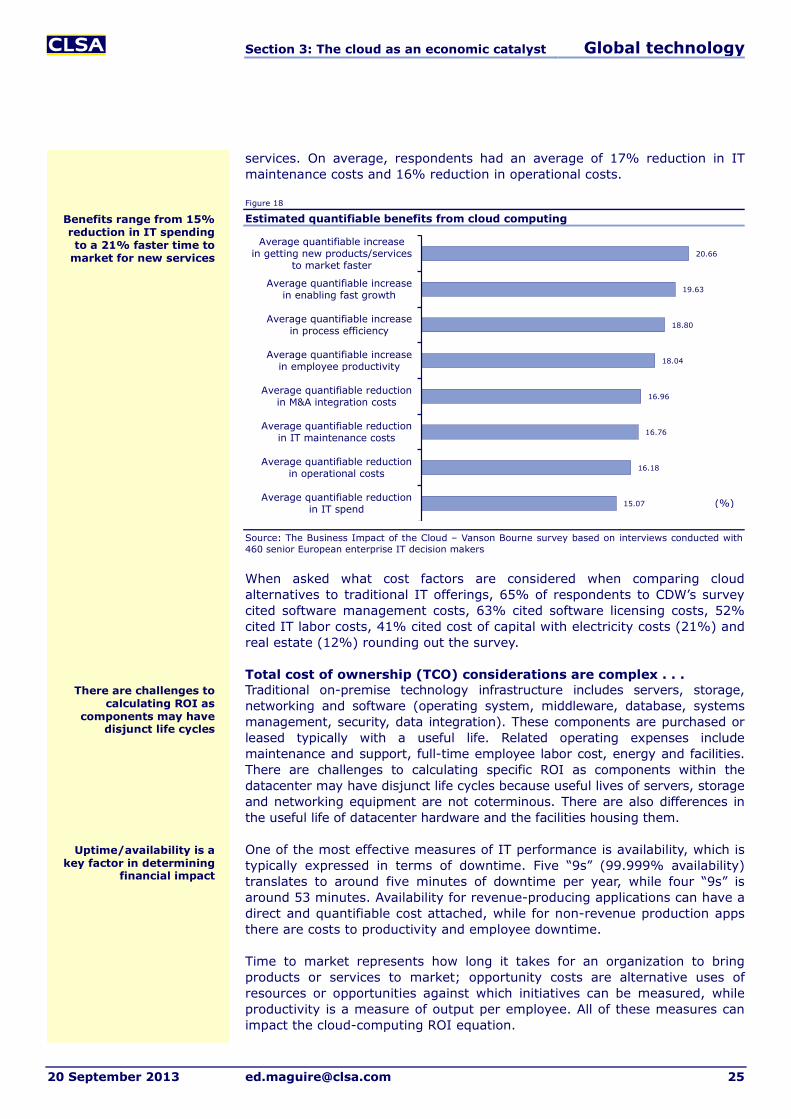
The Business Impact of the Cloud, a March 2012 report by Vanson Bourne, found benefits from cloud computing ranging from 15% for quantifiable reduction in IT spending to a 21% acceleration in time to market for new
0
10
20
30
40
50
60
70
80
2011 2012 2013 2014 2015 2016 2017
(US$bn) IaaS PaaS SaaS
SaaS is the largest portion of the market, forecast at an 18.5%
Cagr through 2017
Quantifying economics of cloud computing is an
inexact discipline
CDW survey respondents cite an average 13% IT
budget savings from cloud, increasing to
25% in four years
SaaS, PaaS and IaaS to grow from US$23.6bn in
2012 to US$72bn in 2017, a 25% Cagr
Section 3: The cloud as an economic catalyst Global technology
20 September 2013 [email protected] 25
services. On average, respondents had an average of 17% reduction in IT maintenance costs and 16% reduction in operational costs.
Figure 18
Estimated quantifiable benefits from cloud computing
Source: The Business Impact of the Cloud – Vanson Bourne survey based on interviews conducted with 460 senior European enterprise IT decision makers
When asked what cost factors are considered when comparing cloud alternatives to traditional IT offerings, 65% of respondents to CDW’s survey cited software management costs, 63% cited software licensing costs, 52% cited IT labor costs, 41% cited cost of capital with electricity costs (21%) and real estate (12%) rounding out the survey.
Total cost of ownership (TCO) considerations are complex . . . Traditional on-premise technology infrastructure includes servers, storage, networking and software (operating system, middleware, database, systems management, security, data integration). These components are purchased or leased typically with a useful life. Related operating expenses include maintenance and support, full-time employee labor cost, energy and facilities. There are challenges to calculating specific ROI as components within the datacenter may have disjunct life cycles because useful lives of servers, storage and networking equipment are not coterminous. There are also differences in the useful life of datacenter hardware and the facilities housing them.
One of the most effective measures of IT performance is availability, which is typically expressed in terms of downtime. Five “9s” (99.999% availability) translates to around five minutes of downtime per year, while four “9s” is around 53 minutes. Availability for revenue-producing applications can have a direct and quantifiable cost attached, while for non-revenue production apps there are costs to productivity and employee downtime.
Time to market represents how long it takes for an organization to bring products or services to market; opportunity costs are alternative uses of resources or opportunities against which initiatives can be measured, while productivity is a measure of output per employee. All of these measures can impact the cloud-computing ROI equation.
15.07
16.18
16.76
16.96
18.04
18.80
19.63
20.66
Average quantifiable reductionin IT spend
Average quantifiable reductionin operational costs
Average quantifiable reductionin IT maintenance costs
Average quantifiable reductionin M&A integration costs
Average quantifiable increasein employee productivity
Average quantifiable increasein process efficiency
Average quantifiable increasein enabling fast growth
Average quantifiable increasein getting new products/services
to market faster
(%)
Benefits range from 15% reduction in IT spending to a 21% faster time to
market for new services
There are challenges to calculating ROI as
components may have disjunct life cycles
Uptime/availability is a key factor in determining
financial impact

Section 3: The cloud as an economic catalyst Global technology
26 [email protected] 20 September 2013
. . . and cloud ROI is an inexact science The Economics of Cloud Computing by Bill Williams provides a framework for calculating the ROI of cloud-computing projects. Line items that can be measured include disk storage, disk maintenance, server hardware, server maintenance, firewalls and load balancers, network switches, software licenses, software maintenance, facilities and full-time equivalent (FTE) labor. A business calculating the ROI of SaaS versus traditional on-premise IT (or PaaS or IaaS) would need to calculate the costs of all of the prior components over a period of several years (typically three years) then compare this to the cost of a SaaS subscription.
Once annual costs have been calculated, then multiyear costs should be reflected. Typically, a documented payment on a cloud investment in less than a year is respectable. ROI = (gains from investment less costs of investment)/costs of investment. Net present value (NPV) uses a discount rate applied to cash inflows and outflows starting in the first year. If the NPV is high enough (and positive), that would suggest a project makes economic sense (if assumptions are correct).
Will cloud computing reduce or increase aggregate IT spending? An ongoing investor concern is that the deflationary aspects for IT - declining cost of computing, emergence of free open-source software and the shared efficiencies from cloud architecture - will ultimately dampen IT spending. We would concur with author Simon Wardley’s view that cloud computing is subject to the Jevons Paradox, the theory that technological progress that increases the efficiency with which a resource is used will increase the rate of its consumption.
Figure 19
Cloud computing has parallels with the Jevons Paradox
Source: Wikipedia
English economist William Stanley Jevons first described this paradox in his 1865 book The Coal Question. At that time, there were concerns that British coal reserves were dwindling, and some experts believed that improvements in efficiency would reduce coal consumption. The Jevons Paradox was the argument that fuel-efficiency improvements would actually increase fuel use, not reduce demand, as greater output per unit of coal would actually
Improved technology doubles the amount of Work produced with a given amount of Fuel
Demand for Fuel rises
Elastic demand
Costs falls by half
Price
0 QuantityQuantity demanded more than doubles
ROI is commonly calculated over a period
of three years
We believe cloud computing reduces costs,
which will accelerate demand
As prices of a commodity decline, demand elasticity
significantly boosts consumption
The Jevons Paradox was first observed with UK
coal consumption in the 19th Century
Section 3: The cloud as an economic catalyst Global technology
20 September 2013 [email protected] 27
stimulate demand. Jevons observed that coal consumption grew dramatically after James Watt introduced the coal-fired steam engine, given its efficiency over Thomas Newcomen's prior design.
It’s our view that cloud computing and related technologies such as open-source software and higher-level programming languages are a parallel to James Watt’s steam engine, with compute power substituting for coal. As such, disruption within the infrastructure is likely to continue along a path of “creative destruction” as proprietary infrastructure hardware and software providers see their ability to charge premium “rents” and enjoy attractive profit margins steadily erode.
The commoditization of computing, bandwidth and storage has proven to be a continuous dynamic. The principle of Moore’s Law, which holds that processor performance can double every 18 months, has held fast since the 1970s, while price performance of Dram continues to improve along a similar dynamic. It’s a fair assumption that these dynamics will continue for the medium term, but over the next decade it’s likely we may reach the physical limits of processor density. This in turn could have longer-term ramifications on resource-consumption considerations in software architecture, but for the foreseeable future the emerging cloud-computing architecture continues to factor in declining cost of compute. We’d highlight our colleague Mark Heller’s CLSA U Blue Book Moore no more? The future of IC manufacturing, which explores the implications of reaching the end of Moore’s Law.
Figure 20
Moore’s Law
Source: Wikipedia
In fact, the dynamic of exponential cost and performance improvement is occurring across a broad range of technologies. While improvement occurs at different rates, the consistent historical trend remains a common dynamic across different hardware technologies.
Cost of computing, bandwidth and storage
continues to decline
Moore’s Law has held fast since the 1970s
Open-source software and higher-level programming languages parallel James
Watt’s steam engine

Section 3: The cloud as an economic catalyst Global technology
28 [email protected] 20 September 2013
Figure 21
Time to double (or half) Dynamic Ram memory “half pitch” feature size 5.4 years Dynamic Ram memory (bits per dollar) 1.5 years Average transistor price 1.6 years Microprocessor cost per transistor cycle 1.1 years Total bits shipped 1.1 years Processor performance in MIPS 1.8 years Transistors in Intel microprocessors 2.0 years Microprocessor clock speed 2.7 years Note: MIPS = millions of instructions per second, a measure of processing capacity. Source: Ray Kurzweil, KurzweilAI.net
Sizing the broader economic impact of cloud computing A May 2013 report from McKinsey Global Institute estimates the potential economic impact for cloud technology between US$1.7-6.2tn in 2025, of which US$1.2-5.5tn could come from surplus from the use of cloud-driven services, while US$500-700bn could come from productivity improvements in enterprise IT. The McKinsey report assumed 20-30% productivity gains from reduced infrastructure and facilities footprint, with 10-15% productivity gains from standardization of application environments and packages as well as faster experimentation and testing.
A 2012 report from KPMG Australia estimated that adoption of cloud services across 75% of relevant ICT spending, achieving opex savings of 25% and capex savings of 59% after 10 years, would result in an increase of long-run GDP of 0.23% per year or A$3.32bn. The economic benefits can be grouped into three broad categories, according to the report: direct cost savings, productivity improvements and innovation.
A positive force for economic growth There has been some debate about the impact that ICT and cloud computing in particular is having on job creation. A natural process of “creative destruction” comes from automating manual processes and enabling tasks to be performed in geographically dispersed locations (at lower cost). There is a growing number of studies that seek to quantify the beneficial impact of cloud computing.
A 2009 study by Federico Etro on the Economic Impact of Cloud Computing on Business Creation, Employment and Output in Europe found that cloud computing would contribute between 0.05-0.3% to the annual growth rate in Europe. The Centre for Economics and Business Research in 2010 found that cloud computing would improve the efficiency of an average employee by an average of 2.1%, and would generate 1.6% of total GDP for UK, Germany, France, Italy and Spain from 2010 to 2015. A white paper by Harvard Business School Professor Marco Iansti and Gregory Richards of Keystone Strategy found that cloud computing would increase US GDP by 0.83-0.99% per year.
A March 2012 study commissioned by SAP and published by the Sand Hill Group cited several findings:
11 cloud companies added 80,000 jobs in the USA in 2010 alone.
Companies selling cloud services are forecast to grow cloud-based revenue an average of US$20bn per year, which could generate as many as 472,000 jobs in the USA and internationally over the next five years.
There is a natural process of “creative destruction” from automating manual
processes
Companies selling cloud services are forecast to grow cloud revenue an
average of US$20bn/year
McKinsey estimates the potential economic impact
for cloud between US$1.7-6.2tn in 2025
Exponential cost and performance
improvement occurs across technologies

Section 3: The cloud as an economic catalyst Global technology
20 September 2013 [email protected] 29
Over the next five years, US$30bn in cumulative venture-capital investments in cloud computing is expected, which could add another 213,000 new jobs in the USA and abroad.
Cloud computing could save US businesses as much as US$625bn over the next five years, much of which can be reinvested in new business opportunities and additional jobs.
Microsoft in March 2012 sponsored a study with IDC - Cloud computing’s role in job creation - that estimated that in 2011, IT cloud services helped organizations of all sizes in all sectors globally generate more than US$400bn in revenue and 1.5m new jobs. As a result of the new study, IDC estimates:
Increased business revenue from cloud-enabled IT innovation could reach US$1.1tn a year by 2015 globally.
Spending on public and private IT cloud services could generate nearly 14m jobs worldwide by 2015.
Over 50% of new cloud-related jobs will come from small- and medium-sized businesses. Over 1m jobs will be created in banking, communications and discrete manufacturing. The majority of these jobs will come from emerging markets like India and China because of their large workforce.
An innovation accelerator There is increased focus on cloud-fueled business incubation and we believe we are at the beginning of enterprise adoption of the cloud to fuel business innovation. A February 2012 study from the IBM Institute for Business Value and the Economist Business unit found that 72% of the leaders were piloting, adopting or had substantially implemented cloud computing; this is expected to reach 90% in three years. Out of the top seven objectives cited for cloud adoption, only one was related to cost reduction; other objectives include increased partner collaboration, new channels/markets, new revenue streams, competitive differentiation, flexible pricing models and rebalanced mix of offerings. This same study found that only 16% of respondents were currently using the cloud for innovation, such as entering new lines of business or industries, while 35% plan to rely on the cloud for business-model innovation in the coming three years.
Initial beneficiaries of public cloud IaaS customers have been web-based startups, departmental application projects, “burst” or overflow hosting for ecommerce applications for the medium term. Concerns over security, integration and governance keep the most mission-critical enterprise applications on premise.
We believe continuous pricing deflation of cloud IaaS favors scale over the long term. Smaller entrants and traditional service providers will be forced to differentiate into higher-value services. Providers will seek to achieve vendor lock-in through proprietary offerings (such as PaaS), but open-source initiatives such as OpenStack will help preserve openness. Internet/ecommerce businesses are direct beneficiaries of virtually unlimited compute, storage and network bandwidth offered and managed as a service. Examples include Google, Facebook, NetFlix, Amazon, FourSquare, Pinterest and many more.
Cloud-enabled IT innovation could reach
US$1.1tn/year by 2015 globally
We are at the beginning of enterprise adoption of
the cloud to fuel business innovation
Smaller cloud IaaS vendors will be forced to differentiate into higher-
value services

Section 3: The cloud as an economic catalyst Global technology
30 [email protected] 20 September 2013
Who benefits? As we’ve discussed before in our writings on innovation, the combination of cheap, accessible and scalable compute and storage allows users to create, innovate and experiment with applications - to bring the marginal cost of failure towards zero. Startups and entrepreneurs benefit from cloud services. Many of these are small, but a number has reached significant scale. We would aggregate beneficiaries into several segments:
Cloud-service providers - Infrastructure-as-a-Service providers benefit from growing secular demand for their services. Competitive dynamics are fierce. Service providers win on scale, transparency, ease of provisioning, security and governance. We’d distinguish these providers from beneficiaries who happen to be users. Amazon’s non-AWS businesses are an example. Microsoft’s Bing and Office365 benefit from the underlying cloud infrastructure platform.
Leading cloud-service providers include Amazon (AMZN), Salesforce.com (CRM), Microsoft (MSFT), Google (GOOG), Rackspace (RAX), Joyent (Private), Softlayer/IBM (IBM), Terremark/Verizon (VZ), Savvis/CenturyLink (CTL), Navisite/Time Warner (TW), Dimension Data/NTT (NTT) and others. Amazon remains the dominant leader in this segment by virtue of massive scale, aggressive feature expansion and low cost. We are seeing incumbent technology vendors, including Oracle and VMware, launch their own public clouds as part of their own strategies. At this stage, we see most vendors as playing defense against Amazon’s dominance and would expect smaller competitors to seek differentiation through vertical or process-related services.
Internet and ecommerce companies - Then there are internet and ecommerce businesses that operate on a cloud-architected infrastructure. Google, Facebook, LinkedIn and Yahoo all benefit from scale, cost and flexibility advantages that come from modern cloud architecture. The cloud delivery model affords a variety of business models: advertising, information services (accessed through API calls) and various ebusiness strategies.
If one examines the essential IP that differentiates internet companies from one another, it’s clear that the value resides in the software. Google Search, Facebook, OpenTable, Yelp, Twitter and LinkedIn - these are all applications at the core, with different constituencies and models. Where they all benefit is from the ability to scale rapidly and efficiently, leveraging low-cost and commodity hardware. It’s important to distinguish that not all internet/ecommerce companies run on a cloud-based architecture. Some are just delivering applications written to a multitier architecture and delivered over the internet. Conversely, applications written on a cloud-based architecture can be delivered behind a corporate firewall.
Leading internet and ecommerce companies include Amazon (AMZN), Facebook (FB), Google (GOOG), NetFlix (NFLX), LinkedIn (LNKD), Yahoo! (YHOO), Baidu.com (BIDU), Sohu.com (SOHU), Pandora (P), Yelp (YELP), Zillow (Z), Angie’s List (ANGI), Zynga (ZNGA), BlueNile (NILE) and others.
Software-as-a-Service vendors as “cloud natives” - We’ve already seen the emergence of highly successful SaaS companies that deliver their applications over the internet, with business models based on subscriptions, transactions and business outcomes. SaaS vendors benefit both from running on top of PaaS and IaaS, while reducing the cost and
Internet and ecommerce companies are cloud
applications
SaaS vendors benefit from running on top of
PaaS and IaaS
Cloud computing brings the marginal cost of
innovation failure towards zero

Section 3: The cloud as an economic catalyst Global technology
20 September 2013 [email protected] 31
overhead required to maintain infrastructure and at the same time delivering real business value from application logic. There are numerous publicly traded SaaS vendors that benefit from operational efficiencies derived from delivering a service based on shared resources. Not all employ a true cloud-based architecture. We note that Salesforce.com has architected its Sales Cloud and other applications on its own Force.com PaaS, while its other PaaS offering Heroku runs on Amazon Web Services.
Leading SaaS vendors include Salesforce.com (CRM), NetSuite (N), Workday (WDAY), BazaarVoice (BV), BlackBaud (BLKB), Carbonite (CARB), Concur (CNQR), Cornerstone OnDemand (CSOD), Demandware (DWRE), LogMeIn (LOGM), LivePerson (LPSN), ServiceNow (NOW), RealPage (RP), Responsys (MKTG), Marketo (MKTO), ServiceSource (SREV), DealerTrak (TRAK), Ultimate Software (ULTI) and Vocus (VCUS).
The nimble startups - It is axiomatic that software startups seeking venture funding need to be running on a public cloud like AWS, Azure or AppEngine. There are thousands of pure-play internet and mobile companies running on AWS, with FourSquare, Instagram and Pinterest among the most prominent. Salesforce.com has disclosed that its own ecosystem of third-party ISVs on Force.com has reached critical mass, with at least one potential IPO in the wings.
The rise of the “API economy” Cloud infrastructure is also giving rise to a generation of companies with business models built on APIs. Entertainment, sports, news, maps and location services can be delivered as part of application “mash-ups” with revenue based on the number of times the services are accessed. Web APIs are more than technology, they facilitate new revenue opportunities and give rise to new models. As the role of data becomes increasingly important, the economic power of APIs will become increasingly apparent.
An API is a simple concept in programming terms, a protocol intended as an interface for software components to communicate with each other. The term “web API” refers to a web service, which is an always-on software function accessible via a network address over the internet or in the cloud. Essentially, a web service is a way to access functionality over the web as a component. Providers of web services, sites and brands publish their APIs, and what has evolved is a broadly open architecture that allows sharing of data and content between applications. This allows content that is created in one place to be updated and posted in different locations across the web. The interoperability is critical because it allows applications to be treated like services - and services like applications.
Web APIs are behind what is known as “Web 2.0” functionality, where multiple services can be embedded into web-based applications. Various uses include:
Photo sharing - Photos from sites like Flickr and Photobucket can be shared via social sites like Facebook.
Content embedding - This enables content to be embedded, such as a slide presentation from Slideshare or Scribd to a LinkedIn profile or blog. Video content from Vimeo or YouTube can be embedded as well.
Dynamic content sharing - This allows comments or content created in applications like Twitter, Facebook or TripAdvisor to be shared on Facebook, LinkedIn or other sites.
Transforming the app economy into the
API economy
An open architecture has evolved that allows
sharing data and content between applications
Web APIs are behind what is known as “Web
2.0” functionality
Fostering a surge of startups

Section 3: The cloud as an economic catalyst Global technology
32 [email protected] 20 September 2013
Identity sharing - This functionally allows user information to be shared from web communities to outside applications. The Facebook application platform allows users of third-party applications to create IDs and log into apps via an open API. This creates value for the app by allowing it to access user information, while offering new functionality to the web community.
Unlocking value by connecting businesses to the world In many ways, the app economy is being replaced by the API economy. APIs are building blocks for the next generation of applications, a way to embed a plethora of different services into composite “mash-ups”. The website Programmable Web tracks over 9,900 commercially available APIs, and we are seeing steady growth of private companies whose business models are purely based on API calls (requests for the underlying service). Notable are privately held Factual (an information directory service) and Alohar Mobile (a geo-location API). Other firms like Pipl and SportsData are openly indicating plans to charge for the use of their APIs. Others such as Dun & Bradstreet, Klout and BestBuy are finding ways to monetize their APIs. In April 2013, Intel purchased API aggregator Mashery for over US$180m, reflecting the broad strategic importance of API services.
API business models are increasingly important
sales channels

Section 4: Ripples turn to waves Global technology
20 September 2013 [email protected] 33
Ripples turn to waves Cloud-computing architecture recasts the dynamics of infrastructure hardware and software. Incumbent technology vendors must navigate dual threats from ascendant open-source alternatives and transition to service models. Below the PaaS layer, providers of middleware, database, operating systems and hardware must reckon with the forces of creative destruction. As value accrues up the stack, it gravitates towards SaaS and solution services. Our top software picks are Salesforce.com, Akamai and Microsoft.
As infrastructure transforms into a service, on-premise models are disrupted. Open-source alternatives undercut pricing power for proprietary infrastructure offerings. This doesn’t mean there aren’t good business opportunities around open source, rather it means that rules change. High-margin hardware and infrastructure-software vendors will see revenue and margins pressured, whereas low-margin, high-volume players can do well exploiting economies of scale.
Cloud infrastructure service providers are likely to win on scale. We expect Amazon, Google and Microsoft to be long-term winners, while Rackspace appears at risk. EMC is positioned to benefit from ongoing datacenter buildout, along with Delta and Quanta. Proprietary infrastructure vendors at risk include Intel, HP, VMware and Oracle.
Dual vectors of disruption The adoption of a cloud-based architecture brings to bear two primary vectors for disruption on providers of technology infrastructure:
Open-source software/commodity hardware. The next generation of cloud architecture is heavily based on open-source software. Once considered the province of IT geeks, open-source software is fully in the mainstream and there are more viable alternatives to proprietary software than ever.
“Everything as a service”. A defining characteristic of cloud-infrastructure services is the ability for customers to purchase compute, storage and other services per use on a subscription or metered basis. This is a profound shift (and challenge) for incumbent technology providers, financially, organizationally and culturally.
Open-source alternatives mature for software layers Open-source software is a key vector for disruption, particularly for cloud computing since so much of the infrastructure in the new cloud-based architecture is based on open-source components. Open-source principles inherently enable innovation, not just in software, hardware and services, but through the derivative benefits to technology users in any endeavor. There are over one billion lines of freely available open-source code that developers and business users can access to create applications and new businesses. Free open-source software reduces costs for startups as well as new projects within IT organizations. Even with paid technical expertise and support, the ROI tends to be overwhelmingly favorable for open source.
Over the past decade, Linux has made significant inroads into the Unix and mainframe markets. Since 2009, Linux server shipments enjoyed a 17% Cagr, well ahead of Windows Server’s 7% and Unix’s 11% decline.
IT spending to grow in aggregate, with plenty of
“creative destruction”
Open source has been critical to enable
innovation, not just in software
Value migrates upwards, commoditization pushes downwards; PaaS is the
pivot point

Section 4: Ripples turn to waves Global technology
34 [email protected] 20 September 2013
Figure 22
Server shipments by OS
(units) 2009 2010 2011 2012 % Cagr 2009-12
Linux 1,792,929 2,119,427 2,472,226 2,875,927 17 Unix 439,804 403,346 366,426 314,472 (11) Windows 5,212,754 6,252,158 6,570,900 6,382,128 7 Source: Gartner
However, the economics of open source illustrate the disruptive impact on business models. Revenue associated with Linux is based on subscriptions for support and services, not for the software (which can be downloaded for free). From 2009 to 2012, Linux increased from 24% to 30% of server shipments, while the proportion of revenue increased from only 9% to 12%.
Figure 23
Revenue share for server operating systems
Source: Gartner
There are increasingly viable open-source alternatives to proprietary software all the way up the stack from OS (Linux, FreeBSD) to database (MySQL, MongoDB, Cassandra), Big Data/data-warehousing management (Hadoop, Talend), content management (Drupal), application server (JBoss), analytic tools (R language, Pentaho, Jaspersoft), CRM (SugarCRM) and many more. In fact, it is not unusual for startups, particularly in the internet or ecommerce arena, to avoid the use of proprietary software entirely.
“X”-as-a-Service models upend equipment capex SaaS vendors have disrupted the existing on-premise enterprise software applications landscape. While this is partly due to the online delivery model and subscription basis of the business, the advantage that SaaS vendors have is the ability to develop and push innovations into the market more quickly. Salesforce.com in application software uses periodic, rolling version releases (summer 2013, winter 2012) that can be launched several times a year rather than monolithic versions of on-premise applications that saw annual or even less frequent updates.
The market for public cloud IaaS is Amazon’s to lose as the company’s momentum outpaces all other competitors. Its self-service model has proven extraordinarily effective in growing the business to a US$2bn-plus annual run rate. “Gorilla game” dynamics (by which disproportionate benefits and market share accrue to the leading vendor in the space) are in full effect, as Amazon’s APIs and conventions have increasingly become the de facto standard in the cloud.
6.5 7.6 8.4 9.3 9.9 10.5 11.7
37.6 34.9 32.2 30.0 29.9 27.3 24.4
55.9 57.5 59.4 60.7 60.2 62.2 63.9
0
20
40
60
80
100
120
2006 2007 2008 2009 2010 2011 2012
(% of total market)
Linux Server UNIX Server Windows Server
The leading cloud platforms, including
Google and Amazon EC2, are built on open source
Linux now accounts for 30% of server shipments
Amazon is pushing the cost curve down
. . . while the proportion of revenue increased from
only 9% to 12%
Linux increased from 24% to 30% of server
shipments . . .

Section 4: Ripples turn to waves Global technology
20 September 2013 [email protected] 35
CEO Jeff Bezos has commented publicly that the company’s philosophy is to offer compute and storage services at modest margins (high-single digits), while passing along all economies of scale to customers. This forces competitors to respond to stay in the game. In June 2013, Amazon Web Services announced that EC2 Dedicated Instances would now be available to clients for up to 80% off current prices. This is the 36th time that Amazon has cut prices since 2006. Google in May 2013 cut some of its enterprise cloud-service prices by 25%, and Microsoft Azure has cut its prices 21-33% to even the playing field. Amazon Web Services accounts for just 1% of all internet traffic. This should help mitigate bandwidth concerns.
How cloud architecture impacts the software stack Application infrastructure and middleware (AIM) is a broad, somewhat amorphous category of software that encompasses capabilities that intermediate between applications, application server, database and operating systems. Application servers and integration software can be partly if not largely displaced by PaaS, at least furthering the trend towards replacing proprietary solutions with open-source alternatives.
It’s our view that a fully realized PaaS layer will subsume much of the functionality that has heretofore been handled by discrete categories of middleware software (file transfer, application server and application integration, for instance). Gartner’s view is that over 70% of PaaS functionality can be referenced to AIM capabilities. With over 150 vendors addressing different aspects of PaaS functionality, the market is highly fragmented, both in terms of vendor share as well as functions. The market for AIM is large, estimated to be US$22bn, as well as highly fragmented and dynamic. While there is a healthy 7.9% growth forecast through 2017, we anticipate a lot of creative destruction as upstart offerings target incumbents.
Figure 24
Application infrastructure and middleware market forecast 2011A 2012A 2013E 2014E 2015E 2016E 2017E Revenue (US$bn) 19.4 20.4 21.8 23.5 25.4 27.4 29.6 YoY growth (%) 9.9 5.2 6.9 7.9 7.9 7.9 7.9 Source: Gartner
IBM and Oracle have the greatest share in this broad segment, with SAP, Microsoft, Software AG, Tibco and Salesforce.com also comprising the 62% of share accounted for by the top seven vendors.
Figure 25
Application infrastructure and middleware 2012 market share
Source: Gartner
Microsoft5%
IBM31%
Oracle16%
SAP3%
Software AG3%
TIBCO3%
SalesForce.Com2%
Others38%
Amazon’s strategy is to pass along economies of
scale to its customers
A growing market with a lot of competitive
turmoil expected
Expect plenty of creative destruction in the various
middleware markets
IBM and Oracle have the greatest share in this
broad segment

Section 4: Ripples turn to waves Global technology
36 [email protected] 20 September 2013
The biggest functional area that PaaS offerings address is application platforms. CloudBees, Engine Yard, Force.com, Heroku, Zoho Creator, GigaSpaces, Google’s AppEngine, Red Hat OpenShift, IBM’s SmartCloud Application Service, Oracle’s Public Cloud Java Service and Microsoft’s Azure PaaS all run in the cloud, while on-premise offerings like Apprenda, ActiveState Stackato and CloudFoundry offer similar functionality behind the firewall. Integration middleware services are emerging from several segments: data integration, managed file transfer, application services governance, ecommerce B2B integration and traditional integration middleware. Cloud-based offerings include Dell’s Boomi, IBM CastIron, Informatica Cloud Services and MuleSoft MuleiOn, while on-premise solutions include Cordys Business Operations Platform, IBM Sterling, Informatica Cloud Platform and Jitterbit Enterprise.
In terms of open source, there are a number of alternatives to traditional application servers, including Red Hat’s JBoss and MuleSoft’s TomCat. Proprietary real-time integration and messaging-software offerings from the likes of IBM and Tibco can be substituted with offerings like RabbitMQ or even dispensed with entirely.
Figure 26
Proprietary versus cloud-based middleware
Category Function License Technologies/Companies Application server Used for the efficient execution
of procedures for supporting its applied applications
Proprietary WebSphere (IBM), WebLogic (Oracle), NetWeaver (SAP), Windows Server (Microsoft)
Open source JBoss AS (Red Hat), Geronimo (Apache), GlassFish (Oracle), JOnAS (OW2 Consortium)
Integration software Used for designing and implementing the interaction and communication between interacting software applications
Proprietary WebSphere ESB (IBM), Adeptia ESB Suite (Adeptia), webmethods ESB (SoftwareAG), Oracle ESB (Oracle), BizTalk Server (Microsoft)
Open source ServiceMix / Synapse (Apache), JBoss ESB (Red Hat), Mule (MuleSoft), UltraESB (AdroitLogic)
Source: CLSA
We believe incumbents with the largest market share in proprietary offerings face the greatest risk to their middleware businesses from PaaS and open-source competition. Oracle is seeking to offset threats to WebLogic through its engineered systems strategy, as ExaLogic appliances pre-integrate and optimize all layers of the technology stack. IBM’s WebSphere application server and middleware is also at risk, and the company’s broadening embrace of open-source technologies including OpenStack is a way to keep the services and consulting organizations engaged in building new applications. Tibco is focusing on its own PaaS offering, while Informatica’s cloud offering recently surpassed 10% of license sales.
Database: Still growing, but upstarts have the momentum The relational database has been an essential component of the enterprise software stack, powering applications of all types while growing to become nearly a US$30bn industry. Advantages of leading enterprise relational databases include data integrity, security, scalability as well as the ability to ensure transaction integrity. Historically, the database has been one of the stickiest areas of software. Switching costs have been high because databases support mission-critical applications, data are costly to move from one system to another, applications tend to be written specifically to the
The biggest functional area that PaaS offerings
address is application platforms
There are a number of open-source alternatives to traditional application
servers
The relational database has been an essential
component of the enterprise software stack
Incumbents with the largest market share in
proprietary offerings face the greatest risk
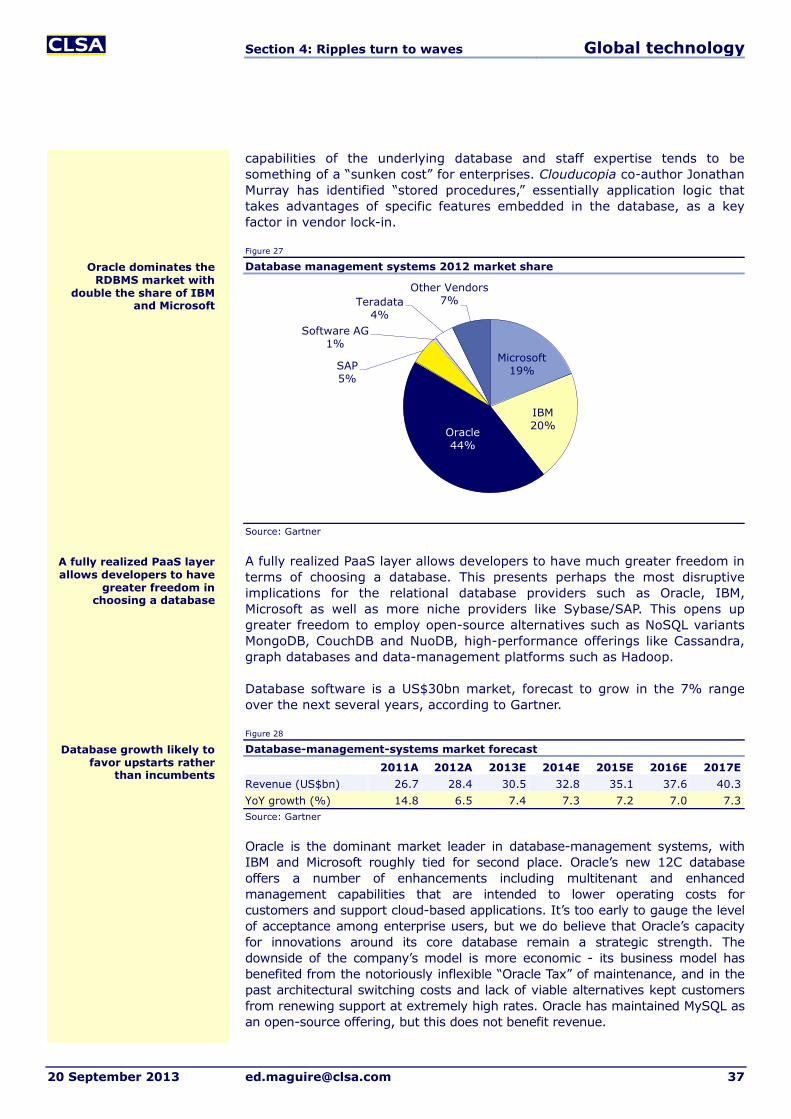
Section 4: Ripples turn to waves Global technology
20 September 2013 [email protected] 37
capabilities of the underlying database and staff expertise tends to be something of a “sunken cost” for enterprises. Clouducopia co-author Jonathan Murray has identified “stored procedures,” essentially application logic that takes advantages of specific features embedded in the database, as a key factor in vendor lock-in.
Figure 27
Database management systems 2012 market share
Source: Gartner
A fully realized PaaS layer allows developers to have much greater freedom in terms of choosing a database. This presents perhaps the most disruptive implications for the relational database providers such as Oracle, IBM, Microsoft as well as more niche providers like Sybase/SAP. This opens up greater freedom to employ open-source alternatives such as NoSQL variants MongoDB, CouchDB and NuoDB, high-performance offerings like Cassandra, graph databases and data-management platforms such as Hadoop.
Database software is a US$30bn market, forecast to grow in the 7% range over the next several years, according to Gartner.
Figure 28
Database-management-systems market forecast 2011A 2012A 2013E 2014E 2015E 2016E 2017E Revenue (US$bn) 26.7 28.4 30.5 32.8 35.1 37.6 40.3 YoY growth (%) 14.8 6.5 7.4 7.3 7.2 7.0 7.3 Source: Gartner
Oracle is the dominant market leader in database-management systems, with IBM and Microsoft roughly tied for second place. Oracle’s new 12C database offers a number of enhancements including multitenant and enhanced management capabilities that are intended to lower operating costs for customers and support cloud-based applications. It’s too early to gauge the level of acceptance among enterprise users, but we do believe that Oracle’s capacity for innovations around its core database remain a strategic strength. The downside of the company’s model is more economic - its business model has benefited from the notoriously inflexible “Oracle Tax” of maintenance, and in the past architectural switching costs and lack of viable alternatives kept customers from renewing support at extremely high rates. Oracle has maintained MySQL as an open-source offering, but this does not benefit revenue.
Microsoft19%
IBM20%Oracle
44%
SAP5%
Software AG1%
Teradata4%
Other Vendors7%
Oracle dominates the RDBMS market with
double the share of IBM and Microsoft
A fully realized PaaS layer allows developers to have
greater freedom in choosing a database
Database growth likely to favor upstarts rather
than incumbents
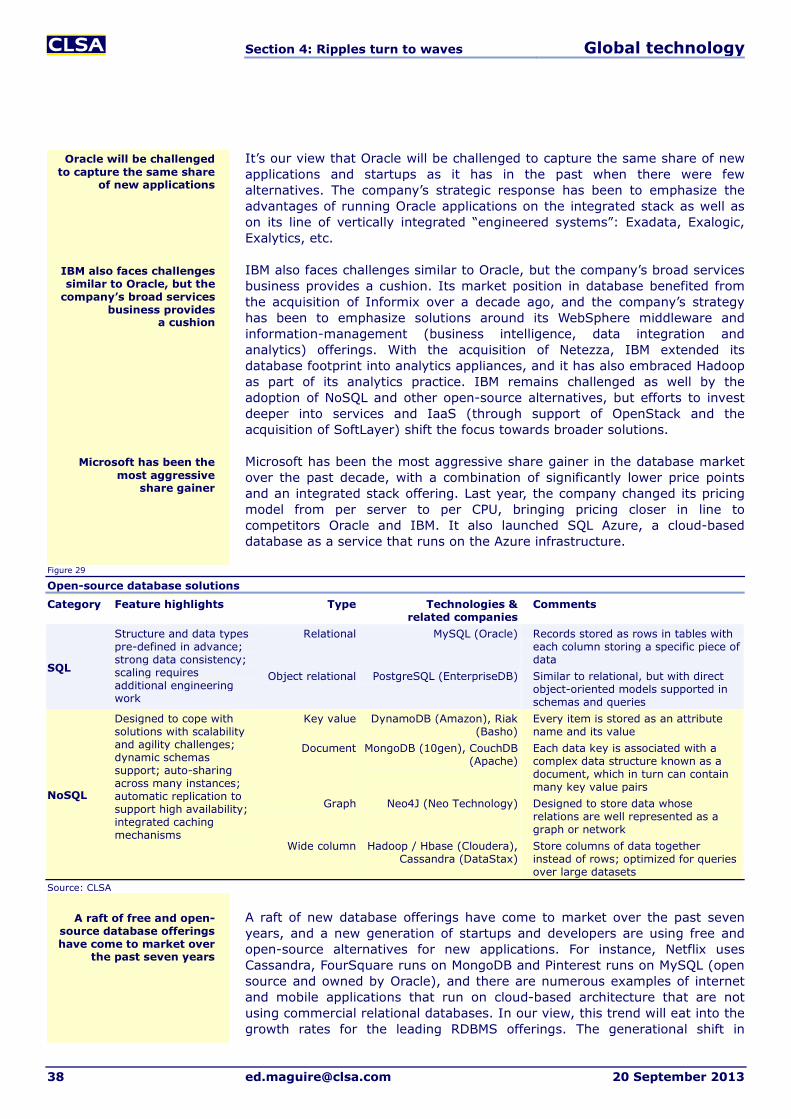
Section 4: Ripples turn to waves Global technology
38 [email protected] 20 September 2013
It’s our view that Oracle will be challenged to capture the same share of new applications and startups as it has in the past when there were few alternatives. The company’s strategic response has been to emphasize the advantages of running Oracle applications on the integrated stack as well as on its line of vertically integrated “engineered systems”: Exadata, Exalogic, Exalytics, etc.
IBM also faces challenges similar to Oracle, but the company’s broad services business provides a cushion. Its market position in database benefited from the acquisition of Informix over a decade ago, and the company’s strategy has been to emphasize solutions around its WebSphere middleware and information-management (business intelligence, data integration and analytics) offerings. With the acquisition of Netezza, IBM extended its database footprint into analytics appliances, and it has also embraced Hadoop as part of its analytics practice. IBM remains challenged as well by the adoption of NoSQL and other open-source alternatives, but efforts to invest deeper into services and IaaS (through support of OpenStack and the acquisition of SoftLayer) shift the focus towards broader solutions.
Microsoft has been the most aggressive share gainer in the database market over the past decade, with a combination of significantly lower price points and an integrated stack offering. Last year, the company changed its pricing model from per server to per CPU, bringing pricing closer in line to competitors Oracle and IBM. It also launched SQL Azure, a cloud-based database as a service that runs on the Azure infrastructure.
Figure 29
Open-source database solutions
Category Feature highlights Type Technologies & related companies
Comments
SQL
Structure and data types pre-defined in advance; strong data consistency; scaling requires additional engineering work
Relational MySQL (Oracle) Records stored as rows in tables with each column storing a specific piece of data
Object relational PostgreSQL (EnterpriseDB) Similar to relational, but with direct object-oriented models supported in schemas and queries
NoSQL
Designed to cope with solutions with scalability and agility challenges; dynamic schemas support; auto-sharing across many instances; automatic replication to support high availability; integrated caching mechanisms
Key value DynamoDB (Amazon), Riak (Basho)
Every item is stored as an attribute name and its value
Document MongoDB (10gen), CouchDB (Apache)
Each data key is associated with a complex data structure known as a document, which in turn can contain many key value pairs
Graph Neo4J (Neo Technology) Designed to store data whose relations are well represented as a graph or network
Wide column Hadoop / Hbase (Cloudera), Cassandra (DataStax)
Store columns of data together instead of rows; optimized for queries over large datasets
Source: CLSA
A raft of new database offerings have come to market over the past seven years, and a new generation of startups and developers are using free and open-source alternatives for new applications. For instance, Netflix uses Cassandra, FourSquare runs on MongoDB and Pinterest runs on MySQL (open source and owned by Oracle), and there are numerous examples of internet and mobile applications that run on cloud-based architecture that are not using commercial relational databases. In our view, this trend will eat into the growth rates for the leading RDBMS offerings. The generational shift in
Oracle will be challenged to capture the same share
of new applications
IBM also faces challenges similar to Oracle, but the
company’s broad services business provides
a cushion
A raft of free and open-source database offerings have come to market over
the past seven years
Microsoft has been the most aggressive
share gainer

Section 4: Ripples turn to waves Global technology
20 September 2013 [email protected] 39
developers take advantages of new freedoms afforded by PaaS to adopt open-source alternatives as well. As of July 2013, DataStax (Cassandra) received US$64m in follow-on funding, 10Gen (MongoDB) has received US$82m so far, Basho (Riak) has received US$26m, Cloudera (Hadoop) has received US$141m and Hortonworks (also Hadoop) has raised US$70m.
Server operating systems The abstraction of workloads means that choice of the underlying operating system becomes irrelevant. The choice of OS will depend on preference of the developer, with Linux variants the predominant standard. With the adoption of cloud-based architecture, we expect a continuation of the similar dynamics with most disruption coming from open source. High-end Unix servers have been first to give way to commodity x86 server farms. Google is a prime example, having built its datacenters from off-the-shelf parts. As servers therefore become commodities, the open-source route makes the most economic sense.
Figure 30
Server operating-systems market share 2012
Source: Gartner
The dynamics of open source in the software industry have been most apparent with the disruption that Linux inflicted on the market for server operating systems. Gartner sizes the 2012 market for Linux Server OS revenue at US$1.37bn, growing 16% YoY, while the market for the three leading Unix variants (HP-US, AIX and Solaris) declined 7% YoY to US$2.6bn. Windows server is a US$7.5bn business that grew 7% YoY in 2012, benefiting from the integration of the Hyper-V hypervisor into the datacenter editions.
Figure 31
Operating-systems market forecast
2011A 2012A 2013E 2014E 2015E 2016E 2017E Revenue (US$bn) 32.2 32.2 33.4 34.6 35.8 36.9 37.9 YoY growth (%) 6.0 0.0 3.9 3.6 3.3 3.1 2.6 Source: Gartner
We expect the market dynamics for server operating systems to continue to favor variants of Linux, though there is an ongoing debate regarding how much will be paid Linux and how much will not have any incremental revenue attached. The distinction comes around the virtualization layer, with “host”
Microsoft58%IBM
20%
Oracle5%
HP7%
Red Hat7%
SUSE2% Other Vendors
2%
Servers are becoming commodities, and
so has the OS
There is an ongoing debate regarding how
much will be paid Linux and how much is not
Revenue share for Linux-vendor Red Hat and SuSE
understates market impact
Overall operating-systems market is expected to grow low single digits

Section 4: Ripples turn to waves Global technology
40 [email protected] 20 September 2013
operating systems that run below the hypervisor subject to a greater level of commoditization (and concentration of purchasing power) versus “guest” operating systems that are tied to applications running above them.
The larger cloud providers including Amazon and Google have their own variants of Linux running in their datacenters, so the growth of servers and underlying compute capacity does not drive incremental adoption of paid operating systems (this is where AWS can create greater economies of scale). However, business are still likely to rely on paid Linux associated with running applications, as the value from support/subscriptions comes from access to specialized intellectual capital, on-call support and certifications.
Figure 32
Open-source operating systems OS family Distribution License type Linux Red Hat Enterprise Linux (Red Hat), SUSE
Linux (SUSE), Ubuntu (Canonical), Oracle Linux (Oracle), Mandrake
GPL/LGPL
BSD FreeBSD, OpenBSD, NetBSD BSD BSD/Unix Darwin Apple Public Source License Unix OpenSolaris Common Development and
Distribution License Source: CLSA
We expect Oracle’s Solaris, IBM’s AIX and HP’s HP-UX to decline as a proportion of the market. Of the three, IBM has been gaining share, though in a declining market. We expect Red Hat to continue to benefit from new application deployments, expansion of existing projects and vendor consolidation at large enterprise customers. We expect the overall paid-Linux and open-source OS market to continue to grow at healthy mid-teens rates for the medium term, with Red Hat continuing to dominate enterprise share even as Oracle (Linux), SUSE, CentOS, Canonical (Ubuntu) and other smaller distributors benefit from market momentum.
Impact on software and hardware support remains murky For hardware and software vendors, the revenue streams from support are the most profitable of all. These revenue streams fuel investment in R&D and provide cashflow visibility that is core to business models. Software support is a US$58bn annual market, of which the top nine vendors account for 37% of the pie. Hardware support is a US$94bn market, of which the top nine vendors account for 43% of the total. Software and hardware maintenance tends to be based on the price of the underlying licenses or hardware products, typically 17-22% per year for software and 10-12% for hardware.
Figure 33 Figure 34
Software-support market share 2012 Hardware-support market share 2012
Source: Gartner
Others63%
Oracle10%SAP
7%
Microsoft6%
HP4%
IBM4%
Sage2%
Symantec2%
EMC2%
Others57%
HP9%
IBM8%
Ricoh5%
Dell5%
Cisco4%
EMC4%
Fujitsu3%
Oracle3%
NCR2%
The larger cloud providers including Amazon and Google have their own
variants of Linux
We expect Oracle’s Solaris, IBM’s AIX and HP’s HP-UX to decline
For hardware and software vendors, support
revenue is the most profitable of all
Open-source operating systems are the default
alternative to Unix

Section 4: Ripples turn to waves Global technology
20 September 2013 [email protected] 41
Increased automation and management capabilities from a fully realized PaaS layer will reduce the need for certain types of application maintenance and support. This is highly dependent on the types of applications, of course, but impact will come from a couple of sources. As traditional on-premise applications migrate to cloud-delivery models or SaaS alternatives, there will be less need to manage the underlying hardware and storage specifically associated with the applications. As new applications are written on PaaS, the ability to standardize middleware and integration functions across multiple applications will reduce the need for incremental maintenance and support services.
Hyperscale datacenters move the hardware needle Proliferation of internet-connected smartphones and tablets derive much of their power and value from being connected to cloud-based services. This in part drives the urgent need to expand capacity. The relentless growth in server workloads, network bandwidth requirements, storage and power demands lead to the need for more efficient datacenter designs. In response to growing demand is the emergence of hyperscale datacenters (single facilities with over 15,000 servers). Steve Ballmer of Microsoft recently disclosed that the company runs over 1m servers in its datacenters.
Google is also estimated to operate over a million servers, Amazon operating less than a million, and smaller companies like Facebook running ‘hundreds of thousands of servers’. SoftLayer (acquired by IBM) and Rackspace both run around 100,000 servers. This trend is being driven by business-to-consumer (B2C) internet companies (such as Google, Apple, Facebook, Ebay, Tencent, Baidu, Amazon and others) and public cloud providers (such as AWS, Rackspace, Microsoft, IBM and Google). The public cloud providers support a wealth of startups including Netflix, Instagram, FourSquare, Pinterest, AirBnB and others.
Figure 35
IT demand average annual growth rate
Source: Gartner
Hyperscale datacenters are changing relationships with suppliers by dint of their purchasing power, focus on energy efficiency and increased levels of automation. Gartner forecasts the largest datacenters’ share of IT spending to increase from 23% in 2012 to 27% by 2016 as spending power accrues to the largest facilities. Hyperscale datacenters can purchase servers in quantities of
0
10
20
30
40
50
60
Server workloads Network bandwidth Storage capacity Power costs
(%)
Hyperscale datacenters concentrate purchasing
power
Secular demand is strong for storage, network
bandwidth, servers and power
The need for certain types of application
maintenance and support will decline
Microsoft disclosed it manages over 1m servers
in its datacenters
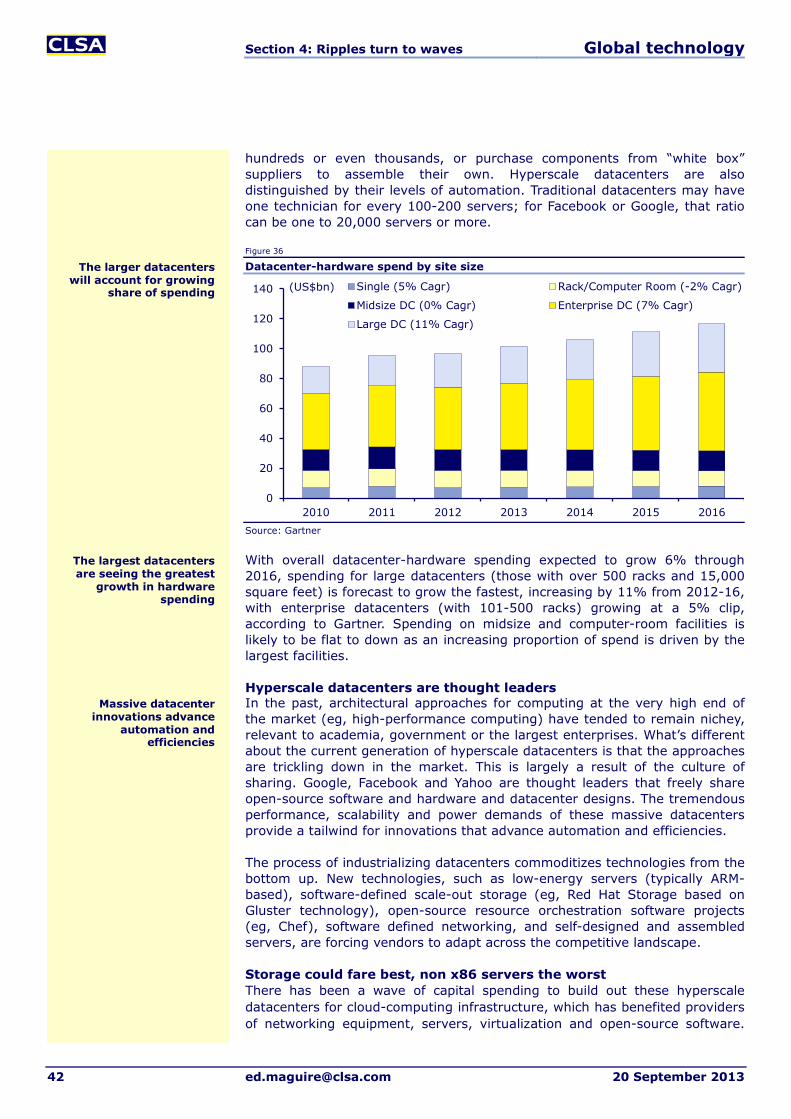
Section 4: Ripples turn to waves Global technology
42 [email protected] 20 September 2013
hundreds or even thousands, or purchase components from “white box” suppliers to assemble their own. Hyperscale datacenters are also distinguished by their levels of automation. Traditional datacenters may have one technician for every 100-200 servers; for Facebook or Google, that ratio can be one to 20,000 servers or more.
Figure 36
Datacenter-hardware spend by site size
Source: Gartner
With overall datacenter-hardware spending expected to grow 6% through 2016, spending for large datacenters (those with over 500 racks and 15,000 square feet) is forecast to grow the fastest, increasing by 11% from 2012-16, with enterprise datacenters (with 101-500 racks) growing at a 5% clip, according to Gartner. Spending on midsize and computer-room facilities is likely to be flat to down as an increasing proportion of spend is driven by the largest facilities.
Hyperscale datacenters are thought leaders In the past, architectural approaches for computing at the very high end of the market (eg, high-performance computing) have tended to remain nichey, relevant to academia, government or the largest enterprises. What’s different about the current generation of hyperscale datacenters is that the approaches are trickling down in the market. This is largely a result of the culture of sharing. Google, Facebook and Yahoo are thought leaders that freely share open-source software and hardware and datacenter designs. The tremendous performance, scalability and power demands of these massive datacenters provide a tailwind for innovations that advance automation and efficiencies.
The process of industrializing datacenters commoditizes technologies from the bottom up. New technologies, such as low-energy servers (typically ARM-based), software-defined scale-out storage (eg, Red Hat Storage based on Gluster technology), open-source resource orchestration software projects (eg, Chef), software defined networking, and self-designed and assembled servers, are forcing vendors to adapt across the competitive landscape.
Storage could fare best, non x86 servers the worst There has been a wave of capital spending to build out these hyperscale datacenters for cloud-computing infrastructure, which has benefited providers of networking equipment, servers, virtualization and open-source software.
0
20
40
60
80
100
120
140
2010 2011 2012 2013 2014 2015 2016
Single (5% Cagr) Rack/Computer Room (-2% Cagr)
Midsize DC (0% Cagr) Enterprise DC (7% Cagr)
Large DC (11% Cagr)
(US$bn)
Massive datacenter innovations advance
automation and efficiencies
The largest datacenters are seeing the greatest
growth in hardware spending
The larger datacenters will account for growing
share of spending
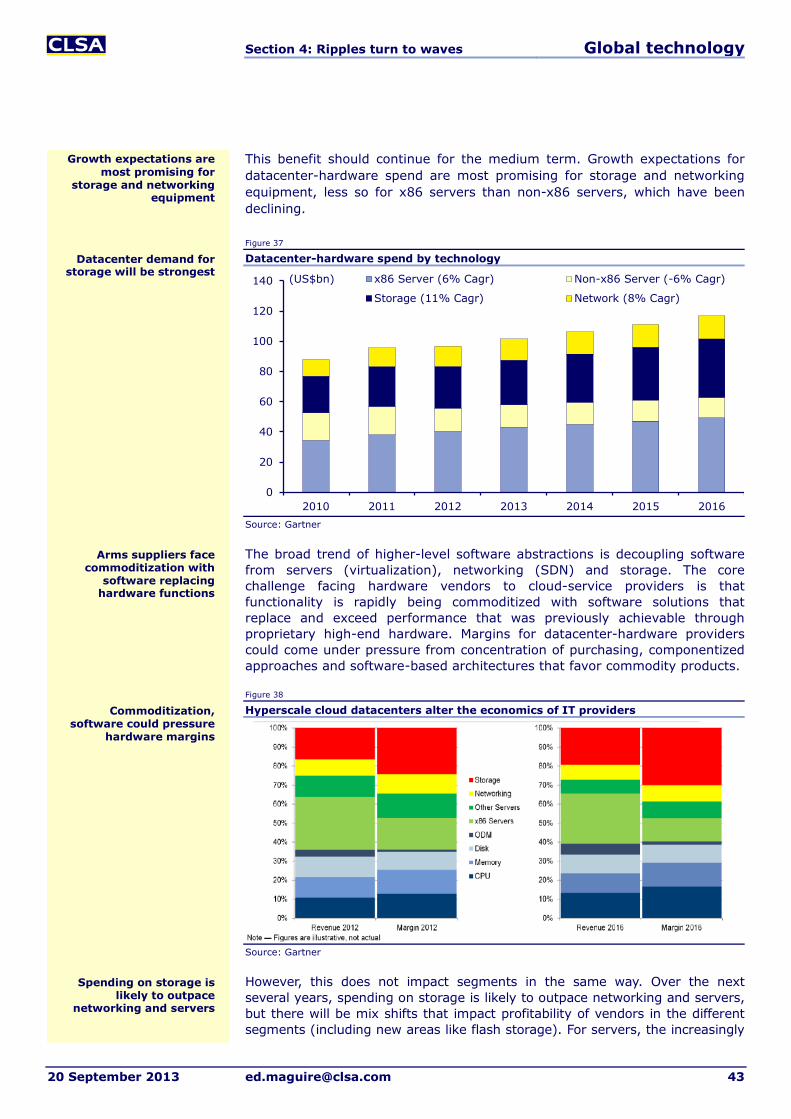
Section 4: Ripples turn to waves Global technology
20 September 2013 [email protected] 43
This benefit should continue for the medium term. Growth expectations for datacenter-hardware spend are most promising for storage and networking equipment, less so for x86 servers than non-x86 servers, which have been declining.
Figure 37
Datacenter-hardware spend by technology
Source: Gartner
The broad trend of higher-level software abstractions is decoupling software from servers (virtualization), networking (SDN) and storage. The core challenge facing hardware vendors to cloud-service providers is that functionality is rapidly being commoditized with software solutions that replace and exceed performance that was previously achievable through proprietary high-end hardware. Margins for datacenter-hardware providers could come under pressure from concentration of purchasing, componentized approaches and software-based architectures that favor commodity products.
Figure 38
Hyperscale cloud datacenters alter the economics of IT providers
Source: Gartner
However, this does not impact segments in the same way. Over the next several years, spending on storage is likely to outpace networking and servers, but there will be mix shifts that impact profitability of vendors in the different segments (including new areas like flash storage). For servers, the increasingly
0
20
40
60
80
100
120
140
2010 2011 2012 2013 2014 2015 2016
x86 Server (6% Cagr) Non-x86 Server (-6% Cagr)
Storage (11% Cagr) Network (8% Cagr)
(US$bn)
Arms suppliers face commoditization with
software replacing hardware functions
Growth expectations are most promising for
storage and networking equipment
Datacenter demand for storage will be strongest
Spending on storage is likely to outpace
networking and servers
Commoditization, software could pressure
hardware margins

Section 4: Ripples turn to waves Global technology
44 [email protected] 20 September 2013
virtualized nature of workloads has already boosted utilization rates of servers, but the growing trend towards white-box, “self-build” (as in the case of Amazon and Google) and open-source designs distributed through the Facebook-sponsored OpenCompute project will further pressure the market towards lower-margin, commodity offerings. If trends continue apace, the storage and component vendors will enjoy increasing proportions of total profit from datacenter-hardware sales, while server vendors and ODMs will get squeezed.
We are seeing traditional hardware vendors react in a variety of ways to protect margins: IBM and Oracle are pursuing software/hardware solution strategies through the Pure Systems and Exa-systems offerings. Cisco is embracing software defined networking and advancing a strategy built around the “Internet of Everything”. EMC has, and will continue to, invest in software for higher levels of automation and governance. Stakeholders across the value chain could be affected differently with adoption of cloud computing. For smaller cloud-service providers, competition from large technology providers will exert pricing pressures on infrastructure services.
Servers: Innovation and commoditization We are already witnessing the commoditization of servers as workloads in the cloud can be deployed on virtualized pools of servers (mostly x86). This trend sets up different dynamics, as server choice for users is no longer linked to squeezing performance out of specialized machines.
Figure 39
Server 2012 market share
Source: Gartner
According to Gartner, 10m servers shipped in 2012 and will grow in the mid-single-digit range over the next few years. Enterprise IT spending remains tepid, but the explosion of mobile computing is driving strong growth in hyperscale datacenters that offer cloud services. The Linux server market, which is more relevant for our discussion, is expected to grow in the low-double digits, primarily driven by rising capacity demands for cloud computing. Despite the commoditization of x86 servers and declining proportion of high-end Unix servers, ample demand should continue to drive revenue growth across the industry at large.
Figure 40
Server market forecast
2011A 2012A 2013E 2014E 2015E 2016E 2017E Revenue (US$bn) 52.8 52.5 52.4 54.6 56.4 58.3 60.6 YoY growth (%) 7.9 (0.6) (0.1) 4.2 3.3 3.3 4.0 Source: Gartner
Fujitsu4%
IBM30%
NEC2%
Dell15%
HP27%
Oracle5%
Cisco3%
Self-Build/ODM3%
Others11%
Mobile computing is driving growth in
hyperscale datacenters
We are seeing traditional hardware vendors react
in different ways to protect margins
IBM and HP have the biggest share of the
server market
Ample demand to continue to drive revenue
growth across the industry at large
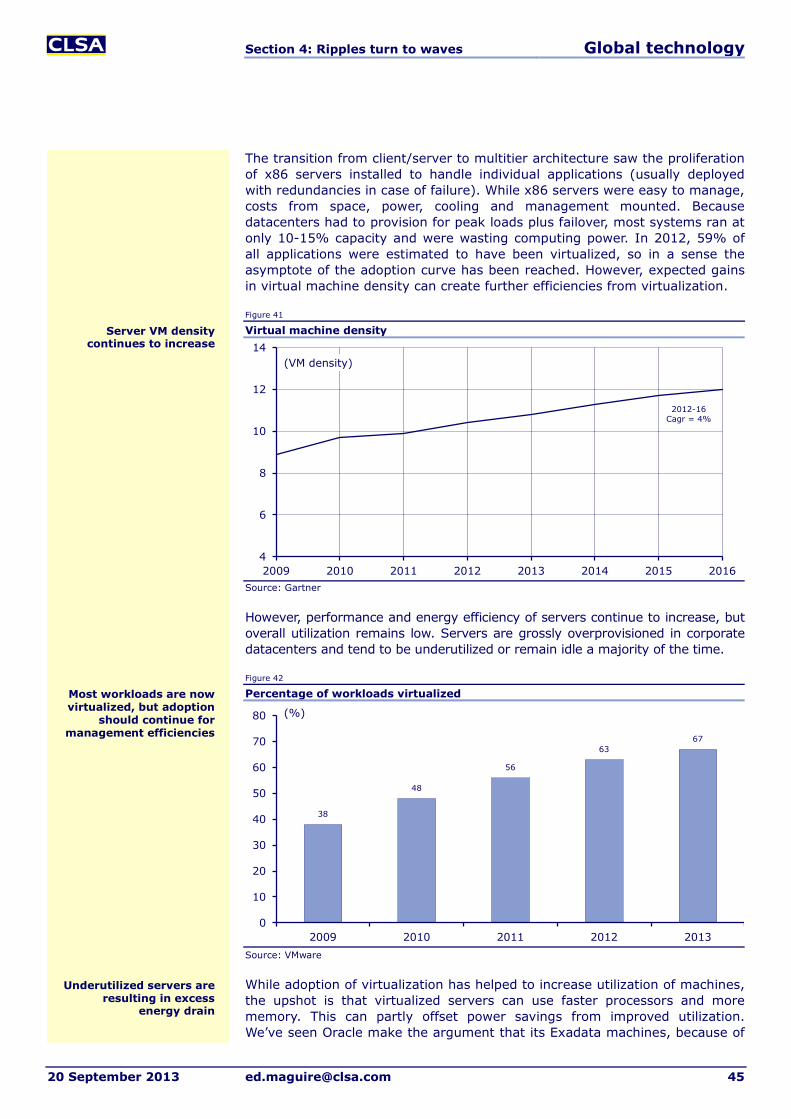
Section 4: Ripples turn to waves Global technology
20 September 2013 [email protected] 45
The transition from client/server to multitier architecture saw the proliferation of x86 servers installed to handle individual applications (usually deployed with redundancies in case of failure). While x86 servers were easy to manage, costs from space, power, cooling and management mounted. Because datacenters had to provision for peak loads plus failover, most systems ran at only 10-15% capacity and were wasting computing power. In 2012, 59% of all applications were estimated to have been virtualized, so in a sense the asymptote of the adoption curve has been reached. However, expected gains in virtual machine density can create further efficiencies from virtualization.
Figure 41
Virtual machine density
Source: Gartner
However, performance and energy efficiency of servers continue to increase, but overall utilization remains low. Servers are grossly overprovisioned in corporate datacenters and tend to be underutilized or remain idle a majority of the time.
Figure 42
Percentage of workloads virtualized
Source: VMware
While adoption of virtualization has helped to increase utilization of machines, the upshot is that virtualized servers can use faster processors and more memory. This can partly offset power savings from improved utilization. We’ve seen Oracle make the argument that its Exadata machines, because of
4
6
8
10
12
14
2009 2010 2011 2012 2013 2014 2015 2016
(VM density)
2012-16Cagr = 4%
38
48
56
6367
0
10
20
30
40
50
60
70
80
2009 2010 2011 2012 2013
(%)
Underutilized servers are resulting in excess
energy drain
Server VM density continues to increase
Most workloads are now virtualized, but adoption
should continue for management efficiencies

Section 4: Ripples turn to waves Global technology
46 [email protected] 20 September 2013
their tightly optimized performance capabilities, provide better utilization as well as power savings for running cloud-based workloads when compared to x86 server farms. Salesforce.com and Oracle’s multiyear agreement, under which Salesforce.com will commit to purchasing Exadata machines to support expansion of its platform and application infrastructure that was architected to run on Oracle database, could provide a case study in utilization.
Servers still account for a majority of the datacenter spend, despite the rapid growth in power and cooling-related costs. A study done by Amazon’s distinguished engineer James Hamilton showed that server hardware accounts for 57% of overall datacenter costs (both capex and opex) while energy accounts for about 30%. As such, even small energy savings at the server level could result in significant overall energy savings at the datacenter level. The ideal choice for datacenter operators would be to find a server that is cheaper, uses less energy and offers similar reliability and performance of the current generation servers. Microservers do not yet offer similar performance, but for certain applications, they offer good enough performance and reliability with much lower cost and energy usage, which we believe will drive adoption in the coming years.
Interest builds in low-power servers for internet datacenters With the increasing focus on energy efficiency in large datacenters (servers typically consume 70% of peak power draw while sitting idle), we are seeing growing interest in low-power servers (microservers), notably using ARM-based or Intel Atom processors. CLSA semiconductor analyst Srini Pajjuri’s discussions with industry participants suggest that initial targets for microservers are likely to be companies that have large-scale datacenters and control their own software, such as Facebook, Google and Amazon. Some have also highlighted the small- and medium-business (SMB) market as a target given the lower cost and simplicity of microservers. An HP graphic illustrates that microservers using low-power processors are best suited for web, social media and content delivery, while less suitable for mainstream enterprise IT.
Figure 43
Microserver application suitability
Source: HP
Mainstream enterprise IT would not benefit
from microservers
ARM makes sense for the cloud, big data, social
media and web hosting
A low-cost, low-power server would be the ideal
choice for datacenters

Section 4: Ripples turn to waves Global technology
20 September 2013 [email protected] 47
For enterprise IT, performance is an issue, but the bigger challenge is software compatibility. Microsoft Windows Server currently does not run on ARM. Atom-based microservers offer an attractive value proposition to certain applications that are less CPU intensive in the enterprise.
Open Compute - Open source for hardware The Open Compute project originated among a team of Facebook engineers that spent two years designing a datacenter from the ground up, with the goal to scale and manage in the most efficient manner possible. The project produced custom-designed servers, power supplies, server racks and battery-backup systems, which were created with datacenter needs in mind. Because of design choice like a 480-volt electrical distribution system, servers designed for efficiency, use of hot aisle and outside air for heating and cooling, Facebook’s first custom datacenter uses 38% less energy to do the same work as other existing facilities, while costing 24% less. The team decided to make the specifications available to everyone.
Figure 44 Figure 45
Open vault storage hardware V0.5 Open Compute datacenter electrical design
Source: OpenCompute.org
In additional to leading cloud-services providers, major financial firms are adopting Open Compute specifications, and manufacturers such as Intel, AMD, HP and Dell are building motherboards and blade servers to the new specs. Open Compute publishes open specifications and CAD drawings for virtual input/output (I/O), hardware management, Intel and AMD motherboards and power supplies, datacenter electrical and mechanical designs, rack standard, battery cabinet and storage.
Figure 46
Open Compute product contributions Company Segment Description AMD Motherboard AMD v2.0: Uses 2 AMD G34 processors (Magny Course or
Interlagos) AMD Open 3.0: 2 Opteron 6300 CPUs, targets Cloud, HPC
and Storage AppliedMicro Motherboard 64-bit ARM microserver board Calxeda Storage Project Knockout - storage board that has an ECX-1000
processor. Essentially converts Open Vault from a JABOD to a storage server
Fusion-IO Storage ioScale 3.2TB I/O PCIe card HYVE Storage Torpedo storage server - 2 OpenU storage server that hold
15 3.5" drives compatible with Open Rack Intel Motherboard Intel v2.0 uses 2 Xeon E5-2600 processors Silicon
Photonics Enabling 100Gbps interconnects to disaggregate additional
components traditionally bound to the motherboard Source: Open Compute, CA Taiwan, companies
Software compatibility is a major challenge for
enterprise IT penetration
Several members have contributed components
to the open-source community
The Open Compute project originated among
a team of Facebook engineers
Major financial firms are adopting Open Compute
specifications

Section 4: Ripples turn to waves Global technology
48 [email protected] 20 September 2013
The Open Compute Project has gained considerable momentum over the past year. The Group Hug project supports a new design for vendor-neutral servers that enable processor upgrades without needing to swap the entire motherboard. Intel, AMD, AppliedMicro and Calxeda have all announced support for Group Hug. Key members in the storage segment include EMC, Fusion-IO, Hitachi and SanDisk. On the microprocessor side, in addition to Intel and AMD, AppliedMicro, ARM, Calxeda and Tilera have all joined the project.
Storage - Growth offset by deflationary forces The adoption of cloud computing is likely to have mixed impact on the storage market. On one hand, proliferation of devices, applications and services will generate massive amounts of data that need to be stored somewhere. On the other hand, the rise of mega-datacenters will concentrate purchases of storage by cloud providers, so vendors will need to compete on economies of scale.
The cloud model - flash reduces need for redundancies The cloud-computing model, in which data are stored in a dedicated datacenter (often offsite in the case of public cloud), does away with the need for architectural redundancies in traditional storage. Traditional enterprise storage employs primary and secondary storage. Primary storage is accessed on a random basis and is used to support active applications (usually disc, increasingly flash). Secondary storage is designed for backup and data protection, using media such as tape, optical disc and virtual tape libraries. Cloud storage does away with the need for redundant systems, as most data can be stored on a single server. Flash storage, which is currently far more expensive than disc, can reduce the need for disc capacity by orders of magnitude because of the low disc utilization and redundancies needed to deliver good performance from discs.
The Big Data explosion favors storage providers The fundamental drivers of storage demand will continue to benefit from the proliferation of connected devices (and sensors) that will consume data-intensive services while generating massive amounts of data that will need to be stored. Growth of data has been forecast to be exponential over the next decade. A December 2012 IDC study sponsored by EMC forecasts the digital universe to reach 40 zettabytes (ZB) by 2020, representing 50-fold growth from the beginning of 2010. This would equate to 40ZB or 5,247GB per person worldwide. The study found that less than a third of the digital universe required data protection in 2010, but this is expected to exceed 40% by 2020. IDC estimates that nearly 40% of the information in the digital universe will be “touched” by cloud-computing providers in 2020. This means that a byte will be stored or processed in a cloud somewhere in the journey from originator to disposal. IDC estimates that as much as 15% will be maintained in a cloud.
A market subject to continual commoditization The dynamics of the storage market have seen multiple cycles of innovation, commoditization and disruption. The adoption of the cloud-computing model does not alter the outlook for storage to the same extent as for servers, for instance. Enterprise and datacenter-storage technology has long been informed by the need to balance availability, backup and recovery, archiving and compliance requirements with the cheapest appropriate medium.
Cloud computing is likely to have mixed impact on
the storage market
Cloud-computing model reduces redundancies in
traditional storage architecture
The digital universe will reach 40 zettabytes by 2020, representing 50-fold growth from 2010
The storage market sees cycles of innovation,
commoditization and disruption

Section 4: Ripples turn to waves Global technology
20 September 2013 [email protected] 49
Storage has been undergoing a process of commoditization since storage-area-network (SAN) software began to “pool” resources across discs. Tape and disc storage have long been virtualized through SAN architectures. Storage technologies consistently seek to allocate data to the most appropriate lowest-cost storage medium based on business need. This advances a process of continual deflation, which is offset by rapid growth in the quantities of data.
The physical storage market has long evidenced the dynamics of commoditization, as the robust growth of data was offset by rapidly declining cost of media and software-driven efficiencies, allowing the market to post modest sales growth while absorbing massive growth in data. Over the next five years, Gartner forecasts 31% growth in raw terabytes that will be stored in block-access external controller-based disk storage, with revenue growing at 4.2% annually.
Figure 47
Worldwide forecast for block-access external controller-based disk storage
2011 2012 2013 2014 2015 2016 2017 Cagr (%) 2012-17
Vendor revenue (US$bn) 16.5 16.9 17.6 18.3 19.0 19.9 20.8 4.2
Vendor revenue growth (%) - 2.3 4.1 3.8 4.4 4.5 4.5
Array units (1,000) 326 314 314 317 325 336 349 2.2
Array unit growth (%) - (3.7) (0.1) 1.1 2.5 3.3 4.0
Raw terabytes (m) 10.1 12.3 15.7 20.4 27.2 36.4 48.1 31.4
Raw terabyte growth (%) - 22.0 27.4 30.4 32.8 34.2 32.1
Source: Gartner
Storage infrastructure encompasses both the management software (eg, backup and recovery, replication, hierarchical storage management, storage-resource management, archiving and other capabilities) and the physical storage (eg, tape, discs and flash). Gartner expects the storage-management-software market to grow at better than 7% through 2017, as the migration of value towards more intelligent software continues to drive demand. Demand for storage-management software has not been as closely correlated to demand for underlying storage, as business drivers such as governance and compliance impact the need for management software, while data growth does not have a linear impact on scalability needs. It’s our view that cloud-based storage technologies are adjacencies rather than replacement offerings.
Figure 48
Storage-management market forecast (software only)
2011A 2012A 2013E 2014E 2015E 2016E 2017E Revenue (US$bn) 14.0 14.9 16.0 17.2 18.5 19.8 21.2 YoY growth (%) 13.8 6.4 7.3 7.7 7.3 7.0 7.1 Source: Gartner
Nonetheless, there is plenty of creative destruction in the storage-management-software market. Companies like Symantec, IBM and EMC see only modest growth for their traditional offerings (notably Symantec’s file system), but more rapidly growing vendors like CommVault and private vendors like Veeam and Varonis continue to gain share.
Declining costs keep storage revenue growth
lower than data volumes
Storage infrastructure encompasses
management software and physical storage
Storage-management software is forecast to
see 7%-plus growth over the next five years
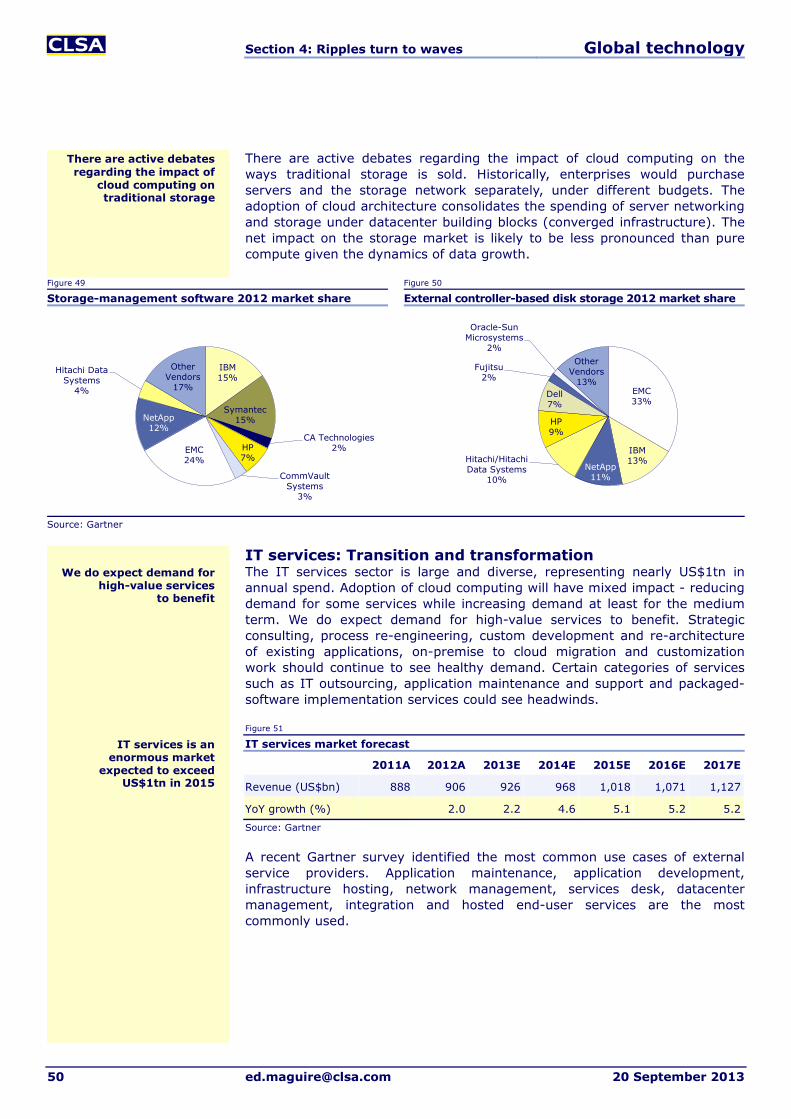
Section 4: Ripples turn to waves Global technology
50 [email protected] 20 September 2013
There are active debates regarding the impact of cloud computing on the ways traditional storage is sold. Historically, enterprises would purchase servers and the storage network separately, under different budgets. The adoption of cloud architecture consolidates the spending of server networking and storage under datacenter building blocks (converged infrastructure). The net impact on the storage market is likely to be less pronounced than pure compute given the dynamics of data growth.
Figure 49 Figure 50
Storage-management software 2012 market share External controller-based disk storage 2012 market share
Source: Gartner
IT services: Transition and transformation The IT services sector is large and diverse, representing nearly US$1tn in annual spend. Adoption of cloud computing will have mixed impact - reducing demand for some services while increasing demand at least for the medium term. We do expect demand for high-value services to benefit. Strategic consulting, process re-engineering, custom development and re-architecture of existing applications, on-premise to cloud migration and customization work should continue to see healthy demand. Certain categories of services such as IT outsourcing, application maintenance and support and packaged-software implementation services could see headwinds.
Figure 51
IT services market forecast
2011A 2012A 2013E 2014E 2015E 2016E 2017E
Revenue (US$bn) 888 906 926 968 1,018 1,071 1,127
YoY growth (%) 2.0 2.2 4.6 5.1 5.2 5.2 Source: Gartner
A recent Gartner survey identified the most common use cases of external service providers. Application maintenance, application development, infrastructure hosting, network management, services desk, datacenter management, integration and hosted end-user services are the most commonly used.
IBM15%
Symantec15%
CA Technologies2%HP
7%
CommVault Systems
3%
EMC24%
NetApp12%
Hitachi Data Systems
4%
Other Vendors
17% EMC33%
IBM13%
NetApp11%
Hitachi/Hitachi Data Systems
10%
HP9%
Dell 7%
Fujitsu2%
Oracle-Sun Microsystems
2%Other
Vendors13%
We do expect demand for high-value services
to benefit
IT services is an enormous market
expected to exceed US$1tn in 2015
There are active debates regarding the impact of
cloud computing on traditional storage
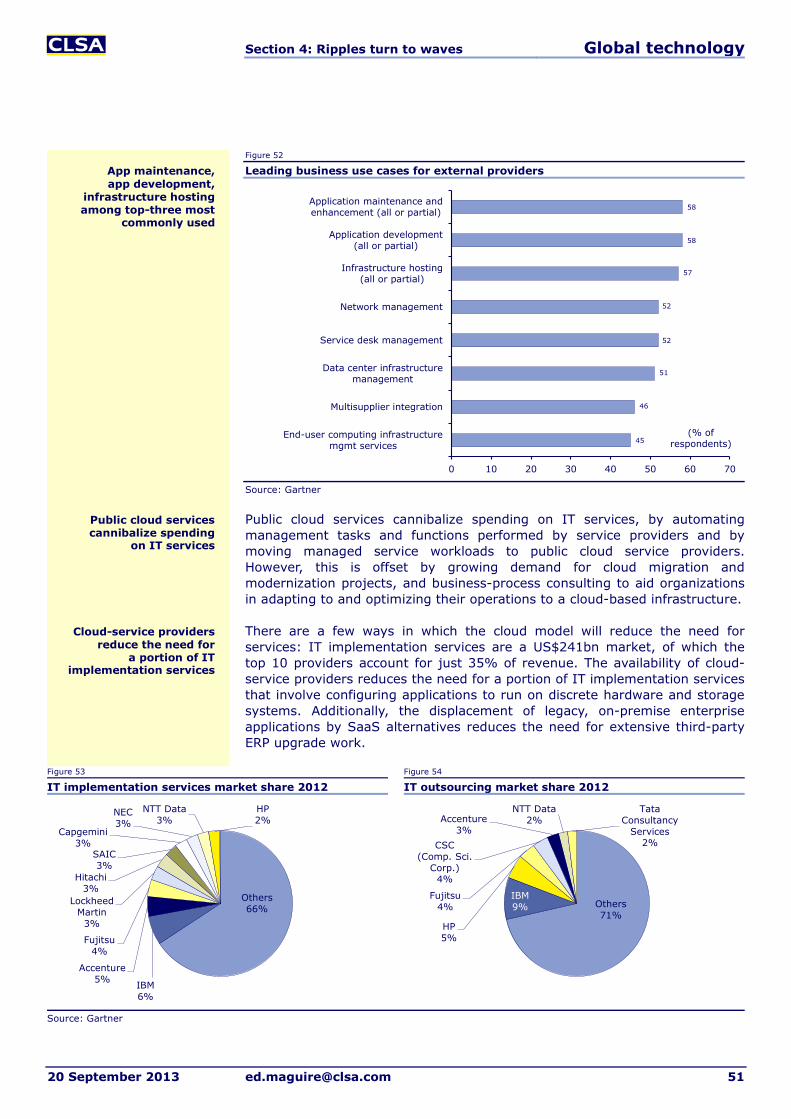
Section 4: Ripples turn to waves Global technology
20 September 2013 [email protected] 51
Figure 52
Leading business use cases for external providers
Source: Gartner
Public cloud services cannibalize spending on IT services, by automating management tasks and functions performed by service providers and by moving managed service workloads to public cloud service providers. However, this is offset by growing demand for cloud migration and modernization projects, and business-process consulting to aid organizations in adapting to and optimizing their operations to a cloud-based infrastructure.
There are a few ways in which the cloud model will reduce the need for services: IT implementation services are a US$241bn market, of which the top 10 providers account for just 35% of revenue. The availability of cloud- service providers reduces the need for a portion of IT implementation services that involve configuring applications to run on discrete hardware and storage systems. Additionally, the displacement of legacy, on-premise enterprise applications by SaaS alternatives reduces the need for extensive third-party ERP upgrade work.
Figure 53 Figure 54
IT implementation services market share 2012 IT outsourcing market share 2012
Source: Gartner
45
46
51
52
52
57
58
58
0 10 20 30 40 50 60 70
End-user computing infrastructuremgmt services
Multisupplier integration
Data center infrastructuremanagement
Service desk management
Network management
Infrastructure hosting(all or partial)
Application development(all or partial)
Application maintenance andenhancement (all or partial)
(% of respondents)
Others66%
IBM6%
Accenture5%
Fujitsu4%
Lockheed Martin
3%
Hitachi3%
SAIC3%
Capgemini3%
NEC3%
NTT Data3%
HP2%
Others71%
IBM9%
HP5%
Fujitsu4%
CSC (Comp. Sci.
Corp.)4%
Accenture3%
NTT Data2%
Tata Consultancy
Services2%
Public cloud services cannibalize spending
on IT services
Cloud-service providers reduce the need for
a portion of IT implementation services
App maintenance, app development,
infrastructure hosting among top-three most
commonly used

Section 4: Ripples turn to waves Global technology
52 [email protected] 20 September 2013
We’ve seen the rapid growth of SaaS vendors, such as Salesforce.com and Workday, impact growth of legacy CRM and HR applications from Oracle and SAP (and related IT services), but the transition occurs gradually. The pace of this transition differs depending on the type of application (and organization). For HR and CRM applications, there is already the availability of mature SaaS offerings in the market, and the relative performance and regulatory demands are more favorable to migration to third-party SaaS providers. For some applications, such as trading, data warehousing and finance, there are fewer SaaS alternatives. Organization in regulated industries such as finance, healthcare and government may have business reasons for keeping software running on premise.
IT outsourcing is a US$280bn industry, of which the top-seven providers account for 29% of the market. There is a continuum of public cloud service that spans the range from basic IaaS to managed hosting of dedicated servers to fully hosted applications and IT infrastructure. The market for outsourcing services is so broad and fragmented that it’s difficult to quantify potential substitution and disruption from IaaS offerings. Pure infrastructure services, such as compute and storage for testing/development and production, can be bundled with higher-value services such as business-process functions, governance and performance management. Generally, the higher-level offerings will have increasingly stringent service level agreements (SLAs) with value-added offerings. We’d increasingly expect traditional outsourcing services to be subsumed into higher-level offerings, as basic IaaS commoditizes rudimentary hosting and outsourcing services.
Networking - Towards software defined everything There has been a tremendous amount of interest in and hype related to software defined networking (SDN) and by extension the software defined datacenter (SDDC). Exploring the broader impact of SDN on the networking market is beyond the scope of this report, but it’s important to highlight the trend.
SDN and SDDC architectures endeavor to accelerate provisioning and management of networks through software in a similar way to how virtualization and software abstraction changed how servers are deployed. The goal of an SDN is to provide similar agility to networks. The SDN architecture decouples the control and data planes, centralizing networking intelligence and state. The underlying network infrastructure becomes abstracted from control applications. The result is programmable, automated network infrastructure that can be linked to high-level orchestration systems that can also control servers, storage and security. Ultimately software automation can control an entire datacenter, allowing for far greater flexibility, scalability and cost savings.
Abstracting the topology of the network and the datacenter reduces need for a lot of manual configuration and connections, reducing costs and overhead. In principle the SDN approach is analogous to virtualized servers, with cost savings coming from lower operational costs and the ability to use commodity hardware for storage, server and networking rather than proprietary devices. Thinking of the SDN software as akin to PaaS, this decouples software from the underlying hardware, allowing users to select the most appropriate or lowest-cost components.
We’d increasingly expect traditional outsourcing
services to be subsumed into higher-level offerings
SaaS offerings replace services-heavy ERP and
CRM applications
SDN abstracts networking akin to virtualization
of servers
SDN software also decouples software from the underlying hardware
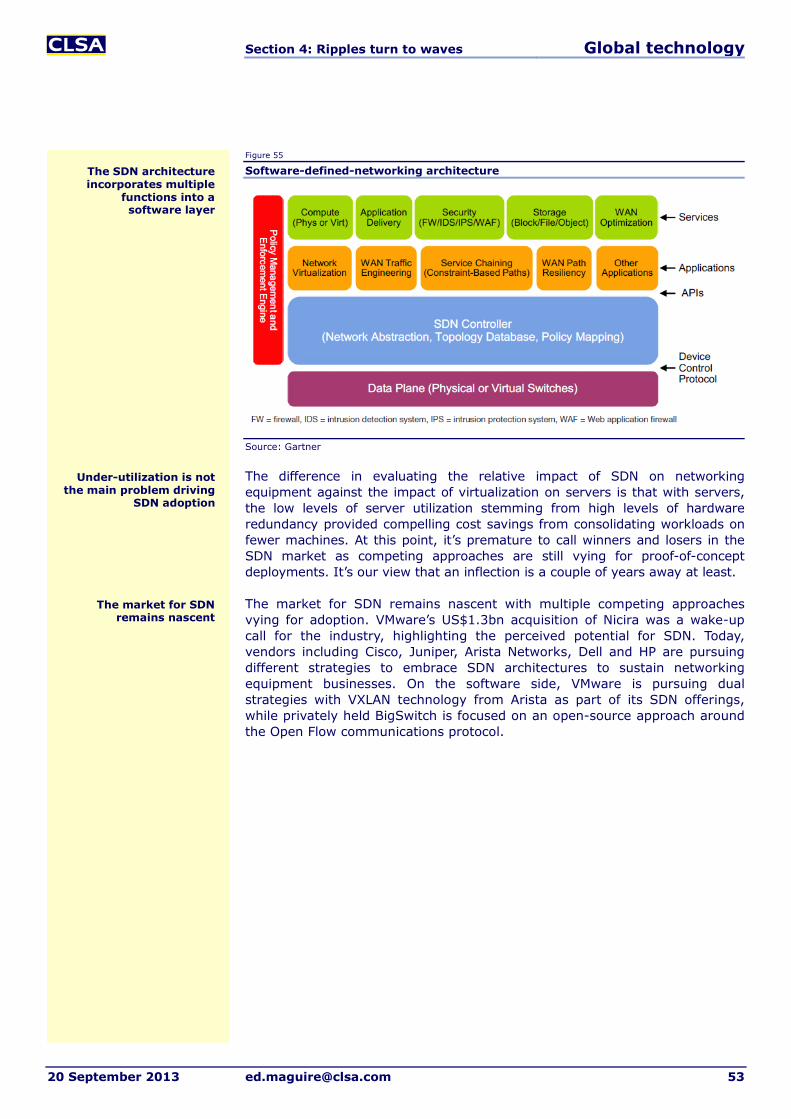
Section 4: Ripples turn to waves Global technology
20 September 2013 [email protected] 53
Figure 55
Software-defined-networking architecture
Source: Gartner
The difference in evaluating the relative impact of SDN on networking equipment against the impact of virtualization on servers is that with servers, the low levels of server utilization stemming from high levels of hardware redundancy provided compelling cost savings from consolidating workloads on fewer machines. At this point, it’s premature to call winners and losers in the SDN market as competing approaches are still vying for proof-of-concept deployments. It’s our view that an inflection is a couple of years away at least.
The market for SDN remains nascent with multiple competing approaches vying for adoption. VMware’s US$1.3bn acquisition of Nicira was a wake-up call for the industry, highlighting the perceived potential for SDN. Today, vendors including Cisco, Juniper, Arista Networks, Dell and HP are pursuing different strategies to embrace SDN architectures to sustain networking equipment businesses. On the software side, VMware is pursuing dual strategies with VXLAN technology from Arista as part of its SDN offerings, while privately held BigSwitch is focused on an open-source approach around the Open Flow communications protocol.
The SDN architecture incorporates multiple
functions into a software layer
Under-utilization is not the main problem driving
SDN adoption
The market for SDN remains nascent

Global technology
20 September 2013 [email protected] 55
Company profiles
Akamai ............................................................................................57
Amazon ...........................................................................................61
Delta ...............................................................................................67
EMC .................................................................................................69
Google .............................................................................................73
IBM .................................................................................................77
Intel ................................................................................................83
Microsoft .........................................................................................87
Oracle ..............................................................................................93
Quanta ............................................................................................99
Rackspace ..................................................................................... 101
Salesforce.com .............................................................................. 105
Tata Consultancy ........................................................................... 111
PC OEMs ........................................................................................ 115
All prices quoted herein are as at close of business 16 September 2013, unless otherwise stated

Akamai US$51.37 - BUY
Financials Year to 31 December 11A 12A 13CL 14CL 15CL Revenue (US$m) 1,159 1,374 1,561 1,789 2,036 Net income (US$m) 265 290 356 420 488 EPS (US$) 1.41 1.60 1.96 2.32 2.64 CL/consensus (21) (EPS%) - - 100 105 106 EPS growth (% YoY) - 13.2 22.7 18.2 13.9 PE (x) 36.6 32.3 26.3 22.3 19.6 EV/Ebitda (x) 19.8 17.8 15.6 12.9 10.8 FCF yield (%) 2.8 3.3 2.2 3.5 4.4 Source: Company, CLSA; consensus data from IBES; CL = estimate.
Find CLSA research on Bloomberg, Thomson Reuters, CapIQ and themarkets.com - and profit from our evalu@tor proprietary database at clsa.com
Ed Maguire [email protected] +1 212 549 8200
20 September 2013
USA Technology Reuters AKAM.OQ Bloomberg AKAM US
Priced on 16 September 2013 S&P 500 @ 1,697.6 12M hi/lo US$51.93/32.67 12M price target US$66.00 ±% potential +28% Shares in issue 179.4m Free float (est.) 96.9% Market cap US$9,152m 3M average daily volume US$72.3m Major shareholders The Vanguard Group 5.5%
Stock performance (%) 1M 3M 12M
Absolute 12.4 20.1 32.8 Relative 9.1 15.5 13.8 Abs (US$) 12.4 20.1 32.8
Source: Bloomberg
www.clsa.com
50
70
90
110
130
150
170
190
15
20
25
30
35
40
45
50
55
Sep 11 May 12 Jan 13 Sep 13
Akamai (LHS)
Rel to 500
(US$) (%)
Making the cloud run Building on its origins in delivering static content over the internet, Akamai has developed services that optimize application performance, security and ecommerce ROI. The “middle mile” remains a performance choke point for the cloud, and the firm’s intelligent technologies combine more than 130,000 global points of presence with cutting-edge analytics. Operational enhancement and technological portfolio expansion position the stock for further gains. We rate the shares BUY with a US$66 target.
Moving big data across the cloud Akamai’s core competency is moving bits (media, images, software, games, etc) across the public internet. The business benefits from periodic inflections in data traffic (eg, the rise of YouTube in 2005-06, proliferation of HD video in 2009-10). The current surge in streaming content, mobile and social applications is driving further growth in the demand.
Growing the footprint on the ground Management has a near-term goal of 18% revenue growth over the next three to five years, and with current forecasts modeling low-teens growth there’s an inflection in the works. Since mid-2012, Akamai has pursued an aggressive sales-force expansion that will increase total sales headcount by roughly 80% through the end of 2013. With roughly five quarters for new hires to become productive, we’d expect the fruits of this expansion in 2H13.
An expanding product portfolio There’s a healthy pipeline of new services offerings that complement its existing Media Delivery and Web-Performance and Security businesses. Security launched as an independent unit in 2012 with a range of anti- distributed denial of service (DDoS) related offerings. Late in 2012, Akamai announced deals with carriers AT&T and Orange to license its content delivery network (CDN) software, and this segment is seeing strong momentum. Slated for 2014 are hybrid cloud offerings that will target location-based ecommerce opportunities.
WD-40 for the cloud Akamai’s competitive advantage lies in the combination of network presence (its servers reside within thousands of networks and service providers to accelerate performance for the “last mile”) and proprietary technology (includes routing intelligence to avoid internet congestion). Software efficiencies allow the company to outpace pure price competition, while value-add services deliver real business value - not just infrastructure - to thousands of global customers.

Akamai - BUY Global technology
58 [email protected] 20 September 2013
Big throughput for the future cloud Akamai is focusing on increasing capacity from 10 TB/second today to 50 TB/second by 2015. The problems have changed since the company was founded in the 1990s - the last mile is no longer the biggest bottleneck. Edge capacity is moving towards 25 TB/second at endpoints. If there are 400m users, this is 10,000 TB/second at capacity. For carriers, it’s difficult to deliver more than 5 TB/second, and even with 100 carriers this is only a fraction of the needs.
Akamai’s vision is to extend its delivery platform to the home, office, business and carrier. The next-generation media platform is about extending the edge to the device. The company is working on a peering approach to technology. There are 30m Akamai clients that are helping with software delivery in the gaming vertical. This peering technology is improving development by 10x through client devices.
How to make the cloud run better Akamai has rebranded its offerings over the past year. Web Performance includes the Aqua Web Solutions product; this is the Dynamic Site Accelerator (DSA) for B2C sites, which has evolved into Aqua Ion. Terra Enterprise Solutions is Web App Accelerator and Terra Alta was announced last year. Revenue is based on the number of apps or sites times a price. This has stable pricing with uplift from new services, mobile adoption and value-add modules. Competition includes datacenter devices and CDNs.
There are a lot of challenges for performance because the character of the content has gotten heavier. There is also a lot of third-party content. Web coding is also inefficient. There are more types of devices, a lot of chatter protocols and mobile congestion. Mobile internet access was not designed for the web, so there are inherent inefficiencies. This is important because so much access is moving to mobile - today one of four users accesses commerce sites through mobile. The difference between desktop and mobile’s top-30 site load time is 2 seconds versus 9 seconds. The landline internet has not been at that level since 2001. Speed has direct impact on abandonment rates – and this has direct impact on the bottom line.
Optimizing the mobile experience The new Aqua Ion solution runs on the same platform as DSA. It’s a mobile optimization solution: it filters out attack traffic, detects if the device is in a congested network and applies optimizations for the type of content and device.
CEO Thomas Leighton explained how adoption of cloud architecture impacts performance. Routing across the public internet can be optimized. Communications protocols were designed 30-40 years ago and often require multiple round trips from device to server. Akamai’s proprietary communications protocol reduces the number of round trips. Typically there are 31 round trips, which isn’t a big deal; at the last mile, it’s not a big deal (except if it’s mobile); and in the middle mile this makes a huge difference. Pre-fetching is another approach to optimize the number of round trips, caching content locally in anticipation of client browsing patterns.
The new Aqua Ion product has generated a 50%-plus increase in download speeds over the DSA offering. Aqua has been able to improve the delivery to end users under the 2-second threshold. This improvement can increase conversion rates, with meaningful implications. Akamai’s Terra Alta offering for B2B has driven significant gains for ecommerce customers.
The last mile is no longer the biggest bottleneck
Akamai’s vision is to extend its delivery
platform to the home, office, business and carrier
Mobile internet access was not designed
for the web
Communications protocols were designed
30-40 years ago

Akamai - BUY Global technology
20 September 2013 [email protected] 59
Security offerings protect from massive attacks Security includes the Kona Site Defender product that comprises denial-of-service protection, a web app firewall and DNS protection. Revenue comes from the number of apps or sites times the price. The number of sites and apps are growing through re-driven transactions. Pricing is stable and average revenue per user (ARPU) is rising. There are a number of fragmented competitive offerings including datacenter devices, carrier filtering and cloud-washing solutions.
The company is working on improving adoption, expanding the channel, extending different types of applications that can be protected and potentially enabling managed security service providers (MSSPs). Attacks are evolving, becoming increasingly sophisticated. Attacks have come from glory hounds, political “hacktivism”, profit/ransom attacks and state-sponsored attacks.
Traditional solutions fail to meet the challenges. Datacenter devices can be overwhelmed. Carrier filtering helps but lacks scale and doesn’t do packet inspection. Cloud-washing solutions have performance issues. Akamai uses its distributed network to block DDoS traffic. Attacks can be absorbed by the Akamai pipe, which has plenty of headroom. The company has demonstrated how its web application firewall can filter out denial-of-service attacks and keep sites up and running. Mostly customers do not like their names used, but Akamai protected the 2012 Olympics. The Summer Olympics saw an enormous amount of attacks that were all protected.
Hybrid cloud solutions promise new market opportunities Akamai’s Hybrid Cloud product is under development for 2H13 beta. This is technology to optimize apps, SaaS apps and internet websites. The competitive landscape around WAN optimization is shifting to more of a lightweight service. The first customers are retailers who want to reach shoppers that are using smartphones in the store. Shoppers use smartphones for navigation, product alerts and quick response (QR) codes with information about the products. Shoppers using multiple channels will spend more (especially if they are using devices within the store). Akamai is working on putting software in the store to make the experience better for customers. Branch stores use multiprotocol label switching (MPLS) links to pull data from the central datacenter, but it’s easy for these endpoints to be overwhelmed as everything is coming over the WAN. Akamai is putting its software onto a commodity hardware box. The box can be connected to the branch router then connected to the datacenter.
Carriers are the next avenue for revenue growth The Aura Network Solutions line targets carriers. This business has two revenue streams: Orange is an OEM selling a CDN platform and a distributor. AT&T, Verizon, Orange and now SwissCom distribute the platforms. Competition includes device vendors and other CDN vendors. The competitive advantages are technology for scale and performance, the ability to federate and the large customer base. The company’s strategy is to help carriers reduce capex and colocation costs and improve penetration of the segment through partnerships.
Security is a new growth area for Akamai
Attacks can be absorbed by the Akamai pipe, which
has plenty of headroom
Carrier products: The Aura Network
Solutions line
Akamai’s Hybrid Cloud product is under
development

Akamai - BUY Global technology
60 [email protected] 20 September 2013
Summary financials Year to 31 December 2011A 2012A 2013CL 2014CL 2015CL Summary P&L forecast (US$m) Revenue 1,159 1,374 1,561 1,789 2,036 Op Ebitda 464 519 585 690 810 Op Ebit 296 315 403 485 584 Interest income 11 6 6 7 7 Interest expense - - - - - Other items 64 86 86 86 86 Profit before tax 371 408 495 577 677 Taxation (106) (118) (140) (157) (189) Minorities/pref divs/affils - - - - - Net income 265 290 356 420 488
Summary cashflow forecast (US$m) Net income 265 290 356 420 488 Operating adjustments (64) (86) (87) (86) (86) Depreciation/amortisation 168 204 182 206 226 Working capital changes - - - - - Non-operating adjustments 84 122 21 54 52 Net operating cashflow 453 530 474 594 680 Capital expenditure (183) (220) (272) (268) (265) Free cashflow 270 311 201 325 416 Acq/inv/disposals 354 (559) (23) - - Net investing cashflow 171 (779) (296) (268) (265) Increase in loans - - - - - Dividends 0 0 0 0 0 Net equity raised/other (294) (108) (94) (57) (57) Net financing cashflow (294) (108) (94) (57) (57) Incr/(decr) in net cash 330 (357) 83 268 359 Exch rate movements (2) 0 (11) (11) (11) Opening cash 232 559 202 274 532 Closing cash 559 202 275 532 880
Summary balance sheet forecast (US$m) Cash & equivalents 559 202 274 532 880 Debtors 211 219 274 315 358 Inventories - - - - - Other current assets 352 308 426 437 450 Fixed assets 293 345 446 509 547 Intangible assets 498 816 798 798 798 Other term assets 432 711 660 660 660 Total assets 2,346 2,601 2,878 3,250 3,693 Short-term debt 3 - - - - Creditors 124 176 205 235 268 Other current liabs 21 28 5 6 7 Long-term debt/CBs 41 52 66 66 66 Provisions/other LT liabs 0 0 - - - Minorities/other equity 0 (1) 0 0 0 Shareholder funds 2,156 2,346 2,602 2,943 3,353 Total liabs & equity 2,346 2,601 2,878 3,250 3,693
Ratio analysis Revenue growth (% YoY) - 18.6 13.6 14.5 13.9 Ebitda growth (% YoY) - 12.0 12.7 18.0 17.4 Ebitda margin (%) 40.0 37.8 37.5 38.6 39.8 Net income margin (%) 22.8 21.1 22.8 23.5 24.0 Dividend payout (%) 0.0 0.0 0.0 0.0 0.0 Effective tax rate (%) 28.7 28.9 28.2 27.2 27.9 Ebitda/net int exp (x) - - - - - Net debt/equity (%) (23.9) (6.4) (8.0) (15.8) (24.3) ROE (%) 12.3 12.9 14.4 15.1 15.5 ROIC (%) 11.7 11.7 12.6 14.5 16.8 EVA®/IC (%) 1.4 1.4 2.3 4.2 6.5 Source: CLSA

Amazon US$296.06 - OUTPERFORM
Financials Year to 31 December 11A 12A 13CL 14CL 15CL Revenue (US$m) 48,077 61,093 73,656 87,951 102,692 CSOI1 (US$m) 1,573 1,668 1,882 3,342 3,800 Net income (US$m) 632 (40) 162 1,196 2,461 Adjusted EPS (US$) 3.38 2.76 3.83 6.02 8.97 CL/consensus (42) (EPS%) - - 106 104 94 Adj EPS growth (% YoY) (16.0) (18.2) 38.7 57.1 49.1 Adjusted PE (x) 87.7 107.2 77.3 49.2 33.0 FCF yield (%) 1.5 0.3 1.2 2.2 3.4 PB (x) 17.9 17.8 17.3 15.2 11.2 ROE (%) 8.6 (0.5) 2.1 14.1 22.9 Net debt/equity (%) (34.1) (36.6) (51.1) (74.0) (94.4) 1Consolidated segment operating income. Source: Company, CLSA; consensus data from IBES; CL = estimate.
Find CLSA research on Bloomberg, Thomson Reuters, CapIQ and themarkets.com - and profit from our evalu@tor proprietary database at clsa.com
James Lee [email protected] +1 617 295 0120
Wei Fang +1 617 295 0128
20 September 2013
Global Media Reuters AMZN.OQ Bloomberg AMZN US
Priced on 16 September 2013 S&P 500 @ 1,697.6 12M hi/lo US$313.59/218.23 12M price target US$325.00 ±% potential +10% Shares in issue 461.0m Free float (est.) 79.0% Market cap US$135,265m 3M average daily volume US$673.9m Major shareholders Capital World Investors 5.2% FMR LLC 4.6%
Stock performance (%) 1M 3M 12M
Absolute 4.1 7.3 13.3 Relative 1.5 2.9 (2.2) Abs (US$) 4.1 7.3 13.3
Source: Bloomberg
www.clsa.com
50
100
150
200
250
300
350
400
0
50
100
150
200
250
300
350
Sep 08 May 10 Jan 12 Sep 13
Amazon (LHS)
Rel to 500
(US$) (%)
Dominant player in cloud Amazon is a dominant cloud player, providing a wide range of cloud-computing services through Amazon Website Services (AWS). The cloud platform has several hundred thousand customers running a variety of applications despite heightened competition. AWS is the fastest-growing segment within the company and we estimate a 56% revenue Cagr over the next two years. AWS is only a fraction of the total revenue base and we will continue to monitor its development. We reiterate our O-PF rating.
Dominant player in the cloud Amazon has a good set of cloud-computing products that allows enterprises to outsource their IT functions to more flexibly and efficiently control their costs. AWS provides cloud solutions ranging from online storage to database management, computing, messaging and so on. One key differentiator is its flexible usage-based pricing practice, enabling many small-and medium-sized businesses to benefit from the flexibility of public cloud computing. In addition, the company has also consistently lowered its prices over the past years, passing the economies of scale to customers. As a result, AWS grows its user base rapidly and has emerged as a dominant player in the space.
Leveraging partners to scale According to cloud-service agency Eucalyptus, Amazon has several hundred thousand customers, though many are still experimenting. Still, Eucalyptus is seeing more mission-critical applications running on AWS and estimates that half of the revenue growth will come from existing customers taking more services. Competition is heating up in the space as public cloud providers are moving to on premises and vice versa. AWS is leveraging partners like Eucalyptus to meet the demand of enterprises that seek this hybrid offering. We believe that AWS is a game-changer in the Silicon Valley, accelerating innovation because it allows startups to shift expenses to opex from capex.
Valuation We rate the stock an O-PF with a target price of US$325. Our target is based on 34x 15CL non-GAAP EPS of US$8.97 plus normalized cash of US$16 per share, at the midpoint of the past two year’s trading range of 25x and 40x.

Amazon - O-PF Global technology
62 [email protected] 20 September 2013
Big Kahuna breaks from the pack Amazon Simple Storage was launched in 2006, with EC2 later that year. Now there are over three dozen different services across compute, storage, management and development tools. The company does not disclose exact customer count, other than noting that it has ‘hundreds of thousands’ of clients in 190 countries.
AWS has emerged as a potent force in enterprise IT, as case studies and conversations with partners, consultants and customers reinforce the view that the weakness we have seen in servers (particularly Oracle/Sun and IBM’s x86 servers) have been commoditized by the move to the cloud model. AWS is the leading edge of IaaS, accounting for roughly 40-50% of the market, according to various industry estimates.
What’s notable about AWS is that it enables businesses to scale more rapidly than ever. Pinterest has disclosed how it grew its user base from zero to 15m in nine months, running entirely on AWS with a single IT staffer. CycleComputing uses AWS for supercomputing. Its client, pharmaceutical research firm Schrodinger, was able to harness 50,000 compute cores across Amazon's global AWS capacity to test 21m potential cancer compounds. To build out this capacity on a standalone basis would have cost US$20-25m. On Amazon, this took three hours to complete at under US$5,000 per hour.
Extending savings to the customer rather than keeping in house AWS has lowered prices 31 times since 2006. Amazon’s philosophy is to drive costs down through scale and efficiencies and it has made the decision to pass along cost-reduction benefits to the customer. The company launched AWS Trusted Advisor, an audit tool that provides recommendations to help customers save money. The idea is that the less the customers spend, the more likely they will be successful over time. There are lower variable expenses as well. IDC has estimated a 70% lower five-year TCO for customers migrating on-premise workloads to AWS.
Robust releases of new features Amazon’s pace of major features and services releases has been on a near-exponential trajectory, with 159 new features in 2012, up from 82 in 2011. The company has launched 53 new major features and services in 1Q13. As of April 2013, the number of active customers has increased 102% since the beginning of the year with a 53% increase in usage per customer. The AWS Marketplace was launched in 2012 and now has 25 categories and 778 product listings. Amazon itself has moved all of the websites from Amazon.com to AWS, improving utilization. In effect, it is reducing the cost of failure for experimentation towards zero, which allows users to experiment frequently at low cost.
Amazon does not disclose customer count other than indicating numbers in the ‘hundreds of thousands’, but customers are storing over 2tn objects. The service is running 1.1m peak requests per second. Last year, the company launched Dynamo DB, a key value store and managed non-relational database. Amazon launched a feature called local secondary query to allow queries on any attribute (previously just hash and range functions were supported).
Momentum accelerating. Cloud adoption appears to be accelerating in 2013 as businesses are rushing to move workloads and apps to the AWS cloud. Anecdotal evidence points to accelerating adoption of IaaS, and this is supported by external user surveys.
AWS has emerged as a potent force in
enterprise IT
The pace of major features and services is
on a near-exponential trajectory
AWS has lowered prices 31 times since 2006
Amazon does not disclose customers other than
indicating numbers in the ‘hundreds of thousands’
Amazon - O-PF Global technology
20 September 2013 [email protected] 63
It’s not just about cost. Although we hear compelling case studies around cost savings, users like that AWS enables new types of projects and applications that take advantage of global scale and bursting capabilities. Customers like the flexibility of the pricing model, but also specifically in the case of Amazon, the global footprint allows compliance with stringent data-storage regulations (notably in the EU).
Who’s on the short end of the stick? AWS adoption appears to impact server hardware and storage vendors the most. What we hear from customers is that existing licenses (for database and apps) are relatively safe in the absence of re-architecture (or substitution by SaaS), but traditional systems management and on-premise IT management tools are likely to be impacted. Amazon’s comments that it will continue to pass on savings to customers is great news for end users, but potentially bad news for enterprise IT vendors with high margins.
Case studies underscore the powerful ROI We share several public case studies from Amazon customers that illustrate the ROI equation. The data from Mars Curiosity Rover are flowing back to Amazon’s S3 storage services. Privately held Cycle computing is running loads with up to 100,000 cores at less than US$10,000 per hour. Samsung Electronics’ SmartHub for its SmartTVs would have cost US$34m in capex, and after evaluating the options, it went with AWS. Foursquare has operated with a 50% savings on analytics costs. Autodesk is using AWS Virtual Private Cloud to enable manufacturers to perform heavy computation. Another example is Climate Corp, which runs jobs of 4-5,000 cores with five trillion data points and 10,000 scenarios to predict weather in the USA. The company has seen 15x growth in data since last year. Hospitality is another important vertical for AWS. The Four Seasons, InterContinental Hotel Group, Kempinski and many other hotel chains are using AWS for IT. Startups including AirBnB are also operating 100% on AWS.
Healthcare cloud promotes global collaboration and self-service Bristol Meyers Squibb (BMS) has discussed its usage of AWS for research. The company is targeting older servers as part of an asset-reduction strategy. It has an internal grid and plans to keep retired servers dark in case they are needed. BMS created a virtual private network to the Amazon Gateway and configured a virtual private cloud (VPC) on EC2. The VPC isolates the environment from other internal users and external AWS customers. BMS provides users a self-provisioning portal that offers a variety of databases, servers and operating systems that can be set up in a few minutes. The ability to apply a business-hours use policy reduces the number of hours that are billed. After setting up the self-provisioning system, an analysis concluded that jobs could be completed at a time savings of 98% for very low cost. BMS was able to optimize clinical trials with a lower number of subjects and fewer visits required, cutting the time of the trials by months and cost by two-thirds.
Nasdaq uses AWS to offer a vertical-specific FinQloud Nasdaq OMX’s FinQloud is an industry-only cloud that combines industry knowledge and technology with AWS security and infrastructure. Nasdaq built solutions on EC2, S3 and EMR for its customers, while Holly Hasty from First Southwest (a regional investment bank) offers clearing services to brokers across the country. Nasdaq has stored market data on AWS and worked with the company X9 to provide access for app developers.
Data from Mars Curiosity Rover are flowing back to
Amazon’s S3 storage services
Bristol Meyers Squibb has discussed its usage of
AWS for research
FinQloud combines industry knowledge and tech with AWS security
and infrastructure

Amazon - O-PF Global technology
64 [email protected] 20 September 2013
GE introduces a product design cloud We’ve heard General Electric’s Business Integration Technology Laboratory draws parallels with AWS to Thomas Edison’s creation of the first commercial power grid in 1882 at 257 Pearl Street. The evolution of connectivity has been an exponential phenomenon. As a system’s complexity grows exponentially, there is a need for greater speed and scale to support the design-to-manufacturing process. GE wants to improve the speed by five times. The Crowded-drive Ecosystem for Evolutionary Design is a global environment that allows for collaborative design. Individual users can orchestrate their own workloads while collaborating with others. The GovCloud is an international traffic in arms regulations (ITAR) compliant environment. The model is collaborative, but federated so that the models, tools and data are distributed around the world while maintaining governance, ownership and security. EC2 allows for rapid prototyping, simulation and design, providing access to individuals and teams.
Healthcare and biotech building new vertical clouds as well Healthcare and biotech are changing from data driven to computational science. The Center for Disease Control (CDC) collects data about health risks to track diseases and other public health threats. BioSense 2.0 was built on AWS to enable collaboration to collect data, analyze and provide alerts. Healthcare providers, government, individuals and the CDC can all access this data.
Illumina is using AWS for its gene-sequencing technology. The firm provides DNA sequencing (roughly 95% of the genes sequenced so far), helping with cancer research, particularly in finding the differences between cancers. Its BaseSpace service allows information to be streamed to the cloud so that users can perform informatics on genomic data. In the past, Illumina put data on hard discs and shipped them; now with Direct Connect to AWS, data are uploaded directly and shared. The majority of MySeq instruments are connected and high-end systems are connecting at a rapid pace. The 1,000 Genome Project provides 250 TB of genomic data from 2,000 individuals, allowing anyone to access the data.
As a system’s complexity grows exponentially,
there is a need for greater speed and scale
Healthcare and biotech are changing from data driven to computational
science
Illumina is using AWS for its gene-sequencing
technology

Amazon - O-PF Global technology
20 September 2013 [email protected] 65
Summary financials Year to 31 December 2011A 2012A 2013CL 2014CL 2015CL Summary P&L forecast (US$m) Revenue 48,077 61,093 73,656 87,951 102,692 Op Ebitda 1,945 2,834 3,679 5,206 7,160 Op Ebit 862 676 638 2,066 3,729 Interest income 61 41 43 50 52 Interest expense (64) (92) (131) (131) (131) Other items 76 (80) (115) 0 0 Profit before tax 935 545 435 1,985 3,650 Taxation (291) (429) (249) (789) (1,189) Minorities/pref divs/affils (12) (156) (25) - - Net income 632 (40) 162 1,196 2,461
Summary cashflow forecast (US$m) Net income 632 (40) 162 1,196 2,461 Operating adjustments 0 0 - 0 0 Depreciation/amortisation 1,083 2,158 3,041 3,139 3,431 Working capital changes 1,463 1,175 332 179 217 Non-operating adjustments 725 925 1,189 1,192 1,292 Net operating cashflow 3,903 4,218 4,723 5,707 7,401 Capital expenditure (1,811) (3,784) (3,031) (2,639) (2,670) Free cashflow 2,092 434 1,692 3,068 4,731 Acq/inv/disposals (119) - - - - Net investing cashflow (1,930) (3,784) (3,031) (2,639) (2,670) Increase in loans (267) (267) (267) (267) (267) Dividends 0 0 0 0 0 Net equity raised/other (215) 62 62 62 62 Net financing cashflow (482) (205) (205) (205) (205) Incr/(decr) in net cash 1,491 229 1,487 2,863 4,526 Exch rate movements 1 0 0 0 0 Opening cash 3,777 5,269 5,498 6,985 9,848 Closing cash 5,269 5,498 6,985 9,848 14,374
Summary balance sheet forecast (US$m) Cash & equivalents 5,269 5,498 6,985 9,848 14,374 Debtors 2,571 2,749 3,315 3,958 4,621 Inventories 4,992 6,109 7,366 8,795 10,269 Other current assets 4,658 4,658 4,658 4,658 4,658 Fixed assets 4,417 6,370 6,716 6,540 6,130 Intangible assets 1,955 1,955 1,955 1,955 1,955 Other term assets 1,416 856 535 434 434 Total assets 25,278 28,195 31,529 36,188 42,441 Short-term debt - - - - - Creditors 11,145 14,051 16,941 20,229 23,619 Other current liabs 3,751 3,751 3,751 3,751 3,751 Long-term debt/CBs 2,625 2,676 2,959 3,134 2,607 Provisions/other LT liabs 0 0 0 0 0 Minorities/other equity 0 0 0 0 0 Shareholder funds 7,757 7,717 7,879 9,075 12,464 Total liabs & equity 25,278 28,195 31,529 36,188 42,441
Ratio analysis Revenue growth (% YoY) 40.6 27.1 20.6 19.4 16.8 Ebitda growth (% YoY) (1.4) 45.7 29.8 41.5 37.5 Ebitda margin (%) 4.0 4.6 5.0 5.9 7.0 Net income margin (%) 1.3 (0.1) 0.2 1.4 2.4 Dividend payout (%) 0.0 - 0.0 0.0 0.0 Effective tax rate (%) 31.1 78.7 57.1 39.7 32.6 Ebitda/net int exp (x) 648.3 55.6 41.8 64.3 90.6 Net debt/equity (%) (34.1) (36.6) (51.1) (74.0) (94.4) ROE (%) 8.6 (0.5) 2.1 14.1 22.9 ROIC (%) 12.2 2.9 6.3 40.1 164.5 EVA®/IC (%) 0.8 (8.3) (5.0) 28.7 153.1 Source: CLSA
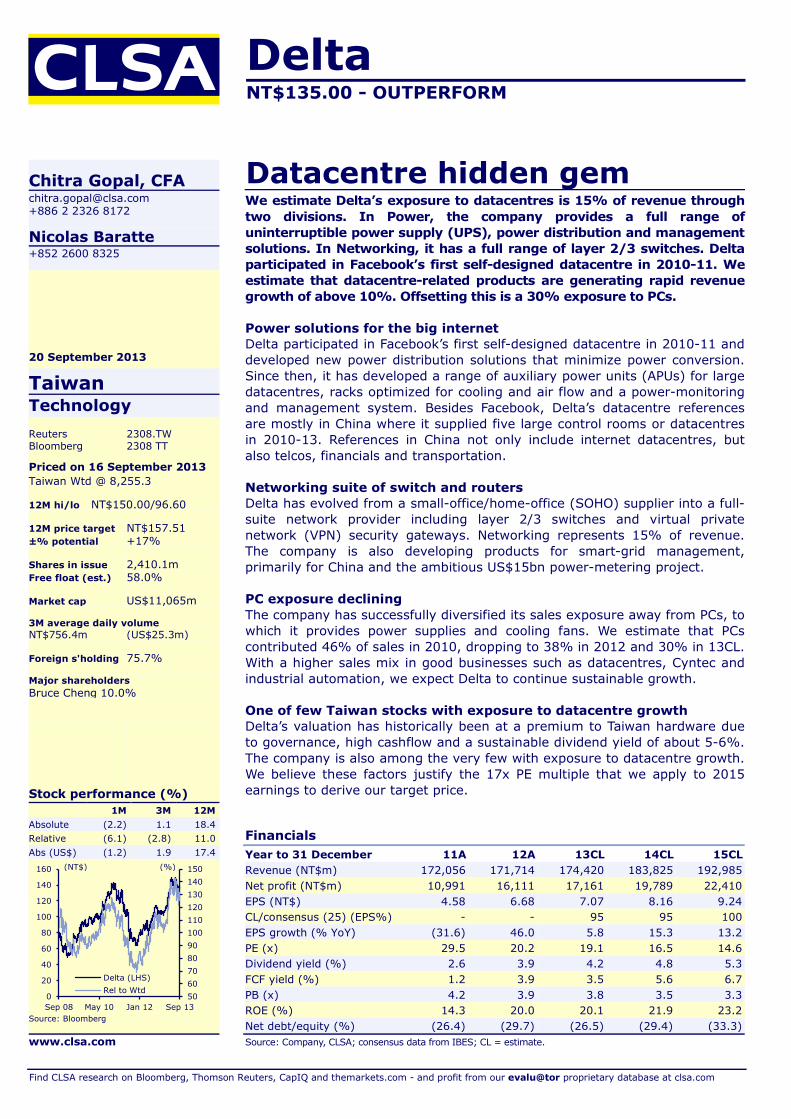
Delta NT$135.00 - OUTPERFORM
Financials Year to 31 December 11A 12A 13CL 14CL 15CL Revenue (NT$m) 172,056 171,714 174,420 183,825 192,985 Net profit (NT$m) 10,991 16,111 17,161 19,789 22,410 EPS (NT$) 4.58 6.68 7.07 8.16 9.24 CL/consensus (25) (EPS%) - - 95 95 100 EPS growth (% YoY) (31.6) 46.0 5.8 15.3 13.2 PE (x) 29.5 20.2 19.1 16.5 14.6 Dividend yield (%) 2.6 3.9 4.2 4.8 5.3 FCF yield (%) 1.2 3.9 3.5 5.6 6.7 PB (x) 4.2 3.9 3.8 3.5 3.3 ROE (%) 14.3 20.0 20.1 21.9 23.2 Net debt/equity (%) (26.4) (29.7) (26.5) (29.4) (33.3) Source: Company, CLSA; consensus data from IBES; CL = estimate.
Find CLSA research on Bloomberg, Thomson Reuters, CapIQ and themarkets.com - and profit from our evalu@tor proprietary database at clsa.com
Chitra Gopal, CFA [email protected] +886 2 2326 8172
Nicolas Baratte +852 2600 8325
20 September 2013
Taiwan Technology Reuters 2308.TW Bloomberg 2308 TT
Priced on 16 September 2013 Taiwan Wtd @ 8,255.3 12M hi/lo NT$150.00/96.60 12M price target NT$157.51 ±% potential +17% Shares in issue 2,410.1m Free float (est.) 58.0% Market cap US$11,065m 3M average daily volume NT$756.4m (US$25.3m) Foreign s'holding 75.7% Major shareholders Bruce Cheng 10.0%
Stock performance (%) 1M 3M 12M
Absolute (2.2) 1.1 18.4 Relative (6.1) (2.8) 11.0 Abs (US$) (1.2) 1.9 17.4
Source: Bloomberg
www.clsa.com
5060708090100110120130140150
0
20
40
60
80
100
120
140
160
Sep 08 May 10 Jan 12 Sep 13
Delta (LHS)Rel to Wtd
(NT$) (%)
Datacentre hidden gem We estimate Delta’s exposure to datacentres is 15% of revenue through two divisions. In Power, the company provides a full range of uninterruptible power supply (UPS), power distribution and management solutions. In Networking, it has a full range of layer 2/3 switches. Delta participated in Facebook’s first self-designed datacentre in 2010-11. We estimate that datacentre-related products are generating rapid revenue growth of above 10%. Offsetting this is a 30% exposure to PCs.
Power solutions for the big internet Delta participated in Facebook’s first self-designed datacentre in 2010-11 and developed new power distribution solutions that minimize power conversion. Since then, it has developed a range of auxiliary power units (APUs) for large datacentres, racks optimized for cooling and air flow and a power-monitoring and management system. Besides Facebook, Delta’s datacentre references are mostly in China where it supplied five large control rooms or datacentres in 2010-13. References in China not only include internet datacentres, but also telcos, financials and transportation.
Networking suite of switch and routers Delta has evolved from a small-office/home-office (SOHO) supplier into a full-suite network provider including layer 2/3 switches and virtual private network (VPN) security gateways. Networking represents 15% of revenue. The company is also developing products for smart-grid management, primarily for China and the ambitious US$15bn power-metering project.
PC exposure declining The company has successfully diversified its sales exposure away from PCs, to which it provides power supplies and cooling fans. We estimate that PCs contributed 46% of sales in 2010, dropping to 38% in 2012 and 30% in 13CL. With a higher sales mix in good businesses such as datacentres, Cyntec and industrial automation, we expect Delta to continue sustainable growth.
One of few Taiwan stocks with exposure to datacentre growth Delta’s valuation has historically been at a premium to Taiwan hardware due to governance, high cashflow and a sustainable dividend yield of about 5-6%. The company is also among the very few with exposure to datacentre growth. We believe these factors justify the 17x PE multiple that we apply to 2015 earnings to derive our target price.
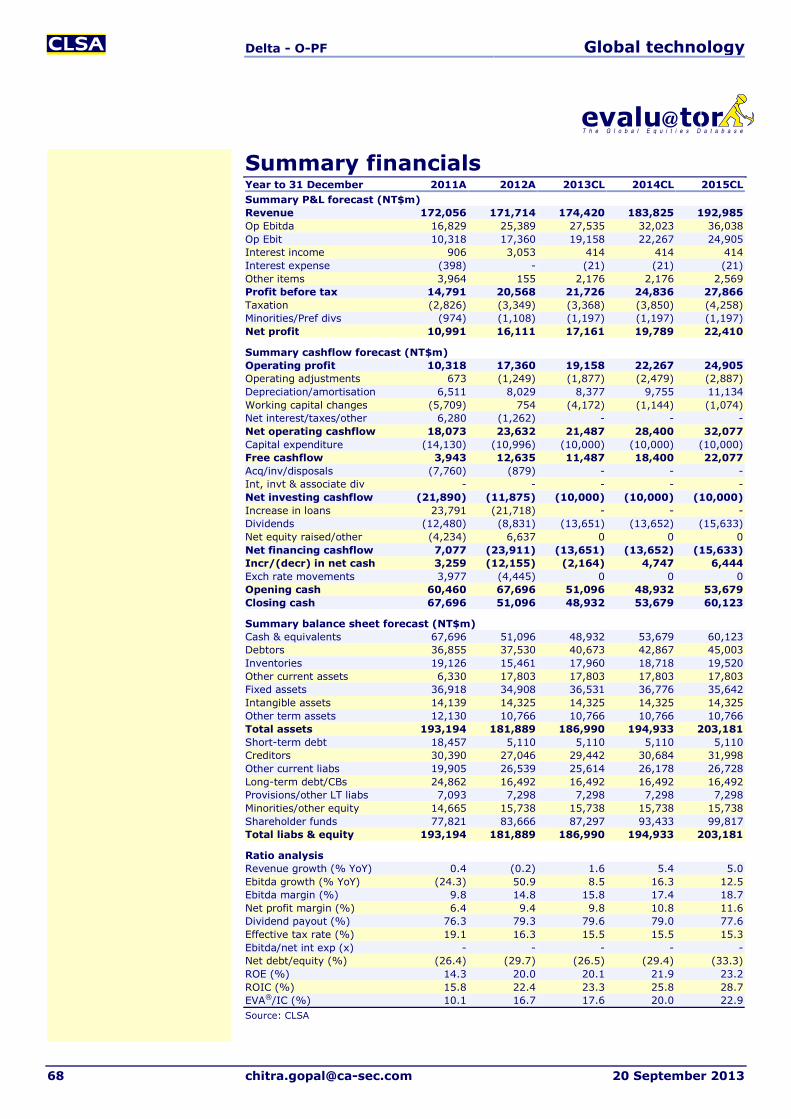
Delta - O-PF Global technology
68 [email protected] 20 September 2013
Summary financials Year to 31 December 2011A 2012A 2013CL 2014CL 2015CL Summary P&L forecast (NT$m) Revenue 172,056 171,714 174,420 183,825 192,985 Op Ebitda 16,829 25,389 27,535 32,023 36,038 Op Ebit 10,318 17,360 19,158 22,267 24,905 Interest income 906 3,053 414 414 414 Interest expense (398) - (21) (21) (21) Other items 3,964 155 2,176 2,176 2,569 Profit before tax 14,791 20,568 21,726 24,836 27,866 Taxation (2,826) (3,349) (3,368) (3,850) (4,258) Minorities/Pref divs (974) (1,108) (1,197) (1,197) (1,197) Net profit 10,991 16,111 17,161 19,789 22,410
Summary cashflow forecast (NT$m) Operating profit 10,318 17,360 19,158 22,267 24,905 Operating adjustments 673 (1,249) (1,877) (2,479) (2,887) Depreciation/amortisation 6,511 8,029 8,377 9,755 11,134 Working capital changes (5,709) 754 (4,172) (1,144) (1,074) Net interest/taxes/other 6,280 (1,262) - - - Net operating cashflow 18,073 23,632 21,487 28,400 32,077 Capital expenditure (14,130) (10,996) (10,000) (10,000) (10,000) Free cashflow 3,943 12,635 11,487 18,400 22,077 Acq/inv/disposals (7,760) (879) - - - Int, invt & associate div - - - - - Net investing cashflow (21,890) (11,875) (10,000) (10,000) (10,000) Increase in loans 23,791 (21,718) - - - Dividends (12,480) (8,831) (13,651) (13,652) (15,633) Net equity raised/other (4,234) 6,637 0 0 0 Net financing cashflow 7,077 (23,911) (13,651) (13,652) (15,633) Incr/(decr) in net cash 3,259 (12,155) (2,164) 4,747 6,444 Exch rate movements 3,977 (4,445) 0 0 0 Opening cash 60,460 67,696 51,096 48,932 53,679 Closing cash 67,696 51,096 48,932 53,679 60,123
Summary balance sheet forecast (NT$m) Cash & equivalents 67,696 51,096 48,932 53,679 60,123 Debtors 36,855 37,530 40,673 42,867 45,003 Inventories 19,126 15,461 17,960 18,718 19,520 Other current assets 6,330 17,803 17,803 17,803 17,803 Fixed assets 36,918 34,908 36,531 36,776 35,642 Intangible assets 14,139 14,325 14,325 14,325 14,325 Other term assets 12,130 10,766 10,766 10,766 10,766 Total assets 193,194 181,889 186,990 194,933 203,181 Short-term debt 18,457 5,110 5,110 5,110 5,110 Creditors 30,390 27,046 29,442 30,684 31,998 Other current liabs 19,905 26,539 25,614 26,178 26,728 Long-term debt/CBs 24,862 16,492 16,492 16,492 16,492 Provisions/other LT liabs 7,093 7,298 7,298 7,298 7,298 Minorities/other equity 14,665 15,738 15,738 15,738 15,738 Shareholder funds 77,821 83,666 87,297 93,433 99,817 Total liabs & equity 193,194 181,889 186,990 194,933 203,181
Ratio analysis Revenue growth (% YoY) 0.4 (0.2) 1.6 5.4 5.0 Ebitda growth (% YoY) (24.3) 50.9 8.5 16.3 12.5 Ebitda margin (%) 9.8 14.8 15.8 17.4 18.7 Net profit margin (%) 6.4 9.4 9.8 10.8 11.6 Dividend payout (%) 76.3 79.3 79.6 79.0 77.6 Effective tax rate (%) 19.1 16.3 15.5 15.5 15.3 Ebitda/net int exp (x) - - - - - Net debt/equity (%) (26.4) (29.7) (26.5) (29.4) (33.3) ROE (%) 14.3 20.0 20.1 21.9 23.2 ROIC (%) 15.8 22.4 23.3 25.8 28.7 EVA®/IC (%) 10.1 16.7 17.6 20.0 22.9 Source: CLSA

EMC US$26.88 - OUTPERFORM
Financials Year to 31 December 11A 12A 13CL 14CL 15CL Revenue (US$m) 20,008 21,714 23,406 25,371 27,374 Net income (US$m) 3,365 3,695 4,060 4,563 4,924 EPS (US$) 1.51 1.67 1.87 2.20 2.42 CL/consensus (41) (EPS%) - - 101 105 103 EPS growth (% YoY) 19.4 10.9 11.9 17.2 10.2 PE (x) 17.8 16.1 14.3 12.2 11.1 Dividend yield (%) 0.0 0.0 0.7 1.5 1.5 FCF yield (%) 7.4 8.5 8.5 10.0 10.8 PB (x) 3.1 2.6 2.4 2.1 1.7 ROE (%) 18.2 17.5 17.3 17.8 16.9 Net debt/equity (%) (5.5) (12.9) (6.6) (13.8) (24.9) Source: Company, CLSA; consensus data from IBES; CL = estimate.
Find CLSA research on Bloomberg, Thomson Reuters, CapIQ and themarkets.com - and profit from our evalu@tor proprietary database at clsa.com
Louis Miscioscia, CFA [email protected] +1 212 408 5662
20 September 2013
USA Technology Reuters EMC.N Bloomberg EMC US
Priced on 16 September 2013 S&P 500 @ 1,697.6 12M hi/lo US$28.18/21.45 12M price target US$30.00 ±% potential +12% Shares in issue 2.2m Free float (est.) 100.0% Market cap US$55,933m 3M average daily volume US$378.8m Major shareholders The Vanguard Group, Inc. 4.6% State Street Global Advisors 4.1%
Stock performance (%) 1M 3M 12M
Absolute 3.9 8.6 (3.5) Relative 1.3 4.0 (16.7) Abs (US$) 3.9 8.6 (3.5)
Source: Bloomberg
www.clsa.com
50
70
90
110
130
150
170
190
210
5
10
15
20
25
30
35
Sep 08 May 10 Jan 12 Sep 13
EMC (LHS)
Rel to 500
(US$) (%)
Virtualization of everything We view the virtualization of everything, including SDDC for companies with existing datacenters, legacy applications or public/private clouds, as both a risk and an opportunity for EMC. The risk is that virtualization could commoditize hardware, though in the near term this threat appears low as many organizations do not want to build systems with unproven products. The opportunity, as with any new type of computing, goes to the company that can seize this architectural shift.
Products reasonably well positioned for the coming cloud wave EMC seems less at risk than smaller vendors mainly due to its breadth and depth of product and incumbent status. The company is best positioned with its ownership of VMware, which aims to be a leader in clouds and SDDC with vCloud. VMware also has its own cloud stack of software, although it is mostly faulted for not being open in comparison to OpenStack or CloudStack. Besides its VMware advantage, EMC enjoys an installed base of storage solutions around the globe and has the benefit of scale, partnerships and integration to survive and thrive in the new environment. The VNX/VNXe launched in 2011 also pushed the company into a leading spot in converged architecture solutions.
IT managers are risk adverse The old saying used to be that no datacenter manager was ever fired for buying IBM (the suggestion that it was the safe, low-risk solution). The same today goes for EMC. When installing a new type of IT solution, it’s said that you are not on the “leading edge” of technology, but the “bleeding edge” for the pain that is often inflicted in making it work. Thus vendors often continue to buy what they have previously bought as it is low risk.
Knowledge of IT processes takes time; limited for “new” technologies Incumbents have products readily available today, and while not the lowest-capital cost option, and at times quite expensive compared to the alternative, they are tested and proven. Even when planning something new, such as a cloud, it might be the current products that get picked over new unproven ones. Besides familiarity with these products, there is a base of knowledge and experience within one’s own company and broadly in the IT industry that does not emerge quickly. With new technologies, it’s often difficult to find experienced assistance.
EMC - O-PF Global technology
70 [email protected] 20 September 2013
Dominant IT providers at risk With the coming cloud onslaught and the possible re-architecting of datacenters, dominant IT providers appear to be at risk. If there is one vendor with the weapons in its arsenal to fight and win, we believe it’s EMC. The company owns over 80% of VMware, which basically started the shift to the cloud with virtualization; however, that does not ensure dominance as the next waves come in. It’s still a jumpball as many companies are beginning to offer cloud stacks. If a company wants to maximize cost savings and invest in the future, then the open-source cloud stacks or private clouds with commodity servers and disks may be the right solution. EMC’s products that have ties to cloud storage are:
Isilon The niche leader in scale-out network attached storage (NAS) was acquired in late 2010. Isilon’s revenue was US$60m in 4Q10 or US$240m annualized. In 2013, Atmos and Isilon together have over a US$1bn run rate. The focus initially was Big Data, which meant big files, usually associated with huge data sets like video (movies), scientific in general, for the oil & gas and medical sectors.
EMC has pushed to broaden the definition of Big Data to mean massive amounts of data, not just big files. In comparison to the rest of the product line, this scale-out NAS, with support for large clusters systems, is more in line with a cloud approach than the other EMC products. Still, there are drawbacks as the file systems have limits on the amount of data in a file, the number of files and constraints in crossing over from one silo of storage device to another. In May 2013, EMC updated the Isilon platform to make the product line more cloud and mobility friendly.
Atmos This solution is actually the cloud, specifically cloud storage. EMC’s concept is that if a company does not want to run on a public cloud via say Amazon due to the variety of issues with a public cloud, then it could buy a preconfigured system with the same components of a public cloud but installed on its own datacenter (ie, a private cloud) and enjoy the same benefits. It’s hard to evaluate if this product solution is as good as acquiring a cloud stack and doing it oneself, but at least it is a true cloud solution.
Also, EMC’s Atmos advertising suggests an 80% savings in storage costs versus a normal approach, which we understand to be cloud storage with commodity hardware versus storage arrays.
Virtual Computing Environment Co (VCE) The joint venture was created in November 2009 when Cisco, EMC and VMware decided to create a converged infrastructure product that would help customers deploy IT solutions and move to the cloud. In a converged system model, networking, compute, storage and visualization are included in one product. VCE’s demand run rate surpassed US$1bn in revenue in 4Q12. The product competes directly with Oracle’s ExaLogic and NetApp/Cisco’s FlexPod and is sold exclusively through the channel. Tie in to the cloud is possible, but VCE is not a low-cost commodity product. It is basically integrated, made easier to deploy, but not a low-cost option.
Atmos is cloud storage with 80% cost
savings versus conventional approaches
The Isilon acquisition signals a strategy
in line with a cloud approach
EMC is well positioned in this new marketplace

EMC - O-PF Global technology
20 September 2013 [email protected] 71
Summary financials Year to 31 December 2011A 2012A 2013CL 2014CL 2015CL Summary P&L forecast (US$m) Revenue 20,008 21,714 23,406 25,371 27,374 Op Ebitda 4,864 5,492 6,055 6,898 7,497 Op Ebit 3,442 3,964 4,416 5,175 5,704 Interest income 129 115 117 65 60 Interest expense (170) (79) (152) (200) (200) Other items 752 766 721 772 772 Profit before tax 4,153 4,766 5,102 5,812 6,336 Taxation (640) (918) (883) (1,088) (1,242) Minorities/pref divs/affils (148) (153) (159) (161) (170) Net income 3,365 3,695 4,060 4,563 4,924
Summary cashflow forecast (US$m) Net income 3,365 3,695 4,060 4,563 4,924 Operating adjustments (904) (963) (982) (1,012) (1,012) Depreciation/amortisation 1,422 1,528 1,639 1,723 1,793 Working capital changes 1,071 1,191 306 256 151 Non-operating adjustments 715 811 900 877 882 Net operating cashflow 5,669 6,262 5,923 6,407 6,737 Capital expenditure (1,244) (1,238) (996) (820) (820) Free cashflow 4,425 5,024 4,927 5,587 5,917 Acq/inv/disposals (2,300) (2,667) (3,852) 0 0 Net investing cashflow (3,544) (3,905) (4,848) (820) (820) Increase in loans (24) (1,711) 5,442 0 0 Dividends 0 0 (430) (831) (813) Net equity raised/other (1,695) (438) (1,895) (2,550) (800) Net financing cashflow (1,719) (2,149) 3,117 (3,381) (1,613) Incr/(decr) in net cash 407 208 4,192 2,205 4,304 Exch rate movements 5 15 (82) 0 0 Opening cash 4,119 4,531 4,754 8,864 11,070 Closing cash 4,531 4,754 8,864 11,070 15,374
Summary balance sheet forecast (US$m) Cash & equivalents 4,531 4,754 8,864 11,070 15,374 Debtors 2,937 3,433 3,790 4,083 4,389 Inventories 1,010 1,201 1,370 1,438 1,521 Other current assets 3,104 2,820 5,200 5,200 5,200 Fixed assets 2,833 3,145 3,541 4,181 4,821 Intangible assets 13,921 15,875 15,833 15,833 15,833 Other term assets 5,931 6,840 8,100 8,100 8,100 Total assets 34,268 38,069 46,698 49,905 55,237 Short-term debt 3,305 1,652 1,650 1,650 1,650 Creditors 1,102 1,041 1,209 1,269 1,342 Other current liabs 5,970 7,611 7,998 8,140 8,311 Long-term debt/CBs 119 58 5,530 5,530 5,530 Provisions/other LT liabs 3,493 4,183 4,724 5,141 5,436 Minorities/other equity 733 958 1,117 1,278 1,448 Shareholder funds 19,547 22,565 24,469 26,898 31,521 Total liabs & equity 34,268 38,069 46,698 49,905 55,237
Ratio analysis Revenue growth (% YoY) 17.6 8.5 7.8 8.4 7.9 Ebitda growth (% YoY) 26.3 12.9 10.3 13.9 8.7 Ebitda margin (%) 24.3 25.3 25.9 27.2 27.4 Net income margin (%) 16.8 17.0 17.3 18.0 18.0 Dividend payout (%) 0.0 0.0 10.7 18.2 16.5 Effective tax rate (%) 15.4 19.3 17.3 18.7 19.6 Ebitda/net int exp (x) 118.0 - 174.5 51.1 53.5 Net debt/equity (%) (5.5) (12.9) (6.6) (13.8) (24.9) ROE (%) 18.2 17.5 17.3 17.8 16.9 ROIC (%) 16.8 17.0 17.6 18.6 19.6 EVA®/IC (%) 4.1 4.3 4.8 5.9 6.9 Source: CLSA

Google US$887.76 - BUY
Financials Year to 31 December 11A 12A 13CL 14CL 15CL Revenue (US$m) 37,905 51,379 59,682 71,538 85,227 Ebitda (US$m) 14,006 16,198 17,817 22,846 28,647 Net income (US$m) 9,737 10,520 12,953 15,875 20,532 Adjusted EPS (US$) 36.06 39.88 43.87 54.49 67.86 CL/consensus (41) (EPS%) - - 100 106 111 Adj EPS growth (% YoY) 21.8 10.6 10.0 24.2 24.5 Adjusted PE (x) 24.6 22.3 20.2 16.3 13.1 FCF yield (%) 3.8 4.5 3.8 6.1 7.6 PB (x) 5.0 4.1 3.7 3.0 2.4 ROE (%) 18.7 16.2 15.9 17.5 18.2 Net debt/equity (%) (9.9) (12.9) (26.2) (40.0) (51.2) Source: Company, CLSA; consensus data from IBES; CL = estimate.
Find CLSA research on Bloomberg, Thomson Reuters, CapIQ and themarkets.com - and profit from our evalu@tor proprietary database at clsa.com
James Lee [email protected] +1 617 295 0120
Wei Fang +1 617 295 0128
20 September 2013
Global Media Reuters GOOG.O Bloomberg GOOG US
Priced on 16 September 2013 S&P 500 @ 1,697.6 12M hi/lo US$928.00/636.00 12M price target US$1,075.00 ±% potential +21% Shares in issue 326.0m Free float (est.) 100.0% Market cap US$295,820m 3M average daily volume US$1,741.3m Major shareholders Fidelity Management 5.9%
Stock performance (%) 1M 3M 12M
Absolute 3.6 1.2 25.1 Relative 1.1 (3.0) 8.0 Abs (US$) 3.6 1.2 25.1
Source: Bloomberg
www.clsa.com
90
95
100
105
110
115
120
125
0100200300400500600700800900
1,000
Sep 11 May 12 Jan 13 Sep 13
Google (LHS)
Rel to 500
(US$) (%)
Big scale, modest profile Google’s massive scale can only be rivaled by a few globally. Its SaaS offerings are widely deployed with an estimated 425m users and 5m businesses using various applications. The company is a meaningful competitor to Microsoft’s Office365 based on pricing and ease of use for small businesses. Like other Google properties, a key strength is its user friendliness to developers. However, the enterprise cloud services have not received either the profile or attention of its competitors.
SaaS: Google Apps square off against Office365 Google bundles several independently customizable products under the Apps umbrella, charging a US$5 monthly user fee (free for education). Google Apps have seen mixed adoption at larger organizations due to security concerns and deployment challenges. However, its aggressive pricing has attracted over 5m business users while pressuring Microsoft’s Office365 on pricing.
Fueling AppEngine IaaS AppEngine is Google’s PaaS platform for developing and hosting web applications. Previewed in April 2008 and released in September 2011, AppEngine supports multiple programming languages but is designed with a broad range of services to make development fast and easy, while supporting a limited range of applications designed for Google’s infrastructure.
Big infrastructure Google was late to the market with pure IaaS, announcing Google Compute Engine in June 2012. The company gets high marks from users for rapid scalability, reliability and per-minute billing. However, it trails Microsoft Azure and AWS in features, customer support and referenceable case studies.
Focusing on developers through open-source technologies Google has built a full stack of cloud services on its global infrastructure, also including cloud storage, Big Data analytics (BigQuery), hosted MySQL database (Cloud SQL), as well as prediction API and translate API, which enable developers to incorporate predictive analytics and translation into web applications. Google has the scale to compete head on with AWS and Microsoft and has emphasized an open-source approach around software.
Big scale, modest profile By dint of its massively scalable global infrastructure, Google is one of the few vendors with the capability to challenge Amazon in the IaaS market head to head. Perhaps because of the breadth of focus, Google’s enterprise cloud services have not received either the profile or attention of its competitors.

Google - BUY Global technology
74 [email protected] 20 September 2013
Leveraging search infrastructure for cloud services Google’s SaaS offerings are widely deployed with an estimated 425m users and 5m businesses using various applications. The company has emerged as a meaningful competitor to Microsoft’s Office365 based on pricing and ease of use for small businesses. However, it has suffered negative publicity around several high-profile large deployments, notably a large win at the City of Los Angeles. There is a perception in the market that Google is not focused on the enterprise, which seems to be reinforced by its acquisition of Postini, a SaaS email-security business for US$625m in 2007, only to be shut down in 2012.
Scope and scale in the cloud Google does not publicly disclose details of its network infrastructure, but it has made references to an Atlas Top 10 report that ranks the company as the third-largest global ISP, trailing Level 3 and Global Crossing. Google has numerous datacenters around the world, with at least 12 locations in the USA. Most of the software stack used within the company was developed in house. Commodity x86 servers run custom versions of Linux, with the design goal being maximum performance per dollar. It’s not known how many servers Google operates, but we’ve seen estimates ranging from 900,000 (based on datacenter electricity calculations) to between 1.9m and 2.3m (based on known datacenter square footage).
Technology leadership focuses on developers A key goal for Google is to make development easier for programmers. In addition to offering the AppEngine and related services, the company has created a Cloud Playground environment where developers can quickly try out ideas. In January, Google moved its cloud platform to the GitHub collaborative development environment to accelerate this evolution.
A notable project in Google’s cloud efforts is CapeDwarf, a project in collaboration with the Red Hat/JBoss application server to deliver an alternate implementation of AppEngine that runs on JBoss. This would enable AppEngine applications to be deployed on premise or on private clouds, providing levels of code portability that would allow users to leverage AppEngine as a development and testing platform while opening up options for deployment.
Google Apps struggle to be enterprise ready
Possibly the third-largest global ISP
Making development easier for programmers

Google - BUY Global technology
20 September 2013 [email protected] 75
Summary financials Year to 31 December 2011A 2012A 2013CL 2014CL 2015CL Summary P&L forecast (US$m) Revenue 37,905 51,379 59,682 71,538 85,227 Op Ebitda 14,006 16,198 17,817 22,846 28,647 Op Ebit 12,155 13,236 14,855 19,884 25,685 Interest income 584 625 711 650 700 Interest expense - - - - - Other items 0 0 0 0 0 Profit before tax 12,739 13,861 15,566 20,534 26,385 Taxation (3,002) (3,341) (3,392) (4,659) (5,853) Minorities/pref divs/affils - - - - - Net income 9,737 10,520 12,174 15,875 20,532
Summary cashflow forecast (US$m) Net income 9,737 10,520 12,174 15,875 20,532 Operating adjustments 0 217 779 - - Depreciation/amortisation 1,851 2,962 2,962 2,962 2,962 Working capital changes 630 898 (3,275) (669) (749) Non-operating adjustments 2,347 2,022 3,286 3,450 3,600 Net operating cashflow 14,565 16,619 15,926 21,617 26,345 Capital expenditure (3,438) (3,273) (4,414) (3,000) (3,000) Free cashflow 11,127 13,346 11,512 18,617 23,345 Acq/inv/disposals (15,603) (9,783) - - - Net investing cashflow (19,041) (13,056) (4,414) (3,000) (3,000) Increase in loans 726 1,328 - - - Dividends 0 0 0 0 0 Net equity raised/other 81 (99) 487 487 487 Net financing cashflow 807 1,229 487 487 487 Incr/(decr) in net cash (3,669) 4,792 11,999 19,104 23,832 Exch rate movements 22 3 0 0 0 Opening cash 13,630 9,983 14,778 26,776 45,881 Closing cash 9,983 14,778 26,776 45,881 69,713
Summary balance sheet forecast (US$m) Cash & equivalents 9,983 14,778 26,776 45,881 69,713 Debtors 5,427 7,885 9,320 11,172 13,309 Inventories - - - - - Other current assets 37,348 37,791 38,741 39,820 41,066 Fixed assets 9,603 11,854 13,314 14,326 15,338 Intangible assets 8,924 18,010 10,507 9,533 8,559 Other term assets 1,289 3,480 4,095 4,617 5,219 Total assets 72,574 93,798 102,754 125,348 153,204 Short-term debt 1,218 2,549 2,549 2,549 2,549 Creditors 588 2,012 2,063 2,415 2,846 Other current liabs 7,107 9,776 11,103 12,976 15,139 Long-term debt/CBs 2,986 2,988 2,988 2,988 2,988 Provisions/other LT liabs 2,530 4,758 3,105 3,662 4,306 Minorities/other equity 0 0 0 0 0 Shareholder funds 58,145 71,715 80,946 100,757 125,377 Total liabs & equity 72,574 93,798 102,754 125,348 153,204
Ratio analysis Revenue growth (% YoY) 29.3 35.5 16.2 19.9 19.1 Ebitda growth (% YoY) 15.9 15.7 10.0 28.2 25.4 Ebitda margin (%) 37.0 31.5 29.9 31.9 33.6 Net income margin (%) 25.7 20.5 20.4 22.2 24.1 Dividend payout (%) 0.0 0.0 0.0 0.0 0.0 Effective tax rate (%) 23.6 24.1 21.8 22.7 22.2 Ebitda/net int exp (x) - - - - - Net debt/equity (%) (9.9) (12.9) (26.2) (40.0) (51.2) ROE (%) 18.7 16.2 15.9 17.5 18.2 ROIC (%) 20.4 16.8 18.3 24.8 31.6 EVA®/IC (%) 8.8 5.2 6.7 13.2 20.0 Source: CLSA

IBM US$193.15 - OUTPERFORM
Financials Year to 31 December 11A 12A 13CL 14CL 15CL Revenue (US$m) 106,916 104,507 103,955 106,573 109,910 Net income (US$m) 16,317 17,627 18,363 19,842 21,627 EPS (US$) 13.44 15.25 16.57 18.72 20.84 CL/consensus (15) (EPS%) - - 98 102 104 EPS growth (% YoY) - 13.5 8.7 13.0 11.3 PE (x) 14.4 12.7 11.7 10.3 9.3 Dividend yield (%) 1.5 1.7 1.9 2.1 2.3 FCF yield (%) 6.7 6.8 9.8 12.4 13.5 Source: Company, CLSA; consensus data from IBES; CL = estimate.
Find CLSA research on Bloomberg, Thomson Reuters, CapIQ and themarkets.com - and profit from our evalu@tor proprietary database at clsa.com
Ed Maguire [email protected] +1 212 549 8200
20 September 2013
USA Technology Reuters IBM.N Bloomberg IBM US
Priced on 16 September 2013 S&P 500 @ 1,697.6 12M hi/lo US$215.90/181.10 12M price target US$225.00 ±% potential +16% Shares in issue 1,178.6m Free float (est.) 99.8% Market cap US$211,581m 3M average daily volume US$687.8m Major shareholders State Street 5.4%
Stock performance (%) 1M 3M 12M
Absolute 4.2 (4.5) (6.6) Relative 1.6 (8.5) (19.4) Abs (US$) 4.2 (4.5) (6.6)
Source: Bloomberg
www.clsa.com
50
70
90
110
130
150
170
50
70
90
110
130
150
170
190
210
230
Sep 08 May 10 Jan 12 Sep 13
IBM (LHS)
Rel to 500
(US$) (%)
Getting smarter about cloud For IBM, cloud computing is one of the key pillars of growth; however, the company is widely perceived as a laggard competitively as concerns over the disruptive impact to traditional hosting and outsourcing slowed the pace of adoption. With the recent acquisition of SoftLayer, IBM’s cloud offerings span bare-metal IaaS to managed instances. The company has a portfolio of SaaS offerings as well. Hardware struggles reflect the disruption from the cloud. We reiterate Outperform and US$225 target.
A broad portfolio of SaaS offerings IBM has amassed a broad range of solutions offered as Software as a Service through acquisitions of Sterling Commerce, Kenexa, DemandTec, Coremetrics and more. Most of the SaaS offerings are concentrated in vertical applications. Its IaaS offerings also support a range of custom applications.
Doubling down on cloud services with SoftLayer IBM provides a range of cloud-services offerings that have been marketed under the umbrella of the IBM SmartCloud brand. This includes SaaS, PaaS and IaaS solutions through public, private and hybrid delivery models. In June 2013, IBM acquired cloud-service provider SoftLayer for a reputed US$2bn to build out the capability for more Amazon-like, self-service offerings to complement Smart Cloud Enterprise, which targets large organizations.
Embracing OpenStack and CloudFoundry for next-gen apps IBM’s large middleware portfolio faces threats from open source and PaaS offerings, and re-architecting WebSphere is underway but will take time. IBM has invested in development around open-source OpenStack and Pivotal’s CloudFoundry, recently unveiling BlueMix, an implementation of the company’s open-cloud architecture using Cloud Foundry to help developers code next-generation cloud apps. We expect IBM to grow service revenue around open-source technologies as some proprietary software products decline over time.
Hardware remains challenged The Systems and Technology business faces many of the secular challenges of other on-premise technology vendors. The x86 server business has yet to be sold, high-end power systems are declining with a weak Unix market, while System Z mainframe remains resilient. We expect IBM to increasingly offset server declines with its own compute as a service.

IBM - O-PF Global technology
78 [email protected] 20 September 2013
Getting smarter about the cloud IBM’s strategy is based on four themes: Smarter Planet initiatives, analytics, growth markets and next-generation datacenter and cloud initiatives. In our view, analytics play a central role in IBM’s strategy, unifying the broader strategy across business segments, solution areas and geographies, while providing critical competitive differentiation. Through extensive investment and sustained focus in this area, we believe IBM is the premier investment play on analytics, which provide the primary thematic and technological underpinning to drive growth.
IBM SmartCloud model
Source: Wikimedia Commons
Focusing on cloud computing since 2007 The company has been developing a cloud strategy since 2007, announcing university partnerships with Google for R&D. SmartCloud Enterprise was launched in 2011 and the company claims 80% of Fortune 500 companies are using IBM cloud solutions. IBM offers a range of fully managed technology and cloud services under the SmartCloud brand.
Four themes: Smarter Planet, analytics, growth markets and next-gen datacenter and cloud
IBM combines services, software and hardware
into its cloud architectures
SmartCloud Enterprise was launched in 2011 and the company claims 80%
of Fortune 500 use its solutions
IBM - O-PF Global technology
20 September 2013 [email protected] 79
A sprawling SaaS portfolio IBM offers a broad range of SaaS applications and solutions under several categories: business process as a service; buying, procurement and sourcing; marketing and web analytics; selling and merchandising, smarter cities, social business and smarter analytics. Process applications include vertical applications (for public health, government, telecom, electronics, clinical development) as well as commerce, process services (Emptories), service desk and other functions.
The company’s products can be delivered as applications or customized solutions. Much of the SaaS portfolio has been assembled via M&A over the past decade. Buying and procurement applications include Sterling Commerce (supply chain and supplier management) and Emptoris (sourcing and spend management). Selling and merchandising apps include DemandTec. Social business offerings include hosted (Lotus) notes, and analytics include hosted versions of IBM’s portfolio of BI, analytics and optimization offerings.
Providing alternative approaches to PaaS IBM’s SmartCloud Application Workload Services (SCAWS) is IBM’s PaaS offering that allows developers to deploy Java and PHP applications to the cloud. The platform allows developers to create re-usable templates for applications that can be deployed with IBM Workload Deployer or the IBM PureApplication System.
IBM has also invested in development around open-source OpenStack and Pivotal’s CloudFoundry, recently unveiling BlueMix, an implementation of IBM’s open cloud architecture using Cloud Foundry to help developers code next-generation cloud apps. We regard BlueMix as IBM’s effort to build a services business around open-source software, both as a means to build replicable solutions around next-generation cloud architecture and to hedge against disruption to the traditional middleware business.
Choice in the flavors of public cloud services SmartCloud Enterprise is the company’s high-end infrastructure service for business with service level agreements (SLAs) up to 99.9%. The company’s offerings are designed with datacenter class infrastructure, powered by its Power Systems and x86 servers. There are services optimized for SAP, Oracle and other enterprise applications. SmartCloud Enterprise is targeted towards larger customers and saw reasonable (though not exceptional) traction in the markets.
In June 2013 IBM acquired SoftLayer, a private-equity-driven aggregation of three companies: The Planet (largest private managed-hosting company in the world); EV1 Servers; and SoftLayer. In addition to shared public cloud services, SoftLayer sells “bare-metal” dedicated hosting to clients that need the security and scale of fully utilized compute. Potentially, IBM will be able to replace hardware previously sourced exclusively from SuperMicro with its own servers, while the range of flexible deployment options gives IBM a broader portfolio of solutions to take on AWS, Microsoft Azure, Google, Rackspace and others.
One of the advantages of SoftLayer is the largely self-service nature of its customers, enabled by extensive automation software that handles both virtualized and non-virtualized servers equally well. This dynamic plays to the SMB market and channel, which IBM’s services have typically not addressed in a major way. SoftLayer offers a lot of flexibility in deploying platforms like CloudStack. While not directly linked with BlueMix, we expect IBM to use the
In June 2013, IBM acquired SoftLayer
One of the advantages of SoftLayer is the largely
self-service nature
We regard BlueMix as IBM’s effort to build a
services business around open source
Much of the SaaS portfolio has been assembled via
M&A over the past decade
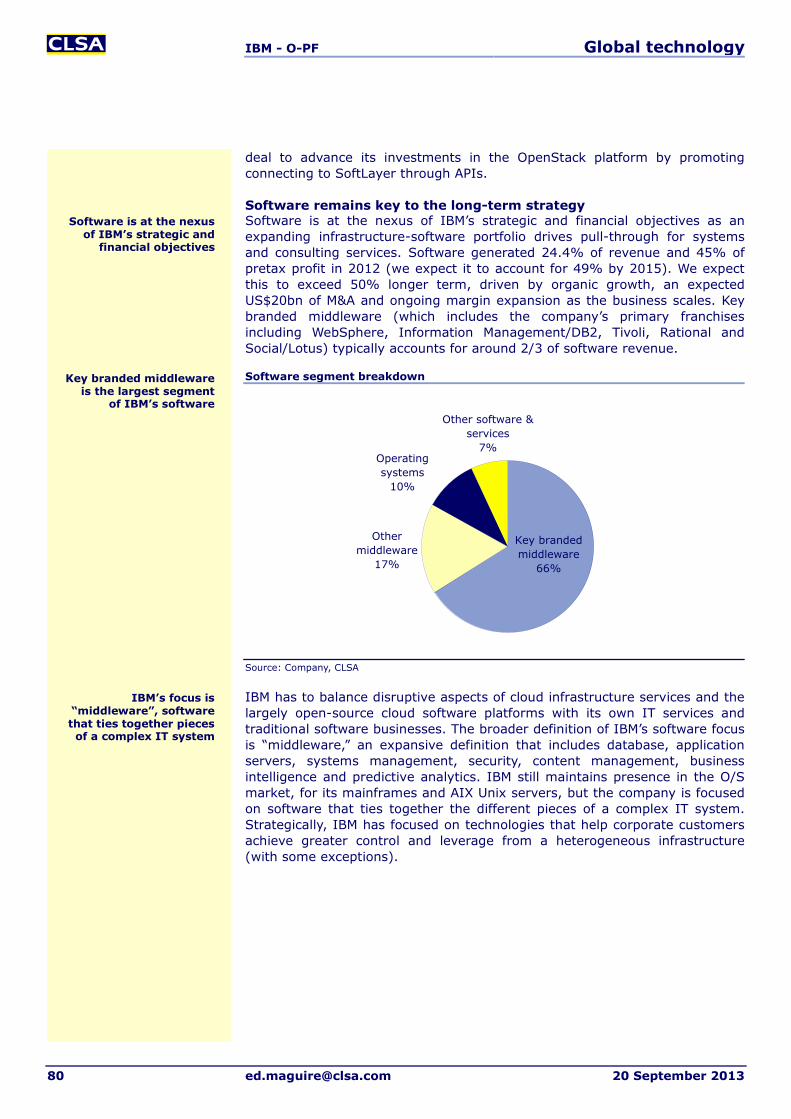
IBM - O-PF Global technology
80 [email protected] 20 September 2013
deal to advance its investments in the OpenStack platform by promoting connecting to SoftLayer through APIs.
Software remains key to the long-term strategy Software is at the nexus of IBM’s strategic and financial objectives as an expanding infrastructure-software portfolio drives pull-through for systems and consulting services. Software generated 24.4% of revenue and 45% of pretax profit in 2012 (we expect it to account for 49% by 2015). We expect this to exceed 50% longer term, driven by organic growth, an expected US$20bn of M&A and ongoing margin expansion as the business scales. Key branded middleware (which includes the company’s primary franchises including WebSphere, Information Management/DB2, Tivoli, Rational and Social/Lotus) typically accounts for around 2/3 of software revenue.
Software segment breakdown
Source: Company, CLSA
IBM has to balance disruptive aspects of cloud infrastructure services and the largely open-source cloud software platforms with its own IT services and traditional software businesses. The broader definition of IBM’s software focus is “middleware,” an expansive definition that includes database, application servers, systems management, security, content management, business intelligence and predictive analytics. IBM still maintains presence in the O/S market, for its mainframes and AIX Unix servers, but the company is focused on software that ties together the different pieces of a complex IT system. Strategically, IBM has focused on technologies that help corporate customers achieve greater control and leverage from a heterogeneous infrastructure (with some exceptions).
Other middleware
17%
Operating systems
10%
Other software & services
7%
Key branded middleware
66%
Key branded middleware is the largest segment
of IBM’s software
Software is at the nexus of IBM’s strategic and
financial objectives
IBM’s focus is “middleware”, software that ties together pieces of a complex IT system
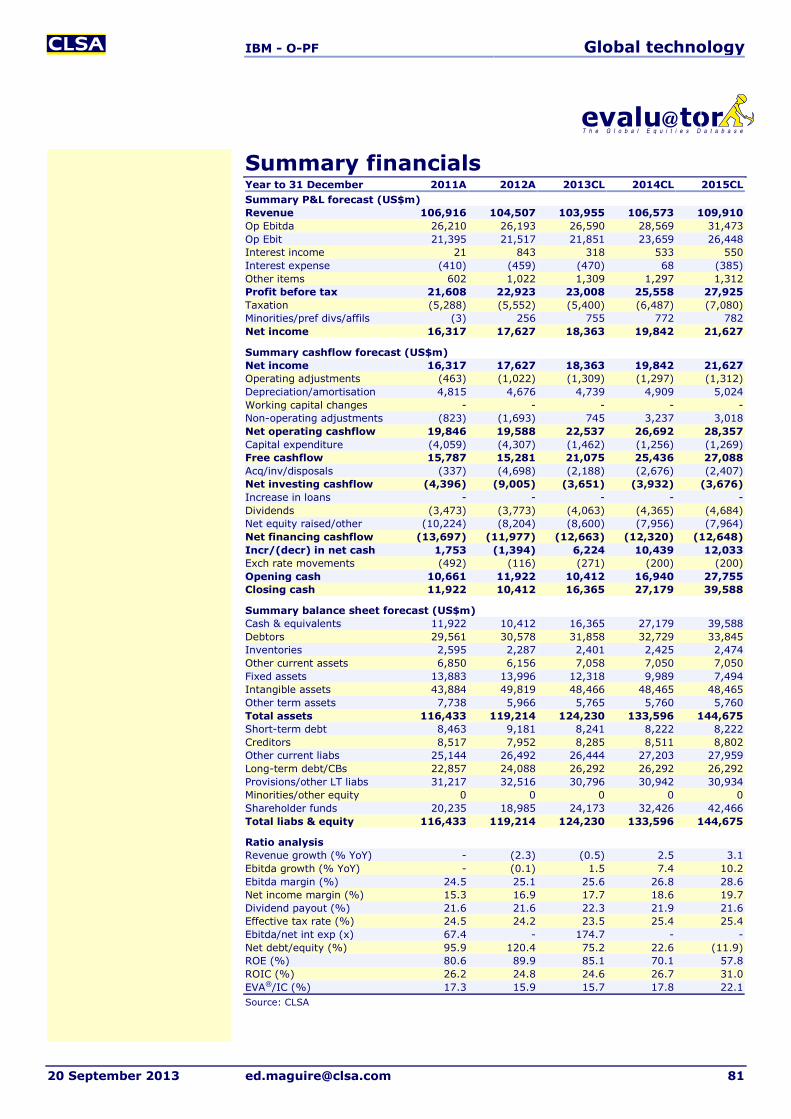
IBM - O-PF Global technology
20 September 2013 [email protected] 81
Summary financials Year to 31 December 2011A 2012A 2013CL 2014CL 2015CL Summary P&L forecast (US$m) Revenue 106,916 104,507 103,955 106,573 109,910 Op Ebitda 26,210 26,193 26,590 28,569 31,473 Op Ebit 21,395 21,517 21,851 23,659 26,448 Interest income 21 843 318 533 550 Interest expense (410) (459) (470) 68 (385) Other items 602 1,022 1,309 1,297 1,312 Profit before tax 21,608 22,923 23,008 25,558 27,925 Taxation (5,288) (5,552) (5,400) (6,487) (7,080) Minorities/pref divs/affils (3) 256 755 772 782 Net income 16,317 17,627 18,363 19,842 21,627
Summary cashflow forecast (US$m) Net income 16,317 17,627 18,363 19,842 21,627 Operating adjustments (463) (1,022) (1,309) (1,297) (1,312) Depreciation/amortisation 4,815 4,676 4,739 4,909 5,024 Working capital changes - - - - - Non-operating adjustments (823) (1,693) 745 3,237 3,018 Net operating cashflow 19,846 19,588 22,537 26,692 28,357 Capital expenditure (4,059) (4,307) (1,462) (1,256) (1,269) Free cashflow 15,787 15,281 21,075 25,436 27,088 Acq/inv/disposals (337) (4,698) (2,188) (2,676) (2,407) Net investing cashflow (4,396) (9,005) (3,651) (3,932) (3,676) Increase in loans - - - - - Dividends (3,473) (3,773) (4,063) (4,365) (4,684) Net equity raised/other (10,224) (8,204) (8,600) (7,956) (7,964) Net financing cashflow (13,697) (11,977) (12,663) (12,320) (12,648) Incr/(decr) in net cash 1,753 (1,394) 6,224 10,439 12,033 Exch rate movements (492) (116) (271) (200) (200) Opening cash 10,661 11,922 10,412 16,940 27,755 Closing cash 11,922 10,412 16,365 27,179 39,588
Summary balance sheet forecast (US$m) Cash & equivalents 11,922 10,412 16,365 27,179 39,588 Debtors 29,561 30,578 31,858 32,729 33,845 Inventories 2,595 2,287 2,401 2,425 2,474 Other current assets 6,850 6,156 7,058 7,050 7,050 Fixed assets 13,883 13,996 12,318 9,989 7,494 Intangible assets 43,884 49,819 48,466 48,465 48,465 Other term assets 7,738 5,966 5,765 5,760 5,760 Total assets 116,433 119,214 124,230 133,596 144,675 Short-term debt 8,463 9,181 8,241 8,222 8,222 Creditors 8,517 7,952 8,285 8,511 8,802 Other current liabs 25,144 26,492 26,444 27,203 27,959 Long-term debt/CBs 22,857 24,088 26,292 26,292 26,292 Provisions/other LT liabs 31,217 32,516 30,796 30,942 30,934 Minorities/other equity 0 0 0 0 0 Shareholder funds 20,235 18,985 24,173 32,426 42,466 Total liabs & equity 116,433 119,214 124,230 133,596 144,675
Ratio analysis Revenue growth (% YoY) - (2.3) (0.5) 2.5 3.1 Ebitda growth (% YoY) - (0.1) 1.5 7.4 10.2 Ebitda margin (%) 24.5 25.1 25.6 26.8 28.6 Net income margin (%) 15.3 16.9 17.7 18.6 19.7 Dividend payout (%) 21.6 21.6 22.3 21.9 21.6 Effective tax rate (%) 24.5 24.2 23.5 25.4 25.4 Ebitda/net int exp (x) 67.4 - 174.7 - - Net debt/equity (%) 95.9 120.4 75.2 22.6 (11.9) ROE (%) 80.6 89.9 85.1 70.1 57.8 ROIC (%) 26.2 24.8 24.6 26.7 31.0 EVA®/IC (%) 17.3 15.9 15.7 17.8 22.1 Source: CLSA
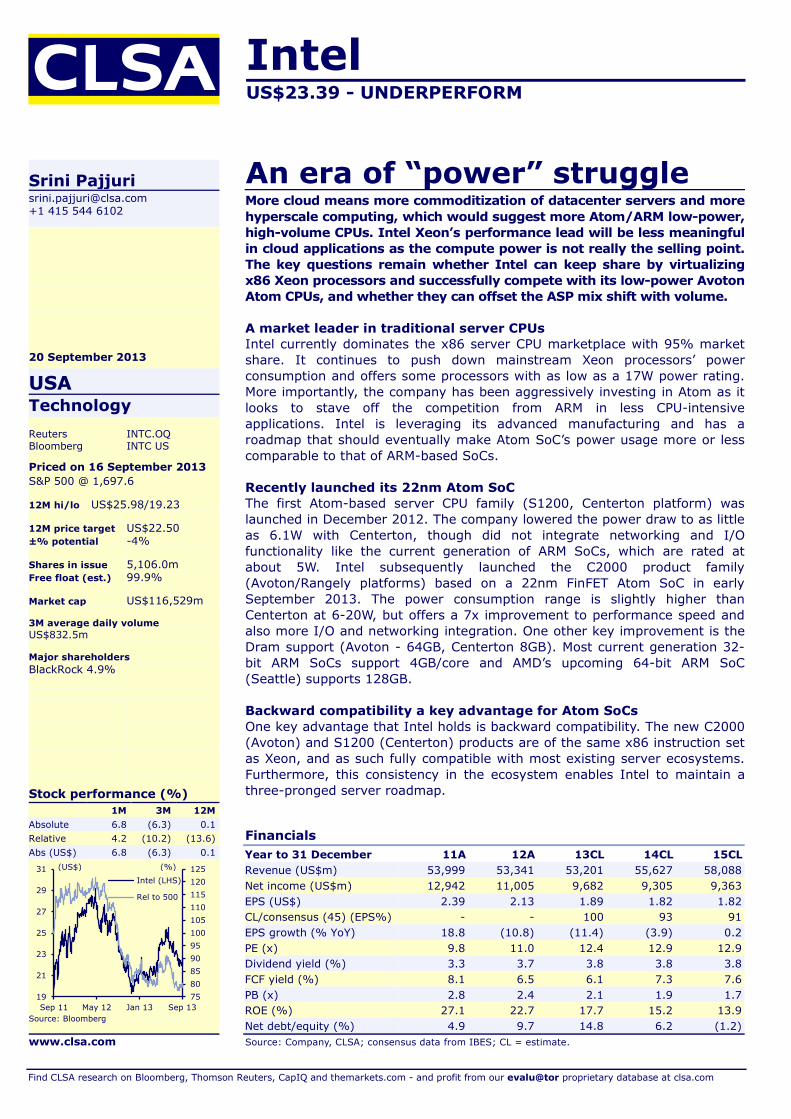
Intel US$23.39 - UNDERPERFORM
Financials Year to 31 December 11A 12A 13CL 14CL 15CL Revenue (US$m) 53,999 53,341 53,201 55,627 58,088 Net income (US$m) 12,942 11,005 9,682 9,305 9,363 EPS (US$) 2.39 2.13 1.89 1.82 1.82 CL/consensus (45) (EPS%) - - 100 93 91 EPS growth (% YoY) 18.8 (10.8) (11.4) (3.9) 0.2 PE (x) 9.8 11.0 12.4 12.9 12.9 Dividend yield (%) 3.3 3.7 3.8 3.8 3.8 FCF yield (%) 8.1 6.5 6.1 7.3 7.6 PB (x) 2.8 2.4 2.1 1.9 1.7 ROE (%) 27.1 22.7 17.7 15.2 13.9 Net debt/equity (%) 4.9 9.7 14.8 6.2 (1.2) Source: Company, CLSA; consensus data from IBES; CL = estimate.
Find CLSA research on Bloomberg, Thomson Reuters, CapIQ and themarkets.com - and profit from our evalu@tor proprietary database at clsa.com
Srini Pajjuri [email protected] +1 415 544 6102
20 September 2013
USA Technology Reuters INTC.OQ Bloomberg INTC US
Priced on 16 September 2013 S&P 500 @ 1,697.6 12M hi/lo US$25.98/19.23 12M price target US$22.50 ±% potential -4% Shares in issue 5,106.0m Free float (est.) 99.9% Market cap US$116,529m 3M average daily volume US$832.5m Major shareholders BlackRock 4.9%
Stock performance (%) 1M 3M 12M
Absolute 6.8 (6.3) 0.1 Relative 4.2 (10.2) (13.6) Abs (US$) 6.8 (6.3) 0.1
Source: Bloomberg
www.clsa.com
7580859095100105110115120125
19
21
23
25
27
29
31
Sep 11 May 12 Jan 13 Sep 13
Intel (LHS)
Rel to 500
(US$) (%)
An era of “power” struggle More cloud means more commoditization of datacenter servers and more hyperscale computing, which would suggest more Atom/ARM low-power, high-volume CPUs. Intel Xeon’s performance lead will be less meaningful in cloud applications as the compute power is not really the selling point. The key questions remain whether Intel can keep share by virtualizing x86 Xeon processors and successfully compete with its low-power Avoton Atom CPUs, and whether they can offset the ASP mix shift with volume.
A market leader in traditional server CPUs Intel currently dominates the x86 server CPU marketplace with 95% market share. It continues to push down mainstream Xeon processors’ power consumption and offers some processors with as low as a 17W power rating. More importantly, the company has been aggressively investing in Atom as it looks to stave off the competition from ARM in less CPU-intensive applications. Intel is leveraging its advanced manufacturing and has a roadmap that should eventually make Atom SoC’s power usage more or less comparable to that of ARM-based SoCs.
Recently launched its 22nm Atom SoC The first Atom-based server CPU family (S1200, Centerton platform) was launched in December 2012. The company lowered the power draw to as little as 6.1W with Centerton, though did not integrate networking and I/O functionality like the current generation of ARM SoCs, which are rated at about 5W. Intel subsequently launched the C2000 product family (Avoton/Rangely platforms) based on a 22nm FinFET Atom SoC in early September 2013. The power consumption range is slightly higher than Centerton at 6-20W, but offers a 7x improvement to performance speed and also more I/O and networking integration. One other key improvement is the Dram support (Avoton - 64GB, Centerton 8GB). Most current generation 32-bit ARM SoCs support 4GB/core and AMD’s upcoming 64-bit ARM SoC (Seattle) supports 128GB.
Backward compatibility a key advantage for Atom SoCs One key advantage that Intel holds is backward compatibility. The new C2000 (Avoton) and S1200 (Centerton) products are of the same x86 instruction set as Xeon, and as such fully compatible with most existing server ecosystems. Furthermore, this consistency in the ecosystem enables Intel to maintain a three-pronged server roadmap.

Intel - U-PF Global technology
84 [email protected] 20 September 2013
Serving the cloud with a range of chips At the highest end of the market, Intel has its Itanium products. At the more mainstream high end of the market, the company released a 22nm Xeon E3 v3 in mid-2013 and has a 14nm Xeon processor on the roadmap for 2014. As ARM is not likely to penetrate the mid to high end of the server market any time soon, server users will need to consider potential ecosystem constraints in low-power server adoption. Whereas ARM may be okay for hyperscale customers that control their own software, enterprise customers should find the x86-based Atom SoCs quite attractive.
Intel server processor summary S1220 S1240 S1260 C2750 C2730 C2550 C2530 C2350 E3-1265L
v3 E3-1230L
v3 Code name Centerton Centerton Centerton Avoton Avoton Avoton Avoton Avoton Xeon Xeon No. of cores 2 2 2 8 8 4 4 2 4 4 No. of threads 4 4 4 8 8 4 4 2 8 8 Clock speed 1.6GHz 1.6GHz 2GHz 2.4GHz 1.7GHz 2.4GHz 1.7GHz 1.7GHz 2.5GHz 1.8GHz Max Turbo Frequency NA NA NA 2.6GHz 2GHz 2.6GHz 2GHz 2GHz 3.7GHz 2.8GHz Cache 1MB 1MB 1MB 4MB 4MB 2MB 2BM 1MB 8MB 8MB Max memory 8B 8GB 8GB 64GB 32GB 64GB 32GB 16GB 32GB 32GB Lithography 32nm 32nm 32nm 22nm 22nm 22nm 22nm 22nm 22nm 22nm ECC Yes Yes Yes Yes Yes Yes Yes Yes Yes Yes Intel virtualization Yes Yes Yes Yes Yes Yes Yes Yes Yes Yes PCIe lanes 8xPCIe 2 8xPCIe 2 8xPCIe 2 16xPCIe 2 8xPCIe 2 16xPCIe 2 8xPCIe 2 4xPCIe 2 16xPCIe 3 16xPCIe 3 TDP 8.1W 6.1W 8.5W 20W 12W 14W 9W 6W 45W 25W Price (US$) 54 64 64 na na na na na 294 250 Launch 4Q12 4Q12 4Q12 3Q13 3Q13 3Q13 3Q13 3Q13 2Q13 2Q13 Source: Intel, CLSA
Intel server CPU roadmap
Source: Intel
Intel’s server processor business accounts for approximately US$10bn revenue in 2013 (about 19% of total revenue). Average server CPU ASPs are approximately US$500-600, with low-end Xeons selling for about US$150-200. This compares to US$54-64 for the S1200 Atom processors (C2000 likely similar). As such, a key outstanding question is whether Intel can make up for the ASP loss with higher volumes in workloads where low-power processors displace Xeon. Our sense is that about four to five low-power processors can displace one Xeon, which would suggest that any low-power cannibalization would be a negative for Intel’s ASP mix.
Challenge to Intel is to make up the ASP loss with higher volumes
Newer designs have low power
A range of chips addresses different
workload needs

Intel - U-PF Global technology
20 September 2013 [email protected] 85
Summary financials Year to 31 December 2011A 2012A 2013CL 2014CL 2015CL Summary P&L forecast (US$m) Revenue 53,999 53,341 53,201 55,627 58,088 Op Ebitda 23,541 22,160 20,530 21,071 20,967 Op Ebit 17,477 14,638 12,492 12,555 12,451 Interest income 58 82 0 0 0 Interest expense (29) (30) (161) (148) 0 Other items 275 183 422 0 0 Profit before tax 17,781 14,873 12,753 12,407 12,451 Taxation (4,839) (3,868) (3,071) (3,102) (3,088) Minorities/pref divs/affils - - - - - Net income 12,942 11,005 9,682 9,305 9,363
Summary cashflow forecast (US$m) Net income 12,942 11,005 9,682 9,305 9,363 Operating adjustments 0 0 0 0 (100) Depreciation/amortisation 6,064 7,522 8,038 8,516 8,516 Working capital changes 331 (220) (1,483) (585) (221) Non-operating adjustments 1,626 577 1,924 1,168 1,168 Net operating cashflow 20,963 18,884 18,161 18,404 18,726 Capital expenditure (10,764) (11,027) (10,897) (9,600) (9,600) Free cashflow 10,199 7,857 7,264 8,804 9,126 Acq/inv/disposals 463 (3,033) (6,336) - - Net investing cashflow (10,301) (14,060) (17,233) (9,600) (9,600) Increase in loans 5,171 6,064 (42) - - Dividends (4,127) (4,350) (4,477) (4,480) (4,498) Net equity raised/other (12,144) (3,122) (39) 248 248 Net financing cashflow (11,100) (1,408) (4,558) (4,232) (4,250) Incr/(decr) in net cash (438) 3,416 (3,630) 4,572 4,876 Exch rate movements 5 (3) (10) 0 0 Opening cash 5,498 5,065 8,478 4,838 9,410 Closing cash 5,065 8,478 4,838 9,410 14,285
Summary balance sheet forecast (US$m) Cash & equivalents 5,065 8,478 4,838 9,410 14,285 Debtors 3,650 3,833 3,881 3,954 4,128 Inventories 4,096 4,734 4,949 5,276 5,725 Other current assets 3,289 4,629 3,682 3,682 3,682 Fixed assets 23,627 27,983 31,920 34,120 36,320 Intangible assets 9,254 9,710 9,447 8,331 7,215 Other term assets 22,138 24,984 30,835 30,835 30,835 Total assets 71,119 84,351 89,552 95,608 102,191 Short-term debt 247 312 263 263 263 Creditors 2,956 3,023 2,650 2,465 2,589 Other current liabs 8,825 9,563 8,262 8,262 8,540 Long-term debt/CBs 7,084 13,136 13,150 13,150 13,150 Provisions/other LT liabs 6,096 7,114 7,282 7,282 7,282 Minorities/other equity 0 0 0 0 0 Shareholder funds 45,911 51,203 57,944 64,186 70,367 Total liabs & equity 71,119 84,351 89,552 95,608 102,191
Ratio analysis Revenue growth (% YoY) 23.8 (1.2) (0.3) 4.6 4.4 Ebitda growth (% YoY) 16.4 (5.9) (7.4) 2.6 (0.5) Ebitda margin (%) 43.6 41.5 38.6 37.9 36.1 Net income margin (%) 24.0 20.6 18.2 16.7 16.1 Dividend payout (%) 32.7 40.8 47.6 49.6 49.4 Effective tax rate (%) 27.2 26.0 24.1 25.0 24.8 Ebitda/net int exp (x) - - 127.5 142.4 - Net debt/equity (%) 4.9 9.7 14.8 6.2 (1.2) ROE (%) 27.1 22.7 17.7 15.2 13.9 ROIC (%) 26.2 19.5 15.2 13.9 13.5 EVA®/IC (%) 13.8 7.1 2.8 1.6 1.2 Source: CLSA

Microsoft US$32.79 - OUTPERFORM
Financials Year to 30 June 12A 13A 14CL 15CL 16CL Revenue (US$m) 73,723 77,849 90,755 105,610 110,939 Net income (US$m) 22,910 21,857 22,789 25,462 28,321 EPS (US$) 2.71 2.58 2.72 3.06 3.44 CL/consensus (28) (EPS%) - - 100 104 107 EPS growth (% YoY) 0.5 (4.7) 5.3 12.8 12.2 PE (x) 12.1 12.7 12.1 10.7 9.5 Dividend yield (%) 2.4 2.8 2.8 2.8 2.8 FCF yield (%) 10.6 8.8 9.4 10.5 9.1 PB (x) 4.2 3.5 3.2 2.8 2.4 ROE (%) 37.1 30.1 27.8 28.0 26.8 Net debt/equity (%) 7.6 14.9 3.9 (11.8) (21.0) Source: Company, CLSA; consensus data from IBES; CL = estimate.
Find CLSA research on Bloomberg, Thomson Reuters, CapIQ and themarkets.com - and profit from our evalu@tor proprietary database at clsa.com
Ed Maguire [email protected] +1 212 549 8200
18 September 20139 September 2013
20 September 2013
USA Technology Reuters MSFT.OQ Bloomberg MSFT US
Priced on 16 September 2013 S&P 500 @ 1,697.6 12M hi/lo US$36.42/26.26 12M price target US$38.00 ±% potential +16% Shares in issue 8,763.8m Free float (est.) 87.8% Market cap US$273,231m 3M average daily volume US$1,639.8m Foreign s'holding 7.3% Major shareholders Capital 4.2% BlackRock Global 3.8%
Stock performance (%) 1M 3M 12M
Absolute 3.1 (5.6) 5.1 Relative 0.6 (9.5) (9.3) Abs (US$) 3.1 (5.6) 5.1
Source: Bloomberg
www.clsa.com
80
85
90
95
100
105
110
115
2022242628303234363840
Sep 11 May 12 Jan 13 Sep 13
Microsoft (LHS)Rel to 500
(US$) (%)
All in the cloud Microsoft has a multifaceted cloud strategy at the core of its focus on devices and services. With its plans to acquire Nokia’s phone businesses, the services aspect gains rising importance. Microsoft is a top-three global cloud-service provider with over 1m servers powering Office365, Bing, Azure, Xbox Live, etc. Its Azure offerings reflect the most fully realized portfolio of software and services enabling hybrid clouds. Past investments position the company well to transition to the cloud model.
Playing at all layers in the cloud Microsoft offers cloud services at all three levels of the stack: SaaS (Office365, Dynamics CRM and other enterprise apps), PaaS and IaaS (through the Azure platform). Its strategy has increasingly emphasized cloud investments, about which management has been upfront. In March 2010, CEO Steve Ballmer said that the work of 75% of the people was cloud focused or fully cloud inspired, and expected to reach 90% in a year (2011).
SaaS offerings broad and deep The company offers hosted versions of business applications. Business Productivity Online Services (BPOS) was rebranded as Office365 in late 2011, and over the past 18 months demand has hit an inflection point. Management disclosed that Office365’s annual run rate grew from US$1bn in March 2013 to US$1.5bn in June 2013.
Hybrid PaaS and IaaS offered via the Azure platform Windows Azure is the company’s cloud computing platform (PaaS) and infrastructure (IaaS) that is designed to help customers build, deploy and manage application services hosted on Microsoft-managed datacenters. Developers are able to use a variety of programming languages and tools to write code for cloud services; many also use specific software-development kits created by Microsoft to aid application development.
Finding synergies across consumer and enterprise Microsoft has had to ramp up investments in cloud services in recent quarters. While it’s unclear to what extent competition with Amazon could pressure margins over time, there are potential synergies and technology advances from operating Bing, Office365, Dynamics, Azure and Xbox Live on common datacenters.
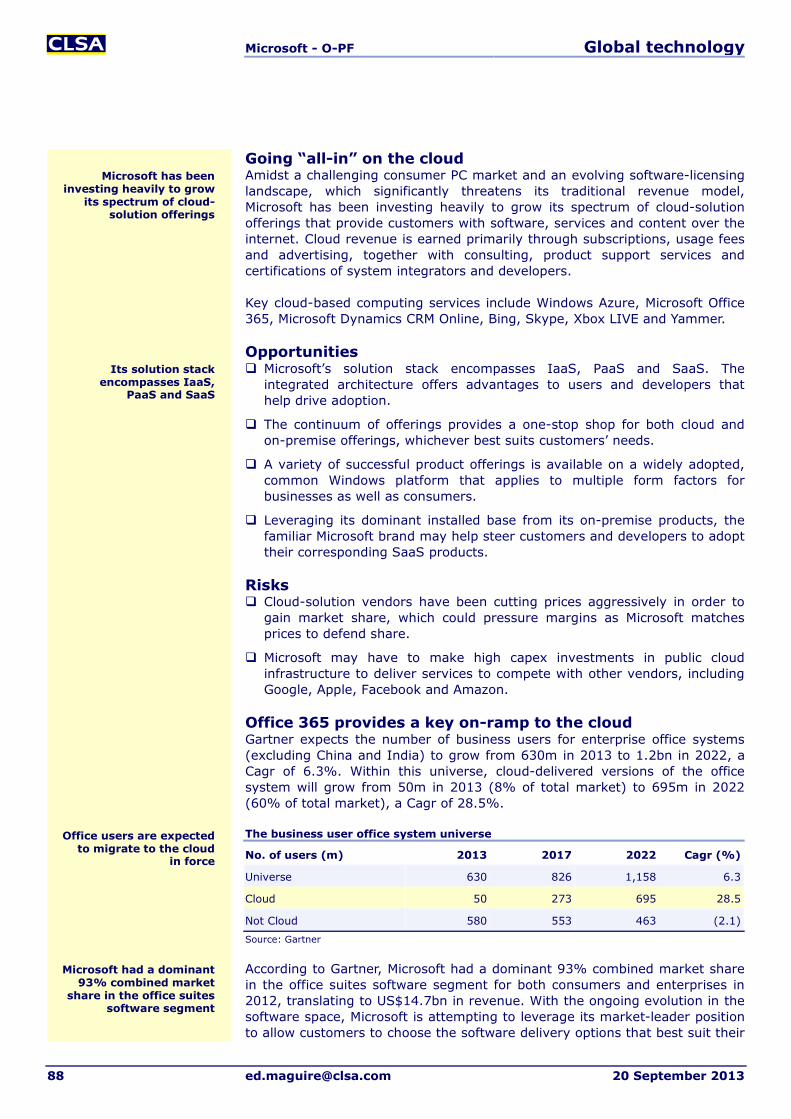
Microsoft - O-PF Global technology
88 [email protected] 20 September 2013
Going “all-in” on the cloud Amidst a challenging consumer PC market and an evolving software-licensing landscape, which significantly threatens its traditional revenue model, Microsoft has been investing heavily to grow its spectrum of cloud-solution offerings that provide customers with software, services and content over the internet. Cloud revenue is earned primarily through subscriptions, usage fees and advertising, together with consulting, product support services and certifications of system integrators and developers.
Key cloud-based computing services include Windows Azure, Microsoft Office 365, Microsoft Dynamics CRM Online, Bing, Skype, Xbox LIVE and Yammer.
Opportunities Microsoft’s solution stack encompasses IaaS, PaaS and SaaS. The
integrated architecture offers advantages to users and developers that help drive adoption.
The continuum of offerings provides a one-stop shop for both cloud and on-premise offerings, whichever best suits customers’ needs.
A variety of successful product offerings is available on a widely adopted, common Windows platform that applies to multiple form factors for businesses as well as consumers.
Leveraging its dominant installed base from its on-premise products, the familiar Microsoft brand may help steer customers and developers to adopt their corresponding SaaS products.
Risks Cloud-solution vendors have been cutting prices aggressively in order to
gain market share, which could pressure margins as Microsoft matches prices to defend share.
Microsoft may have to make high capex investments in public cloud infrastructure to deliver services to compete with other vendors, including Google, Apple, Facebook and Amazon.
Office 365 provides a key on-ramp to the cloud Gartner expects the number of business users for enterprise office systems (excluding China and India) to grow from 630m in 2013 to 1.2bn in 2022, a Cagr of 6.3%. Within this universe, cloud-delivered versions of the office system will grow from 50m in 2013 (8% of total market) to 695m in 2022 (60% of total market), a Cagr of 28.5%.
The business user office system universe
No. of users (m) 2013 2017 2022 Cagr (%)
Universe 630 826 1,158 6.3
Cloud 50 273 695 28.5
Not Cloud 580 553 463 (2.1) Source: Gartner
According to Gartner, Microsoft had a dominant 93% combined market share in the office suites software segment for both consumers and enterprises in 2012, translating to US$14.7bn in revenue. With the ongoing evolution in the software space, Microsoft is attempting to leverage its market-leader position to allow customers to choose the software delivery options that best suit their
Microsoft has been investing heavily to grow
its spectrum of cloud-solution offerings
Microsoft had a dominant 93% combined market
share in the office suites software segment
Its solution stack encompasses IaaS,
PaaS and SaaS
Office users are expected to migrate to the cloud
in force

Microsoft - O-PF Global technology
20 September 2013 [email protected] 89
needs by extending their on-premise office suites to the cloud. Office 365 is the SaaS subscription-based office software suite that includes all the traditional office applications, plus Lync for communication and conferencing, Exchange Server for email and SharePoint for collaboration and social networking.
Management stated that the annual run rate for Office 365 increased from US$1bn in 3QFY13 (March) to US$1.5bn in 4QFY13 (June). While adoption rate continues to ramp, it is also our understanding that Microsoft has dropped prices for Office 365 in 2012 with typical price cuts at around 20%, suggesting tactical discounting and aggressive price cutting to fight off competition from other SaaS solutions such as Google Apps and Zoho.
While competition in this space continues to build, it is our view that Microsoft has the best opportunity among its peers to migrate the existing installed base to the cloud. Key areas for expansion include communication (Lync), collaboration (Sharepoint) and social tools in Office 365 in addition to hosted Exchange and productivity tools. The company has also rolled out a consumer version of Office365 (US$99/year for up to five machines) and the transition from product to service model is having approximately a 5% impact on growth in the consumer Office business.
The “cloud operating system” with Azure at the center Azure is Microsoft’s public cloud platform, which enables customers to build, operate and deploy applications. Azure can be purchased in 89 countries. The company operates eight datacenters: four in the USA, two in Europe and two in Asia. Microsoft has a 99.95% monthly SLA (with credits for any downtime).
Azure enables users to build websites with ASP, .NET, Node.js or PHP. Microsoft has been adding some proprietary tools to deploy apps with FTP, Git or TFS. Users can start for free and scale up as traffic grows. Microsoft does not charge for a shared model; if users are on a shared box, there will be less bandwidth. Scalability is achieved through automated load balancing, failover and other management functions. Microsoft handles all the load balancing, so applications can easily scale up and down.
The virtual-machines component is the IaaS layer that allows customers to create either Windows or Linux virtual machines to run in the public cloud via the use of Windows Azure Hypervisor. With the help of Microsoft System Center, customers can configure, manage and elastically scale up or down applications, services and computing resource usage within a single platform. Customers also have the option to build their own private cloud on premise, powered by Windows Server 2012 and equipped with the Hyper-V technology.
Microsoft went with PaaS first because that was where it expected apps to go; however, this did not enable users to perform basic compute and storage as a service, which was what the market gravitated towards first with Amazon Web Services. In a sense, Microsoft jumped into the deep end with the launch of Azure. The PaaS technology needed to be there first, but the company was not making it easy for developers to deploy apps to the cloud. IaaS has finally become generally available this year, and Microsoft is matching Amazon’s pricing for basic infrastructure services.
The annual run rate for Office 365 increased from
US$1bn in 3QFY13 to US$1.5bn in 4QFY13
Microsoft went initially with PaaS first, but this
did not enable users to do what they wanted first
Azure has 8 datacenters: 4 in the USA, 2 in Europe
and 2 in Asia with a 99.95% monthly SLA

Microsoft - O-PF Global technology
90 [email protected] 20 September 2013
Windows Azure architecture
Source: Microsoft
Sleeping with the enemy - A more open stance towards open source Microsoft Azure supports Linux VMs, including SuSE, CentOS and others, but not Red Hat . . . yet. Originally, Azure was a good choice primarily for the Microsoft stack (eg, ASP, .NET and other stacks). With multiplatform support, developers can now use a Mac to build a Node app that runs a MongoDB database on Linux. The ability to run different workloads opens up many possibilities. Microsoft also now has a significant partner ecosystem, including Ubuntu, SuSe, Opscode, OpenLogic, RightScale, New Relic, AppDynamics and others.
Big Data advances with support for Hadoop on Azure Microsoft has become a surprisingly good partner in the Apache Hadoop project, embracing Hadoop on Windows Azure. There is a need to connect petabytes of data to humans in the workflow in order to scale and democratize how users access data. The project focuses on making Hadoop accessible from all of its main applications, from SharePoint to Excel. Microsoft views search as a Big Data app and has built extensive custom infrastructure.
The Bing API is also important with the company increasingly focused on the concept of search as a platform. The message around Bing is changing as there are more applications within Windows 8 that leverage the data and search capabilities within applications. There are scenarios supported within Office that can integrate external data with proprietary data. The Data Marketplace is also a significant initiative, where Microsoft sells curated data sets that can be imported and combined with other data.
Why we still like the business Microsoft’s key metrics remain unearned revenue and backlog. Total backlog grew 10% YoY to US$44bn in 4QFY13 (in line with 11% in FY12). The backlog accounts for 52% of our FY14 revenue forecast, as more and more revenue comes off the balance sheet. This speaks to Microsoft’s business-model transition to devices and services and the tremendous appeal of its enterprise business.
Microsoft has the technology to move to the cloud. Azure and Office365 are moving in the right direction, assuming capex and datacenter costs are not ultimately margin dilutive. The pending reorg promises to streamline operations and accelerate innovation, and with the next versions of Windows there is greater opportunity to make the transition to a post-PC common platform.
Microsoft sells curated data sets that can be
imported and combined with other data
Microsoft Azure supports Linux VMs
The Windows Azure architecture offers a
comprehensive array of capabilities

Microsoft - O-PF Global technology
20 September 2013 [email protected] 91
Summary financials Year to 30 June 2012A 2013A 2014CL 2015CL 2016CL Summary P&L forecast (US$m) Revenue 73,723 77,849 90,755 105,610 110,939 Op Ebitda 33,075 32,670 34,460 37,757 41,287 Op Ebit 27,956 26,764 28,134 31,435 34,965 Interest income 504 288 0 0 0 Interest expense - - - - - Other items 0 0 0 0 0 Profit before tax 28,460 27,052 28,134 31,435 34,965 Taxation (5,550) (5,195) (5,346) (5,973) (6,643) Minorities/pref divs/affils - - - - - Net income 22,910 21,857 22,789 25,462 28,321
Summary cashflow forecast (US$m) Net income 22,910 21,857 22,789 25,462 28,321 Operating adjustments (5,932) 6 0 0 0 Depreciation/amortisation 5,119 5,906 6,326 6,322 6,322 Working capital changes (175) (1,375) (3,818) (893) (728) Non-operating adjustments 9,680 2,666 6,041 1,970 (5,124) Net operating cashflow 31,602 28,608 31,338 32,862 28,792 Capital expenditure (2,305) (4,257) (5,404) (4,224) (4,250) Free cashflow 29,297 24,351 25,934 28,637 24,541 Acq/inv/disposals (22,481) (19,554) (7,200) - - Net investing cashflow (24,786) (23,585) (12,604) (4,224) (4,250) Increase in loans - 3,537 (3,000) - (1,750) Dividends (6,385) (7,455) (7,717) (7,646) (7,580) Net equity raised/other (3,023) (4,230) (4,378) (4,345) (4,346) Net financing cashflow (9,408) (8,148) (15,095) (11,991) (13,676) Incr/(decr) in net cash (2,592) (3,125) 3,639 16,646 10,866 Exch rate movements (104) (8) (124) (124) (124) Opening cash 9,609 6,937 3,803 7,317 23,839 Closing cash 6,913 3,804 7,318 23,840 34,580
Summary balance sheet forecast (US$m) Cash & equivalents 6,913 3,804 7,318 23,840 34,580 Debtors 15,780 17,486 21,754 22,987 23,974 Inventories 1,137 1,938 1,863 1,864 1,864 Other current assets 61,229 78,238 78,184 78,185 78,185 Fixed assets 8,269 9,991 11,364 11,562 11,785 Intangible assets 16,622 14,655 14,655 14,655 14,655 Other term assets 11,296 16,319 16,275 16,277 16,277 Total assets 121,246 142,431 151,413 169,369 181,321 Short-term debt 1,231 2,999 - 1,750 - Creditors 4,175 4,828 5,722 6,047 6,306 Other current liabs 27,282 29,590 37,130 40,798 37,365 Long-term debt/CBs 10,713 12,601 10,601 10,601 10,601 Provisions/other LT liabs 11,507 13,469 13,074 13,085 13,085 Minorities/other equity 0 0 0 0 0 Shareholder funds 66,338 78,944 84,886 97,088 113,963 Total liabs & equity 121,246 142,431 151,413 169,369 181,321
Ratio analysis Revenue growth (% YoY) 5.4 5.6 16.6 16.4 5.0 Ebitda growth (% YoY) 3.1 (1.2) 5.5 9.6 9.3 Ebitda margin (%) 44.9 42.0 38.0 35.8 37.2 Net income margin (%) 31.1 28.1 25.1 24.1 25.5 Dividend payout (%) 29.5 35.7 33.9 30.0 26.8 Effective tax rate (%) 19.5 19.2 19.0 19.0 19.0 Ebitda/net int exp (x) - - - - - Net debt/equity (%) 7.6 14.9 3.9 (11.8) (21.0) ROE (%) 37.1 30.1 27.8 28.0 26.8 ROIC (%) 34.0 26.0 24.8 28.6 31.5 EVA®/IC (%) 24.3 16.3 15.1 18.9 21.8 Source: CLSA
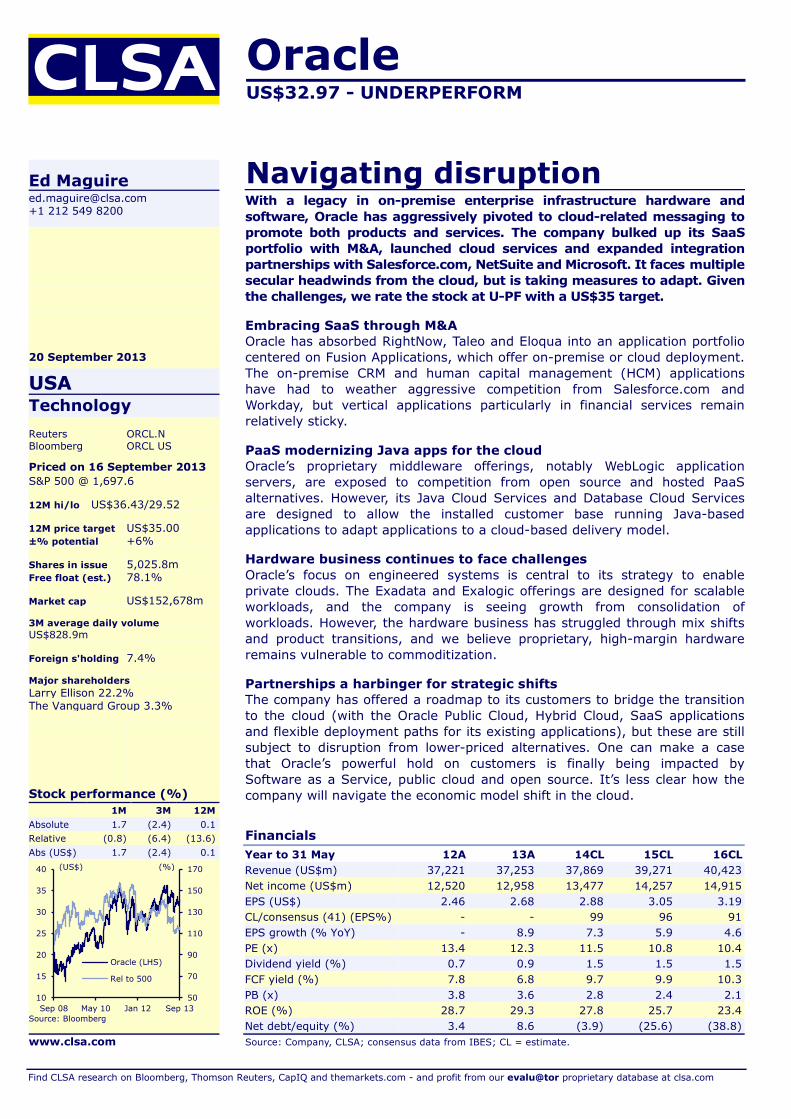
Oracle US$32.97 - UNDERPERFORM
Financials Year to 31 May 12A 13A 14CL 15CL 16CL Revenue (US$m) 37,221 37,253 37,869 39,271 40,423 Net income (US$m) 12,520 12,958 13,477 14,257 14,915 EPS (US$) 2.46 2.68 2.88 3.05 3.19 CL/consensus (41) (EPS%) - - 99 96 91 EPS growth (% YoY) - 8.9 7.3 5.9 4.6 PE (x) 13.4 12.3 11.5 10.8 10.4 Dividend yield (%) 0.7 0.9 1.5 1.5 1.5 FCF yield (%) 7.8 6.8 9.7 9.9 10.3 PB (x) 3.8 3.6 2.8 2.4 2.1 ROE (%) 28.7 29.3 27.8 25.7 23.4 Net debt/equity (%) 3.4 8.6 (3.9) (25.6) (38.8) Source: Company, CLSA; consensus data from IBES; CL = estimate.
Find CLSA research on Bloomberg, Thomson Reuters, CapIQ and themarkets.com - and profit from our evalu@tor proprietary database at clsa.com
Ed Maguire [email protected] +1 212 549 8200
20 September 2013
USA Technology Reuters ORCL.N Bloomberg ORCL US
Priced on 16 September 2013 S&P 500 @ 1,697.6 12M hi/lo US$36.43/29.52 12M price target US$35.00 ±% potential +6% Shares in issue 5,025.8m Free float (est.) 78.1% Market cap US$152,678m 3M average daily volume US$828.9m Foreign s'holding 7.4% Major shareholders Larry Ellison 22.2% The Vanguard Group 3.3%
Stock performance (%) 1M 3M 12M
Absolute 1.7 (2.4) 0.1 Relative (0.8) (6.4) (13.6) Abs (US$) 1.7 (2.4) 0.1
Source: Bloomberg
www.clsa.com
50
70
90
110
130
150
170
10
15
20
25
30
35
40
Sep 08 May 10 Jan 12 Sep 13
Oracle (LHS)
Rel to 500
(US$) (%)
Navigating disruption With a legacy in on-premise enterprise infrastructure hardware and software, Oracle has aggressively pivoted to cloud-related messaging to promote both products and services. The company bulked up its SaaS portfolio with M&A, launched cloud services and expanded integration partnerships with Salesforce.com, NetSuite and Microsoft. It faces multiple secular headwinds from the cloud, but is taking measures to adapt. Given the challenges, we rate the stock at U-PF with a US$35 target.
Embracing SaaS through M&A Oracle has absorbed RightNow, Taleo and Eloqua into an application portfolio centered on Fusion Applications, which offer on-premise or cloud deployment. The on-premise CRM and human capital management (HCM) applications have had to weather aggressive competition from Salesforce.com and Workday, but vertical applications particularly in financial services remain relatively sticky.
PaaS modernizing Java apps for the cloud Oracle’s proprietary middleware offerings, notably WebLogic application servers, are exposed to competition from open source and hosted PaaS alternatives. However, its Java Cloud Services and Database Cloud Services are designed to allow the installed customer base running Java-based applications to adapt applications to a cloud-based delivery model.
Hardware business continues to face challenges Oracle’s focus on engineered systems is central to its strategy to enable private clouds. The Exadata and Exalogic offerings are designed for scalable workloads, and the company is seeing growth from consolidation of workloads. However, the hardware business has struggled through mix shifts and product transitions, and we believe proprietary, high-margin hardware remains vulnerable to commoditization.
Partnerships a harbinger for strategic shifts The company has offered a roadmap to its customers to bridge the transition to the cloud (with the Oracle Public Cloud, Hybrid Cloud, SaaS applications and flexible deployment paths for its existing applications), but these are still subject to disruption from lower-priced alternatives. One can make a case that Oracle’s powerful hold on customers is finally being impacted by Software as a Service, public cloud and open source. It’s less clear how the company will navigate the economic model shift in the cloud.

Oracle - U-PF Global technology
94 [email protected] 20 September 2013
Managing the big shift Oracle’s business model has been predicated on on-premise software and hardware sales, with support revenue key to the model. The hardware business is a commodity business which continues to underperform, and we are seeing broad-based weakness in branded servers at other vendors as well. We believe enterprise hardware businesses will continue to be commoditized by cloud computing. Both public cloud providers like Amazon and the architecture of x86 server farms are undermining traditional servers. Management had expected the commodity portion would bottom out as engineered systems gain traction, but this is taking longer than initially thought. The Exa-systems offerings are seeing decent momentum, largely around consolidation within the existing installed base.
The emphasis on selling infrastructure products (not solutions) has been successful in driving a high-margin product business, but as infrastructure (ie, servers, OS, increasingly database and middleware) becomes subject to commoditization, applications will be the path towards higher value. For Oracle, apps ARE important but have been relatively smaller than database, largely acquired and arguably not in its DNA.
Recent partnerships with Salesforce.com, NetSuite and Microsoft are notable moves that signal a more open stance towards integration with competing solutions. Salesforce.com has committed to Oracle’s database, Exadata and Oracle Linux for 12 years; now Oracle will also adopt Salesforce.com’s CRM while Salesforce.com will adopt Oracle’s HCM and back-office apps.
Expanding into the cloud Oracle’s cloud-related offerings span an extensive portfolio of hardware, software and services, ranging from Oracle Public Cloud, Hybrid Cloud, SaaS applications and flexible deployment paths for its existing applications. The technical advantages of Oracle’s vertically integrated system stack have been key selling points, but we have concerns over the company’s shift to a ratable, services-based purchasing model. It’s also unclear how Oracle will navigate the economic model shift in the cloud. Pricing remains opaque, particularly for pending database, messaging and storage services. Still, we don’t expect pricing to be particularly disruptive as Oracle is not competing in the commodity IaaS segment of the market.
The company has disclosed that well over 2,000 customers are using its cloud services. Database Services include an Oracle Database in the cloud running on an Exadata box, supporting APEX, SQL, PL/SQL, Java and REST APIs. The data schema and table-space isolation are managed and monitored. Java Services run Java apps in the cloud, JDeveloper, Eclipse or NetBeans. There is a variety of configurations, which can go from share to multinode instances. There is an object-storage service with key value, file and DB BLOBs, OpenStack accessible with a REST API. Developer services enable agile development teams through GIT and messaging services for asynchronous communications for applications. Compute services allow users to package code in assembly language and deploy via OpenStack on the cloud. The cloud business is now at a US$1bn-plus run rate. In 4QFY13, management noted 500 new SaaS customers, of which 300 were in the HCM segment. This reinforces the company’s rationale for the M&A strategy as well as core strength in this area.
Apps ARE important but are arguably not in Oracle’s core DNA
Oracle’s business model has been predicated on
on-premise software and hardware sales
The technical advantages of Oracle’s vertically
integrated systems have been key selling points
Oracle’s cloud business is now running at over a
US$1bn run rate

Oracle - U-PF Global technology
20 September 2013 [email protected] 95
Applications focused on Software as a Service Oracle’s broad portfolio application suites are designed to run on an SaaS model. The apps were rewritten on Java with an HTML interface, built in analytics, social and collaboration functions. The company refers to its applications as ERP Services. There is a range of different offerings around finance, procurement, self-service procurement, supply and project accounting. Oracle uses its own software to consolidate from 167 countries. HCM Services incorporate social capabilities to manage the candidate and employee lifecycle.
With a majority of its software products still under the traditional perpetual license, Oracle has been expanding into the SaaS business via acquisitions, including RightNow for customer-service products, Taleo for talent management and Eloqua for marketing/customer experience. Most of RightNow, Taleo and Eloqua’s capabilities have been integrated into the portfolio.
Protecting the database and middleware flanks Oracle has been the dominant market leader in the database-management systems segment. The new 12c (“c” for cloud) database offers a number of enhancements including multitenant and enhanced management capabilities that are intended to lower operating costs for customers and to support cloud-based applications. As part of the Sun deal in 2009, Oracle acquired MySQL as an open-source database, in many cases a lower-end alternative to the Oracle database. The Oracle Enterprise Manager 12c provides a rich set of self-serviced management user interfaces for managing services in the cloud platform. Oracle Fusion Middleware is based on a unique hot-pluggable architecture of middleware products, ranging from application server, integration & process management to development tools, for building standards-based platforms to develop and run services. The BEA Systems acquisition, which closed in 2008, was another M&A move by Oracle to strengthen its enterprise infrastructure software and middleware offerings. The partnership with Microsoft to deploy Oracle software, including Java, Oracle database and Oracle WebLogic Server, on Windows Server Hyper-V and Windows Azure demonstrates the company’s ambition to push for the wider adoption of its cloud solutions and its Java-as-the-platform ideology.
Oracle remains the dominant leader in the relational database market, but there is growing momentum around open-source alternatives such as Hadoop, NoSQL and object-oriented variants such as Apache Cassandra, MongoDB and others. We’d note that Oracle’s installed base of databases supporting production apps is quite sticky, but the challenge is to capture share of new generation applications that take advantage of mobility and Big Data use cases. For the Global 2000, Oracle remains a fixture, but for new companies that are key to drive growth in the future (for instance internet companies like Pinterest or Foursquare and SaaS companies like Workday), there is less of a pressing need to invest in a proprietary relational database. Even Oracle’s open-source MySQL offering is being targeted competitively by MongoDB. Oracle does have columnar and NoSQL offerings, but these are relatively small. The other challenge to the relational database’s lock-in comes from the role of Platform as a Service. We haven’t seen widespread signs of Hadoop replacing traditional data warehouses as use cases are more complementary, but we recently heard of a couple of rip-and-replace cases. The challenge for Oracle is to capture more of the new use cases that threaten to capture more open-source share and use of commodity hardware in scale-out virtualized infrastructure.
The challenge for Oracle database is to capture
share of new generation applications
Oracle has been expanding into the SaaS business via acquisitions
Oracle’s broad portfolio application suites are designed to run on an
SaaS model
It is a dominant leader in the database-
management systems segment

Oracle - U-PF Global technology
96 [email protected] 20 September 2013
Hardware faces off against Infrastructure as a Service Oracle’s hardware product offerings have been significantly consolidated after the Sun Microsystems acquisition. The Exadata and Exalogic engineered systems, ZFS Storage and Oracle SuperCluster are examples of its compute, storage and network resources. Oracle VM then provides the abstraction and pool-management capabilities for mapping on to the resource layer. On the operating system front, Oracle Solaris has been declining in the server OS market, while Oracle Linux is likely to benefit from market momentum, as indicated by the recently announced Microsoft partnership whereby Oracle Linux preconfigured instances will be made available to Windows Azure users.
Initial pricing models for hosted Exadata and Exalogic capabilities are essentially just term licenses rather than metered pricing. This is more managed hosting than cloud services, to put a finer distinction on it. What will continue to challenge Oracle is how the advent of cloud platforms creates the conditions where database is increasingly commoditized for certain types of workloads (not traditional transactional applications, but more highly scalable web-based applications). We’re seeing more companies such as Pinterest or Foursquare run 100% on AWS, using a NoSQL database like Couchbase or MongoDB. There’s fundamental deflation across hardware and infrastructure software, and Oracle’s applications represent a way to migrate value over time.
Hardware product offerings have been
significantly consolidated
Oracle’s applications represent a way to
migrate value over time

Oracle - U-PF Global technology
20 September 2013 [email protected] 97
Summary financials Year to 31 May 2012A 2013A 2014CL 2015CL 2016CL Summary P&L forecast (US$m) Revenue 37,221 37,253 38,279 39,776 40,976 Op Ebitda 20,128 20,543 21,322 21,971 22,219 Op Ebit 17,212 17,612 18,604 19,655 20,443 Interest income (768) (798) (651) (651) (599) Interest expense - - - - - Other items 22 11 (3) 7 8 Profit before tax 16,466 16,825 17,950 19,011 19,853 Taxation (3,946) (3,867) (4,270) (4,522) (4,722) Minorities/pref divs/affils - - - - - Net income 12,520 12,958 13,681 14,489 15,130
Summary cashflow forecast (US$m) Net income 12,520 12,958 13,681 14,489 15,130 Operating adjustments (2,539) (2,033) (1,735) (1,382) (983) Depreciation/amortisation 2,916 2,931 2,718 2,316 1,776 Working capital changes 9 (594) 246 82 227 Non-operating adjustments 837 962 1,072 873 894 Net operating cashflow 13,743 14,224 15,981 16,379 17,046 Capital expenditure (648) (3,305) (766) (796) (820) Free cashflow 13,095 10,919 15,216 15,584 16,226 Acq/inv/disposals (7,733) (2,651) - - - Net investing cashflow (8,381) (5,956) (766) (796) (820) Increase in loans 1,700 4,974 - - - Dividends (1,205) (1,433) (2,283) (2,283) (2,283) Net equity raised/other (6,594) (12,041) 251 245 (1,753) Net financing cashflow (6,099) (8,500) (2,032) (2,038) (4,035) Incr/(decr) in net cash (737) (232) 13,183 13,546 12,191 Exch rate movements (471) (110) 0 0 0 Opening cash 16,163 14,955 14,613 27,796 41,342 Closing cash 14,955 14,613 27,796 41,342 53,533
Summary balance sheet forecast (US$m) Cash & equivalents 14,955 14,613 27,796 41,342 53,533 Debtors 6,377 6,049 6,193 6,391 6,579 Inventories 158 240 240 242 245 Other current assets 18,533 20,790 20,581 20,624 20,619 Fixed assets 3,021 3,053 2,567 2,141 1,775 Intangible assets 33,018 33,983 32,206 27,033 26,124 Other term assets 2,265 3,084 3,045 3,044 3,047 Total assets 78,327 81,812 92,628 100,817 111,922 Short-term debt 2,950 - - - - Creditors 438 419 382 389 388 Other current liabs 12,000 12,453 11,886 12,191 12,602 Long-term debt/CBs 13,524 18,494 18,494 18,494 18,494 Provisions/other LT liabs 5,328 5,301 5,307 5,297 5,300 Minorities/other equity 399 407 407 407 407 Shareholder funds 43,688 44,738 56,152 64,040 74,730 Total liabs & equity 78,327 81,812 92,628 100,817 111,922
Ratio analysis Revenue growth (% YoY) - 0.1 2.8 3.9 3.0 Ebitda growth (% YoY) - 2.1 3.8 3.0 1.1 Ebitda margin (%) 54.1 55.1 55.7 55.2 54.2 Net income margin (%) 33.6 34.8 35.7 36.4 36.9 Dividend payout (%) 9.8 11.2 16.7 15.8 15.1 Effective tax rate (%) 24.0 23.0 23.8 23.8 23.8 Ebitda/net int exp (x) 26.2 25.7 32.8 33.8 37.1 Net debt/equity (%) 3.4 8.6 (16.4) (35.5) (46.6) ROE (%) 28.7 29.3 27.1 24.1 21.8 ROIC (%) 27.5 25.8 26.5 30.1 33.8 EVA®/IC (%) 19.0 17.3 18.1 21.7 25.3 Source: CLSA
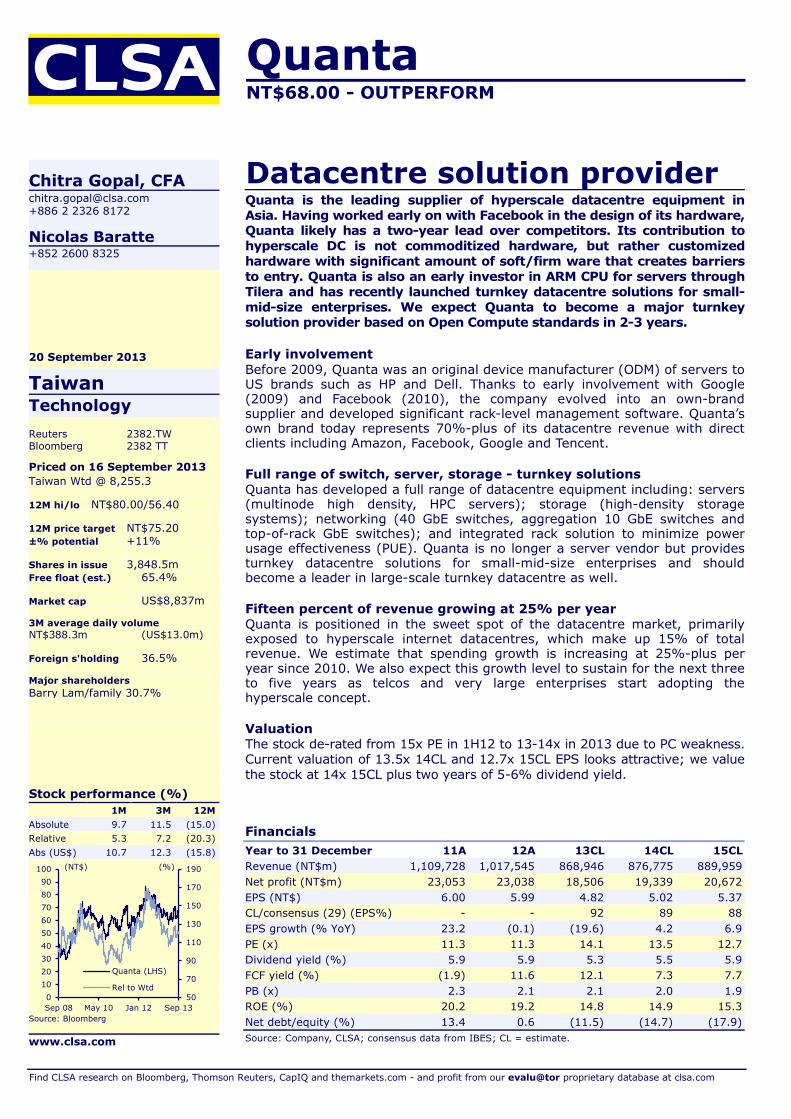
Quanta NT$68.00 - OUTPERFORM
Financials Year to 31 December 11A 12A 13CL 14CL 15CL Revenue (NT$m) 1,109,728 1,017,545 868,946 876,775 889,959 Net profit (NT$m) 23,053 23,038 18,506 19,339 20,672 EPS (NT$) 6.00 5.99 4.82 5.02 5.37 CL/consensus (29) (EPS%) - - 92 89 88 EPS growth (% YoY) 23.2 (0.1) (19.6) 4.2 6.9 PE (x) 11.3 11.3 14.1 13.5 12.7 Dividend yield (%) 5.9 5.9 5.3 5.5 5.9 FCF yield (%) (1.9) 11.6 12.1 7.3 7.7 PB (x) 2.3 2.1 2.1 2.0 1.9 ROE (%) 20.2 19.2 14.8 14.9 15.3 Net debt/equity (%) 13.4 0.6 (11.5) (14.7) (17.9) Source: Company, CLSA; consensus data from IBES; CL = estimate.
Find CLSA research on Bloomberg, Thomson Reuters, CapIQ and themarkets.com - and profit from our evalu@tor proprietary database at clsa.com
Chitra Gopal, CFA [email protected] +886 2 2326 8172
Nicolas Baratte +852 2600 8325
20 September 2013
Taiwan Technology Reuters 2382.TW Bloomberg 2382 TT
Priced on 16 September 2013 Taiwan Wtd @ 8,255.3 12M hi/lo NT$80.00/56.40 12M price target NT$75.20 ±% potential +11% Shares in issue 3,848.5m Free float (est.) 65.4% Market cap US$8,837m 3M average daily volume NT$388.3m (US$13.0m) Foreign s'holding 36.5% Major shareholders Barry Lam/family 30.7%
Stock performance (%) 1M 3M 12M
Absolute 9.7 11.5 (15.0) Relative 5.3 7.2 (20.3) Abs (US$) 10.7 12.3 (15.8)
Source: Bloomberg
www.clsa.com
50
70
90
110
130
150
170
190
0102030405060708090
100
Sep 08 May 10 Jan 12 Sep 13
Quanta (LHS)
Rel to Wtd
(NT$) (%)
Datacentre solution provider Quanta is the leading supplier of hyperscale datacentre equipment in Asia. Having worked early on with Facebook in the design of its hardware, Quanta likely has a two-year lead over competitors. Its contribution to hyperscale DC is not commoditized hardware, but rather customized hardware with significant amount of soft/firm ware that creates barriers to entry. Quanta is also an early investor in ARM CPU for servers through Tilera and has recently launched turnkey datacentre solutions for small-mid-size enterprises. We expect Quanta to become a major turnkey solution provider based on Open Compute standards in 2-3 years.
Early involvement Before 2009, Quanta was an original device manufacturer (ODM) of servers to US brands such as HP and Dell. Thanks to early involvement with Google (2009) and Facebook (2010), the company evolved into an own-brand supplier and developed significant rack-level management software. Quanta’s own brand today represents 70%-plus of its datacentre revenue with direct clients including Amazon, Facebook, Google and Tencent.
Full range of switch, server, storage - turnkey solutions Quanta has developed a full range of datacentre equipment including: servers (multinode high density, HPC servers); storage (high-density storage systems); networking (40 GbE switches, aggregation 10 GbE switches and top-of-rack GbE switches); and integrated rack solution to minimize power usage effectiveness (PUE). Quanta is no longer a server vendor but provides turnkey datacentre solutions for small-mid-size enterprises and should become a leader in large-scale turnkey datacentre as well.
Fifteen percent of revenue growing at 25% per year Quanta is positioned in the sweet spot of the datacentre market, primarily exposed to hyperscale internet datacentres, which make up 15% of total revenue. We estimate that spending growth is increasing at 25%-plus per year since 2010. We also expect this growth level to sustain for the next three to five years as telcos and very large enterprises start adopting the hyperscale concept.
Valuation The stock de-rated from 15x PE in 1H12 to 13-14x in 2013 due to PC weakness. Current valuation of 13.5x 14CL and 12.7x 15CL EPS looks attractive; we value the stock at 14x 15CL plus two years of 5-6% dividend yield.
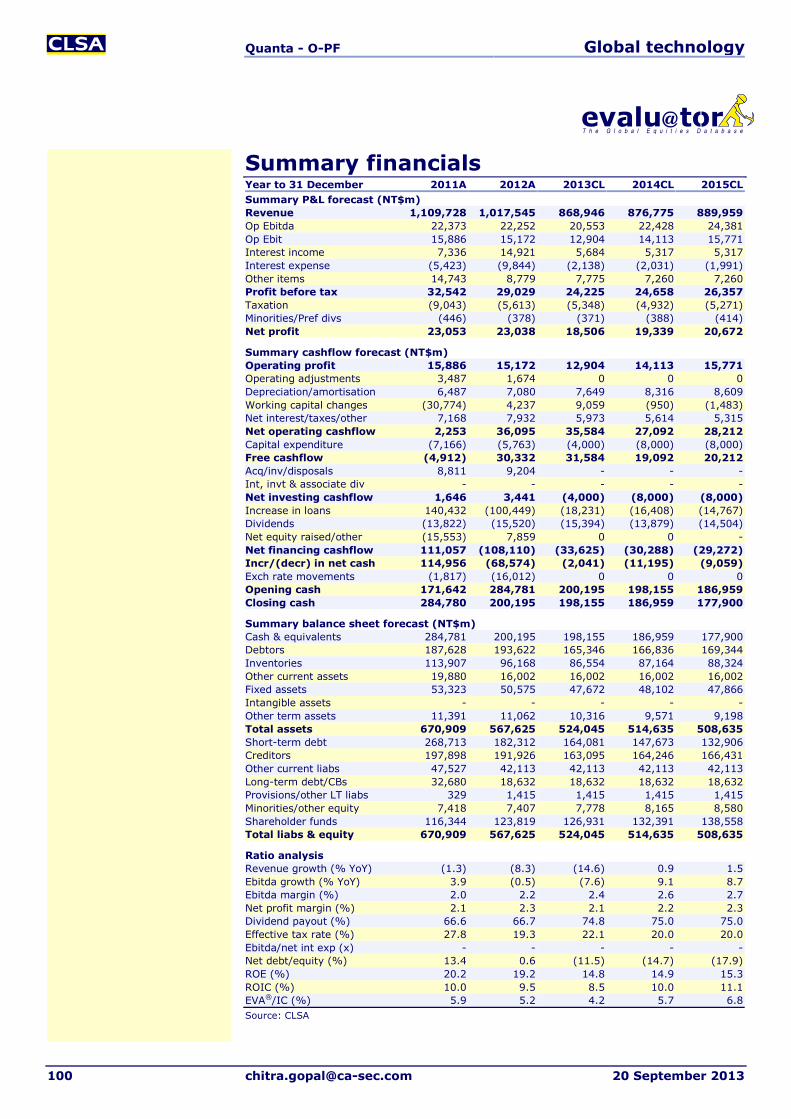
Quanta - O-PF Global technology
100 [email protected] 20 September 2013
Summary financials Year to 31 December 2011A 2012A 2013CL 2014CL 2015CL Summary P&L forecast (NT$m) Revenue 1,109,728 1,017,545 868,946 876,775 889,959 Op Ebitda 22,373 22,252 20,553 22,428 24,381 Op Ebit 15,886 15,172 12,904 14,113 15,771 Interest income 7,336 14,921 5,684 5,317 5,317 Interest expense (5,423) (9,844) (2,138) (2,031) (1,991) Other items 14,743 8,779 7,775 7,260 7,260 Profit before tax 32,542 29,029 24,225 24,658 26,357 Taxation (9,043) (5,613) (5,348) (4,932) (5,271) Minorities/Pref divs (446) (378) (371) (388) (414) Net profit 23,053 23,038 18,506 19,339 20,672
Summary cashflow forecast (NT$m) Operating profit 15,886 15,172 12,904 14,113 15,771 Operating adjustments 3,487 1,674 0 0 0 Depreciation/amortisation 6,487 7,080 7,649 8,316 8,609 Working capital changes (30,774) 4,237 9,059 (950) (1,483) Net interest/taxes/other 7,168 7,932 5,973 5,614 5,315 Net operating cashflow 2,253 36,095 35,584 27,092 28,212 Capital expenditure (7,166) (5,763) (4,000) (8,000) (8,000) Free cashflow (4,912) 30,332 31,584 19,092 20,212 Acq/inv/disposals 8,811 9,204 - - - Int, invt & associate div - - - - - Net investing cashflow 1,646 3,441 (4,000) (8,000) (8,000) Increase in loans 140,432 (100,449) (18,231) (16,408) (14,767) Dividends (13,822) (15,520) (15,394) (13,879) (14,504) Net equity raised/other (15,553) 7,859 0 0 - Net financing cashflow 111,057 (108,110) (33,625) (30,288) (29,272) Incr/(decr) in net cash 114,956 (68,574) (2,041) (11,195) (9,059) Exch rate movements (1,817) (16,012) 0 0 0 Opening cash 171,642 284,781 200,195 198,155 186,959 Closing cash 284,780 200,195 198,155 186,959 177,900
Summary balance sheet forecast (NT$m) Cash & equivalents 284,781 200,195 198,155 186,959 177,900 Debtors 187,628 193,622 165,346 166,836 169,344 Inventories 113,907 96,168 86,554 87,164 88,324 Other current assets 19,880 16,002 16,002 16,002 16,002 Fixed assets 53,323 50,575 47,672 48,102 47,866 Intangible assets - - - - - Other term assets 11,391 11,062 10,316 9,571 9,198 Total assets 670,909 567,625 524,045 514,635 508,635 Short-term debt 268,713 182,312 164,081 147,673 132,906 Creditors 197,898 191,926 163,095 164,246 166,431 Other current liabs 47,527 42,113 42,113 42,113 42,113 Long-term debt/CBs 32,680 18,632 18,632 18,632 18,632 Provisions/other LT liabs 329 1,415 1,415 1,415 1,415 Minorities/other equity 7,418 7,407 7,778 8,165 8,580 Shareholder funds 116,344 123,819 126,931 132,391 138,558 Total liabs & equity 670,909 567,625 524,045 514,635 508,635
Ratio analysis Revenue growth (% YoY) (1.3) (8.3) (14.6) 0.9 1.5 Ebitda growth (% YoY) 3.9 (0.5) (7.6) 9.1 8.7 Ebitda margin (%) 2.0 2.2 2.4 2.6 2.7 Net profit margin (%) 2.1 2.3 2.1 2.2 2.3 Dividend payout (%) 66.6 66.7 74.8 75.0 75.0 Effective tax rate (%) 27.8 19.3 22.1 20.0 20.0 Ebitda/net int exp (x) - - - - - Net debt/equity (%) 13.4 0.6 (11.5) (14.7) (17.9) ROE (%) 20.2 19.2 14.8 14.9 15.3 ROIC (%) 10.0 9.5 8.5 10.0 11.1 EVA®/IC (%) 5.9 5.2 4.2 5.7 6.8 Source: CLSA

Rackspace US$52.26 - SELL
Financials Year to 31 December 11A 12A 13CL 14CL 15CL Revenue (US$m) 1,025 1,309 1,530 1,732 1,945 Net income (US$m) 76 105 99 122 138 EPS (US$) 0.55 0.75 0.69 0.85 0.95 CL/consensus (22) (EPS%) - - 102 98 92 EPS growth (% YoY) 59.9 35.7 (6.9) 22.0 12.2 PE (x) 95.0 70.0 75.2 61.7 55.0 Dividend yield (%) 0.0 0.0 0.0 0.0 0.0 FCF yield (%) 1.0 1.7 0.7 0.0 (0.1) PB (x) 12.1 8.8 7.5 6.4 5.5 ROE (%) 14.7 14.6 10.8 11.2 10.9 Net debt/equity (%) (3.5) (19.8) (21.3) (18.2) (14.7) Source: Company, CLSA; consensus data from IBES; CL = estimate.
Find CLSA research on Bloomberg, Thomson Reuters, CapIQ and themarkets.com - and profit from our evalu@tor proprietary database at clsa.com
Louis Miscioscia, CFA [email protected] +1 212 408 5662
20 September 2013
USA Technology Reuters RAX.N Bloomberg RAX US
Priced on 16 September 2013 S&P 500 @ 1,697.6 12M hi/lo US$81.36/33.91 12M price target US$40.00 ±% potential -23% Shares in issue 142.2m Free float (est.) 80.0% Market cap US$7,261m 3M average daily volume US$72.6m Major shareholders Weston (Graham M) 13.7% Capital World Investors 12.3%
Stock performance (%) 1M 3M 12M
Absolute 18.7 51.0 (20.6) Relative 15.8 44.7 (31.5) Abs (US$) 18.7 51.0 (20.6)
Source: Bloomberg
www.clsa.com
0
100
200
300
400
500
600
700
800
0
10
20
30
40
50
60
70
80
90
Sep 08 May 10 Jan 12 Sep 13
Rackspace (LHS)
Rel to 500
(US$) (%)
The double-edged sword Rackspace’s business can be divided into two segments: managed hosting (MH) and cloud computing. While we see good growth for MH, which accounts for about 75% of the company’s revenue, Gartner’s 15-20% Cagr estimate through 2016 seems too aggressive for this legacy business. The new cloud business will grow at 2-3x this rate, according to Gartner, but fierce competition exists in this space from various tech giants, squeezing margins and growth potential for Rackspace.
Cloud computing holds both opportunities and risks Rackspace is only one of many players on the cloud side and significantly lags AWS. With US$400m in revenue in 13CL, IaaS cloud services are a double-edged sword for Rackspace, with a lot of risks. The company could see margin leverage as more clients move to the cloud. MH requires customization and manual intervention, while the cloud less so due to automation and virtualization. Incremental revenue from the cloud can be more margin accretive than MH, which is more a linear function. But this depends on technology and scale.
Behind in technology and scale Technology is the key to achieve leverage, and Rackspace is behind in comparison to AWS. For example, AWS can spin up or down applications automatically. For Rackspace, it’s still a manual process. AWS is by far the industry leader and six times the size of Rackspace based on revenue. AWS can use this scale advantage as a competitive weapon with pricing. With giants like Microsoft, Google, IBM and VMware also entering this market, competition will be further intensified.
The giants have awakened; merger possible? Today, the competition comprises mostly AWS. Tomorrow, it will also include Google, Microsoft, IBM and many other industry giants. In tech, if you don’t become a giant, or merge with one, over time you are at a big disadvantage. However, a merger with Rackspace could be tough given its roughly US$6.3bn market cap, and a deal at say a 30% premium would put it over US$8bn. Both Microsoft with US$77bn of cash and Google with US$55bn of net cash could potentially look to strengthen their offerings, and if Rackspace interests them, they could afford it; IBM too, but financially it would probably be a stretch, though not impossible. For most others, basically we believe it would be out of reach.

Rackspace - SELL Global technology
102 [email protected] 20 September 2013
Rackspace’s OpenStack A few years back, if Rackspace had released a solid production version of OpenStack, it might have been able to dominate the cloud software stack market. However, there were many false starts. The original work was with NASA, and then with Citrix, all of which never panned out, and both partners eventually moved onward.
Rackspace realized in order to get true momentum, the whole IT community needed to contribute as the effort was bigger than it expected. So in late 2011 and into 2012, the company moved the core of the code to Apache Software Foundation for open-source certification. It gave up the concept of selling software via the VMware model, but hopefully left the door open for a Red Hat-type support model, or as a way to leverage its core business via OpenStack cloud apps.
In April 2012, AT&T, Cisco, Dell, HP, IBM, Red Hat and many others announced their intent to become platinum or gold members and supporters of OpenStack. Despite their endorsement, Rackspace felt the code was still not ready for enterprise support. In August 2012, the company eventually released Rackspace Private Cloud software (code name Alamo), freely available from its website. In order to get a return on its effort, the company offers support for a fee and hopes this will be material. However, prior comments from the CEO are that this could take years to develop. In April 2013 OpenStack had a very successful user conference in Portland, Oregon, with over 2,800 attendees, doubling the attendance from the previous event six months prior.
The shift to the open community has moved Rackspace and OpenStack to the level of thought leaders for cloud stack software. Still to be determined is whether the code is gaining traction outside this group of supporters and if it will emerge as a standard - the key to future success.
There is a view that companies that want to build their applications for use in a public cloud or hybrid cloud environment right from the beginning will want to use open software code. First, it avoids being locked into paying anyone a licensing fee. Second, given VMware’s success in the datacenter, it reduces the concern that more control will be given to one vendor. There have been many comments from industry experts and companies that even the latest release of OpenStack is still not ready for prime time. Even if it does become a standard, it’s unclear if Rackspace will profit from it. HP and IBM could benefit even more from it than Rackspace as they are using it to run their own cloud hosting sites and competing directly with Rackspace.
The open community is behind OpenStack, but
will that benefit Rackspace?
Rackspace is considered a thought leader for open
cloud stack software, but is it enough?
In August 2012, Rackspace Private Cloud
software was released
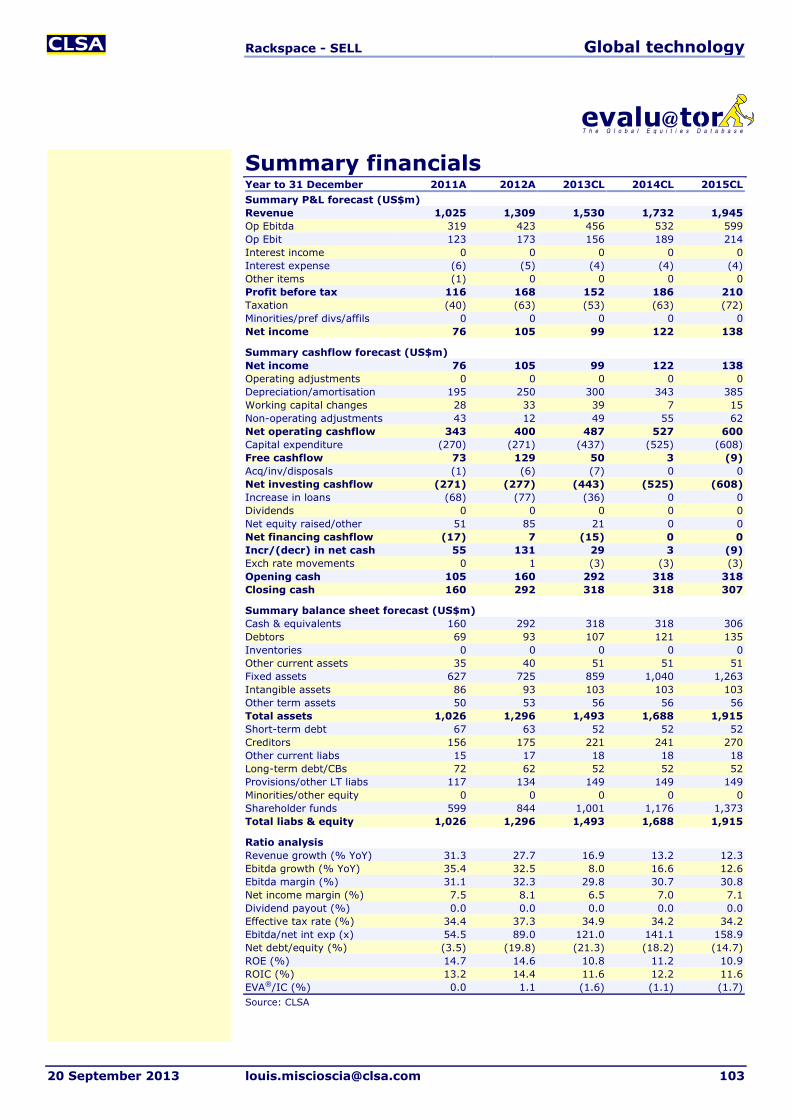
Rackspace - SELL Global technology
20 September 2013 [email protected] 103
Summary financials Year to 31 December 2011A 2012A 2013CL 2014CL 2015CL Summary P&L forecast (US$m) Revenue 1,025 1,309 1,530 1,732 1,945 Op Ebitda 319 423 456 532 599 Op Ebit 123 173 156 189 214 Interest income 0 0 0 0 0 Interest expense (6) (5) (4) (4) (4) Other items (1) 0 0 0 0 Profit before tax 116 168 152 186 210 Taxation (40) (63) (53) (63) (72) Minorities/pref divs/affils 0 0 0 0 0 Net income 76 105 99 122 138
Summary cashflow forecast (US$m) Net income 76 105 99 122 138 Operating adjustments 0 0 0 0 0 Depreciation/amortisation 195 250 300 343 385 Working capital changes 28 33 39 7 15 Non-operating adjustments 43 12 49 55 62 Net operating cashflow 343 400 487 527 600 Capital expenditure (270) (271) (437) (525) (608) Free cashflow 73 129 50 3 (9) Acq/inv/disposals (1) (6) (7) 0 0 Net investing cashflow (271) (277) (443) (525) (608) Increase in loans (68) (77) (36) 0 0 Dividends 0 0 0 0 0 Net equity raised/other 51 85 21 0 0 Net financing cashflow (17) 7 (15) 0 0 Incr/(decr) in net cash 55 131 29 3 (9) Exch rate movements 0 1 (3) (3) (3) Opening cash 105 160 292 318 318 Closing cash 160 292 318 318 307
Summary balance sheet forecast (US$m) Cash & equivalents 160 292 318 318 306 Debtors 69 93 107 121 135 Inventories 0 0 0 0 0 Other current assets 35 40 51 51 51 Fixed assets 627 725 859 1,040 1,263 Intangible assets 86 93 103 103 103 Other term assets 50 53 56 56 56 Total assets 1,026 1,296 1,493 1,688 1,915 Short-term debt 67 63 52 52 52 Creditors 156 175 221 241 270 Other current liabs 15 17 18 18 18 Long-term debt/CBs 72 62 52 52 52 Provisions/other LT liabs 117 134 149 149 149 Minorities/other equity 0 0 0 0 0 Shareholder funds 599 844 1,001 1,176 1,373 Total liabs & equity 1,026 1,296 1,493 1,688 1,915
Ratio analysis Revenue growth (% YoY) 31.3 27.7 16.9 13.2 12.3 Ebitda growth (% YoY) 35.4 32.5 8.0 16.6 12.6 Ebitda margin (%) 31.1 32.3 29.8 30.7 30.8 Net income margin (%) 7.5 8.1 6.5 7.0 7.1 Dividend payout (%) 0.0 0.0 0.0 0.0 0.0 Effective tax rate (%) 34.4 37.3 34.9 34.2 34.2 Ebitda/net int exp (x) 54.5 89.0 121.0 141.1 158.9 Net debt/equity (%) (3.5) (19.8) (21.3) (18.2) (14.7) ROE (%) 14.7 14.6 10.8 11.2 10.9 ROIC (%) 13.2 14.4 11.6 12.2 11.6 EVA®/IC (%) 0.0 1.1 (1.6) (1.1) (1.7) Source: CLSA

Salesforce.com US$49.65 - BUY
Financials Year to 31 January 12A 13A 14CL 15CL 16CL Revenue (US$m) 2,267 3,050 4,021 5,267 6,479 Net income (US$m) 194 243 213 385 513 EPS (US$) 0.34 0.41 0.34 0.58 0.73 CL/consensus (42) (EPS%) - - 99 109 100 EPS growth (% YoY) - 19.6 (17.0) 70.9 25.7 PE (x) 146.7 122.6 147.7 86.4 68.7 Dividend yield (%) 0.0 0.0 0.0 0.0 0.0 FCF yield (%) 1.5 1.9 1.7 2.3 2.8 PB (x) 17.9 12.8 8.8 8.3 7.0 ROE (%) 12.2 12.4 7.3 10.2 11.3 Net debt/equity (%) (35.2) (26.8) 16.2 (15.0) (41.3) Source: Company, CLSA; consensus data from IBES; CL = estimate.
Find CLSA research on Bloomberg, Thomson Reuters, CapIQ and themarkets.com - and profit from our evalu@tor proprietary database at clsa.com
Ed Maguire [email protected] +1 212 549 8200
20 September 2013
USA Technology Reuters CRM.N Bloomberg CRM US
Priced on 16 September 2013 S&P 500 @ 1,697.6 12M hi/lo US$50.60/34.78 12M price target US$64.00 ±% potential +29% Shares in issue 136.0m Free float (est.) 91.5% Market cap US$29,591m 3M average daily volume US$216.6m (US$216.6m) Major shareholders Fidelity Management 15.1%
Stock performance (%) 1M 3M 12M
Absolute 13.8 30.6 26.2 Relative 10.6 25.5 8.2 Abs (US$) 13.8 30.6 26.2
Source: Bloomberg
www.clsa.com
707580859095100105110115120
20
25
30
35
40
45
50
55
Sep 11 May 12 Jan 13 Sep 13
Salesforce.com
Rel to 500 (RHS)
(US$) (%)
The cloud purebred Salesforce.com is the most prominent and successful SaaS vendor. The company has expanded beyond its origins in on-demand salesforce automation into customer service, PaaS, marketing and social business. The firm’s sustained 30%-plus revenue growth is a testament to robust secular demand and focused execution. The ecosystem of third-party ISVs running on the company’s PaaS marks significant momentum. We rate Salesforce.com BUY with a US$64 target.
A powerful core in CRM Customer relationship management (CRM) is Salesforce.com’s mainstay, and the company has taken share over the past decade, dominating over 40% of the cloud CRM market. Indications are that the opportunity remains promising. In our view, the value of the company’s offerings is not just about replacing legacy software - the ROI model addresses hardware, replacing IT staff, overhead and server costs.
Building an application ecosystem PaaS has been Salesforce.com’s fastest-growing offering over the past year, and the company maintains two platforms: Force.com (on which the Salesforce.com apps run); and Heroku (which runs on Amazon Web Services). More than 300k applications have been built on Force.com and over 2m apps on Heroku; 1.4m-plus apps have been installed from AppExchange.
Doubling down on emarketing In June, Salesforce.com acquired ExactTarget, a provider of cloud-based cross-channel marketing solutions for US$2.5bn. The suite of permission-based email, social and mobile-marketing offerings target B2C companies. The company is combining assets from its Buddy Media and Radian6 acquisitions into a more comprehensive marketing cloud to target the growing proportion of IT spending forecast by Gartner and others to be controlled by the chief marketing officer.
It’s all about business value The company is evolving from a cloud-based software provider of CRM and service to a high-value strategic technology partner impacting business processes. While the economic ROI model for Salesforce.com replaces server, datacenter and IT overhead as well, the most profound change is that the company is leading its clients through business transformation. In our view, this is analogous to ERP’s industry impact, with a market opportunity potentially greater in scope over time.
Salesforce.com - BUY Global technology
106 [email protected] 20 September 2013
The 800-pound cloud gorilla Salesforce.com benefits not only from the secular shift towards SaaS and cloud computing, but the broadening product offerings increase the available market and cross-selling opportunities. Over the past year, the company has noted no meaningful signs of slowdown in the business, reinvesting for growth through aggressive hiring with headcount doubling to over 12,000 over the past two years. The Sales Cloud continues to account for over 50% of revenue, while service, platforms and marketing are making good progress. Salesforce.com continues to build an impressive portfolio supporting its social-enterprise vision with key offerings (Sales Cloud, Service Cloud, Marketing Cloud, Chatter, Work.com and PaaS), providing tools for customers to build social front offices.
Evangelizing Software as a Service Launched in 1999, the company evangelized its vision of SaaS, which delivered all application functionality to users via the internet. Founder and CEO Marc Benioff envisioned providing a customer experience with an intuitive interface and similar ease of use of internet and ecommerce sites, such as Yahoo! and Amazon. Customers would purchase subscriptions, and the provider would manage all backend infrastructure, storage and security. This approach represented a logical evolution as well as a paradigm shift in how business applications were consumed and delivered.
The critical role of the company’s multitenant architecture, which provides multiple users with individually customized versions of an application, resulted in competitive advantages from a highly efficient delivery model. Because Salesforce.com runs a single instance of its core application, the company has been able to derive significant efficiencies from R&D, resource utilization, rapid upgrades and service levels.
The subscription-based model has created a “virtuous cycle,” successfully aligning the interests of the vendor and customer and resulting in sustained value creation. Because renewals are so critical to realizing customer value, it has reinforced the company’s focus on customer satisfaction, which, in turn, pays further dividends. Satisfied customers are more likely to renew their subscriptions and, more important, to become in effect an extension of the sales force.
Salesforce.com’s ascent benefited from a confluence of unique market dynamics. However, the company’s strategic focus on expanding into a platform player, consistent enhancements to usability and technology, and efforts to expand its user and partner ecosystem position the company to enjoy sustained growth and leadership - particularly with an improvement in macroeconomic conditions.
Salesforce.com is becoming a solutions company, guiding its customers in how to adapt and change their own business processes to embrace social technologies. What this means for the business is sporadic mega deals (eight and nine figures in size), a more consultative sales process with an imperative to maintain execution across different segments. As a key beneficiary of the secular move towards cloud-based applications and platforms, shifting emphasis towards business value is the long-term strategy that will take Salesforce.com from US$4bn to US$10bn, in our view.
The multitenant approach offers scale, R&D and
cost efficiencies
Salesforce.com is becoming a solutions
company
Salesforce.com benefits from the secular shift
towards SaaS and cloud computing
The SaaS subscription model effectively aligns
the interests of the vendor and customer
Salesforce.com - BUY Global technology
20 September 2013 [email protected] 107
Our fundamental view of Salesforce.com centers on the company’s continued ability to grow the business by managing the transition away from on-premise to cloud-based apps. This has worked well for established software categories like Sales Force Automation and Customer Service, but what Chatter has done and what Work.com and the Marketing Cloud are doing is to move Salesforce.com into helping customers change their own business processes. ‘Business value, not just IT ROI.’
Still the leader in sales-force automation Salesforce.com defines and dominates SaaS with a well-honed, disruptive approach. The subscription-based business model and strong corporate culture fosters self-reinforcing customer relationships that drive incremental user adoption, uptake of new offerings and subscription renewals. A potent combination of scale, focus and first-mover advantage keeps competition at bay. On-demand CRM offerings from SAP, Oracle and Microsoft have yet to meaningfully slow the company’s share gains.
The company has taken share in core markets over the past decade, dominating over 40% of the cloud CRM market, but the opportunity may be bigger. The company’s offerings are not just about replacing software - the ROI model addresses hardware, replacing IT staff, overhead and server costs. The Sales Cloud has surpassed the US$2bn mark this year. It took eight years to grow to US$500m and four years for the Service Cloud to reach US$500m. The company is now regularly delivering 1bn-transaction days on its infrastructure.
Service Cloud The Service Cloud is a customer-service offering that focuses on supporting the customer portal, web self-service, call center, social networking and other functions. It has made significant progress outside of existing CRM customers. A multitenant knowledge base provides the central repository for information relevant to email, web and call-center interactions - and provides a measure of differentiation that has allowed Salesforce.com to broaden its penetration of larger enterprise customers. Service Cloud has become a significant revenue driver for the company, exceeding the US$500m run rate four years after launch.
Focus on platforms A critical development is growth in ISVs using Force.com and Heroku to power a new generation of development tools targeted to mobile apps. We believe progress as a PaaS provider is critical to sustain the next phase of expansion. With the platform crossing the 1bn/transactions-a-day threshold, it’s our view that the combination of critical mass and new use cases position Salesforce.com as a winner for the long term. We note that the company’s platform offerings do not provide for private cloud code portability, but we believe existing ISVs will remain committed to the platforms.
Salesforce.com offers two different PaaS offerings - Force.com (which uses the company’s proprietary APEX programming language) and Heroku (which supports multiple languages including Java). The promise of Salesforce’s PaaS offerings is to allow developers and independent software vendors to significantly reduce the time and cost of creating new applications that run on the Salesforce.com infrastructure. Benefits for Salesforce.com include diversification of the business through a partner revenue-sharing model, the ability to leverage existing investments in software tools and delivery infrastructure, and the means to add more subscribers to the end-user base.
Service Cloud has gained traction primarily among
smaller customers
Custom applications should help drive the next
phase of growth for Salesforce.com
The company has taken share in core markets over the past decade

Salesforce.com - BUY Global technology
108 [email protected] 20 September 2013
We view the engagement of developers and VARs as of key importance to the company’s ability to sustain revenue growth and create competitive barriers to entry. While adoption of Force.com was gradual because of the semi-proprietary nature of the APEX scripting language and the lack of portability beyond the Salesforce.com platform, Heroku has helped expand the developer base. We note that the availability of third-party applications increases “stickiness” of the platform. Microsoft has long focused on the developer community as a core strategy to create great penetration for its own platforms and products.
Skating where the puck is heading In February 2012, Gartner forecast that by 2017 the largest portion of corporate IT spend would be controlled by the chief marketing officer, outpacing even the chief information officer. Gartner estimates that marketing departments control from a third to up to half of the budget for purchasing marketing software.
The processes of marketing, like other business processes, are undergoing a digital transformation as technology increasingly encapsulates specific functions. According to the US Census Bureau, total ecommerce sales for 2Q12 grew 3.3% YoY to US$54.8bn, while total retail sales declined 0.4% YoY. Ecommerce now represents over 5% of total retail sales. Within the past three years, enterprise software companies including IBM, Salesforce.com and Oracle have significantly increased mindshare with CMOs through acquisitions and partnerships - with the goal of capturing more share of the marketing budget.
Bulking up the Marketing Cloud through ExactTarget Salesforce.com’s acquisition of Buddy Media provided a social-media marketing platform that enables corporate clients to manage assets, campaigns and relationships. Combined with Radian6’s social-media analytics, Buddy Media’s platform tied together assets, furthers efforts to increase engagement and improves digital-marketing ROI. Notably, the Marketing Cloud already manages more than 10% of Facebook's ad spend. Buddy Media bolstered Salesforce.com’s portfolio of offerings for corporate marketing departments.
The US$2.5bn acquisition of ExactTarget (Salesforce.com’s largest to date and first public acquisition target) filled a key gap and advances the footprint of the Marketing Cloud. ExactTarget’s suite of cloud-based email, social and mobile marketing offerings provides marketing automation as a SaaS business mainly for business-to-consumer companies. A major focus is the ability to integrate and analyze large data sets from its own systems and other CRM marketing (Salesforce.com and Microsoft Dynamics), web analytics (Omniture and Coremetrics) and marketing automation (Marketo).
The largest portion of corporate IT spend will be
controlled by the chief marketing officer
We view the engagement of developers and VARs
as of key importance
The US$2.5bn acquisition of ExactTarget filled
a key gap

Salesforce.com - BUY Global technology
20 September 2013 [email protected] 109
Summary financials Year to 31 January 2012A 2013A 2014CL 2015CL 2016CL Summary P&L forecast (US$m) Revenue 2,267 3,050 4,021 5,267 6,479 Op Ebitda 419 574 655 851 1,069 Op Ebit 261 357 361 558 791 Interest income 23 20 17 20 22 Interest expense (22) (37) (71) (22) (22) Other items 0 0 - - - Profit before tax 263 340 307 555 791 Taxation (82) (115) (131) (207) (314) Minorities/pref divs/affils 12 18 37 37 37 Net income 194 243 213 385 513
Summary cashflow forecast (US$m) Net income 194 243 213 385 513 Operating adjustments (205) (513) (397) (474) (486) Depreciation/amortisation 157 217 293 294 278 Working capital changes 105 98 (314) 159 122 Non-operating adjustments 341 692 1,056 661 800 Net operating cashflow 592 737 851 1,025 1,227 Capital expenditure (152) (176) (330) (249) (247) Free cashflow 440 561 521 775 980 Acq/inv/disposals (338) (763) (2,812) - - Net investing cashflow (490) (939) (3,142) (249) (247) Increase in loans (31) (32) 1,386 (168) (168) Dividends 0 0 0 0 0 Net equity raised/other 106 366 395 445 500 Net financing cashflow 76 335 1,782 276 332 Incr/(decr) in net cash 178 133 (510) 1,052 1,312 Exch rate movements 5 7 817 0 0 Opening cash 424 607 747 1,054 2,106 Closing cash 607 747 1,054 2,106 3,418
Summary balance sheet forecast (US$m) Cash & equivalents 607 747 1,054 2,106 3,418 Debtors 684 873 1,175 1,371 1,647 Inventories - - - - - Other current assets 381 396 459 526 558 Fixed assets 528 605 1,206 1,147 1,124 Intangible assets 974 1,737 4,041 4,041 4,041 Other term assets 990 1,172 1,110 1,153 1,194 Total assets 4,164 5,529 9,044 10,344 11,981 Short-term debt - - 299 179 59 Creditors 536 598 847 1,080 1,297 Other current liabs 1,788 2,320 2,832 3,423 4,085 Long-term debt/CBs 49 127 1,328 1,312 1,306 Provisions/other LT liabs 205 167 210 240 267 Minorities/other equity 0 0 (29) 92 (59) Shareholder funds 1,587 2,318 3,559 4,019 5,024 Total liabs & equity 4,164 5,529 9,044 10,344 11,981
Ratio analysis Revenue growth (% YoY) - 34.6 31.8 31.0 23.0 Ebitda growth (% YoY) - 37.0 14.1 30.1 25.5 Ebitda margin (%) 18.5 18.8 16.3 16.2 16.5 Net income margin (%) 8.5 8.0 5.3 7.3 7.9 Dividend payout (%) 0.0 0.0 0.0 0.0 0.0 Effective tax rate (%) 31.1 33.8 42.7 37.3 39.8 Ebitda/net int exp (x) - 33.6 12.1 357.4 3,092.5 Net debt/equity (%) (35.2) (26.8) 16.2 (15.0) (41.3) ROE (%) 12.2 12.4 7.3 10.2 11.3 ROIC (%) 34.5 30.7 8.3 9.4 15.1 EVA®/IC (%) 18.3 14.6 (7.8) (6.8) (1.0) Source: Company, CLSA

Tata Consultancy Rs1,902.55 - OUTPERFORM
Financials Year to 31 March 12A 13A 14CL 15CL 16CL Revenue (Rsm) 488,938 629,895 822,898 963,594 1,084,191 Ebitda (Rsm) 144,174 180,871 243,203 280,511 311,369 Net profit (Rsm) 106,380 139,416 180,983 208,263 233,676 EPS (Rs) 54.4 71.2 92.5 106.4 119.4 EPS growth (% YoY) 22.5 31.1 29.8 15.1 12.2 PE (x) 35.8 27.3 21.1 18.3 16.3 Dividend yield (%) 1.5 1.3 1.8 2.1 2.1 FCF yield (%) 1.9 2.4 3.3 4.3 4.9 ROE (%) 36.8 37.9 38.9 35.5 32.4 EV/Ebitda (x) 25.5 20.1 14.7 12.4 10.8 Source: Company, CLSA; consensus data from IBES; CL = estimate.
Find CLSA research on Bloomberg, Thomson Reuters, CapIQ and themarkets.com - and profit from our evalu@tor proprietary database at clsa.com
Nimish Joshi [email protected] +91 22 6650 5054
Rohit Kadam +91 22 6650 5037
20 September 2013
India Technology Reuters TCS.BO Bloomberg TCS IB
Priced on 16 September 2013 India Sensex @ 19,742.5 12M hi/lo Rs2,075.85/1,197.60 12M price target Rs2,200.00 ±% potential +16% Shares in issue 1,957.2m Free float (est.) 26.0% Market cap US$60,653m 3M average daily volume Rs2,586.4m (US$42.0m) Major shareholders Tata Sons & others 74.0% FIIs 15.7%
Stock performance (%) 1M 3M 12M
Absolute 9.4 34.1 45.2 Relative 2.7 30.8 36.0 Abs (US$) 7.3 22.7 25.5
Source: Bloomberg
www.clsa.com
100
110
120
130
140
150
160
170
180
190
500
700
900
1,100
1,300
1,500
1,700
1,900
2,100
2,300
Sep 11 May 12 Jan 13 Sep 13
Tata Consultancy
Rel to Sensex (RHS)
(Rs) (%)
Breaking away from the pack Tata Consultancy Services (TCS) has the potential to be India’s first firm to reach US$100bn in market cap, in our view. With a low but growing share of the global IT market and superior execution, TCS is shaking up industry league tables. Scale and innovation in delivery should help it maintain its sector-leading margins and premium valuations. We believe the stock remains the best medium to long-term IT-services play. However, on a 12-month basis, we maintain our Outperform call.
Long runway on growth TCS remains on track for mid-teens revenue growth - faster than the industry average. Its market share remains low, even as it demonstrates superior ability to expand its addressable market. Gradual consolidation within IT services plays to the company’s strengths and helps its growth prospects. It seems to be alert to technology shifts that could hurt its traditional business - and while it might not be at the forefront of this change, it is catching up fast.
Superior margin defense There is much skepticism over the sustainability of TCS’ industry-leading 27% Ebit margin. While some downside is possible in the next few years, it is unlikely to be significant enough to hurt its market-cap creation prospects. The company’s margin premium over peers is a function of its scale, delivery innovation, execution of complex projects and intellectual property. These are sustainable differentiators in an otherwise commoditized industry. Regulatory change is the only real structural risk to margins.
Valuation premium likely to stay The cyclicality of TCS’ business leads to some volatility in valuations, but should not hold back market-cap accretion. Solid execution and an improving competitive position can keep the firm ahead of its peers on most growth and operating metrics, helping to maintain its premium valuations. A superior cashflow profile and high potential for elevated dividends implies TCS can trade at a stronger PE than just suggested by its EPS growth.
Good near-term prospects Indian IT is in a unique sweet spot, with revenue growth rebounding as the rupee weakens. This implies significant potential earnings upside in FY14-15. The US immigration bill remains a challenge, but a weak rupee can help reduce its impact. Our target is Rs2,200, based on 20.5x FY15CL EPS (a slight premium to the four-year average), which we believe is deserved given TCS’ improving competitiveness and stable management.

Tata Consultancy - O-PF Global technology
112 [email protected] 20 September 2013
What is cloud computing? Secular commoditization of computing resources during the past decade has resulted in the widespread availability of relatively cheap computing power, in both consumer and enterprise spheres. Consequently, there has been a marked increase in the amount of “spare” computing devices available. Cloud computing provides a mechanism by which a third-party service provider manages your IT-service requirements through a hosted or Software-as-a-Service (SaaS) model.
Current framework of cloud computing
Source: CLSA
As we wrote in Beyond the cloud, the benefits of cloud computing include conversion of capital commitment to operating costs, ability to pay per use and reduced need for prior provisioning. Reduced capital commitments can help smaller companies scale hardware only when needed.
Pay per use releases excess computing and storage capacity into the cloud until needed and essentially converts these into utilities. Ease of provisioning reduces over- and underprovisioning risks within hardware planning.
Cloud computing as a concept has been around for a while. The internet is a form of cloud computing, providing connectivity across systems. It is estimated that the world’s datacenters use only 20-30% of the time at their peak but there is no dearth of inventive ideas that could benefit from the additional computing power.
Unlike virtualization, cloud computing is not only motivated by efficiency. Instead, it is also a potential enabler for business models that may not be able to grow without access to the scalability cloud computing provides.
Communications Storage Computational resources
Cloud applications
Cloud software environment
Cloud software infrastructure
Software kernel
Firmware/hardware
Data storage as a service(DaaS)
Platform as a service(PaaS)
Software as a service(SaaS)
Communications as a service
(CaaS)
Infrastructure as a service
(IaaS)
Hardware as a service(HaaS)
Third-party processing provision
Scalability and not efficiency motivates
cloud computing
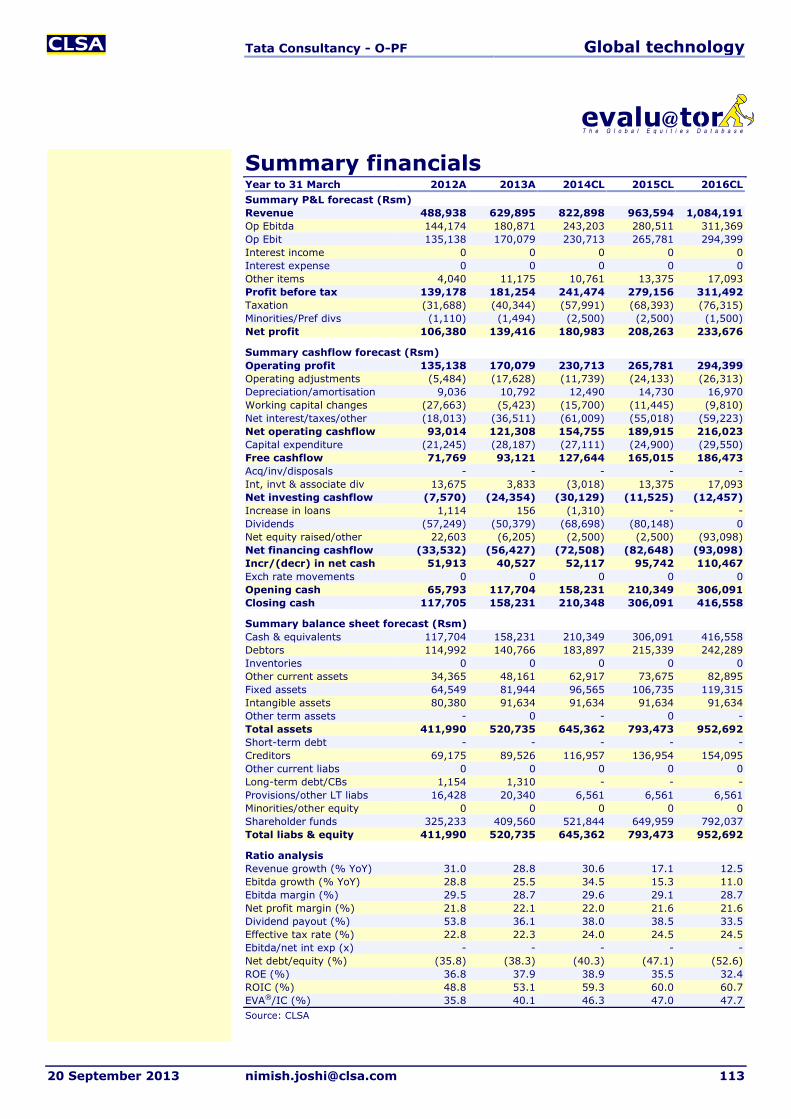
Tata Consultancy - O-PF Global technology
20 September 2013 [email protected] 113
Summary financials Year to 31 March 2012A 2013A 2014CL 2015CL 2016CL Summary P&L forecast (Rsm) Revenue 488,938 629,895 822,898 963,594 1,084,191 Op Ebitda 144,174 180,871 243,203 280,511 311,369 Op Ebit 135,138 170,079 230,713 265,781 294,399 Interest income 0 0 0 0 0 Interest expense 0 0 0 0 0 Other items 4,040 11,175 10,761 13,375 17,093 Profit before tax 139,178 181,254 241,474 279,156 311,492 Taxation (31,688) (40,344) (57,991) (68,393) (76,315) Minorities/Pref divs (1,110) (1,494) (2,500) (2,500) (1,500) Net profit 106,380 139,416 180,983 208,263 233,676
Summary cashflow forecast (Rsm) Operating profit 135,138 170,079 230,713 265,781 294,399 Operating adjustments (5,484) (17,628) (11,739) (24,133) (26,313) Depreciation/amortisation 9,036 10,792 12,490 14,730 16,970 Working capital changes (27,663) (5,423) (15,700) (11,445) (9,810) Net interest/taxes/other (18,013) (36,511) (61,009) (55,018) (59,223) Net operating cashflow 93,014 121,308 154,755 189,915 216,023 Capital expenditure (21,245) (28,187) (27,111) (24,900) (29,550) Free cashflow 71,769 93,121 127,644 165,015 186,473 Acq/inv/disposals - - - - - Int, invt & associate div 13,675 3,833 (3,018) 13,375 17,093 Net investing cashflow (7,570) (24,354) (30,129) (11,525) (12,457) Increase in loans 1,114 156 (1,310) - - Dividends (57,249) (50,379) (68,698) (80,148) 0 Net equity raised/other 22,603 (6,205) (2,500) (2,500) (93,098) Net financing cashflow (33,532) (56,427) (72,508) (82,648) (93,098) Incr/(decr) in net cash 51,913 40,527 52,117 95,742 110,467 Exch rate movements 0 0 0 0 0 Opening cash 65,793 117,704 158,231 210,349 306,091 Closing cash 117,705 158,231 210,348 306,091 416,558
Summary balance sheet forecast (Rsm) Cash & equivalents 117,704 158,231 210,349 306,091 416,558 Debtors 114,992 140,766 183,897 215,339 242,289 Inventories 0 0 0 0 0 Other current assets 34,365 48,161 62,917 73,675 82,895 Fixed assets 64,549 81,944 96,565 106,735 119,315 Intangible assets 80,380 91,634 91,634 91,634 91,634 Other term assets - 0 - 0 - Total assets 411,990 520,735 645,362 793,473 952,692 Short-term debt - - - - - Creditors 69,175 89,526 116,957 136,954 154,095 Other current liabs 0 0 0 0 0 Long-term debt/CBs 1,154 1,310 - - - Provisions/other LT liabs 16,428 20,340 6,561 6,561 6,561 Minorities/other equity 0 0 0 0 0 Shareholder funds 325,233 409,560 521,844 649,959 792,037 Total liabs & equity 411,990 520,735 645,362 793,473 952,692
Ratio analysis Revenue growth (% YoY) 31.0 28.8 30.6 17.1 12.5 Ebitda growth (% YoY) 28.8 25.5 34.5 15.3 11.0 Ebitda margin (%) 29.5 28.7 29.6 29.1 28.7 Net profit margin (%) 21.8 22.1 22.0 21.6 21.6 Dividend payout (%) 53.8 36.1 38.0 38.5 33.5 Effective tax rate (%) 22.8 22.3 24.0 24.5 24.5 Ebitda/net int exp (x) - - - - - Net debt/equity (%) (35.8) (38.3) (40.3) (47.1) (52.6) ROE (%) 36.8 37.9 38.9 35.5 32.4 ROIC (%) 48.8 53.1 59.3 60.0 60.7 EVA®/IC (%) 35.8 40.1 46.3 47.0 47.7 Source: CLSA

PC OEMs Sector outlook
Find CLSA research on Bloomberg, Thomson Reuters, CapIQ and themarkets.com - and profit from our evalu@tor proprietary database at clsa.com
Avi Silver [email protected] +1 212 549 4411
Chang Liu +1 212 408 5785
20 September 2013
USA Technology
Dell DELL Rating U-PF Target US$13.65
Hewlett-Packard HPQ Rating U-PF Target US$23.00
www.clsa.com
Server vendors at risk Ongoing adoption of IaaS and PaaS will have mixed effects on Dell and HP’s business models. PaaS will further accelerate the commoditization of branded servers as more hyperscale datacenters will use white-box/self-built server hardware and networking equipment. This, combined with rising server utilization, will result in headwinds for the companies’ enterprise server businesses. The trend could also cannibalize part of their service businesses (ie, BPO and application management services).
Server commoditization trend For HP and Dell, the biggest risk from growing PaaS and IaaS adoption is the secular challenge in industry standard server-hardware commoditization. In hyperscale datacenter buildouts, branded server vendors can offer little differentiation and value add for customers as all the value is accruing to processor and software vendors - strikingly similar to the PC market. Both Dell and HP have been experiencing declines in their server-hardware margins due to slowing demand and aggressive pricing. Dell has seen its Enterprise Solutions Group (ESG) hardware operating margin narrow from 10.5% to 4.5% in the past three years. HP has experienced YoY declines in its industry server sales over the past seven consecutive quarters.
Server revenue exposure In terms of market exposure, Industry Standard Server (ISS) hardware accounts for about 10% of HP’s total revenue and roughly 40% of its enterprise revenue. Server and networking hardware accounts for about 20% of Dell’s total revenue, with the networking business growing significantly faster than the server business.
Some portion of IT services revenue under pressure In addition to increasing margin pressure from server-hardware commoditization, a portion of the IT service businesses at Dell and HP is likely to come under pressure due to: more services and outsourcing being managed through cloud-service providers; and lower branded server-hardware demand leading to lower attachment of associated services. The most obvious challenges include business processing outsourcing (BPO) and application management services.
Dell - ESG faces margin pressure HP - Server business has declined
Source: Companies, CLSA
11,566 11,959 12,028
1,216 876 546
10.5%
7.3%
4.5%
0
2
4
6
8
10
12
14
0
2,000
4,000
6,000
8,000
10,000
12,000
14,000
16,000
FY11 FY12 FY13
Dell ESG (hardware) salesESG operating profitESG operating margin (RHS)
(%)(US$m)
3,072
3,186 3,187 3,137
2,994
2,806 2,851
10
12
14
16
18
20
22
24
2,5002,6002,7002,8002,9003,0003,1003,2003,3003,400
12 J
an
12 A
pr
12 J
ul
12 O
ct
13 J
an
13 A
pr
Jul 1
3
Industry Standard ServersEnterprise Group OPM% (RHS)
(US$m) (%)
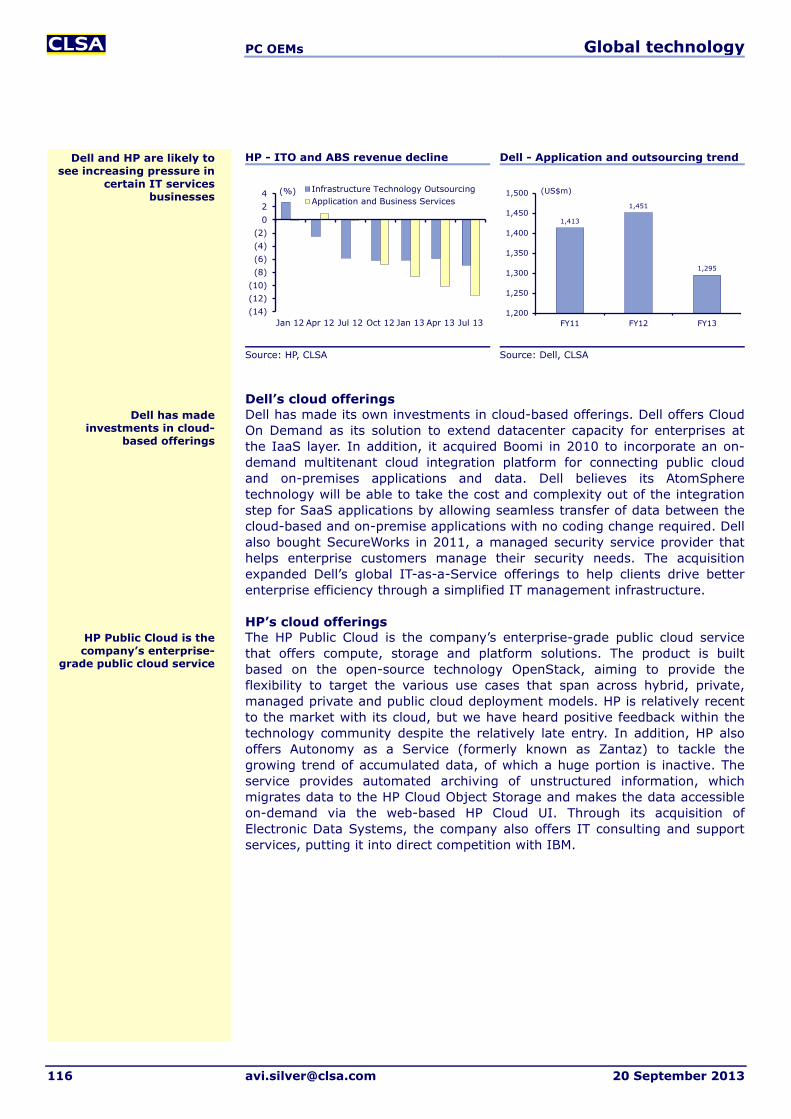
PC OEMs Global technology
116 [email protected] 20 September 2013
HP - ITO and ABS revenue decline Dell - Application and outsourcing trend
Source: HP, CLSA Source: Dell, CLSA
Dell’s cloud offerings Dell has made its own investments in cloud-based offerings. Dell offers Cloud On Demand as its solution to extend datacenter capacity for enterprises at the IaaS layer. In addition, it acquired Boomi in 2010 to incorporate an on-demand multitenant cloud integration platform for connecting public cloud and on-premises applications and data. Dell believes its AtomSphere technology will be able to take the cost and complexity out of the integration step for SaaS applications by allowing seamless transfer of data between the cloud-based and on-premise applications with no coding change required. Dell also bought SecureWorks in 2011, a managed security service provider that helps enterprise customers manage their security needs. The acquisition expanded Dell’s global IT-as-a-Service offerings to help clients drive better enterprise efficiency through a simplified IT management infrastructure.
HP’s cloud offerings The HP Public Cloud is the company’s enterprise-grade public cloud service that offers compute, storage and platform solutions. The product is built based on the open-source technology OpenStack, aiming to provide the flexibility to target the various use cases that span across hybrid, private, managed private and public cloud deployment models. HP is relatively recent to the market with its cloud, but we have heard positive feedback within the technology community despite the relatively late entry. In addition, HP also offers Autonomy as a Service (formerly known as Zantaz) to tackle the growing trend of accumulated data, of which a huge portion is inactive. The service provides automated archiving of unstructured information, which migrates data to the HP Cloud Object Storage and makes the data accessible on-demand via the web-based HP Cloud UI. Through its acquisition of Electronic Data Systems, the company also offers IT consulting and support services, putting it into direct competition with IBM.
(14) (12) (10) (8) (6) (4) (2)
0 2 4
Jan 12 Apr 12 Jul 12 Oct 12 Jan 13 Apr 13 Jul 13
Infrastructure Technology OutsourcingApplication and Business Services
(%)
1,413
1,451
1,295
1,200
1,250
1,300
1,350
1,400
1,450
1,500
FY11 FY12 FY13
(US$m)
Dell and HP are likely to see increasing pressure in
certain IT services businesses
Dell has made investments in cloud-
based offerings
HP Public Cloud is the company’s enterprise-
grade public cloud service

Appendices Global technology
20 September 2013 [email protected] 117
Appendix 1: What it’s all about In basic terms, cloud computing is a pool of resources dynamically allocated and accessible through a common application programming interface (API), essentially a set of software “hooks” to which users connect. Concurrent trends of hardware commoditization and virtualization have converged with grid computing and component-based service-oriented architecture (SOA) to form the basis of cloud computing. Multitenant architecture enables a scalable infrastructure to be accessed and shared by multiple unrelated (and distinct) users - as a service. The realization of SaaS is possible because cloud services are elastic, available on demand and measurable, and economies of scale can be exploited.
The benefits of cloud computing are well documented. The most obvious example of savings is the cost avoided in building or expanding a private datacenter. Rather than acquiring capacity in a stair-step fashion, it is possible (and more economical) to acquire capacity “as needed” from a cloud-service provider. Because of the ability to scale up and even more critically to scale down when resources are not needed, cloud users save money and their businesses become more flexible as a result.
Another example of savings is related to IT personnel costs. NIST has estimated the total cost of information technology runs 18 times the cost of equipment alone. The advantage of multitenancy lies in reducing IT costs because a single platform can be shared and updated at once. While the attractiveness of potential cost savings and increased business agility are compelling, the evolution of cloud services remains in early stages with obstacles inhibiting wider adoption.
Technology challenges remain obstacles to adoption Data governance and compliance issues are key challenges. Disparate, sometimes nonexistent, regulation of data and where it resides, or may reside, can create planning and compliance headaches for multinationals. Regulation of transactions and taxes pose a dilemma for clouds that may transfer data processing across state or country borders. In addition, security issues are critical. For instance, many European countries require that consumer data reside in datacenters that are physically located in the same country as the customers themselves.
Downtime is also a threat. As data become consolidated in massive regional datacenters, the potential negative ramifications from hacking and outages become more severe. Every major cloud-service provider has had to deal with an outage at one time or another. Amazon Web Service has faced several intermittent outages that have sidelined hundreds of websites and startup businesses, and this has presented a challenge to adoption for businesses concerned with downtime. Microsoft’s Windows Azure service saw intermitted outages on the 29 February 2012 Leap Day, resulting in the company having to issue 33% credits for the entire month.
The technology underlying cloud services is still evolving, which creates significant opportunities for existing vendors and startups to create value. X86 server virtualization has been commercially available only since 2003, and software with the capacity to orchestrate and monitor cloud infrastructure performance has yet to mature. Federating workloads between clouds remains cumbersome and is impossible by some standards. Currently there is a plethora of vendors seeking to address the cloud-services market, each in
What does the cloud represent?
Cloud services allow organizations to access IT
resources “as needed”
Data governance and compliance are
key hurdles
Cloud-services technologies are evolving,
creating significant innovation opportunities
Outages remain a lingering fear

Appendices Global technology
118 [email protected] 20 September 2013
its own (sometimes) proprietary way. In effect, many vendors are locking in customers in what is defined as an open system.
Cloud computing has seen a significant level of investment, both from established vendors repositioning their offerings to address the new paradigm and from aggressive startups seeking untapped opportunities. We highlight some of the more prominent vendors in the figure below.
Overview of the cloud-computing landscape
Source: CLSA
Understanding the layers in the cloud In its current form, cloud computing can be broken down into three main categories: SaaS, PaaS and IaaS.
Software as a Service (SaaS) refers to the delivery of applications over the internet. SaaS is the most mature segment of cloud computing, with leading players in business since the late 1990s. In a SaaS approach, compute and storage reside in a centralized datacenter, while the end user accesses the application via a web browser. SaaS vendors become a combination of web-hosting company and software provider, as the core competencies extend beyond coding, bug fixes and understanding business processes to include datacenter-related skills such as maintaining uptime and availability. Salesforce.com is the dominant vendor in SaaS applications, with a total run rate exceeding US$3bn this year. The recent consolidation wave, with Oracle buying RightNow and EloquaTaleo and SAP buying SuccessFactors, underscores how SaaS applications represent not just a growth opportunity, but also an existential threat to established enterprise software vendors.
Platform as a Service (PaaS) is essentially a development platform on a massive scale, one that enables deployment of SaaS applications on a common platform, taking advantage of common services, resources and quality controls. The vision of PaaS is to provide developers an environment that accelerates the creation and deployment of applications, which share common services such as authentication, billing and database integration while benefiting from scalability and resilience. The PaaS market remains highly fragmented, with a plethora of offerings from public and private competitors.
(SaaS)Apps
Citrix OnlineConcurNetSuiteUltimate SoftwareWorkday
(IaaS) (PaaS)Integration/
Platforms
ActiveState/StackatoApprendaCloudFoundry/PivotalDell/BoomiIBM/Cast IronInformatica CloudJoyentEngine YardLongJump/SoftwareAGRed Hat OpenShiftRightScale
(IaaS/CaaS)Infrastructure
Amazon AWSApache Cloud Stack(Citrix)CenturyLink/SavvisData DimensionIBM/SoftlayerOpen Stack (open source)RackspaceTerremarkVmware
VMwareMicrosoft Oracle Salesforce.com Amazon SAP
CRM Dynamics/Office 365, Bing
Windows Azure
Azure IaaSHyper-V
SearchGoogle Apps
AppEngine
Compute Engine
Taleo, RightNow, Eloqua, Fusion Applications
Oracle Cloud PaaS, DatabaseCloud Service
TechnologyManaged Cloud
Services
Sales Cloud, Service Cloud,
Marketing Cloud
Force.com, Heroku
na
na
Elastic Beanstalk
Elastic Compute Cloud
(EC2)
SuccessFactors, Ariba,
BusinessOne
SAP NetWeaver Cloud
na
vSphere
Vcloud, ESX
SaaS refers to the delivery of applications
over the internet
Cloud categories include Software, Platform and
Infrastructure as a Service
PaaS enables development and
deployment of SaaS apps on a common platform

Appendices Global technology
20 September 2013 [email protected] 119
Infrastructure as a Service (IaaS) refers to the delivery as a service of computing resources and capabilities, including computing power, storage, memory and other technologies used to run applications. Virtualization and resource-management software enable the delivery of these resources on a large scale. IaaS turns IT into a service and removes the burden of datacenter expertise as a requirement for small and medium businesses. For adopters of cloud-computing services, this enables customers to better focus on the business at hand rather than having to become experts in datacenter technologies. Amazon Web Services is the dominant leader in IaaS.
The cloud continuum The use of the technologies underlying public clouds supports a range of delivery models from private to hybrid to public clouds. There are no commonly agreed upon definitions of the various gradations, but several key distinctions exist.
Private (or internal) cloud: While there is quite a bit of variability in the definition, the concept of private cloud, like the public cloud, refers to a scalable, typically grid-based infrastructure that employs virtualization techniques and multitenant architectures to support dynamic provisioning of computing resources. There are a few variants of the private cloud: the closed private cloud, in which the infrastructure is operated and maintained by and solely for the benefit of a single organization, most appropriately a large enterprise or government organization. Another variant is the hosted private cloud, where resources are maintained by a third-party provider (eg, a collocation facility) but resources are reserved for a single organization (or in the case of a community private cloud, a group of organizations or partners). An enterprise private cloud offers more sophisticated security levels, usage tracking and other capabilities and is typically offered as a value-added service by a carrier or collocation provider. Generally the common characteristic of private cloud is the delineation of resources for use by a single organization or group, in contrast to more broadly shared resources with the public cloud. What distinguished the private cloud from more the traditional datacenter is the use of virtualization technologies to pool resources such as hardware, storage and I/O and self-service provisioning and management capabilities. The private cloud approach is most commonly used by the largest organizations (such as banks and government). Private clouds can be operated by organizations themselves or outsourced to a third party.
Hybrid cloud: This refers to a combination of private and public cloud resources, with certain workloads and applications typically designated to run on one or another. The ability to provide “burst” capacity, moving a workload from a private cloud to public cloud to accommodate temporary spikes in traffic or resource demands, characterizes the potential vision of the hybrid cloud model. Challenges for architecting and implementing hybrid clouds relate to federation of workloads, portability of virtual stacks between private and public clouds, data governance and persistence of security policy. Nonetheless, the hybrid cloud is likely to be the most typical approach for enterprises as they gradually adopt cloud computing.
Public (or external) cloud: This term describes cloud computing in its most widely conceived sense, as a pool of computing and storage resources delivered over the internet that can be dynamically provisioned on a self-service basis and billed according to usage, with infrastructure and resources maintained by a third-party provider.
Private clouds come in several variants, but
typically serve a single organization or group
The hybrid cloud is expected to be the most
common approach for enterprises
IaaS delivers computing resources used to run
applications

Appendices Global technology
120 [email protected] 20 September 2013
Current cloud adoption favors private over public clouds, but we believe this could change over time. Cloud-enablement vendors broadly anticipate that enterprises will maintain a mix of 30% of processing on premises (or private datacenters) and 70% on hosted clouds once concerns over security and governance are fully addressed. Industry analysts suggest that early adaptors are focused on the use of public clouds as a means to contain IT capex for peak workloads, with the use of public cloud IaaS topping out at about 30% currently. There are still data security, governance and interoperability demands to be addressed before public cloud adoption embraces mission-critical enterprise applications.
The foundation of the cloud: Infrastructure as a Service Public cloud computing IaaS provides virtual machines, storage and network resources, from shared pools of capacity. The benefits of IaaS come from standardization, which allows for customer self service. In an IaaS model, the vendor manages the hardware, virtualization, datacenter and facilities, while the customer typically is responsible for everything above the hypervisor. This includes the operating system, middleware and applications.
Cloud system infrastructure services (IaaS )
(US$bn) 2011 2012 2013 2014 2015 2016 2017 Cagr (%) 2012-17
Compute 3.41 4.94 7.29 10.54 14.75 19.74 25.38 38.7 Print 0.07 0.10 0.13 0.17 0.22 0.28 0.35 28.8 Storage 0.86 1.13 1.67 2.32 3.09 3.99 4.88 34.0 Cloud system infrastructure services (IaaS) total 4.35 6.17 9.09 13.04 18.07 24.02 30.61 37.8 Source: Gartner
Gartner forecasts the cloud IaaS market to achieve a 37.8% Cagr through 2017. The market is poised for strong growth with worldwide IaaS forecast to grow from an estimated US$4.4bn in 2011 to US$30.6bn in 2017. The 451 Group estimated that Amazon had a 37% share of the IaaS market in 2011, which represented approximately US$700m, but a variety of sources estimate the size of Amazon Web Services at a US$2.0-2.4bn annual run rate in 2013.
A key aspect of IaaS is the ability to dynamically scale up or down according to the resource needs of the business or the application. Customers are typically charged according to their resource usage, based on server capacity, processing intensity, data storage and other metrics. This approach allows IT departments to pay for resources close to actual usage needs rather than having to plan capital expenditures, procure, deploy and manage proprietary infrastructure. This ability to provide dynamic scaling - up and down - is what differentiates IaaS from traditional managed hosting, where a service provider maintains dedicated, static resources for a customer or application. The ability to handle “bursts” through dynamic provisioning of resources is part of the appeal of IaaS.
Service providers transition to the cloud Traditional datacenters derive the majority of business from colocation, datacenter outsourcing and hosting. Datacenter services is a mature market. The current impact of IaaS and PaaS on traditional datacenter businesses is small, but is expected to increase as cloud services account for a larger proportion of revenue. Gartner estimates the global IT outsourcing market will reach US$188bn in 2013, at a Cagr of 5.4% through 2017. IaaS and PaaS are likely to cannibalize a significant proportion of traditional datacenter services as traditional offerings face commoditization and or substitution.
Current cloud adoption favors private over public,
but this could change over time
A key benefit of IaaS is the ability to dynamically
scale up or down
The benefits of IaaS come from standardization,
which allows for customer self service
Gartner forecasts IaaS growing from US$4.4bn in
2011 to US$30.6bn in 2017

Appendices Global technology
20 September 2013 [email protected] 121
IT outsourcing market size and growth opportunity by segment
Source: Gartner
We are seeing a trend of traditional external service providers moving into cloud IaaS as a way to capture new spend and offset challenges to their existing businesses. There is increasing focus from outsourcing, collocation and hosting providers such as IBM, AT&T, Verizon, Orange, CSC and others, particularly carriers looking to drive incremental opportunities to offset declining voice and outsourcing revenue (which is subject to continual price erosion due to competitively driven contract renegotiations).
Traditional service providers face a number of longer-term challenges. Over time, low-cost cloud services could disrupt and replace existing outsourcing services. Cloud services also require significant investments in hardware, software and real estate, and traditional service providers must continue to deploy capex to stay competitive. Fortunately for providers in the industry, there is no shortage of nascent opportunities in the market. Particularly for service providers with existing network assets, the incremental investments required to add software-enhanced offerings to the portfolio is modest. The more meaningful challenges are practical; higher-value services like hosted virtual desktops, cloud-based development operations and PaaS address different economic buyers (line of business for instance versus network services). Bridging different types of sales processes and go-to-market strategies can be the most significant hurdle.
Traditional service providers evolving towards cloud IaaS In many respects, the idea of IaaS is the natural extension of IT outsourcing, with a few important distinctions. Traditional IT outsourcing providers (particularly for datacenter outsourcing) have included vendors that have been instrumental in establishing the IT outsourcing market itself. Leading companies, such as IBM, HP, Fujitsu, CSC, Siemens, BT and others, typically provide a range of services that include dedicated hosting (operating
The higher up the stack, the greater potential
revenue per square foot for service providers
IaaS is the natural extension of IT
outsourcing
We are seeing a trend of traditional external
service providers moving into cloud IaaS
Low-cost cloud services could disrupt and replace
existing outsourcing services
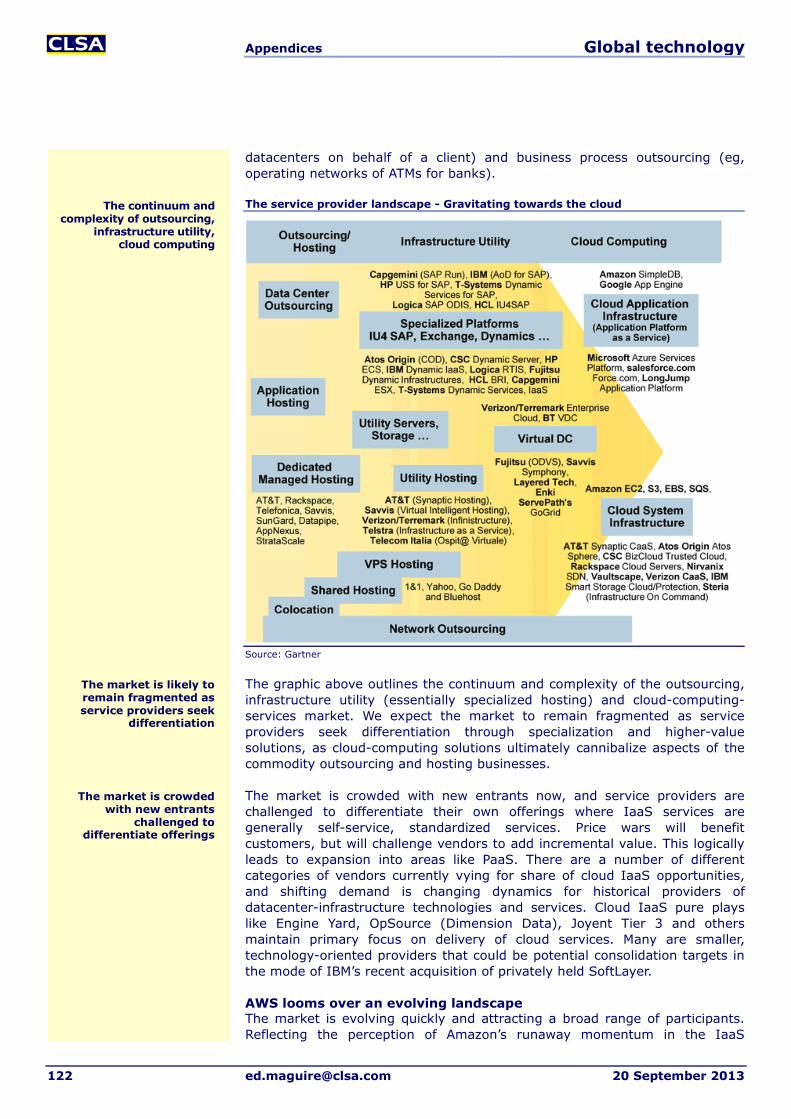
Appendices Global technology
122 [email protected] 20 September 2013
datacenters on behalf of a client) and business process outsourcing (eg, operating networks of ATMs for banks).
The service provider landscape - Gravitating towards the cloud
Source: Gartner
The graphic above outlines the continuum and complexity of the outsourcing, infrastructure utility (essentially specialized hosting) and cloud-computing-services market. We expect the market to remain fragmented as service providers seek differentiation through specialization and higher-value solutions, as cloud-computing solutions ultimately cannibalize aspects of the commodity outsourcing and hosting businesses.
The market is crowded with new entrants now, and service providers are challenged to differentiate their own offerings where IaaS services are generally self-service, standardized services. Price wars will benefit customers, but will challenge vendors to add incremental value. This logically leads to expansion into areas like PaaS. There are a number of different categories of vendors currently vying for share of cloud IaaS opportunities, and shifting demand is changing dynamics for historical providers of datacenter-infrastructure technologies and services. Cloud IaaS pure plays like Engine Yard, OpSource (Dimension Data), Joyent Tier 3 and others maintain primary focus on delivery of cloud services. Many are smaller, technology-oriented providers that could be potential consolidation targets in the mode of IBM’s recent acquisition of privately held SoftLayer.
AWS looms over an evolving landscape The market is evolving quickly and attracting a broad range of participants. Reflecting the perception of Amazon’s runaway momentum in the IaaS
The market is crowded with new entrants
challenged to differentiate offerings
The market is likely to remain fragmented as service providers seek
differentiation
The continuum and complexity of outsourcing,
infrastructure utility, cloud computing
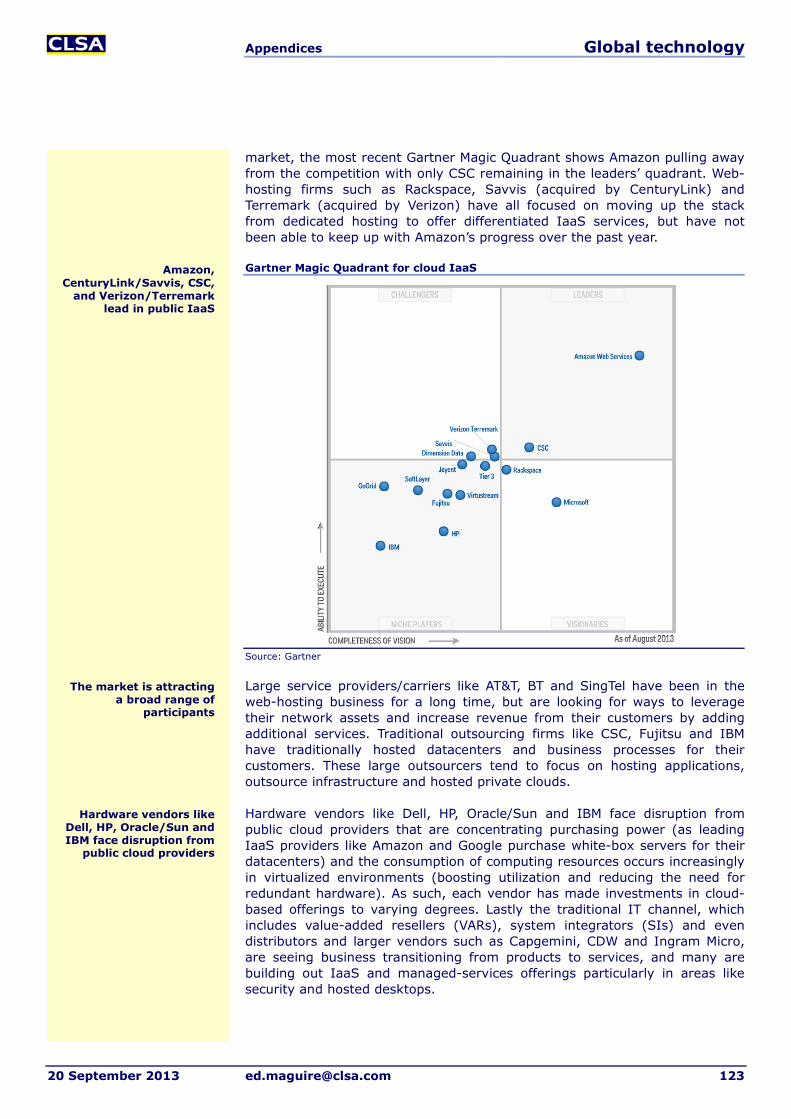
Appendices Global technology
20 September 2013 [email protected] 123
market, the most recent Gartner Magic Quadrant shows Amazon pulling away from the competition with only CSC remaining in the leaders’ quadrant. Web-hosting firms such as Rackspace, Savvis (acquired by CenturyLink) and Terremark (acquired by Verizon) have all focused on moving up the stack from dedicated hosting to offer differentiated IaaS services, but have not been able to keep up with Amazon’s progress over the past year.
Gartner Magic Quadrant for cloud IaaS
Source: Gartner
Large service providers/carriers like AT&T, BT and SingTel have been in the web-hosting business for a long time, but are looking for ways to leverage their network assets and increase revenue from their customers by adding additional services. Traditional outsourcing firms like CSC, Fujitsu and IBM have traditionally hosted datacenters and business processes for their customers. These large outsourcers tend to focus on hosting applications, outsource infrastructure and hosted private clouds.
Hardware vendors like Dell, HP, Oracle/Sun and IBM face disruption from public cloud providers that are concentrating purchasing power (as leading IaaS providers like Amazon and Google purchase white-box servers for their datacenters) and the consumption of computing resources occurs increasingly in virtualized environments (boosting utilization and reducing the need for redundant hardware). As such, each vendor has made investments in cloud-based offerings to varying degrees. Lastly the traditional IT channel, which includes value-added resellers (VARs), system integrators (SIs) and even distributors and larger vendors such as Capgemini, CDW and Ingram Micro, are seeing business transitioning from products to services, and many are building out IaaS and managed-services offerings particularly in areas like security and hosted desktops.
Amazon, CenturyLink/Savvis, CSC,
and Verizon/Terremark lead in public IaaS
Hardware vendors like Dell, HP, Oracle/Sun and IBM face disruption from
public cloud providers
The market is attracting a broad range of
participants
Appendices Global technology
124 [email protected] 20 September 2013
The battle over lock-in versus open standards Cloud-service providers are faced with the threat of commoditization and margin erosion over time. Strategies to offset this include competition on price (which favors providers of large scale) and differentiation (through service, range/breadth of offerings and technology). Cloud IaaS differs from dedicated hosting in that switching costs are in theory (and in practice) so low. Cloud-computing resources are fungible; it doesn’t matter if a user is sharing a server with many other users, or using multiple servers linked together.
Although it can be argued that cloud-service providers are not passing along the same trajectory of price/performance improvement as Moore’s Law provides for compute power, the market is still nascent, with many new entrants, and switching costs for customers of cloud-infrastructure providers are by default less than for on-premise technologies. It is a lot easier and less costly to switch a web application from running on Amazon Web Services to Rackspace than it would be to switch from running applications on Microsoft to a Java stack. The reason is that switching costs are directly related to the level of vendor lock-in.
Wikipedia defines lock-in as: ‘In economics, vendor lock-in, also known as proprietary lock-in or customer lock-in, makes a customer dependent on a vendor for products and services, unable to use another vendor without substantial switching costs. Lock-in costs, which create barriers to market entry, may result in antitrust action against a monopoly.’
Vendor lock-in can be highly effective in traditional IT scenarios. Technology vendors prefer proprietary approaches, because it creates a moat around their relationship with the customer. This was far easier to accomplish in the world of on-premise software. Examples of vendor lock-in abound among application vendors like SAP, which embed its technology in the customer’s business processes. Database vendors like Oracle and IBM play a foundational role supporting mission-critical applications, and as a result tend to engage in strategic architectural planning. Of course, Microsoft’s integration of its Office Suite and Windows OS are essential for productivity and collaboration. Vendor lock-in is great for vendor economics. A locked-in customer will continue to direct spending towards software maintenance, services and upgrades. This is economically highly beneficial to vendors (look at the financial success of SAP, Oracle and Microsoft as a result), while customers benefit from the inherent compatibilities and fewer headaches from integration.
The battle for IaaS lock-in: OpenStack versus proprietary approaches By dint of early mover status and market penetration, Amazon Web Services has established itself as the de facto public cloud standard. The company offers a number of services that developers and IT users can access to provision, deploy and manage applications running on its Elastic Computing Cloud. Amazon’s Elastic Beanstalk deployment tool, CloudFormation services management offering and CloudWatch monitoring services provide a full suite of IaaS tools for public cloud uses.
For users looking to deploy private clouds, OpenStack provides an open-source framework that has attracted support of multiple vendors. In July 2010, Rackspace and NASA launched OpenStack. This is an open-source project intended to enable organizations to create and offer cloud-computing services running on standard hardware. OpenStack has engaged dozens of
Customer switching costs are directly related to the
level of vendor lock-in
Technology vendors prefer proprietary
approaches
OpenStack provides an open-source framework
that has attracted support of dozens of vendors
Amazon Web Services has established itself as the
de facto public cloud IaaS standard
Cloud-service providers face commoditization and margin erosion long term

Appendices Global technology
20 September 2013 [email protected] 125
technology partners both public and private, including Citrix, Dell, NTT Data, Canonical, HP, Cisco and many others.
Migrating applications from public to private cloud is likely to be gated by “data gravity”. Dave McCrory, Senior VP of Platform Engineering for Warner Music Group, defines the concept of data gravity as: ‘Essentially, wherever major applications are running, masses of data tend to grow as interactions with applications create additional data. In public clouds there are services - there is an accelerative effect when application move towards the data, and also an “escape velocity” base on the ability to move data. Data gravity results from trying to shrink the amount of time necessary to convert data into information into action. The closer applications move to a mass of data, this shortens the cycle time needed to convert data into valuation knowledge for business action.’
Prices are dropping, but not as quickly as Moore’s Law There is a natural deflationary characteristic for IaaS businesses that is inherent to technology. A substantial part of this is driven by Moore’s Law and its corollaries (the continuous improvement in price/performance for compute and storage). Another contributing factor is the natural efficiencies of scale that accompany growth and investment. Service providers pass on price declines to their customers, with Amazon notably transparent in communicating the steady declines in cost to its customers.
In May 2013, Amazon Web Service reduced prices for its IaaS offerings, the 31st time in six years, while Google has done similar. Passing on price declines accomplishes two things: it transfers more value to customers and helps to fend off competition.
Art Whittman of InformationWeek has argued that prices are not dropping as quickly as the underlying technology, hence the economic benefits of cloud computing are less compelling as they should be. He writes: ‘The cost of a typical compute offering in Amazon has fallen only 18% in the last five years with little or no change in capability. This translates into a compound annual improvement of roughly 4%. Meanwhile, the number of cores available in a typical server has increased by a factor of 6x to 12x over the same period with only modest increases in costs.’
While there are merits to this argument, the reality is that providers of cloud-infrastructure services also do not experience the full benefits of Moore’s Law in their cost structure. The physical costs of real estate, power and staff are far less fungible than servers and storage, and do not always scale in linear fashion. For customers, the costs of cloud-infrastructure services increase in linear fashion (with volume discounts, of course), whereas service providers must assume the costs and risks of maintaining excess capacity during periods of downtime while working with step-function dynamics that relate to physical infrastructure investment. Nonetheless, this buys time for IaaS providers to diversify into higher value-add services.
There is a natural deflationary characteristic
for IaaS businesses that is inherent to technology
Amazon Web Service has reduced prices for its
IaaS offerings 31 times in six years
Providers of cloud-infrastructure services do
not experience full benefits of Moore’s Law

Appendices Global technology
126 [email protected] 20 September 2013
Appendix 2: The software cloudscape Defining the nature of how vendors are beneficially exposed and/or threatened by the cloud-computing model is an inexact art. We must consider both the technology and business model and the two tend to go hand in hand. As our focus is predominantly software, we have taken a look at the broader software universe and segmented the landscape into broad categories that include Software as a Service (both general and vertical, apps and infrastructure), mixed-model businesses and on-premise application and infrastructure vendors. We’ve further provided an overview of the business models (whether subscription, perpetual or mixed) to offer greater granularity for investors.
Software cloudscape by category
Category Companies (Ticker)
Software-as-a-Service applications (General)
BazaarVoice (BV), Callidus (CALD), Concur (CNQR), Salesforce.com (CRM), Cornerstone OnDemand (CSOD), ChannelAdvisor (ECOM), E2Open (EOPN),Intralinks (IL), J2 Global (JCOM), LivePerson (LPSN), Responsys (MKTG), Marketo (MKTO), Model N (MODN), Marin Software (MRIN), NetSuite (N), SciQuest (SQI), Tangoe (TNGO), Ultimate Software (ULTI), Workday (WDAY)
Software-as-a-Service applications (Vertical)
Active Netwokd (ACTV), AthenaHealth (ATHN), Wllie Mae (ELLI) , Fleetmatics (FLTX), Medidata (MDSO), RealPage (RP), Synchronoss (SNCR), DealerTrak (TRAK) and Texture (TXTR)
Software-as-a-Service (Infrastructure)
Akamai Tech (AKAM), Carbonite (CARB), Demandware (DWRE), LogMeIn (LOGM), Rally Software (RALY), ServiceNow (NOW)
Mixed-model technology IBM (IBM), Oracle (ORCL), Magic (MGIC), Microsoft (MSFT), EMC (EMC), ServiceSource (SREV)
Applications (Mixed model) Adobe (ADBE), Autodesk (ADSK), Intuit (INTU), Jive (JIVE), Microsoft (MSFT), Nuance (NUAN), Oracle (ORCL), Open Text (OTEX), SAP (SAP), SilverSpring (SSNI), SPS Commerce (SPSC), Tyler Technologies (TYL)
Applications (On premise) Accelrys (ACCL), Advent Software (ADVS), Ansys (ANSS), Aspen Tech (AZPN), Actuate (BIRT), Cadence (CDNS), Dassault Systemes (DASTY), Epiq systems (EPIQ), Guidewire (GWRE), Mentor Graphics (MENT), MicroStrategy (MSTR), Pros Revenue Management (PRO), Parametric Technologies (PMTC), QlikTech (QLIK), Synopsys (SNPS), Tableau (DATA), Teradata (TDC), Verisk (VRSK)
Infrastructure (Mixed model) AVG (AVG), CA Technologies (CA), Compuware (CPWR), Citrix (CTXS), Informatica (INFA), NQ Technologies (NQ), Proofpoint (PFPT), Qualys (QLYS), Red Hat (RHT), Splunk (SPLK), Symantec (SYMC), Tibco (TIBX), VMware (VMW)
Infrastructure (On premise) Check Point (CHKP), ClickSoftware (CKSW), CommVault (CVLT), Fortinet (FTNT), Imperva (IMPV), NICE Systems (NICE), Palo Alto Networks (PANW), PegaSystems (PEGA), Progress Software (PRGS), SolarWinds (SWI), Vasco Data Security (VDSI), Verint (VRNT)
Source: CLSA (names in bold are covered by CLSA Americas)
What’s notable about the two-year stock performance of different software categories is that all of the SaaS names outperformed the Nasdaq, while all of the on-premise and mixed-model software and diversified technology stocks underperformed the index. The relative performance of different categories is remarkably consistent with the view that value continues to migrate from on-premise towards cloud-based services. We’d note that the best-performing segment over one year is the relatively small SaaS-infrastructure vendors (which include the likes of ServiceNow and Akamai). In many respects, infrastructure SaaS offerings are applications targeted towards IT management and performance. Also notable is that on- premise applications are the best-performing category of non-SaaS software, while mixed-model technology, applications and infrastructure have all underperformed.
Quantifying cloud impact on software vendors is an inexact art, but there are
clear differences
SaaS software stocks have consistently
outperformed traditional software names
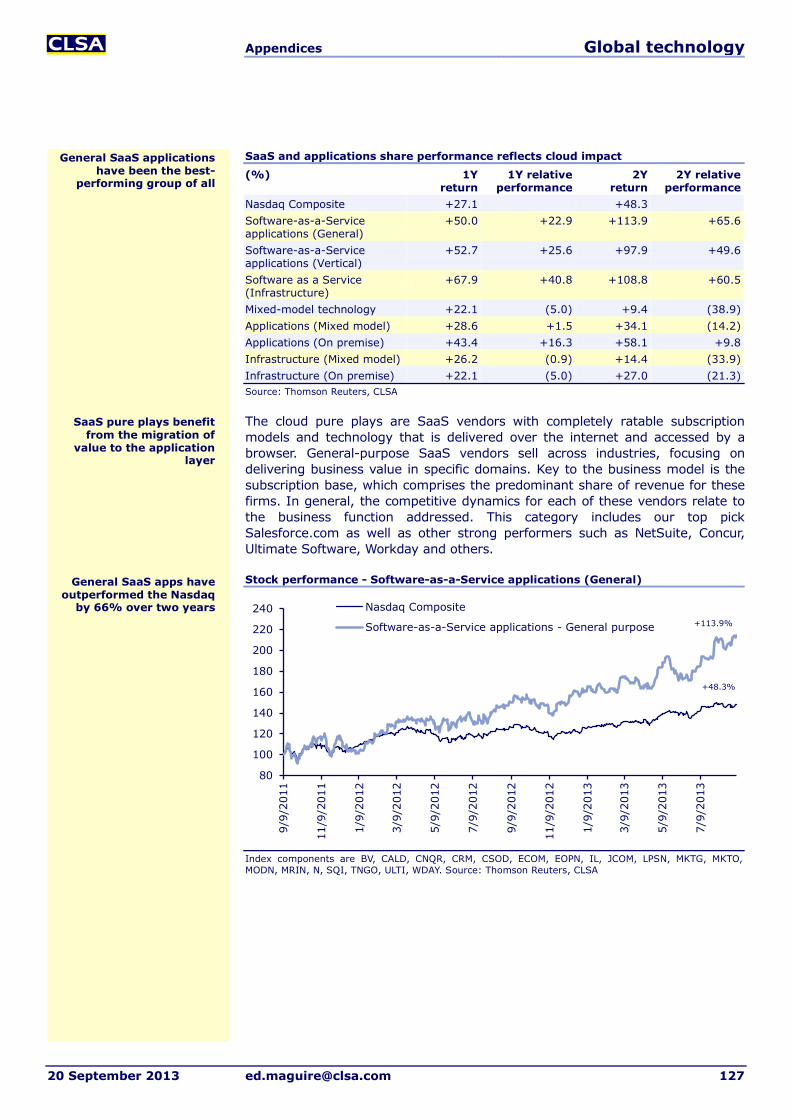
Appendices Global technology
20 September 2013 [email protected] 127
SaaS and applications share performance reflects cloud impact
(%) 1Y return
1Y relative performance
2Y return
2Y relative performance
Nasdaq Composite +27.1 +48.3 Software-as-a-Service applications (General)
+50.0 +22.9 +113.9 +65.6
Software-as-a-Service applications (Vertical)
+52.7 +25.6 +97.9 +49.6
Software as a Service (Infrastructure)
+67.9 +40.8 +108.8 +60.5
Mixed-model technology +22.1 (5.0) +9.4 (38.9) Applications (Mixed model) +28.6 +1.5 +34.1 (14.2) Applications (On premise) +43.4 +16.3 +58.1 +9.8 Infrastructure (Mixed model) +26.2 (0.9) +14.4 (33.9) Infrastructure (On premise) +22.1 (5.0) +27.0 (21.3) Source: Thomson Reuters, CLSA
The cloud pure plays are SaaS vendors with completely ratable subscription models and technology that is delivered over the internet and accessed by a browser. General-purpose SaaS vendors sell across industries, focusing on delivering business value in specific domains. Key to the business model is the subscription base, which comprises the predominant share of revenue for these firms. In general, the competitive dynamics for each of these vendors relate to the business function addressed. This category includes our top pick Salesforce.com as well as other strong performers such as NetSuite, Concur, Ultimate Software, Workday and others.
Stock performance - Software-as-a-Service applications (General)
Index components are BV, CALD, CNQR, CRM, CSOD, ECOM, EOPN, IL, JCOM, LPSN, MKTG, MKTO, MODN, MRIN, N, SQI, TNGO, ULTI, WDAY. Source: Thomson Reuters, CLSA
80
100
120
140
160
180
200
220
240
9/9/
2011
11/9
/201
1
1/9/
2012
3/9/
2012
5/9/
2012
7/9/
2012
9/9/
2012
11/9
/201
2
1/9/
2013
3/9/
2013
5/9/
2013
7/9/
2013
Nasdaq Composite
Software-as-a-Service applications - General purpose
+48.3%
+113.9%
SaaS pure plays benefit from the migration of
value to the application layer
General SaaS applications have been the best-
performing group of all
General SaaS apps have outperformed the Nasdaq
by 66% over two years

Appendices Global technology
128 [email protected] 20 September 2013
Software-as-a-Service applications - General purpose Name Ticker Market cap
(US$m) Business model Description/Comments
Bazaarvoice BV 815.1 About 98% SaaS subscription revenue; 2% media revenue from advertisers
Online platform for capturing, managing, displaying and sharing consumer reviews about products and services
Callidus Software
CALD 273.0 75% recurring revenue (on-demand subscriptions, term licenses and maintenance); 25% services and others
SaaS offerings organized under four categories: hiring, learning, marketing and selling clouds
Concur Technologies
CNQR 5,583.2 92% SaaS subscription revenue; rest from connection set-up fees and consulting services
An integrated SaaS-based business travel procurement, expense & invoice management solution
Salesforce.com CRM 26,688.6 Predominantly subscription model, some per-use recurring revenue
Market leader for SaaS CRM; traction in PaaS is building
Cornerstone CSOD 2,700.6 No breakdown of revenue from SaaS subscriptions, consulting services and elearning content (according to IR)
Human-capital management (HCM) and talent-management SaaS solutions: recruiting, learning cloud, performance, and extended enterprise
ChannelAdvisor ECOM 514.7 67% of total revenue is fixed subscription fees, 33% from variable subscriptions
SaaS platform that integrates, manages and optimizes merchandise sales across hundreds of online channels
E2open EOPN 505.5 58% subscriptions and support, 42% professional services
Network enables companies to collaborate with their trading partners to procure, manufacture, sell and distribute products
Intralinks Holdings
IL 499.6 Estimated 60% subscriptions (long-term contracts with auto-renewal), 40% transactions (short term no renewal)
SaaS solutions for secure content management and collaboration within and among organizations
J2 Global JCOM 2,258.5 97% from business cloud services (subscription and usage-based fees); 3% from digital media (advertising sales)
Business services provided in the cloud such as communication, messaging, data backup, CRM, eFax, eVoice
Liveperson LPSN 558.2 Majority of the revenue is generated from monthly service revenue and related professional services
Cloud-based platform for customer-service chat, voice and content delivery across multiple channels and screens
Responsys MKTG 726.2 70% from subscriptions, 30% from professional services
Solutions for marketers to create, execute, optimize and automate consumer interactions and marketing campaigns
Marketo MKTO 1,249.8 90% from subscriptions, 10% from professional services
Digital-marketing services with lead management, social marketing, sales insights and revenue cycle analytics
Model N MODN 518.3 41% SaaS and maintenance; 59% license and implementation
Revenue-management solutions for the life- science and technology industries
Marin Software MRIN 400.8 Revenue principally from subscriptions to its platform either directly with advertisers or with advertising agencies
Revenue-acquisition-management platform offers integrated digital-advertising-management solutions for search, display, social media and mobile advertising
NetSuite N 7,297.3 82% subscription and support, 18% professional services and other; all recurring revenue
Provider of cloud-based financials/ enterprise resource planning (ERP) software suites
SciQuest SQI 459.7 Revenue primarily derived from subscription fees and related services; some perpetual license for certain software products; ratios not provided
Cloud-based spend management including procurement solutions, spend analysis, supplier management and contract-lifecycle management
Tangoe TNGO 690.7 74% from recurring technology and services; 26% from strategic consulting, software licenses and other
Telecommunications expense management optimizes processes and expenses for fixed and mobile communications assets and services
Ultimate Software
ULTI 4,012.0 80% recurring, 19% services, <1% license Payroll and HCM software as a service; successful as a displacement to ADP
Workday WDAY 12,945.6 70% subscription revenue (92% total unearned revenue as of Jan 13), 30% professional services
Enterprise cloud applications for HCM, payroll, financial management, grants management, time tracking, procurement
Source: Companies, CLSA

Appendices Global technology
20 September 2013 [email protected] 129
Vertical SaaS providers focus on specific industries with unique business needs. We see this area of SaaS offering significant opportunities for new entrants over the next few years. This segment has outperformed the Nasdaq over a two-year period. Key names in this segment include AthenaHealth, RealPage and DealerTrak.
Stock performance - Software-as-a-Service applications (Vertical)
Index components are ACTV, ATHN, ELLI, FLTX, MDSO, RP, SNCR, TRAK and TXTR. Source: Thomson Reuters, CLSA
Software-as-a-Service applications - Vertical Name Ticker Market cap
(US$m) Business model Comments
Active Network ACTV 624.9 88% technology revenue (65% registration and 23% licensed software, maintenance, hosting and implementation); 12% marketing services
Cloud-based activity and participant management (APM) solutions that transform the way organizers manage their activities and events
Athenahealth ATHN 4,221.9 97% business services revenue, 3% implementation and other revenue
Cloud-based business services for medical care givers
Ellie Mae ELLI 820.0 87% on-demand revenue, 13% on-premise revenue
Enterprise solutions for originating mortgages, loan processing and underwriting
Fleetmatics FLTX 1,581.8 100% subscription revenue SaaS solutions for managing local fleets of commercial vehicles
Medidata MDSO 2,352.4 79% application services (cloud-based), 21% professional services
Cloud-based solutions for life sciences that enhance the efficiency of clinical development processes
Realpage RP 1,617.8 95% on-demand, 2% on premise, 3% professional and other
Real-estate-management marketing, pricing, screening, leasing, accounting, purchasing and other property operations
Synchronoss Technologies
SNCR 1,390.2 67% transactional and subscription services, 33% professional service and software license arrangements
Wireless subscriber order processing, transaction management, service provisioning, device activation through multiple channels
Dealertrack TRAK 1,825.7 58% transaction services, 37% subscription services, 5% other revenue
Web-based software solutions for the automotive retail industry
Textura TXTR 976.3 88% from activity-driven revenue based on project dollar value, 12% subscription revenue from organizations
Provider of on-demand collaboration software to the commercial construction industry
Source: Companies, CLSA
SaaS infrastructure solution vendors are fewer, but offer large opportunities for share gains against on-premise alternatives, while addressing new markets and use cases enabled by cloud delivery. Key names in this segment include
80
100
120
140
160
180
200
2209/
9/20
11
11/9
/201
1
1/9/
2012
3/9/
2012
5/9/
2012
7/9/
2012
9/9/
2012
11/9
/201
2
1/9/
2013
3/9/
2013
5/9/
2013
7/9/
2013
Nasdaq Composite
Software-as-a-Service applications - Vertical+97.9%
+48.3%
Vertical domain expertise concentrates value
SaaS infrastructure solution vendors are
fewer, but offer large opportunities
Vertical SaaS apps have outperformed the Nasdaq
by 50% over a two-year period

Appendices Global technology
130 [email protected] 20 September 2013
Akamai, Demandware, Rally Software and ServiceNow. In many respects, the cloud delivery model of these services effectively turns these functions into applications, even though they address IT or infrastructure problems.
Stock performance - Software as a Service (Infrastructure)
Index components are AKAM, CARB, DWRE, LOGM, RALY, NOW. Source: Thomson Reuters, CLSA
Software as a Service - Infrastructure Name Ticker Market cap
(US$m) Business model Comments
Akamai Tech AKAM 8,321.2 Subscriptions and per-use charges, all recurring revenue
Provider of content delivery and cloud infrastructure services
Carbonite CARB 359.0 All subscription-based revenue Provider of secure cloud backup solutions for consumers and SMBs
Demandware DWRE 1,357.0 Share of the gain model - revenue is based on a portion of commerce conducted on the platform
Ecommerce platform as a service
LogMeIn LOGM 730.4 Revenue primarily derived from premium services subscription fees, the licensing of Ignition for iPhone, iPad and Android software products
Cloud-based collaboration, IT management and customer-service offerings
Rally Software RALY 731.4 83% subscription and support, 4% perpetual license, 13% professional services
Provider of cloud-based solutions for managing Agile software-development activities
ServiceNow NOW 5,838.6 84% subscription, 16% professional services and other
Provider of cloud-based services to automate and standardize business processes and consolidate IT in global enterprises
Source: Companies, CLSA
Vendors with origins in traditional on-premise technology, such as IBM, Oracle and Microsoft, are focused on building their cloud offerings in different ways. While the three have roots in different technology eras (IBM in mainframe, Oracle and Microsoft in client/server and PC), all made the transition to the top multitier (or internet) architected application in the late 1990s and 2000s. The shift to cloud computing is led by SaaS and presents challenges on the technology, business model and organizational fronts. For investors, gaining transparency into the distinctions that arise from the shift from perpetual license to subscription is a challenge. For the organizations themselves, managing the separate sales-force approaches, commission structures and customer touch represents perhaps the greater challenge.
80
100
120
140
160
180
200
220
9/9/
2011
11/9
/201
1
1/9/
2012
3/9/
2012
5/9/
2012
7/9/
2012
9/9/
2012
11/9
/201
2
1/9/
2013
3/9/
2013
5/9/
2013
7/9/
2013
Nasdaq Composite
Software-as-a-Service - Infrastructure
+108.8%
+48.3%
Incumbent vendors incorporate SaaS for
growth and diversification
SaaS infrastructure has outperformed the Nasdaq
by 61% over two years

Appendices Global technology
20 September 2013 [email protected] 131
The mixed-model technology vendors (particularly IBM and Oracle) that have tried to balance hardware businesses with the shift to cloud services have particularly struggled. The group has significantly lagged in share gains and is the worst-performing category in our analysis.
Stock performance - Mixed-model technology
Index components include IBM, ORCL, MGIC, MSFT, EMC, SREV. Source: Thomson Reuters, CLSA
Mixed-model technology Name Ticker Market cap
(US$m) Business model Comments
IBM IBM 205,863.2 Highly diversified model encompassing software, services and hardware
Recently acquired SoftLayer for IaaS, cloud offerings have lagged. Broad SaaS portfolio including Sterling, Coremetrics, etc
Oracle ORCL 155,545.9 Highly diversified model encompassing software, services and hardware
Offers SaaS including Taleo, RightNow and Eloqua, managed hosting PaaS and IaaS
Magic Software MGIC 771.7 23% software, 16% maintenance and technical support, 61% consulting services
Metadata-driven, code-free application platform for customers to quickly develop enterprise-grade cross-platform business applications
Microsoft MSFT 273,972.2 Highly diversified model encompassing software, services and hardware
Office365 and Azure are currently on a US$2.5bn run rate; technology is farthest along
EMC MA EMC 56,266.2 60% product sales (systems and software), 40% services (installation, professional, maintenance, training and SaaS); unknown split of the SaaS component
Provider of enterprise-storage infrastructure, data-management software and virtual-infrastructure solutions and services
ServiceSource SREV 946.6 Hybrid tech-enabled services model; SaaS is growing as a proportion of revenue
Recurring revenue management; Renew OnDemand is the cloud application built to maximize recurring revenue
Source: Companies, CLSA
On-premise application vendors offer cloud-based offerings that in some cases enhance and complement and in other cases replace existing offerings. For certain enterprise applications, the transition to SaaS or cloud-based approaches can be relatively straightforward. Some vendors, like Autodesk, offer stripped-down cloud offerings to grow the user base. Others, like Adobe, SAP and Oracle, have entered the SaaS market predominantly via acquisitions. Others like Microsoft have taken on-premise products and engineered them to be delivered over the cloud (Office365). Making the transition from on-premise to SaaS is disruptive to the model, and it’s difficult for companies in this category to manage both the impact to revenue trajectory and shift of delivery and business model while sustaining share gains. While the category has gained over the past two years, the group has underperformed the Nasdaq.
80
90
100
110
120
130
140
150
160
9/9/
2011
11/9
/201
1
1/9/
2012
3/9/
2012
5/9/
2012
7/9/
2012
9/9/
2012
11/9
/201
2
1/9/
2013
3/9/
2013
5/9/
2013
7/9/
2013
Nasdaq Composite
Mixed-model technology+48.3%
+9.4%
Mixed-model technology shares have
underperformed the Nasdaq by 39% over the
past two years
On-premise application vendors employ a variety
of approaches to move to the cloud
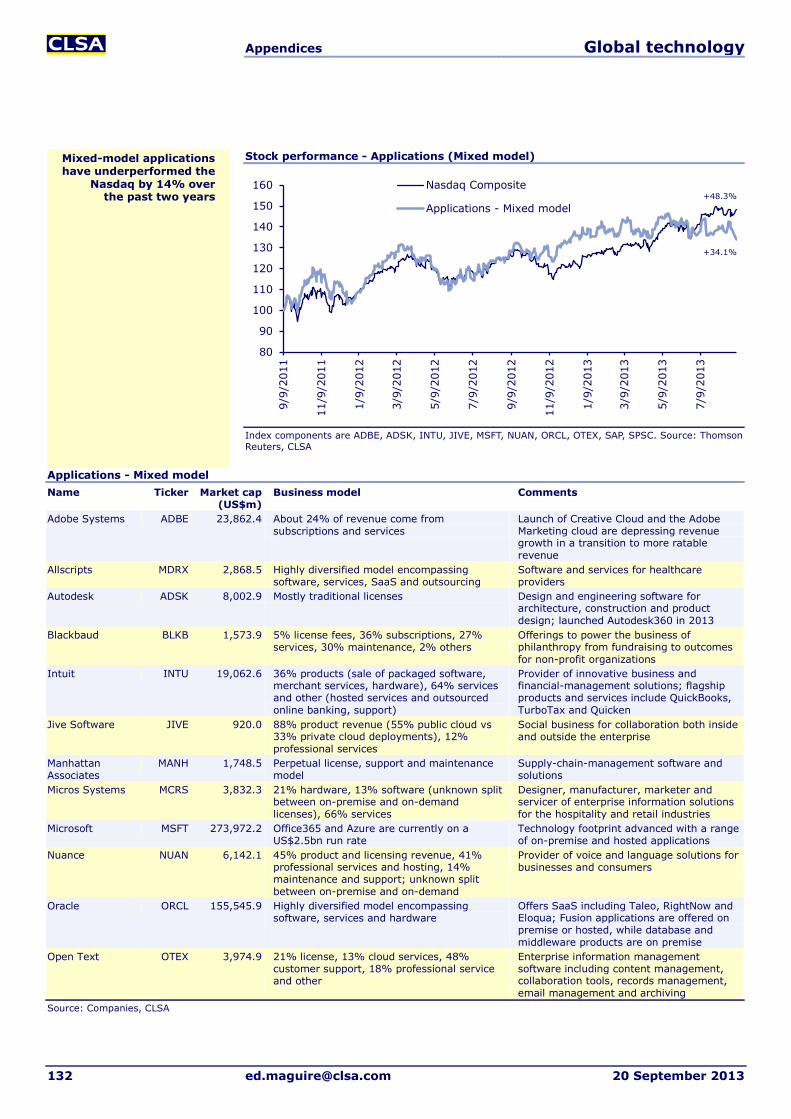
Appendices Global technology
132 [email protected] 20 September 2013
Stock performance - Applications (Mixed model)
Index components are ADBE, ADSK, INTU, JIVE, MSFT, NUAN, ORCL, OTEX, SAP, SPSC. Source: Thomson Reuters, CLSA
Applications - Mixed model Name Ticker Market cap
(US$m) Business model Comments
Adobe Systems ADBE 23,862.4 About 24% of revenue come from subscriptions and services
Launch of Creative Cloud and the Adobe Marketing cloud are depressing revenue growth in a transition to more ratable revenue
Allscripts MDRX 2,868.5 Highly diversified model encompassing software, services, SaaS and outsourcing
Software and services for healthcare providers
Autodesk ADSK 8,002.9 Mostly traditional licenses Design and engineering software for architecture, construction and product design; launched Autodesk360 in 2013
Blackbaud BLKB 1,573.9 5% license fees, 36% subscriptions, 27% services, 30% maintenance, 2% others
Offerings to power the business of philanthropy from fundraising to outcomes for non-profit organizations
Intuit INTU 19,062.6 36% products (sale of packaged software, merchant services, hardware), 64% services and other (hosted services and outsourced online banking, support)
Provider of innovative business and financial-management solutions; flagship products and services include QuickBooks, TurboTax and Quicken
Jive Software JIVE 920.0 88% product revenue (55% public cloud vs 33% private cloud deployments), 12% professional services
Social business for collaboration both inside and outside the enterprise
Manhattan Associates
MANH 1,748.5 Perpetual license, support and maintenance model
Supply-chain-management software and solutions
Micros Systems MCRS 3,832.3 21% hardware, 13% software (unknown split between on-premise and on-demand licenses), 66% services
Designer, manufacturer, marketer and servicer of enterprise information solutions for the hospitality and retail industries
Microsoft MSFT 273,972.2 Office365 and Azure are currently on a US$2.5bn run rate
Technology footprint advanced with a range of on-premise and hosted applications
Nuance NUAN 6,142.1 45% product and licensing revenue, 41% professional services and hosting, 14% maintenance and support; unknown split between on-premise and on-demand
Provider of voice and language solutions for businesses and consumers
Oracle ORCL 155,545.9 Highly diversified model encompassing software, services and hardware
Offers SaaS including Taleo, RightNow and Eloqua; Fusion applications are offered on premise or hosted, while database and middleware products are on premise
Open Text OTEX 3,974.9 21% license, 13% cloud services, 48% customer support, 18% professional service and other
Enterprise information management software including content management, collaboration tools, records management, email management and archiving
Source: Companies, CLSA
80
90
100
110
120
130
140
150
160
9/9/
2011
11/9
/201
1
1/9/
2012
3/9/
2012
5/9/
2012
7/9/
2012
9/9/
2012
11/9
/201
2
1/9/
2013
3/9/
2013
5/9/
2013
7/9/
2013
Nasdaq Composite
Applications - Mixed model+48.3%
+34.1%
Mixed-model applications have underperformed the
Nasdaq by 14% over the past two years

Appendices Global technology
20 September 2013 [email protected] 133
Applications - Mixed model (continued) Name Ticker Market cap
(US$m) Business model Comments
SAP SAP 69,164.8 29% software, 2% cloud subscriptions, 51% support, 19% professional services and other. Another measure by segments: 97% on-premise, 3% cloud
Enterprise application software and software-related services, including SAP Business Suite (ERP, CRM, SRM, etc), PaaS for mobile apps development
Silver Spring SSNI 1,394.6 78% product revenue (hardware and software sales), 22% service revenue (including professional services, managed services, SaaS and customer support); unknown percentage for SaaS piece
The Smart Energy Platform enables advanced metering, distribution automation and demand-side management for the utility business
SPS Communications
SPSC 1,014.3 88% recurring revenue Provider of on-demand supply-chain-management solutions and the Retail Universe community
Tyler Technologies
TYL 2,402.8 9% software licenses, 12% SaaS subscriptions, 23% software services, 47% maintenance, 6% appraisal and 2% hardware and others
Integrated information-management solutions and services for the public sector, with a focus on local governments
Source: Companies, CLSA
Despite broad momentum around the cloud, there remain certain categories of applications that lend themselves to on-premise deployment and are likely to remain so. These include analytics, technical and design software, back office and operations. These categories are likely to remain a “long tail” for on-premise software. The group has modestly outperformed the market over the past two years, reflecting our view that even with the broad shift towards cloud-based models, application logic delivers significant business value, which offsets the deflationary aspects of infrastructure.
Stock performance - Applications (On premise)
Index components include ACCL, ADVS, ANSS, AZPN, BIRT, CDNS, DASTY, EPIQ, GWRE, MENT, MSTR, PRO, PMTC, QLIK, SNPS, DATA, TDC, VRSK. Source: Thomson Reuters, CLSA
8090
100110120130140150160170180
9/9/
2011
11/9
/201
1
1/9/
2012
3/9/
2012
5/9/
2012
7/9/
2012
9/9/
2012
11/9
/201
2
1/9/
2013
3/9/
2013
5/9/
2013
7/9/
2013
Nasdaq Composite
Applications - On premise +58.1%
+48.3%
Certain categories of applications lend
themselves to on-premise deployment
On-premise apps have outperformed the Nasdaq
by 10% over the past two years

Appendices Global technology
134 [email protected] 20 September 2013
Applications - On premise
Name Ticker Market cap (US$m)
Business model Comments
Advent Software ADVS 1,451.2 Perpetual and term product license; support and maintenance model; immaterial portion from SaaS
Software and services for asset-management and financial-services firms
Aspen Technologies
AZPN 3,034.3 Subscriptions Process control software, underwent transition to token-based ApenONE subscription model
Accelrys ACCL 511.7 55% license and subscription revenue, 24% maintenance on perpetual licenses, 9% content revenue, 12% professional services and other
Develops and commercializes scientific business-intelligence software and solutions
Ansys ANSS 8,133.5 35% lease licenses, 28% perpetual licenses, 35% maintenance, 3% service
Develops engineering simulation software and services for use in a variety of industries
Actuate BIRT 350.4 42% license fees, 58% service revenue; unknown split between perpetual and subscription-based licenses
Proprietary and open-source platforms for business analytics
Cadence Design CDNS 4,094.4 63% product revenue (including both hardware and software), 9% services, 28% maintenance revenue; unknown split between term, subscription and perpetual
Solution provider for the design of integrated circuits and electronic devices
Dassault Systemes
DASTY 12,499.5 Perpetual license, support and maintenance model
Product design and engineering
EPIQ Systems EPIQ 467.5 Perpetual license, support and maintenance model with hosting
Legal-services support applications
Guidewire GWRE 2,513.8 42% license (32% term, 10% perpetual), 13% maintenance, 45% services
The Guidewire InsuranceSuite enables core P&C insurance operations
Mentor Graphics MENT 2,346.2 63% system and software revenue (54% upfront license; 9% ratable license), 37% service and support revenue
Solution provider for the design of integrated circuits and electronic devices
Microstrategy MSTR 1,315.6 Traditional license, support and maintenance model
Provider of enterprise software platforms for business intelligence and mobile and social intelligence applications
PROS Revenue Management
PRO 868.8 66% license and implementation (includes 5% term licenses and 3% hosting services), 34% maintenance and support, ie, SaaS revenue about 8% of total
Offers big data software applications to analyze, execute and optimize sales, pricing, quoting, rebates and revenue management
PTC PMTC 3,242.3 28% license revenue, 72% services; unknown split of subscription-based versus perpetual licenses
Software solutions that help companies design products, manage product information and improve their product development and services processes
QlikTech QLIK 2,800.1 Traditional license, support and maintenance model
User-driven business intelligence that enables customers to make business decisions quickly and easily
Synopsys SNPS 5,724.6 83% time-based license (technology subscription + perpetual licenses), 6% upfront revenue (term licenses), 11% maintenance and service
Developer of integrated circuits and electronic systems design & testing software
Tableau DATA 3,968.5 Traditional license, support and maintenance model
Business-discovery vendor, just launched Tableau Online as a SaaS offering
Teradata TDC 10,412.3 Perpetual product license, support and maintenance model, less than 5% from online-marketing services
Data warehousing and analytics software, hardware and consulting services
Verisk Analytics VRSK 10,627.4 Transactions and subscription Risk analytics Source: Companies, CLSA
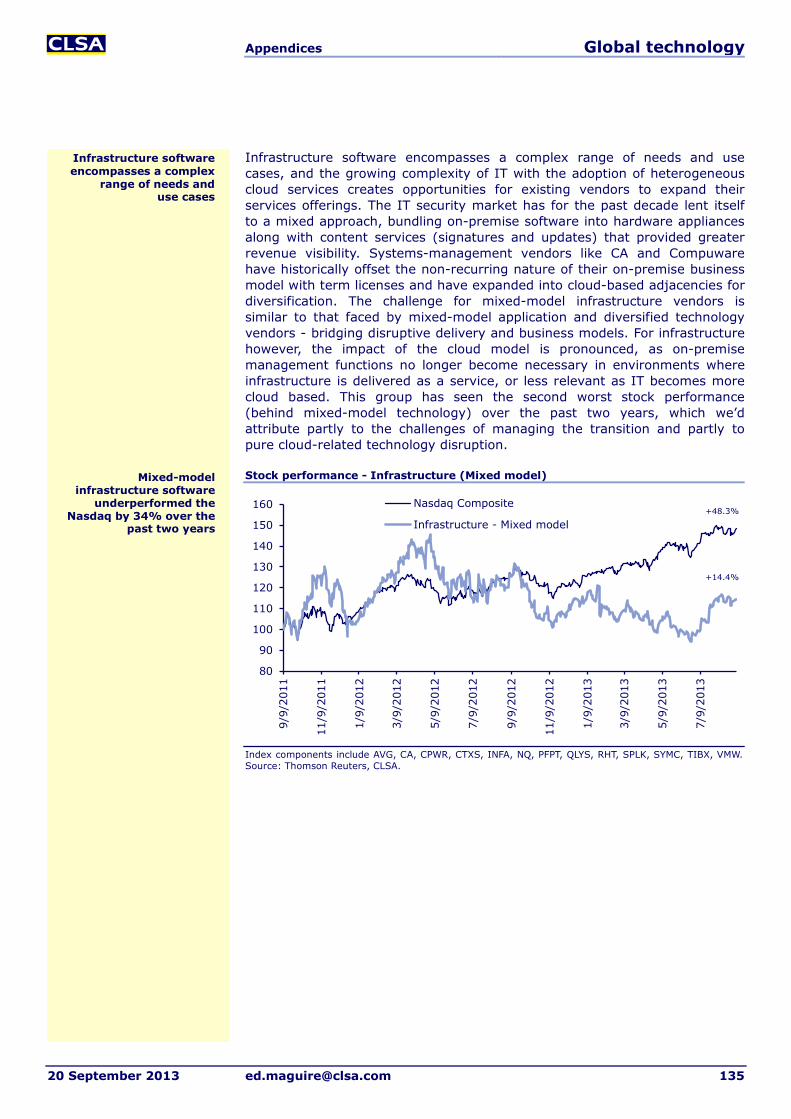
Appendices Global technology
20 September 2013 [email protected] 135
Infrastructure software encompasses a complex range of needs and use cases, and the growing complexity of IT with the adoption of heterogeneous cloud services creates opportunities for existing vendors to expand their services offerings. The IT security market has for the past decade lent itself to a mixed approach, bundling on-premise software into hardware appliances along with content services (signatures and updates) that provided greater revenue visibility. Systems-management vendors like CA and Compuware have historically offset the non-recurring nature of their on-premise business model with term licenses and have expanded into cloud-based adjacencies for diversification. The challenge for mixed-model infrastructure vendors is similar to that faced by mixed-model application and diversified technology vendors - bridging disruptive delivery and business models. For infrastructure however, the impact of the cloud model is pronounced, as on-premise management functions no longer become necessary in environments where infrastructure is delivered as a service, or less relevant as IT becomes more cloud based. This group has seen the second worst stock performance (behind mixed-model technology) over the past two years, which we’d attribute partly to the challenges of managing the transition and partly to pure cloud-related technology disruption.
Stock performance - Infrastructure (Mixed model)
Index components include AVG, CA, CPWR, CTXS, INFA, NQ, PFPT, QLYS, RHT, SPLK, SYMC, TIBX, VMW. Source: Thomson Reuters, CLSA.
80
90
100
110
120
130
140
150
160
9/9/
2011
11/9
/201
1
1/9/
2012
3/9/
2012
5/9/
2012
7/9/
2012
9/9/
2012
11/9
/201
2
1/9/
2013
3/9/
2013
5/9/
2013
7/9/
2013
Nasdaq Composite
Infrastructure - Mixed model+48.3%
+14.4%
Infrastructure software encompasses a complex
range of needs and use cases
Mixed-model infrastructure software
underperformed the Nasdaq by 34% over the
past two years
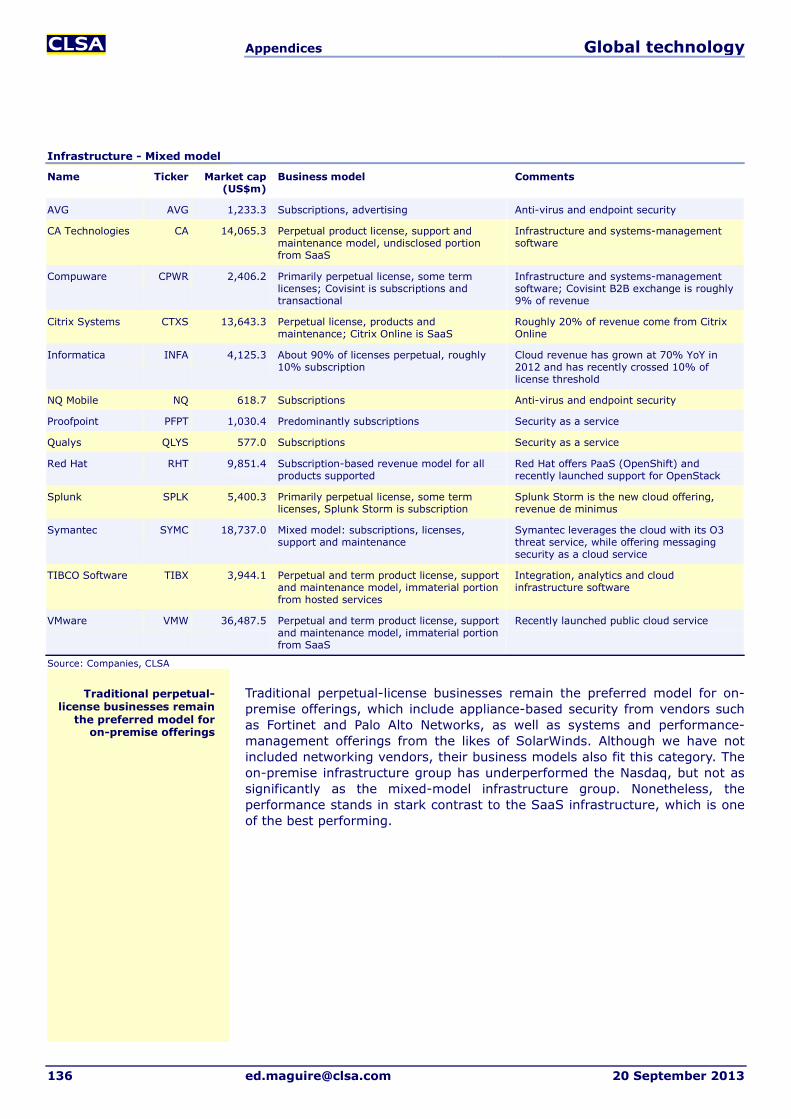
Appendices Global technology
136 [email protected] 20 September 2013
Infrastructure - Mixed model
Name Ticker Market cap (US$m)
Business model Comments
AVG AVG 1,233.3 Subscriptions, advertising Anti-virus and endpoint security
CA Technologies CA 14,065.3 Perpetual product license, support and maintenance model, undisclosed portion from SaaS
Infrastructure and systems-management software
Compuware CPWR 2,406.2 Primarily perpetual license, some term licenses; Covisint is subscriptions and transactional
Infrastructure and systems-management software; Covisint B2B exchange is roughly 9% of revenue
Citrix Systems CTXS 13,643.3 Perpetual license, products and maintenance; Citrix Online is SaaS
Roughly 20% of revenue come from Citrix Online
Informatica INFA 4,125.3 About 90% of licenses perpetual, roughly 10% subscription
Cloud revenue has grown at 70% YoY in 2012 and has recently crossed 10% of license threshold
NQ Mobile NQ 618.7 Subscriptions Anti-virus and endpoint security
Proofpoint PFPT 1,030.4 Predominantly subscriptions Security as a service
Qualys QLYS 577.0 Subscriptions Security as a service
Red Hat RHT 9,851.4 Subscription-based revenue model for all products supported
Red Hat offers PaaS (OpenShift) and recently launched support for OpenStack
Splunk SPLK 5,400.3 Primarily perpetual license, some term licenses, Splunk Storm is subscription
Splunk Storm is the new cloud offering, revenue de minimus
Symantec SYMC 18,737.0 Mixed model: subscriptions, licenses, support and maintenance
Symantec leverages the cloud with its O3 threat service, while offering messaging security as a cloud service
TIBCO Software TIBX 3,944.1 Perpetual and term product license, support and maintenance model, immaterial portion from hosted services
Integration, analytics and cloud infrastructure software
VMware VMW 36,487.5 Perpetual and term product license, support and maintenance model, immaterial portion from SaaS
Recently launched public cloud service
Source: Companies, CLSA
Traditional perpetual-license businesses remain the preferred model for on-premise offerings, which include appliance-based security from vendors such as Fortinet and Palo Alto Networks, as well as systems and performance-management offerings from the likes of SolarWinds. Although we have not included networking vendors, their business models also fit this category. The on-premise infrastructure group has underperformed the Nasdaq, but not as significantly as the mixed-model infrastructure group. Nonetheless, the performance stands in stark contrast to the SaaS infrastructure, which is one of the best performing.
Traditional perpetual- license businesses remain
the preferred model for on-premise offerings

Appendices Global technology
20 September 2013 [email protected] 137
Stock performance - Infrastructure (On premise)
Index components are CHKP, CKSW, CVLT, FTNT, IMPV, NICE, PANW, PEGA, PRGS, SWI, VDSI, VRNT. Source: Thomson Reuters, CLSA
Infrastructure - On premises
Name Ticker Market cap (US$m)
Business model Comments
Check Point Software
CHKP 11,647.2 Perpetual license, support and maintenance model
Network and content security software and systems vendor
ClickSoftware CKSW 230.1 Perpetual product license, support and maintenance model, immaterial portion from SaaS
Field service schedule optimization
CommVault CVLT 4,048.4 Perpetual license, support and maintenance model
CommVault is a traditional storage management software vendor
Fortinet FTNT 3,386.7 Perpetual license, support and maintenance model
Unified Threat Management security software and systems vendor
Imperva IMPV 1,069.3 Perpetual license, support and maintenance model
Database and data security appliance vendor
NICE Systems NICE 8,112.8 Perpetual product license, support and maintenance model, hosted and SaaS offerings
Video analytics, risk management and workforce optimization
Palo Alto Networks
PANW 3,521.9 Perpetual license, support and maintenance model
Next-generation firewall and enterprise security appliance vendor
Pegasystems PEGA 1,424.9 Perpetual product license, support and maintenance model, undisclosed portion from Pega Cloud
Business rules and workflow software
Progress Software PRGS 1,377.7 Perpetual product license, support and maintenance model, undisclosed portion from SaaS
Application development and enablement
Solarwinds SWI 2,866.5 Perpetual license, support and maintenance model
Application and IT performance management
Vasco Data VDSI 321.7 Perpetual product and license model, undisclosed portion from DigiPass as a Service
Strong authentication products and services
Verint Systems VRNT 1,892.2 Perpetual product license, support and maintenance model, undisclosed portion from SaaS
Video security and workforce management vendor
Source: Companies, CLSA
80
90
100
110
120
130
140
150
160
9/9/
2011
11/9
/201
1
1/9/
2012
3/9/
2012
5/9/
2012
7/9/
2012
9/9/
2012
11/9
/201
2
1/9/
2013
3/9/
2013
5/9/
2013
7/9/
2013
Nasdaq Composite
Infrastructure - On premises +48.3%
+27.0%
On-premise infrastructure software underperformed the Nasdaq by 21% over
the past two years

Important disclosures Global technology
140 [email protected] 20 September 2013
Companies mentioned Akamai (AKAM US - US$51.37 - BUY)1 Amazon (AMZN US - US$296.06 - OUTPERFORM) 1 Dell (DELL US - US$13.87 - UNDERPERFORM) 1 Delta (2308 TT - NT$135.5 - OUTPERFORM) 2 EMC (EMC US - US$26.88 - OUTPERFORM) 1 Google (GOOG US - US$887.76 - BUY) 1 Hewlett Packard (HPQ US - US$21.74 - UNDERPERFORM) 1 IBM (IBM US - US$193.15 - OUTPERFORM) 1 Intel (INTC US - US$23.39 - UNDERPERFORM) 1 Microsoft (MSFT US - US$32.79 - OUTPERFORM) 1 Oracle (ORCL US - US$32.97 - UNDERPERFORM) 1 Quanta (2382 TT - NT$68.00 - OUTPERFORM) 2 Rackspace (RAX US - US$52.26 - SELL) 1 Salesforce.com (CRM US - US$49.65 - BUY) 1 Tata Consultancy (TCS IB - RS1,901.80 - OUTPERFORM) 2
VMware (VMW US - US$88.32 - UNDERPERFORM)1 1covered by CLSA Americas; 2covered by CLSA Analyst certification The analyst(s) of this report hereby certify that the views expressed in this research report accurately reflect my/our own personal views about the securities and/or the issuers and that no part of my/our compensation was, is, or will be directly or indirectly related to the specific recommendation or views contained in this research report.
Important disclosures Policy of CLSA (which for the purpose of this disclosure includes subsidiaries of CLSA B.V. and CLSA Americas, LLC ("CLSA Americas")) and Credit Agricole Securities Taiwan Co., Ltd. (“CA Taiwan”) is to only publish research that is impartial, independent, clear, fair, and not misleading. Analysts may not receive compensation from the companies they cover.
Regulations or market practice of some jurisdictions/markets prescribe certain disclosures to be made for certain actual, potential or perceived conflicts of interests relating to a research report as below. This research disclosure should be read in conjunction with the research disclaimer as set out at www.clsa.com/disclaimer.html and the applicable regulation of the concerned market where the analyst is stationed and hence subject to. This research disclosure is for your information only and does not constitute any recommendation, representation or warranty. Absence of a discloseable position should not be taken as endorsement on the validity or quality of the research report or recommendation.
Neither analysts nor their household members/associates may have a financial interest in, or be an officer, director or advisory board member of companies covered by the analyst unless disclosed herein. Unless specified otherwise, CLSA/CLSA Americas/CA Taiwan did not receive investment banking/non-investment banking income from, and did not manage/co-manage a public offering for, the listed company during the past 12 months, and it does not expect to receive investment banking compensation from the listed company within the coming three months. Unless mentioned otherwise, CLSA/CLSA Americas/CA Taiwan does not own a discloseable position, and does not make a market, in the securities.
The analysts included herein hereby certify that the views expressed in this research report accurately reflect their own personal views about the securities and/or the issuers and that unless disclosed otherwise, no part of their compensation was, is, or will be directly or indirectly related to the specific recommendation or views contained in this research report or revenue from investment banking services provided. The analyst/s also states/s and confirm/s that he has/have not been placed under any undue influence, intervention or pressure by any person/s in compiling this research report. In addition, the analysts included herein attest that they were not in possession of any material, non-public information regarding the subject company at the time of publication of the report. Save from the disclosure below (if any), the analyst(s) is/are not aware of any material conflict of interest.
Important disclosures Global technology
20 September 2013 [email protected] 141
Key to CLSA/CLSA Americas/CA Taiwan investment rankings: BUY: Total return expected to exceed market return AND provide 20% or greater absolute return; O-PF: Total return expected to be greater than market return but less than 20% absolute return; U-PF: Total return expected to be less than market return but expected to provide a positive absolute return; SELL: Total return expected to be less than market return AND to provide a negative absolute return. For relative performance, we benchmark the 12-month total return (including dividends) for the stock against the 12-month forecast return (including dividends) for the local market where the stock is traded. For example, in the case of US stock, the recommendation is relative to the expected return for S&P of 10%. Exceptions may be made depending upon prevailing market conditions. We define stocks we expect to provide returns of 100% or higher including dividends within three years as “Double Baggers”.
Overall rating distribution for CLSA/CLSA Americas/CA Taiwan Universe: Buy / Outperform - CLSA: 61%; CLSA Americas: 59%; CA Taiwan: 63%, Underperform / Sell - CLSA: 39%; CLSA Americas: 41%; CA Taiwan: 37%, Restricted - CLSA: 0%; CLSA Americas: 0%; CA Taiwan: 0%. Data as of 30 June 2013. Investment banking clients as a % of rating category: Buy / Outperform - CLSA: 89%; CA Taiwan: 0%, Underperform / Sell - CLSA: 11%; CA Taiwan: 0%, Restricted - CLSA: 0%; CA Taiwan: 0%. Data for 12-month period ending 30 June 2013. For a history of the recommendations and price targets for companies mentioned in this report, as well as company specific disclosures, please write to: (a) CLSA Americas, Compliance Department, 1301 Avenue of the Americas, 15th Floor, New York, New York 10019-6022; (b) CLSA, Group Compliance, 18/F, One Pacific Place, 88 Queensway, Hong Kong and/or; (c) CA Taiwan Compliance (27/F, 95, Section 2 Dun Hua South Road, Taipei 10682, Taiwan, telephone (886) 2 2326 8188).
© 2013 CLSA Limited, CLSA Americas, LLC (“CLSA Americas”) and/or Credit Agricole Securities Taiwan Co., Ltd. (“CA Taiwan”)
This publication/communication is subject to and incorporates the terms and conditions of use set out on the www.clsa.com website. Neither the publication/communication nor any portion hereof may be reproduced, duplicated, copied, reprinted, sold or redistributed without the written consent of CLSA group of companies (excluding CLSA Americas, LLC) (“CLSA”), CLSA Americas (a broker-dealer registered with the US Securities and Exchange Commission and an affiliate of CLSA) and/or CA Taiwan.
CLSA, CLSA Americas and CA Taiwan has/have produced this publication/communication for private circulation to professional, institutional and/or wholesale clients only. The information, opinions and estimates herein are not directed at, or intended for distribution to or use by, any person or entity in any jurisdiction where doing so would be contrary to law or regulation or which would subject CLSA, CLSA Americas and/or CA Taiwan to any additional registration or licensing requirement within such jurisdiction. The information and statistical data herein have been obtained from sources we believe to be reliable. Such information has not been independently verified and we make no representation or warranty as to its accuracy, completeness or correctness. Any opinions or estimates herein reflect the judgment of CLSA, CLSA Americas and/or CA Taiwan at the date of this publication/communication and are subject to change at any time without notice. Where any part of the information, opinions or estimates contained herein reflects the views and opinions of a sales person or a non-analyst, such views and opinions may not correspond to the published view of CLSA, CLSA Americas and/or CA Taiwan. This is not a solicitation or any offer to buy or sell. This publication/communication is for information purposes only and does not constitute any recommendation, representation, warranty or guarantee of performance. Any price target given in the report may be projected from one or more valuation models and hence any price target may be subject to the inherent risk of the selected model as well as other external risk factors. This is not intended to provide professional, investment or any other type of advice or recommendation and does not take into account the particular investment objectives, financial situation or needs of individual recipients. Before acting on any information in this publication/communication, you should consider whether it is suitable for your particular circumstances and, if appropriate, seek professional advice, including tax advice. CLSA, CLSA Americas and/or CA Taiwan do/does not accept any responsibility and cannot be held liable for any person’s use of or reliance on the information and opinions contained herein. To the extent permitted by applicable securities laws and regulations, CLSA,CLSA Americas and/or CA Taiwan accept(s) no liability whatsoever for any direct or consequential loss arising from the use of this publication/communication or its contents. Where the publication does not contain ratings, the material should not be construed as research but is offered as factual commentary. It is not intended to, nor should it be used to form an investment opinion about the non-rated companies.

Important disclosures Global technology
142 [email protected] 20 September 2013
Subject to any applicable laws and regulations at any given time, CLSA, CLSA Americas, CA Taiwan, their respective affiliates or companies or individuals connected with CLSA/CLSA Americas/CA Taiwan may have used the information contained herein before publication and may have positions in, may from time to time purchase or sell or have a material interest in any of the securities mentioned or related securities, or may currently or in future have or have had a business or financial relationship with, or may provide or have provided investment banking, capital markets and/or other services to, the entities referred to herein, their advisors and/or any other connected parties. As a result, investors should be aware that CLSA, CLSA Americas, CA Taiwan and/or their respective affiliates or companies or such individuals may have one or more conflicts of interest.
Regulations or market practice of some jurisdictions/markets prescribe certain disclosures to be made for certain actual, potential or perceived conflicts of interests relating to research reports. Details of the disclosable interest can be found in certain reports as required by the relevant rules and regulation and the full details are available at http://www.clsa.com/member/research_disclosures/. Disclosures therein include the position of CLSA, CLSA Americas and CA Taiwan only and do not reflect those of Credit Agricole Corporate & Investment Bank and/or its affiliates. If investors have any difficulty accessing this website, please contact [email protected] on (852) 2600 8111. If you require disclosure information on previous dates, please contact [email protected].
This publication/communication is distributed for and on behalf of CLSA Limited (for research compiled by non-US and non-Taiwan analyst(s)), CLSA Americas (for research compiled by US analyst(s)) and/or CA Taiwan (for research compiled by Taiwan analyst(s)) in Australia by CLSA Australia Pty Ltd; in Hong Kong by CLSA Limited; in India by CLSA India Ltd (Address: 8/F, Dalamal House, Nariman Point, Mumbai 400021. Tel No: +91-22-66505050. SEBI Registration No: BSE Capital Market Segment: INB010826432; BSE F&O Segment: INF010826432; NSE Capital Market Segment: INB230826436; NSE F&O Segment: INF230826436); in Indonesia by PT CLSA Indonesia; in Japan by CLSA Securities Japan Co., Ltd; in Korea by CLSA Securities Korea Ltd; in Malaysia by CLSA Securities Malaysia Sdn Bhd; in the Philippines by CLSA Philippines Inc (a member of Philippine Stock Exchange and Securities Investors Protection Fund); in Thailand by CLSA Securities (Thailand) Limited; and in Taiwan by CA Taiwan.
United States of America: Where any section of the research is compiled by US analyst(s), it is distributed by CLSA Americas. Where any section is compiled by non-US analyst(s), it is distributed into the United States by CLSA solely to persons who qualify as "Major US Institutional Investors" as defined in Rule 15a-6 under the Securities and Exchange Act of 1934 and who deal with CLSA Americas. However, the delivery of this research report to any person in the United States shall not be deemed a recommendation to effect any transactions in the securities discussed herein or an endorsement of any opinion expressed herein. Any recipient of this research in the United States wishing to effect a transaction in any security mentioned herein should do so by contacting CLSA Americas.
United Kingdom: Notwithstanding anything to the contrary herein, the following applies where the publication/communication is distributed in and/or into the United Kingdom. This publication/communication is only for distribution and/or is only directed at persons ("permitted recipients") who are (i) persons falling within Article 19 of the Financial Services and Markets Act 2000 (Financial Promotion) Order 2001 (the "FPO") having professional experience in matters relating to investments or high-net-worth companies, unincorporated associations, etc. falling within Article 49 of the FPO, and (ii) where an unregulated collective investment scheme (an "unregulated CIS") is the subject of the publication/communication, also persons of a kind to whom the unregulated CIS may lawfully be promoted by a person authorised under the Financial Services and Markets Act 2000 ("FSMA") by virtue of Section 238(5) of the FSMA. The investments or services to which this publication/communication relates are available only to permitted recipients and persons of any other description should not rely upon it. This publication/communication may have been produced in circumstances such that it is not appropriate to categorise it as impartial in accordance with the FSA Rules.
Singapore: This publication/communication is distributed for and on behalf of CLSA Limited (for research compiled by non-US and non-Taiwan analyst(s)), CLSA Americas (for research compiled by US analyst(s) and/or CA Taiwan (for research compiled by Taiwan analyst(s)) in Singapore through CLSA Singapore Pte Ltd solely to persons who qualify as Institutional, Accredited and Expert Investors only, as defined in s.4A(1) of the Securities and Futures Act. Pursuant to Paragraphs 33, 34, 35 and 36 of the Financial Advisers (Amendment) Regulations 2005 with regards to an Accredited Investor, Expert Investor or Overseas Investor, sections 25, 27 and 36 of the Financial Adviser Act shall not apply to CLSA Singapore Pte Ltd. Please contact CLSA Singapore Pte Ltd in connection with queries on the report. MICA (P) 138-12-2012
Important disclosures Global technology
20 September 2013 [email protected] 143
The analysts/contributors to this publication/communication may be employed by a Credit Agricole or CLSA company which is different from the entity that distributes the publication/communication in the respective jurisdictions.
MSCI-sourced information is the exclusive property of Morgan Stanley Capital International Inc (MSCI). Without prior written permission of MSCI, this information and any other MSCI intellectual property may not be reproduced, redisseminated or used to create any financial products, including any indices. This information is provided on an "as is" basis. The user assumes the entire risk of any use made of this information. MSCI, its affiliates and any third party involved in, or related to, computing or compiling the information hereby expressly disclaim all warranties of originality, accuracy, completeness, merchantability or fitness for a particular purpose with respect to any of this information. Without limiting any of the foregoing, in no event shall MSCI, any of its affiliates or any third party involved in, or related to, computing or compiling the information have any liability for any damages of any kind. MSCI, Morgan Stanley Capital International and the MSCI indexes are service marks of MSCI and its affiliates. The Global Industry Classification Standard (GICS) was developed by and is the exclusive property of MSCI and Standard & Poor's. GICS is a service mark of MSCI and S&P and has been licensed for use by CLSA.
EVA® is a registered trademark of Stern, Stewart & Co. "CL" in charts and tables stands for CLSA/CLSA Americas/CA Taiwan estimates unless otherwise noted in the source.

Research & sales offices www.clsa.com
Australia CLSA Australia Pty Ltd CLSA House Level 15 20 Hunter Street Sydney NSW 2000 Tel: +61 2 8571 4200 Fax: +61 2 9221 1188
India CLSA India Ltd 8/F, Dalamal House Nariman Point Mumbai 400021 Tel: +91 22 6650 5050 Fax: +91 22 2284 0271
Philippines CLSA Philippines, Inc 19/F, Tower 2 The Enterprise Center 6766 Ayala corner Paseo de Roxas Makati City Tel: +63 2 860 4000 Fax: +63 2 860 4051
USA - Boston CLSA Americas, LLC 99 Summer Street, Suite 220 Boston, MA 02110 Tel: +1 617 295 0100 Fax: +1 617 295 0140
China - Beijing CLSA Limited - Beijing Rep Office Unit 10-12, Level 25 China World Trade Center Tower 2 1 Jian Guo Men Wai Ave Beijing 100004 Tel: +86 10 5965 2188 Fax: +86 10 6505 2209
Indonesia PT CLSA Indonesia WISMA GKBI Suite 901 Jl Jendral Sudirman No.28 Jakarta 10210 Tel: +62 21 2554 8888 Fax: +62 21 574 6920
Singapore CLSA Singapore Pte Ltd 80 Raffles Place, No.18-01 UOB Plaza 1 Singapore 048624 Tel: +65 6416 7888 Fax: +65 6533 8922
USA - Chicago CLSA Americas, LLC One South Dearborn Street Suite 2100 Chicago IL 60603 Tel: +1 312 220 7346 Fax: +1 312 212 4401
China - Shanghai CLSA Limited - Shanghai Rep Office Room 910, 9/F 100 Century Avenue Pudong New Area Shanghai 200120 Tel: +86 21 2020 5888 Fax: +86 21 2020 5777
Japan CLSA Securities Japan Co., Ltd. 16/F, Shiodome Sumitomo Building 1-9-2, Higashi-Shimbashi Minato-ku, Tokyo 105-0021 Tel: +81 3 4578 8000 Fax: +81 3 4578 8080
Taiwan Credit Agricole Securities (Taiwan) Company Limited* 27/F, 95, Section 2 Dun Hua South Road Taipei 10682 Tel: +886 2 2326 8188 Fax: +886 2 2326 8166 * CAST is an exclusive Taiwan research provider to CLSA
USA - New York CLSA Americas, LLC 1301 Avenue of The Americas 15th Floor, New York 10019 Tel: +1 212 408 5888 Fax: +1 212 261 2502
China - Shenzhen CLSA Limited - Shenzhen Rep Office Room 3111, Shun Hing Square Di Wang Commercial Centre 5002 Shennan Road East Shenzhen 518008 Tel: +86 755 8246 1755 Fax: +86 755 8246 1754
Korea CLSA Securities Korea Ltd 30/F, One IFC 10 Gukjegeumyung-ro Yeongdeungpo-gu Seoul, 150-712 Tel: +82 2 397 8400 Fax: +82 2 771 8583
Thailand CLSA Securities (Thailand) Ltd 16/F, M. Thai Tower All Seasons Place 87 Wireless Road, Pathumwan, Bangkok 10330 Tel: +66 2 257 4600 Fax: +66 2 253 0532
USA - San Francisco CLSA Americas, LLC 50 California Street, Suite 850 San Francisco, CA 94111 Tel: +1 415 544 6100 Fax: +1 415 434 6140
Hong Kong CLSA Limited 18/F, One Pacific Place 88 Queensway Hong Kong Tel: +852 2600 8888 Fax: +852 2868 0189
Malaysia CLSA Securities Malaysia Sdn Bhd Suite 20-01, Level 20 Menara Dion 27 Jalan Sultan Ismail 50250 Kuala Lumpur Tel: +60 3 2056 7888 Fax: +60 3 2056 7988
United Kingdom CLSA (UK) 12/F, Moor House 120 London Wall London EC2Y 5ET Tel: +44 20 7614 7000 Fax: +44 20 7614 7070
CLSA Sales Trading Team Australia +61 2 8571 4201 China (Shanghai) +86 21 2020 5810 Hong Kong +852 2600 7003 India +91 22 6622 5000 Indonesia +62 21 573 9460 Japan +81 3 4580 5169 Korea +82 2 397 8512
Malaysia +60 3 2056 7852 Philippines +63 2 860 4030 Singapore +65 6416 7878 Taiwan* +886 2 2326 8124 Thailand +66 2 257 4611 UK +44 207 614 7260 US +1 212 408 5800
Research subscriptions To change your report distribution requirements, please contact your CLSA sales representative or email us at [email protected]. You can also fine-tune your Research Alert email preferences at https://www.clsa.com/member/tools/email_alert/.
©2013 CLSA Limited (for research compiled by non-Taiwan analyst(s)) and/or Credit Agricole Securities Taiwan Co., Ltd (for research compiled by Taiwan analyst(s)). Key to CLSA/CLSA Americas/CA Taiwan investment rankings: BUY: Total return expected to exceed market return AND provide 20% or greater absolute return; O-PF: Total return expected to be greater than market return but less than 20% absolute return; U-PF: Total return expected to be less than market return but expected to provide a positive absolute return; SELL: Total return expected to be less than market return AND to provide a negative absolute return. For relative performance, we benchmark the 12-month total return (including dividends) for the stock against the 12-month forecast return (including dividends) for the local market where the stock is traded. We define stocks we expect to provide returns of 100% or higher including dividends within three years as “Double Baggers”. 05/08/2013
CLSA is certified ISO14001:2004
CLEANGREEN& TM
At CLSA we supportsustainable development.
We print on paper sourced fromenvironmentally conservativefactories that only use fibres
from plantation forests.Please recycle.