
Soda Can Myth Busters - Brown University · Myth #1: Shaking a soda significantly increases the...
6
Posted: Monday, November 4, 2013 – v1.0 Lab Due: Wednesday, November 13 (5 PM), 2013 Fall 2013: Profs. Christian Franck, Jennifer Franck TAs: Jon Estrada (jonathan_estrada at brown dot edu) Alireza Khorshidi (alireza_khorshidi at brown dot edu) ENGN0310 – Mechanics of Solids and Structures Lab 2 – Soda Can Myth Busters Myth #1: Shaking a soda significantly increases the pressure inside the can. Myth #2: Tapping the tab on a soda can with your finger a few times can reduce some of the pressure on the top of the can, causing less liquid to spray out upon opening. In class, we talked about hoop stress and strain for thin-walled pressure vessels. By using the thin-walled assumption, strain gages, and a dog-bone sample cut from the same type of can, we will determine how much (if any) the pressure increases inside the can when it is shaken. Secondly, we will determine whether we can decrease the pressure in a can after it has been shaken by tapping on the top, or any other technique that you may propose. However, in order to use the hoop stress and strain equations, we will need to know the material properties. Thus, we will specifically measure E and ν via an independent tensile test on a section of aluminum cut from the wall of the same brand of can. 2.1 Testing Equipment and Experimental Setup Figures 1 and 2 contain the equipment and data acquisition that you will be using as part of the lab. Each of the components description and brief usage is listed below. !"#$%#$& ()"*#+" ()*( *),-+" ."()/0)1#$() ()/0#"$& *(/#2 (a) Instron Tensile Testing machine with dog-bone sample loaded. !"#$%& ()*+,- .+/& 01 %&+234 ! 5 ! 6 !"/$"-& (7&8,9&- (b) Dog-Bone sample of the aluminum can with strain-gage attached. Figure 1: Lab Equipment 1
Transcript of Soda Can Myth Busters - Brown University · Myth #1: Shaking a soda significantly increases the...
Posted: Monday, November 4, 2013 – v1.0 Lab Due: Wednesday, November 13 (5 PM), 2013
Fall 2013: Profs. Christian Franck, Jennifer FranckTAs: Jon Estrada (jonathan_estrada at brown dot edu)
Alireza Khorshidi (alireza_khorshidi at brown dot edu)
ENGN0310 – Mechanics of Solids and Structures
Lab 2 – Soda Can Myth Busters
Myth #1: Shaking a soda significantly increases the pressure inside the can.
Myth #2: Tapping the tab on a soda can with your finger a few times can reduce some of the pressureon the top of the can, causing less liquid to spray out upon opening.
In class, we talked about hoop stress and strain for thin-walled pressure vessels. By using thethin-walled assumption, strain gages, and a dog-bone sample cut from the same type of can,we will determine how much (if any) the pressure increases inside the can when it is shaken.Secondly, we will determine whether we can decrease the pressure in a can after it has beenshaken by tapping on the top, or any other technique that you may propose. However, in orderto use the hoop stress and strain equations, we will need to know the material properties.Thus, we will specifically measure E and ν via an independent tensile test on a section ofaluminum cut from the wall of the same brand of can.
2.1 Testing Equipment and Experimental Setup
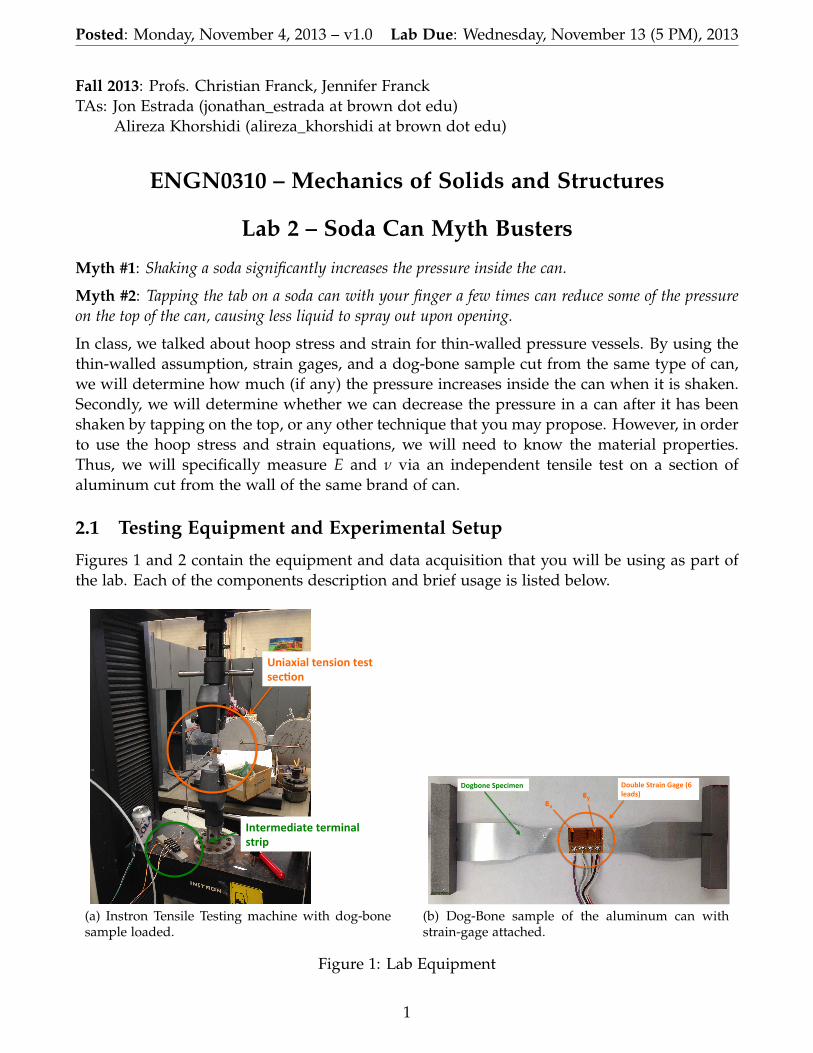
Figures 1 and 2 contain the equipment and data acquisition that you will be using as part ofthe lab. Each of the components description and brief usage is listed below.
!"#$%#$&'()"*#+"'()*('*),-+"'
."()/0)1#$()'()/0#"$&'*(/#2''
(a) Instron Tensile Testing machine with dog-bonesample loaded.
!"#$%&'()*+,-'.+/&'01'%&+234'
!5'!6'
!"/$"-&'(7&8,9&-'
(b) Dog-Bone sample of the aluminum can withstrain-gage attached.
Figure 1: Lab Equipment
1

Posted: Monday, November 4, 2013 – v1.0 Lab Due: Wednesday, November 13 (5 PM), 2013
!"#$%&'#()*+,+)-.//"0)
1%"+,2,.#")!0'3/")
*+,+)-.//"0)4.56+0")
7)8)'#9:,);0'3/")<.&,+/")2.:0$")
(a) Acquistion hardware and software interface tocollect your voltage data.
!"#"$%&'()*"(&+,-.."#/&0.&%,"&1-%-&2)33"(&!)45-("6&
• !"#$%&'(")%*+,"(#%-%%!.%/0/%
• !"#$%1223%*+,"(#%-%%!.%/04%
• 52672#8%9+,(3$%&'(")%*+,"(#%-%!.%/0:%
• 52672#8%9+,(3$%;,"#*<8,*8%*+,"(#%-%%!.%/0=%
• >#*+,2#%&'(")%?'+8#*(2#%-%!.%//@%
• >#*+,2#%&'(")%A2"B%-%!.%//C%
(b) Example Screen-Shot of the Data AcquisitionProgram.
Figure 2: Data Acquisition
• Instron Machine: Commercial material testing machine (Instron company) - commonlyused to generate nominal uniaxial tension stress-strain curves to determine materialproperties.
• Dog-bone sample: name given for the common shape of materials used in the Instron.The dogbone shape ensures uniform strain across the samples gage section (center area).
• Load Cell Transducer: Analog device that measures how much force is being applied toit (just like a scale to measure weight). The typical output is a change in voltage, whichneeds to be converted to either Newtons or kilo Newtons.
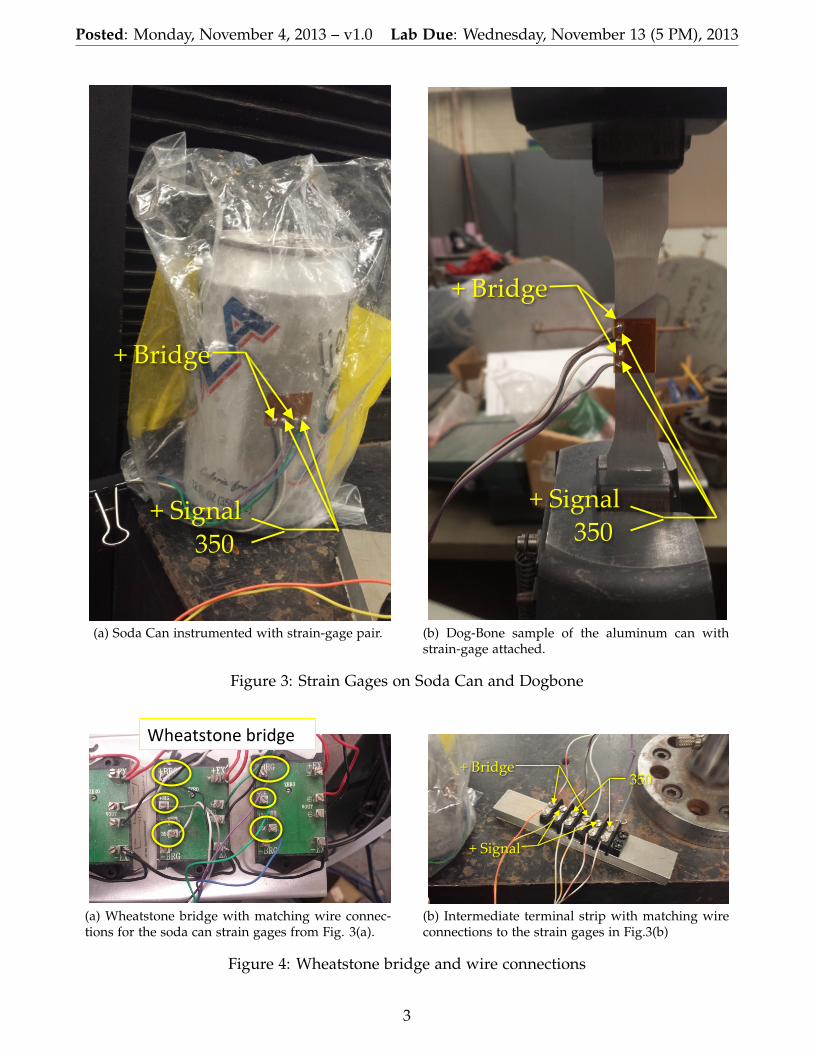
• Strain Gage: A long, special resistor which directly relates changes in applied strain tochanges in its resistance. The change in resistance of a strain gage is determined usinga Wheatstone bridge and the strain gage factor (GF). Please review the concept behindstrain gages (see last page). Here each can and dogbone sample has a pair of orthogonalstrain gages attached with wire connections shown in Figs. 3 and 4.
• Intermediate Terminal Strip: Simple "extension cord" between the strain gages and theWheatstone bridge.
• Wheatstone Bridge: It’s a device consisting of four balanced internal resistors, one ofwhich is a variable resistor and one of which is the unknown resistance of each straingage. The variable resistor balances the unknown resistance allowing us to determinethe strain gages resistance changes proportional to changes in strain. The final outputfrom the Wheatstone bridge is a voltage proportional to the resistance changes of thestrain gage (see more on the last page).
2
Posted: Monday, November 4, 2013 – v1.0 Lab Due: Wednesday, November 13 (5 PM), 2013
!"#$%&'()
!"*%'+,-)./0)
(a) Soda Can instrumented with strain-gage pair.
!"#$%&'()
!"*%'+,-)./0)
(b) Dog-Bone sample of the aluminum can withstrain-gage attached.
Figure 3: Strain Gages on Soda Can and Dogbone
!"#$%&%'(#)*+,-.#)
(a) Wheatstone bridge with matching wire connec-tions for the soda can strain gages from Fig. 3(a).
!"#$%&'()
!"*%'+,-)
./0)
(b) Intermediate terminal strip with matching wireconnections to the strain gages in Fig.3(b)
Figure 4: Wheatstone bridge and wire connections
3

Posted: Monday, November 4, 2013 – v1.0 Lab Due: Wednesday, November 13 (5 PM), 2013
• Data Logger: Electronic device (Agilent 349070A) that collects all voltage channels fromthe strain gages and the Instron machine and converts them into a digital signal format(i.e., bits) that a computer can interpret.
• Voltage Source: Required voltage input source to the Wheatstone bridge (here: Vin =5Volts).
• Data Logger Software: Data acquisition software to record and save your data comingfrom the Data Logger (Figure 2 (b) highlights all the data channels you will need to selectto collect your strain and load data).
2.2 Important Experimental Details
(a) The raw data format that you will get from the Strain Gage Data Logger will be in units ofVolts, i.e., you will get a Vout. To convert your voltage output signal, Vout, into actual strains,you will use the following conversion formula:
εn =−4Vr
2.067 · (1 + 2Vr). (1)
Vr =Vout,strained −Vout,unstrained
Vin=
∆VmeasuredVin
. (2)
For your experiments, Vin = 5Volts.
(b) You will also need to convert the raw voltage signal from the Load Cell Transducer into anactual force. You will do this by using the following conversion:
Force = ∆Vmeasured · Ps = [Vout,loaded −Vout,noload] · Ps, (3)
where Ps is the load cell sensitivity, and is equal to PS = 1kN/Volt.
2.3 Finding the Material Properties
To convert the hoop and longitudinal strains into stresses and ultimately the pressure insideyour can, you will need to know the Young’s Modulus E and Poisson’s Ratio ν. To deter-mine E and ν you will (with Mr. Corkum and the TAs’ help) conduct a uniaxial tension test,generate a stress-strain curve (nominal), and calculate both εx and εy from your datalogger tocompute ν.
(a)Using digital calipers measure the thickness and width of the dog bone sample, being care-ful not to squeeze the material. Zero the calipers with the jaws in the fully-closed position.Take three thickness and three width measurements each. Compute an average value for
4
Posted: Monday, November 4, 2013 – v1.0 Lab Due: Wednesday, November 13 (5 PM), 2013
each dimension.
(b) Load the dog bone sample into the Instron, and attach the gage wires to the intermediateterminal strip and the Wheatstone bridge as shown in Fig. 3.
(c) Start the Data Logger Software making sure all appropriate channels are selected (see Fig.2b). To record the unstrained and unloaded voltages, make sure you collect some data beforeyou start actually extending the specimen in the Instron machine. Next, use the little scrollwheel on the Instron machine to slowly load your sample while carefully monitoring theextension and load increase on the computer monitor. Have one of the TAs or Mr. Corkumsupervise you during this process. Once you have collected enough data to trace out the fullstress-strain curve (elastic and plastic region), you may continue loading the sample until itbreaks. The maximum load the strips can sustain ∼ 400N.
2.4 Measuring Pressure in the Can
Overview: The soda can is instrumented with an orthogonal strain gage pair. By measuringthe hoop and longitudinal strains, you should be able to compute the pressure using our thin-walled vessel equations. This derivation should be completed BEFORE the beginning the lab!The process outlined below will have you shake the can, and measure the pressure rise (ifany). It will allow you to attempt to lower the pressure through any tricks you wish (you mayresearch methods before-hand if you wish) and take another measurement. Try any methodyou like, but document each one you try. At the very end of the lab you will finally crack openthe can and measure the pressure drop and final pressure.
(a) Determine the thickness and diameter of the can. Before executing the experiment, youmust measure the diameter of your can using digital calipers. Zero the calipers with the jawsin the fully-closed position and stand the can vertically. Measure the diameter by carefullylaying the calipers over the top of the upright can. Slowly close the jaws around the can, beingcareful not to squeeze it. Take three diameter measurements.
(b) Attach the six strain gage wires (there are six) to the Wheatstone bridge (Fig. 3). The wiresoldered to the left pad of the first gage is connected to ‘bridge’, and the two wires solderedto the right pad of the first gage are connected to ‘+ signal’ and ‘350’, in any order. Repeat thisfor the second gage. If you’re unsure on what to do, just ask one of the TAs.
(c) Start and then run Data Logger, the data acquisition software. Squeeze the can slightlyto see if the strain gage is active. Begin shaking the can by turning it quickly back and forth,and be extremely careful not to dislodge any of the wires. Save a ‘.csv’ file of the new strainvalues as acquired by Data Logger.
(d) Try and reduce the pressure of the can. Continue to take data, noting whether the straindecreases appreciably by tapping the can, turning it, or any other method you can think of.By looking at the live sampling on the data logger computer screen, you can see if the strainsare changing at all.
5
Posted: Monday, November 4, 2013 – v1.0 Lab Due: Wednesday, November 13 (5 PM), 2013
(e) The last act is to open the can. Once you’re ready alert the TA first. Let him make sure yourcan is in a plastic bag, and your data logger is set at the correct sampling rate and is collectingdata. If it all check’s out - go for it - crack it open!(f) Make sure you save all your files and email them to yourself when you’re done.
2.5 The Analysis
Using the conversion formulas provided above, your thickness and cross-sectional area mea-surements, convert all your raw voltage signal data into proper stress and strain data.
(a) Plot the nominal stress-strain curve from your uniaxial tension test. From the data calculatethe Young’s modulus, E. On the same label the Young’s Modulus and the yield point (σ0) asdetermined by using the 0.2% offset rule.
(b) Determine an empirical Poisson’s ratio ν for the your dog-bone specimen using your mea-sured strain gage values, εx and εy.
(c) On the same graph, plot your calculated εθ and εx can strain data versus time. Make sureyour graph is properly labeled and looks professional!
(d) Using the thin-walled assumptions from class, convert the hoop and longitudinal strainsto stresses and plot them versus time.Compute the ratio between σθ and σx. How does the ratio compare to our analytical resultsfrom class. Discuss and quantify sources of error.
(f) Using the results from (d) plot pressure vs. time stating exactly, which stress componentyou used to compute pressure and why?
(g) Did you bust the myth? Comment and discuss your final results. Discuss possible sourcesof error and quantify them.
6