SOCIOLOGIA - studia.ubbcluj.ro · Romanian Version of the School Success Profile.....31 ÁGNES...
271
SOCIOLOGIA 1/2010
Transcript of SOCIOLOGIA - studia.ubbcluj.ro · Romanian Version of the School Success Profile.....31 ÁGNES...
SOCIOLOGIA1/2010

YEAR (LV) 2010 MONTH JUNE ISSUE 1
S T U D I A UNIVERSITATIS BABEŞBOLYAI
SOCIOLOGIA
THE SOCIAL ECOLOGY OF SCHOOL SUCCESS. IMPLICATIONS FOR POLICY AND PRACTICE
Special Issue. Guest Editors: Maria Roth, Gary Bowen, PaulTeodor Hărăguş
1
EDITORIAL OFFICE: B.P. Hasdeu no. 51, 400371 Cluj‐Napoca, Romania • Phone +40 ‐ 264‐40.53.52
CONTENTS
MARIA ROTH, GARY BOWEN, PAULTEODOR HĂRĂGUŞ, Guest Editors' Foreword for the Special Issue on The Social Ecology of School Success. Implications for Policy and Practice ......................................................................... 3
GARY L. BOWEN, JACK M. RICHMAN, The School Success Profile: Assessing
the Social Environment and the Individual Adaptation of Middle and High School Students.........................................................................................................11
PAUL‐TEODOR HĂRĂGUŞ, MARIA ROTH, DIANA DAMEAN, The Measurement of the Social Dimensions of School Success – A Validity Study of the Romanian Version of the School Success Profile ...................................................31
ÁGNES DÁVID‐KACSÓ, The Role of Family Factors in School Outcomes at Different School Levels .....................................................................................................57

HORAȚIU RUSU, ANCA BEJENARU, Factors Influencing School Success in Rural Romania: A Case Study Based on Data Collected with the School Success Profile Instrument .............................................................................................71
ADRIAN HATOS, Multilevel Analysis of Academic Achievements of Upper‐Secondary Students in a Romanian City: Effect of Composition, Resource Allocation or Differentiation? ........................................................................................89
ADRIAN HATOS, GABRIELLA PUSZTAI, HAJNALKA FÉNYES, Are Factors of Social Capital Able to Modify Social Reproduction Effects? ...........................117
DENNIS K. ORTHNER, HINCKLEY JONES‐SANPEI, RODERICK ROSE, MICAELA MERCADO, PATRICK AKOS, Careerstart: A Middle Grades Strategy for Promoting Student School Engagement and Academic Success ..................137
ANDREA RÁCZ, From Child Protection to Higher Education. Endogenous and Exogenous Factors Influencing Participation in Higher Education of Young Adults Brought Up in Public Child Care..................................................................155
COSIMA RUGHINIŞ, ROXANA TOADER, Education and Scientific Knowledge in European Societies. Exploring Measurement Issues in General Population Surveys .................................................................................................................................175
Romanian Sociology Today
IMRE PÁSZKA, The Structure of Narrative Forms .....................................................205 Methodological Forum
NORBERT PETROVICI, Corrupt Knowledge and the Quest for Objectivity: A Critique of the Romanian Positivist Sociology.................................................221
RALUCA SOREANU, Metaphor in the Social Sciences: Creative Methodologies and Some Elements for an Epistemological Reconstruction .........................239
ANCA SIMIONCA, Methodology and the Quality of Research: Reflections on an Uneasy Yet Promising Relationship ...................................................................257

STUDIA UNIVERSITATIS BABEŞ‐BOLYAI, SOCIOLOGIA, LV, 1, 2010
SOCIAL ECOLOGIES OF SCHOOL SUCCESS. IMPLICATIONS FOR POLICIES AND PRACTICE
Guest Editors’ Foreword
MARIA ROTH*, GARY BOWEN**, PAULTEODOR HĂRĂGUŞ***
From a social perspective, education is a social system within society, intersecting other social systems and has its own agents, institutions, values, inequalities, and is regulated by special laws and policies. It has a specific social dynamic that goes through phases and changes that resonate to the phenomena in the larger social system. In the new millennium, education requires researchers’ renewed examination of its involvement in social progress as well as in the maintenance of social inequalities and economic differences. Schools are life contexts for learning, play, competition, work, identity formation, and training of a large variety of competences. Schools are not merely places of education and work, but also social institutions that shape peoples lives, and help structure society (D. B. Bills, 2004).
This issue grew out of common interest of two disciplines: sociology and social work. Both professions tend to reveal what is beneath the appearances of children’s difficulties in schools, how social markers like gender, social status, income, race and ethnicity influence attendance and performance of students, teachers’ behavior. These can hardly be considered new findings, though their influences are important to bear in mind when analyzing any education related behavior (Bills, 2004). This issue does not promise a wide theoretical confrontation but aims to offer a research based analytic framework that can serve both theorists and practitioners, with both sociology and social work background, though anchored in different theoretical perspectives. In a world characterized by cultural and social inequalities, both approaches look for more just ways of organizing school and both give place to socially critical research. “Critical researchers are committed not just to knowing, but to transforming” (Mills and Gale, p. 436). Addressed to sociologistscounselors, school social workers, mediators, school administrators and managers, and teachers, authors of this issue engage in theoretical and empirical analysis, which are drawn from a wide a range of perspectives. * Faculty of Sociology and Social Work, “Babeş‐Bolyai” University Cluj‐Napoca, e‐mail: [email protected]
** School of Social Work, The University of North Carolina at Chapel Hill, e‐mail: [email protected]
*** Faculty of Sociology and Social Work, “Babeş‐Bolyai” University Cluj‐Napoca, e‐mail: [email protected]
MARIA ROTH, GARY BOWEN, PAUL‐TEODOR HĂRĂGUŞ
4
Our choice for the analysis of school success comes from its attractiveness for all agents and researchers involved in education. Schools as organizations; students and teachers as agents of learning; and parents, communities and employers as beneficiaries of education services all aim for social and educational success and competence. But schools, as well as families have their own values, rules, concepts about the needs of their students and their own role in students’ evolution towards educational success. From a systems perspective, no agents of education live isolated from other systems; they are all influenced by what is going on in their proximal and distal systems. Factors from home, communities and societies in general impact on how children are doing at school. Applied to schools, according to the ecological theory, the lives of people cannot be understood without taking into consideration their social‐environmental characteristics. To understand how students of different ages reach or do not reach success within and via education systems is a comprehensive task.
Explaining the specifics of sociology of education, David and Greenfell (1998, p. 6) saw the contribution of sociologic research to education as an ‘act’ to understand the variety of and changes of the educational phenomena in relation to their surroundings “which give rise to them and are in turn re‐constituted by them” Following the historic development of the sociology of education, Dentler (2002) places its emergence 100 years ago (1910‐1930). Anchored in practical problems of teacher training and school problem management, ”educational sociologists never became heroes in the annals of academic sociology because they practiced their profession as opposed to building the academic discipline. Their mission was to use the knowledge of their field in educational administration and planning and to help prepare teachers by providing knowledge about the family, community, religion, and other contextual institutions” (Dentler, 2002, p. 138). Though education has always been dominated by psychologists and psychological theories, the contribution of sociology to the field of discussing equal opportunity is overall recognized. This preoccupation reached its peak in the 60s and 70s, when sociologists became increasingly linked to civic movements, for nondiscrimination on racial and ethnic basis and social justice. A remarkable development in this field was represented by sociologists at Johns Hopkins University, in the Center for Urban Education in New York City and so forth, under initiatives begun by James S. Coleman, Garth Taylor, Lee G. Burchinal and others (Dentler, 2002). They focused on solutions to inequality of educational opportunity among racial and ethnic groups in the United States. For example, in the Center at Johns Hopkins, and the Center for Urban Education in New York City, sociologists made comparative analyses of schools and programs for the two major racial groups. Coleman and his collaborators (Coleman et al. 1966; Coleman 1988; Coleman, 1990) collected data on family background and school equity variables, and documented racial segregation policies. They also evaluated programs and policies oriented to equalize the educational policies and practices.

Guest Editors' Foreword
5
Research in sociology of education continued in the last 30 years along several directions. One can identify studies that reveal the effects of class, racial and ethnic patterns; the intersection of family and community; and the age and gender group of students and teachers. Often this is combined with a micro‐sociological approach, which looks at the interaction processes that shape learning, teaching, sociometry in peer group interactions, and violence and safety issues.
The complexity of school‐related social problems creates a fertile field for both social scientific analysis and for applied social sciences. Grounded on the principle that unequal abilities and resources should be matched by services and intervention programs of varying sorts, school social work facilitates equal opportunities. The traditional focus of school social work is matching needs of students with the requirements and demands of schools, by using all existent resources. School social work can be described as empowering youth for positive development, helping students adjust in the existing schools, but also bringing positive changes to schools, to better accommodates students (To Siu‐Ming, 2007). Its mission and dilemma is finding a balance between serving individual students and serving the educational institution. It faces the eternal dilemma of social work between commitment to the individuals whose rights are in danger or to the society and its institutions, which tend to preserve the existing social structures. School will always build on diversity: diverse capacities and values in pupils and their families; varied relations between families, teachers and pupils; and different needs of society in relation to the skills.
School social workers often approach education from an ecological perspective. They assess school success at macro‐, meso‐, micro and individual‐levels and organize interventions that address risk factors and that promote protective factors. The role of school social workers is to provide a wide range of interventions to very different students (crisis intervention, case management, and counseling) and prevention programs (for example early pregnancy prevention, drug abuse prevention, violence prevention) (Jonson‐Reid et al. 2004). The research in school social work may look for risk and protective factors that influence school success, as do for example, Bowen and Richman; Hărăguş, Roth and Damian; Rusu and Bejenaru; Kacsó within this issue. As presented by Bowen and Richman; Hărăguş, Roth and Damian (in this issue), research may assess regional variations in school practices, and develop baseline information for programs that target risks.
School social workers work directly with students and families, defining outcomes in measurable terms, using reliable, valid measurement instruments. They track the results of interventions, do reports and educate communities as well as their political and administrative leaders on specific needs of schools and students (Garrett, 2006). They usually base their research on the person‐in‐environment systemic framework. According to the ecological theory applied to schools, the lives of people cannot be understood without taking into consideration

MARIA ROTH, GARY BOWEN, PAUL‐TEODOR HĂRĂGUŞ
6
their social‐environmental characteristics. In the present issue Gary Bowen and Jack Richman from the School of Social Work at the University of North Carolina at Chapel Hill (UNC) present the comprehensive survey they designed in 1993 – and continuously researched since then – called the School Success Profile (SSP). It is a strengths‐based assessment tool for evaluating the social dimensions of students’ achievement and monitoring interventions in schools. The survey reports on indicators of demographics; school performance; contextual risks; social capital assets; internal assets; and health, adjustment, and social support. Presented by its developers, the article gives a general overview of the information collected and its utility for evidence‐based school interventions.
Three papers in this issue present results of research that was aimed to adapt the SSP to the Romanian context. The success of this process is supported in the validity study presented by Hărăguş, Roth and Damean, that creates the foundations for assuming school‐based interventions that promote equal opportunities in Romanian context. The SSP also allows further analysis on explanatory models of the Romanian school achievement. The article of Rusu and Bejenaru examine the effects of social capital that result in lower school performance and higher abandonment rates of Romanian students in rural areas versus urban areas, while the paper of Kacsó visits the influence of family factors on school outcomes. Results brings into attention interesting dynamics of socio‐economic, individual, and family and community factors that significantly weigh on students’ school performance. All three articles demonstrate the usefulness of the SSP that works with a structure of relevant factors in the social context framed by the underfinanced educational system (Miclea et al., 2007) and the more and more polarized Romanian society.
Research helps establish school policy priorities and search for resources for the remediation programs, keeping accurate records for their interventions and outcomes, essentially contributing to the shaping of the education climate in schools. An example of such research work is offered in this issue by Orthner et al., who base their interventions on curriculum innovations that orient students towards a future career. As shown in this article, by helping middle grade students understand links between the curricula and future career opportunities through the program Career Start, students are empowered in their academic work. By promoting affirmative actions, and using appreciative methods, group work and many other forms of interventions school social workers move from a purely critical perspective to flexible and dynamic empowerment approaches.
In terms associated mostly with Bourdieu, the disposition to make use of the school and the predisposition to succeed in it depend on the objective chances that are attached to the different social classes, these dispositions and predispositions in turn constituting one of the most important factors in the perpetuation of the structure of educational chances (Bourdieu and Passeron, 1977). Theorists and practitioners agree that there cannot be an overall equality of school performance, while all agents perform their roles under very different

Guest Editors' Foreword
7
circumstances. Students and teachers have different social, economic and cultural capital, and so do their institutions, families, communities and peer‐groups. Behind different personalities, motivations, energies, and social or learning competences involved there are gender, social status, economic, cultural differences that are often hidden by the pretended equalitarian façade of the educational process (Bourdieu and Passeron, 1977; David and Grenfell, 1998). Education continues to require researchers’ renewed examination and explanation in the construction of social and economic differences (Mills and Gale, 2007). Since its origins (Coleman et al., 1966), the idea of equal chances in education is the cornerstone of the sociology of education. From a bourdieuian perspective, capital attracts capital, leading to a stratification of schools. Children do not enter education with equal social, economic or cultural capital (Robins, 1998)
Following this flow of ideas, a second group of articles took the stand of social capital theory. Set into the sociology of education tradition that attempts to explain how is it possible that schools can be seen as equality achieving institution but are also places where the social inequalities is reproduced (a similar research question appears also by Rusu and Bejenaru, earlier presented in this editorial), the article of Hatos, Pusztai and Fényes is interested in discovering which factors of social capital are able to alter the school based reproductive determinism. The social and cultural context of this article is by itself interesting: Hungarian schools in a limited geographical area, which is part of three different countries: Hungary, Romania and Ukraine. Continuing previous work, which revealed that individual and context‐level religious variables (seen as social capital resources) can influence favorably the school career of students with deprived social background, this paper points out their contextual effects on student’s school achievement. The article analyzes the relations between school composition effect (regarding the parental capital), the religious network, and the teacher’s involvement on the student’s achievement rates, which have a significant load in students school related outcomes.
In his second paper based on social capital theory, Adrian Hatos looks at data on school achievement of upper secondary students from the city of Oradea by means of multilevel analysis. Adrian Hatos article is dual focused indiscussing both theoretical and methodological aspects. The analysis shows that from the different factors influencing achievement (social composition, resource allocation and the segregation or differentiation of the Romanian schools), the differentiation between high‐schools and classes can explain about half of the total variation in student achievement but still, at the individual level, social reproduction forces are still important. He concludes warning researchers about the difficulties of adequate data collection and sampling for multilevel analysis.
The paper of A. Rácz demonstrates the interest of the editorsin educational research relevant for policy makers. It discusses international and Hungarian agenda on education of minors in public child care. Based on

MARIA ROTH, GARY BOWEN, PAUL‐TEODOR HĂRĂGUŞ
8
interviews of academically successful youngsters who benefited from child care, the article examines endogenous and exogenous factors that influence the educational career of these persons. Her data is informative for the policy measures needed to provide comprehensive support for children and young people in public child care in order to achieve better educational credentials.
Another direction that more recently largely evolved in sociology is the cross‐national comparison and its measurement. In this context, the article of Cosima Rughiniş and Roxana Toader is recommended to sociologists interested in measurement issues of factual knowledge of science as included in Eurobarometer and STISOC 2009 surveys. The scientific knowledge in European countries is interesting in itself, but the real interest of the authors is methodological. It looks at consequences resulting in maintaining or eliminating “don’t know” answers in the survey. It proposes to eliminate the uni‐dimensionality of the “scientific knowledge” concept (that opposes the “correct answers” to the rest of the answers). Insisting on the “don’t know” answers, and using a multiple correspondence analysis, the article stresses the importance of a bi‐dimensional model, where the acquiescence response style factor can be combined with the “don’t know” response style factor (or the “self‐attributed ignorance of science” scale). Moreover, the article suggest that acquiescence introduces errors in estimating the score of the scientific knowledge because of the positive items, suggesting that a better approach will be to choose negative items when constructing such scales.
For educational sociologists and social workers, education carries essential inequalities based on structural dimensions of society. The editors’ selection of articles reflects on a large scale of social factors that influence educational outcomes. Though, the message of this collection of researches is that social scientists can contribute essentially by looking at social factors influencing school systems, school‐parent‐teachers‐peers‐educators’ relations, evaluations, educational policies. Results, as presented in these articles show that social factors might have a significant impact on educational outcomes, but children and youth, as well as teachers, managers and communities have lots of opportunities to improve their efforts and reach the desired success.
REFERENCES Bills, D.B. (2004). Sociology of Education and Work. Malden M.A: Blackwell Publishing. Bourdieu, P. (1977). Outline of a Theory of Practice. Cambridge: Cambridge University
Press. Bourdieu, P. and Passeron, J.C. (1977). Reproduction in Education, Society and Culture.
London: Sage Publications.

Guest Editors' Foreword
9
Coleman, J.S. (1990). Equality and Achievement in Education. Boulder, CO: Westview Press. Coleman, J.S. (1988). Social capital in the creation of human capital. American Journal
of Sociology. 94: 95‐120. Coleman, J.S., Campbell, E.Q., Hobson, C.J. (1966). Equality of Educational Opportunity.
Washington, DC: U.S. Department of Health, Education and Welfare. Dentler, R.A. (2002). Practicing Sociology: Selected Fields. Westport. CT: Praeger. David, M., Grenfell, J. (eds.) (1998). Bourdieu and Education: Acts of Practical Theory.
London: Falmer Press. http://www.questia.com/read/104180389. Garett, K.J. (2006). Making the Case for School Social Work. Children & Schools. 28: 115‐122. Jonson‐Reid, M., Kontak, D., Citerman, B., Essma, A., Fezzi, N. (2004). School Social Work
Case Characteristics, Services, and Dispositions: Year One Results. Children & Schools. 26: 5‐22.
Miclea, M. et al. (2007). România educaţiei, România cercetării – Raportul Comisiei Prezidenţiale pentru analiza şi elaborarea politicilor din domeniile educaţiei şi cercetării. [The Romania of Education, the Romania of Research – The Report of the Presidential Commission for the Analysis and Development of Education and Research Policies]. http://edu.presidency.ro/upload/raport_edu.pdf (acccesed, on the 1st of February 2010).
Mills, C. and Gale, T. (2007). Researching social inequalities in education. The case for a Bourdieuian research methodology, International Journal of Qualitative Studies in Education. 20(4): 433‐447.
Robins, D. (1998). The Need for an Epistemological ‘Break’. In M. David and J. Grenfell (eds.): Bourdieu and Education: Acts of Practical Theory. London: Falmer Press, pp. 27‐52.
Siu‐Ming, To. (2007). Empowering School Social Work Practices for Positive Youth Development: Hong Kong Experience. Adolescence, 42(167): 555‐568.


STUDIA UNIVERSITATIS BABEŞ‐BOLYAI, SOCIOLOGIA, LV, 1, 2010
THE SCHOOL SUCCESS PROFILE: ASSESSING THE SOCIAL ENVIRONMENT AND THE INDIVIDUAL ADAPTATION
OF MIDDLE AND HIGH SCHOOL STUDENTS
GARY L. BOWEN* AND JACK M. RICHMAN**
ABSTRACT. This article provides an overview of the School Success Profile (SSP), which is a strengths‐based assessment tool for informing, monitoring, and evaluating interventions to promote school success among middle and high school students. Framed and informed by the Eco‐Interactional Development (EID) model of school success, the SSP assesses students within the context of their broader social environment and yields individual and summary group student profiles from the data, informing both micro‐ and macro‐level practice interventions. The SSP is designed to augment other ways of knowing about students and their presenting situations. The history and development of the SSP are reviewed, as well as the 2008 version of the SSP that allows users to design their own survey. Information about the reliability and validity of the SSP are offered. Use of the SSP has expanded from the United States to other countries, including Romania and Portugal. Keywords: school success, assessment, evidence‐based practice, evaluation
The School Success Profile: Assessing the Social Environment and the Individual Adaptation of Middle and High School Students1
A goal of social work practice in schools is to help students overcome barriers to school success. Intervention success is promoted in situations where social workers have access to information about students, and a careful assessment is the first step in the evidence‐based practice sequence. Social workers employ many tools in their efforts to understand students and their presenting situations, including observations of students, information from significant others in the lives of students, and administrative data. Social workers * School of Social Work, The University of North Carolina at Chapel Hill, e‐mail: [email protected]. ** School of Social Work, The University of North Carolina at Chapel Hill, e‐mail: [email protected]. 1 Development of the School Success Profile and the design and implementation of the online system to administer and score it have been supported by a series of grants from the BellSouth Foundation (1992–1997), from the John S. and James L. Knight Foundation (1995–2006), from the William T. Grant Foundation (2003–2006), and from the National Institute on Drug Abuse (2005‐2010).

GARY L. BOWEN, JACK M. RICHMAN
12
also employ quantitative assessment tools in the form of surveys to assess the perceptions of students about themselves, their performance at school, and the larger environment in which they live. The resulting information may be used directly by school social workers to inform interventions or to guide more informal assessments.
This article reviews one such survey, the School Success Profile (SSP), as a strengths‐based assessment tool for informing, monitoring, and evaluating social work interventions with middle and high school students. Developed by Drs. Gary Bowen and Jack Richman from the School of Social Work at the University of North Carolina at Chapel Hill (UNC)2, the SSP assesses students within the context of their broader social environment and yields both individual and summary group profiles from the data informing both micro‐ and macro‐level practice interventions. The SSP is designed to augment other ways of knowing about students and their presenting situations.
The SSP resulted from a partnership between the School of Social Work (SSW) at The University of North Carolina at Chapel Hill and Communities In Schools (CIS) at the national, state and local levels in the United States in the early 1990s. CIS is the largest private, nonprofit network in the United States devoted to promoting high school graduation and success among students at risk of school failure. The SSP was designed to help CIS (1) inform the process by which students are provided with a comprehensive program of support services and life skills training; (2) monitor changes in program participants over time; and (3) increase accountability to stakeholders. The SSP is administered in cooperation with Flying Bridge Technologies, Inc. (FBT), which is an internet and interactive media service company in Charlotte, North Carolina.
Since its initial development as a prototype in 1993, the SSP has undergone four major revisions (in 1997, in 2001, in 2005, and in 2008) to increase its responsiveness as a source of information for informing student‐, school‐, and community‐based interventions. During the 1996‐1997 academic year, the SSP was administered to a probability sample of 2,099 public school students in grades 6 to 12 from across the United States (Harris and Associates, Inc., 1997). Since 1993, the SSP has been used in more than 1,000 middle and high schools and administered to nearly 100,000 students in the United States. Although the SSP was designed in partnership with CIS, the survey is currently used in a variety of educational and social service settings, including juvenile detention facilities and neighborhood youth programs.
2 Correspondence should be directed to Dr. Gary L. Bowen, School of Social Work, The University of North Carolina at Chapel Hill, 325 Pittsboro Street, Chapel Hill, NC 27599‐3550; email: [email protected].

THE SCHOOL SUCCESS PROFILE: ASSESSING THE SOCIAL ENVIRONMENT AND THE …
13
Researchers in both the United States and abroad have also included items and scales from the SSP in their own research tools. The SSP or parts of the SSP have been translated into Spanish, Hebrew, Lithuanian, Romanian, and Portuguese. For example, Professor Maria Roth from “Babeş‐Bolyai” University in Cluj, Romania, and her research team, which also includes Paul‐Teodor Hărăguş from “Babeş‐Bolyai” University, have pilot tested a Romanian and a Hungarian version of SSP in urban and rural schools. In addition, the research team of Mariana Veloso‐Martins, Tânia Gouveia, and Dr. Emília Costa from the Psychotherapy, Development and Training Institute (Faculty of Psychology and Educational Sciences of Porto University) has adapted and administered the SSP to a multistage cluster stratified representative sample of 1698 Portuguese 11th grade students. Financed by the Calouste Gulbenkian Foundation, the research team is interested, in part, on the quality of the students’ significant relationships (i.e., parents, teachers and peers) throughout life and the influence of these relationships on their school success3.1 Content
The current version of the SSP includes 263 closed‐ended items. These items address students’ beliefs about their social environment—neighborhoods, schools, friends, and families—and about their own physical and psychological health and school performance (individual adaptation). The survey is divided into six modules: About You (15 items), Neighborhood (26 items), School (105 items), Friends (27 items), Family (45 items), and Health and Well‐Being (45 items).
The SSP assesses 30 dimensions that are related to the student’s social environment and individual adaptation (see Appendix A for a summary description of each dimension). Each profile dimension is a summary scale or index that includes multiple items. The 18 social environment dimensions are all labeled and defined as assets that students need for healthy development and school success. The 12 dimensions of individual adaptation are positively worded and are defined as attitudinal and behavioral outcomes that evidence 3 In response to requests from practitioners using the middle and high school version of the SSP, an elementary version of the survey has been developed with funding from the National Institute on Drug Abuse—the Elementary School Success Profile (ESSP). Dr. Natasha Bowen leads the ESSP project. The ESSP assesses the same major domains as the current SSP, but includes items and language appropriate for third through fifth graders. To enhance its ability to sustain children’s interest, the online survey includes state‐of‐the‐art graphics and audio features. Because of concerns about the reliability and validity of self‐report data from young children, some elementary SSP data are collected from parents and teachers. Like the SSP, the ESSP has involved rigorous testing throughout its development, which is ongoing (N. Bowen, 2006; Woolley, Bowen, and Bowen, 2004). The elementary survey allows school‐based practitioners to address risk and protective factors known to be associated with adolescent behavioral problems before the problems fully develop.

GARY L. BOWEN, JACK M. RICHMAN
14
healthy development and success at school. School success is defined as graduation from high school prepared to pursue postsecondary education or training, military service, or employment capable of moving the student toward economic self‐sufficiency. The SSP includes no questions about illegal behavior, substance abuse, sexual activities, or issues of child abuse and neglect that may place students or families in self‐incriminating situations.
From a design perspective, the 30 dimensions from the SSP are organized from a logic‐model perspective: distal results (academic performance), intermediate results (personal beliefs and well‐being/school attitudes and behavioral indicators), and proximal results (neighborhood, school, friends, and family indicators) (see Appendix A). Distal and intermediate results were labeled student results because they are viewed as the consequence of addressing the support needs of students. As longer term results, no single agency, organization, or group can either take full credit for these results when they meet expectations or assume total responsibility when they fall short of expectations—they are the product of multiple contextual influences in the lives of students. Proximal results were labeled program results because they are the targets of intervention and prevention activities. Unlike student results, results related to the neighborhood, school, peer, and family environment can be directly linked to the efforts of individuals and agencies working to help youth.
In the past, we have used the hands on a clock to distinguish among these three levels of results, as well as to represent the chain of influence among them (Bowen et. al., 2001). From this perspective, distal results are on the hour hand, intermediate results are on the minute hand, and proximal results are on the second hand. Results on the hour hand turn slowest of all and depend on the movement of the second and minute hands.
The current version of the SSP allows users maximum degrees of freedom in designing their own survey. Earlier versions of the SSP followed a fixed format design—students completed all items on the SSP. Consequently, a key challenge in developing earlier versions of the SSP was keeping the survey to a manageable length. Users now use a function on the SSP administrative website to select items and scales that they want to appear on the survey. Importantly, users must select all items that are associated with particular dimensions. Although some users elect to use all items and scales on the SSP, the result is a survey that takes between 60 minutes and 75 minutes for the average middle school student to complete. Users are encouraged to configure the SSP to take no more than 30 to 45 minutes to complete. Consequently, in its current form, the SSP is best described as a pool of items and scales. This design feature allows the developers flexibility to add items and scale dimensions that are relevant to the science and practice of school‐based interventions.
THE SCHOOL SUCCESS PROFILE: ASSESSING THE SOCIAL ENVIRONMENT AND THE …
15
Conceptual Framework
The SSP was developed after a comprehensive review of the school success literature and of risk and protective factors for children (Richman and Bowen, 1997, Richman, Bowen, and Woolley, 2004). An eco‐interactional developmental perspective of school success framed and informed the literature review (Bowen, 2009). Drawing on Bronfenbrenner’s (2005) bioecological theory of human development, attention is directed to proximal processes in the social environment that may either constrain or support students’ ability to achieve desired results. Bronfenbrenner defined proximal processes as “progressively more complex reciprocal interaction[s] between an active, evolving biopsychosocial human organism and the persons, objects, and symbols in [the child’s] immediate environment ... over extended periods of time “ (p. 6). These processes may either promote or constrain students’ goodness of fit and their ability to achieve desired results. These may include people, in the form of interpersonal relationships and social support, or places, in the form of safety, satisfaction, and opportunity. At any one time, students both influence and are influenced by multiple proximal processes within and between social environments.
Proximal processes are assumed to operate on a continuum from risk to asset, which is consistent with Sameroff and Guttman’s (2004) concept of “promotive factors”—factors that exert positive effects on outcomes, independent of risk status. Gilgun (1996) refers to such proximal processes as “assets,” to distinguish them from protective factors that operate in the context of risk. However, the EID model does not assume a one‐to‐one correspondence between proximal processes, in the form of people and places, and specified outcomes. Upper and lower threshold points may be present where the relationship between the proximal process and the specified outcome shifts more dramatically (Crane, 1991). The operation and impact of proximal processes also are assumed to vary by the students’ development status (such as their age), their personal characteristics (such as their race/ethnicity), and their intra‐personal attributes, skills, and competencies (e.g., self‐confidence).
In summary, the EID model provides a framework for understanding school success in the broader contexts in which students’ lives take place. The model provides a blueprint for informing assessment, basic and applied research, and intervention and prevention planning. Reliability and Validity
The process that evolved in developing the SSP included partnerships with stakeholders at many levels. Drs. Bowen and Richman consulted with national experts in education, adolescent development, and psychometrics to identify existing items and scales for inclusion, as well as for information regarding

GARY L. BOWEN, JACK M. RICHMAN
16
questionnaire design. Subject matter experts provided consultation on the content validity of SSP measures—the degree to which items on the SSP adequately represent and assess underlying conceptual dimensions. Lay experts, including CIS staff and student participants, provided critical feedback on the face validity of the measures. Drs. Bowen and Richman also elicited the help of school superintendents, teachers, guidance counselors, and school social workers in obtaining feedback on the instrument from diverse groups of middle and high school students, through the use of student interviews and focus groups. Special attention was given to ensuring that survey items were applicable to both middle and high school students and students from diverse ethnic and cultural backgrounds in the United States. This collaborative process continues through ongoing feedback solicited from individuals involved in all aspects of the SSP administrative process.
Although the reliability and validity of many of the core SSP measures have been demonstrated across a number of research investigations (see http://www.uncssp.org/publications.asp for a list of SSP‐related research publications), the 2001 version of the SSP was subjected to a rigorous test for reliability and validity, including tests of measurement invariance over gender, school level, and race/ethnicity (Bowen, Rose, and Bowen, 2005). Based on a nonprobability sample of more than 16,000 middle and high school students across 351 school sites and six states who took the SSP between July 2001 and March 2003, the findings provided support for the internal consistency reliability and the construct validity of the SSP core profile dimensions. Garcia‐Reid (2003), in a study of Latino 7th‐graders attending a middle school in an at‐risk urban area in northern New Jersey, also demonstrated the reliability and validity of the Spanish version of the SSP.
The results from the extensive psychometric analysis of the 2001 version of the SSP were used in developing the current version of the SSP, which is a modified and extended version of the 2005 SSP. Recent reliability analysis with more than 3,500 students across 14 middle and high schools in one North Carolina community confirms the internal consistency of the survey items comprising each dimension—23 of the 30 dimensions on the 2008 version of the SSP had reliability coefficients that exceeded .80; the lowest reliability coefficient was .74. Five of the eight new dimensions on the 2008 SSP had reliability coefficients that were .90 or higher. Overall, these reliability coefficients are considerably higher than the cutoffs of .60 or .70 that are commonly specified as minimally acceptable in aggregate analysis with large samples (Rosenthal, 1994). A detailed description of each SSP dimension, including the original source of the items and scoring procedures, is available from the first author.

THE SCHOOL SUCCESS PROFILE: ASSESSING THE SOCIAL ENVIRONMENT AND THE …
17
Administration
FBT maintains an information website for researchers and practitioners interested in using the SSP (http://www.schoolsuccessonline.com/). This website provides descriptive information on the SSP, as well as access to a best practices database, a search engine for locating school‐based practice resources, and a list of funders that provide grants for school‐based research and practice development. A link is also provided on the website to purchase use of the SSP, which results in a username and password. The SSP is priced per unit of administration. The price per unit varies by the number of SSPs purchased with prices per unit decreasing as the number of units increase.
FBT handles the business side of the SSP, including all contracts for its use, through a licensing agreement with the Drs. Bowen and Richman and the University of North Carolina at Chapel Hill. Academic researchers and school‐based practitioners who wish to use scale dimensions from the SSP in their research and university graduate students who wish to use the SSP in part of whole in their research are typically not charged a fee for use. However, a letter of agreement is required in which users agree to give proper attribution in publications to SSP‐related items and scales and, if applicable, the original source of these items and scales.
For clients who purchase the SSP, training materials are available for downloading from the SSP administration website. Administration and intervention trainings are available to SSP clients via 90‐minute online webinars. Training is fee based, and requires the use of an online tool for real time communication at remote sites. Our partner company, Flying Bridge Technologies, Inc., subscribes to Live Meeting from Microsoft®—an effective and easy to use online tool. On site, face‐to‐face administration and intervention training is also offered for a fee. Sites incur additional costs for on‐site technical assistance and for special data analysis requests, such as merging SSP data from two administrations into a longitudinal dataset for analysis.
Sites are encouraged to secure active parent consent before students take the SSP. The SSW works with clients to address their own guidelines for institutional review. Sites are strongly encouraged to notify parents at a minimum before survey administration. Consequently, parents have an option to contact the school if, for some reason, they do not want their child to take the SSP. Clients assume full responsibility for compliance with applicable institutional review requirements.
The SSP is typically administered to students in the computer lab at their school, although the SSP can be taken from any computer with an Internet connection4. A unique serial number (student ID) and password are assigned 4 A hard copy version of the SSP is available for use, including an optical scan scoring sheet. However, clients are strongly encouraged to use the online version of the SSP, if at all possible.

GARY L. BOWEN, JACK M. RICHMAN
18
to each student, although clients decide whether or not they link the names of students with specific ticket codes for tracking. Thus, the SSP may be administered as an anonymous survey. Students sit at the computer, enter the assigned serial number and password, and choose if they want to take the SSP in English or Spanish (still in development for current version) by clicking on the relevant box on the computer screen. After clicking on a next button, they watch a short video that introduces them to the SSP and provides instructions for completing the survey. Students need audio on the computer to hear the introduction, although a written script is also available. They complete the SSP by clicking on the box with the best answer for each question on the screen and then clicking on the next button to continue. They may use the back button to go back to a previous answer or the skip button to move past a question. On the last screen, they click next to close the survey. If they cannot finish the survey in one sitting, they can come back to the survey, re‐enter the assigned serial number and password, and continue where they left off. School sites download individual and summary group profiles from the Web. Access to these profiles is password‐protected, and sites have access only to their own data. Summary Profiles
The SSP provides data in the form of individual student profiles and site‐level aggregate profiles. An integrated query system allows practitioners to examine group‐level results within student subgroups, both singly (e.g., gender) and in combination (e.g., gender and grade). Practitioners are encouraged to meet with students individually and as a group to establish the validity of the findings from the students’ perspective, and hard copy resources are available for downloading online to inform this process. The SSP is designed to supplement and enhance practitioners’ ongoing observations of and dialogue with students, not to substitute for this process. Other information, such as that from school records or observations, may either support or counter students’ reports.
Practitioners work with students, both individually and as a group, to design appropriate intervention goals and strategies. Repeated administrations of the SSP provide a means to monitor the effectiveness of interventions. A key advantage in the design of the current survey is that users can select only those items and scale dimensions for re‐administration of the SSP that are relevant to their intervention.
Results‐focused planning (RFP), which is a program management strategy, provides an approach for using information from the SSP as a tool for intervention and prevention planning. A key principle of RFP is planning with the intended results in mind (Hatry, 1999). RFP focuses on helping practitioners manage results rather than manage activities (Orthner and Bowen, 2004). The specification of program activities receives attention only after intended results

THE SCHOOL SUCCESS PROFILE: ASSESSING THE SOCIAL ENVIRONMENT AND THE …
19
are defined, and intended results are organized in the form of a logic model based on theory, empirical research, practice wisdom, and discussion with stakeholders at multiple levels. Individual Profile
The individual profile includes information about 30 dimensions related to the student’s social environment and individual adaptation (see Appendix B for a sample profile). The student’s ID and the date of administration is listed at the top of the page (right hand corner), and reference information about the student is included on the upper right hand side of the profile form. The individual profile has attribution to a particular student only if clients have linked student names to student IDs.
Each profile dimension is a summary scale that includes multiple items. Students receive scores only for those dimensions that were included on the survey. The 18 social environment dimensions are all labeled and are defined as assets that students need for healthy development and school success. The 12 indicators of individual adaptation are positively worded and are defined as attitudinal and behavioral indicators that evidence healthy development and success at school.
Student scores on each dimension are coded into three colors: red, yellow, and green. The colors correspond to cutoffs that have been determined based on comparison to national norms, criterion analysis, and expert review. Each dimension reflects a continuum of protection from red (potential risk), yellow (some caution may be warranted), and green (potential asset).
From an RFP perspective, the 18 social environment dimensions are program results that can be targeted for intervention and prevention planning as a means to influence student results associated with individual adaptation. Individual profiles provide a starting point for intervention planning and a baseline for tracking individual progress over time. Practitioners and students use the data in the context of other available information to design the most appropriate interventions and to modify interventions as needed to ensure student success. Summary Group Profile
A composite summary of the individual profiles at a particular site, the summary group profile helps school social workers identify areas that may represent particular strengths or concerns among students. A site may include a classroom (at least 10 students), school, district, county, or state. The summary group profile looks similar to the individual profile with the exception that information includes summary statistics for the student group (see Appendix C

GARY L. BOWEN, JACK M. RICHMAN
20
for a sample summary group profile from a small private school serving 40 low‐income, male students). Reference information about the student group is included on the right side of the summary profile.
Summary data on the 30 SSP profile dimensions are included on the left and right sides of the page. The percentages associated with each dimension indicate the proportion of students who received one of three scores: red (potential risk), yellow (some caution may be warranted), and green (potential asset). These data reflect how students are doing as a group on the dimensions included in the social environment profile and the individual adaptation profile.
The most positive summary group profile would include results with a high percentage of students with green (asset) codes. In reviewing the findings, school practitioners are encouraged to consider the desired performance standard for each dimension—the minimally acceptable proportion of students with asset codes. Information from the summary group profile is helpful in prioritizing interventions that address the difficulties faced by groups of students. In this way, profile data are one means by which social workers determine how to allocate their limited resources to maximize program effectiveness.
Summaries of evidence‐based practice strategies/programs are provided for each of the dimensions included on the individual profile and summary group profile, including a description of the program, the objectives of the intervention, implementation requirements, the cost, evaluation research references, and contact information for further details on the program. Gordon’s (1983) public health typology of prevention programs informs the classification of programs and strategies as universal (programs that target all students in the school), selected/indicated (programs that target specific students who might benefit from program components), or multi‐component (programs that include universal and selective/indicated components). Promising practices (intervention ideas and strategies that have shown promise) and resources (books, articles, and websites that provide information about effective practices in schools) are also displayed for each dimension. The SSP research staff at UNC reviews and updates this feature of the website on an ongoing basis. Detailed Group Report
The SSP data are also aggregated into a detailed group report informing practitioners about students’ risks and assets, and helping them demonstrate program needs to stakeholders and potential funders. The detailed group report includes 123 indicators across six summary profiles: demographic (10 items); school performance (5 items); contextual risks (20 items); social capital assets (25 items); internal assets (25 items); and health, adjustment, and social support (38 items). Each indicator is assessed by a single SSP survey item, and results are expressed in percentages (0 to 100%). A sample detailed group report is available from the first author.

THE SCHOOL SUCCESS PROFILE: ASSESSING THE SOCIAL ENVIRONMENT AND THE …
21
Seventy of the 123 indicators address contextual risks, social capital assets, and internal assets. These indicators have demonstrated good discriminate validity in prior studies of personal adjustment, school attitudes and behavior, and/or academic performance (e.g., Woolley and Bowen, 2007).
Contextual risks are situations and conditions in the social environment of youth that decrease their chances for school success and positive developmental outcomes. The detailed group report provides information about risk factors found in the neighborhoods, schools, peer relationships, and families of youth, including risks related to the safety and social needs of students.
Social capital assets exist for youth within and outside of the family. In the family, social capital refers to the quality of family relationships and the time and attention parents give to youth. Social capital outside the family includes three aspects. First, it includes the opportunities and support that youth receive from institutions and adults in their community. Second, it consists of the relationships that parents have with adults and institutions in the community that have linkages to their developing child. These linkages provide youth with greater consistency of expectations and experiences across settings. Last, it includes the supportive relationships that youth experience with their friends. Social capital assets may operate as either promotive or protective factors in helping youth manage life demands and achieve their goals and ambitions. Because of the important role that parents/guardians play in the life and development of children, adult family members and their links to other sources of social capital were a central focus in the development of the social capital assets index.
Internal assets are those resources that reside within the individual. Resulting from the dual influences of nature and nurture, these assets reflect the value and belief systems of youth about themselves and about the level of control they exert over events in their lives. Such value and belief systems inform the way in which youth approach and react to events and situations in their environment. Internal assets are captured in the areas of health, self‐regard, social competency, future orientation, and school engagement.
Consistent with an RFP perspective, practitioners are encouraged to develop performance standards for the indicators associated with school performance; contextual risks; social capital assets; internal assets; and health, adjustment, and social support. As a basis for interpretation of students’ results, performance standards are defined as the minimum desired result. Interventions are targeted at closing the gap between desired expectations and current realities as reflected in the detailed group report. Summary and Conclusion
The SSP has received many affirmative evaluations from practitioners in the field using its results as a basis for designing and monitoring the effects of interventions with students (see www.schoolsuccessprofile.org), as well as

GARY L. BOWEN, JACK M. RICHMAN
22
positive reviews from behavioral and social scientists about its utility as an evidence‐based assessment method (e.g., Corcoran, 2005; Early, 2001; Franklin, 2004; Galassi and Akos, 2007). In the Foreword for The Reliability and Validity of the School Success Profile (SSP) (Bowen et al., 2005), Dr. Cynthia Franklin, Distinguished Professor in the School of Social Work at the University of Texas at Austin and former editor of Children and Schools, a journal of the National Association of Social Workers, described the SSP as standing alone “as one of the truly excellent, empirically validated, comprehensive, and standardized measurement tools for schools” (p. 11). Assessment is the first step in an evidence‐based practice strategy sequence (Thyer, 2002), and social work practitioners need access to information about the degree to which instruments produce reliable and valid data. Only then can they successfully choose among competing assessment tools and place enough confidence in the tools’ findings to inform intervention strategies.
Although the results from prior investigations to examine the psychometric properties of the SSP have been promising (Bowen, Rose, and Bowen, 2005), including studies using the earlier Spanish version of the SSP (Garcia‐Reid, 2003), continued efforts are required to examine the integrity of the SSP using diverse samples across different social and cultural contexts. We are particularly interested in seeing the SSP translated for use with populations of students in non‐English speaking countries. Current work in Romania, as mentioned earlier, is an excellent example of international applications. The SSP is a dynamic assessment tool and it will continue to be revised periodically to reflect changing norms and to address evolving conditions in the assessment of the needs of middle and high school students.
As our development and evaluation of the SSP continue through what Gambrill (1999) calls the “tradition of criticism” (p. 343), we, the developers of the SSP, take some refuge in the instructions that are given for its use—the SSP’s caveat emptor: “The SSP is designed to augment other ways of knowing about students and their presenting situations.” Practitioners are strongly encouraged to discuss SSP results with student respondents, allowing students to give meaning and interpretation to the quantitative results. Decisions should not be based on SSP results alone. When used in this context, the future of the SSP as an assessment tool for use by social work practitioners appears promising.
WEBSITES RELATED TO SSP http://www.uncssp.org/
The main website, which is maintained by the developers of the SSP at the University of North Carolina at Chapel Hill, provides summary information about the SSP, including an extensive list of publications and research that make use of the assessment.

THE SCHOOL SUCCESS PROFILE: ASSESSING THE SOCIAL ENVIRONMENT AND THE …
23
http://www.schoolsuccessonline.com/
Sponsored by Flying Bridge Technologies, Inc., this website is used primarily for marketing the SSP and registering clients for use, although access is provided to a best practices database, a search engine for locating school‐based practice resources, and a list of funders that provide grants for school‐based research and practice development.
REFERENCES Bowen, G.L. (2009). Preventing school dropout: The Eco‐interactional Development
Model of School Success. The Prevention Researcher, 16(3): 3‐8. Bowen, G.L., Rose, R.A., and Bowen, N.K. (2005). The reliability and validity of the School
Success Profile. Philadelphia, PA: Xlibris Corporation. Bowen, G.L., Woolley, M.E., Richman, J.M., and Bowen, N.K. (2001). Brief intervention in
schools: The School Success Profile. Brief Treatment and Crisis Intervention, 1: 43‐54.
Bowen, N.K. (2006). Psychometric properties of the Elementary School Success Profile’s child questionnaire. Social Work Research, 30: 51‐63.
Bronfenbrenner, U. (Ed.). (2005). Making human beings human: Bioecological perspectives on human development. Thousand Oaks, CA: Sage.
Corcoran, J. (2005). Building strengths and skills: A collaborative approach to working with clients. New York: Oxford.
Crane, J. (1991). The epidemic theory of ghettos and neighborhood effects on dropping out and teenage childbearing. American Journal of Sociology, 96: 1,226‐1,259.
Early, T.J. (2001). Measures for practice with families from a strengths perspective. Families in Society: The Journal of Contemporary Human Services, 82: 225‐232.
Franklin, C. (2004). The delivery of school social work services. In P. Allen‐Meares (Ed.), Social work services in schools (4th ed.). Boston: Pearson Education, Inc.: 295‐325.
Galassi, J.P., and Akos, P. (2007). Strengthsbased school counseling: Promoting student development and achievement. New York: Lawrence Erlbaum Associates.
Gambrill, E. (1999). Evidence‐based practice: An alternative to authority‐based practice. Families in Society: The Journal of Contemporary Human Services, 80: 341‐350.
Garcia‐Reid, P. (2003). Pathways to school engagement among Latino youth in an urban middle school context: The influence of social support, sense of ethnic pride, and perception of discrimination (Doctoral Dissertation, Fordham University, 2003).
Gilgun, J.F. (1996). Human development and adversity in ecological perspective, Part 1: A conceptual framework. Families in Society: The Journal of Contemporary Human Services, 77: 395‐402.

GARY L. BOWEN, JACK M. RICHMAN
24
Gordon, R.S., Jr. (1983). An operational classification of disease prevention. Public Health Reports, 98: 107‐109.
Harris and Associates. (1997). School Success Profile (Study No. 628173). New York: Author.
Harris and Associates (1997). School Success Profile (Study No. 628173). New York: Author.
Hatry, H.P. (1999). Performance measurement: Getting results. Washington, DC: Urban Institute Press.
Orthner, D.K., and Bowen, G.L. (2004). Strengthening practice through Results Management. In A.R. Roberts and K. Yeager (Eds.): Handbook of practice based research. New York: Oxford University Review, pp. 897‐904.
Richman, J.M., and Bowen, G.L. (1997). School failure: An ecological‐interactional‐developmental perspective. In M.W. Fraser (Ed.): Risk and resilience in childhood: An ecological perspective. Washington, DC: NASW Press, pp. 95–116.
Richman, J.M., Bowen, G.L., and Woolley, M.E. (2004). School failure: An eco‐interactional developmental perspective. In M.W. Fraser (ed.): Risk and resilience in childhood: An ecological perspective (2nd ed.). Washington, DC: NASW Press, pp. 133‐160.
Rosenthal, J.A. (1994). Reliability and social work research. Social Work Research, 18: 115‐121.
Sameroff, A.J., and Gutman, L.M. (2004). Contributions of risk research to the design of successful interventions. In P. Allen‐Meares and M.W. Fraser (eds.): Intervention with children and adolescents: An interdisciplinary perspective. Boston, MA: Pearson, pp. 9‐26.
Thyer, B.A. (2002). Principles of evidence‐based practice and treatment development. In A.R. Roberts and G.J. Greene (eds.): Social workers’ desk reference. New York: Oxford University Press, pp. 739‐742.
Woolley, M.E., and Bowen, G.L. (2007). In the context of risk: Supportive adults and the school engagement of middle school students. Family Relations, 56: 92‐104.
Woolley, M.E., Bowen, G.L., and Bowen, N.K. (2004). Cognitive pretesting and the developmental validity of child self‐report instruments: Theory and applications. Research on Social Work Practice, 14: 191‐200.
THE SCHOOL SUCCESS PROFILE: ASSESSING THE SOCIAL ENVIRONMENT AND THE …
25
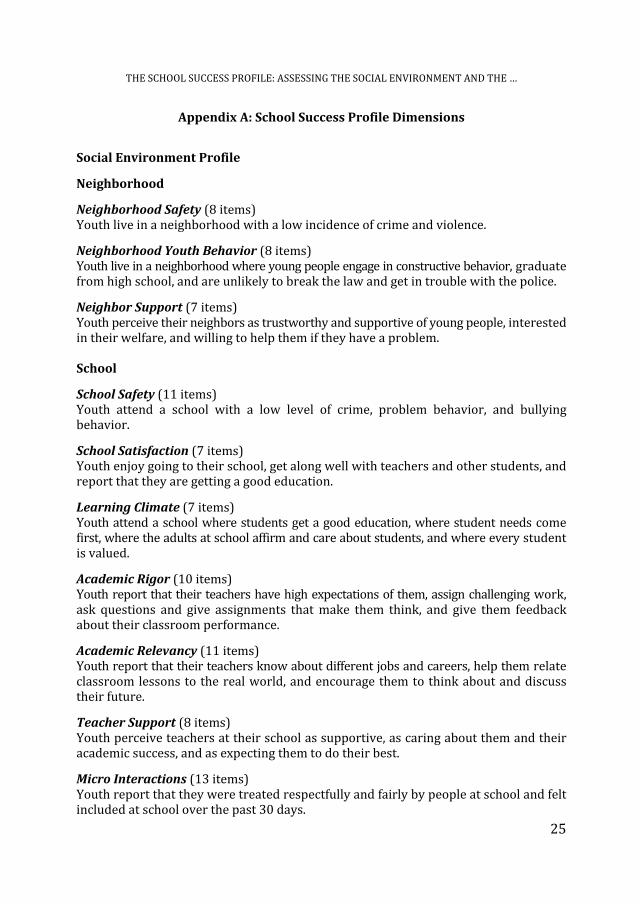
Appendix A: School Success Profile Dimensions
Social Environment Profile
Neighborhood
Neighborhood Safety (8 items) Youth live in a neighborhood with a low incidence of crime and violence.
Neighborhood Youth Behavior (8 items) Youth live in a neighborhood where young people engage in constructive behavior, graduate from high school, and are unlikely to break the law and get in trouble with the police.
Neighbor Support (7 items) Youth perceive their neighbors as trustworthy and supportive of young people, interested in their welfare, and willing to help them if they have a problem. School
School Safety (11 items) Youth attend a school with a low level of crime, problem behavior, and bullying behavior.
School Satisfaction (7 items) Youth enjoy going to their school, get along well with teachers and other students, and report that they are getting a good education.
Learning Climate (7 items) Youth attend a school where students get a good education, where student needs come first, where the adults at school affirm and care about students, and where every student is valued.
Academic Rigor (10 items) Youth report that their teachers have high expectations of them, assign challenging work, ask questions and give assignments that make them think, and give them feedback about their classroom performance.
Academic Relevancy (11 items) Youth report that their teachers know about different jobs and careers, help them relate classroom lessons to the real world, and encourage them to think about and discuss their future.
Teacher Support (8 items) Youth perceive teachers at their school as supportive, as caring about them and their academic success, and as expecting them to do their best.
Micro Interactions (13 items) Youth report that they were treated respectfully and fairly by people at school and felt included at school over the past 30 days.

GARY L. BOWEN, JACK M. RICHMAN
26
Friends
Friend Behavior (9 items) Youth have friends who are unlikely to break the law or get in trouble with the police, who stay out of trouble and perform well at school, and who are likely to graduate from high school.
Peer Group Acceptance (8 items) Youth feel accepted by their peers, able to be themselves, and able to resist peer pressure.
Friend Support (5 items) Youth perceive their friends as trustworthy and supportive and as responsive to their needs and feelings.
Family
Home Academic Environment (8 items) Youth report that they discuss their courses or programs at school, their school‐related activities, current events and politics, and their plans for the future with the adults who live in their home.
Parent Education Support (6 items) Youth report that the adults in their home encourage and support them in their school work and activities, help them get needed books or supplies, and offer help with homework or special assignments.
School Behavior Expectations (12 items) Youth perceive the adults in their home as expecting them to do their school work, to attend classes, and to follow school rules.
Parent Support (5 items) Youth report that the adults in their home provide them with loving support and encouragement and spend free time with them.
Family Togetherness (7 items) Youth report that the people in their home feel a sense of emotional closeness and bonding with one another, do things together, and work together to solve problems. Individual Adaptation Profile
Personal Beliefs and WellBeing
Physical Difficulties (3 items) Youth report that over the past week, they did not have any physical difficulties such as toothaches, trouble seeing, or difficulty hearing.
Body Weight (3 items) Youth do not report concerns about their weight.

THE SCHOOL SUCCESS PROFILE: ASSESSING THE SOCIAL ENVIRONMENT AND THE …
27
Physical Health (9 items) Youth evidence good health, as indicated by an absence of symptoms or physical illness over the past seven days.
Adjustment (6 items) Youth do not feel a sense of sadness, confusion, aloneness, or general despair about the future.
Self Confidence (5 items) Youth report a sense of confidence in themselves and positive self‐regard.
Religious Orientation (4 items) Youth report that religion plays a role in their lives and affects the decisions they make.
Social Support Use (8 items) Youth indicate that there are people they can turn to for various types of social support and assistance. School Attitudes and Behavior
Success Orientation (12 items) Youth are able to picture their futures in a positive way, work hard and make choices that will guarantee a successful future, and feel confident that they will be successful in life.
School Engagement (4 items) Youth report that they find school fun and exciting, look forward to learning new things at school, look forward to going to school, and are not bored at school.
Extracurricular Participation (10 items) Youth report that they have or will have participated in school activities during the current school year that are not part of class work.
Trouble Avoidance (11 items) Youth report that they have avoided problem behaviors in the past 30 days that reflect getting into trouble at school. Academic Performance
Grades (3 items) Youth report at least B’s or C’s or better on their most recent report card, no D’s or F’s on their most recent report card, and they describe their grades as better or much better than the grades received by other students in their classes.

GARY L. BOWEN, JACK M. RICHMAN
28
Appendix B: Sample Individual Profile

THE SCHOOL SUCCESS PROFILE: ASSESSING THE SOCIAL ENVIRONMENT AND THE …
29
Appendix C: Sample Summary Group Profile


STUDIA UNIVERSITATIS BABEŞ‐BOLYAI, SOCIOLOGIA, LV, 1, 2010
THE MEASUREMENT OF THE SOCIAL DIMENSIONS OF SCHOOL SUCCESS – A VALIDITY STUDY
OF THE ROMANIAN VERSION OF THE SCHOOL SUCCESS PROFILE
PAULTEODOR HĂRĂGUŞ∗, MARIA ROTH∗∗, DIANA DAMEAN***
ABSTRACT. Our paper presents the results of research that was aimed to adapt to a Romanian context the School Success Profile questionnaire, designed at the University of North Carolina at Chapel Hill (USA) by G. Bowen and J. Richman. The Romanian research team assumed that school success in Romania is influenced by similar social‐contextual factors as it is in the United States. The paper shortly presents the goals of our project, the theoretical background of the SSP as we understand it, the process we went through to adapt the instrument, the sampling for the Romanian data set, the dimensions of the evaluation, and the psychometric qualities of the survey for the Romanian sample. Each of the social environment dimensions (school, peers, neighborhood and family) have a significant effect both on school attitudes and behavior, and on personal beliefs and well being. Data also revealed significant associations between demographic variables (gender, ethnicity, residence, school level, income) and respondents’ school performance, thus raising the question on how the identified inequalities can be tackled. Keywords: The School Success Profile, ecological perspective, education, inequalities
Introduction1
The current research is based on the results of the research project, The social diagnosis of school performance using the School Success Profile (SSPRo) and the design of evidence based intervention methods2. The project’s main objectives are to reveal the extent to which students’ performance is associated with social factors, and how can school systems be made more equitable for all students. ∗ “Babeş‐Bolyai” University, Cluj‐Napoca. Contact email address: [email protected] ∗∗ “Babeş‐Bolyai” University, Cluj‐Napoca. Contact email address: [email protected] *** “Babeş‐Bolyai” University, Cluj‐Napoca. Contact email address: [email protected] 1 The authors are grateful to Gary Bowen and Cristina Raț for valuable comments on the paper. 2 The article is based on the results of the PN II project nr. 91‐063/2007 financed by The National Centre for Programme Management (CNMP), coordinated by Maria Roth, PhD (“Babeş‐Bolyai” University). For more details please check the site of the project: www.successcolar.ro (in Romanian).

PAUL‐TEODOR HĂRĂGUŞ, MARIA ROTH, DIANA DAMEAN
32
In order to do so, the research team has chosen The School Success Profile, an evaluation instrument developed by the University of North Carolina at Chapel Hill (USA) to be validated in Romania. The School Success Profile (SSP) is a powerful and comprehensive assessment tool for middle and high school students, providing school, class and individual profiles of social and individual factors that influence school performance. The adaptation process went through several stages which will be presented in this study.
Theoretical background
In the first stage, the theoretical background of the instrument was scrutinized from the perspective of its applicability to Romanian educational practice. The instrument was built on an eco‐interactional developmental perspective of school success (Bowen, 2009). This theory is anchored in Bronfenbrenner’s (1979) (bio)ecological theory on the contextual nature of human development, on studies of child and adolescent risk and resilience factors (Fraser, 1997; Fraser and Allen‐Meares, 2004), and also on studies regarding the effect of resource‐factors and protective‐factors on children and adolescents (Scales et al., 2006; Richman and Fraser, 2001). From this perspective, it is assumed thatthe balance of risk and protective factors that students experience in their social environments influences the level of success they experience in school and in life (Bowen, Rose and Bowen, 2005).
Bronfenbrenner’s ecological theory (1979) describes the developmental process as an interaction of several subsystems: the microsystem (the direct relation of the individual with immediate family, people in the neighborhood, teachers in the school, members of the peer‐group etc.); the mesosystem (meaning the system of relations between microsystems, as for example parents relations with teachers, that directly influence children’s educational outcomes); the exosystem (experiences in a social setting in which an individual does not have an active role, but which nevertheless influence the experience in an immediate context, for example the influence of parents’ career situation in relation to the child’s experiences about parent support); macrosystem (or the social‐economic‐cultural context in which individuals live); and the chronosystem (the patterning of environmental events and transitions over the life course). The SSP takes into consideration factors of the microsystem (neighborhood, school, family, and friends), individual health factors, psychological factors (self‐esteem, personal adjustment, school engagement), and the dimensions of school success (grades, trouble avoidance, school engagement). It also considers factors of the second level of the ecological analysis, the mesosystem, as it is focused on the relation between elements of the microsystem: neighborhood and peer‐group attitudes; and the parent‐school relation (to what extent are

THE MEASUREMENT OF THE SOCIAL DIMENSIONS OF SCHOOL SUCCESS – A VALIDITY STUDY …
33
parents involved in the school environment, for example in meeting with teachers) (Richman and Bowen, 1997). The focus is not equally oriented toward other social systems, but they are not totally ignored. For example, some aspects of the exosystem are considered in analyzing the school success and the employment of parents. The macrosystem is present in SSP research through the demographic and institutional aspects implied by the analysis of school success, namely issues such as poverty, ethnicity, urban or rural location of the school, parents’ educational and professional status.
The Romanian experts included in the research team considered that these levels of analysis are applicable to the Romanian context as they were also supported by previous studies. For example, Agabrian and Millea (2005) examined the role of parent support in children’s school achievement based on Epstein’s theory of the intersection of the influence spheres and built a model that included parenting, home support for learning, parents’ involvement in volunteering activities and in decision making in schools, their involvement and collaboration to solve community issues, and overall communication between parents, schools and communities.
The eco‐interactional developmental perspective considers resilient school‐children to be able to use their resources to address their needs, and to function successfully at school. School difficulties appear when there are discrepancies between children’s resources and their needs. According to their results, Richman, Bowen and Woolley (2004) insist on the difficulties for a child to develop protective factors in unpredictable and chaotic environments in which the needs of school‐children are not satisfied or there is no balance between requirements and competences. This occurs, for example, when the requirements of the educational system are too high, thus generating frustration and uncertainty in one’s own abilities, or, on the contrary, too low, thus causing loss of interest and discontent with school. As previous Romanian research results show (Miclea, 2005; Jigău et al 2002) within the Romanian education system, structural inequalities are a risk factor for the balance of needs and resources, as well as that of requirements and competences and a risk for children’s participation in the schooling process. As a result, in Romania children from rural areas have a significantly lower rate of school success than children from urban areas. According to the Presidential Report on Education (Miclea, 2005), half of the rural graduates of the lower secondary education (11‐14 year‐olds) do not succeed at national tests and do not obtain a diploma of competences at graduation. Thus, our research team considered it is relevant to follow this pathway when analyzing the school trajectories of children at risk and elaborate profiles of social dimensions that influence school involvement.

PAUL‐TEODOR HĂRĂGUŞ, MARIA ROTH, DIANA DAMEAN
34
Previous Romanian studies have already highlighted some other social‐contextual factors that impact school achievement. For example, Tufiş (2008) and Agabrian (2008) analyzed the role of parenting and community on school performance. Another research theme was ethnicity, showing the risks Roma students face as a result of social deprivation and exclusion (Jigău et al 2002). Other recent research is focusing on the organizational and institutional characteristics of the schools, indicating that school context (like the quality and the intensity of the cooperation between students and teachers, between teachers themselves, the distribution of material resources, facilities and human resources) has a significant impact on academic results (Hatos, 2008).
These previous researches reinforced our decision of selecting a comprehensive instrument that structures individual and social, proximal and distal, independent and dependent dimensions of education. When choosing the SSP an important argument was its appropriate design to serve evidence‐based practice, in which school intervention is based on research and on empirical results. Thus, SSP can be seen as a bridge between theory and practice (Powers, Bowen and Rose, 2005). The instrument allows social diagnose, by pointing to the factors that need correction. Once the social conditions become more favorable for children, their personal opinions toward school and their well‐being also improve, hopefully resulting in higher school performance. The interaction theory of school success states that improvement of distal results is possible by changing the antecedents to school success. The efficiency of the SSP was repeatedly praised as an essential element of a comprehensive research based intervention method (Corcoran, 2005; Early, 2001; Franklin, 2004; Galassi and Akos, 2007; Rouk, 2000; Woolley et al, 2004).
Translation of the SSP
In the second stage of the research process our team focused on the SSP dimensions, their accurate translation, and the clarification of items for the Romanian population. After translating the SSP into Romanian and into Hungarian, the two versions were compared. This generated a process of double checking of translations and verification of cultural correspondence and comprehensibility by students. We organized 7 focus groups with school‐children and 2 with experts (teachers and school counselors) and discussed their understanding of the dimensions of the social environment and of the individual characteristics as translated into the Romanian and Hungarian version. Most discussions were centered on the issues of safety in neighborhoods, the ways to define poverty of families, as well as the description of school success. We have decided to exclude the questions related to weapons, and use different words for the terms not entirely understood by students. For example gang was translated with its Romanian term (banda), while in measuring poverty we used several questions that try to clarify the social strata in which the students
THE MEASUREMENT OF THE SOCIAL DIMENSIONS OF SCHOOL SUCCESS – A VALIDITY STUDY …
35
live. Due to experts’ feed‐back we ended up including more questions than the original survey, which also extended the duration of completion and caused difficulties to the younger participants in our research. Future revisions are needed for reducing the items with lower relevance. In spite of the mentioned changes, the questionnaire kept the original 26 dimensions related to students’ social environment and individual adaptation. Each dimension was measured by a scale consisting of several items. The 18 dimensions of social environment were labeled and defined as assets that students need for healthy development and school success. The 8 dimensions of individual adaptation were positively worded and were defined as attitudinal and behavioral indicators that evidence healthy development and success at school. In line with SSP, both the Romanian and the Hungarian version do not include questions about illegal behavior, substance abuse, sexual activities, or issues of child abuse and neglect that may place students and families in self‐incriminating situations.
The 26 dimensions of the SSP are organized on three levels: distal results (indicators of school performance, indicators of behavior, and indicators of attitudes toward school), intermediate results (indicators of personal opinions and indicators of well‐being) and proximal results (indicators for community, school, friends and family). Distal and intermediate results are a direct consequence of physical, psychological and support needs of children and also are influenced by contextual factors. The proximal results, being connected to the community, family, school and friends, are targeted by prevention and intervention programs.
After a thorough analysis in the expert groups, we decided to adopt the definition of school failure and success according to the definitions given by the authors. As Richman, Bowen and Woolley (2004) describe, although the most severe form of school failure is dropping‐out, it is still possible that some children attend school without being unable to fulfill the formal requirements of the curricula. Therefore we adopted the authors’ definitions and we included in the survey the concept of school failure as encompassing both the physical absence and the psychological absence and low school performance. Richman and Fraser (2001) define school risk as the presence of certain factors that cause a high probability in children to display negative behaviors. These risk factors can be individual (e.g. ADHD, choleric temperament) or ecological and contextual (e.g. parents’ divorce, the death of one parent, a high crime rate in the neighborhood, poverty etc.). In order to prevent school failure it is necessary to identify those risk factors that significantly correlate to low school performance. If school failure is analyzed through a contextual frame (family, peer‐group, school, community) rather than from a demographic perspective, we can identify a broader range of risk situations. We are not only focused on the aspects of the social environment that are associated to school failure, but also on the categories of students who are more exposed to risk.
PAUL‐TEODOR HĂRĂGUŞ, MARIA ROTH, DIANA DAMEAN
36
On the other hand, protective factors refer to students’ ability to overcome risk situations and to achieve school success, even in a less favorable environment. Such protective factors are: social competencies (flexibility, empathy, the ability to establish and maintain friendship relations), autonomy (self‐esteem, self‐discipline, self‐regulation, personal efficiency) or contextual factors (school safety, neighborhood safety, family support, adult support).
As in the original version, the first page of the questionnaire is an introduction that describes the instrument and guarantees confidentiality of data. Respondents need to fill in their school enrolment number, thus allowing researchers to identify them and compare their profiles over time. The research team has access only to the unique enrollment number, while the school’s administrations have access to the name of the student.
Objectives
The current study examines the statistical relevance of the 26 core dimensions in the Romanian version of the SSP in order to give professionals who work in the field of education useful information about the validity of the instrument. Validating the SSP in Romania and analyzing the impact of its social dimensions on school achievement is not only important for social research per se, but also it is an opportunity for developing further social policies and for selecting appropriate intervention programs. The SSP is both an instrument for basic research and an applied research tool for assessing children’s evolution during school years and evaluating the progress they make as a result of intervention programs.
Method
Source of Data
The validity analyses were based on the results of a survey carried out on a nationally representative sample The SSP Ro, is a self‐report survey, were student voluntarily answered to approximately 300 multiple‐choice questions. The survey takes about 30 minutes to complete (for high‐school students) and 45‐55 minutes for middle‐school children.
Data Collection Procedures
The project research team constructed a multi‐stage stratified random sample of middle and high school classes of pupils, who constituted the clusters of subjects to take part in the survey. The selection of classes is representative for the eight developmental regions (corresponding to the NUTS‐II EU classification) and the urban‐rural distribution of schools within

THE MEASUREMENT OF THE SOCIAL DIMENSIONS OF SCHOOL SUCCESS – A VALIDITY STUDY …
37
regions3. Because the Romanian school system has a tracking characteristic (it assigns students in high‐school according to tests and grades) it was considered important to take into account the theoretical/vocational divide. The construction of the sample was done in two steps: first, a sample of 67 schools public schools (special education schools and private owned schools were excluded from the analysis4) was selected from 11 counties (Argeş, Bistrița‐Năsăud, Cluj, Covasna, Galați, Iaşi, Mureş, Neamț, Sibiu, Timiş, Vâlcea) and the city of Bucharest. In the second step the students were sampled by entire classrooms and not individually (thus creating a cluster sampling), of at least two classes by institution. The response rate for the initially targeted schools is 95%, higher than the targeted response rate of 85% of the PISA 2003 study (OECD, 2005). The response rate for the individual students is over 90%, calculated by summing the cases where there was a refusals to complete the questionnaire and the cases eliminated due to a higher non‐response rate (more than 33% of the questions left unanswered).
Our final sample consists of 2695 middle‐school (aged 11‐14) and high‐school (aged 15‐18) students, who completed the questionnaire. Data were collected between October 2008 and January 2009 by a team of field researchers that consisted of faculty staff, PhD students, MA students and teachers, every one of them from outside the selected schools.
Sample Description
Students in the sample were nearly evenly distributed by gender: 54.4% female and 45.5% were in middle‐school (in 2007, at the national level 47.75% were enrolled in middle‐school). This difference can be attributed to the increased difficulty for middle‐school students to complete the questionnaire (and the process of eliminating incomplete questionnaires). 72.7% of the students were enrolled in schools in urban areas, a number that is similar to the national figures (72.87%). As mentioned before, the sample is representative for the urban‐rural distribution of schools, not of students. It sometimes happens that students from rural areas attend schools from urban areas, some of them commuting on a daily basis, others living in student dormitories or in private accommodation. We were interested in the effects of being enrolled in an urban versus rural school, not in the effects of students’ residence per se.
3 In Romania “urban area” is defined by national standards (certain localities which have the status of towns or citites); they are further divided into “municipalities” (larger) and “towns” (smaller). Rural localities (villages) are divided in two categories: the administrative centre of the area (“centre of commune”) and the belonging villages.
4 In 2001, under 1% of the students were enrolled in private education in Romania (Miclea, 2005).

PAUL‐TEODOR HĂRĂGUŞ, MARIA ROTH, DIANA DAMEAN
38
Table 1.
Sample description (N=2695)
Demographic variable % Gender
Female 54.4 School location
Urban 72.7 Ethnicity Romanian 89.3 Hungarian 9.2 Roma 1.3 School Middle school 45.5 Recipient of social benefits 22.3
A measure that tried to evaluate the economically disadvantaged students was constructed: the students were asked if they receive any of the following: social scholarship or other types of benefits from public or private funds. The results were that 22.3% of the students reported being in this situation. Since in all these cases the recipient is the child and the benefits are means‐tested (taking into consideration the family income) we can say that this is a proxy for economically disadvantaged students but we are aware of the difficulties to equate such measure with the “at‐risk‐of‐poverty” threshold used by Eurostat.
Regarding the ethnicity of the students 89.3% of the children in the sample are Romanians, 9.2% Hungarians and 1.3% Roma (and 0.2% other ethnic groups). While the sample estimates correctly the proportions of Romanians5 the number for Hungarians are inflated6 while the numbers of Roma children is much lower (existing residential segregation might explain this, Roma children being over‐represented in schools from marginalized rural settings – see Fleck and Rughinis, 2008). Thus we raise a caution in the use of “ethnicity” for evaluating the situation of Roma children.
Measures
Following the work of Power, Bowen and Rose (2005) we will use three types of measures. First we use five of the already mentioned demographic variables: gender (0 for female, 1 for male), school location (0 for rural, 1 for
5 In the 2002 Census there were 89.6% Romanians, 5.7% Hungarian and 4.7% Roma children reported (0‐19 years).
6 This procedure was done intentionally, for analytical purpose e.g. comparing the validity of the instrument in the two languages: Romanian and Hungarian, although this will not be done in this paper.

THE MEASUREMENT OF THE SOCIAL DIMENSIONS OF SCHOOL SUCCESS – A VALIDITY STUDY …
39
urban), ethnicity (1 for Romanian and Hungarian, 0 for other), school level (0 for middle school and 1 for high school) and the social benefits recipient status (0 for no, 1 for yes).
The second type of variables will be the eight individual adaptation dimensions, further divided in a group of three variables that describes the school attitudes and behaviors (school engagement, trouble avoidance and grades) and five personal beliefs and well‐being factors (physical health, self‐esteem, adjustment, optimism and social support use).
The last type of variables consists of 18 social dimensions, each of these trying to evaluate the risk and protective factors of the student environment. The second and the third types are composites measures, constructed using multiple survey items. Every item is positively coded (thus indicating a desirable situation) and the construction of each variable was done by summing up the responses.
Data Analysis
For the examination of the psychometric properties of the SSP we used the path set by Bowen, Rose and Bowen (2005). First, we performed a descriptive analysis of the 26 dimensions (see Table 2); in the second stage we studied the internal consistency of the items using the Cronbach’s alpha indicator. For the final stage we used a multi‐steps approach: in the first we performed a confirmatory factor analysis, where all the items constituting each scale were forced to load on one factor representing that dimension. In conjunction with this method we also used an oblique rotation in case that multiple factors were retained, the loading criterion for an item being .40 in both cases. The second step consisted of calculating the Pearson correlations coefficient at the dimensions level, looking at how dimensions from the same domain correlate with each other. We expected that in the same domain the scales will correlate at a “medium” level, which means that 16% of the variance is shared (Cohen, 1988) and that across domains correlation will be smaller (the Pearson correlation being smaller than .40). For the purpose of this analysis no treatment of missing data was conducted on the data.
In the second part of the analysis we conducted a two‐step linear regression. In the first step, each of the eight individual adaptation dimensions was regressed on the five demographic variables: gender, ethnicity, residence, school level and social benefit recipient. In the second step the 18 social environments factors were added to the analysis as supplementary explanatory variables. Our intention is to compare the amount of variance explained in the first step with the variance explained after the introduction of explanatory factors. Standardized beta coefficients were used, as the square of these can be interpreted as the proportion of variance that is uniquely shared between the individual factors and the respective social dimension factors. Colinearity

PAUL‐TEODOR HĂRĂGUŞ, MARIA ROTH, DIANA DAMEAN
40
diagnosis shows that only 4 items7 in the analysis have a variance inflation factors (VIF) between 2 and 2.67, thus allowing us to conclude that colinearity is low. Given that at this stage we focus on data exploration, we have decided to test with the help of multilinear regression models the individual direct effects of each potential predictor, and decide upon the solution for the multi‐colinearity problem after some further investigations of the data. Table 9 contains the synthesized results. For this part of the analysis, in order to have comparable results over the eight linear regressions, we eliminated every case where a missing value was present in the 31 variables, thus the final sample consists of 1713 students. It is important to note here that a preliminary analysis of the eliminated cases shows that they are not random in population, and that we have a systematic situation where students being boys, from rural schools, from middle‐school, with Roma ethnicity and recipient of social benefits are found more often in this group. This situation requires a missing data analysis that will be done in another article.
Table 2.
School success dimensions reliability assessment
Mean Std.
deviation Min. Max. Alpha
Cronbach’s 1. Neighborhood support 3.65 2.43 0 7 0.83 2. Neighborhood youth behavior 6.95 1.85 0 9 0.66 3. Neighborhood safety 7.10 1.51 0 8 0.76* 4. Learning climate 5.86 2.16 0 8 0.78 5. School satisfaction 4.74 2.18 0 7 0.80 6. Teacher support 5.05 2.60 0 8 0.83 7. School safety 36.90 7.52 24 48 0.93* 8. Academic relevancy8 29.71 6.92 11 44 0.89 9. Academic rigor9 29.49 0.12 10 40 0.88 10. Personal safety in school (micro‐interactions)10 13.46 4.70 5 20 0.88*
7 In the eight linear regressions, the following factors had a VIF between 2 and 2.67: learning climate, academic rigor, academic relevancy and parent support.
8 Academic relevancy: Respondents consider that things they learn at school are relevant for their future career and that their teachers often make links between what they teach in class and possible workplaces. (ex. My teachers help me make a link between what I learn in class and possible employment or career).
9 Academic rigour: Respondents consider that their teachers help them obtain better results, they have high standards and they stimulate them to think (ex. My teachers give me assignments that make me think).
10 Personal safety in school (microinteractions): Respondents do not feel discriminated, excluded or mistreated at school (ex: Someone at school treated me with disrespect).

THE MEASUREMENT OF THE SOCIAL DIMENSIONS OF SCHOOL SUCCESS – A VALIDITY STUDY …
41
Mean Std.
deviation Min. Max. Alpha
Cronbach’s 11. Friend support 12.94 2.41 5 20 0.88 12. Peer group acceptance 20.07 2.89 8 24 0.73 13. Friend behavior 23.10 3.25 9 27 0.82 14. Family togetherness 8.97 2.81 7 21 0.89 15. Parent support 12.60 2.59 5 15 0.85 16. Home academic environment 6.40 1.73 0 8 0.74* 17. Parent education support 4.69 1.59 0 6 0.74 18. School behavior expectations 26.98 5.63 11 46 0.91 19. Physical health 22.52 3.22 9 27 0.77 20. Self esteem 13.33 2.11 5 15 0.83 21. Optimism 37.48 6.46 12 48 0.87 22. Social support use 5.25 2.35 0 8 0.80* 23. Adjustment 14.86 2.84 6 18 0.82* 24. School engagement 7.27 1.42 3 11 0.68 25. Trouble avoidance 28.89 3.54 11 33 0.80 26. Grades 11.11 2.19 3 15 0.62
* Alpha Cronbach slightly increases if some of the items are eliminated
Validity results
Table 2 presents some elements of descriptive analysis regarding the dimensions of the School Success Profile: the mean, the standard deviation, the minimum and maximum values as well as the result of the fidelity analyses (internal consistency reliability).
It is noteworthy that for all the 26 dimensions, the reliability coefficients were higher than what is commonly considered as minimally acceptable (0.60) in aggregate analysis with large samples (Rosenthal, 1994, cited in Bowen, Rose and Bowen, 2005). According to this classification, minimally acceptable values (between 0.60 and 0.70) were obtained only for three dimensions (Grades, School engagement and Neighborhood youth behavior), whereas the alpha values can be considered to be fair (between 0.70 and 0.80) for seven dimensions, good (between 0.80 and 0.85) for fifteen dimensions and very good (between 0.90 and 0.95) for two dimensions.
We have low alpha values only for two dimensions, school engagement and grades, comprising of a low number of items (only 3), as the fidelity measure tends to register higher values when there are more factors involved. Consequently, it is not expected to have high internal consistency. However, in the case of „neighborhood youth behavior”, the alpha value can be significantly increased (up to 0.74) by eliminating the question: “as far as you know, how often young people from your neighborhood happen to do the following: find a job or go to college after completing highschool?”

PAUL‐TEODOR HĂRĂGUŞ, MARIA ROTH, DIANA DAMEAN
42
Individual adaptation
We will now discuss the individual adaptation factors, also referred to as distal results: the indicators of school performance (or grades), of deviant school behavior (trouble avoidance) and of attitudes towards school (school engagement). Other dimensions included in this category are the intermediate results (personal belief and well‐being indicators): physical health, self‐esteem, optimism, adjustment and social support use. Most correlations can be considered low (under 0.30) or medium (between 0.30 and 0.50), while one single correlation was strong (0.51).
Table 3.
Individual factors
1 2 3 4 5 6 7 8
1 Physical health 1 .22 .52 .12 .11 .09 .20 .11 2 Self esteem 1 .30 .42 .35 .19 .12 .15 3 Adjustment 1 .19 .17 .08 .17 .15 4 Optimism 1 .36 .28 .24 .30 5 Social support use 1 .14 .12 .18 6 School engagement 1 .24 .14 7 Trouble avoidance 1 .40 8 Grades 1
Note: All correlations are significant at the 0.01 level
Confirmatory factor analysis shows that all factors are loaded as expected, except for „trouble avoidance”, where several questions had low factor loadings (for values of under 0.4). This situation, that was recurrent in the case of other behavior evaluations (friend behavior or neighborhood youth behavior) shows that students distinguish as different the school oriented behavior and the legal oriented behavior.
Table 4. Neighborhood
1 2 3
1 Neighborhood support 1 0.321 0.123 2 Neighborhood youth behavior 1 0.417 3 Neighborhood safety 1
Note: All correlations are significant at the 0.01 level

THE MEASUREMENT OF THE SOCIAL DIMENSIONS OF SCHOOL SUCCESS – A VALIDITY STUDY …
43
Neighborhood
The second domain considered is neighborhood, defined as the part of the town/village the student lives in. As we can see in Table 4, the items are positively coded, higher values meaning a safer environment that helps and supports the student and his/her academic performance and protects him/her against certain disturbing factors that can lead to school failure. Berman et al (1996), Bowen, Richman and Bowen (1998), Bowen and Bowen (1999) have shown that certain characteristics of the community can influence individual dimensions, such as trouble avoidance at school (school deviance).
Neighborhood safety was correlated with neighborhood youth behavior, the average scores showing that students often evaluate neighborhood characteristics based on the behavior of their peers. Factor analysis shows all factors loaded as expected, except for „neighborhood youth behavior” (as stated early in this paper).
School
The third domain we analyzed is school, allowing us to identify several aspects of school environment that can have positive effects on school adjustment. First, students were asked to evaluate school safety in general, then their personal safety in school (if they have been victims of violence, verbal or physical aggression etc.) and the learning climate. The following items focus on students’ evaluation of their teachers, stating whether they receive support from them, whether there is a high level of academic rigor (whether the teachers have high standards, whether they ask question that make them think etc.), whether there is academic relevancy for the student (whether the teachers are interested in the student’s career choices, their future employment, whether the teachers make a connection between things learned in class and the surrounding world) etc.
Table 5. School
1 2 3 4 5 6 7 1 Learning climate 1 0.56 0.61 ‐0.04+ 0.59 0.17 0.54 2 School satisfaction 1 0.54 ‐0.06 0.44 0.26 0.50 3 Teacher support 1 ‐0.06 0.63 0.15 0.70 4 School safety 1 ‐0.11 0.12 ‐0.11 5 Academic relevancy 1 0.07 0.66
6 Personal safety in school (Micro interaction) 1 0.07
7 Academic rigor 1
Note: + p<0.1; for all other variables p< 0.01

PAUL‐TEODOR HĂRĂGUŞ, MARIA ROTH, DIANA DAMEAN
44
Factor analysis shows that all items loaded as expected on the hypothesized factor (values above 0.40), except for „teacher support”, where some items are overlapping the factor „learning climate”.
Table 6. Peer group
1 2 3
1 Friend support 1 0.16 0.12 2 Peer group acceptance 1 0.17 3 Friend behavior 1
Note: All correlations are significant at the 0.01 level
Peer Group
The fourth domain addressed was that of the „peer group”, measuring friend support, peer group acceptance (or resistance to peer group pressure) and friend behavior. The inter‐correlations (Table 6) show weak relation inside this domain.
Family
The last domain considered was family. Dimensions within this domain have shown a high correlation with individual adaptation dimension in prior SSP analyses. The factors we analyzed were: family togetherness (if the relationships between grown‐ups and between grown‐ups and children are warm and functional), parent support (if the parents show positive feelings or appreciation towards the children), home academic environment (if the adults show interest towards school learning subjects and their aspects), parent education support (encouragement for good results at school but also help with homework or different projects) and school behavior expectations (to what extent would grown‐ups be upset if their child had deviant behavior at school, received low grades etc.).
Table 7. Family
1 2 3 4 5
1 Family togetherness 1 0.60 0.33 0.40 0.16 2 Parent support 1 0.43 0.52 0.12 3 Home academic environment 1 0.43 0.19 4 Parent education support 1 0.13 5 School behavior expectations 1
Note: All correlations are significant at the 0.01 level

THE MEASUREMENT OF THE SOCIAL DIMENSIONS OF SCHOOL SUCCESS – A VALIDITY STUDY …
45
The correlations from table 7 show more medium scores (above 0.30) than for other factors, whereas the validity analysis shows that factors are loaded according to expectations (values ranging from 0.40 to 0.90).
Correlation matrix
The last part of the analysis contains the presentation of correlations between the 18 factors of social dimensions and the 8 factors of individual adaptation, that is, between proximal and distal factors. Table 8 shows that all correlations between these factors are significant (especially because of the large sample). We highlighted the medium ones (with values higher than 0.30 that can be interpreted as uniquely sharing over 9% of the variance). The result shows that there is a great impact of school factors on school engagement and on school trouble avoidance, as well as the impact of family factors on optimism or on self‐esteem. Grades (or the students’ academic performance) correlate poorly with the factors presented here.
Results and discussions: The intervention matrix
The analysis results are organized in an intervention matrix for practitioners (Table 9). The matrix links the 18 SSP social environment dimensions (represented in the rows of the table) with the eight SSP individual adaptation dimensions (represented in the columns of the table), in order to determine the social environment dimensions that are most influential for student outcomes in the sample population. Standardized beta weights are included in the cells of the matrix. The matrix also reports the variance explained in step 1 of the multiple regression model (which includes only demographic variables) and in step 2 (which is the full model and includes both demographic variables and social environment dimensions). The last row of the table reports the R square change in the models for each individual adaptation outcome – the unique variance explained by the set of social environment dimensions, beyond the five demographic variables. The results are reported to correspond to the distinction between intermediate results (personal beliefs and well‐being) and distal results (school attitudes and behavior and academic performance). In presenting the results for the eight individual adaptation dimensions, we will only focus on the SSP dimensions that met or exceeded the .09 effect size cutoff, on the statistically significant counterintuitive findings for the effects of the SSP dimensions, and on the statistically significant demographic variables. Table 9 includes the full results for each regression analysis, with highlighted SSP dimensions and demographic variables that meet or exceed the .09 cutoff. In this article results are briefly presented. Several of our finding need further research. In further publications we shall find opportunities to compare our results with those of the original SSP and discuss the differences and similarities according to the literature.

Table 8.
Bivariate correlations between the social environment profile and the individual factors.
Personal Beliefs and Well‐Being
School Attitudes and Behavior
Physical
health
Self
esteem
Adjustment
Optimism
Social support
use
School
engagement
School trouble
avoidance
Grades
Neighborhood support
0.14
0.30
0.14
0.29
0.39
0.24
0.17
0.07
Neighborhood youth behavior
0.21
0.15
0.17
0.14
0.17
0.19
0.27
0.15
Neighborhood safety
0.28
0.13
0.19
0.12
0.11
0.18
0.35
0.22
Learning climate
0.17
0.18
0.14
0.26
0.22
0.38
0.30
0.14
School satisfaction
0.17
0.30
0.17
0.36
0.28
0.47
0.35
0.20
Teacher support
0.21
0.21
0.17
0.35
0.29
0.36
0.28
0.21
School safety
0.06
‐0.06
0.12
‐0.06
‐0.07
‐0.07
‐0.06
0.03
Academ
ic relevancy
0.16
0.13
0.08
0.31
0.22
0.36
0.21
0.05
Academ
ic rigor
0.15
0.20
0.09
0.42
0.30
0.36
0.27
0.20
Personal safety in school (M
icro interactions)
0.13
0.06
0.13
0.20
0.13
0.15
0.17
0.19
Friend support
0.14
0.19
0.18
0.21
0.25
0.05
0.09
0.19
Peer group acceptance
0.20
0.15
0.27
0.14
0.12
‐0.05
0.12
0.15
Friend behavior
0.24
0.05
0.22
0.12
0.10
0.22
0.41
0.20
Family togetherness
0.18
0.42
0.24
0.33
0.34
0.17
0.20
0.12
Parent support
0.14
0.36
0.26
0.32
0.40
0.16
0.16
0.14
Hom
e academ
ic environment
0.02
0.23
0.09
0.25
0.31
0.15
0.13
0.19
Parent education support
0.09
0.23
0.17
0.22
0.31
0.17
0.10
0.04
School behavior expectations
0.05
0.08
0.02
0.16
0.19
0.11
0.16
0.22
Note: Correlations scores higher than 0.3 are bolded.
THE MEASUREMENT OF THE SOCIAL DIMENSIONS OF SCHOOL SUCCESS – A VALIDITY STUDY …
47
Distal Results: School Attitudes, Behavior and Academic Performance
The SSP individual adaptation dimensions included in school attitudes and behavior were school engagement, trouble avoidance, and grades. The demographic variables accounted for a relatively small amount of the variance in these individual adaptation dimensions (3.9% to 12.9%). The total variance explained by the combined model of demographic variables and social environmental dimensions ranged from 21.4% to 33.6% across these three dimensions. The component of R square change attributed entirely to the social environment dimensions ranged from 14.2% to 24%. School Engagement
Standardized beta coefficients of the social environment dimensions were above .09 and represented moderate effect sizes for the case of school satisfaction (.308) and academic relevancy (.094). Increases in these two dimensions paralleled increases in the levels of school engagement. An unexpected finding involved peer group acceptance (‐.094): the higher the peer group acceptance, the lower the level of self‐reported school engagement. Also, being female (‐.081) and being enrolled in a rural school (‐.052) were both associated with higher levels of school engagement. Trouble Avoidance
Four of the social environment dimensions had standardized beta coefficients above .09: friend behavior (.224), micro interactions (.137), school satisfaction (.128) and neighborhood safety (.108). Increases in these dimensions were associated with higher levels of trouble avoidance. Counterintuitive findings involved parent educational support (‐.085) and friend support (‐.061), although with small effects: the more positive these social environment dimensions, the lower the level of self‐reported trouble avoidance. In what concerns the demographics, being in middle school (‐.179), being female (‐.132), being Romanian or Hungarian (‐.068) and in urban schools (.065) were all associated with higher levels of reported trouble avoidance. Grades
Standardized beta coefficients were above the threshold of .09 for the following social environment dimensions: teacher support (.199), home academic environment (.123), school behavior expectations (.108), school satisfaction (.104), academic rigor (.103), parent support (.099), neighborhood safety (.099), school safety (.094). All these dimensions were associated with higher grades. Unexpectedly, dimensions like academic relevancy (‐.182), micro interactions
PAUL‐TEODOR HĂRĂGUŞ, MARIA ROTH, DIANA DAMEAN
48
(‐.084), parent educational support (‐.076) and neighborhood support (‐.066) were associated with lower grades. Furthermore, being female (‐.136), being in urban schools (.128), being Romanian or Hungarian (‐.099) and receiving social benefits (.050) were all associated with higher grades. Intermediate Results: Personal Beliefs and WellBeing
The SSP individual adaptation dimensions included in the personal beliefs and well‐being section are: physical health, selfesteem, adjustment, optimism and social support. The demographic variables alone accounted for a relatively small amount of the variance in these individual adaptation dimensions (1.5% to 6.8%). The total variance explained by the full model of demographic variables and social environment dimensions together ranged from 25.5% to 31.3% across these five dimensions. The component of R square change attributed entirely to the social environment dimensions ranged from 18.8% to 29.8%. Physical Health
The standardized beta coefficients in the equation predicting social support were above the threshold of .09 for both micro‐interactions in school (.196) and neighborhood safety (.153), indicating moderate effect sizes. In the context of these assets, students reported higher levels of physical health. In addition, being male (.304), being in middle school (‐.136) and in urban schools (.056) were all associated with reports of better physical health. SelfEsteem
Family togetherness (.240), school satisfaction (.166), parent support (.096) and peer group acceptance (.090) were all above the threshold of .09. Increases in self‐esteem paralleled increases in all these dimensions. A counterintuitive finding involved positive friend behavior: although the effect was smaller (‐.074), the more positive the reported friend behaviors, the lower the level of respondents’ self‐esteem. After controlling for the SSP dimensions, the gender variable (previously without a significant effect) turns out to have a medium effect on the self‐esteem (.094). Adjustment
The following standardized beta coefficients of the social environment dimensions were above the moderate effect cutoff of .09 for personal adjustment: parent support (.195), peer group acceptance (.174), micro interaction (.127), teacher support (.110) and friend behavior (.104), each one having a positive association with personal adjustment. Counterintuitive findings involved academic

THE MEASUREMENT OF THE SOCIAL DIMENSIONS OF SCHOOL SUCCESS – A VALIDITY STUDY …
49
rigor and school behavior expectations. Thus, the higher the academic rigor (‐.114), the lower the self‐reported level of adjustment. Although the effect was rather small (‐.064), the higher the school behavior expectations of the parents is associated with a lower the level of adjustment. Students reporting higher levels of adjustment were boys (.309), enrolled in school in urban areas (.088) and in middle school (‐.056).
Optimism
Four of the social environment dimensions had standardized beta coefficients that represent moderate effect sizes. These included academic rigor (.237), school satisfaction (.150), family togetherness (.117) and peer group acceptance (.110). Increases in optimism corresponded with increases in these dimensions. A counterintuitive finding involved the micro interactions in school: the higher the level of micro interactions, the lower the level of respondents’ optimism; however, the effect was small (‐.058). Also, being enrolled in an urban school (.088) or not being a social benefit recipient (‐.054) were all associated with higher levels of reported optimism.
Social Support
The standardized beta coefficients for five of the social environment dimensions had medium effects: this include neighborhood support (.195), parent support (.161), friend support (.131), parent educational support (.118), academic rigor (.114) and home academic environment (.102). As expected, increases in social support paralleled increases in these five dimensions. Also, girls (‐.044) and middle school students (‐.078) and those students enrolled in urban schools (.060) reported statistically significant higher levels of social support than their counterparts.
Discussion
The intervention matrix, theoretically constructed and empirically tested showed that many of the social dimensions were significant predictors or the school attitudes and behavior or for the personal beliefs and well‐being of Romanian students. Some of this dimensions, however, had stronger effect than others: school satisfaction, academic rigor, peer group acceptance or parent support had moderate association with many of the individual outcomes, while neighborhood youth behavior or learning climate were among the poorest predictors.
The study showed that school dimensions had more medium sized predictors, an expected finding on school attitudes and behavior but these effects were also on personal beliefs and well being dimensions. The only exception

PAUL‐TEODOR HĂRĂGUŞ, MARIA ROTH, DIANA DAMEAN
50
here is self‐esteem, where the school domain had no predictors and, even if school satisfaction (.166) might look as an exception, it is more likely that this is happening because of the cross‐sectional design of the study that hides a possible inverse relation. Also peer and family domain have also many scales that had effects on individual outcomes.
Some SSP dimensions were found to have a negative effect on individual outcomes, a result that is, at least, counterintuitive. We will note here that parent education support is negatively related to both trouble avoidance and grades (see table 9) and, interesting for us, this results were also encountered in the original SSP research (Powers, Bowen and Rose, 2005: 183). Their explanation for this phenomenon stresses the cross‐sectional nature of the data and possible situations where parents start getting involved in children’s school situation when they perceive that they have problems at school.
As expected, the demographic characteristics have also effects on the individual outcomes: being in high‐school had a negative effect on most results, while boys have reported better well‐being and personal beliefs and more negative school attitudes and behavior characteristics.
The intervention matrix, theoretically constructed and empirically tested showed that many of the social dimensions were significant predictors or the school attitudes and behavior or for the personal beliefs and well‐being of Romanian students. Some of this dimensions, however, had stronger effect than others: school satisfaction, academic rigor, peer group acceptance or parent support had moderate association with many of the individual outcomes, while neighborhood youth behavior or learning climate were among the poorest predictors.
The study showed that school dimensions had more medium sized predictors, an expected finding on school attitudes and behavior but these effects were also on personal beliefs and well being dimensions. The only exception here is self‐esteem, where the school domain had no predictors and, even if school satisfaction (.166) might look as an exception, it is more likely that this is happening because of the cross‐sectional design of the study that hides a possible inverse relation. Also peer and family domain have also many scales that had effects on individual outcomes.
Some SSP dimensions were found to have a negative effect on individual outcomes, a result that is, at least, counterintuitive. We will note here that parent education support is negatively related to both trouble avoidance and grades (see table 9) and, interesting for us, this results were also encountered in the original SSP research (Powers, Bowen and Rose, 2005: 183). Their explanation for this phenomenon stresses the cross‐sectional nature of the data and possible situations where parents start getting involved in children’s school situation when they perceive that they have problems at school.

Table 9.
The TwoStep Linear Regression Results
School Attitudes and Behavior
Personal Beliefs and WellBeing
School
Engagement Trouble
Avoidance Grades Physical
Health
Self
Esteem
Adjustment Optimism
Social
Support Use
1st Step Results
1. Gender (1 ‐ m
ale)
‐.135**
‐.240**
‐.189**
.205** .044
.214**
‐.078**
‐.097**
2. School level (1 ‐ high school)
‐.031
‐.257**
‐.116**
‐.168** ‐.138**
‐.100**
‐.174**
‐.069**
3. Ethnicity (0 ‐ Romanian and Hungarian; 1 ‐ other) .011
‐.086**
‐.107**
‐.031
‐.110**
‐.011
‐.041
‐.013
4. School location (1‐urban)
‐.131**
.049*
.140**
.059*
‐.031
.106**
.054*
.049
5. Social benefits (1 – recipient)
.000
.014
.051*
‐.007
‐.039
.028
‐.066**
‐.014
2nd Step Results:
1. Gender (1 ‐ m
ale)
‐.081**
‐.132**
‐.136**
.304** .094** .309**
‐.017
‐.044*
2. School level (1 ‐ high school)
.103**
‐.179**
‐.041
‐.136** ‐.056*
‐.057*
‐.037
.078**
3. Ethnicity (0 ‐ Romanian and Hungarian; 1 ‐ other) .007
‐.068**
‐.099**
‐.007
‐.065**
.018
‐.015
.006
4. School location (1‐urban)
‐.052*
.065**
.128**
.056*
‐.022
.088**
.080**
.060*
5. Social benefits (1 – recipient)
.002
.019
.050*
.009
‐.015
.046*
‐.054*
.001
SSP Dimensions:
Neighborhood
6. Neighborhood support
.036
‐.015
‐.066*
.037
.087** .023
.066**
.195**
7. Neighborhood youth behavior
.020
.040
.005
.021
.011
.009
‐.028
‐.021
8. Neighborhood safety
.020
.108**
.099**
.153**
.028
.046
.038
.023
School
9. Learning climate
.060*
.040
‐.018
‐.043
‐.033
.014
‐.047
‐.013
10. School satisfaction
.308**
.128**
.104**
.038
.166** .068**
.150**
.042
11. Teacher support
.031
.035
.199**
.067
.032
.110**
.041
.069*
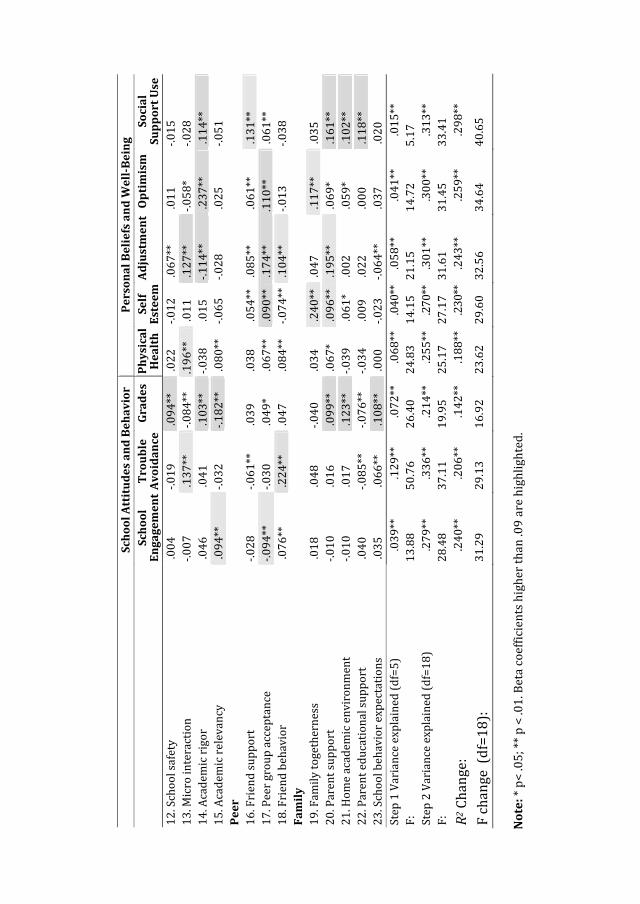
School Attitudes and Behavior
Personal Beliefs and WellBeing
School
Engagement Trouble
Avoidance Grades Physical
Health
Self
Esteem
Adjustment Optimism
Social
Support Use
12. School safety
.004
‐.019
.094**
.022
‐.012
.067**
.011
‐.015
13. Micro interaction
‐.007
.137**
‐.084**
.196**
.011
.127**
‐.058*
‐.028
14. Academic rigor
.046
.041
.103**
‐.038
.015
‐.114**
.237**
.114**
15. Academic relevancy
.094**
‐.032
‐.182**
.080** ‐.065
‐.028
.025
‐.051
Peer
16. Friend support
‐.028
‐.061**
.039
.038
.054** .085**
.061**
.131**
17. Peer group acceptance
‐.094**
‐.030
.049*
.067** .090** .174**
.110**
.061**
18. Friend behavior
.076**
.224**
.047
.084** ‐.074**
.104**
‐.013
‐.038
Family
19. Fam
ily togetherness
.018
.048
‐.040
.034
.240** .047
.117**
.035
20. Parent support
‐.010
.016
.099**
.067*
.096** .195**
.069*
.161**
21. Hom
e academ
ic environment
‐.010
.017
.123**
‐.039
.061*
.002
.059*
.102**
22. Parent educational support
.040
‐.085**
‐.076**
‐.034
.009
.022
.000
.118**
23. School behavior expectations
.035
.066**
.108**
.000
‐.023
‐.064**
.037
.020
Step 1 Variance explained (df=5)
.039**
.129**
.072** .068**
.040** .058**
.041**
.015**
F:
13.88
50.76
26.40
24.83
14.15
21.15
14.72
5.17
Step 2 Variance explained (df=18)
.279**
.336**
.214** .255**
.270** .301**
.300**
.313**
F:
28.48
37.11
19.95
25.17
27.17
31.61
31.45
33.41
R2 Change:
.240**
.206**
.142** .188**
.230** .243**
.259**
.298**
F change (df=18):
31.29
29.13
16.92
23.62
29.60
32.56
34.64
40.65
Note: * p< .05; ** p < .01. Beta coefficients higher than .09 are highlighted.
THE MEASUREMENT OF THE SOCIAL DIMENSIONS OF SCHOOL SUCCESS – A VALIDITY STUDY …
53
As expected, the demographic characteristics have also effects on the individual outcomes: being in high‐school had a negative effect on most results, while boys have reported better well‐being and personal beliefs and more negative school attitudes and behavior characteristics.
Conclusions
The study presented the development process and the validity of the Romanian version of the School Success Profile instrument, focusing on the interactions between students’ social environment and their individual adaptation. We offer this instrument to practitioners, to help them evaluate students’ academic performance, to follow up their progress and identify protective and risk factors in schools, classes and individuals. Validity tests indicated a good internal consistency for the 26 dimensions of the instrument, which implies that the Romanian version of the SSP can be useful in the social diagnosis of the social dimensions of school success and the decision making process whether a student should be included in a certain intervention program to avoid school failure and hoping to reach better school involvement. It also demonstrates the intercultural validity of the School Success Profile and the similarities in the problems school children face to adapt to challenges of school environment. Our research team will continue to elaborate further analysis to reveal the impact of the here mentioned social dimensions on educational success and discuss the culturally relevant results in a comparative perspective.
The SSP was created to provide information about students’ particular school related problems and to build a comprehensive view on the social aspects that influence academic achievement. The risks and inequalities revealed in the Romanian context of the education system envisage further studies and applications of SSP‐Ro. Assessment that results in SSP‐Ro allows school managers, councilors, school social workers, mediators and other practitioners a results‐focused planning (or RFP, as described by Bowen and Richman in this issue of Studia Sociologia).
REFERENCES Agabrian, M. (2007). Relationships Between School and Family: The Adolescents' Perspective,
Forum. Qualitative Social Research, Vol. 8 (1), http://www.qualitative‐research.net/ index.php/fqs/article/viewArticle/209/461 (date of access 10/May/2010)
Agabrian, M., Millea, V. (2005). Parteneriate şcoală – familie – comunitate. Studiu de caz. [Partnerships between School – Family – Community. A Case Study]. Iaşi: Editura Institutul European.

PAUL‐TEODOR HĂRĂGUŞ, MARIA ROTH, DIANA DAMEAN
54
Berman, S.L., Kurtines, W.M., Silverman, W.K., Serafini, L.T. (1996). The impact of exposure to crime and violence on urban youth. American Journal of Orthopsychiatry, 66: 329–336.
Bowen, G.L. (2009). Preventing school dropout: The eco‐interactional developmental model of school success. The Prevention Researcher, 16 (3): 3‐8.
Bowen, G.L., Richman, J.M. (2008). School Success Profile. Jordan Institute for Families: University of North Carolina at Chapel Hill.
Bowen, G.L., Rose, R.A., Bowen, N.K. (2005). The reliability and validity of the School Success Profile. Philadelphia, PA: Xlibris Corporation.
Bowen, N.K., Bowen, G.L. (1999). Effects of Crime and Violence in Neighborhoods and Schools on the School Behavior and Performance of Adolescents. Journal of Adolescent Research, 14: 319–342.
Bowen, G., Richman, J.M., Bowen, N.K. (1998). Sense of school coherence, perceptions of danger at school, and teacher support among youth at risk of school failure. Child and Adolescent Social Work Journal, 15: 273–286.
Bronfenbrenner, U. (1979). The Ecology of Human Development: Experiments by Nature and Design. Cambridge: Harvard University Press.
Corcoran, Jacqueline (2005). Building strengths and skills: A collaborative approach to working with clients. New York: Oxford.
Cohen, Jacob (1988). Statistical Power Analysis for the Behavioral Sciences. 2nd ed., Hillsdale: Lawrence Erlbaum.
Early, T.J. (2001). Measures for practice with families from a strengths perspective. Families in Society: The Journal of Contemporary Human Services, 82: 225‐232.
Fleck, G. si Rughinis, C. (2008). Vino mai aproape. Incluziunea si excluziunea romilor in societatea romaneasca de azi [Come Closer. The inclusion and exclusion of the Roma in the contemporary Romanian society]. Bucureşti: Human Dynamics.
Franklin, C. (2004). The delivery of school social work services. In P. Allen‐Meares (ed.), Social work services in schools (4th edition), Boston: Pearson Education, Inc., pp.295‐325.
Fraser, M.W. (ed) (1997). Risk and resilience in childhood an ecological perspective. NASW Press.
Fraser, M.W. (2000). Intervention research in Social Work: A basis for evidence based practice?, paper presented at the Evidence based practice Conference. Toward a Research Agenda for Social Work Practice Guidelines, St Louis, MO: George Warren Brown School of Social Work, Washington University.
Fraser, M.W., and Allen‐Meares, P. (2004). Intervention with children and adolescents: New hope and enduring challenges. In P. Allen‐Meares and M. W. Fraser (eds.): Intervention with children and adolescents: An interdisciplinary perspective, Needham Heights, MA: Allyn and Bacon, pp.532‐544.
Galassi, John P., and Akos, Patrick (2007). Strengthsbased school counseling: Promoting student development and achievement. New York: Lawrence Erlbaum Associates.

THE MEASUREMENT OF THE SOCIAL DIMENSIONS OF SCHOOL SUCCESS – A VALIDITY STUDY …
55
Hatos, A. (2008). Impactul segregării şi diferențierii asupra performanțelor şcolare ale elevilor din clasele 10‐12. O analiză multinivel. [The Impact of segregation and differentiation of school performances in the 10th and 12th grades]. Calitatea Vietii, XIX (1–2): 141–158.
Jigău, M. (ed.) (2002). Învăţământul rural din România. Condiţii, probleme şi strategii de dezvoltare. Bucureşti: Editura MarLink.
Miclea, M. (2005). Raport asupra stării sistemului de învăţământ, Bucureşti. Available at: http://www.edu.ro/index.php/genericdocs/3590 [Date of access: 10/May/2010].
OECD (2005). PISA 2003 Technical Report, Paris. Powers J.D., Bowen, G.L., Rose, R.A. (2005). Using Social Environments Assets to Identify
Intervention Strategies for Promoting School Success. Children and Schools, vol.27, (3): 177‐187.
Richman, J.M., Bowen, G.L. (1997). School Failure: An Ecological‐Interactional Developmental Perspective. In M.W. Fraser (ed.): Risk and Resilience in Childhood. An Ecological Perspective, Washington DC: NASW Press.
Richman, J.M., Bowen, G.L., and Woolley, M.E. (2004). School failure: An eco‐interactional‐developmental perspective. In M.W. Frasier (ed.): Risk and resilience in childhood: An ecological perspective (2nd edition), Washington, DC: NASW Press, pp.133‐160.
Richman, J.M., Fraser, M.W. (2001). Resilience in childhood: The role of risk and protection. In J.M. Richman and M.W. Fraser (eds.): The context of youth violence: Resilience, risk and protection, Westport, CT: Praeger, pp.1‐12.
Richman, J.M., Rosenfeld, L.B., Bowen G.L. (1998). Social Support for Adolescents at Risk of School Failure. Social Work, 43(4): 309‐323.
Rouk, U. (2000). The School Success Profile: Students voice their concerns, Washington, DC: Policy Studies Associates, Inc.
Scales, P.C., Roehlkepartain, E.C. Neal, M., Kielsmeier, J.C., Benson, P.L. (2006). Reducing Academic Achievement Gaps: the Role of Community Service and Service‐learning. The Journal of Experiential Education. 29(1): 38‐66.
Tufiş, P.A. (2008). Predictors of school success in Romania. Family background, school factors, and community factors. Revista Calitatea Vieţii, XIX (3‐4): 389‐405.
Woolley, M.E., Bowen, G.L., and Bowen, N.K. (2004). Cognitive pretesting and the developmental validity of child self‐report instruments: Theory and applications. Research on Social Work Practice, 14: 191‐200.

STUDIA UNIVERSITATIS BABEŞ‐BOLYAI, SOCIOLOGIA, LV, 1, 2010
THE ROLE OF FAMILY FACTORS IN SCHOOL OUTCOMES AT DIFFERENT SCHOOL LEVELS
ÁGNES DÁVIDKACSÓ*
ABSTRACT. This article examines the relations between family factors and school related problems, which cumulatively increase in the risk of school failure. The results show that the influence of family factors on school related problems differs between boys and girls, and also according to their educational level: middle or high school; however, at the level of basic education, the family factors with significant effects on school related problems are overlapping. In the case of middle school students, regardless of gender, family togetherness and school behavioral expectations hold significant effects. A separate analysis, made according to school levels, shows that the importance of family factors in school related problems decreases at high school level, but it still remains significant. At high school level, the significant predictors were: the monitoring in extra school activities for girls, and the home academic environment for boys. The location of the school had significant effects only on the middle school aged girls' school related problems, while the fact that one or both parents are working abroad had significant effects on the school risk index at both school levels, for boys and girls alike. Keywords: school failure, social capital, family characteristics, school behavioral expectations
Introduction
This study is a result of secondary analysis of the data obtained during the project The social diagnosis of school performance using the School Success Profile (SSPRo) and the design of evidence based intervention methods1. The project was focused on the identification of social factors that influence school success, which can serve as a base for efficient interventions in order to improve students' school performance. During the first stage of the project, the School Success Profile questionnaire was translated and validated for Romania, based on the self‐administered questionnaire developed by Richman and Bowen (2005) for middle and high school students in the USA. The researchers embraced an * „Babeş‐Bolyai” University Cluj‐Napoca, e‐mail: [email protected] 1 The article is based on the results of the PN II project nr. 91‐063/2007 financed by The National Centre for Programme Management (CNMP), coordinated by Maria Roth, PhD (Babes‐Bolyai University). For more details please check the site of the project: www.successcolar.ro

ÁGNES DÁVID‐KACSÓ
58
ecological‐developmental‐interactional perspective (Richman and Bowen, 1997), offering a diagnosis of students’ social milieu: the family, peers, neighborhood and school. In Epstein's categories of family involvement in children's education (apud. Ingram, Wolfe and Lieberman, 2007), two categories refer to particular family practices which influence the school performance of students: (1) the gratification of the student's needs in the family and (2) the school related issues and activities such as homework, cognitively stimulating activities (reading, cultural activities, discussions on school related topics, etc.). Pomerantz et al. (2007) state that more parent involvement in the homework activities of children does not necessarily lead to better school results. The emotional climate of the parent‐child interaction during the time spent with school‐related issues might be influential as well. According to the results of Agabrian and Millea (2005), Romanian parents are motivated to get involved in their children's education and consider school related expectations very important. The same study reveals that adolescents perceived the school‐related strategies of their parents as being of twofold: usually formal (asking formal questions about school related issues), but sometimes specific (explaining, encouraging, helping). The importance of the emotional support of the family on school results hasn’t been studied in the Romanian context yet. The present study tried to analyze the importance of the emotional support provided by parents, the home academic environment, school related expectations and regular discussions about school‐related issues and problems faced by adolescents at school. Theoretical background
The relationship between family and school outcomes of children can be approached from many perspectives. Common in these perspectives is that the parental role in the educational success of the child cannot be examined without considering the social context in which it occurs (Auerbach, 2007). It can be analyzed as a strategy that aimed to conserve or improve the social status of the family (as shown by Bourdieu and Passeron, 1978), or as a result of family practices which mediate the effects of demographic factors (Feinstein et. al., 2004). The ecological‐developmental‐interactional perspective conceptualizes the school success as a result of interactions within and between the microsystems of students’ lives (Richman and Bowen, 1997) Bourdieu (1978) considers that the educational strategy of the family is determined by the “habitus” of parents. According to their educational strategy, families invest their capital (economical, social and cultural) in their child’s education. The families which need cultural capital for their social ascension

THE ROLE OF FAMILY FACTORS IN SCHOOL OUTCOMES AT DIFFERENT SCHOOL LEVELS
59
will be more interested in education and will invest more of their capital in this process. In the context of this study, the focus on the investment of social capital in education is crucial. In Bourdieu's approach, the social capital relevant for the educational career of children consists of the social relations that parents can use in order to customize their children's school experience. Coleman (1988) also emphasized the importance of the families' social capital for children’s school success, social capital meaning significant relationships as accessible resources for the child. In this perspective, social capital in its directly usable form for the child means the physical presence of the adult in the family and the attention this adult pays to the child. The different kinds of social capital valuables for the child influence different aspects of school outcomes, such as academic performance or behavior at school(Coleman, 1988, apud. Woolley, Kol and Bowen, 2008) Feinstein et al. (2004) constructed a model of intergenerational transmission of school success, identifying distal and proximal factors. The authors consider “distal” those factors that have measurable effect on the development of children; proximal are factors that mediate their effect. The distal factors are: family structure, family size, teenage motherhood, income and poverty and the employment of the mother. The proximal factors are: parental style and educational behavior of the parents. The effect of distal factors are mediated by proximal factors, namely the family characteristics consisting of parental particularities. The authors consider that the constellation of the factors have greater importance in their effect on school success than each factor in particular. Bronfenbrenner’s (1979) ecological systems perspective also provides a useful way to conceptualize children’s developmental environment. Bronfenbrenner describes four systems: micro, meso, exo and macro. The micro system refers to the individuals immediate environment; the system that the individual participates in directly. For children, the most important microsystems are the family, the school, the neighborhood and the peer group (Richman and Bowen, 1997). The mesosystem represents the connection between microsystems. (e.g. the relationship between family and school: when parents meet with teachers on the child’s behalf). The exosystem represents the settings in which the child does not participate directly, but influence the microsystems (e.g. the parents' work place, the neighborhood). The macrosystem is the broad social level (e.g., national government policies, cultural values, war, economy). The interactional perspective refers to the “goodness‐of ‐fit” between the individual and the environment. It includes two levels: the needs of the person and the gratification of these needs, and the demands of the environment with the adaptability of the person to these demands (Richman and Bowen, 1997). The developmental perspective suggests that the child is in continuous interaction with the environment, acts and reacts,

ÁGNES DÁVID‐KACSÓ
60
which in time results in specific developmental outcomes (Richman and Bowen, 1997). Applying this approach on the school success, the successful student's needs are satisfied in all four microsystems, this student being capable to answer adequately to the increasing demands of school. In time, as the student's needs are changing, an effective and satisfying microsystem also changes. The family factors with important effect on the school results can change in different developmental stages which means that it is useful to analyze these relationships between family and school outcomes, separately for the different school levels. The most severe form of school failure is the school drop‐out, but Richman and Bowen (1997) consider that the concept is more complex including the “interior drop‐outs”, i.e, pupils who are physically present at school, but they don't profit from the educational activities and leave the educational system without acquisitioning the skills and knowledge needed for their social integration. These students obtain low average grades, they have to repeat classes, and they register have many absences. The behavioral problems at school are also associated with poor academic outcomes (Wolley et al., 2008). Numerous studies, using quantitative or qualitative methods, have demonstrated the role of various family‐related factors for school success. For example, Spera (2003) found a significant relation between parental values, aspirations, child‐centered attitudes and parental monitoring, and the school outcomes of children, such as academic performance, school motivation and engagement in education. Woolley and Grogan‐Kaylor (2006) and Woolley, Kol and Bowen (2008) provided solid evidence for the influence of family cohesion, parental emotional support, and academic environment at home on the children's school achievements, trouble avoidance, school engagement and the feeling of coherence associated with school. Plunkett et al (2008) associated parental educational support with the child's academic motivation. These findings correspond with those obtained by qualitative methods: Auerbach's (2007) results obtained by interviewing socially disadvantaged parents shows that the most effective socially disadvantaged students were those whose parents provided moral support, discussed with their child about the importance of education and other topics, had high expectations and had a clear structure of the family life. These findings are similar to the results of Murray and Naranjo (2008) whose subjects also highlighted the importance of parents’ interest in school related topics in their school success. The purpose of the present study
This study examines the relationship between the emotional support provided by the family, educational activities in the family and school related problems of students. The cumulation of school related problems is considered a risk‐factor for school failure. The first hypothesis is that family factors have

THE ROLE OF FAMILY FACTORS IN SCHOOL OUTCOMES AT DIFFERENT SCHOOL LEVELS
61
significant effects on school related problems. The second hypothesis is that, at different educational levels, different family characteristics hold significant effects on school related problems, and their effects vary between girls and boys.
Method
The analysis below is based on the data obtained from the national survey, which aimed to validate the School Success Profile questionnaire (Bowen and Richman, 2005) in Romania. The survey was carried out within the project Social Diagnosis of the School Performance Through the Social Scale of School Success and Development of Evidencebased Intervention Methods (see details about the project on www.successcolar.ro) The School Success Profile (SSP) is a self‐report questionnaire designed for middle and high school students. The data were collected in November 2008 ‐January 2009 on a representative sample of middle and high school students from Romania (see Roth, Hărăguş and Dămean, this volume) After excluding the cases with more than three missing answers on the 27 dimensions of the questionnaire, a working dataset of 2465 cases was obtained. The researches on Roma children shows that the school experience and educational career is different for Roma and non‐Roma children, and the relationship between children, parents and educational institutions are also different (Fleck and Rughinis, 2008). Given that our sample did not include a Roma sub‐sample, there were only 25 children who participated at the survey and declared themselves as being of Roma ethnicity; consequently, the data do not permit a separate analysis of Roma students. For this reason, I have decided to perform the analysis including only the non‐Roma children. Measures
All measures used in this research were scales and items from the SSP.
Measures of family factors:
The family togetherness scale consists of seven items asking the student for example if their family members “support one other”, “play and laugh together” , or “feel loved by and care for one another”. The possibilities of response are ranging from “at all”‐1, to “very much”‐3. The alpha reliability of this scale is .88 . The scale of emotional support scale includes five items such as “how often in the last month, your family members “let you know you were loved” or “told you that you did a good job”. The possibilities of response are ranging from: “never”‐1, to “three times ore more”‐3. The reliability of this scale is: alpha=.85. The monitoring of the child in outofschool activities scale is measured by the SSP item:”Is there an adult in your home who knows where you are

ÁGNES DÁVID‐KACSÓ
62
when you are not at home or in school?” The possibilities of answer are: “no”‐1, “sometimes”‐2, ”almost always”‐3, “always”‐4. In order to be able to introduce this item in the regression analysis, the answers were dichotomized: the “no” received the value 0, all the other possibilities received the value 1. The home academic environment scale consists of eight items asking the student about how often in the last month the members of their family discussed with them things like “School activities or events that interest you”, “Things you've studied in class”, “Current events”. The possibilities of response are ranging from:”never”‐1, to “three times or more”‐3. The alpha reliability of this scale is .83. The educational support scale consists of six items which asks the student for example about how often their family members “praised or rewarded them for working hard on school work” or “offered to help them with homework or special assignment”, with responses between “never”‐1, and “three times or more”‐3. The alpha reliability of this scale is .81. The school related expectation scale consists of eleven items asking the student about how upset the adults in their home would be if they knew the student turned in his/her homework late or not at all, or he/she cut a class, etc. The possibilities of responses are between “at all”‐1, “very much”‐3. The alpha reliability of this scale is .91. The demographic variables considered were: location of the school (urban, rural) and the transnational character of the family (parents working abroad). That was dichotomized: the “none” answer received the value 0, all other answers received the value 1. The outcome variable
The dependent variable – school failure risk index is a result of combining 5 items regarding different school related problems from the SSP‐Ro questionnaire: the number of grade averages below 5 (in the last semester), number of grade retentions, lack of involvement in learning operationalized by the item “My parent received a warning about my grades or homework”, warning received from the principal for behavioral problems: “I had to see the principal or I was at the disciplinary committee because of problems with my attendance or behavior”, and the warning received by parents for the student's behavioral problems : “My parents received a warning about my attendance or behavior”. Each item of this scale was dichotomized, the “none” answer receiving the value 0, and all the other possibilities, the value 1. The alpha reliability of the scale is .62. The value obtained by one student on this scale shows the number of school related problems the student has. If this value is higher, the risk of school failure for the student is higher, as well.
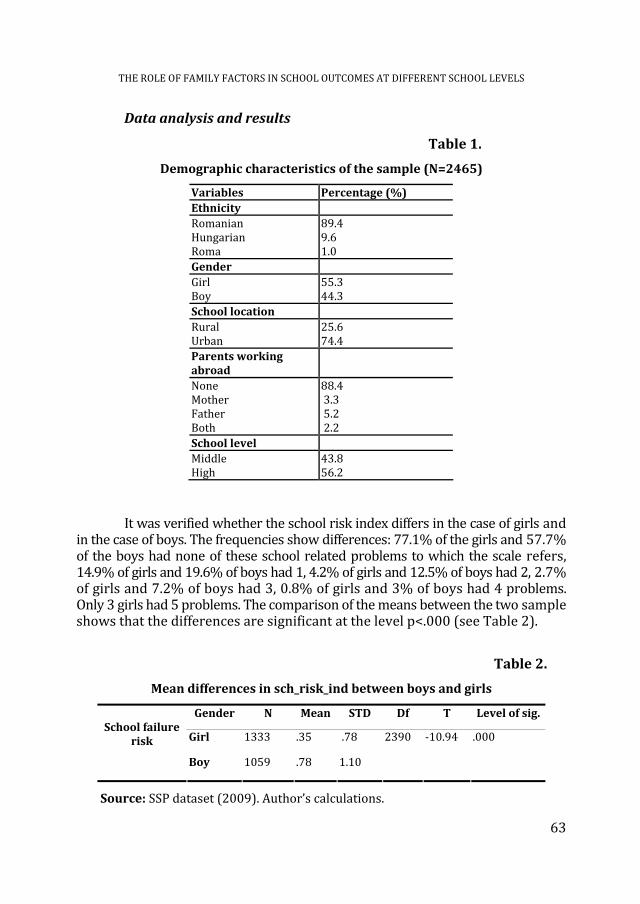
THE ROLE OF FAMILY FACTORS IN SCHOOL OUTCOMES AT DIFFERENT SCHOOL LEVELS
63
Data analysis and results
Table 1.
Demographic characteristics of the sample (N=2465)
Variables Percentage (%) Ethnicity Romanian Hungarian Roma
89.4 9.6 1.0
Gender Girl Boy
55.3 44.3
School location Rural Urban
25.6 74.4
Parents working abroad
None Mother Father Both
88.4 3.3 5.2 2.2
School level Middle High
43.8 56.2
It was verified whether the school risk index differs in the case of girls and in the case of boys. The frequencies show differences: 77.1% of the girls and 57.7% of the boys had none of these school related problems to which the scale refers, 14.9% of girls and 19.6% of boys had 1, 4.2% of girls and 12.5% of boys had 2, 2.7% of girls and 7.2% of boys had 3, 0.8% of girls and 3% of boys had 4 problems. Only 3 girls had 5 problems. The comparison of the means between the two sample shows that the differences are significant at the level p<.000 (see Table 2).
Table 2.
Mean differences in sch_risk_ind between boys and girls
Gender N Mean STD Df T Level of sig.
Girl 1333 .35 .78
School failure
risk
Boy 1059 .78 1.10
2390 ‐10.94 .000
Source: SSP dataset (2009). Author’s calculations.

ÁGNES DÁVID‐KACSÓ
64
The analysis of the relationship between family factors and school related problems was done separately for the two educational levels, since the relationships between children and their families change in the different developmental stages, corresponding to the middle and high school level. Because the school risk index differs significantly between girls and boys, and the effects of family factors on boys and girls can be different, girls and boys were considered separately. In this way, the effect of family factors on school related problems was analyzed in four sub‐samples: middle school girls and boys, and high school girls and boys.
Table 3.
Means and standard deviations for the considered variables
Middle school High school
Girls Boys Girls Boys
Mean STD. Mean STD. Mean STD. Mean STD. School risk index .40 .82 .85 1.13 .32 .75 0.71 1.06 Family togetherness 19.61 2.45 19.54 2.31 18.64 2.96 18.60 2,98 Parental support 13.28 2.13 13.16 2.21 12.38 2.76 11.84 2.71 Academic environment at home 6.70 1.41 6.44 1.75 6.43 1.70 6.14 1.86 Parental educational support 5.16 1.21 5.12 1.35 4.27 1.69 4.27 1.71 School behavioral expectations 27.79 5.89 26.65 6.09 27.49 4.46 26.32 5.30 Extra school monitoring (none=0) .95 .88 .96 .91 Parents working abroad (none=0) .10 .15 0.10 .09
Source: SSP dataset (2009). Author’s calculations. Table 4 presents the results of the hierarchical multiple regressions models for the school risk index, tested separately for middle and high schools, and boys and girls . The school location and the existence of an abroad working parent were introduced in the first step, the family factors were added in the second step. The school location, parents working abroad and extra school monitoring are dummy variables.
Table 4.
Hierarchical multiple regression for the school risk index
School level Middle school High school
Girls Boys Girls Boys
Beta P Beta p Beta P Beta p Model 1 R2 =.032 R2 =.015 R2 =.013 R2 =.026 School location (rural =0) ‐.139 .001 ‐.062 .194 .006 .875 .001. .982 Parents working abroad (none=0) .111 .009 .113 .017 .125 .001 .172 .000 Model 2 R2=.070 R2 =.062 R2 =.033 R2 =.049 School location (rural=0) .‐121 .004 ‐.034 .468 .012 .741 .018 .683

THE ROLE OF FAMILY FACTORS IN SCHOOL OUTCOMES AT DIFFERENT SCHOOL LEVELS
65
School level Middle school High school
Girls Boys Girls Boys
Beta P Beta p Beta P Beta p Parents working abroad (none=0) .101 .016 .108 .021 .130 .000 .166 .000 Family togetherness ‐.106 .030 ‐.162 .004 .032 .483 ‐.074 .171 Parental emotional support .012 .810 .022 .706 ‐.069 .187 .010 .862 Academic environment at home ‐.029 .533 .086 .118 ‐.080 .070 ‐.118 .015 Parental educational support .112 .025 .005 .927 .086 .072 .179 .000 School behavioral expectations ‐.187 .000 ‐.160 .001 ‐.025 .495 ‐.052 .220 Extra school monitoring (none=0) ‐.006 .891 ‐.044 .344 ‐.113 .003 .032 .459
Source: SSP dataset (2009). Author’s calculations. Discussion
The goodness of fit of the explanatory models was modest in all four cases. The predictive power of family factors on the school risk index was somewhat better in the case of middle school girls (R2=.070, F=6.13, p<.01) and middle school boys (R2=.062, F=4.71, p<.01). In the high school sample the effect of family factors on school risk index was lower for both girls and boys, but in the case of girls it decreased with 4% (R2=.033, F=4.18, p<.01), whereas in the case of boys it decreased only with 1,3% (R2=.049, F=4.55, p<.01). At the middle school level, in the case of girls the effects of family factors on school risk index was higher than in the case of boys, but in the high school sample, it was in the case of boys that the effects of family factors was higher. Although the predictive power of the model in each sub‐sample is modest, it is significant in each case. All in all, our results suggest that the family factors have a significant effect on the school risk index, although there are differences between sexes and educational levels. Differences were found between the four sub‐samples also in the particular ranking of family factors with significant effect on the school risk index. In the sub‐sample of middle school girls, the school related expectation had the highest effect (beta=‐.187, p<.01), followed by the parental educational support and the family togetherness, which are significant at the level p<.05. A family perceived as supportive by the middle school aged girl, with well perceived school related expectations determine decreased school risk index (fewer school related problems). It is important to state the significant positive correlation between parental educational support and school risk index, which suggests that more educational support from parents is interrelated with more school related problems. Pomerantz, et al. (2007), based on the research of Pomerantz and Eaton carried out in 2001 ( apud. Pomerantz et al. 2007), suggest that this is because parents assist students who have difficulties at school, and if the students’ initial level is taken into account, the results improve after parents’ educational involvement at home. In our case, this means that if middle school aged girls were having problems at school, parents would get more involved.

ÁGNES DÁVID‐KACSÓ
66
In the sample of middle school aged boys, the effects of educational support were not significant. A more detailed analysis, which allows the identification of parents who provide educational support for the middle school aged students, is needed for the explanation of this difference between girls and boys concerning the effects of parental education on school risk index. The other two variables with significant effects on the school risk index were the same as in the girl sample: the family togetherness (p<.01) and the school related expectations (p<.01). In other words, similarly to the case of girls, the middle school boys with strong perceived family support and school related expectations registered on average smaller values of the school risk index. Considering also the demographic variables, in the middle school boy sample, the effect of the school location and the existence of migrant parent in family is significant at the level p<.02 (F=4.44), but in the girl sample it is strongly significant (F=10.07, p<.01). In the boy sample, the effects of the school location is not significant, whereas in the girl sample it is significant (beta=‐.139, p<.01). Living in rural area increases the risk of school failure for middle school girls, not for boys though. The fact that at least one of the parents is working abroad had significant effects on school risk index for both girls and boys (p<.01 for girls and p<.02 for boys). In high school the school location had no significant effect on school risk index, neither on girls, nor on boys. The abroad working parent in family had significant effect both in the high school boy and high school girl sample (p<.01 in both cases). In the high school girl sample the family factors had the weakest effect on school risk index: only the extra school monitoring had significant effect on school risk index (p<.01). In the case of high school girls having parents working abroad and lacking adult monitoring increases the school failure index. In the sample of high school boys, the family factors had a stronger predictive value than in girl sample. Only in this sample the home academic environment was significantly associated with decreased school risk index (beta=‐.118, p<.02). The parental educational support was significantly positively associated with school failure index, as in the case of middle school girls. Our data suggest that having parents working abroad and a weak perceived academic environment at home increase the school failure index for high school boys. Summarizing the results, it is important to state that the school location had significant effect only in middle school girl sample, increasing the school failure index. Having parents working abroad increased the school failure index in all four samples. Regarding the family factors, we can remark that the family togetherness and the school related expectations had significant effect in both middle school samples, but had no significant effect on high school student's school failure index. In the case of high school girls, considering the family variables only the monitoring decreased significantly the school failure index, in the boy sample the home academic environment was the family variable

THE ROLE OF FAMILY FACTORS IN SCHOOL OUTCOMES AT DIFFERENT SCHOOL LEVELS
67
with significant effect on school failure index. In the middle school girl and the high school boy sample the parental educational support was significantly but positively related to the school failure index. Limitations of the study
In our results we can only consider associations, without causality between the variables. Further research is needed to clarify the nature of relationships between the parental educational support and school failure index, where the findings were contrary to the expectations. One more limitation is the deletion of some cases in order the reduce missing values from the sample, which affected the representativity of the national‐level sample. Finally, all our results are based on a self report questionnaire completed by students, so the family characteristics analyzed refer in fact to the students’ perceptions of those characteristics. Conclusions
The family factors with effect on school failure index differ between middle and high school students. In the case of middle school students, regardless of gender, the following family factors hold significant effects: family togetherness and school behavioral expectations. At this developmental stage, the emotional safety within the family and the expectations of parents are very important for the school results of both girls and boys. In the case of high school students, the effect of family factors on school failure index decreased, but the explanatory model still remains significant. At high school level the monitoring in extra school activities was significant predictor for girls, while for boys the home academic environment was significant predictor. At this stage, the student’s emotional dependency on family is decreasing, and the differences between genders are increasing, the effective family practices related the student's school outcomes differ according the student's gender. This finding corresponds with the results of Plunkett et. al (2008). The results of present study also have shown that as Feinstein et al. (2004) stated, beyond the demographic factors, the family characteristics expressed in parental practices have significant impact on the student's school outcomes. The fact that the existence of abroad‐working parent in the family had significant effect on school risk index in all subsamples shows the importance of the physical presence of the parent in the family as a valuable resource for the student, as Coleman (1988) has accentuated. The family togetherness, the regular discussions with the student about important topics for her/him, the monitoring of the student, are signs of the intergenerational connectedness described by Coleman (1988), that makes valuable for the child the parent's different forms of capital.

ÁGNES DÁVID‐KACSÓ
68
The differences between variables with significant effect on school failure indicate the different needs of the youth but also the different family attitudes towards boys and girls of high school level.
REFERENCES Agabrian, M., Millea, V. (2005). Parteneriate şcoală – familie – comunitate. Studiu de caz
[Schoolfamilycommunity partnerships. A case study]. Iaşi: Editura Institutul European.
Auerbach, S. (2007). From Moral Supporters to Struggling Advocates: Reconceptualizing Parental Roles in Education Through the Experience of Working‐Class Families of Color. Urban Education, 42(3): 250‐283.
Bourdieu, P. and Passeron, J.L. (1978). A társadalmi egyenlőtlenségek újratermelődése [Reproduction in Education, Society and Culture], Budapest: Gondolat.
Bowen, G.L., Richman, J.M. (2005). School Success Profile, Jordan Institute for Families, University of North Carolina at Chapel Hill.
Bronfenbrenner, U. (1979). The ecology of human development: experiment by nature and design. Cambridge: Harvard University Press.
Coleman, J.S. (1988). Social Capital in the Creation of Human Capital. The American Journal of Sociology, Supplement: Organizations and Institutions: Sociological and Economic Approaches to the Analysis of Social Structure, 94: 95‐120.
Feinstein, L., Duckworth, K., Sabates, R. (2004). A Model of the Intergenerational Transmission of Educational Success. London: The Centre for Research on the Wider Benefits of Learning, Institute of Education.
Fleck, G. and Rughinis, C. (2008). Vino mai aprope. Incluziunea și excluziunea romilor în societatea românească de azi [Come Closer. The inclusion and exclusion of the Roma in contemporary Romanian society]. Bucharest: Human Dynamics.
Hoover‐Dempsey, K.V., Sandler H.M. (1997). Why Do Parents Became Involved in Their Children's Education?. Review of Educational Research, 67: 3‐42.
Ingram, M., Wolfe, R.B., Lieberman J.M. (2007). The Role of Parents in High Achieving Schools Serving Low‐Income, At‐Risk Populations. Education and Urban Society, 39: 419‐450.
Murray, C. and Naranjo, J. (2008). Poor, Black, Learning Disabled, and Graduating: An Investigation of Factors and Processes Associated With School Completion Among High‐Risk Urban Youth. Remedial and Special Education, 29(3): 145‐160.
Nash, J.K. and Fraser, M.W. (1997). Methods in the Analysis of Risk and Protective Factors: Lessons from Epidemiology. In M.W. Fraser (ed.): Risk and Resilience in Childhood. An Ecological Perspective, Washington: NASW Press, pp. 53‐65.

THE ROLE OF FAMILY FACTORS IN SCHOOL OUTCOMES AT DIFFERENT SCHOOL LEVELS
69
Plunkett, S.W., Henry, C.S., Houltberg, B.J., Sands, T. and Abarca‐Mortensen, S. (2008). Academic Support by Significant others and Educational Resilience in Mexican‐Origin Ninth Grade Students From Intact Families. The Journal of Early Adolescence, 28: 333‐365.
Pomerantz, E.M., Moorman, E.A., Litwack, S.D. (2007). The How, Whom and Why of Parent's Involvement in Children's Academic Lives: More is Not Always Better. Review of Educational Research, 77(3): 373‐410.
Richman, J.M., Bowen, G.L. (1997). School Failure: An Ecological‐Interactional Developmental Perspective. In M.W. Fraser (ed.): Risk and Resilience in Childhood. An Ecological Perspective, Washington: NASW Press, pp. 95‐116.
Spera, C. (2006). Adolescent's Perceptions of Parental Goals, Practices, and Styles in Relation to Their Motivation and Achievement. The Journal of Early Adolescence, 26: 456‐470.
Woolley, M.E. and Grogan‐Kaylor, A. (2006). Protective Family Factors in the Context of Neighborhood: Promoting Positive School Outcomes. Family Relations, 55(1): 93‐104.
Woolley, M.E, Kol, K. and Bowen, G. (2009). The Social Context of School Success for Latino Middle School Students: Direct and Indirect Influences of Teachers, Family, and Friends. The Journal of Early Adolescence, 29: 43‐61.

STUDIA UNIVERSITATIS BABEŞ‐BOLYAI, SOCIOLOGIA, LV, 1, 2010
FACTORS INFLUENCING SCHOOL SUCCESS IN RURAL ROMANIA: A CASE STUDY BASED ON DATA COLLECTED WITH THE SCHOOL SUCCESS PROFILE INSTRUMENT
HORAŢIU RUSU* AND ANCA BEJENARU**
ABSTRACT. Classical sociological studies of the ‘60s and ’70s have brought a great interest for the relation between school education and social stratification and, with it, social reproduction theories developed. Explanatory models set forth that social inequalities rooted in the social background (family of origin, neighborhood, peer groups, etc.) transpose into inequalities in school results and educational trajectories. Our paper investigates these relationships in today’s rural Romania, trying to answer the question: “Which variables influence most the academic performance of gymnasium students?”. Our focus was motivated by the results of recent studies in our country, showing that Romanian students from rural areas perform worse than students from urban areas (Miclea et al., 2007: 8; Voicu and Vasile, 2009). The data used in this paper were collected in 2009 using a School Success Profile based questionnaire (Bowen, Rose and Bowen, 2005); the analysis was performed on a sub‐sample of a national sample of gymnasium students. Keywords: academic results, social background, rural Romania, gymnasium students Introduction1
Education is a key factor in reducing social inequalities and increasing competitiveness. Children with low school performances and those leaving school early are at higher risk of socio‐professional failure, being more likely to experience economic and social disadvantages during different stages of their lives, as compared to their peers with better academic performances or higher levels of education (Pallas, 2006; Bowen, Bowen and Ware, 2002; Brewster and
* Lucian Blaga University, Sibiu, [email protected] ** Lucian Blaga University, Sibiu, [email protected] 1 This article is based on research data conducted in the project The Social Diagnosis of School Performance Using the School Success Profile (SspRo) and the Design of Research Based Intervention Methods. The project is part of the 4th Program of the National Center of Program Management ‐ Partnerships in the priority domains; The contract number is 91‐063/14.09.2007 (PNCDI II).
The authors would like to thank to Andrei Gheorghiță and Bogdan Voicu for comments on earlier drafts of the paper and for suggesting further reading.
HORAȚIU RUSU, ANCA BEJENARU
72
Bowen, 2004). In this condition, schools have been held up as both the means of achieving equality in society, but also as holding a crucial role in the reproduction of inequalities (Reay, 2009).
Although all Romanian governments affirmed the vital importance of education, after twenty years of transition, the gap between education services/ schools in rural and urban areas represents a deplorable reality. The dispro‐portionate number of students from rural areas who prematurely interrupt their careers in education, as well as their inadequate academic performances (MECI, 2009) contribute to the reproduction of inequalities between rural and urban areas in Romania (Miclea et al., 2007; Voicu and Vasile, 2009). Many causes, both structural and individual, are invoked when explaining these disparities, but among them, still, the utmost important are the structural factors like schools infrastructure, the quality of human resources involved in education, various household characteristics like economic deprivation, etc. (Jigău, 2000).
These reasons give us the opportunity to take a closer look at some of the causes influencing school success in rural Romania. The analyses we make considers among some structural, socio‐economic status factors, a series of other causes influencing academic performances, seen from the perspective of the students, in short, students’ perceptions. Thus, the contribution that our paper makes to the literature on school success in rural Romania is the exploration of the predictive power of various student’s perceptions of the factors influencing school outcomes, after controlling for neighborhood effects, which represent an understudied factor influencing school success.
The article has the following structure: a first part, pointing the theoretical framework and the influences of the individual, family and community factors on academic achievements; a second part, dedicated to the description of methodology and the used indicators; a third part where we present the data and the analysis; and finally, we outline some conclusions.
Background
Which set of factors has been indicated by theories to influence school performances? The issue has been extensively studied. Since 1960s, the importance of school environment and families on educational success has been overtly acknowledged. Researchers argued heatedly about whether schools or families were more important. At the same time, researchers have paid cursory attention to communities as purveyors of children's education and little attention to whether or how these contexts worked together (Epstein and Sanders, 2000). These factors could be captured, together with the structural and normative influences in a “situational or ecological approach” (Chatman, 1989; Bowen and Richman, 1997). From the perspective of Bronfenbrenner (1981), the environmental factors are hierarchically organized in four contexts: micro, meso, exo and macrosystems, defined as follows: the microsystems are settings with

FACTORS INFLUENCING SCHOOL SUCCESS IN RURAL ROMANIA: A CASE STUDY BASED ON …
73
physical and material characteristics, where the developing person engage in direct interactions: families, early education and care services, neighborhood and peer groups; the mesosystem comprise the interactions among two or more settings in which the developing persons actively participate: for example, the interaction between the family and children’s school, or between the family and neighborhood residents; the exosystem refers to one or more settings that do not involve developing persons as acting participants, but in which events that occur affect or are affected by what happens in the setting containing the developing persons: for example, the activities of local school board or the parents network of friends and so on; the macrosystem refers to the consistencies in the form and content of lower order system that exist or could exist, at the level of culture or subculture as a whole, along with any belief system or ideology underlying such consistencies (Bronfenbrenner, 1981: 21‐26). A complementary approach is concerned with “human factors” including: needs, values, expectations, beliefs, abilities, attitudes (Chatman, 1989; Bowen and Richman, 1997). Bowen and Richman (1997) propose a complex perspective called ecological‐interactional‐developmental perspective. This eclectic perspective integrates three important components. The first component, from an ecological perspective, captures the process of mutual adaptation and accommodation that take places between individuals/persons and the changing properties of the immediate settings in which the developing person lives and the larger context in witch the settings are embedded. The second component, from an interactional perspective, focuses on the goodness‐of‐fit between the characteristics of the individual and the characteristics of their environment. Richman and Bowen (1997: 104) identified two levels of fit: needssupplies and demandscompetencies. The third component, from a developmental perspective, supports the idea that the interaction and their consequences between the developing persons and the environment must be understood as a dynamic process over time (Richman and Bowen, 1997: 105).
In our study, along with the structural, socio‐economic status factors, as stated above, and individual factors, we are focusing on two key microsystems that affect school performances: the family and the community. The community is operationalized further as peer‐group and neighborhood.
Individual, family and community factors influencing school performances
Among individual/personal factors influencing academic achievements, intelligence (Jencks et al. 1979; Brody, 1992; Jensen, 1998), personality (De Raad and Schouwenburg, 1996; Chamorro‐Premuzic and Furnham, 2003, 2005), motivation (Stipek, 1988; Mitchell, 1992; Covington, 2000), self concept (Purkey, 1970; Stipek 1984; Marsh 1990; Marsh and Craven, 1997) and health (Grossman, 1975) play important roles. Out of this large array of personal factors, self concept and health are of relevance for our paper.

HORAȚIU RUSU, ANCA BEJENARU
74
The foundation of self concept is self‐worthy theory, suggesting that all individuals tend to create and maintain a positive self image (Covington, 1992; Eccles and Wigfield, 2002). The self concept can be operationalized as non academic and academic self concept (see Marsh, 1993; McGrew, 2007) the latter meaning the individual’s perception of self‐efficacy in the academic setting. Marsh (1990) found evidence for a reciprocal effects model between academic self concept and academic achievement, where prior academic self concept has positive effects on subsequent school grades.
Studies documenting health implications over academic achievement indicate a negative relation between a poor state of health and school success (Grossman, 1975; Edwards and Grossman, 1979; Case et al., 2002; Wells et al., 2003). Romanian studies and data support this relation in what concerns school enrolments. In 1998 about 40% of the children between 7 and 14 years suffering from a physical, sensorial or psychical disability were not enrolled in school (Voicu and Pop, 2000:141).
Influence of family background on the academic success and access to education was highlighted starting with the classical studies of educational inequality (see Coleman et al., 1966; Blau and Duncan 1967; Jencks, 1973; Boudon, 1973, 1974; Bernstein, 1975; Bourdieu and Passeron, 1990). It is fully accepted now that economical, cultural, and social capital of family are associated with educational performance.
Lower economic resources were associated in different studies with lower educational performances (Brooks‐Gunn and Duncan, 1997; Nash, 2002). In accordance with this aspect, being children from single‐parent family is negatively associated with school success, because of lower financial, emotional, and social resources (Nash, 2002).
Various studies show that belonging to a higher social class is a factor that increases chances of graduating several school levels. Children who have lower social class origins need more success in school than children from higher classes to decide to continue school in the upper levels (Breen and Yaish, 2006).
In their studies on educational inequality van de Werfhorst and Hofstede (2007) identified that parental cultural capital strongly affects primary school performances and has a significant and strong positive effect on secondary school success. In particular, parents' academic culture proved to be a factor with decisive impact on academic achievement (see Chapman, 2003; Woolley and Grogan‐Kayla, 2006).
The emotional dimension of the family plays a significant role in the manifestation of the children's school behaviors. Thus, support from family and how that support is perceived by the child are factors affecting the various dimensions of academic achievement. Woolley and Grogan‐Kaylor (2006), show that the students satisfaction with the way their families respond to situations such as needing help when something is bothering the children, responding to

FACTORS INFLUENCING SCHOOL SUCCESS IN RURAL ROMANIA: A CASE STUDY BASED ON …
75
the feelings of children, and talking when they need to, influence significantly the school behaviors of children.
A number of studies have highlighted the relationship of the family with other microsystems, and the influence of this relationship on school performance. This dependency may be defined in two important ways from an ecological perspective: connections among the adults in children's microsystems and congruence in behaviors, values, and attitudes across settings (Lee et al., 2006). Children whose parents are more involved in their education and have a good connection with the school, have more positive attitudes towards school, higher attendance, better work habits and higher academic success than children whose parents are not involved (Chapman, 2003; Hill et al., 2004). At the same time, parents are less able to meet the emotional needs of adolescents when the community provides models of negative adolescent behavior, such as violence (Bowen, Bowen, Ware, 2002).
The literature abounds in studies showing the impact of neighborhood on students’ school valorization, participation, performance and conduct. An important dimension is the economic capital of people in the neighborhood. According with Galenson (1998), living in a poor neighborhood, which may also concentrate a high proportion of ethnic or racial minorities, reduces the probability of school participation. Crane (1991) shows that, when neighborhood quality decreases, the adolescents are at higher risk of dropping out. Ceballo et. al. (2004) also show that adolescents who lived in neighborhoods with a higher percentage of financially well‐off neighbors tended to value education more than adolescents having financially deprived neighbors.
Neighborhood support was highlighted by a series of studies as having a positive impact on psychological and behavioral engagement of the students with their schooling (Woolley and Bowen, 2007). Bowen and Chapman (1996) showed that neighborhood support is an even stronger predictor of student adjustment than parental support. It also proved out to constitute a significant predictor of psychological well‐being. Later, Rosenfeld et. al. (1998) found that, compared with parents, teacher and friends, neighborhood support plays an indirect rather than a direct role, in influencing students’ perception of the types of social support they receive. Another explanation suggested by Rosenfeld et. al. (1998: 304) was that neighborhood support may have an influence only in the absence of the support from more proximate sources such as parents, fiends or teachers.
The safety of the neighborhood is also a factor influencing various dimensions of school success. Bowen and Bowen (1999) show that measures of neighborhood danger were slightly more predictive of school outcomes than measures of school danger. Rosenfeld et al. (2006) indicated that neighborhood danger, especially when experienced personally, had an important negative influence on school attendance, trouble avoidance, and school satisfaction, and less influence on grades. In particular, crime in the neighborhood has a considerable

HORAȚIU RUSU, ANCA BEJENARU
76
negative influence on learning behavior (Nash, 2002). Plybon et al. (2003) showed that the students’ perception of their neighborhood as being cohesive (defined as perception of neighborhood risk, integration and satisfaction) was associated with positive school outcomes.
Another dimension intensively analyzed is friends’ support. In different studies, peer‐group support was associated with students’ orientation for pursuing socially responsible goals at school (Wentzel, 1998), with students’ achievement through motivational and affective pathways (Ahmed et al., 2008). At the same time, Buchanan and Bowen (2008) show that, at various levels of adult support, peer‐group support is an important contributor to students’ psychological well‐being. A number of researchers show that deviant conduct and dropout peers increase the probability of behavioral problems, drug use and school dropout (Fergusson and Horwood, 1998; Ary et al., 1999, Ellenbogen and Chamberland, 1997; Williams, Ayers, and Arthur, 1997). Ellenbogen and Chamberland (1997) show that the deviant conduct of peers influences less girls’ behavior, as compared to boys’ behavior. At the same time, Ary et al. (1999) demonstrate that although deviant friends have the biggest influence in determining problematic conduct, parental monitoring and family factors, such as conflict and involvement, could prevent this developmental process. The risk of dropping out increases when the student is involved in peer groups with a non‐educational orientation (low valuation of school, outside of school or working) (South, Baumer, and Lutz, 2003; Ellenbogen and Chamberland, 1997; Goodenow and Grady, 1993; Delgado‐Gaitan, 1986).
Methodology, indicators and measurement
Following the ideas presented above, we analyze further the factors connected to the academic performance in rural Romania. Thus, our empirical analysis aims at answering the following question: “Which variables influence most the academic performance of gymnasium students in rural Romania?” We know that in general, Romanian students from rural areas perform worse than students from urban areas (see Miclea et al., 2007: 8; Voicu & Vasile, 2009), but nevertheless an assessment of their academic performance using a School Success Profile based instrument (see Bowen, Rose and Bowen, 2005) was not yet done.
The School Success Profile (SSP) aims at providing a comprehensive instrument (questionnaire) that collects information on 22 variables (conceived as summary scales including multiple items) concerning student’s social environment and individual adaptation (Bowen, Rose and Bowen, 2005: 22). The variables we use in our analysis represent only a part of the variables used by Bowen et al. (2005), and they are either approximate or similar with the variable constructed by them. The details of constructing our variables are presented below. They belong to the following dimensions: individual, family, friends and neighborhood.
FACTORS INFLUENCING SCHOOL SUCCESS IN RURAL ROMANIA: A CASE STUDY BASED ON …
77
Besides these dimensions, variables concerning socio‐economic status dimensions were added to the analysis. All items, except from socio‐demographic variables, represent students’ subjective accounts of the given dimensions.
The sample we used represents a sub‐sample of 467 students living in rural areas of Romania, extracted from a national sample of 2456 cases. Data were collected in 2009. The students are 6th to 8th grade, aged 11‐16.
Although in the current literature multilevel analysis have become commonplace when assessing school performances (Hox, 2002; Goldstein, 2003; Bickel, 2007; etc), due to data constraints (less than 20 cases on the second level – school or locality level – and some cases where less than 30 cases on the first level – individual level), we decided to use the uni‐level multiple regression analysis.
The dependent variable in our study is “school success”, operationalized as academic performance. It is measured on an index computed from two variables, as an additive scale. The first variable measures the self‐reported average grades received in the last semester, and varies on a scale from 4 to 10, where 4 denote worst (class failed) and 10 best performances (excellent). The second variable measures self‐ranking in comparison with the average grades of classmates and varies on a scale from 1 to 5, where 1 means that the student considers his/her averages much worse than those of most of the colleagues, and 5 means that the student consider his/her averages much better than those of most of the colleagues. A similar method of constructing academic performance as dependant variable was used by Bowen, Rose and Bowen (2005: 159) or Iovu and Porumb (2009: 119).
The independent variables belong to the following categories (based on the dimensions they try to measure): socio‐economic status dimension, individual, family, friends, and neighborhood.
The independent variables belonging to the socioeconomic status dimension are: the family’s maximum stock of education, gender, social status, the number of parents living in the household and age. The family stock of education is measured as the maximum level of education between parents on the ISCED scale. A similar measure of family education is used by Voicu and Vasile (2009: 126). Gender is a dummy variable where female is coded 1 and male is coded 0. Social status is measured through a dummy variable indicating that the student benefits from scholarship granted on social grounds (coded as 1, whereas no scholarship on social grounds is coded as 0). Parent’s presence in the household is another measure of the family background. It is computed as an additive index from two dummy variables measuring the presence of each parent in the household, so that it varies from 0 to 2, where 0 means that the student is not living with his/her parents, 1 means that the student is living with one parent, and 2 means that the student is living with both of his/her parents.

HORAȚIU RUSU, ANCA BEJENARU
78
An independent variable pointing the confluence between the socio‐demographic status and the structural setting of the school is the student’s learning language variable. Its insertion into our analysis is justified by the ethnic composition of the sample (about 9% of the sample are Hungarian and Roma ethnics). It was used due to the fact that numerous studies (Rivera 1983, 1984; Cummins, 1986; etc) discuss the relation between language mastery and academic performance, showing that better language proficiency conducts to better school results. The variable measuring the learning language is a dummy variable where learning in one’s mother’s tongue was coded as 1.
The independent variables measuring the individual dimension are the academic self concept operationalized as beliefs about one’s own academic performance and self‐reported health status.
The beliefs about one’s own academic achievement are defined here as an optimistic orientation of self‐efficacy in the future. The academic achievement beliefs index is computed as an additive index of twelve items (Cronbach's Alpha, 0.870, pointing the one‐dimensional structure of the index) each measured on a 4‐point scale (see also Hărăguş, Dămean and Roth, 2009: 29). The twelve items are: a) I am confident about my future; b) I know I will be successful in the future; c) I know how my life shouldn’t look like; c) I know what I need to be a successful adult; e) I feel I am on the right way; f) I am trying to maximize my chances for a better future; g) There is a strong relation between school success and life success; h) I am ready to work hard to have a better life; i) I am convinced I have all I need to be successful; j) I am sure I will graduate high school; k) After I will graduate a high school I want to attend a university; l) I see myself doing important things in life.
The evidence of good health is indicated by the absence of the following symptoms or physical illness over the past seven days: a) lethargy; b) trouble going to sleep at night; c) tired or sleepy most of the day; d) upset stomach/stomach ache; e) headache; f) nausea or vomiting; g) dizziness or fainting; h) other aches and pains; i) trouble with your nerves. The nine items are measured on a 3‐point scale (none; one or two days; three or more days). We recoded each item as dummy variable (none, coded 0, versus the other possible answers, coded 1) and then computed an additive index (Cronbach's Alpha of 0.792). A similar procedure was adopted by Bowen, Rose and Bowen (2005: 139) or Hărăguş, Dămean and Roth (2009:29).
The independent variables measuring the influence of the family dimension on the academic performance are: parent’s expectations regarding student’s school behavior and, home academic environment.
Eleven 3‐point scale items (not upset; somewhat upset; very upset) assess student’s perceptions of parents’ expectations of their school behavior.

FACTORS INFLUENCING SCHOOL SUCCESS IN RURAL ROMANIA: A CASE STUDY BASED ON …
79
The question addressed to the students is “How upset would the adults in your home be with you if they knew the following things happened at school?”. The items are: a) you turned in your homework late or not at all; b) you showed up for school late (unexcused); c) you cut a class; d) you received a mark below 5 on your report card; e) you made fun of another student; f) you picked on another student; g) you misbehaved in class; h) a teacher sent you to the principal’s office for misbehavior; i) you got in a physical fight with another student; j) you got into an argument with a teacher; k) you carried a weapon to school. The variable we use in the analysis is an additive index (Cronbach's Alpha 0.940) based on these items. A similar procedure was adopted by Bowen, Rose and Bowen (2005: 133).
Home academic environment is assessed with seven items each measured on a 3‐point scale (never; once or twice; more than twice). Students report if they discussed during the past 30 days the following with an adult who lives in their home: a) selecting courses or programs at school; b) school activities or events that interest you; c) things you’ve studied in class; d) current events; f) your plans for the future; g) work/career choices; h) your plans for college. We recode each item as a dummy variable (never, coded 0, versus the other possible answers, coded 1) and then computed an additive index (Cronbach's Alpha 0.830). A similar procedure was adopted by Bowen, Rose and Bowen (2005: 126) except that they used an eight item in the index construction: politics discussions.
The independent variable measuring the influence of the friends dimension on the academic performance is friends support. This is assessed with five items, each measured on a 3‐point scale: a) not like me; b) a little like me; c) a lot like me. The students have to evaluate how well does each of the following statements describe them: a) I can trust my friends; b) I am able to tell my problems to my friend; c) I feel close to my friends; d) I can count on my friends for support; e) I can talk to my friends about things that bother me. We constructed an additive index with all these items (Cronbach's Alpha 0.865). A similar procedure was adopted by Bowen, Rose and Bowen (2005: 110).
The independent variable assessing the impact of the neighborhood dimension is neighborhood youths' behavior. We decided to construct an additive index (Cronbach's Alpha 0.634) with only 3 of the nine variables measuring youths’ behavior in SSP, namely those measuring youths’ positive behavior (Bowen, Rose and Bowen, 2005: 92). The variables, initially measured on a four‐point scale (very unlikely; unlikely; likely; very likely) were first recoded as dummy variables. The students were asked how likely young people about their age, living in their neighborhood, would be to do the following types of things: a) Make good grades in school; b) Graduate from high school; c) Find a job or go to college after completing high school.
HORAȚIU RUSU, ANCA BEJENARU
80
Results and discussion
The analysis presented further (Table 1) show the results of OLS regression analysis explaining academic performance in rural Romanian schools. Seven cases were eliminated from the analysis, being considered outliers (values differ with above 2 standard deviations from the mean). No co‐linearity effects have been identified (all VIF values are below 2 and the tolerance statistics are above 0.8).
Out of the set of independent variables used in the model, eight variables contribute to explaining some of the variation in the dependent variable; the most important influence is held by the set of socio‐demographic variables, followed closely by variables related to the individual and family dimensions.
Among the group of socioeconomic status variables, family’s stock of education, being a female, benefiting from scholarship on social grounds, the number of parents present in the household, and student’s age have significant effects in all models. Cultural capital (measured by means of the maximum stock of education indicator) proves to be an important predictor of school success, as expected after reading the literature (Chapman, 2003). Results show that the higher the stock of family members’ education, the higher the academic results of students. The total effect of this variable is very important, being the third in the overall model. On average, female students from rural areas reported significantly better results than their male peers. The total effect of this variable is also important. Similar results concerning the correlation between gender and school participation in Romania were reported by Voicu and Pop (2000:141). Students benefiting of scholarships on social grounds perform worse than their better‐off peers. Previous studies also pointed at the negative effects of low economic resources of the family (Nash, 2002).The total effect of this variable in the overall model is almost as important as the effects of gender. The variable measuring the number of parents living in the household has an important positive effect: students living with their parents perform better than their peers from lone‐parent families or those who grew up in the absence of their parents. However, the total effect is relatively small. The last socio‐demographic indicator used in the analysis was the age of students. The results show that the younger the student, the higher the probability of good academic performance. The total effect of this variable in the overall model is also important. It is possible that its effect is induced by the increasing implication (with age) of students in household chores.
The indicator measuring if students learn in their mother tongues is significant only for the first model. The results are convergent with the previously mentioned theories; showing that learning in one’s mother’s tongue is conductive to better results than learning in another tongue (in this case, Romanian). Nevertheless, the total effect of this variable is relatively small.

Table 1.
Factors influencing academ
ic perform
ance
Variable
Model 1
Model 2
Model 3
Model 4
Model 5
Variable
dimension
B p
β
B p
β
B p
β
B p
β
B
β
Constant
12.161
***
8.934***
6.843***
6.572***
6.598***
family's maximum
stock of
education
0.476***0.213
0.401***0.180
0.314
**0.140
0.319
**0.142
0.326
**0.146
girl – YES
0.637
**0.153
0.588
**0.141
0.529
**0.127
0.522
**0.125
0.478
**0.115
scholarship on social grounds ‐YES
‐0.824
**‐0.136
‐0.744
**‐0.123 ‐0.746
**‐0.124
‐0.741
**‐0.123
‐0.689
**‐0.114
number of parents living with
0.485
**0.130
0.391
* 0.105
0.341
*0.091
0.351
* 0.094
0.351
* 0.094
socio
demographic st
udents' age
‐0.315
**‐0.147
‐0.298
**‐0.139 ‐0.273
**‐0.127
‐0.276
**‐0.128
‐0.270
**‐0.126
school
related
learns in mothers' tongue ‐ YES
0.685
* 0.099
0.348
0.050
0.372
0.054
0.365
0.053
0.313
0.045
Optim
istic academic achievement
beliefs in the future
0.088***0.289
0.069***0.228
0.066***0.219
0.063***0.209
individual
factors
healthy – YES
0.085
**0.096
0.067
+0.076
0.061
0.068
0.053
0.059
school behavior expectations
0.081***0.257
0.077***0.245
0.072***0.228
family
home academ
ic environment
0.124
+0.088
0.124
+0.087
0.107
0.076
friends
friends’ support
0.041
0.049
0.035
0.041
neighborhood Neighborhood youths' positive
behavior
0.211
* 0.109
adjusted R
2
14.25%
23.18%
30.94%
30.96%
31.86%
R2 change
8.93%
7.76%
0.02%
0.90%
Note: *** p < 0.001, ** p < 0.01, * p < 0.05, + p < 0.1

HORAȚIU RUSU, ANCA BEJENARU
82
The second set of variables measures the individual dimension influence on school performance. Being optimistic proves to be a factor highly correlated with school success. The total effect of this variable is very important, being the second most influential factor in the overall model. Although health is significant when introduced in the initial model, it loses its significance in the total model, which includes all independent variables. Nevertheless, the variable shows that being healthy is influential in school success.
The coefficients of the variables in the family dimension group show that the perceived expectation of the family towards school behavior is the most influential indicator of academic performance: the higher the perceived expectations, the better the school results. This is the most influential variable in the total model. The other variable assessing the family dimension measured through students’ perceptions, is the home academic environment. Although it is significant when introduced in the initial model, it loses its significance in the total model. However, this variable shows that the stronger the orientation towards the academic sphere of the home/family environment is, the higher are the student’s performances.
The variable approximating friends’ dimension, friends’ support, has no significant impact on the dependent variable. It shows that the academic results are more or less the same, no matter of friends support.
The neighborhood dimension, measured through the perceived attitude towards school of young persons in the neighborhood, has a significant impact on school success. The more positive the attitude towards school among young persons from the neighborhood, the better the academic results of students. It is important to notice that, when controlling for neighborhood effects, the impact of home academic environment on school performance diminishes. This could mean that the social norms and models provided by the neighborhood youths provide, at this age, a stronger referential for students’ strategies towards school and career‐orientation than the models provided by parents. The effects we could notice here are somehow convergent with the remark of Bowen and Chapman (1996), that the neighborhood dimension constitutes a stronger predictor of student adjustment than the family dimension, namely the parent support indicator. The predictive power of attitudes among young persons from the neighborhood is one of the strongest in our model, pointing out that more attention should be given to this dimension in further investigations carried out in Romania.
Nevertheless, our analysis demands a cautious reading, given that we have encountered several limitations. One of them concerns the significance levels in the models, which can be explained by the characteristics of the sample. An accurate reading of the significance levels is: if the sample were representative, then the results obtained could be extended for the whole

FACTORS INFLUENCING SCHOOL SUCCESS IN RURAL ROMANIA: A CASE STUDY BASED ON …
83
population with a probability of “p”. Another one refers to the construction of the dependent variable: we acknowledge that, due to the different ranges of the scale, the first variable composing the index (self‐reported grades) has bigger influence on the scale than the second one (self‐ranking in comparison with the classmates’ average grades); still, we obtained similar results for our models when the two variables comprising the index were combined using the principal component analysis method.
A third set of cautions refers to the fact that we were not able to control, due to the lack of data, the influences the aggregate levels of community/locality (e.g. community development indices) and school (e.g. school size) in our models. However, in another study, where we used similar models with those presented here (Rusu and Bejenaru, 2010), we have tried to verify the impact of the aggregate level of the community, using a variable that indicated the degree of community development. We assumed that, in general, due to the territorial profile of the socio‐economic development in Romanian counties, the degree of development of localities is negatively correlated with the distance between the locality and the administrative center of the county, measured in km), Surprisingly, the results showed an inverse relation: the farther a locality is from the county’s residential center, the better the academic results of the children. The explanation we put forward (to be tested in further studies), is that the distance actually measures other aspects. One explanation could be the indulgence of the teachers: due to the limited number of students and economic constraints, in schools from remote localities teachers tend to be more indulgent and give bigger grades hoping to preserve their jobs. Another explanation could be that probably the best students form the rural localities, who are near the county’s administrative center, study in the city, and not in their rural residence; in this way the average academic achievements of the remaining students in the school from the rural locality.
Finally, the last set of cautions in reading our results concerns the type of data we used: most of them measure subjective accounts and perceptions, i.e. they do not constitute direct measures of families’, friends’ or neighborhoods attitudes, values and actions.
Conclusions
Romania presents a series of cumulative factors that create a gap between schools from rural areas and schools from urban areas (Miclea et. al., 2007). Poor infrastructure, lack of qualified personnel, lack of proper funding, a significantly lower level of socio‐economic status of the people living in rural areas, and the participation of children in household work represent the most salient causes of the problem set forth on the political and the public agenda.

HORAȚIU RUSU, ANCA BEJENARU
84
In our paper, we addressed, along with the socio‐economic and individual factors, two key microsystems that affect school performances: the family and the community (operationalized as friends and neighborhood). An overall interpretation of our results indicate that, when controlling for other dimensions, factors related to the family are the most important in influencing academic results. In the total model, the most powerful predictor of academic performance is the expectation of the family concerning school behavior. Nevertheless, the final model brings into attention the importance of the neighborhood dimension, especially the attitude of young persons from the neighborhood towards school. These finding ask for further exploration, as it could have great implications for public policies in the field of education. They highlight the demand to design educational policies and intervention programs that have a broader approach, considering not only the school and the family, but also the neighborhood dimension.
REFERENCES
Ahmed, W., Minnaert A., van der Werf, G. and Kuype, H. (2008). Perceived Social Support
and Early Adolescents’ Achievement: The Mediational Roles of Motivational Beliefs and Emotions. Journal of youth and adolescence, 39 (1): 36‐46.
Ary, D.V., Duncan, S.E., Biglan, A., Metzler, C.W., Noell, J.W. and Smolkowski, K. (1999). Development of adolescent problem behavior. Journal of Abnormal Child Psychology, 27 (2): 141‐150.
Bernstein, B. (1975). Towards a theory of educational transmissions. London: Routledge & Kegan Paul.
Blau, P.M. and Duncan, O.D. (1967). The American Occupational Structure. New York: Wiley. Blau, D.M. (1999). The effect of income on child development. Review of Economics and
Statistics, 81 (2): 261–276. Boudon, R. (1974). Education, Opportunity, and Social Inequality: Changing Prospects in
Western Society. New York: Wiley. Boudon, R. (1973). L'inégalité des chances. la mobilité sociale dans les sociétés industrielles.
Paris: A. Colin. Bourdieu, P. and Passeron, J‐C. (1990). Reproduction in education, society and culture.
London: Sage. Bowen, N.K. and Bowen, G.L. (1999). Effects of crime and violence in neighborhoods and
schools on the school performance of adolescents. Journal of Adolescent Research, 14 (3): 319‐342.
Bowen, Natasha K., Bowen, Gary L. and Ware, William B. (2002). Neighborhood Social Disorganization, Families, and the Educational Behavior of Adolescents. Journal of Adolescent Research, 17 (5): 468‐490.

FACTORS INFLUENCING SCHOOL SUCCESS IN RURAL ROMANIA: A CASE STUDY BASED ON …
85
Bickel, R. (2007). Multilevel analysis for applied research: it’s just regression. New York: Guilford Press.
Bowen, G.L. and Chapman, M.V. (1996). Poverty, Neighborhood Danger, Social Support, and the Individual Adaptation Among At‐Risk Youth in Urban Areas. In Journal of Family Issues, 17(5): 641‐666.
Breen, R. and Yaish, M. (2006). Testing the Breen‐Goldthorpe Model of Educational Decision Making. In S.L. Morgan, D.B. Grusky and G.S. Fields (eds.): Mobility and Inequality. Frontiers of Research in Sociology and Economics, Stanford: Stanford University Press, pp. 232–58.
Brewster, A.B. and Bowen, G.L. (2004). Teacher Support and the School Engagement of Latino Middle and High School Students at Risk of School Failure. Child and Adolescent Social Work Journal, 21(1): 47‐67.
Brody, N. (1992). Intelligence. New York: Academic. Bronfenbrenner, U. (1981). The ecology of human development. Cambridge: Harvard
University Press. Buchanan, R.L. and Bowen, G.L. (2008). In the Context of Adult Support: The Influence of
Peer Support on the Psychological Well‐Being of Middle‐School Students. Child and Adolescent Social Work Journal. 25(5): 397‐407.
Case, Anne, Lubotsky D. and Paxson C. (2002). Economic status and health in childhood: The origins of the gradient. The American Economic Review, 92(5): 1308‐1334.
Ceballo, R., McLoyd, V.C. and Toyokawa, T. (2004). The Influence of Neighborhood Quality on Adolescents’ Educational Values and School Effort. Journal of Adolescent Research, 19(6): 716‐739.
Chamorro‐Premuzic, T. and Furnham, A. (2003). Personality predicts academic performance: Evidence from two longitudinal university samples. Journal of Research in Personality. 37 (4): 319‐338.
Chamorro‐Premuzic, T. and Furnham, A. (2005). Personality and intellectual competence. New Jersey: Lawrence Erlbaum Associates.
Chapman, M.V. (2003). Poverty level and school performance: Using contextual and self‐report measures to inform interventions. Children & Schools, 25 (1): 5‐17.
Chatman, J.A. (1989). Improving interactional organizational research: A model of person‐organization fit. Academy of Management Review, 14(3): 333 – 349.
Coleman, J.S. (1966). Equality of Educational Opportunity, Washington, U.S. Department of Health, Education, and Welfare, Office of Education.
Covington, M.V. (1992). Making the grade: A selfworth perspective on motivation and school reform. New York: Cambridge Univ. Press.
Covington, M. (2000). Goal Theory, Motivation, and School Achievement: An Integrative Review. Annual Review of Psychology. 51: 171‐200.
Crane, J. (1991). The Epidemic Theory of Ghettos and Neighborhood Effects on Dropping Out and Teenage Childbearing. American Journal of Sociology. 96 (5): 1226‐1259.
Cummins, J. (1986). Empowering minority students: A framework for intervention. Harvard Educational Review, 56: 18‐36.

HORAȚIU RUSU, ANCA BEJENARU
86
David, G. (1998). Ethnic Differences in Neighborhood Effects on the School Attendance of Boys in Early Chicago. History of Education Quarterly. 38(1): 17‐35.
Delgado‐Gaitan, C. (1986). Adolescent Peer Influence and Differential School Performance. Journal of Adolescent Research, 1(4): 449‐462.
De Raad, B., and Schouwenburg, H.C. (1996). Personality in learning and education: A review. European Journal of Personality, 10: 303–336.
Duncan, G.J., and Brooks‐Gunn, J. (1997). Consequences of growing up poor. New York: Russell Sage Foundation.
Eccles, J.S., and Wigfield, A. (2002). Motivational beliefs, values, and goals. Annual Review of Psychology, 53: 109‐132.
Edwards, L.M., and Grossman, M. (1979). The Relationship Between Children’s Health and Intellectual Development. In S.J. Mushkin and D.W. Dunlop (eds.): Health, What is it Worth? Measures of Health Benefits. New York: Pergamon Press. pp 273‐314.
Ellenbogen, S., and Chamberland, C. (1997). The peer relations of dropouts: a comparative study of at‐risk and not at‐risk youths. Journal of Adolescence. 20(4): 355‐367.
Epstein, J.L., and Sanders, M.G. (2000). Connecting home, school, and community: New directions for social research. In M.T. Hallinan (ed.): Handbook of the sociology of education. New York: Kluwer Academic, pp. 285‐306.
Fergusson, D.M., and Horwood, L.J. (1998). Early conduct problems and later life opportunities. Journal of Child Psychology & Psychiatry, 39 (8): 1097‐1108.
Galenson, D.W. (1998). Ethnicity, Neighborhood, and the school Attendence of Boys in Atebellum Boston. In: Journal of Urban History, 24, pp. 603‐626.
Goodenow C., and Grady, K.E. (1993). The Relationship of School Belonging and Friends' Values to Academic Motivation Among Urban Adolescent Students. Journal of Experimental Education, 62(1): 60‐71.
Goldstein, H. (2003). Multilevel statistical models. London: Arnold. Grossman, M. (1975). The Correlation between Health and Schooling. In Terleckyj,
Nestor E. (ed.), Household Production and Consumption. New York: Columbia University Press for the National Bureau of Economic Research.
Gutman, L., McLoyd, V.C., and Toyokawa, T. (2005). Financial strain, neighborhood stress, parenting behaviors, and adolescent functioning of urban African American boys and girls. Journal of Research on Adolescence, 15: 425‐449.
Hill, N.E. et al. (2004), Parent‐Academic Involvement as Related to School Behavior, Achievement, and Aspirations: Demographic Variations Across Adolescence, Child development, 75(5): 1491‐1509.
Hox, J. (2002). Multilevel Analysis. Techniques and Applications. Mahwah, NJ: Lawrence Erlbaum Associates.
Jencks, C. (1973). Inequality: a reassessment of the effect of family and schooling in America, London: Allen Lane.
Jencks, C. (1979). Who gets ahead? The determinants of economic success in America. New York, NY: Basic Books.
Jensen, A.R. (1998). The g Factor: The Science of Mental Ability. New York: Praeger.

FACTORS INFLUENCING SCHOOL SUCCESS IN RURAL ROMANIA: A CASE STUDY BASED ON …
87
Jigău, M. et al. (2000). Învăţământul rural din România: condiţii, probleme şi strategii de dezvoltare. Bucureşti: Ministerul Educației Naționale, Institutul de Ştiințe ale Educației.
Lee, J., and Bowen, N.K. (2006). Parent involvement, cultural capital and the achievement gap in elementary school children. American Educational Research Journal, 43: 193‐218.
Marsh, H.W. (1990). The causal ordering of academic self‐concept and academic achievement: A multiwave, longitudinal panel analysis. Journal of Educational Psychology, 82: 646‐656.
Marsh, H.W. (1993). Academic self‐concept: Theory measurement and research. In J. Suls (Ed.), Psychological perspectives on the self, Hillsdale, NJ: Erlbaum. pp. 59‐98.
Marsh, H.W., and Craven, R. (1997). Academic self‐concept: Beyond the dustbowl. In G. Phye (Ed.), Handbook of classroom assessment: Learning, achievement, and adjustment. Orlando, FL : Academic Press. pp. 131‐198.
McGrew, K.S. (2007). Beyond IQ: A Model of Academic Competence and Motivation (Institute for Applied Psychometrics). http://www.iapsych.com/acmcewok/map.htm, 24/March/ 2010.
Miclea, M. et al. (2007). România educaţiei, România cercetării – Raportul Comisiei Prezidenţiale pentru analiza şi elaborarea politicilor din domeniile educaţiei şi cercetării. http://edu.presidency.ro/upload/raport_edu.pdf acccesed, 22/March/2010.
Mitchell, J.V. Jr. (1992). Interrelationships and predictive efficacy for indices of intrinsic, extrinsic, and self‐assessed motivation for learning. Journal of Research and Development in Education, 25 (3): 149‐155.
Nash, J.K. (2002). Neighborhood effects on sense of school coherence and educational behavior in students at risk of school failure. Children & Schools, 24(2): 73‐89.
Pallas, A.M. (2006). A subjective approach to schooling and the transition to adulthood. In Ross Macmillan (ed.): Constructing adulthood: Agency and subjectivity in adolescence and adulthood. Advances in Life Course Research.11: 173‐197.
Plybon, L.E., Edwards, L., Butler, D., Belgrave, F.Z., and Allison, A.W. (2003). Examining the link between neighborhood cohesion and school outcomes: The role of support coping among African American adolescent girls. Journal of Black Psychology, 29(4): 393‐407.
Purkey, W.W. (1970). The selfconcept and school achievement. Englewood Cliffs: Prentice Hall.
Reay, D. (2009). Sociology, social class and education. In Apple, M.W., Ball, S.J., Gandin, L.A.: The Routledge International Handbook of the Sociology of Education, London: Routledge, pp. 396‐404.
Richman, J.M., and Bowen, G.L. (1997). School failure: An ecological‐interactional‐developmental perspective. In M.W. Fraser (ed.): Risk and resilience in childhood: An ecological perspective. Washington, DC: NASW Press, pp. 95‐116.
Rivera, C. (ed.). (1984). Language proficiency and academic achievement. Clevedon, England: Multilingual Matters.
Rivera, C. (ed.). (1983). An Ethnographic/Sociolinguistic Approach to Language Proficiency Assessment. Clevedon, England: Multilingual Matters.

HORAȚIU RUSU, ANCA BEJENARU
88
Rosenfeld, L.B., Richman, J.M., and Bowen, G.L. (1998). Low Social Support among At‐Risk Adolescents. In Social Work in Education, 20(4): 245‐260.
Rosenfeld, L.B., Richman, J.M., and Bowen, G.L. (2000). Social support networks and school outcomes: The centrality of the teacher. Child and Adolescent Social Work Journal, 17(3): 205‐226.
Rosenfeld, L.B., Richman, J.M., Bowen, G.L. and Wynns, S.L. (2006). In the face of a dangerous community: The effects of social support and neighborhood danger on high school students’ school outcomes. Southern Communication Journal, 71(3): 273‐289.
Roth, M., Dămean, D., and Iovu, B. (2009). Succesul şcolar la intersecţia factorilor sociali. Cluj: Presa Universitară Clujeană.
Rusu, H., and Bejenaru, A. (2010). School success in rural Romania: a case study. paper presented at the National Conference Cercetare şi Politici Sociale, 28‐29 May, Oradea, Romania.
South, S.J., Baumer, E.P., and Lutz, A. (2003). Interpreting community effects on youth education attainment. Youth & Society, 35(1): 3–36.
Stipek, D.J. (1984). Young Children’s Performance Expectations. In Nicholls, J., and Maehr, M. (eds): Advances in Motivation and Achievement, Vol. 3: The Development of Achievement Motivation, Greenwich: Academic Press.
Stipek, D.J (1988). Motivation to Learn: From Theory to Practice. Englewood Cliffs: Prentice Hall.
Voicu, B., and Pop, L. (2000). Grupuri de risc şi cauze ale neparticiparii şcolare. Rezultatele şcolare. In Jigău, M. (ed.): Învăţământul rural din România: condiţii, probleme şi strategii de dezvoltare. Bucureşti: Ministerul Educației Naționale, Institutul de Ştiințe ale Educației, pp. 140‐163.
Voicu, B., and Vasile, M. (2009). Inegalitățile rural‐urban şi masificarea educației superioare din România. In A. Hatos and S. Săveanu (eds.): Educaţia şi excluziunea socială a adolescenţilor din România, Oradea: Editura Universității Oradea, pp. 119‐144.
Van de Werfhorst, H.G. and Hofstede, S. (2007). Cultural capital or relative risk aversion? Two mechanisms for educational inequality compared. The British Journal of Sociology, 58(3): 391‐415.
Wentzel, K.R. (1998). Social relationships and motivation in middle school: The role of parents, teachers, and peers. Journal of Educational Psychology, 90(2): 202–209.
Wells, T., Sandefur, G.D. Hogan. D.P. (2003). What Happens after the High School Years among Young Persons with Disabilities? Social Forces, 82(2): 803‐832.
Woolley, M.E., and Bowen, G.L. (2007). In the context of risk: Supportive adults and the school engagement of middle school students. Family Relations, 56(1): 92‐104.
Woolley, M.E., and Grogan‐Kaylor, A. (2006). Protective family factors in the context of neighborhood: Promoting positive school outcomes. Family Relations, 55(1): 93‐104.
*** (2009). Raport asupra stării sistemului naţional de învăţământ [Report on the situation of the National Education System]. Bucureşti: Ministerul Educației, Cercetării şi Inovării (MECI).

STUDIA UNIVERSITATIS BABEŞ‐BOLYAI, SOCIOLOGIA, LV, 1, 2010
MULTILEVEL ANALYSIS OF ACADEMIC ACHIEVEMENTS OF UPPER SECONDARY STUDENTS IN A ROMANIAN CITY: EFFECT OF COMPOSITION, RESOURCE ALLOCATION
OR DIFFERENTIATION?
ADRIAN HATOS*
ABSTRACT. This article aims to investigate through hierarchical linear regression the relationships of academic performances of students in grades 10‐12 from the city of Oradea (North‐West Romania) with contextual variables describing the social composition of educational collectivities as well as the distribution of material and human resources. The sample is a subset of the initial two‐stage random sample of 3500 students from grades 8‐12, surveyed through a self‐administered questionnaire within the second wave of the longitudinal study entitled “Adolescents, future citizens”, funded by the National Council for Research in Higher Education through the research grant A497/2006. An important conclusion of the analysis is that more than half of the variation of school results is covered by differences between schools and classes. The type of school, its social composition and the distribution of human resources among schools correlate all significantly with the educational achievements of students net of individual and classroom variables. Compositional effects as well as segregation and differentiation of schools and students are reflected in the multilevel decomposition of academic performance. The article discusses the results having in mind 1) the theoretical status of presumed compositional effects; 2) the aims of improving school effectiveness altogether with reducing gaps in distribution of educational opportunities and 3) the methodological limitations of my analyses. Keywords: academic achievement, multilevel regression, compositional effects, methodology
Introduction
Equality of educational opportunities signifies primarily the equality of access to educational resources, a desirable feature with presumably direct effect on educational achievements. Access to school resources is a field of inquiry that is of particular interest for educational policies as school failure is one of the main avenues of social exclusion and of compromising of social cohesion and of human capital of a nation. * University of Oradea, E‐mail: [email protected]

ADRIAN HATOS
90
One process with serious effects on the equality of educational opportunities is differentiation of the school collectivities: the situation in which the differences between schools, or, in the case of inside school analysis, between student groups, are much stronger in terms of socio‐economic composition than the variations inside the school or, respectively, between individuals. Very important are, from this point of view the results of numerous studies worldwide according to which, with almost no exception, individual school results are influenced by the social composition of student collectivities. One stake of the interest in this topic springs from the fact that such inequalities are often important pieces in vicious causal mechanisms at the societal level. There are, in this regard, arguments that educational inequality contributes to the lowering of social cohesion (Green, Preston, & Sabates, 2003: 118‐140). Objectives of the paper
Processes of segregation appear very clear in the case of upper secondary cycle in Romanian education (which corresponds to the popularly called lyceum‐years, though only around half of the students in this cycle are enrolled in what are officially called the lyceums). Thus, various forms of competitive promotions (admission in the lyceums, lyceum graduation examinations) are transmitting the impact of socio‐economic background upon the student’s school career. Schools are themselves differentiated from an administrative viewpoint in several types which are in common sense considered as strongly overlapping with social hierarchies – the prestigious National Colleges, Theoretical Lyceums, School‐groups and Vocational Schools). More clearly it is nothing unexpected in stating that upper secondary schools in Romania are strongly segregated. My investigation aims to go beyond these intuitive conclusions by inquiring the level of differentiation in this level of education and, moreover, the strength of the relationship between educational results and social composition of schooling collectivities in a usual urban educational setting, i.e. high school students in a large Romanian city. I will separate between groups variation from between individual differences using multilevel analysis in explaining individual achievement. Moreover, building on existing theories relating academic performance to individual and contextual effects I will try to assess the weight of factors like social composition and distribution of resources on high‐school students in Oradea. The social factors of educational success
The international sociology of education literature is rich in establishing the factors of educational achievement at the level of student and his/her family. With respect to individual and family related factors, the thesis of reproduction of social inequalities though educational processes is one of the most firmly

MULTILEVEL ANALYSIS OF ACADEMIC ACHIEVEMENTS OF UPPER SECONDARY STUDENTS IN A ROMANIAN CITY
91
established conclusions of educational studies of the last decades. According to these studies, educational achievements are dependent on the material, educational and cultural endowments of the background families (Boudon, 1973; Bourdieu & Passeron, 1970; Coleman, 1966; Jencks, 1990).
Consequently, school performance should be in a positive relationship with the indicators of socio‐economic status of the families: material resources, educational capitals and cultural capital. The causal mechanisms linking such predictors with academic performance is, however not entirely clear existing contending theories in the area: some theorists underline the importance of material resources while others suggests that the main factor behind educational success are the educational and cultural (Lareau, 2000; OECD, 2004) resources of background families or the effects of capital are mediated through subjective factors like aspirations and motivations, as maintained by the well‐known Wisconsin model (see, for example Sewell and Hauser, 1975).
Continuing with individual predictors, one can highlight the importance of gender – the majority of research materials providing evidence of the better school performances of girls (PISA, 2001, 2007)1 or of age group, some researches recording the tendency of achievements to drop together with the increase in age of teenagers. Simmons and Blyth (1987) attributes these instances of decline to adjustment difficulties faced by teenagers. Leisure styles or sub‐cultures are also pointed at by researches as being a covariate of educational engagement and performance: many researches highlight the fact that bad educational results, dropout and juvenile delinquency are positively correlated with a party‐going and social leisure marked by risk behavior (drinking, substance abuse etc.) or, in the case of the teenagers with a working class background, according to Hagan (1991) even with later involvement in delinquent activities.
I close the list of predictors of academic achievement which appear with a remarkable constancy in surveys with the involvement in school‐based extracurricular activities. Despite of some methodological shortcomings of many of the researches in the field (Feldman and Matjasko, 2005; Fredricks and Eccles, 2005, 2006) the net image is that of general positive effects. The educational research literature had started in the 80s to underline consistently the value of considering contextual factors in accounting for the variance of academic achievement. However, studies addressing the issue of educational achievements in Romania that use multilevel techniques of multivariate analysis are quite scarce, although not considering within unit similarity, due to commonality of conditions or to processes of selection, is an evident error. To make the situation worse, academic achievement does not seem to be a
1 I am making general statements. There are, though, disciplines or kinds of tasks at which boys display systematically better results.
ADRIAN HATOS
92
topic at all, except for that of offspring of several groups that are known to be subject of severe deprivation or social exclusion, like the Roma or the students from the remote rural areas (Jigau, 2000; Jigau and Surdu, 2002). Some of the recent attempts at measuring the impact of contextual variables on academic achievement (Hatos, 2008; Tufiș, 2008) are affected by serious and unrecognized methodological limits.
The multilevel determinants of school performances
In 1966, James Coleman in his famous study on the Equality of educational opportunity asserted that the social composition of the student collectivity has a stronger relationship with achievement, net of student’s social background, than any other school‐level feature (Coleman, 1966: 325). More than 30 years later, the PISA 2000 survey has produced the same result that school social status, measured through the parents’ occupational status’, wealth’ and cultural capital’s averages have a significant impact on individual accomplishments in all countries. In many countries this compositional effect is more important than that of individual social background (PISA, 2001: 210). What is the causal mechanism relating social composition with individual achievement is a tricky question though. Thrupp, Lauder and Robinson (2002) highlight that alternative theories have been proposed for this issue: the most commonly known is the peer effect explanation forwarded by Coleman, according to which the collectivities can act upon individual students’ motivations, attitudes and aspirations thus influencing his/her achievements. Other alternative causal chains proposed in this area of research point into the direction of teacher or organizational and institutional reactions to specific social composition of the schools (Thrupp et al., 2002).
There are also, features of school context that have significant impact on academic results besides that of social composition. One important such characteristic is the school climate, the quality and the intensity of the cooperation between students and teachers and even between teachers themselves. The students that are learning in schools with positive climate tend to have better results than those that have a negative assessment of the relations in the school. Another important descriptor of school context is the quality of schools and teachers. Heyneman and Loxley (1983) maintained about schools in developing countries that their resources are even more important than the socio‐economic background of the students.
The study published by Coleman in 1966 had already emphasized the unexpected conclusion that school quality, especially the material endowment with various elements of educational infrastructure, is relatively unimportant for the production of educational achievement compared with the impact of families which appeared, ever since, as a key factor of educational success.

MULTILEVEL ANALYSIS OF ACADEMIC ACHIEVEMENTS OF UPPER SECONDARY STUDENTS IN A ROMANIAN CITY
93
More recent research which searched for the productivity functions of material investments in schools have ended with the same little expected outcome. Hence, a synthesis of 377 comparative international studies focusing on educational effectiveness shows that there is no evidence of significant effect on student achievement of any of the following variables considered as indicators of economic investment in education: the student‐teacher ratio, the level of teachers’ formal training, teachers’ experience, their salary and expenditures per students (Hanushek, 1997; Hanushek and Luque, 2003). Another economist of education reaches similar results using TIMMS data: instead of producing better performances, at country level, increased expenditures per student and smaller classes have significant negative relationships with results in mathematics and sciences (Woessmann, 2007).
The size of schools is also often related with students’ performances. The largely held view that small sized schools are favorable for obtaining good educational results is supported primarily by the records of negative correlations obtained between the size of educational institutions and variables measuring students’ affective adjustment to their school contexts (Mok and Flynn, 1996). Small sized schools determine better interpersonal relations, stimulate the involvement in extracurricular activities, provide more abundant opportunities for the development of students’ leadership potential, have fewer behavior problems, benefit from a better climate and experience lower dropout rates. The tests of direct relationship are not convincing however (idem).
Differentiation, segregation and educational outcomes
Contextual effects and school differentiation are strongly intertwined phenomena. Differentiation increases the homogeneity of schools, and enhances, supposedly, the social compositional effects. Since differentiation is produced usually mainly on the bases of previous achievement which adds to other selection and self‐selection criteria of whom most are based on capital considerations, one can infer that differentiation and segregation are partially produced by compositional effects in previous educational settings.
Differentiation is produced in most of the cases, having the effect of deepening of between schools inequality, through competitive examinations, which are rewarding individual merit or is the unexpected result of parents’ option and of selection decisions implemented in schools. Within a school, differentiation reflects usually the ability grouping of students (tracking) a practice with well known negative impact on average educational achievement. All the above selection, choice or promotion procedures entail social segregation of schools or classes because the criteria used for `meritocratic` differentiation among students have the tendency of being strongly associated with students’ socio‐economic background.

ADRIAN HATOS
94
Evaluations of effects desegregations of American schools have recorded the fact that these policies have had long term positive effects upon self‐esteem of graduates or upon the relationships between members of different ethnic and race groups (Schofield, 1995; Wells and Crain, 1994). Synthesizing the scarce longitudinal American educational results of the 80s and 90s of the previous century, Rumberger and Palardy (2005) record results which give evidence of the significant effect that the social composition of the schools, measured using a variety of features (SES, race, ethnicity), on academic achievement measured in various ways. Worth mentioning are also the results of the research synthesis by Hochschild and Skovronik (2003) according to which desegregation has had a differentiated effect, with a positive impact on the achievements of African‐American students without reducing those of Caucasian students. A clear result of the PISA surveys (see PISA, 2007) stresses the fact that early differentiation of students on the bases of abilities is associated with socio‐economic disparities but not with better general results. In fact, the higher the differentiating impetus within an educational system the more dispersed are the results of learning and the average results will lower. The PISA studies, made with students aged 15 have shown that all countries with top scores have comprehensive non‐marketized educational systems (Green, Preston, and Janmaat, 2006). In these countries ‐ like Finland and the Far‐Eastern countries ‐ the students are not tracked using various criteria like ability grouping and the choice of schools by parents or the students is not possible until the beginning of the upper secondary level. Moreover, most of the countries in the first 10 are among those in which the part of the variation of the achievement scores attributable to between schools differences and to socio‐economic background is low compared to the international comparison (PISA, 2007). Besides these arguments, the issue of differentiation is important as the relationship of school differentiation and contextual effects complicate the methodology of researching compositional effects. Considering the above mentioned mechanisms of differentiation and achievement, within group homogeneity of accomplishment is both a product of prior achievements and compositional effects (Thrupp et al., 2002). Evaluating the latter effect involves, therefore, controlling for the previous achievements. This is peculiarly the case with our sample of 10‐12 graders which had been placed in their schools and their classes after a merit‐based entrance competition. The data used in this research did not include reliable indicators of previous achievement so I cannot expect in this research to clearly measure the strength and direction of compositional effects. However, even if measures of prior achievement are missing, multilevel techniques can be employed to identify patterns of differentiation and possible contextual factors influencing individual achievement.

MULTILEVEL ANALYSIS OF ACADEMIC ACHIEVEMENTS OF UPPER SECONDARY STUDENTS IN A ROMANIAN CITY
95
Research objectives
In order to assess the important relationships mentioned above I have built multilevel models of formal indicators of academic achievement of a sample of high‐school students from Oradea, Romania. The models presented in this article will serve two conventional purposes followed in researches of this sort: 1) to separate the variances accounted at individual, class and school level; 2) the elaboration of a model that allows inferences concerning the relationships of collectivities’ features and individual educational achievements: social composition at the student bodies from the two available levels – of class and school, features of social organization of school level groups and the distribution of material resources and facilities and of human resources between the schools. The appropriate statistical tests will be performed while controlling for the individual level‐effects retained from the literature: the status reproduction effect, the impact of leisure style, of age and of gender. Data sources
The measures of the effects of class and school‐level variables on the individual academic performance were computed on a randomly selected two‐stage sample of 1428 students with valid and imputed values on the dependent variable, enrolled in grades 10‐12 at the moment of the study in lyceums and educational groups (grup școlar) in Oradea. The students were selected from 19 schools and 62 classes, a group composition that makes multilevel regression merely tentative as the number of third level units and of the second level units within the third level ones is rather small. The sample does not include the students without a living father nor the students that were enrolled in other type of educational institutions like the vocational schools.
The sample used in the following analyzes was a subset of the initial two‐stage random sample of 3500 students from grades 8‐12 surveyed through a self‐administered questionnaire within the second wave of the longitudinal study entitled `Adolescents, future citizens` funded by the National Council for Research in Higher Education (NCRHE) through the research grant A497/2006. Since the dependent variable in our research, which measures school performance, contains the answers to the question `What was your GPA in the previous semester?` and the data were collected at the end of the first semester of the 2007‐2008 school year, I have excluded from the sample students from grade 9 because their answers referred to grades from the previous academic year when they had been very likely enrolled in other schools. For similar reasons I have also excluded students from grade 8 because of the dramatic differences between upper secondary (grades 9‐12) and lower secondary (grades 5‐8) educational institutions.

ADRIAN HATOS
96
Variables
In accordance with the paper’s objective, the central concepts of our research are educational results, background socio‐economic status and the social composition of the schools and the distribution of resources within and between schools. The dependent variable in the following analyzes, educational achievement, was measured on a numeric scales using the GPA (Grade Point Average – conventional grading in Romanian school system) from the previous semester, that is the GPA obtained in the second semester of the academic year 2007‐2008. As the grading systems in Romanian schools represents an assessment of learning results with well‐known problems of validity and reliability I warn the reader that the results included in the present research do not refer to educational effectiveness but to process of production of school results with a merely presumable relationship of these results with the student’s abilities, effort and knowledge.
Replacing missing values for the dependent variable
The dependent variable had a high percentage of missing values (20% of students did not report their GPA from the previous semester). This has put a heavy burden on the analysis, inflating the standard errors and making the estimates less reliable. In order to attenuate this issue I have replaced the missing values using multiple imputations via multiple regression. The variables that had been used in order to replace the absent values were:
1. The student has attended academic contest (dichotomy) 2. The student had won academic prizes 3. The student has ever thought of quitting school (dichotomy)
The multiple regression of the dependent variable against the three variables has an R2 of 0,233. To assure the robustness of the results of parameter estimation using imputed dependent variables all the multilevel models have been repeated for three imputed data sets.
Other individuallevel variables
Student’s socio‐economic background was measured using two variables indicating the parents’ educational capital and, respectively, the material resources at home which are often mentioned in the literature as having a significant effect

MULTILEVEL ANALYSIS OF ACADEMIC ACHIEVEMENTS OF UPPER SECONDARY STUDENTS IN A ROMANIAN CITY
97
on academic achievement: 1) if the father holds a higher education certificate2; and 2) the score of home material resources which was computed by counting the home appliances mentioned as being held at home: automatic washing machine, car, personal computer, internet connection and mobile phone.
The school’s and classes’ social composition was measured using two aggregated variables:
‐ The percentage of students whose father have higher education certificate ‐ The average score of home material resources ‐ The average score of cultural resources (books, paintings etc.)
The indicators of variation of distribution of human resources have been measured only at the school level for a very simple reason, their variability within schools being much lower between classes than between different schools. The measure used in my analyses had been the percentage of teachers holding level 1 teaching certificate (between 16‐63%).
I have computed, using data from the county School Inspectorate several variables signifying the school’s material resources: student/computer ratio (between 4,6‐22,6) and if the school organizes a chorus (9 out of 19 schools have chorus).
Finally, another indicator regarded important in studies devoted to school success and its relations with the features of context, as mentioned above, is school size which has been measured with the number of students enrolled in the academic year 2007‐2008. This variable ranges from 331 to 2200 in our sample.
Modeling school performance using socio‐economic factors, either at individual or at aggregate level, requires the control through other characteristics that are well known for their impact on student results. The above variable scheme shows that I tried to avoid introducing in the models factors whose relationship with the dependent variable, even if statistically strong, is ambiguous considered the causal mechanism. In the preliminary analyzes I have used age and leisure but I have excluded individual measures of perception of educational climate and of involvement in extracurricular activities.
2 Using this indicator may seem disputable. Until the mid‐eighties of the previous century there were few doubts regarding the presupposition that the children status attainment depends in greater measure on the status of the father than that of the mother even in the most advanced capitalist societies (Goldthorpe, 1983). Changes that occurred recently in the social structure of advanced societies, especially the relative positions of men and women on the labor market imposed a reconsidering of this perspective. In this line, Korupp and Gazenboom (2002) have tested with data from USA, Germany and Holland several models of intergenerational transmission of SES controlling for the parents’ gender and concluded that the best solution is to consider the status of the dominant parent. It is beyond discussion the fact that, in Romania, this person is almost all the time, the man.

ADRIAN HATOS
98
Table 1.
Other independent variables included in the analysis by level of analysis
Characteristic Measurement Observation Individual level Gender Dichotomy 1=male, 0=female Age Numeric Active leisure Numeric Factor score of the most important component extracted
using Varimax rotation of ten numeric items of leisure (number of read books, frequency of trips, frequency of going out to theater etc.) The score correlates positively with the frequency of clubbing, going to disco, meeting persons of different gender, of alcohol consumption and going to parties)
Cultivated leisure
Numeric Factor score of the second component extracted using Varimax rotation of ten numeric items of leisure (see above for items). The score correlates positively with the number of books read, frequency of visits to museums, theater etc.
Class and school level Proportion of men
Numeric
Average satisfaction with school
Numeric Summated score of 4 Likert‐type items: How satisfied are you with…your grades? Your relations with colleagues? Your relations with the teachers? Your school, generally? The score ranges from 0 to 40 and has an alpha>0,7.
Index of involvement in extracurricular activities
Numeric Average of individual participation scores generated by counting the number of type of extracurricular activities in which the student participated during the previous year, from a list of 9.
School Type of school Dichotomy 1=Theoretic lyceum or national college; 0=educational
group. 11 out of the 19 schools included in the sample are theoretic lyceums or national colleges.
Source: Author’s composition.
On the other hand the corresponding aggregated measures were introduced as predictors at the level of schools and class. Moreover, in order to test the hypothesis that the present classification of upper secondary schools contributes greatly to the individual success or failure – students from differing categories of schools having unequally distributed chances of obtaining good
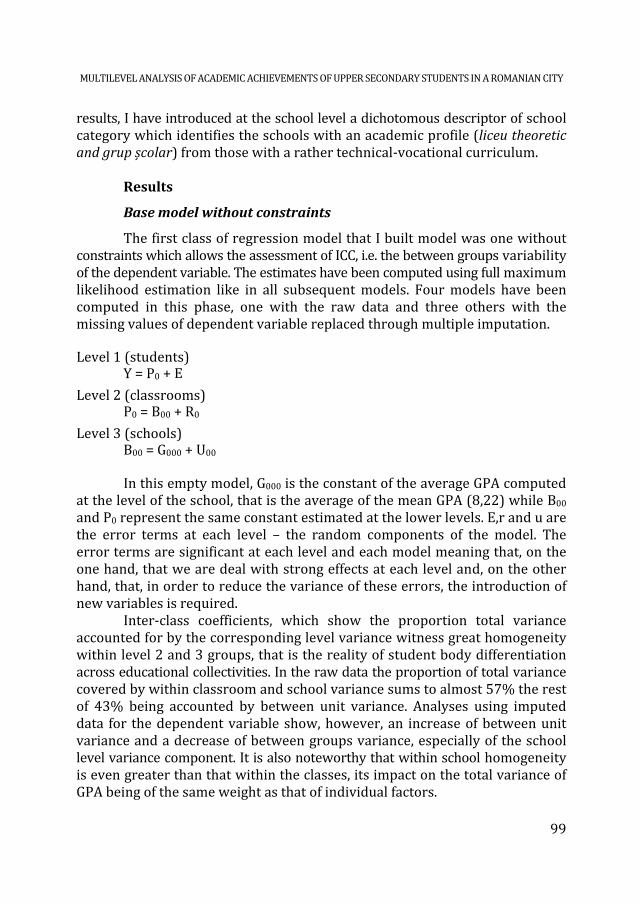
MULTILEVEL ANALYSIS OF ACADEMIC ACHIEVEMENTS OF UPPER SECONDARY STUDENTS IN A ROMANIAN CITY
99
results, I have introduced at the school level a dichotomous descriptor of school category which identifies the schools with an academic profile (liceu theoretic and grup școlar) from those with a rather technical‐vocational curriculum. Results
Base model without constraints
The first class of regression model that I built model was one without constraints which allows the assessment of ICC, i.e. the between groups variability of the dependent variable. The estimates have been computed using full maximum likelihood estimation like in all subsequent models. Four models have been computed in this phase, one with the raw data and three others with the missing values of dependent variable replaced through multiple imputation. Level 1 (students) Y = P0 + E Level 2 (classrooms) P0 = B00 + R0 Level 3 (schools) B00 = G000 + U00
In this empty model, G000 is the constant of the average GPA computed at the level of the school, that is the average of the mean GPA (8,22) while B00 and P0 represent the same constant estimated at the lower levels. E,r and u are the error terms at each level – the random components of the model. The error terms are significant at each level and each model meaning that, on the one hand, that we are deal with strong effects at each level and, on the other hand, that, in order to reduce the variance of these errors, the introduction of new variables is required.
Inter‐class coefficients, which show the proportion total variance accounted for by the corresponding level variance witness great homogeneity within level 2 and 3 groups, that is the reality of student body differentiation across educational collectivities. In the raw data the proportion of total variance covered by within classroom and school variance sums to almost 57% the rest of 43% being accounted by between unit variance. Analyses using imputed data for the dependent variable show, however, an increase of between unit variance and a decrease of between groups variance, especially of the school level variance component. It is also noteworthy that within school homogeneity is even greater than that within the classes, its impact on the total variance of GPA being of the same weight as that of individual factors.

ADRIAN HATOS
100
The large ICCs remaining underline nevertheless the necessity of taking into consideration of contextual variables when modeling the student GPA of previous semester.
Table 2. Variance components
Raw data
Input 1
Input 2
Input 4
E (level 1 variance component/total variance) 0,44 0,56 0,47 0,46 R0 (level 2 ICC: level 2 variance component/ total variance) 0,14 0,14 0,20 0,21 U00 (level 3 ICC: level 3 variance component/ total variance) 0,42 0,30 0,33 0,33
Source: Author’s calculations. Because my intention was to test the effects of social composition of
student collectivities and that of distribution of resources in the production of individual educational achievements controlling for individual factors my inquiry was limited to the composition of random coefficient regressions – that is regressing the constants at the level of schools and classes. Modeling the regression estimates at upper levels or of the interactions would make the interpretation of their effects on constants difficult.
Multilevel models of academic achievement
I have done the modeling of the dependent variable applying a conventional approach: first a random‐regression coefficient, in which only the individual level predictors have been introduced to account for the variation of the subject’s academic achievement while the class‐room and school‐level intercepts are allowed to vary across collectivities. In the second stage I have introduced the classroom level fixed effects to model the second level intercepts and, finally, in the third stage I have modeled the school‐level intercept using variables measured at this level3.
Parameters of the random regression coefficients (regression with fixed effects at level 1 which allows the upper level intercepts to vary randomly, i.e. across groups) are consistent both across samples and across models with effects at different levels. In the same time, the parameters of fixed effects of regression of classroom level intercept are the most unstable, varying dramatically from sample to sample. Finally, at the upper level fixed effects, those of the equation of school constant we find again relatively stable parameters.
3 Estimates of the four models are printed in Appendix.

MULTILEVEL ANALYSIS OF ACADEMIC ACHIEVEMENTS OF UPPER SECONDARY STUDENTS IN A ROMANIAN CITY
101
Comparing the models obtained with the imputed data with those made using raw data one can detect several significant differences which suggest the effect of patterned missing data at the level of the dependent variable. In other words, some of the effects are significant in the raw data but not in the imputed data or the other way around. This happens with the high‐brow cultural resources at home, which have significant positive effect in the original data but not in the data sets containing data of dependent variable replaced for missing data. Average involvement in extracurricular activities in the classroom appears again to be much more positively related to the dependent variable in the original data than in the imputed data. Concerning the effects of characteristics of the schools, we notice that the human resources of the schools have significant effect on the dependent variable in all data sets, both raw and imputed, underlining the presence of an important relationship.
Individuallevel effects
As already noted, the individual level effects display a remarkable stability across inputed data‐sets as well as across models. Therefore, one can assume a high level of certainty when making theoretical inferences on the bases of these results.
The strongest individual level predictor of student performance is gender: boys have, in high‐schools located in Oradea at least, average GPAs one third of a point lower than girls. Contrary to some of the theoretical predictions age, measured through the proxy of grade, has no effect on the dependent variable.
The single individual level measure of socio‐economic background influencing academic performance is home material endowment which shows that the more affluent the family of the student is the better his/her results are.
Contrary to many common theories in the area of sociological explanation of educational success, background educational and cultural capitals do not display significant direct effects on the dependent variable. Leisure style, which we suppose to be highly correlated with this socio‐economic indicators have consistently significant, though not the strongest, influence on academic achievement. Thus, active and social leisure is negatively correlated with GPA while an increase in cultivated leisure is related with an improvement in academic performance.
However, if expected effects of material and cultural resources at the individual level are missing one should not infer that they are not related to the dependent variables. It is possible though that these effects are hidden by institutional and group‐level effects due to strong mechanisms of segregation and differentiation across socio‐economic lines.

ADRIAN HATOS
102
Classroom level effects
The proportion of students with father with higher education in the class is the sole predictor at this level that has a stable and significant effect on the class‐level average. Comparing all the six models that include this variable one can infer that, controlling for all other predictors, a class in which all students have father with higher education has an average GPA higher with around 1,5 points than a class in which this indicator is null.
Participation in school‐based extracurricular activities displays also a high level of stability across models and data sets, yet the estimate is at the edge of statistical significance (p<0,1). Our data show that an increase in the average class‐level involvement in such instances of non‐formal learning is correlated with an increase in academic performance.
Another interesting and puzzling phenomenon at this level is the dramatic increase in significance of class‐level average home cultural endowment followed by the introduction of school level variables. Adding to this observation the counterintuitive direction of the effect – the estimate indicates negative relationship of home cultural resources with the students’ school results one can suppose that we are facing here probably a collinearity problem with variables measured at the third level.
School level predictors
Estimates of fixed effects at the school level display stability comparable to those at the individual level. The school‐level average GPA is positively related to the mean material endowment of its students and with the school‐type. That is students enrolled in schools with affluent social composition as well as those in high‐ schools with academic curriculum (liceu teoretic and colegiu national) have significantly higher averages. The proportion of experienced teachers is in positive relationship with the average achievement of the school’s students confirming our expectations.
Less comprehensible are the slightly but constantly significant positive effects of student/computer ratio according to which an increase in number of computers/students is correlated with lower average achievement at the level of the entire school. Contrary to references in literature size of school has no apparent relation with students’ academic achievement.
One important feature of third level fixed effects is that they reduce the level’s variance component (the degree of intergroup variability) to an insignificant amount. In other words, if the first and second level intercepts’ equations fail largely to explain the total variability of dependent variable, the specifications at the school level cover much of the variance recorder at this level.
MULTILEVEL ANALYSIS OF ACADEMIC ACHIEVEMENTS OF UPPER SECONDARY STUDENTS IN A ROMANIAN CITY
103
Discussion
Analysis of variance components at the three levels indicate a great degree of homogeneity of student collectivities considered. Thus, we are entitled to label the population of high‐schools and their respective classrooms from which our sample had been selected as highly differentiated.
This observation in itself can raise concerns as international studies of educational effectiveness have constantly highlighted the negative effects on student achievement of differentiation and segregation. Our results can hardly be compared with international assessments though, as most of such surveys are done with students at earlier stages in their educational career (corresponding to Romanian lower secondary cycle) when Romanian schools are, presumably less differentiated. At the moment of my subjects’ educational career, in most of the known international settings, differentiation has already occurred basically in a manner similar to the organization of the Romanian upper cycle of the secondary schools.
The three‐level models allow us little room for causal inferences as the data are transversal but gives room for the interpretation of between groups significant differences offering the possibility of understanding the patterns of segregation and differentiation between schools and classes. The multi‐level models presented in the article suggest a high level of correlation between academic performance, type of schools and home material resources of the students while, at the level of classes the same correlations hold true for the relationship between the average academic performance and the average educational capital of the class.
A school’s teachers’ experience is in the expected relationship with the students’ achievement, net of other important qualities of the institution like its type or material endowment. Deriving effectiveness judgments from this evidence would be, however, imprudent. The most prudent interpretation is to admit the possibility of a circular and complex causation: better teachers make better performing students while good quality student body attracts more talented and motivated scholars being able, in the same time to augment the incentives of the school’s staff towards improved professional performance and training. While confirmation of hypotheses is difficult to be claimed due to mentioned causal inference problems, rejection is possible with lower risks. Age, for instance, is not correlated negatively with academic performance as predicted by some previous research. More significant, the mechanism of social reproduction of social statuses through the dependence of academic achievement on educational and cultural resources is largely absent. On the other hand, the background material resources are correlated strongly with student achievement at the individual level, suggesting, in contrast with the second and third order

ADRIAN HATOS
104
level fixed effects of social composition that, actually, other kinds of background resources, educational and cultural, are either the actual criteria of educational advancement and differentiation or the compositional features that have an influence on results. Other important hypothesis rejected by our data is that of relationship between student achievement and the human and material resources of the educational institutions. This finding is in line with the vast amount of literature in the field of economics of education or educational effectiveness according to which „money does not matter”. In our specific case, regarding the correlation of student/pc ratio with the dependent variable we can express doubts on the validity of this indicator as a measure of material resources of the schools or we can think of variability of this measure in correlation with aspects of the school or school management which are not necessarily correlated with levels of achievement, like curriculum or arbitrary administrative decision. Similar methodological comments can be made about the lack of effect of human resource indicator – the percentage of teachers with grade 2 – which might not be the best indicator for the chose characteristic. Less ambiguous is the absence of relationship between school size and academic achievement.
I repeat, because we use cross‐sectional data, our results support only partially the social composition effect hypothesis. According to this, averages of achievement measures are influenced by the weight of students from the new middle classes, defined primarily by the advanced educational resources (Larionescu, Mărgineanu, and Neagu, 2006). Indeed, in line with the theoretical assumptions of this theory, in the multilevel models, the social composition of student collectivities, classes or schools, has an impact of the magnitude of the family socio‐economic background. However, the estimates at the class and school level in my models can be interpreted also as reflective of the internal social composition homogeneity of educational groups built up in a highly selective educational environment that produces segregated and differentiated schools and classes. Moreover, if compositional effects are admitted, the specific class and school averages should not be interpreted merely as peer‐group effects but also as possible products of pedagogical reactions of teachers to specific social composition patterns.
Regarding the results concerning our focus variables the interpretations are simple: all other things being equal, students coming from well‐off families perform better at school than the others. Moreover, the class averages are the bigger as the proportion of students from families rich in educational capitals is increasing. Evidently, the most privileged are those that succeed in having an accumulation of favorable conditions: raised in materially well‐off families and are enrolled in classes with a high percentage of high‐social status background students in schools with academic profile. Regarding this finding is noteworthy mentioning that, in a highly selective promotion system like the Romanian one, at
MULTILEVEL ANALYSIS OF ACADEMIC ACHIEVEMENTS OF UPPER SECONDARY STUDENTS IN A ROMANIAN CITY
105
the end of the pre‐tertiary cycle, when as seen, the educational institutions display a large amount of differentiation in terms of student intake and achievement, social reproduction mechanisms are not yet offset, being highly visible in the correlation of individual achievement with individual material resources.
On the other hand, the apparent positive relationship of the group‐level average participation in extracurricular activities and academic achievement can sustain some class and school management recommendations. Of course, in this case, one can talk of endogeneity limitations in the analysis but, in any case, the aggregate correlation we are pointing to give us indications on the characteristics of a good learning collectivity and provide clues for programs of educational effectiveness.
The distribution of material resources has a rather weak relation with the dependent variable sustaining the view that investing such resources can add little to educational productivity. Given the absence of relationship of indicators of material resources with the dependent variable and the apparent significance of compositional variables, the size and the significance of the estimate of school‐type points to possible important institutional, organizational or pedagogical differences that still exists net of student intake and resource inequalities. However, this effect may be another proxy of previous performances or of more properly measured measures of school resources. Limits of the analysis
The analysis in the present paper has several limitations that have been already noted as shortening the scope of my research. One important weakness concerns the specification of the multilevel models which does not contain measures of previous achievements of students and, thus, prevents me from clearly identifying compositional effects from accumulated differentiation through merit based selection. This problem is associated with the transversal character of the data that makes causal inferences difficult. Given these methodological limits I proposed alternative and plausible interpretations for my results. Even if all the limitations mentioned in this section were solved, the specification of multilevel models restricts final theoretical inferences as I did not tested models containing cross level interactions nor did I looked for most parsimonious regression equations.
Measurement considerations are critical for this kind of research. Given the complexity of characteristics like student subculture, material resource or human resource distribution I cannot make definitive statements concerning the findings based on the estimates corresponding to those concepts.
Data restrictions have affected the robustness of my results either. Given the research design I had to extract from the initial sample of 3500 student a subsample of 1428 teenagers enrolled in grades 10 to 12 in high‐schools in Oradea. Thus, the number of groups at third level, of schools, is rather low raising

ADRIAN HATOS
106
suspicions about the reliability of estimates. In my opinion this real shortcoming is partially solved through repeating the analysis on data sets obtained through multiple imputation of missing values of the dependent variable. Conclusions
The findings of my analyses can be classified into two broad area of concern: theoretical and methodological.
The most solid theoretical result of my research is the amount of differentiation within the upper secondary educational institutions. Inter‐correlation coefficients as well as classroom and school level effects show that around half of the total variation in student achievement can be interpreted as evidence of difference between student collectivities – classrooms and schools – which display in turn a great amount of homogeneity. This is highlighted also by the fact that the distribution of performances across groups correlates with distribution of material, educational and cultural resources. The results unveil the processes and effects of selectivity at work in Romanian schools similar to ones to be found in other countries with analogous organization of school career.
Given the methodological limits of the research, compositional effects cannot be rejected, yet the arguments in the data are not solid enough. Evidences in this area can be interpreted also as proxies of previous performances which determined academically and socially differentiated schools in an educational environment where social reproduction is still powerful. However, since the multilevel estimates of measures of social composition are significant at group level, the strength of effect of individual‐level material background points to powerful social reproduction mechanisms still at work in the upper secondary educational institutions in Romania. The significant effects of leisure indicators suggest the fact that influences of educational and cultural capital might be mediated, at the age of our subjects, by life‐style.
Based on my results, the arguments in favor or distributional effects are weak. Neither human nor material resources of the schools are in a convincing way related to educational outcomes. This kind of influences could be hidden, though, by the strong effect of the type of schools which could also reflect institutional and educational mechanisms not captured in my specification.
Methodological lessons of the research are of similar importance and had been underlined during the article. First of all, compositional effects cannot be properly assessed if measures of previous educational performances are lacking. Secondly, causal inferences are feeble if data are not results of longitudinal measurement. Third, the robustness of estimates requires large enough samples at all levels. All these considerations warn on the difficulties of sound modeling of achievement but also on the limits of the actual research in the area. Besides that, theoretical concepts involved in the specification of models of educational performance are complex enough to make the results often doubtful.

MULTILEVEL ANALYSIS OF ACADEMIC ACHIEVEMENTS OF UPPER SECONDARY STUDENTS IN A ROMANIAN CITY
107
REFERENCES
Boudon, R. (1973). L'Inegalite de chances. La mobilite sociale dans les societes industrielles [The inequality of chances. Social mobility in industrialized societies]. Paris: Hachette.
Bourdieu, P., and Passeron, J.C. (1970). La reproduction; éléments pour une théorie du système d'enseignement [The reproduction: elements for a theory of educational systems]. Paris: Éditions de Minuit.
Coleman, J.S. (1966). Equality of educational opportunity (summary report). Washington: U.S. Dept. of Health, Education, and Welfare, Office of Education.
Feldman, A.F., and Matjasko, J.L. (2005). The role of school‐based extracurricular activities in adolescent development: A comprehensive review and future directions. Review of Educational Research, 75(2): 159.
Fredricks, J.A., and Eccles, J.S. (2005). Developmental benefits of extracurricular involvement: do peer characteristics mediate the link between activities and youth outcomes? Journal of Youth and Adolescence, 34(6): 507‐520.
Fredricks, J.A., and Eccles, J.S. (2006). Extracurricular involvement and adolescent adjustment: Impact of duration, number of activities, and breadth of participation. Applied Developmental Science, 10(3): 132‐146.
Goldthorpe, J.H. (1983). Women and Class Analysis: In Defence of the Conventional View. Sociology, 17(4): 465.
Green, A., Preston, J., and Janmaat, J.G. (2006). Education, equality and social cohesion: a comparative analysis: Palgrave Macmillan, Basingstoke.
Green, A., Preston, J., and Sabates, R. (2003). Education, Equity and Social Cohesion: A Distributional Mode. Wider Benefits of Learning Report (No. 7). London: Center for Research on the Wider Benefits of Learning.
Hagan, J. (1991). Destiny and Drift: Subcultural Preferences, Status Attainments, and the Risks and Rewards of Youth. American Sociological Review, 56(5): 567‐582.
Hanushek, E.A. (1997). Assessing the Effects of School Resources on Student Performance: An Update. Educational Evaluation and Policy Analysis, 19(2): 141‐164.
Hanushek, E. A., and Luque, J. A. (2003). Efficiency and equity in schools around the world. Economics of Education Review, 22(5): 481‐502.
Hatos, A. (2008). Impactul segregării şi diferențierii asupra performanțelor şcolare ale elevilor din clasele 10‐12. O analiză multinivel [The impact of segregation and differentiation on the school performance of children from grades 10‐12. A multilevel analysis]. Calitatea Vietii, XIX(1–2): 141–158.
Heyneman, S.P., and Loxley, W.A. (1983). The Effect of Primary‐School Quality on Academic Achievement Across Twenty‐nine High‐and Low‐Income Countries. American Journal of Sociology, 88(6): 1162.
Hochschild, J.L., and Scovronick, N. (2003). The American Dream and the Public Schools: Oxford University Press, USA.
Jencks, C., Mayer, S.E. (1990). The social consequences of growing up in a poor neighborhood. In M. G. H. M. L. Lynn Jr. (ed.): Innercity poverty in the United States, Washington: National Academy Press, pp. 111‐186.

ADRIAN HATOS
108
Jigau, M. (2000). Învăţământul rural din România condiţii, probleme şi strategii de dezvoltare [Education in rural areas in Romania: conditions, problems and strategies for development]. Bucureşti: Ministerul Educației şi Cercetării, Institutul de Ştiințe ale Educației.
Jigau, M., and Surdu, M. (2002). Participarea şcolară a copiilor Romi: probleme, soluţii, actori [The school engagement of Roma children: problems, solutions, actors]. Bucuresti: Ministerul Educației şi Cercetării, Institutul de Ştiințe ale Educației, Institutul de Cercetare a Calității Vieții.
Korupp, S.E., Ganzeboom, H.B.G., and Van Der Lippe, T. (2002). Do Mothers Matter? A Comparison of Models of the Influence of Mothers' and Fathers' Educational and Occupational Status on Children's Educational Attainment. Quality and Quantity, 36(1):17‐42.
Lareau, A. (2000). Home advantage: Social class and parental intervention in elementary education: Rowman and Littlefield Publishers.
Larionescu, M., Mărgineanu, I., and Neagu, G. (2006). Constituirea clasei mijlocii în România [The Foundation of a Middle Class in Romania]. Bucureşti: Editura Economică.
Mok, M., and Flynn, M. (1996). School size and academic achievement in te HSC Examination: is there a relationship. Issues in Educational Research, 6(1): 20.
OECD. (2004). Learning for Tomorrow's World – First Results from PISA 2003: OECD ORGANISATION FOR ECONOMIC CO‐OPERATION AND DEVELOPMENT.
PISA. (2001). Knowledge and skills for life: first results from the OECD Programme for International Student Assessment (PISA) 2000 (No. 9264196714). Paris: Organisation for Economic Co‐operation and Development.
PISA. (2007). PISA 2006: Science Competencies for Tomorrow’s World Executive Summary: Organisation for Economic Co‐operation and Development.
Rumberger, R., and Palardy, G. (2005). Does Segregation Still Matter? The Impact of Student Composition on Academic Achievement in High School. 107(9): 1999‐2045.
Schofield, J.W. (1995). Review of research on school desegregation’s impact on elementary and secondary students. In J.A. Banks (ed.): Handbook of research on multicultural education (pp. 597–616). New York: Macmillan.
Sewell, W.H., and Hauser, R.M. (1975). Education, Occupation, and Earnings. Achievement in the Early Career. New York: Academic Press Inc.
Simmons, R.G., and Blyth, D.A. (1987). Moving Into Adolescence: The Impact of Pubertal Change and School Context: Aldine Transaction.
Thrupp, M., Lauder, H., and Robinson, T. (2002). School composition and peer effects. International Journal of Educational Research, 37(5): 483‐504.
Tufiș, P.A. (2008). Predictors of school success in Romania. Family background, school factors, and community factors. Revista Calitatea Vietii, XIX (3‐4): 389‐405.
Wells, A.S., and Crain, R.L. (1994). Perpetuation theory and the long‐term effects of school desegregation. Review of Educational Research, 64(4): 531‐555.
Woessmann, L. (2007). Fundamental Determinants of School Efficiency and Equity: German States as a Microcosm for OECD Countries. Munich: Ifo Institute for Economic Research.

Table A1.
Models for imputed dataset 1
Model 1: level 1 fixed effects
Model 2: level 1 and 2 fixed effectsModel 3: level 1,2 and 3 fixed effects
Variables
B SE
T P
B SE
T P
B SE
T P
level1 Intercept
8,746
0,618
14,143 0,000
Grade
‐0,057
0,055
‐1,044 0,297
0,000
0,047
0,006
0,996
‐0.004
0.042
‐0.114 0.910
gender (1=m
ale)
‐0,321
0,043
‐7,496 0,000
‐0,296
0,044
‐6,804
0,000
‐0.296
0.043
‐6.804 0.000
father's education (1=HE)
‐0,044
0,052
‐0,848 0,397
‐0,067
0,052
‐1,298
0,195
‐0.067
0.051
‐1.298 0.195
material endow
ment
0,067
0,020
3,282
0,001
0,065
0,021
3,134
0,002
0.064
0.020
3.133
0.002
cultural endow
ment
0,033
0,031
1,064
0,288
0,033
0,031
1,063
0,288
0.032
0.030
1.064
0.288
active leisure scale
‐0,039
0,018
‐2,120 0,034
‐0,039
0,018
‐2,176
0,030
‐0.039
0.018
‐2.170 0.030
cultivated leisure scale
0,075
0,022
3,457
0,001
0,073
0,022
3,384
0,001
0.072
0.021
3.383
0.001
level2 Intercept
7,258
0,862
8,419
0,000
proportion male
‐0,488
0,208
‐2,344
0,023
‐0.321
0.211
‐1.523 0.133
proportion fathers w
ith HE4
1,779
0,360
4,947
0,000
1.470
0.373
3.939
0.000
Avg. material endow
ment
‐0,128
0,119
‐1,070
0,290
‐0.203
0.111
‐1.828 0.072
Avg. cultural endow
ment
‐0,012
0,222
‐0,054
0,958
‐0.428
0.187
‐2.281 0.026
Avg. extracurricular
0,197
0,116
1,690
0,096
0.220
0.121
1.807
0.076
4 ‘HE’ stands for higher education, ‘avg.’ for average

Model 1: level 1 fixed effects
Model 2: level 1 and 2 fixed effectsModel 3: level 1,2 and 3 fixed effects
Variables
B SE
T P
B SE
T P
B SE
T P
Avg. school satisfaction
0,034
0,015
2,212
0,031
0.037
0.014
2.548
0.014
level3 Intercept
1.985
1.326
1.496
0.173
Avg. extracurricular
‐0.075
0.168
‐0.448 0.666
Avg. material endow
ment
1.516
0.286
5.304
0.000
proportion fathers w
ith HE
‐0.599
0.653
‐0.917 0.386
proportion male
0.556
0.370 1.501
0.171
school type (1=liceu teoretic)
0.249
0.090
2.767
0.025
Avg. school satisfaction
‐0.022
0.036
‐0.616 0.555
school size
‐0.000
0.000
‐1.052 0.324
student/pc ratio
0.027
0.009
1.882
0.096
proportion experienced teachers
1.389
0.457
3.035
0.017
chorus (1=yes)
0.144
0.079
2.790
0.024
Deviance difference (LR2)5
LR2 =93,1
p<0,01
LR2 =36,7 P<0,01
LR
2 =40,1p<0,01
Source: Author’s calculations.
5 Models w
ith level 1 fixed effects (entitled Model 1) w
ere compared with the unconstrained model.

Table A2.
Models for imputed dataset 2
Model 1: level 1 fixed effects
Model 2: level 1 and 2 fixed effectsModel 3: level 1,2 and 3 fixed effects
Variables
B SE
T P
B SE
T P
B SE
T P
level1 Intercept
8,689
0,538
16,137
0,000
Grade
‐0,052
0,048
‐1,085 0,279‐0,009
0,042
‐0,220
0,826‐0.021
0.038
‐0.548 0.583
gender (1=m
ale)
‐0,316
0,044
‐7,212 0,000‐0,292
0,045
‐6,512
0,000‐0.292
0.044
‐6.517 0.000
father's education (1=HE)
‐0,005
0,053
‐0,099 0,922‐0,034
0,053
‐0,630
0,528‐0.033
0.053
‐0.636 0.525
material endow
ment
0,062
0,021
2,975
0,0030,058
0,021
2,745
0,007 0.058
0.021
2.742
0.007
cultural endow
ment
0,041
0,032
1,288
0,1980,042
0,032
1,325
0,186 0.041
0.031
1.319
0.188
active leisure scale
‐0,067
0,019
‐3,608 0,001‐0,068
0,019
‐3,669
0,000‐0.067
0.018
‐3.622 0.001
cultivated leisure scale
0,054
0,022
2,427
0,0160,053
0,022
2,413
0,016 0.054
0.022
2.446
0.015
level2 Intercept
7,451
0,771
9,666
0,000
prop. Male
‐0,259
0,190
‐1,365
0,178‐0.088
0.193
‐0.457 0.649
prop. fathers with HE
1,585
0,325
4,876
0,0001.269
0.338
3,748
0.001
Avg. material endow
ment
‐0,048
0,107
‐0,448
0,655 ‐0.103
0.101
‐1.016 0.314
Avg. cultural endow
ment
‐0,126
0,202
‐0,626
0,534 ‐0.556
0.170
‐3,256 0.002
Avg. extracurricular
0,230
0,106
2,171
0,034 0.266
0.110
2.403
0.020
Avg. school satisfaction
0,019
0,014
1,393
0,1690.021
0.013
1.630
0.108

Model 1: level 1 fixed effects
Model 2: level 1 and 2 fixed effectsModel 3: level 1,2 and 3 fixed effects
Variables
B SE
T P
B SE
T P
B SE
T P
level3 Intercept
2.707
1.208
2.241
0.055
Avg. extracurricular
‐0.058
0.153
‐0.382 0.712
Avg. material endow
ment
1.235
0.258
4,773
0.001
Proportion fathers w
ith HE
0.088
0.591
0.149 0.885
Proportion male
0.508
0.338 1.503
0.171
school type (1=liceu teoretic)
0.228
0.082 2.784
0.024
Avg. school satisfaction
‐0.012
0.033
‐0,392 0.705
school size
‐0.000
0.000 ‐0.817 0.438
student/pc ratio
0.026
0.008
3,032
0.017
proportion experienced teachers
1.427
0.417
3.417
0.010
chorus (1=yes)
0.203
0.072
2.807
0.023
Deviance difference (LR2)
LR2 =90,5p<0,01
LR2 =31,6 p<0,01
LR
2 =36,8p<0,01
Source: Author’s calculations.

Table A3.
Models for imputed dataset 4
Model 1: level 1 fixed effects
Model 2: level 1 and 2 fixed effectsModel 3: level 1,2 and 3 fixed effects
Variables
B SE
T P
B SE
T P
B SE
T P
level1 Intercept
8,708
0,598
14,573
0,000
Grade
‐0,051
0,053
‐0,960 0,337‐0,007
0,047
‐0,143
0,886‐0,013
0,046
‐0,288 0,733
gender (1=m
ale)
‐0,345
0,043
‐8,053 0,000‐0,323
0,044
‐7,391
0,000‐0,324
0,044
‐7,403 0,000
father's education (1=HE)
‐0,010
0,052
‐0,192 0,848‐0,035
0,052
‐0,676
0,499‐0,036
0,052
‐0,686 0,493
material endow
ment
0,058
0,020
2,829
0,0050,055
0,021
2,643
0,0090,055
0,021
2,641
0,009
cultural endow
ment
0,041
0,031
1,327
0,1850,041
0,031
1,338
0,1810,042
0,031
1,356
0,175
active leisure scale
‐0,055
0,018
‐2,993 0,003‐0,055
0,018
‐3,030
0,003‐0,054
0,018
‐2,941 0,004
cultivated leisure scale
0,062
0,022
2,879
0,0050,061
0,022
2,824
0,0050,059
0,022
2,721
0,007
level2 Intercept
7,475
0,861
8,679
0,000
proportion male
‐0,373
0,208
‐1,797
0,077‐0,192
0,229
‐0,838 0,406
proportion fathers w
ith HE
1,813
0,358
5,061
0,0001,538
0,407
3,783
0,001
Avg. material endow
ment
‐0,067
0,119
‐0,560
0,577‐0,137
0,121
‐1,131 0,263
Avg. cultural endow
ment
‐0,077
0,221
‐0,347
0,730‐0,568
0,213
‐2,662 0,011
Avg. extracurricular
0,230
0,116
1,991
0,0510,256
0,133
1,99
0,051
Avg. school satisfaction
0,020
0,015
1,301
0,1990,023
0,016
1,460
0,150

Model 1: level 1 fixed effects
Model 2: level 1 and 2 fixed effectsModel 3: level 1,2 and 3 fixed effects
Variables
B SE
T P
B SE
T P
B SE
T P
level3 Intercept
2,401
1,430
1.775
0,113
Avg. extracurricular
‐0,111
0,185
‐0,600 0,831
Avg. material endow
ment
1,278
0,354
4.524
0,002
proportion fathers w
ith HE
‐0,147
0,729
‐0.858
0,416
proportion male
0,325
0,419
1.305
0,229
school type (1=liceu teoretic)
0,366
0,088
2,666
0,029
Avg. school satisfaction
‐0.001
0,041
‐0.048 0,965
school size
0,000
0,000
‐0.612 0,626
student/pc ratio
0,019
0,011
1.882
0,096
proportion experienced teachers
1,469
0,757
3.151
0,015
chorus (1=yes)
0,166
0,096
2.790
0,024
Deviance difference (LR2)
LR2 =99,9p<0,01
LR2 =34,4 p<0,01
LR
2 =37,2p<0,01
Source: Author’s calculations.

Table A4.
Models for raw data
Model 1: level 1 fixed effects
Model 2: level 1 and 2 fixed effectsModel 3: level 1,2 and 3 fixed effects
Variables
B SE
T P
B SE
T P
B SE
T P
level1 Intercept
8.661
0.687
12.600
0.000
grade
‐0.048
0.060
‐0.802
0.423
0.021
0.052
0.406
0.6850.021
0.043
0.503
0.615
gender (1=m
ale)
‐0.325
0.043
‐7.440
0.000
‐0.304
0.044
‐6.852
0.000‐0.314
0.042
‐7.362 0.000
father's education (1=HE)
‐0.066
0.050
‐1.318
0.188
‐0.089
0.050
‐1.764
0.078‐0.076
0.049
‐1.547 0.122
material endow
ment
0.053
0.020
2.616
0.009
0.050
0.020
2.450
0.0150.050
0.020
2.501
0.013
cultural endow
ment
0.080
0.030
2.637
0.009
0.081
0.030
2.657
0.0080.068
0.029
2.327
0.020
active leisure scale
‐0.063
0.020
‐3.082
0.003
‐0.064
0.020
‐3.140
0.002‐0.062
0.020
‐3.095 0.002
cultivated leisure scale
0.071
0.021
3.405
0.001
0.071
0.021
3.407
0.0010.060
0.019
3.009
0.003
level2 Intercept
6.727
0.944
7.121
0.000
proportion male
‐0.360
0.228
‐1.582
0.120‐0.235
0.214
‐1.097 0.278
proportion fathers w
ith HE
1.996
0.388
5.144
0.0001.599
0.375
4.259
0.000
Avg. material endow
ment
‐0.040
0.128
‐0.313
0.756‐0.112
0.115
‐0.979 0.332
Avg. cultural endow
ment
‐0.168
0.242
‐0.696
0.490‐0.553
0.188
‐2.932 0.005
Avg. extracurricular
0.281
0.127
2.217
0.0310.311
0.122
2.535
0.014
Avg. school satisfaction
0.029
0.016
1.752
0.0850.035
0.015
2.345
0.023
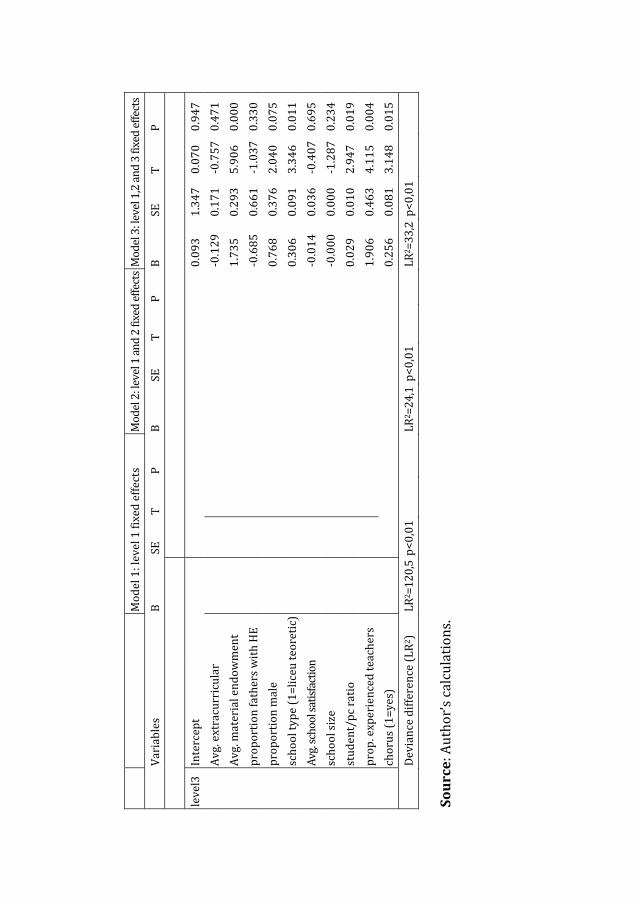
Model 1: level 1 fixed effects
Model 2: level 1 and 2 fixed effectsModel 3: level 1,2 and 3 fixed effects
Variables
B SE
T P
B SE
T P
B SE
T P
level3 Intercept
0.093
1.347
0.070
0.947
Avg. extracurricular
‐0.129
0.171
‐0.757 0.471
Avg. material endow
ment
1.735
0.293
5.906
0.000
proportion fathers w
ith HE
‐0.685
0.661
‐1.037 0.330
proportion male
0.768
0.376
2.040
0.075
school type (1=liceu teoretic)
0.306
0.091
3.346
0.011
Avg. school satisfaction
‐0.014
0.036
‐0.407 0.695
school size
‐0.000
0.000
‐1.287 0.234
student/pc ratio
0.029
0.010
2.947
0.019
prop. experienced teachers
1.906
0.463
4.115
0.004
chorus (1=yes)
0.256
0.081
3.148
0.015
Deviance difference (LR2)
LR2 =120,5p<0,01
LR2 =24,1 p<0,01
LR
2 =33,2p<0,01
Source: Author’s calculations.

STUDIA UNIVERSITATIS BABEŞ‐BOLYAI, SOCIOLOGIA, LV, 1, 2010
ARE FACTORS OF SOCIAL CAPITAL ABLE TO MODIFY SOCIAL REPRODUCTION EFFECTS?
HATOS ADRIAN*, GABRIELLA PUSZTAI**, HAJNALKA FÉNYES***
ABSTRACT. The aim of this study is to reveal the explanatory capacity of social capital theory in connection with the variations in students’ academic achievements in relation to individual and context‐level religious variables. Therefore, the article focuses on the structures and contents of students` relationships in the school in the context of comparison of sources of variation of educational accomplishments of upper secondary Hungarian students living in Hungary, Romania and Ukraine and enrolled in denominational and non‐denominational schools. Using multilevel analysis we compare several indicators of connectedness measured at individual and school level in order to find the variables which are mostly able to alter the well‐known and powerful mechanisms of social reproduction. The results show that students' religious networks as well as the density of these networks within the school have the quality of improving academic achievements.
Keywords: social capital, contextual effects, student achievement
Introduction
Former studies (Pusztai, 2006; 2007) revealed that denominational schools1 influence favorably the school career of students with deprived backgrounds. We have pointed out that differences do not only originate from the advantages or disadvantages of social background but, according to the social capital hypothesis the form, size and composition of relationships can explain the differences. We pointed out that these schools reduce the effects of inequalities of various types of capitals, especially cultural, with the help of organic relationships and cohesion between parents and children in the school community. Better understanding of sources of academic achievement had been brought via the appeal to the social composition of school context and for the social capital. The effect of social composition of school contexts on students`
* Department of Sociology and Social Work, University of Oradea, e‐mail: [email protected] ** Department of Educational Sociology, University of Debrecen, e‐mail: [email protected] *** Department of Sociology, University of Debrecen, e‐mail: [email protected] 1 By the term “denominational schools” we mean educational institutions guided spiritually by a church or denomination.

HATOS ADRIAN, GABRIELLA PUSZTAI, HAJNALKA FÉNYES
118
achievement was first recognized in the 1960s and has become a major topic of research especially with the development of multilevel regression techniques. Studies published during the last two decades, including several signed by the authors of the present article started to include variables indicating social capital (Pusztai, 2006, 2007) in the search for determinants of educational success. The aim of this study is to reveal the explanatory capacity of the concept of social capital theory in connection with the variations in students’ academic achievements in relation to individual and context‐level religious variables. Thus, we focus on the structures and contents of students` relationships organized in school. With the help of multilevel analysis we compare several indicators of social relationships measured at individual and school level in order to find the variable most able to alter reproductive determinism. Theoretical framework
Achievement, networks and contexts
The abundant literature on the social sources of academic success has witnessed a development from models of social reproduction, which highlighted the importance of individual and family‐level characteristics for more complex theoretical accounts that stressed on the one hand, the influence of relationships within schools and between schools and families, under the heading of social capital effects, and the impact of contextual variables related to the organization of schools or even of educational systems, on the other. The thesis of reproduction of social inequalities though educational processes is one of the most firmly established conclusions of educational studies of the last decades (Boudon, 1973; Coleman, 1988; Jencks, 1990). According to these studies, educational achievements are dependent on the material, educational and cultural endowments of the background families. Continuing with individual predictors, one can highlight the importance of gender – the majority of research materials providing evidence of the better school performances of girls (PISA, 2001, 2007)2 or of age group being evident a tendency of achievements to drop together with the increase in age of teenagers. Simmons and Blyth (1987) attribute this decline to adjustment difficulties faced by teenagers. The educational research literature had started in the 80s underlining the importance of considering structural and contextual factors in accounting for the variance of academic achievement. Two important dimensions, intertwined and methodologically challenging, are the network structure of educational groups and the institutional and social‐structural characteristics of educational settings.
2 I am making general statements. There are, though, disciplines or kinds of tasks at which boys display sistematically better results.

ARE FACTORS OF SOCIAL CAPITAL ABLE TO MODIFY SOCIAL REPRODUCTION EFFECTS?
119
One important distinction in this regard is that between the minority‐majority status of the students which, according to Ogbu (1987) have an impact on the educational and social aspirations. Involuntary minorities have lowered such aspirations that may be conducive to lowered performances compared to the majority. This might also determine a gap in achievement between Hungarian students across the borders of Hungary with Romania or Ukraine. According to the findings of Pásztor (2005), country border made very strong differences between Hungarian minority and majority students. After the political transformation, the big gap started to decline, and the minority and majority students’ achievement gap seem to eliminate slowly except for Slovakian Hungarian students. However some differences were experienced yet in Romanian and Ukrainian Hungarian community, her comparative study revealed determined approximation of minority Hungarians to the majority Romanians and Ukrainian students, so we can conclude that minority students intend to fall into line with majority students groups in their country (Pásztor, 2005). The majority of the literature on social capital clearly shows the significant connection between resources of relationships and educational achievement (Ainsworth, 2002). Yet there is no consensus on the causal mechanism connecting social capital to students’ school achievements. Some claim that manifesting itself as a social expectation influencing students’ behavior, social capital is a resource independent of cultural capital (Carbonaro, 1999; Coleman, 1988), whereas others hold the view that social capital in itself is incapable of improving academic achievement, but capable of diminishing the race and class‐dependence of the reproduction of cultural capital (McNeal Jr., 1999). Nevertheless, the Colemanian concept of social capital has brought about a revolutionary renewal of approach in educational sociology, as it has called attention to a force able to modify the determining influence of social status in contradiction with the theory of reproduction focusing on the individual determined by social class. It is well known that the configuration of social networks in school and outside of it is associated with involvement in problematic behaviors both in school and outside of it (Baldwin, Bedell, & Johnson, 1997; Kiesner, Poulin, & Nicotra, 2003), with academic performance and with the personal satisfaction with the educational process. For example, American junior high school students with superior school results or talents have, in comparison to the general population of students, a better school climate and a more seldom affiliation with deviant colleagues (Shaunessy, Suldo, Hardesty, & Shaffer, 2006). Croninger and Lee (2001) and Azzam (2007) have obtained results which emphasize the importance of school social capital, meaning the relationships between students and teachers, on preventing school dropout. The community organization type, with dense social networks, is at the heart of the quality advantage that Catholic schools have in comparison to the public schools in the US, a phenomenon which has been studied by Coleman (1988) and by Bryk, Lee and Holland (1993).
HATOS ADRIAN, GABRIELLA PUSZTAI, HAJNALKA FÉNYES
120
When Corten and Dronkers (2006) tested the theory of social capital, they grounded his hypothesis on Coleman et al.’s concept (Coleman & Hoffer 1987) of the functional school based on shared values3. Dronkers, who insisted on Coleman’s formal criteria, found that European data did not support the fact that the functional school community came into being due to parents’ frequent personal interaction within the same religious community. It is because the European school system is not based on districts. We think that as long as the majority of those belonging to a denominational school community are involved in communal religious practice, we might assume a relatively general value consensus among the members of the local church community (the network of networks) even without everybody knowing everybody else. Approaching the concept of the functional community from the content element of the structure of relationships we concluded that the unity of norms and behavioral patterns is an important element of a consistent value system. In other words, a functional community is characterized by harmony between everyday actions and religious norms. If the members do not feel the interaction between behavioral patterns and religious norms, do not stand up for their religion in their everyday lives or do not take part in the rites with real commitment, there is no real functional community. Beginning with the influential research on academic achievement of American high school students conducted by Coleman, education research became aware of the possible powerful effects of contextual variables which are connected to the selectivity of schools and to processes of segregation and differentiation. In a synthesis of results of American longitudinal educational studies of the 80s and 90s of the previous century, Rumberger and Palardy (2005) provide enough evidence of the significant effect that the social composition of the schools, measured using a variety of features (SES, race, ethnicity) have on academic achievement measured in various ways. The impact of religious variables
One of the issues that rise constantly in debates around sources of school success is the intervention of religious variables in the more common theoretical framework of above. There is an impressive body of literature providing evidence on the positive effects of personal religiosity on educational achievement (Abar, Carter, & Winsler, 2009; Byfield, 2008; Park & Bonner, 2008). Numerous researchers have highlighted the beneficial effects of personal religiosity upon the educational career of students with a deprived social background. 3 The existence of an intergenerational closure around the school was not a measured but a so‐called assumed variable in surveys concerning denominational students.
ARE FACTORS OF SOCIAL CAPITAL ABLE TO MODIFY SOCIAL REPRODUCTION EFFECTS?
121
Studies have revealed that, in Hungary at least, students in denominational schools are not of better social status than public schools students (Pusztai, 2006). The quoted study showed though, that students in denominational schools have more definite plans for higher education, than students in non‐denominational schools of similar social status. Above all, this difference becomes striking among children of less educated parents. We (Pusztai, 2006) suggested as interpretation, that the effects of social reproduction are reduced by some factor in the denominational sector. According to our explanation this effect is based on the organic relations within the school community. This is a form of social capital that can be beneficial to those students as well as for those who lack this kind of resource. In the present paper we investigate the degree in which characteristics of the school context, with a focus on membership in religious networks, have an impact on academic achievement and their potential for offsetting the reproductive effect of the students’ socio‐economic background. In other words we are interested in how the social capital and the presence of trustful relationships in school community alter the reproductive impact of parental status on school performance. The most commonly examined index of school status is the frequency of high‐status parents (education, profession, SES) in school community. It has been often demonstrated that the social composition of school environment is also able to modify performance even controlling for individual social background. However, we investigate also the effects of some different characteristics of school context. Since Coleman’s study, another frequently investigated issue has been the influence of dominant networks in the school community, and the impact of dominant norms within. Coleman linked this type of social capital to the form of relative structure, and emphasized that effective norms can function in a community, if the structure is closed enough to let control operate appropriately (Coleman 1988). The school community operating with collectively accepted norms can help students’ performance by applying information, control and sanctions more effectively. Taking this as a starting point, we observed the impact of the density of religious networks in schools. These networks proved especially strong and drew our attention in previous research (Pusztai, 2006, 2007). Besides this, considering Bryk and Schneider’s study, we examined the personal care of teachers since these authors showed that the increase in trust within the school organization contributes to the improvement of academic performance in school community (A. S. Bryk & Schneider, 2002). We compared the context variables to each other to obtain information concerning which one of them is the most able to modify reproductive determinism.

HATOS ADRIAN, GABRIELLA PUSZTAI, HAJNALKA FÉNYES
122
Hypotheses
According to the hypothesis of our study the school context has a great influence on school commitment pertaining to studying and academic performance; contextual variables have significant influence on individual student’s academic achievements. On the one hand, we assumed that the social status of parents has a strong influence on academic performance, and that the social composition of schools is of even greater significance. Moreover, we assume that people practicing religion, or members of religious networks bring such norms into the school context that help the pursuit of good performance, and make cooperation with the school more popular. These norms will bring about the appreciation of diligent and well‐balanced work, and eventually cause better results even at students coming from disadvantaged social backgrounds. However, it is also presumable that the personal care of teachers presents a sort of lacking social capital which is a missing feature in today’s problematic families, and that a strong conviction of teachers’ care in the school context will encourage students to perform better. Finally, we presume that there are various off‐sector compensating effects that modify the impact of family social status on student performance. The first question is whether school composition regarding to parental cultural capital has the most important effect on student achievement or the two alternative explanations are more subtle to interpret it. The previous option confirms assumptions of reproduction theory. As the second question concerned, in case of the salient role of the density of religious network in analyze, we can highlight the value and norm‐enforcing side of social capital. It would be emphasized not only the structures in school community but also types of norms and values in the strong structures. Consequently the new question is emerged to search concordant features of religious norms that are appropriate in school context. Contrary to the general perception of teacher attention is considered as structural attribute of the relationships. Some characteristics e.g. strength and mutuality of the interactions are important indicators of network structures, because the improve network functions as channels of information. Teachers religiosity was not measured, only the extent of student perception of attention. Inasmuch as we find most significant impact of teacher attention on student achievement, our findings enhance the concept based of structural effectiveness of social capital. Data and method
The research design is one of quasi‐experimentation in which we collected data through a self‐administered questionnaire4 in denominational and non‐denominational secondary (grades 11 and 12 in all countries) schools in the
4 The project is sponsored by OTKA (T048820) and the János Bolyai Research Scholarship of the Hungarian Academy of Sciences.

ARE FACTORS OF SOCIAL CAPITAL ABLE TO MODIFY SOCIAL REPRODUCTION EFFECTS?
123
neighboring counties of Hungary, Romania and Ukraine in 2006. The subjects of the research had been chosen through a two‐stage approach. As we intended to examine the school careers of Hungarian‐speaking students within and outside Hungary in denominational and non‐denominational secondary schools, we chose the schools by pairing each denominational school with a non‐denominational one of similar status regarding their location and the students’ social position. To appreciate student social position we used longitudinal statistical databases collected by ministry of education. Thus, the list of sampled schools consisted of pairs of 40 schools chosen in the way described above. During the second stage, we have chosen randomly among classes of corresponding grades in each school. The final sample consisted of 1466 students. Variables
The dependent variable, student’s achievement: was measured as factor score extracted through principal component analysis of student’s achieve‐ment (school efficiency of student): The items included were all dichotomies: (1) possession of language exam certificate (2) participation of student at student competitions (3) further (higher education) study plans (4) the length of further study plans is above average or not. Extraction was possible as the summated scale’s reliability index (alpha) exceeded 0,7.
Independent variables There were a few contextual variables which were measured only at the school level:
• Type of the school (denominational =1) • Country (the location of the school: Hungary=1)
Other independent variables were measured both at individual and school level:
• Occupation of mother: professional (executive or non‐executive intellectual5) or not
• Occupation of father: professional (executive or non‐executive intellectual) or not Concerning Romania and Ukraine, the white‐collar workers and the entrepreneurs were in the upper class (group), as well.
• Gender (male=1) • Teacher’s personal care which was obtained as factor score of principal
component of: (perception of teacher’s relationships with the student). The items included in the analysis were three dichotomies: (1) the teacher talks to
5 A profession is considered intellectual if a higher education degree needs to the job.

HATOS ADRIAN, GABRIELLA PUSZTAI, HAJNALKA FÉNYES
124
student about his/her personal problems, or not (2) the teacher talks to student about plans for the future, or not (3) the teacher talks to student about his/her life expectations, or not. The summated scale of the above items has an alpha>0,7.
• Personal religious practice of student: if the student prays regularly or not (dichotomy).
• Parents’ religious network: was obtained as principal component of: three dichotomous items: (1) if the parents have religious group of friends or not (2) if the parents go regularly to small religious groups (3) if the parents go regularly to congregation/parish. Here again the summated scale of the above items has an alpha>0,7.
• Students’ religious network was obtained as principal component of: five dichotomous items: (1) if the student has religious group of friends or not (2) if the student go regularly to congregation/parish (3) if the student goes regularly to religious youth group (4) if the student met his/her friends in religious youth group (5) if the student met his/her friends in congregation/parish. Again, the summated scale of the above items has an alpha>0,7. Aggregated measures of these variables were computed as averages of individual values at the school level: percent of male student, average index of teachers’ personal care, average extent of parents’ religious networks, average extent of children’s religious network, average religiosity (measured as percentage of students’ declaring praying often and called in the results section as religious practice), percentage of fathers’ with intellectual profession, percentage of mothers with intellectual profession. One important contextual variable identifies the school as denominational or not. The country variable was also introduced in the analysis as a contextual variable discerning schools located in Hungary from those in Romania and Ukraine. The school level average of the dependent variable cannot be used either, as at the final stage we are modeling this average too (it would be like modeling a variable through itself). Analytical Procedures
First, we will apply some basic multivariate tests in order to assess one of the basic assumptions found in the literature, the negative influence on social reproduction mechanisms of denominational schools. This will allow us to evaluate also the weight of the sample design on the data in focus in our research. Then, in order to robustly test all the expectations of the paper we will run some more complicated regressions which will address the requirements of the hypotheses and of the data. Four models have been fitted: an OLS regression model and three multilevel regressions of student’s achievement. Although in instances in which contextual variables are supposed to play a significant role in explaining the

ARE FACTORS OF SOCIAL CAPITAL ABLE TO MODIFY SOCIAL REPRODUCTION EFFECTS?
125
variation of the dependent variable the usage of hierarchical‐linear models has been a standard for some times we have fitted the OLS regression as a base comparison model. Hierarchical modeling used a conventional approach: first we built an empty model needed to assess the ICC of the dependent variable, than a random regression coefficients model and a two level random intercept model required to test the hypotheses concerning the effects at both first and second level. The number of cases at both levels corresponds to consistency norms in multilevel regression assuring the calculation of robust standard errors. All the parameters in the hierarchical linear models were estimated using restricted maximum likelihood method6. Results
The check of the antireproductive effect of denominational schools
The most important assumptions in studies relating religious education with the sources of academic performance is the capacity of denominational schools to reduce the reproductive mechanisms through which students with better socio‐economic background obtain better educational results. We have checked if this assumption holds in our sample first by doing the two‐way tests of equality of means of the dependent variable between denominational and non‐denominational schools, between the two groups of countries and the levels of status of father and then modeling these differences across types of schools, countries and the status of the father through an ordinary linear model of the academic achievement. The simple comparisons of means enumerated above show us that students in denominational schools do perform better academically than students in non‐denominational schools; on average, students in Hungary have better performances measured through our indicators; students’ whose father holds an occupation that requires higher education have better results that those with lower status jobs (all p<0,01)7. These results are in positive terms with the expectations of our research. Yet, there is no evidence in them of the counter‐reproductive effects of denominational schools. This is the more important as the socio‐economic status breakdown of schools shows no pattern of concentration of students from deprived social categories in denominational schools.
6 Except, of course for the computation of deviance statistics in which case regular maximum likelihood estimates had been used (Snijders and Bosker, 1999).
7 The distribution of the dependent variabile violates only moderately the normality assumptions (based on K‐S tests). Yet, for large samples the results of the t‐tests are reliable.

HATOS ADRIAN, GABRIELLA PUSZTAI, HAJNALKA FÉNYES
126
Table 1.
Type of school by occupation of father (row percentages)
Non‐intellectual Intellectual Non‐denominational 80,7 19,3 Denominational 80,1 19,9
P(Χ2)=0,76 The apparent lack of pattern in the distribution of students from different status groups in the two types of schools considered hides contrasting distribution between Hungary, on the one hand and Romania and Ukraine on the other. Compared to Romania and Ukraine, in Hungary the same association shows a tendency of students from higher status groups to enroll in denominational schools. The partial associations of type of schools, social status of students by country provides slight associations (for both X2 p<0,1).
Table 2.
Partial association of type of school and father's profession by country (row percentages)
Non‐intellectual Intellectual Non‐denominational 71,4 28,6 Ukraine and
Romania Denominational 78,1 21,9 Non‐denominational 86,1 13,9 Hungary Denominational 81,7 18,3
According to the data, denominational schools in Hungary included in our sample concentrate middle class students while the contrary is true in Romania and Ukraine. Thus, our previous finding that students in denominational schools perform better might be a mere consequence of the social composition of these schools – considering that the Hungarian students make up 60% of the total sample – and a simple confirmation of the reproduction mechanism!8 Verifying these suspicions can be done through multivariate analysis. Simple OLS regression of the academic achievement against the three variables considered in the preliminary analyzes from the above pages shows a very weak positive academic effect of denominational schools.
8 Demanding, of course, answers to the issue of such contrasting student intakes by public and denominational schools on the two sides of the Hungarian Eastern border.

ARE FACTORS OF SOCIAL CAPITAL ABLE TO MODIFY SOCIAL REPRODUCTION EFFECTS?
127
Table 3.
OLS regression of academic achievement by country, school type and social status (R2=0,03)
B Std. Error Beta t Sig (Constant) ‐0.261 0.056 ‐4.705 0.000 Country (1=Hu) 0.299 0.057 0.149 5.242 0.000 Type of school (1=denominational)
0.099 0.056 0.050 1.774 0.076
intellectual prof. of father (1=yes)
0.276 0.070 0.111 3.927 0.000
Such a weak effect supports the idea that the average positive results of students in denominational schools are much more determined by composition of the sample and especially of the denominational schools from Hungary than by a counter‐reproductive effect of such schools. These results are hardly conclusive tough, considering the aims of our paper as well as the limitations of the data and of the statistical techniques employed. Most important, data in our sample is nested within schools and contextual effects should be expected and tested. Moreover, the results do not give any clue about our main issues relating academic achievement with social capital and teachers’ pedagogical practice. To deal robustly with these questions we will run multilevel regressions of the dependent variable. Regression of student achievement
In the OLS models we have introduced as predictors both individual and contextual‐level variables. The OLS model was able to explain only 9% of the variance of the dependent variable. There are five significant parameters in this exploratory model are
- Country (positive effect for being student in Hungary) - Gender (negative effect of being a boy) - Teachers’ personal care (positive effect) - Religious network of the child (positive effect) - Profession of father and mother: in both cases, parents having intellectual
profession influence positively the academic achievements of the children The strongest effects at the individual level, identified through standardized regression coefficients are those of: country, teachers’ personal care and religious network of the child. Though these results provide a support for our hypotheses much reliance on them cannot be invested as the data are nested within schools and the within schools variance has to be compared to that between unit in order to assess the reliability of estimates’ standard errors.

HATOS ADRIAN, GABRIELLA PUSZTAI, HAJNALKA FÉNYES
128
Table 4.
OLS regression of student academic achievement
B SE Beta t Sig (Constant) 0,528 0,103 5,139 0,000 Country ‐0,357 0,061 ‐0,177 ‐5,847 0,000 Type ‐0,038 0,061 ‐0,019 ‐0,622 0,534 Gender ‐0,118 0,059 ‐0,059 ‐2,024 0,043 Teachers’ personal care 0,160 0,028 0,163 5,687 0,000 Parents’ religious network ‐0,052 0,033 ‐0,052 ‐1,569 0,117 Child’s religious network 0,199 0,036 0,201 5,505 0,000 Child’s religious practice ‐0,015 0,069 ‐0,007 ‐0,216 0,829 Intellectual profession of father 0,153 0,077 0,062 1,976 0,048 Intellectual profession of mother 0,180 0,071 0,078 2,523 0,012
R2=0,091
Empty model
Computing the ICC (inter‐correlation coefficient) shows if a contextual analysis is needed or not. The inter‐correlation coefficient of 0,285 obtained in the case of our data shows that almost one third of the total variation of the dependent variable is within school variation, which is evidence of a high level of within‐group similarity, further suggesting strong contextual effects. For reference, in the literature a threshold of 0,05 (5%) is required to make the decision of multilevel analysis (Snijders and Bosker, 1999). Random regression coefficient (RRC)
RRC is a model in which only level‐1 are introduced predictors while the intercept is allowed to vary between the groups. The large second order error term [U0=0,267, p<0,01] remaining, shows that there is still a significant variation between schools in what concerns the average of the academic performance of the students. That is, individual level variables are not enough to account for the variation of dependent variable. Using the formula of Bosker and Snijders (1999) for the assessment of reduction of variance we find that this simple model accounts for 7% of the between‐school variation and 12% of the between student variation of the dependent variable. Most of the individual effects in this regression reproduce those from the OLS: strong positive influences of perceived teacher’s care and child’s religious network while the parameter of gender remains again at the edge of significance. A highly interesting effect of controlling the between school variance is the disappearance of the effect of SES measured here through the occupation of the parents. This is not due as one could expect to the increase in the standard

ARE FACTORS OF SOCIAL CAPITAL ABLE TO MODIFY SOCIAL REPRODUCTION EFFECTS?
129
error of the regression estimates but to the decrease of the estimates themselves. The data suggests, confirming results from other research (Hatos, 2008), that consider the action of contextual factors, that the individual level effect of SES is confounded with that of social composition of the schools as a consequence of the processes of social segregation and differentiation at school level.
Table 5.
The Random Coefficient Regression and the Two Level Model
Random coefficient regression Two level model
B SE t Sig B SE t Sig (Constant) 0.003 0.100 0.039 0.969 Gender ‐ ‐0.126 0.064 ‐1.984 0.047 ‐0.122 0.064 ‐1.912 0.056 Child’s religious network 0.116 0.032 3.562 0.001 0.112 0.031 3.531 0.001 Parent’s religious ‐0.019 0.034 ‐0.571 0.567 ‐0.014 0.034 ‐0.423 0.672 Teachers’ personal care 0.138 0.030 4.487 0.000 0.135 0.030 4.394 0.000 Student’s religious practice 0.041 0.064 0.637 0.524 0.046 0.064 0.724 0.469 Intellectual prof. of father or not
‐0.064 0.071 ‐0.911 0.363 ‐0.084 0.070 ‐1.189 0.235
Intellectual prof. of mother or not
0.048 0.069 0.706 0.480 0.034 0.068 0.507 0.611
Intercept ‐1.045 0.570 ‐1.833 0.076 Country (1=Hungary) 0.752 0.133 5.653 0.000 %boys 0.350 0.349 1.003 0.324 Teachers’ care (average) ‐0.435 0.219 ‐1.986 0.056 Parents’ religious network (average)
‐0.613 0.332 ‐1.849 0.074
Students’ religious network (average)
0.782 0.276 2.832 0.009
Religiosity ‐0.025 0.559 ‐0.045 0.965 %father with intellectual profession
2.257 0.616 3.661 0.001
% mother with intellectual profession
0.436 0.581 0.751 0.459
Type (1=denominational) ‐0.093 0.143 ‐0.654 0.518 U 0.267 0.112 R 0.691 0.691 Deviance No of
parameters: 12, Df=9
2958,13 (P<0,000)
No parameters: 19, Df=8
2918,23 (p<0,001)
R21 0,067 0,203 R22 0,120 0,564
Two levels, intercepts only model
As we have found from the earlier models, a large part of the variation of the dependent variable is attributable to differences between schools. In

HATOS ADRIAN, GABRIELLA PUSZTAI, HAJNALKA FÉNYES
130
this second model we added predictors measured at the level of the school to explain the variation of the school level average of the academic achievement and to test the hypotheses that contextual variables have significant influence on individual student’s academic achievements. The model has the remarkable feature of explaining a great part of the between schools variation of educational achievements. All the other level 1 effects are largely unchanged: the greater the teachers’ personal care and the child’s religious network the greater his/her academic achievement. Adding the contextual variables in the explanation of school level averages highlights the significance of the effect of country which is the most important contextual factor explaining variation of the dependent variable The second contextual variable affecting the dependent variable, considering the size of the t‐ratio, is the social composition of the school: the proportion of colleagues with father holding intellectual occupations has a powerful positive effect. If all students were in this situation in a school, the school average of academic achievement measure would increase by 2,3 standard deviations. Another important positive contextual effect is that of the average size of students’ religious network. Hence, we infer that supporting religious networks of the students at the school level is connected to the pursuit of academic performance at the school level. Other two slightly significant contextual parameters have, though, unexpected influence on the school averages of dependent variable. Thus, both the averages of teachers’ personal care and of the measure of parents’ religious networks have negative effects on the average of student achievement at the school level. One important finding in the data is that no significant direct contextual effect of the type of school on the academic achievement of their students remains after controlling for the other variables – individual and contextual. The peculiarities of denominational schools with regard to academic performance seem to be explained totally by their social intake, specific pedagogical practice and specific social capital. Discussion of results
Earlier (Pusztai, 2008) we carried out analyses based on individuals and tried to represent contextual effects with the attributions of aggregate students groups. We compared three context variables (the school composition based on parental social status, teachers’ care aggregated at school level, and the school‐average of students’ religious network) with each other to find out what impact they may have on the students’ academic career. According to the

ARE FACTORS OF SOCIAL CAPITAL ABLE TO MODIFY SOCIAL REPRODUCTION EFFECTS?
131
analysis, it can be stated that there is significant divergence shown among the sectors in the school composition according to parental social status and religiosity of students. In the current analysis using multilevel modeling technique we intended to map the influences of the context, because it was revealed that there are great differences between schools as well as the similarities within the educational institutions are being significant. An integral feature of our study was that we tested our hypothesis that the school context has a great influence on commitment pertaining to studying and academic performance. The important aspect of our design was separation between some dimensions of contextual influences on academic performance. First of all, we can state that contextual effects have a determined impact on student achievement in some dimensions. It was not surprising to discover the diverse social composition of particular schools based on the parental social status. The investigated area is mostly disadvantaged peripheral region far from the developed centers of each country. It is a main law in educational sociology, that the greater are social differences in a society, the more selective became schools despite the interventions of educational policy. We supposed the positive impacts of dense religious networks in school community on student achievement level. Also Coleman called our attention to the students’ relationships networks organized along the religious community. If students’ weak and strong ties dominantly link friends to a religious circle, this structure of social connections influenced positively student achievement on double ways: on the one hand with the help of social control, and on the second hand based on common value‐system. The standard goals, values and norms became redundant in a social system around the student and support them achieve steadily ad resolutely (Burt, 2001). On the basis of the international empirical findings we presumed that religious networks bring stimulating norms into the school context, and can promote the healthy performance competition. The strength of the effect of the density of religious networks in schools was remarkable in our model. It is likely therefore that, the school density of the students’ religious relation networks has dominant influence on academic progress, and it can be accelerated when the students’ inner and outer communal control and norms prevailing in the community. Also in contextual level affirms the compensatory effect of social capital based on the density of religious friend‐circles in school‐community. This fact means that, also students in school‐community without own religious friends can use the resources from classmates’ religious networks. Consequently the collective effectiveness originates from the intergenerational consensus on norms, which can be beneficial even to those students who lack this kind of resource.

HATOS ADRIAN, GABRIELLA PUSZTAI, HAJNALKA FÉNYES
132
However, it was also presumable that a strong conviction of teachers’ care in the school context will encourage pupils to perform better; our data represented falsification of the thesis. There is limited representation of schools and school‐staff in the mainstream studies in educational sociology. According to Bourdieu the role of the schools and teachers can be characterized by the legitimating social inequalities. In that theoretical context teachers are not only incapable, but do not even attempt to improve the students’ achievement, which one can be predicted on the basis of parental social status. The school level perception of teachers’ care however proved to have slightly negative effect on achievement. In the case of the two sectors, different orders developed by including teachers’ care on school level. However, perception of teacher’s care is very subjective variable because of their special reference to the students’ expectations. Students could not compare the levels of teacher attention among schools, but they can compare with their own expectations. As for the findings on the contextual level of the country‐effect we can provide an interpretation in terms of minority or majority status effect. There are well‐known different consequences of the ethnic minority status on the educational achievement regarding to the type of minority (Ogbu, 1987). While voluntary minorities strive to use the majority school‐system and achieve well, involuntary minority students’ aspirations could be frequently restricted. Hungarian minority pertains to the second type; they make a significant effort to maintain separate school‐system, which do not offer enough opportunity and perspectives for the future studies. Also it is not contradictory to our assumption the positive impact of high parental occupational status on the academic achievements of the student. Additionally it is not surprising to experience the negative gender effect on individual achievement in the case of boys (Fenyes, 2008). These differences may also reflect the general patterns of differences in academic efficiency recorded in international assessment between the three countries (PISA, 2007). Thus, according to all of these measurements, secondary school students in Hungary perform better than those from Romania or Ukraine (Pusztai, 2007). Concerning the negative effect of parents’ religious networks we can refer to previews empirical evidence from the investigated region. In the region religiosity in the parental cohort on the one hand conserved its traditional character, and on the other hand shows some impacts of ideological repression: the middle aged generation has a very weak belonging to the church without individual renewal and without organizing small religious communities. This type of religiosity lost the strength of community involvement, so it misses the resources to construct social capital. Moreover, we suspected that parental religiosity indicators are associated with parental occupational status. However this working hypothesis is contradicted by the data. Thus, we cannot speak about accumulation of absences of cultural, economic and social capitals.

ARE FACTORS OF SOCIAL CAPITAL ABLE TO MODIFY SOCIAL REPRODUCTION EFFECTS?
133
As far as the significant impact of the school achievement averages is concerned, we can state that one of the most important features of the school climate is the standard of public opinion about the significance of the learning, schoolwork and achievement. The school level of the prestige of learning depends on the density of students who consider really valuable their work as a student. It can explain the significant influence of the school achievement averages. Conclusions on the basis of the multilevel regressions presented above cannot be turned into theoretical statements without prudence due to several limitations in our research design: 1) the sampling of subjects at both levels (schools and individuals) might have produced significant biases upon the parameter estimates; 2) cross‐level interaction terms have not been tested. Exploratory analyses done after the models in the article were produced suggest that the effect of religious social capital is interacting with the type of school. Thus the impact of school type cannot be rejected firmly but has to be supposed to occur in a more sophisticated way: 3) some of the measures in the data set may raise doubts on concerning validity – i.e. the dependent variable and the social status of the parents; 4) we have not made distinctions among denominational schools on the bases of their corresponding denomination. Conclusions
In this paper we intended to discuss our results in connection with the effect of school level resources on school performance. We presumed that the school context has a great influence on academic performance with the mediation of the composition of social status of parents, the context rates of the students who are members in religious networks as well as the general perception of teachers’ care in the school context. To win some basic association individual effects were taken into account. Consistent with our expectations, the presented analysis confirmed the central importance of parental occupation. Intellectual profession of parents improved students’ school achievement level. Both the determined and regular personal religious practice as well as students’ and parents’ belonging to a religious network promoted the better school achievement of students. Besides, we experienced that gender has an important role in secondary school achievement regardless other characteristics of students the school efficiency of girls was higher. Findings showed the high intensity of teachers’ personal care, that has a positive effect on the school career of students. The main goal of this paper was to point out the contextual effects on students’ achievement. One of the strongest effects on school career seemed to be a school’s location. That is the minority schools’ students can achieve worse than majority school student. The investigated student population in Romania and Ukraine is identified as involuntary type of minorities according to Ogbu’s typology, and they have restricted aspiration towards the higher level of educational system. To reveal the reasons a series of empirical studies should be carried out.

HATOS ADRIAN, GABRIELLA PUSZTAI, HAJNALKA FÉNYES
134
Our analysis validated the importance of school composition according to parental occupation; high proportion of parents with intellectual profession in school context increased the probability of better achievement of students. This mechanism proves that schools as communities with the everyday interactions among students can canalize information and norms from the families to the peer community and can foster the constructions of the new meaning about school career. High proportion of students with outstanding performance has essentially parallel effect. The great significance of learning activities and good achievement is excellent indicator of effective school climate, so there is nothing astonishing in the fact that the average school efficiency of students in school community can have better influence on both student groups with better results and with worse results. We should admit that such a climate has rather medium impact on student achievement. Thanks to special composition of the investigated sample it was a fine opportunity to investigate the impact of school‐sector as well as the effects of religious factors. To avoid the mistakes in conclusion it is important to analyze not only the type of school, but the measured indicators of religiosity. Our data showed that the rate of students with personal religious practice increase the achievement level in school context. That is the same case with the average size of students’ religious network in school context. It seemed to be proved that prayers and members of religious networks in social environment of a school contribute to the formation of positive climate of learning, which inspire the not only the religious students, but also students who live without any religious activity. If a school context is characterized by a low proportion of religious students, merely the type of maintainer cannot develop the effective climate. Contrary to the confirmed importance of intergenerational effects of religiosity in students’ context, the negative effect of parental belonging to religious networks was revealed. That means that only religious network affiliation in parental generation has even more counterproductive effect on the student achievement, when it is not interconnected with the religiosity in intergenerational relations. Contrary to our hypothesis only the intensity of teachers’ personal care perceptions in school context is not effective predictor of higher student achievement rates. In the classes and schools where there is impression of high intensity of teachers’ personal care, the school efficiency of students is lower for all students. This result needs further analysis, because it seems to contradict to the main claim of the modern pedagogy which focuses on the student‐centered education. It is interesting that we can experience this effect only at the individual level, and when a lot of students in a given community sense personal teacher care, and they cannot compare it with the observations from different schools, it has not enough inspiring impact.

ARE FACTORS OF SOCIAL CAPITAL ABLE TO MODIFY SOCIAL REPRODUCTION EFFECTS?
135
REFERENCES Abar, B., Carter, K., and Winsler, A. (2009). The effects of maternal parenting style and
religious commitment on self‐regulation, academic achievement, and risk behavior among African‐American parochial college students. Journal of Adolescence, 32(2): 259‐273.
Ainsworth, J.W. (2002). Why Does It Take a Village? The Mediation of Neighborhood Effects on Educational Achievement. Social Forces, 81(1): 117‐152.
Azzam, A.M. (2007). Why Students Drop Out. Educational Leadership, 64(7): 91‐933. Baldwin, T.T., Bedell, M.D., and Johnson, J.L. (1997). The Social Fabric of a Team‐Based
MBA Program: Network Effects on Student Satisfaction and Performance. The Academy of Management Journal, 40(6): 1369‐1397.
Boudon, R. (1973). L'Inegalite de chances. La mobilite sociale dans les societes industrielles. Paris: Hachette.
Bryk, A.S., Lee, V.E., and Holland, P.B. (1993). Catholic schools and the common good. Cambridge, Mass.: Harvard University Press.
Bryk, A.S., and Schneider, B.L. (2002). Trust in schools: A core resource for improvement: Russell Sage Foundation Publications.
Burt, R.S. (2001). Structural holes versus network closure as social capital. Social capital: Theory and research, 31‐56.
Byfield, C. (2008). The impact of religion on the educational achievement of Black boys: A UK and USA study. British Journal of Sociology of Education, 29(2): 189‐199.
Carbonaro, W.J. (1999). Opening the Debate on Closure and Schooling Outcomes: Comment on Morgan and Sřrensen. American Sociological Review, 64(5): 682‐686.
Coleman, J.S. (1988). Social capital in the creation of human capital. American journal of sociology, 94(Supplement): S95‐S120.
Corten, R., and Dronkers, J. (2006). School achievement of pupils from the lower strata in public, private government‐dependent and private government‐independent schools: A cross‐national test of the Coleman‐Hoffer thesis. Educational Research and Evaluation, 12(2): 179‐208.
Croninger, R., and Lee, V. (2001). Social Capital and Dropping Out of High School: Benefits to At‐Risk Students of Teachers' Support and Guidance. The Teachers College Record, 103(4): 548‐581.
Fenyes, H. (2008). Contextual effects on student efficiency at secondary school students. Review of Sociology, 14(4): 33‐62.
Hatos, A. (2008). Impactul segregării şi diferențierii asupra performanțelor şcolare ale elevilor din clasele 10‐12. O analiză multinivel [A Multilevel Analysis].Calitatea Vietii, XIX(1–2): 141–158.
Jencks, C., Mayer, S.E. (1990). The social consequences of growing up in a poor neighborhood. In M. G. H. M. L. Lynn Jr. (ed.): Innercity poverty in the United States. Washington, DC: National Academy Press, pp. 111‐186.

HATOS ADRIAN, GABRIELLA PUSZTAI, HAJNALKA FÉNYES
136
Kiesner, J., Poulin, F., and Nicotra, E. (2003). Peer Relations Across Contexts: Individual‐Network Homophily and Network Inclusion In and After School. Child Development, 74(5): 1328‐1343.
McNeal Jr., R.B. (1999). Parental involvement as social capital: Differential effectiveness on science achievement, truancy, and dropping out. Social Forces, 78(1): 117‐144.
Ogbu, J.U. (1987). Variability in minority school performance: A problem in search of an explanation. Anthropology and Education Quarterly, 18(4): 312‐334.
Park, H., and Bonner, P. (2008). Family Religious Involvement, Parenting Practices and Academic Performance in Adolescents. School Psychology International, 29(3), 348‐362.
Pásztor, A. (2005). Ellenszélben. Iskolázottsági egyenlõtlenségek a kisebbségi magyar fiatalok körében a rendszerváltozást követõen [Against the Mainstream. Educational inequalities among young ethnic minority Hungarians after the change of the political regime]. Budapesti Corvinus Egyetem, Budapest.
PISA. (2001). Knowledge and skills for life : first results from the OECD Programme for International Student Assessment (PISA) 2000 (No. 9264196714). Paris: Organisation for Economic Co‐operation and Development.
PISA. (2007). PISA 2006: Science Competencies for Tomorrow’s World Executive Summary: Organisation for Economic Co‐operation and Development.
Pusztai, G. (2006). Community and Social Capital in Hungarian Denominational Schools Today. Religion and Society in Central and Eastern Europe, 1.
Pusztai, G. (2007). Effect of social capital on educational achievement of Students in Denominational and Nondenominational School Sectors. In E. Révay and M. Tomka (eds.): Church and Religious Life in PostCommunist Societies. Budapest: Loisir, pp. 241‐258.
Pusztai, G. (2008). What is the Resource of Trust in School Communities? In G. Pusztai (ed.): Education and Church in Central and EasternEurope at First Glance. Debrecen: CHERD, pp. 119‐143.
Rumberger, R., and Palardy, G. (2005). Does Segregation Still Matter? The Impact of Student Composition on Academic Achievement in High School. 107(9), 1999‐2045.
Shaunessy, E., Suldo, S.M., Hardesty, R.B., and Shaffer, E.J. (2006). School Functioning and Psychological Well‐Being of International Baccalaureate and General Education Students: A Preliminary Examination. Journal of Secondary Gifted Education, 17(2), 76‐89.
Simmons, R.G., and Blyth, D.A. (1987). Moving Into Adolescence: The Impact of Pubertal Change and School Context: New York: Aldine Transaction.
Snijders, T.A.B., and Bosker, R.J. (1999). Multilevel analysis: An introduction to basic and advanced multilevel modeling. London: Sage Publications Ltd.

STUDIA UNIVERSITATIS BABEŞ‐BOLYAI, SOCIOLOGIA, LV, 1, 2010
CAREERSTART: A MIDDLE GRADES STRATEGY FOR PROMOTING STUDENT SCHOOL ENGAGEMENT
AND ACADEMIC SUCCESS
DENNIS K. ORTHNER*, HINCKLEY JONESSANPEI**, RODERICK ROSE***, MICAELA MERCADO**** AND PATRICK AKOS*****
ABSTRACT. The world economy is changing and putting more pressure on schools to prepare students to be academically successful and career ready. However, many teachers and school systems are not prepared to help their students understand the links between what is being learned in class work and future jobs and careers. CareerStart is a middle grades teaching strategy that attempts to increase the career relevance of core curriculum courses (math, language arts, social studies and science) in 6th, 7th and 8th grades. Teachers augment their instruction by giving examples of how what they are teaching is related to the careers and job skills of people in their communities. Example lessons are available on‐line and teachers are encouraged to create their own lessons. This report provides data on the implementation of CareerStart and provides findings from a longitudinal evaluation of over 3,000 students in a large school district. Results confirm that students with most of the teachers providing career illustrated lessons are significantly more likely than students not hearing career examples to: 1) be highly engaged in the schools, 2) have fewer unexcused absences, 3) be less likely to get into trouble and get suspended, and 4) perform better on their end‐of‐grade math and reading tests. The findings are interpreted as providing support for the possible‐selves early adolescence learning theory and to support efforts to begin career exploration with students in the core classes of their middle grades of schooling. Keywords: CareerStart, school engagement, school success, longitudinal study Introduction
The value of education for workforce and economic development has never been more clear. The jobs and careers of tomorrow, and for today as well, are increasingly technical and science based, requiring competencies in * School of Social Work, University of North Carolina at Chapel Hill, E‐mail: [email protected] ** School of Social Work, University of North Carolina at Chapel Hill, E‐mail: [email protected] *** School of Social Work, University of North Carolina at Chapel Hill, E‐mail: [email protected] **** School of Social Work, University of North Carolina at Chapel Hill, E‐mail: [email protected] ***** School of Education, University of North Carolina at Chapel Hill, E‐mail: [email protected]

DENNIS K. ORTHNER, HINCKLEY JONES‐SANPEI, RODERICK ROSE, MICAELA MERCADO, PATRICK AKOS
138
language, mathematics, and complex networking skills that were not as necessary for earlier generations of adults. The 21st century labor market is now worldwide with competition for jobs and trade operating across the globe and between nations and regions that are highly competitive and actively exchanging skills and products to meet one another’s needs. In this new world market, primary and secondary schools serve as a critical foundation for building the competencies needed for a national economy to compete on the world stage. The students graduating today in the United States or Romania or Norway will compete for jobs not just in their own country but with students who are graduating from schools in South Africa or Russia or Argentina. No nation can afford to have a large proportion of their youth unprepared for the labor markets that are evolving so quickly today. The United States and other advanced nations are responding to this demand by increasing the pressure on their schools to improve education quality. At the same time, however, only 73% of America’s students are graduating from high school, and among male students in poverty, less than half graduate (U.S. Department of Education, 2009). Youth who do not perform well in school or stay on track to graduate are more likely as adults to live in poverty, receive public assistance, and have poor health outcomes (Blafanz, Fox, Bridgeland and McNaught, 2009). Students who drop out of high school are more than eight times as likely to be in prison as high school graduates (Blafanz et al., 2009). Economist Alan Blinder from Princeton University writes, “It is clear that the U.S. and other rich nations will have to transform their educational systems so as to produce workers for the jobs that will actually exist in their societies… Simply providing more education is probably a good thing on balance, especially if a more educated labor force is a more flexible labor force that can cope more readily with non‐routine tasks and occupational change… In the future, how we educate our children may prove to be more important than how much we educate them” (2005: 23). In this paper, a strategy for how to educate children in the middle grades of schooling is presented, along with data to show the benefits of this teaching strategy for student school engagement and academic achievement success. The “CareerStart” program attempts to improve the relevance of the core subjects required of all students in the target middle schools by helping teachers explain how people in jobs actually use the information that is being taught in the classroom. Though it was designed to help connect at‐risk students to their education, CareerStart is a universal strategy in that all students experience the intervention. It also is purposefully implemented at the start of middle school (6th grade) to capitalize on emerging competencies in early adolescent development and counter early school disengagement. The CareerStart program strategy is being implemented in the state of North Carolina in the United States and is operating in 9 school districts and 30 schools. Over 25,000 students have received this form of career relevant instruction.

CAREERSTART: A MIDDLE GRADES STRATEGY FOR PROMOTING STUDENT SCHOOL ENGAGEMENT …
139
The value of relevance in education
There is a movement in the United States to increase the relevance of educational instruction (Johnson, 2000). The Bill and Melinda Gates Foundation has come to the conclusion that students learn best when their teachers illustrate course content with practical applications to issues students are concerned about or future career decisions they will make. This foundation has funded a number of efforts to strengthen the quality of education and reduce the risks for student dropout, including the successful “Breakthrough” high schools where teachers purposively connect student learning to future education and careers. Another high school model called the “Quantum Opportunity Program” produced higher graduation rates by assuring that at‐risk high school students participated in developmental activities that promoted life skills and employment opportunities (Stern and Wing, 2004). The importance of school relevance is illustrated by a high school dropout in the Ohio education study who stated, “If the school really cares about us and wants more kids graduating, they are going to have to give us something to look forward to” (Orthner, 2007). A recent study of middle and high schools by the American Society for Quality in Engineering (2010) attempted to learn the extent to which science, math and technology education is preparing youth for the demands of higher education and emerging engineering careers. What they learned was disturbing. Student beliefs in the value of math and science for future careers were lower in high school than in middle school. Teachers in middle and high school were also criticized by 63% of the students for not providing any information on the career value of learning math and science. Theories of learning have consistently supported the significance of relevance to student achievement and school success. Modern expectancy‐value theories of learning propose that academic achievement and learning occurs when course content is offered in the context of what students believe will help them achieve their personal goals (Eccles, 1993). Information and tasks that are part of classroom instruction, but not connected to what the student perceives to be of value in light of their personal goals, can promote short‐term learning but the information is less likely to be retained or integrated into their cognitive framework (Wigfield and Eccles, 2002). Without a context for new information, students will be able to answer questions in the short‐term on a test but not retain this information for long‐term benefit. Possible‐selves theory provides additional justification for supporting relevance in education (Markus and Nurius, 1986). This motivation theory provides key clues as to why career and job‐related relevance of teacher‐provided instruction may promote student engagement, especially during the formative early adolescent years (Oyserman, 2008). This theory proposes that youth are actively engaged

DENNIS K. ORTHNER, HINCKLEY JONES‐SANPEI, RODERICK ROSE, MICAELA MERCADO, PATRICK AKOS
140
in developing concepts of their future selves that can motivate them to learn content that is consistent with this projection. The more clear the cues to future possible selves, the better students can create a cognitive framework within which they can collect and aggregate new information that applies to these future self concepts. Research to test this theory has demonstrated that students with higher levels of crystallization of their possible selves perform better on tests, attend class more frequently, and retain knowledge longer (Oyserman, 2008). Finally, research and theory on school transitions in early adolescence supports attention to engagement and relevant learning. Research suggests that many early adolescents experience academic declines (Alspaugh, 1998) and increased distress (Anderman, Maehr and Midgley, 1999) with the transition from elementary school (5th grade) to middle school (6th grade). Several authors (Akos and Galassi, 2004; Eccles et al., 1993) recommend creating a new kind of learning environment that supports students’ emerging desires for autonomy and increased capacity to think about their futures. CareerStart in middle school provides that opportunity for students to engage their possible selves while they are forming their new adolescent identity through emerging peer and learning opportunities.
The CareerStart Strategy
CareerStart is a teacher‐focused, school capacity‐building strategy that attempts to positively influence the educational and workforce trajectory for all students, but especially those at higher risk for school failure. The overall goal of CareerStart has been to develop, implement, and evaluate a future career orientation strategy designed to improve middle school student engagement, academic performance, and career exploration. If these middle school goals are achieved, it is expected that students exposed to CareerStart instruction and support will be better prepared for high school courses and stay in school to graduate. In the United States, middle school education is a significant departure from elementary school education. Students have multiple teachers rather than one teacher; they change classes throughout the day; they have elective classes on topics that explore new interests; and they are more likely to be involved in peer learning experiences. This means they experience extensive contextual change while concurrently experiencing significant personal change through puberty. As early adolescents seek autonomy and distance themselves from their parents, academic expectations and individual responsibility to learn educational content that is necessary for high school and future career success is increased.

CAREERSTART: A MIDDLE GRADES STRATEGY FOR PROMOTING STUDENT SCHOOL ENGAGEMENT …
141
CareerStart is a curriculum innovation that helps teachers in core middle school courses (math, science, language arts and social studies) illustrate the value of learning course content through career examples. These lessons illustrate careers in industries represented in the labor markets in which the schools reside. Students in classrooms with operating CareerStart principles should be able to get answers to the often asked questions: “Who really uses this information in the real world?” or “When will I ever really use this information when I leave school?” Many middle school teachers already attempt to make course content relevant to their students, but CareerStart builds on this with contemporary career illustrations and encourages wider use of these teaching methods.
Photo 1. The CareerStart Day
Source: authors’ photo
The CareerStart strategy revolves around mainstreaming career
exploration into the overall curriculum and culture of the middle school. Teachers are not asked to teach anything new; they use CareerStart lessons to augment what they are already required to teach with examples from careers in which this knowledge is used. For example, students learning to calculate volume in math learn its relevance to heating and air conditioning technicians, equipment operators at a utility, and manufacturing and design processes. Language arts and math content are applied in the exploration of business or office management activities, the development of business plans, or finance and marketing careers. The jobs that are illustrated in the CareerStart lessons range from those that only require a high school diploma and advanced technical training to those that require college or postgraduate degrees.
CareerStart provides critical tools that help teachers implement their instruction in ways that improve the relevance of their instruction. For example, CareerStart provides short, high quality and easy‐to‐teach lessons that core teachers in 6th, 7th and 8th grades can use to illustrate priority concepts that are part of the state required standard course of study. These lessons were prepared by

DENNIS K. ORTHNER, HINCKLEY JONES‐SANPEI, RODERICK ROSE, MICAELA MERCADO, PATRICK AKOS
142
excellent teachers, peer reviewed and reviewed by specialists prior to publishing. Ten example lessons were prepared for each of the four core course in each grade of middle school. Each of the 10 lessons was designed for a one or two‐day student experience. CareerStart lessons and support materials are available on‐line and can be easily accessed via the web at LearnNC (www.learnnc.org), an instructional website widely used by teachers in North Carolina. Teachers are asked to use the CareerStart lessons and to continue to develop and incorporate career‐relevant illustrations in other topics they teach; this is important since the CareerStart lessons by themselves only represent about 6% of the total instructional experience for students.
In addition to the lessons, CareerStart teachers receive updated email CareerStart Dispatch newsletters that keep them informed of new possibilities of career connections to the core content and examples of how other teachers have augmented their teaching to include career relevance. Teachers are also provided opportunities for training at the beginning of the year and coaching on how to best develop these career connections in other aspects of their teaching. Lead teachers, curriculum coordinators and school principals also receive updates on lessons learned from CareerStart and ways to help them promote CareerStart activities in their schools.
The CareerStart strategy also involves parents, caregivers and other school professionals in the instructional approach. One‐third of the lessons require a parent engagement activity in which a student would interview or plan an activity with their parents or caregivers. These activities typically get the students and parents talking about career issues or the types of information and skills that the adults in their lives use on their own jobs. In addition, other school personnel are often involved in career exploration activities or as support for CareerStart lessons. School librarians are encouraged to have U.S. Department of Labor or other career information resources available to teachers and students. School counselors are available to teachers and students to help in early career exploration and providing information on high school courses, community college or university opportunities. School social workers are available to help students identify community resources that can be accessed for career mentoring experiences or guidance in career opportunities available to youth and adults in the community, especially when parents or caregivers are not able to help make those links. It should be noted that CareerStart does not “track” students into particular career vocations or educational trajectories. Instead, it aims to expand students’ visions of the future career and educational opportunities available to them. Sorting students into distinct curricula –college track, general academic or vocational, for instance – already occurs in elementary and middle school, and especially when the students enter high school. Instead of fostering potential inequity, integration of workforce examples in the core curriculum allows all students to engage in career exploration and see the relevance of school at a fraction of the time and financial costs of after‐school or other targeted programs.

CAREERSTART: A MIDDLE GRADES STRATEGY FOR PROMOTING STUDENT SCHOOL ENGAGEMENT …
143
Program evaluation methods
CareerStart is being rigorously evaluated with an experimental design. Fourteen middle schools in a United States school district were randomized to treatment and control conditions. The seven schools in the treatment condition received the CareerStart intervention, while the seven schools in the control condition taught from the standard course of study only. As with many education interventions, compliance was not perfect. For example, many of the teachers in these control schools developed lesson plans on their own that included references to careers in a manner consistent with career‐relevant instruction (CRI). Also, over the course of the 3‐year intervention, teachers, administrators and students migrated between treatment and control schools. Consequently, it was understood at the start of this evaluation that while treatment was randomly assigned, compliance with assignment was imperfect. The data for this study and analysis are based on student‐reported exposure to CRI, not the assignment of the schools to treatment and control, thus this analysis is not based on the experimental design. CRI and student socio‐emotional engagement data were collected using an annual survey administered to all middle school students, thus the selection process included the entire population of middle school students in the district. Student academic achievement data were collected from state‐administered standardized tests conducted at the end of each school year. Sample
The population of students included all students in the school district beginning 6th grade in school year 2006‐07 and followed for the next 3 years. There were 3,074 students in the study: 49% were female; 49% Asian or White and 51% Black, Hispanic or Native American; 54% were defined as low‐income because they received publicly subsidized lunches during the study period; 33% came from single‐parent homes; and 17% were academically gifted. Independent variable: Career Relevant Instruction (CRI)
In a survey administered at the end of 6th, 7th, and 8th grades, students were asked if their teachers in each of the four core subjects, math, science, social studies, and language arts, often used examples from jobs and careers in class. The students had the option of answering: strongly agree, agree, uncertain, disagree, and strongly disagree. Including only those students who answered strongly agree or agree for each class, we summed the number of courses in which a student reported often hearing career examples during 6th, 7th, and 8th grade, resulting in a range of 0 to 12 CRI core classes over a 3 year period. Students were distributed normally across the range of 0 to 12, with the center
DENNIS K. ORTHNER, HINCKLEY JONES‐SANPEI, RODERICK ROSE, MICAELA MERCADO, PATRICK AKOS
144
categories (4 to 8) each representing approximately 11% of the students. We also examined the contribution of specific core subject classes (for example math or science) over the 3 middle school years, in which case a student could have had from 0 to 3 classes in which CRI is reported.
Dependent variables: student engagement and academic success
School engagement was measured both socio‐emotionally and behaviorally. Socio‐emotional school engagement was measured using the School Success Profile subscale (Bowen, Rose & Bowen, 2005). This includes 3 items that assess the student’s excitement of being in school and looking forward to learning new things at school. The scale was created by taking the mean of the 3 items in all instances where 2 or more of the items were not missing. The scale has an alpha for this sample of .80 and ranges from 1 to 5. Behavioral indicators included changes in student unexcused absences and students receiving school suspensions due to their behavior. Academic achievement was assessed by scores calculated from standardized end‐of‐grade (EOG) math and reading scale scores. These North Carolina (U.S) Department of Public Instruction EOG scale scores are intended to serve as normed developmental scales such that the same scale is used throughout all grade levels from third through eighth grade, with progress benchmarked by rising proficiency standards as students ascend through the grades. For this analysis, we used the 8th grade level of proficiency or content mastery on the math and reading tests required of all students.
Analysis Strategy
Means and proportions of academic achievement and engagement outcomes were reported for each level of CRI. The outcome variables—engagement, attendance, and suspension—were not normally distributed but were highly skewed to the left because the majority of the students reported high engagement, few missing school days, and no suspension incidents. These outcomes violate the normal distribution assumption, raising questions about the appropriateness of linear modeling. Furthermore, the continuous outcome models assume “metric invariance”—that the difference on the scale score between 1 and 2 is the same as the difference between 4 and 5, which is arguably not the case for the outcomes of interest. For the academic outcomes, the proficiency level, or subject mastery outcome, is of substantive interest. Therefore, a logical threshold was established for each outcome and logistic regressions were used to test for the associations between perceived CRI and the outcome variables, controlling for student demographic characteristics. Odds ratios and p‐values are reported in parentheses where significant.
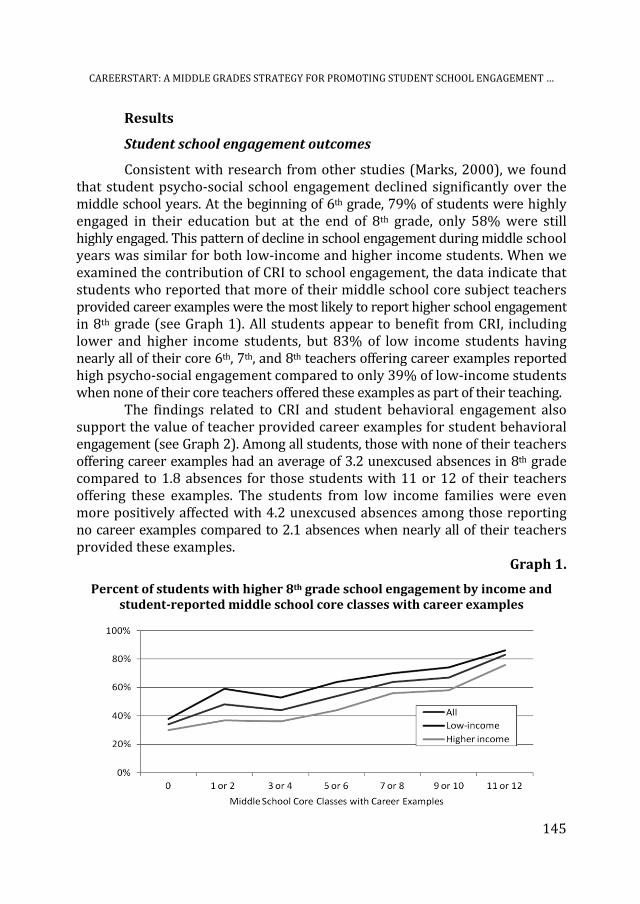
CAREERSTART: A MIDDLE GRADES STRATEGY FOR PROMOTING STUDENT SCHOOL ENGAGEMENT …
145
Results
Student school engagement outcomes
Consistent with research from other studies (Marks, 2000), we found that student psycho‐social school engagement declined significantly over the middle school years. At the beginning of 6th grade, 79% of students were highly engaged in their education but at the end of 8th grade, only 58% were still highly engaged. This pattern of decline in school engagement during middle school years was similar for both low‐income and higher income students. When we examined the contribution of CRI to school engagement, the data indicate that students who reported that more of their middle school core subject teachers provided career examples were the most likely to report higher school engagement in 8th grade (see Graph 1). All students appear to benefit from CRI, including lower and higher income students, but 83% of low income students having nearly all of their core 6th, 7th, and 8th teachers offering career examples reported high psycho‐social engagement compared to only 39% of low‐income students when none of their core teachers offered these examples as part of their teaching.
The findings related to CRI and student behavioral engagement also support the value of teacher provided career examples for student behavioral engagement (see Graph 2). Among all students, those with none of their teachers offering career examples had an average of 3.2 unexcused absences in 8th grade compared to 1.8 absences for those students with 11 or 12 of their teachers offering these examples. The students from low income families were even more positively affected with 4.2 unexcused absences among those reporting no career examples compared to 2.1 absences when nearly all of their teachers provided these examples.
Graph 1.
Percent of students with higher 8th grade school engagement by income and studentreported middle school core classes with career examples
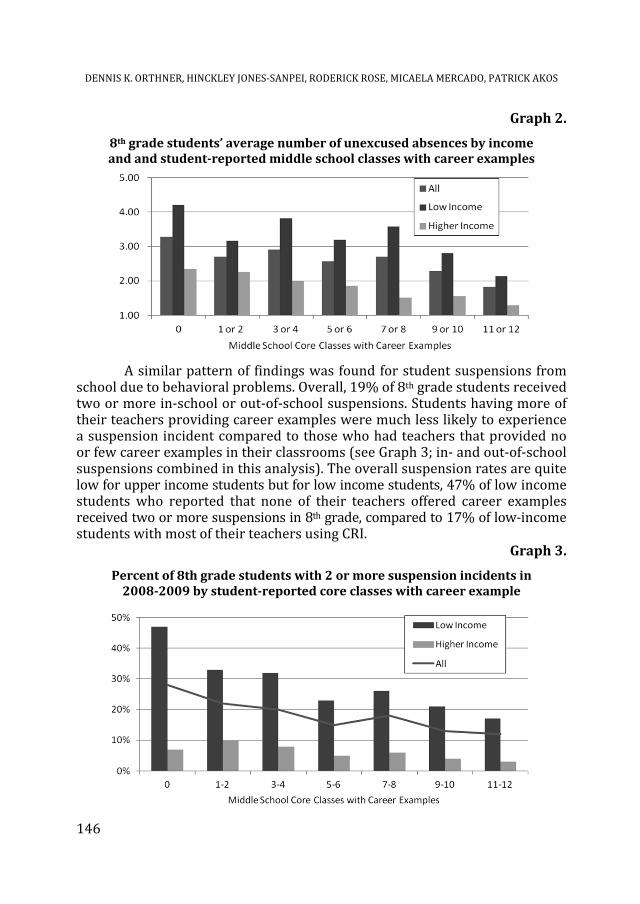
DENNIS K. ORTHNER, HINCKLEY JONES‐SANPEI, RODERICK ROSE, MICAELA MERCADO, PATRICK AKOS
146
Graph 2.
8th grade students’ average number of unexcused absences by income and and studentreported middle school classes with career examples
A similar pattern of findings was found for student suspensions from
school due to behavioral problems. Overall, 19% of 8th grade students received two or more in‐school or out‐of‐school suspensions. Students having more of their teachers providing career examples were much less likely to experience a suspension incident compared to those who had teachers that provided no or few career examples in their classrooms (see Graph 3; in‐ and out‐of‐school suspensions combined in this analysis). The overall suspension rates are quite low for upper income students but for low income students, 47% of low income students who reported that none of their teachers offered career examples received two or more suspensions in 8th grade, compared to 17% of low‐income students with most of their teachers using CRI.
Graph 3.
Percent of 8th grade students with 2 or more suspension incidents in 20082009 by studentreported core classes with career example

CAREERSTART: A MIDDLE GRADES STRATEGY FOR PROMOTING STUDENT SCHOOL ENGAGEMENT …
147
A logistic regression analysis (not shown) confirms that student‐reported teacher CRI (OR=1.10, p<.01) significantly contributes to high socio‐emotional school engagement, even after controlling for student ethnicity (OR=1.81, p<.01), gender, income, single‐parent status, special education status, and previous years school engagement (OR=2.39, p<.01) (Orthner, Jones‐Sanpei, Rose, Akos and Mercado, 2010). Additional analyses indicate that CRI in all four middle grade courses contribute to this outcome, indicating that school engagement benefits from math, science, social studies, and language arts teachers using career examples to illustrate their teaching.
Student academic achievement outcomes
Career relevant instruction also is shown to be associated with student academic achievement scores on standardized end‐of‐grade tests. The descriptive data on math test proficiency indicates that career examples in math and science classes were correlated with students’ math proficiency, while CRI in language arts and social studies was not related to math mastery (see Graph 4). For example, 73% of students with none of their middle grades math teachers providing career examples achieved mastery in math compared to 89% of students where all four of their math teachers offered career examples. The contribution of social studies CRI to math test scores appears modest and language arts CRI shows no effect. A logistic regression analysis with controls for student background characteristics and previous test scores confirms this relationship with significant odds ratios for only math (OR=1.19, p=0.039) and science (OR=1.26, p=0.01) CRI. The only student characteristic that contributes significantly to either model, after controlling for previous test scores, is special education status (math CRI: OR=0.567, p=0.01; science CRI: OR=0.574, p=0.01).
Graph 4.
Percent of 8th grade students achieving Math Mastery by Studentreported Career Examples (CRI) in core subjects during the 3 middle school grades

DENNIS K. ORTHNER, HINCKLEY JONES‐SANPEI, RODERICK ROSE, MICAELA MERCADO, PATRICK AKOS
148
The importance of CRI for proficiency test scores in 8th grade reading is also demonstrated in the data, but the results are not fully in line with what was expected. Overall, CRI by math and science teachers in the 3 middle school grades is associated with higher percentages of students demonstrating mastery on their 8th grade reading end‐of‐grade tests (see Figure 5). For example, among students with none of their middle grades math teachers providing career examples, 59% achieved mastery in reading compared to 78% of students for whom all four of their math teachers offered career examples, a benefit of 19%. For science teacher CRI, this benefit is twenty‐three percentage points, from 50% passing to 73% passing. The contribution of language arts and social studies teacher CRI is not significant, indicating that career examples in those courses did not appear to benefit reading achievement test scores. These descriptive findings are confirmed in a logistic regression analysis of reading mastery with controls for student background characteristics and previous test scores. Similar to the findings for math mastery, this analysis demonstrates significant odds ratios for only math (OR=1.17, p=0.025) and science (OR=1.16, p=0.033) CRI. The only student characteristics that contribute significantly to either model, after controlling for previous test scores, are low‐income (math CRI: OR=0.691, p=0.041; science CRI: OR=0.689, p=0.041) and minority status (math CRI: OR=0.521, p=0.0002; science CRI: OR=0.525, p=0.0002).
Graph 5.
Percent of 8th grade students achieving Reading Mastery by Studentreported Career Examples (CRI) in core subjects during the 3 middle school grades
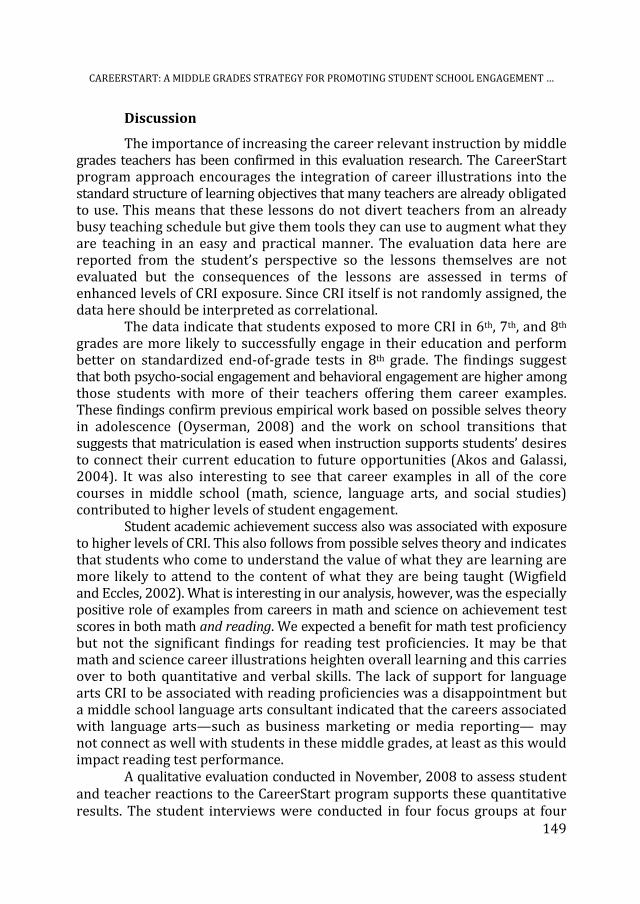
CAREERSTART: A MIDDLE GRADES STRATEGY FOR PROMOTING STUDENT SCHOOL ENGAGEMENT …
149
Discussion
The importance of increasing the career relevant instruction by middle grades teachers has been confirmed in this evaluation research. The CareerStart program approach encourages the integration of career illustrations into the standard structure of learning objectives that many teachers are already obligated to use. This means that these lessons do not divert teachers from an already busy teaching schedule but give them tools they can use to augment what they are teaching in an easy and practical manner. The evaluation data here are reported from the student’s perspective so the lessons themselves are not evaluated but the consequences of the lessons are assessed in terms of enhanced levels of CRI exposure. Since CRI itself is not randomly assigned, the data here should be interpreted as correlational. The data indicate that students exposed to more CRI in 6th, 7th, and 8th grades are more likely to successfully engage in their education and perform better on standardized end‐of‐grade tests in 8th grade. The findings suggest that both psycho‐social engagement and behavioral engagement are higher among those students with more of their teachers offering them career examples. These findings confirm previous empirical work based on possible selves theory in adolescence (Oyserman, 2008) and the work on school transitions that suggests that matriculation is eased when instruction supports students’ desires to connect their current education to future opportunities (Akos and Galassi, 2004). It was also interesting to see that career examples in all of the core courses in middle school (math, science, language arts, and social studies) contributed to higher levels of student engagement. Student academic achievement success also was associated with exposure to higher levels of CRI. This also follows from possible selves theory and indicates that students who come to understand the value of what they are learning are more likely to attend to the content of what they are being taught (Wigfield and Eccles, 2002). What is interesting in our analysis, however, was the especially positive role of examples from careers in math and science on achievement test scores in both math and reading. We expected a benefit for math test proficiency but not the significant findings for reading test proficiencies. It may be that math and science career illustrations heighten overall learning and this carries over to both quantitative and verbal skills. The lack of support for language arts CRI to be associated with reading proficiencies was a disappointment but a middle school language arts consultant indicated that the careers associated with language arts—such as business marketing or media reporting— may not connect as well with students in these middle grades, at least as this would impact reading test performance. A qualitative evaluation conducted in November, 2008 to assess student and teacher reactions to the CareerStart program supports these quantitative results. The student interviews were conducted in four focus groups at four

DENNIS K. ORTHNER, HINCKLEY JONES‐SANPEI, RODERICK ROSE, MICAELA MERCADO, PATRICK AKOS
150
schools with 22 eighth grade students. These students were not expected to know that they were in CareerStart schools since that program name was not used in their classrooms. When asked “what your teachers do to make what they are teaching really interesting and exciting for you as students,” about one‐fourth of the examples mentioned were CareerStart lessons. For example, one student said, “My language arts teacher gave us a fake job interview. It was how to do your resume. So it was using your vocabulary in things you had learned in language arts that could help you write your resume. She showed us two different resumes, an OK one and a very good one. She said that we were business owners and which one would we want to hire?” This came from a CareerStart lesson in seventh grade language arts. Other students commented on the value of hearing that what they were learning could be used in possible future careers. According to one student, “They [career related lessons] are more educational. We like this stuff... It helped put my education in a larger perspective, like, how is education going to help me in life?” Another student commented more specifically, “I’ll hear some people talking in math; they’ll be asking when is this going to relate in life? Then the teacher would actually tell us how we are going to use this in so and so job, and it just kind of keeps you motivated.” Students offered no negative comments on the value of career examples in their classroom work. They appeared to appreciate the attention given to their futures and how this helped them connect what they are learning to future opportunities. One student remembered, “When we [did our] resumes last year [our teacher] put all the careers we were thinking of doing [on the board] and she talked to us about each career and how to do a resume.” That led to lots of other comments from students about how this kind of attention really helped them see their class work as important. A student summarized her feelings this way: “I like it when they talk about career stuff, because then I’ll get an idea of my future. But I would like it if they would do it a bit more.” Thirty 7th grade teachers were interviewed in four focus groups in four CareerStart schools. The teachers were asked about their reactions to CareerStart lessons, both positive and negative. The negative comments largely focused around changes they had to make in their teaching styles and that they often needed more information about the careers that used the skills they were teaching in their classes. It was evident that many of these teachers were not familiar with the local or regional job market and the many kinds of new jobs and careers that were emerging in the 21st century labor force. Newer teachers really valued the lesson plans that were ready‐made for them; more experienced teachers reported having more trouble revising their teaching strategies to include this kind of career‐relevant instruction.

CAREERSTART: A MIDDLE GRADES STRATEGY FOR PROMOTING STUDENT SCHOOL ENGAGEMENT …
151
The value of CareerStart tools was evident in many of the comments made by the teachers. The practical value was highlighted in this statement: “I think it serves as an incentive for them to do their work and you can say to a student, you have to be able to do well in language arts in order to do A, B, C and D; you have to think critically and have to be able to write in order to do any job you want to do. A lot of our kids come from a place where they don’t see the connection in real life to what they are doing in school and they just don’t care. So when you show them there is a connection between what is going to happen when they turn 18 and what they are doing now, it pushes them harder in class.” In a higher poverty school, a teacher said, “It [CareerStart lessons] gives them an awareness of what is available outside their neighborhood. Because our population thinks of here and now in the neighborhood, they don’t think beyond that neighborhood. And it gives them something that says it is OK to become a doctor or ‘I didn’t know a medical technician could do this.’ It gives them something outside of their little box.” One teacher, speaking about a specific lesson in her class, said, “I have done the entire unit. The kids reacted positively, I noticed that the following day, after they had the CareerStart lesson, they were more serious about their learning, which I think is very positive.”
Conclusion
More work still needs to be done to update the CareerStart lessons and to give teachers even more resources that will help them better understand the evolving labor markets in their own communities and across the world economy. If career relevant instruction is to be part of the tool kit of the modern teacher, he or she will need to better understand the full range of jobs that are tied to the subject(s) that they teach and the specific skills needed in the 21st century labor market for those jobs. This is not to suggest that core subject teachers are to become vocational educators; but their students will benefit, as this evaluation has shown, from greater constructive engagement in career exploration and career illustrations as part of subject matter instruction. Teachers, however, are not able to carry this burden alone. A school that is serious about increasing career relevance for their students must have support from many parts of the education community. We have found that school district leadership is a key requirement for program success in that school level leaders pay attention to what is encouraged by their system leaders and board members. Within the school, it is important for school libraries to have access to labor market materials that teachers and students can use as resources in their planning and assignments. School counselors and social workers can help to engage parents and students in early career exploration and thinking, giving hope to students who may be discouraged or not see the relevance of their education.

DENNIS K. ORTHNER, HINCKLEY JONES‐SANPEI, RODERICK ROSE, MICAELA MERCADO, PATRICK AKOS
152
The community as a whole can be important allies in this kind of CareerStart effort. The business and professional communities can be mobilized to help schools and teachers understand the kinds of jobs and careers that are becoming the future of their economy. Employers can help sponsor Career Fairs for middle grade schools and students so that future career thinking is encouraged. We have supported this in our CareerStart schools and found that students, teachers and parents appreciate interacting with employers and businesses in the community. This stimulates conversations at home, among peers and in the classroom that increases the relevance of education and promotes a learning environment that has purpose beyond the tests and activities that typically occur in the school day or school year. All this helps to make education meaningful, practical and part of the process of promoting a more just and economically capable community and nation. Career relevant instruction is not a panacea for education. It does, however, provide an evidence‐based, low cost strategy to keep students engaged in school and support academic achievement at one of the most critical intervention points – the transition into early adolescence and middle grades education.
REFERENCES
Akos, P., Galassi, J. (2004). Middle and high school transitions as viewed by students,
parents, and teachers. Professional School Counseling, 7: 212‐221. Alspaugh, J.W. (1998). Achievement loss associated with the transition to middle school
and high school. The Journal of Educational Research, 92: 20‐25. Anderman, E.M., Maehr, M.L., Midgley, C. (1999). Declining motivation after the transition
to middle school: Schools can make a difference. Journal of Research and Development in Education, 32: 131‐147.
American Society for Quality (2010). ASQ/Harris Survey Shows Teachers Could Do More to Encourage Engineering Careers: Press Release. Milwaukee, Wisconsin: American Society for Quality.
Blafanz, R., Fox, J., Bridgeland, J., McNaught, M. (2009). Grad Nation: A Guidebook to Help Communities’ Tackle the Dropout Crisis. America’s Promise Alliance. Retrieved on 11 March 2010 from http://www.americaspromise.org/Our‐Work/ Dropout‐prevention/~/media/Files/Our%20Work/Dropout%20Prevention/ Grad%20 Nation% 20Guidebook %20052809.ashx
Blinder, A.S. (2005). Fear of Offshoring: A Policy Brief. Princeton, N.J.: Princeton University Center for Economic Policy Studies.
Bowen, G.L., Rose, R.A., Bowen, N.A. (2005). The Reliability and Validity of the School Success Profile. Philadelphia, PA: Xlibris Press.

CAREERSTART: A MIDDLE GRADES STRATEGY FOR PROMOTING STUDENT SCHOOL ENGAGEMENT …
153
Eccles, J.S. (1993). School and family effects on the ontogeny of children’s interest, self‐perceptions, and activity choice. In J. Jacobs (ed.): Nebraska Symposium on Motivation: Vol. 40. Developmental perspectives on motivation. Lincoln: University of Nebraska Press, pp. 145‐208.
Eccles, J.S., Wigfield, A., Midgley, C., Reuman, D., Mac Iver, D., Feldlaufer, J. (1993). Negative effects of traditional middle schools on students’ motivation. The Elementary School Journal, 93: 553‐574. doi:10.1086/461740
Johnson, L.S. (2000). The relevance of school to career: A study in student awareness. Journal of Career Development, 26: 263‐276.
Marks, H.M. (2000). Student engagement in instructional activity: Patterns in the elementary, middle, and high school years. American Educational Research Journal, 37: 153–184.
Markus, H.R., Nurius, P. (1986). Possible selves. American Psychologist, 41: 954‐969. doi:10.1037/0003‐066X.41.9.954
Orthner, D.K. (2007). Public schools: Building capacity for hope and opportunity. In Edwards, J., Crain, M., Kalleberg, A.L. (eds.): Ending Poverty: How to Restore the American Dream. New York: New Press.
Orthner, D.K., Jones‐Sanpei, H., Akos, P., Rose, R., (2010). Promoting school engagement: The effect of teacher provided career examples on the proximal indicators of students success. Presentation at the annual meeting of the Society for Social Work and Research, January 15, 2010.
Oyserman, D. (2008). Possible selves: Identity‐based motivation and school success. In H. Marsh, R. Craven, D., McInerney (eds.), SelfProcesses, Learning and Enabling Human Potential: Dynamic New Approaches, Vol. 3. International Advances in Self Research. Information Age Press, pp. 269‐288.
Stern, D., Wing, J.Y. (2004). Is there solid evidence of positive effects for high school students? In Using Rigorous Evidence to Improve Policy and Practice. New York: Manpower Demonstration Research Corporation.
U.S. Department of Education (2009). Digest of Education Statistics, 2009. Retrieved on 11 March 2010 from http://nces.ed.gov/programs/digest/d08/tables/dt08_106.asp?referrer=list
Wigfield, A., Eccles, J.S. (2002). Children’s motivation during the middle school years. In J. Aronson (ed.), Improving academic achievement: Contributions of social psychology. San Diego, CA: Academic Press, pp. 159‐184.
Wooley, M., Bowen, G.L. (2007). In the context of risk: supportive adults and the school engagement of middle school students. Family Relations, 56: 92‐104. doi: 10.1111/j.1741‐3729.2007.00442.x


STUDIA UNIVERSITATIS BABEŞ‐BOLYAI, SOCIOLOGIA, LV, 1, 2010
FROM CHILD PROTECTION TO HIGHER EDUCATION. ENDOGENOUS AND EXOGENOUS FACTORS INFLUENCING PARTICIPATION IN HIGHER EDUCATION OF YOUNG ADULTS BROUGHT UP IN PUBLIC CHILD CARE
ANDREA RÁCZ*
ABSTRACT. Young men and women raised in public child care face high risks of social and economic deprivation in European nations. This study covers three key issues. Firstly, it deals with the issue of how the situation of children living in and leaving from public child care is addressed in the Hungarian and the international strategies and policy papers. Secondly, it attempts to provide insight into both the Hungarian and the international research agenda related to the situation of children and young adults in public child care. In Hungary, there has not been much research that deals with children who were brought up in public child care. Consequently, we do not know much, for instance, about the school career, job progress, or the founding of a family in the case of young adults leaving from public child care. However, many international studies point out that those who were in public care tend to suffer from social discrimination and often fail to cope with their disadvantageous situation. Finally, on the basis of interviews made in Hungary within the framework of the Yippee international research project, it examines the key factors influencing the school performance of young adults in higher education. The aim is to analyze what types of endogenous and exogenous factors influence the educational career of these persons. By that, I hope to explore the policy measures needed to provide holistic, comprehensive support for children and young people in public child care in order to achieve better educational credentials.
Keywords: child protection, child and youth policy, higher education, institutional public care
Introduction
We hardly have any information on the life‐course of young people leaving from public child care for children Policy reports show that, compared to their peers, they rarely continue their studies to higher education (Jackson, 2007). As higher education became the norm in EU‐countries. Those unable to get a higher qualification will increasingly lag behind and be exposed to social
* University of Debrecen, Institute for Social Policy and Labour, e‐mail: [email protected]

ANDREA RÁCZ
156
exclusion, as well as to all related disadvantages in terms of health status, employment, income status, housing, social participation, and attainable life quality. It therefore has become pressingly necessary to keep these young people within the education system. This study covers three key issues. Firstly, it deals with the issue of how children living in and leaving from public child care appear in the Hungarian and the international strategies and policy approaches. Secondly, it draws attention to their participation in higher education and presents the results of some Hungarian and international research projects on this topic. Finally, on the basis of interviews made in Hungary within the framework of an international research project1, it examines the key factors for the participation of young adults in higher education. The interviews analysed for these purposes consist of conversations with young people participating in higher education or showing an interest in their educational career, as well as those with staff members of the Regional Child Protection Agencies in Hungary.
Facilitating the social integration of children brought up in public child care in the light of the strategic documents
The European Union has no common child and youth policy; basically any child and youth‐related matters fall within Member State competence. However, the coordination of Member State policies and common efforts made in the interest of key objectives and joint programmes also apply to these areas. In the following section we will review a few strategic documents from the 1 The research project entitled Young People from a Public Care Background: Pathways to Education in Europe (Yippee) started in 2009 and it covers five countries: Denmark, Hungary, Spain, Sweden and the United Kingdom. In the study, participants examined the cultural, social, psychological and practical factors that help and enable young people to study further, following their compulsory schooling. This international research project, financed by the 7th Research Framework Programme of the European Union, deals especially with young adults raised in public child care. Its objective is to provide a comprehensive view on what helps and obstructs young people, currently 19 to 21 years old, in further studies in each of these countries and what education paths exist in Europe for those with a public care background. The research had several phases. First the background reading and the published statistical data have been analysed. Interviews were then made with decision makers and providers, and a survey has been conducted among young people of 19 to 21 years old. Interviews were made in each country with 35 young people and a key person appointed by them (who encouraged them to study). It was focused on obtaining information regarding young people's education career, what were the factors that made it more difficult and, in general, which factors determined the continuation of their studies beyond the compulsory school age, and who were the persons that helped young adults in their further studies and the continuation of their education. One year later, the selected young adults were interviewed once again in order to find out how they were able to implement their plans and how their short‐term plans were amended. See: http://tcru.ioe.ac.uk/yippee.

FROM CHILD PROTECTION TO HIGHER EDUCATION.
157
European Union and from Hungary, containing measures focusing on children and young people, explicitly or implicitly, from the social groups living under the most disadvantageous conditions, and which aim at supporting children living in and leaving from public child care and facilitating their social inclusion through integration in higher education and on the labour market.
European strategic documents
The approach of the European Union towards young people is shown by the White Paper of the European Commission: “Whatever their differences (in terms of access to the labour market, education, family life, income, etc.), young people see themselves as fully fledged citizens with all the attendant rights and obligations. Investing in young people is an investment in the richness of our societies, today and tomorrow.” (Commission of the European Communities, 2001: 7). The articulation of these objectives shows the acknowledgement that, for durable and sustainable development, the European Union considers the social integration and employment of young people to be very important. The higher education policy of the Union placed increasing mobility and employability into its focus. In 1999 education ministers from 29 European countries signed the Bologna Declaration. They agreed upon important joint objectives aiming at the creation of a consistent and continuous European Higher Education Area by 2010. Under the Lisbon Strategy, adopted in 2000, the European Union should become a competitive knowledge‐based area, fostering job creation, and should be characterised by economic growth, social cohesion, the prioritisation of environment protection and sustainable development. In the context of the implementation of the Lisbon process, the European Youth Pact (2005) is of outstanding importance, as it contains the objectives identified as necessary to facilitate employment, integration and social progress, education, training, and the reconciliation of work and private/family life in connection with young people. The 2006 report highlights, in connection with social protection and social integration, that emphasis must be placed on the problem of poverty among children and their families. In the case of young people belonging to ethnic minorities and living in poor districts, the issue of cumulative exclusion must be addressed with special attention. In this context, the essential role of education and training in preventing the transmission of poverty between generations must also be highlighted (Council of Europe, 2006). In 2008 the renewed social agenda by the Commission of the European Communities was built around opportunities, access and solidarity. Under this agenda, ongoing efforts must be made to create opportunities in order to create jobs and prosperity. In order to use the opportunities, individuals must be assured of access to education, healthcare and to certain social services. This document considers children and young people as “the Europe of tomorrow”. Its

ANDREA RÁCZ
158
objective is to find solutions for the problems of high unemployment among young people and the large proportion of school drop‐outs, as well as the problems of relatively insecure employment and unequal pay affecting young people. Children must be encouraged to attain qualifications other than and of a higher level than those of their parents (Commission of the European Communities, 2008).
Hungarian strategic documents
Among the Hungarian strategic documents, the most comprehensive document in terms of reducing child poverty and increasing their opportunities is the “Better life for children” 25 Year National Strategy (2007). Provision of services to reduce inequalities in terms of healthcare, education, social welfare, child protection benefits and institutions, and to modernise institutions dealing with and providing services to children are key objectives within the National Strategy. According to the Government, children living in and leaving from public child care are considered to be disadvantaged in terms of labour market participation and employment opportunities, along with groups facing specific disadvantages such as the homeless, prisoners serving their sentence or people entering and leaving the criminal justice system, addicts and people suffering from mental illnesses (TÁMOP, 2007). The National Youth Strategy (2009) outlines a complex solution for implementing public tasks relating to young age groups. It formulates young‐age‐group‐related social objectives and tasks over a fifteen‐year time scale. It considers the facilitation of children being brought up in a family environment as one of the most important tasks; furthermore it prescribes the further development of the child‐protection provision system in order to ensure more successful social integration of those at risk and those leaving care.
The above‐mentioned documents show that the European Community has numerous provisions targeting young people, their education and widening their labour market opportunities. These provisions clarify the European Union’s social integration and solidarity objectives. Despite the fact that young people living in and leaving from public child care constitute one of Europe’s most disadvantaged groups in economic and social terms, the status of these young people is not explicitly acknowledged. People with public child care backgrounds were mentioned in the domestic strategies too, but they do not constitute a specific target group in these documents either. Nevertheless, the acknowledgement by the Government of their disadvantaged position, in terms of labour market and employment opportunities, is an important step forward.

FROM CHILD PROTECTION TO HIGHER EDUCATION.
159
Research projects related to the educational participation of children brought up in public child care
Hungarian research
Few research projects have been carried out in Hungary in connection with the school career and preparation for independent life of children raised in public child care, and the range of statistical data available is also limited. According to the 2006 child protection statistical data there were 21,216 children and young adults living in pubic child care.2. The number of those living in after‐care provision is 4,064; 48% of these lived with foster parents and 52% availed of the benefits in the framework of institutional provision in 2006. The reason for using the benefits was studying for 67% of the young adults and, for 30%, the fact that they were unable to sustain an independent life due to lack of sufficient income. Some 87 persons (3%) were expecting admission to a social institution, and 829 persons were in receipt of after‐care (Child Protection Statistical Guide, 2006).
According to statistical data a significant proportion (65%) of children in public care having finished elementary school continue their studies in a vocational school. There is a significant difference to be observed between the further studies of children being brought up in residential homes (in the Hungarian system: children’s homes and apartment homes) and those raised by foster parents. Of those living in residential homes who had finished elementary school, 76% studied at a vocational school, 7% at a grammar school, 14% at a vocational secondary school, and 3% attended an educational programme accredited within the National Record of Qualifications and provided outside the school system. Of children living with foster parents, 55% attend vocational schools, 13% a grammar school, 31% in vocational secondary school and only 1% receive education outside the school system. (Child Protection Statistical Guide, 2006) According to the data, children being brought up by foster parents are higher achievers than children brought up in residential homes; however, it is important to note that the mental abilities of children are very likely to determine the care location to which they are sent. Children with adequate mental development, of a low age and free of problems 2 In Hungary, those reaching the age of majority have the opportunity to stay in after care provision. Those engaged in studies may use this provision up to the age of 24, with the exception of those studying in full time higher education, for whom the upper age limit is 25 years. The provisions effective as of 1 January 2010 have significantly transformed the after‐care provision system. Those unable to sustain themselves (either working or unemployed) may stay in the system up to 21 years of age; earlier it was possible to receive benefits until the age of 24. After‐care provision may mean even full provision, including the costs of accommodation and food. However, the after‐care can assist in the preparation for an independent life, with the help of professionals.

ANDREA RÁCZ
160
have a higher chance of receiving foster parents (Neményi and Messing, 2007). One can note, regarding the orientation of children living in child‐protection system and attending vocational schools, that in the 2005/2006 school year 37% studied an industrial trade, 13% an agricultural trade, 24% catering and 27% of them continued their studies in other areas (Child Protection Statistical Guide, 2006).
Since 2002, the national competence assessment program has assessed the text‐comprehension and mathematical skills of students in three grades (6th, 8th and 10th grade) on an annual basis. Some 330,000 students from 3,058 institutions participated in the 2008 national competence assessment. This assessment provides an opportunity to compare the characteristics and school performance of 8th and 10th grade students living in residential homes with that of those living either with foster parents or in a family. Differences in scores achieved in mathematics and text comprehension largely depend on the place of upbringing. Students living with families performed at around the national average of 500 points, whereas those living in residential homes scored 70‐80 fewer points. In every grade, more of those living in residential homes have to repeat a year. In the lower classes (grades 1 to 4) 4% of those living in families, 17% of children living with foster parents and 27% of those living in residential homes repeated the grade. In the upper classes (grades 5 to 8) 4% of those living in families, 10% of those living with foster parents and 27% of those living in children’s homes repeated the grade. Investigating the average school achievements of the previous year, one can establish that students raised in public child care perform worse: the average score of those living in families is 3.96, whereas this is 3.47 among those living with foster parents and just 3.15 for students living in residential homes, based on the previous school year. Differences are also significant in terms of future education plans. Of those living in residential homes, 41% prefer a vocational school‐certificate, whereas this was only indicated by 11.3% of students living with their own families. Of students living with their own families, 55% intend to obtain a certificate of higher education, whereas this applies to 26% of those living with foster parents and to 15% of those living in residential homes (Gyarmati et al., 2009) According to estimated data, approximately 5% of children living in public child care are engaged in post‐secondary studies.
According to Szikulai’s (2006) research on after‐care provision and after‐care, a significant difference can be observed between the two groups in terms of qualifications: those in receipt of after‐care mainly completed eight elementary grades; those in receipt of after‐care support typically continue their studies in vocational schools and vocational secondary schools. There are many (40%) unemployed amongst those receiving after‐care. Most of those employed are blue collar workers. As opposed to this, unemployment is around 15% amongst those receiving after‐care support. Since the very majority of studies require full‐time studentship, the proportion of employed is low amongst those living in after‐care support. The high drop‐out rate from school attendance

FROM CHILD PROTECTION TO HIGHER EDUCATION.
161
constitutes another major issue. In the case of young adults in receipt of after‐care support, 70% have not given up any commenced studies, while there was an uncompleted school study for 64% of those in receipt of after‐care. The 2008 research by the Capital Regional Child‐Protection Agency, concerning the issue of education, should be mentioned. This study sought to map the situation of young people living in after‐care provision with foster parents belonging to the Capital Regional Child‐Protection Agency and leaving from this care due to their age or other reasons during the previous ten years. The proportion of those having a certificate of graduation from secondary education is relatively high (44%) among young people raised by foster parents; 34% of them have a trade, and 17% completed elementary studies only. Only 5% of them have a degree of tertiary education. Two‐thirds of those employed work within the field which they studied (Zsoldos, 2008).
International research
Numerous international studies draw attention to the social exclusion of people raised within public child care and their failure to overcome their childhood disadvantages. On the labour market, and for social integration in general, the greatest obstacles for these young people stems from their interrupted educational career. Leaving school many times is a consequence of being placed into a new home; the series of school changes, along with the subsequent integration into new communities makes their situation more difficult, and damages the ability of children to make social connections. Therefore, upon receiving a new foster parent, it is quite often not possible to find a suitable school for them straight away.
According to Sallnäs (apud. Höjer et al., 2008: 40), in Sweden it is problematic that workers in institutions offering nursing and care consider the application of therapeutic methods to be highly important and place less emphasis on school careers. An analysis of the professional reports of institutions showed only 19% identified pursuing school career and obtaining the appropriate qualification as being most important. Children raised in the foster parent system are in a better situation in Sweden too; the importance of education is more emphasized in foster families. Höjer (apud. Höjer et al., 2008: 44) conducted group interviews with Swedish parents whose children live in foster care. According to these parents, they would like to know about the school performance of their children and they wish to participate in various school activities; they would like to be part of their child’s school life. In Denmark, a professional development plan has been established, aiming to raise the quality of work done by professionals active in the child protection system. This professional concept considers school as a development platform where children might be enabled to overcome their traumatic childhood experiences. It is typical in Denmark

ANDREA RÁCZ
162
that internal schools operate within boarding institutions where teachers primarily seek to develop social rather than scholarly competences. However, the integration into regular schools is difficult from these schools. Danish professionals consider that children leaving from public child care are in need of further support, mainly in the fields of studying and work (Bryderup, 2008). According to the 2003 estimates of the Social Exclusion Unit, children brought up in care in the United Kingdom face a ten times higher risk of dropping out of school than their school mates who are raised in families (Höjer et al., 2008: 39). In the framework of a research carried out by the Rainer Foundation in 2008 titled “What Makes the difference?”, 250 young people living in public child care were interviewed on how much the care given by the state was perceived as parental care. According to these interviews, the experiences of those in care are quite far from the aims of the state. Young people raised in institutions mostly wish to be loved and those living with foster parents wish to be able to feel like family members. Of those who had felt personal support, 67% continued their studies after the age of 16 (Höjer et al., 2008: 41). According to Jackson (2007) the effects of receiving public child care are unclear: those entering the system as adolescents have the same bad outcomes in the educational field as those taken into care at a younger age. Poor school performance is closely related to the operation of the system, with its uncertainty in placement due to frequent changes in the care locations. The expectations of caretakers are also low, and they generally neglect the issue of study and further education. In addition, the responses given by school staff to questions over child protection are incomplete. According to Baginsky (2000), although most schools have child protection programs, teachers consider that the majority would not notice if a child is abused, and they are uncertain over the issues on which they should consult professionals, despite the fact that most teachers have participated in some kind of child protection training. According to a research project from 2005, which examined the social integration of young people leaving the public child care, the majority of those with low qualifications and interrupted studies considered that, while in care, they did not receive sufficient opportunities to continue their studies and adequate support was also missing. One of these young persons said that: “… there are no limits in care; basically you could do everything you wanted. As a child I had no sense of responsibility and I stretched the limits as adolescents do” (Barn et al., 2005: 25).
According to the research results, systemic dysfunctionalities (series of changes in care locations and consequently in schools and age groups, low priority given to studying and the importance attached to acquisition of a proper qualification, a lack of personal care and motivation for the child, and exclusion of biological parents from the care process and school life) result in outcomes where young adults are unable to overcome either smaller or more

FROM CHILD PROTECTION TO HIGHER EDUCATION.
163
significant problems in their lives. Motivation in the field of studies is vital in order to increase employment opportunities and to prevent their being unemployed and their engagement in low‐status and underpaid jobs.
We have limited information about those young people in and from public child care who study in higher education. The proportion of children in care who obtain a higher education diploma is also low in the United Kingdom: their proportion can be put around 3‐5%, according to domestic estimates (Jackson, 2007; Rácz et al., 2009). Those young adults who had stable placement (i.e. few changes in care locations), and who also had care workers supporting and motivating them, had better school achievement. Young people who were successful in education also conferred greater importance for their parents (Höier et. Al., 2008).
Factors determining participation in higher education
Numerous factors may influence the continuation of studies beyond the compulsory basic education. Cieslik (2006) groups the factors influencing the student’s self‐image and identity at reaching eighteen years into three categories. Firstly, he mentions the so‐called structural factors, such as insecurity factors appearing on the labour market that may encourage individuals to seek new opportunities to acquire the knowledge that will enable them to find a place on the labour market. He highlights the so‐called social factors, meaning inter‐personal and family relations, i.e. the supportive environment surrounding the individual. The so‐called individual factors, such as an interest in new topics, personal motivation, aspirations, the desire to establish daily routines (the school to establish a daily routine for children) are classified as belonging to the third group.
Burke (2007) examined the factors influencing the participation of young men in higher education. His interviewees stressed that reaching a higher social‐status constitutes an important motivating force, in the same way as the sensation of being a student is better than identifying oneself as a worker. They also explained their participation in higher education by the fact that it makes them (better) men and enables them to find intellectual work as opposed to physical work and offers a more comfortable life. Young men also stressed that the acquisition of a higher‐level degree is an attractive prospect for them, in terms of laying the foundation for their future: equipped with a degree they will be able to find a better‐paying job and allow them to lay the foundations for their future family.
The Yippee international project has tried to map and analyze the factors that facilitate the increase of the attendance rate of young people with public care background in further and higher education. “Success” could be

ANDREA RÁCZ
164
operationalized as the ratio of young people studying in further and higher education. But “success” is described differently by different agents of the child protection system, in the different partner countries. In Spain and Hungary, institutions and services view on “success” is that young people should be autonomous and self‐reliant in their lives. Teachers think “success” is when young people have completed compulsory school without repetition. In the United Kingdom, Denmark, and Sweden, “success” meant to enter further or higher education. In Spain and Hungary, young people’s view on “success” is that they achieve their goals and dreams. Although the political, legal, and organizational contexts are different in the partner countries, social dynamics are similar enough to enable the naming of common factors which can lead young people in public child care to increase their participation in further and higher education. We can talk about facilitators and opportunities which can help young people to be successful on different levels, such as the level of the individual, the level of the family, the level of the system – the system here is thought of as including education and child protection – and the level of policy. On the level of the individual, high expectations, self‐esteem and realistic view of the future are very important. On the level of the family, showing a good personal example and respect for school can help to increase young people’s participation in further and higher education. On the level of the school, preventing drop out, focus on developing basic social competences and practical education, or offering special programs at the upper‐secondary level, are essential. On the child protection level, financial support, a good management of the process of leaving from public child care, stable care workers who provide positive reference for the child and clear protocols for professional action could facilitate the entrance and success in further and higher education. On the policy level, more focus on schooling and education, clear policies for financial and practical support could help young people in and from public child care to be successful in their lives (Casas and Montserrat, 2010).
Factors facilitating participation in higher education, according to the young people
In the Yippee International Project (2009) before the qualitative phase, a survey was conducted among 19‐21 years old young people, who spent at least one year in the public child care system and were in care at the age of 16. In Hungary, we selected four out of the twenty Child Protection Agencies in different areas of the country and succeeded to reach at 132 young people who met our selection criteria. The final selection of the 35 young people to be interviewed was based on the potential highest qualification. For us it means the young person completed compulsory school and started on further and

FROM CHILD PROTECTION TO HIGHER EDUCATION.
165
higher education (systematic approach) and is motivated to study (individual approach). It is very important to note that our research sample is not representative for the entire population of young persons in public child care, because we could not obtain official statistics on the educational participation of young people in public child care.
Three quarters of the interviewees were female. In terms of their ethnic origin four young adults considered themselves to be Roma. Their average age is 19.6 years old. 15 young adults were raised by foster parents and 20 in institutional provision. Among the interviewees, 10 participate in higher education, 8 in secondary education, 11 in training providing a craft, 1 in training providing both a craft and a secondary school graduation certificate, and 5 take part in training providing a vocational qualification outside of the school system.
Because of the small number of young persons with public care background who continue their studies in higher education, we do not have quality information about their motivation, goals and potential difficulties. In the following paragraphs I will examine the factors that contributed to the participation of young adults with a public care background in higher education. As such, 10 out of the 35 interviewees study in colleges or universities. Some 6 of them are female and 4 are male, and 6 out of 10 young people were raised by foster parents before reaching the age of eighteen. When examining the factors facilitating participation in higher education I will use, in addition to the interviews made with the young people participating in higher education, the interviews made with child protection professionals and the staff members of the Regional Child Protection Agencies.
Endogenous factors
On the basis of the analysis of the interviews made with young adults, the factors that proved to be important in terms of continuation of higher studies by the respondents can be classified into two groups. The first group of factors are the so‐called endogenous factors such as persistence, willpower, a desire to move on and a commitment to a secure future. In my opinion, within the meaning of Cieslik (2006), endogenous factors cover the range of individual factors. The school career of young people in higher education can be considered to be balanced. Following the acquisition of their secondary school graduation‐certificate, all of them were positive about continuing their studies and they were supported in this by their foster parents and their teachers. Their decisions concerning career choices were made by themselves and they were typically reported as rational decisions. Young adults considered important, in the context of their career choice, to choose a marketable craft that, in addition to

ANDREA RÁCZ
166
providing an acceptable standard of living, would match with their areas of interest and suit their personalities. Their consideration of the labour market position is shown by the interview excerpt below: “… I looked around the market to find out what is available and I found this hospitality thing that I thought I was interested in – people will always travel and eat, I will always have a job, so it happened like this” (Sz.E. 21 years old, woman, 09/2008). Using Cieslik’s classification (2006), one can establish that individual factors are influenced by structural factors. Young people consider completely natural to make independent decisions and to assume individual responsibility; however they are aware of the surrounding supportive environment where, when considering certain decision‐making situations, they can rely on the professionals working in the child‐protection system, and on their friends and partners. Thus, in Cieslik’s approach, the so‐called social factors also have a strong influence. Choice – even for a decision deemed to be unfavourable later on – is considered to be important. They benefit from decisions containing negative outcome alternatives; the eventual failures and their successful processing strengthen their confidence and their plans for the future, and encourage them to re‐consider, in the light of target and asset values, the solution needed in order to implement their plans. Independent decision‐making, risk‐taking and experimentation in new areas were basic expectations and projected values in the place of their upbringing: “… she (the foster parent) kept saying to me that I have to be independent and that I have to do everything myself. And she always let me make my own decisions, and though I might have made bad decisions, I don’t care. I don’t care since I always finished everything and that was good, at least for the sake of gaining some experience. And so at least I know what I want” (Gy.M. 21 years old, man, 11/2008). Young people themselves realize that they must gain knowledge even before they reached the age of adulthood. Young people clearly believe that their studies lay the foundation for their professional future. Their objective is not only to obtain a higher level of qualification, but they also place great emphasis on their school performance, some planning to learn one more craft following the completion of their current studies. Young people lay the emphasis primarily on their professional development and they consider the acquisition of a suitable qualification important also in the light of ensuring their financial wellbeing. All of them work, either full‐time or on a temporary basis, parallel to their studies (mostly during the summer holidays). They spend their spare time either with their extensive circle of friends or they learn languages. They consider learning languages to be vital for their professional development and for the implementation of their future plans. They generally consider the accountability of their life path as important; persistence, commitment and confidence are seen as the most important attributes necessary for reaching their
FROM CHILD PROTECTION TO HIGHER EDUCATION.
167
individual objectives. Their orientation towards the future is well illustrated in the following statement: “And a secure future is important because, in my opinion, you characterise a person on whether he lives from one day to the other or he knows what he will be doing in two years time, at least roughly” (C.F. 21 years old man, 09/2008).
Exogenous factors
The other category of factors influencing participation in higher education is the set of exogenous factors. The stable place of public care, i.e. the lack of wandering across various institutional settings, proved to be an important factor for increasing the probability of participation in college and university level training. The stability of accommodation largely contributed to the fact that the place of upbringing and the professionals were able to provide emotional security, motivation and support. A good feeling at school, a good relationship between the young adults and their teachers, having close friends throughout their elementary and secondary studies, participation in talent programs, and the assistance provided by a mentor could also be regarded as exogenous factors facilitating the continuation of education. Professionals placed great emphasis on monitoring the school career and on providing help in career choices and they provided the financial background necessary to commence and continue higher level studies. A positive example, shown via the school career of somebody from the immediate environment of the young adult (siblings, classmates, friends etc.) had also a positive influence on engagement in further studies, as were potential help offered by these persons for studies, but also in the orientation between institutions of higher education and in dealing with the necessary school related matters. One of them highlighted the role of the immediate supporting environment through a sibling: “… yet I saw an example, from my older brother, on how it goes. And on such occasions I ask for and have asked advice from him (…) he helped a lot at the beginning, to start” (R.É. 20 years old, woman, 10/2008). Young people had typically positive experiences with child‐protection professionals. For those raised by foster parents, the foster family continues to provide a strong emotional background; even after reaching adulthood, they consider their foster parents as models and they consider the family they grew up in as a model when founding their own family. The importance of emotional support and motivation is illustrated by the following interview excerpt: “… my Mum (the foster mother) helped an awful lot in reaching my objectives. Not exactly in financial support, but through encouragement, for example” (M.L. 21 years old, man, 11/2008).

ANDREA RÁCZ
168
According to those raised in children’s homes, mainly objective and material conditions have been provided for their studies. “The school I attend, I have to pay a fee. The fee is 350 thousand Forint a year but it is paid for me. So, I have always got all the support (…). If I wanted to do sports, it was paid. They just wanted to see, yes, that I continue and do not quit.” (R.É., 20 years old, woman, 10/2008). At the same time, it is not possible to provide a fully‐personalized upbringing in each case, since accommodation in small groups, intimate study space, personal care and emotional security are not ensured. The attitude of child protection professionals towards school is considered to be supportive by young people; many interviewees stressed the importance of the fact that studying and the principle of studying for their own good constitute basic values. By giving priority to studies, the foster family and the residential home confirmed to the young people that good performance at school is a condition for moving forward. The acquisition of knowledge and competences appears as an expectation vis‐à‐vis themselves that was considered important even before reaching the age of adulthood. Young people clearly believe that their studies lay the foundation for their professional future, and their objective is not only to obtain a higher level qualification, but they also place great emphasis on their school performance. Some of them plan to learn one more crafts following the completion of their current studies. They do not consider to face prejudice at school because of their background in public child care, something which was mainly due to their school performance and the relationship established with their teachers and school mates. They believe that, despite their care background, they do not give rise to any condemnation or discrimination. They do not expect any favourable treatment as a result of their situation. They believe that, they should be judged according to the same principles, on the basis of their performance, and to get the same treatment as their classmates living in families. The factors influencing participation in higher education according to the young people are summarized in Table 1.
Table 1. Factors influencing participation in higher education
Endogenous factors Exogenous factors
• Persistence, willpower • Desire to break out • Commitment • Knowledge as a value • Good school performance • Childhood plans and dreams
• Stable place of upbringing • Emotional support and motivation by
the professionals • Good school atmosphere, good relations
with teachers and school mates • Support for studies

FROM CHILD PROTECTION TO HIGHER EDUCATION.
169
• Determination • Commitment towards laying the
foundations for a secure future • Taking on decision making • Progressive individualisation • Consciousness (conscious career
choice) • Considering labour‐market
opportunities • Orientation to the future
• Talent support • Monitoring the school career • Help in career choice from professionals • Financial support • A supportive person in the immediate
surrounding
Source: Author’s composition. At the same time, they stated that the child‐protection system sets narrow boundaries, and although they have little personal experience, they cannot and do not want to accept the general child‐protection mentality. “I don’t know, maybe boundaries are not as extended for those under state care. That is, the boundaries of how far you can reach and what dreams you can have. Meaning: OK, I will have a vocational school qualification, maybe a secondary school leaving‐certificate and that’s all. I have much greater objectives that this” (R.É. 20 years old, woman, 10/2008).
Facilitation of higher education participation at system level – views of professionals and decision makers
In Hungary, professionals basically consider preparation for independent life as being highly important, and that young adults gradually gains competence in dealing with their own problems, learning to take care of themselves and becoming able to budget and make independent use of their income or benefits. Many of them stressed that treating the care‐subjects as an adult is of basic importance, together with support for their decisions, including the decision to pursue further studies beyond the age of compulsory schooling and support for participation in higher level education. In their opinion, realistic goals must be set, in line with the abilities and areas of interest of the child concerned. “There are remote objectives set to a child and goals that are within his/her opportunities and capabilities that are reachable by him/her. Because it is obvious that we will not chase a child with less ability to attend college. We would rather find a suitable trade for them” ‐ said a director of a children’s home (L.M. 40‐45 years old, woman, 10/2008).

ANDREA RÁCZ
170
They stressed the importance of financial support in studying, e.g. taking a role in financing of language lessons and participation in preparatory courses, and placing emphasis on the importance of studying. One of the professional foster parents highlighted the importance of setting a personal example: “Among other things it is important that I enrolled at a college in that time (…) I was inspired by the fact that they can see me many times revising at night and in the early morning and so on. (…) And then they also said that: look, if my mother ‐ whatever – did not get a grade two, it is not nice for me to come home with a two. So there was this playful competition running between us” (T.V. 40‐45 years old, woman, 09/2008). In the majority of cases, the narrow child‐protection boundaries are present in the minds of the child‐protection professionals. They prefer boys to learn a craft, while for girls the desired qualification is a general secondary school graduation‐certificate. However, the crafts they learn are not competitive, especially in case of girls. The following excerpt from an interview made with a after care worker shows an example of gender‐based expectations: “… so this principle works within the home, to have at least one craft, really. It is really like this for boys, to have at least one craft” (H.A., 40‐45 years old, woman, 10/2008).
The interviewed social workers and other staff members of the Regional Child‐Protection Agency also drew attention to numerous problems. According to them, the biggest problem is that schools do not have the necessary means to look after children living within the child‐protection system. Many believe that there is a significant difference between foster care and institutional care. Those living in foster care are more motivated, since personalized upbringing and attention are very effective; foster parents provide an inspirational environment and they also provide a stronger role model, for example, via the school performance of the foster parents' own children. That is, professionals urge the strengthening of the basic education system and, in this context, the better preparation of teachers, which suggests a change of attitude. They also criticized the education system, suggesting more development of basic competences and putting more emphasis on practical education over lexical knowledge. In addition, they emphasized the importance of psychosocial support for children, both at school and within the child‐protection system. In relation to this, it is important to have fewer children per professional in the residential homes, so that personal care may be assured again. They also emphasized the importance of affirmative action in the education system, and of financial support for further studies. In their opinion, more scholarship programs and opportunities for obtaining resources via competitions are needed. Many drew attention to the fact that the professions learned are not competitive. It was established that more professionals are needed within the child‐protection system, such as developmental teachers and psychologists, and that children need successful examples which serve as

FROM CHILD PROTECTION TO HIGHER EDUCATION.
171
role models. This could be achieved, for instance, through organizing events and celebrations together with young adults formerly in public child care, who successfully integrated into society. Children might become acquainted thus with the positive example of those having left the system. The interviewees highlighted that knowledge ought to be a value in the society. Conclusions
In the European Union’s strategies and policy papers we could see that the European Community has numerous provisions targeting young people, their education and the widening of their labour market opportunities. However, the difficulties of young people living in and leaving from public child care are not explicitly acknowledged and therefore they do not constitute a specific target group for public policies. Among young people raised in public child care, as compared with those raised in families, there is an increased risk of abandoning their studies after graduating compulsory education. According to Petrie and Simon (apud. Casas and Montserrat, 2010: 101) in the EU countries young men and women from a public care background are over‐represented on virtually every dimension of disadvantage, including poverty, housing, unemployment, criminal activity and teenage pregnancy. It means that young people who received public care face a higher risk of social exclusion.
It is difficult to judge which are the most efficient means to ensure the continuation of education and school success in the case of children and young adults in public child care. Only a few of them manage to get higher education diploma.
This study tried to reveal the most important factors affecting the educational career of children and young adults in public child care by analyzing the life‐paths of these young persons, their views on their studies as well as on the quality of public provisions they have received, as well as by interviewing professionals and the staff of the Regional Child Protection Agencies responsible for the upbringing of the young adults in public care. At the level of the individual, the influencing factors can be classified basically into two groups: endogenous and exogenous factors. The attitude and education method of the child protection actors (foster parents, those working within the child protection system), and their assistance in gaining access to support play key roles in a successful school career. School experience and cooperation with in‐school actors (teachers, students) are also of high importance. However, according to young adults, due to the narrow boundaries within the child protection system, the most important factors leading them to pursue a higher education are inner motivation, the importance of studying, their love of studying, their plans, the accomplishment of childhood dreams, the desire for successful social integration and the creation a secure future.

ANDREA RÁCZ
172
In Hungary, changes are certainly needed in order to help young people raised in public child care to overcome the barriers of continuing their studies beyond compulsory school. In the child protection system, it would be very important to offer psychosocial and financial support, and to provide successful role models. In the educational system, positive discrimination and mentor programs could help young people in public child care to increase their participation in further and higher education. At the political level, integrated legal and administrative frameworks for action, and clear policies for financial help and practical support are needed.
In summary, in public child care, despite the fact that the children and young people themselves consider studying to be an important factor in laying the foundations for their future. Basically three key factors can be highlighted at a systemic level as having a significant influence on the school performance of children with child‐protection background and on the level of their further studies beyond the compulsory schooling age. 1) Expectations: In cases where child protection professionals set high expectations, children and young people achieve better school performance and have more opportunities to continue their studies beyond the age of compulsory schooling. The commitment shown by a child protection professional, teacher, a mentor, or another person who is important for the child who is able to provide the encouragement needed for them to continue the studies. 2) Stability of the placement: Numerous studies have drawn a parallel between the stability of the placement and good school performance. Children and young people who are not forced to move constantly obtain better results at school. On the other hand, children with a high number of transitions from one place to another, which is typically associated with an unavoidable change of their educational institution, have lower chances of obtaining good results at school. 3) Access to financial support: In the case of young people raised outside of families, their financial situation can also restrict the opportunities of obtaining a higher qualification, since studies place a heavy financial burden on their shoulders. Residential homes and foster families are often unable to afford to contribute at funding education, as it can hardly pay for basic school equipment and other school‐related expenses (school books, travel costs, dormitory accommodation) (Höjer et. al, 2008; Rácz et al., 2009).
REFERENCES
A Magyar Köztársaság Kormánya ‐ Társadalmi Megújulás Operatív Program 2007‐2013 (2007). Budapest [Hungarian Government: Social Renewal Operational Programme] www.nfu.hu/download/2736/tamop_adopted_hu.pdf (10/Marc/2008).
Baginsky, M. (2000). Child protection and education Summary of research and findings. The Online Child Protection Resource, NSPCC Inform, December 2000
http://www.nspcc.org.uk/inform (10/Dec/2008).

FROM CHILD PROTECTION TO HIGHER EDUCATION.
173
Barn, R., Andrew, L. and Mantovani, N. (2005). Life after care The experiences of young people from different ethnic groups. York: Joseph Rowntree Foundation.
Burke, P.J. (2007). Men accessing education: masculinities, identifications and widening participation. British Journal of Sociology of Education, 28 (4): 411‐424.
Bryderup, I.M. (2008). Literature Review Denmark, Danish School of Education, University of Aarhus, unpublished manuscript available at the Danish School of Education, Aarhus.
Casas, F. and Montserrat, C. (2010). Young People from a Public Care Background: establishing a Baseline of Attainment and Progression beyond Compulsory Schooling in Five EU countries.
http://tcru.ioe.ac.uk/yippee/Portals/1/YiPPEE%20WP34%20FINAL%2026%2003%2010%20(3).pdf (01/April/2010).
Cieslik, M. (2006). Reflexivity, learning identities and adult basic skills in the United Kingdom. British Journal Sociology of Education, 27 (2): 237‐250.
Európai Közösségek Bizottsága (2001). Az Európai Bizottság fehér könyve ‐ Új lendület Európa fiataljai számára. Brüsszel [Comission of the European Communities: White Paper – A new impetus for European youth].
http://www.polipifjusag.hu/index.php?action=dokumentumok (03/April/2009). Európai Közösségek Bizottsága (2005). A Bizottság közleménye a Tanácsnak az ifjúságot
érintő európai szakpolitikákról. Napirenden az európai fiatalokat foglalkoztató kérdések: Az Európai ifjúsági paktum végrehajtása és az állampolgári szerepvállalás ösztönzése. Brüsszel [Commission of the European Communities: Addressing the concerns of young people in Europe – implementing the European Youth Pact and promoting active citizenship].
http://ec.europa.eu/youth/archive/whitepaper/post‐launch/com_206_hu.pdf (03/April/2009).
Európai Közösségek Bizottsága (2008). A bizottság közleménye az Európai Parlamentnek, a Tanácsnak, az Európai Gazdasági és Szociális Bizottságnak és a régiók Bizottságának ‐ megújított szociális menetrend: lehetőségek, hozzáférés és szolidaritás a XXI. századi Európában. Brüsszel [Commission of the European Communities: Communication from the Commission to the European Parliament, the Council, the European Economic and Social Committee and the Committee of the regions ‐ Opportunities, access and solidarity: towards a new social vision for 21st century Europe].
www.szmm.gov.hu/download.php?ctag=download&docID=20228 (03/April/2009). Council of Europe (2006): Joint Report on Social Protection and Social Inclusion. Brussels:
The Council of Europe. http://ec.europa.eu/employment_social/spsi/docs/social_inclusion/2006/cs
2006_7294_hu.pdf (14/Feb/2009). Gyarmati, A., Csák, R. and Rácz, A. (2009). Gyermekvédelmi gondoskodásban élők
továbbtanulásának, felsőoktatási részvételének vizsgálata az országos statisztikai adatok tükrében, valamint a Területi Gyermekvédelmi Szakszolgálatok gyermekvédelmi gondoskodásban élők oktatási részvételének, továbbtanulásának elősegítésével kapcsolatos feladataival kapcsolatos kérdőíves felmérés eredményeinek bemutatása. [A comparative investigation of national statistics concerning children within the

ANDREA RÁCZ
174
child‐protection system, with emphasis on the continuation of their studies and their presence within the higher education system, and a presentation of the results of a questionnaire survey concerning those tasks of the Regional Child‐Protection Agencies that facilitate the educational participation and further studies of children within the child‐protection system], Budapest: Szociálpolitikai és Munkaügyi Intézet, unpublished manuscript available at Szociálpolitikai és Munkaügyi Intézet, Budapest.
Gyermekvédelmi statisztikai Tájékoztató 2006. [Child Protection Statistical Guide 2006] Budapest, SZMM‐SZMI.
„… Hogy általuk legyen jobb!” Nemzeti Ifjúsági Stratégiáról szóló Országgyűlési határozat 2009‐2024 (2009). [„So they can make it better!”], Parliament Resolution on National Youth Strategy, Budapest.
http://szmm.gov.hu/main.php?folderID=16512&articleID=41878&ctag=articlelist&iid=1, (01/Feb/2010).
Höjer, I., Johannson, H. and Hill, M. (2008). State of the Art Consolidated Literature Review ‐ The Educational Pathways of Young People from a Public Care Background in Five EU countries.
http://tcru.ioe.ac.uk/yippee/Portals/1/State%20of%20the%20art%20review%20of%20educational%20pathways%20in%20Europe%20FINAL%2011.12.08.pdf (10/Apr/2010)
Jackson, S. (2007). Care leavers, exclusion and access to higher education. In D. Abrams, J. Christian and D. Gordon (eds.): Multidisciplinary Handbook of Social Exclusion Research. Chichester UK, pp.115‐135.
„Legyen jobb a gyerekeknek!” Nemzeti Stratégiáról szóló Országgyűlési határozat 2007‐2032 (2007). Budapest („Making Things Better for our Children”, Parliament Resolution on National Strategy).
http://www.biztoskezdet.hu/uploads/attachments/lgyen%20jobb%20nemz%20strat.pdf (18/Marc/2010)
Neményi, M. and Messing, V. (2007). Gyermekvédelem és esélyegyenlőség [Child protection and equalities]. Kapocs, 4 (1): 2‐19.
Rácz, A., Hodosán, R. and Korintus, M. (2009). Dokumentumok, szakirodalmak a gyermekvédelmi rendszerben élő, fiatal felnőttek továbbtanulásáról és felsőoktatási részvételéről [Literature review on access to further and higher education among young people from public care background]. Esély 2009/3: 97‐114.
Szikulai, I. (2006). „Nem szeretném, hogy befejeződjön...” [„I do not want it to be over…”] In A. Rácz (ed.): A magyar gyermekvédelmi rendszer helyzete, jövőbeli kihívásai. Budapest: NCSSZI.
Zsoldos, Á. (2008). A rendszerből kikerülő fiatalok életútjának alakulása (1997‐2007) [Biographies of young people from public care]. Budapest: Fővárosi Területi Gyermekvédelmi Szakszolgálat, unpublished manuscript available at Fővárosi Területi Gyermekvédelmi Szakszolgálat, Budapest).
The Yippee International Project website: http://tcru.ioe.ac.uk/yippee/

STUDIA UNIVERSITATIS BABEŞ‐BOLYAI, SOCIOLOGIA, LV, 1, 2010
EDUCATION AND SCIENTIFIC KNOWLEDGE IN EUROPEAN SOCIETIES. EXPLORING MEASUREMENT ISSUES
IN GENERAL POPULATION SURVEYS
COSIMA RUGHINIŞ* AND ROXANA TOADER**
ABSTRACT. The paper analyzes indicators of scientific knowledge and health knowledge currently available in population surveys and discusses their dimensionality, with particular reference to DK answers. Multiple correspondence analysis is used to identify a satisfactory data reduction strategy, in the Eurobarometer 63.1 2005 and STISOC 2009 surveys. Results support the relevance of an acquiescence response style factor and of a DK response style factor. A bi‐dimensional factor model for the negative indicators, including a substantive knowledge factor and a DK style factor seems to offer the most meaningful utilization of the scientific knowledge items. Keywords: scientific literacy, scientific knowledge, health knowledge, measurement model, response style, multiple correspondence analysis Introduction
The scale of factual knowledge of science has been used in general population surveys for more than 30 years. It has been included in the biennial surveys of the National Science Foundation (NSF) since 1979, and it has also been used in Eurobarometers (such as, more recently, the Eurobarometer 2005 64.1 and Eurobarometer 2002.3). The scale’s items, as phrased in the Eurobarometer 2002.3 and in the STISOC 20091 Romanian survey, are presented in Table 22. In
* Department of Sociology and Social Work, University of Bucharest, e‐mail: [email protected]
** Department of Sociology and Social Work, University of Bucharest, e‐mail: [email protected]
1 The STISOC 2009 survey is part of the research project „Science and Society. Interests and perceptions of the public concerning scientific research and its results” (Ştiință şi societate. Interese şi percepții ale publicului privind cercetarea ştiințifică şi rezultatele cercetării), financed by NASR – National Authority for Scientific Research (ANCS ‐ Autoritatea Națională pentru Cercetare Știintifică), contract no. 203CPII/10.09.2008, principal investigator L. Vlăsceanu, Department of Sociology and Social Work, University of Bucharest.
2 Some items are differently formulated in other surveys. For example, the Eurobarometer 2005 64.1 asks about the mother’s genes while the Eurobarometer 2002.3 asks about the father’s genes in the relation to the sex of the baby. Also, the Romanian language translation differs between the two Eurobarometers. Modified versions of the items are used in other surveys as well – such as the 1993 ISSP Environment Survey analyzed by Hayes and Tariq 2000 (p. 436).

COSIMA RUGHINIŞ AND ROXANA TOADER
176
this paper we discuss alternative measurement models for scientific knowledge3, exploring their dimensionality by multiple correspondence analysis4.
There is a significant body of research that relies on this measurement instrument, in what is generally referred to as the “Public Understanding of Science” research tradition (Bauer et. al. 2007). Factual knowledge of science has been conceptualized as a dimension of the broader concept of scientific literacy (Miller, 1993, 1998). Bauer et. al. (2007) distinguish three main paradigms of research on scientific literacy, starting from the policy concern that the public lacks a basic understanding of scientific concepts, to a reframing of the relationship between scientific institutions and the public, focusing on issues of trust and science communication. In these evolving research frameworks the factual knowledge scale has been used to measure levels of scientific literacy among the general public (Miller and Pardo, 2000), including discussions of differences in literacy at individual (von Roten, 2004) or country level (Eurobarometer, 2005), to estimate trends (Eurobarometer, 2001, 2005; Miller, 2004; Bauer 2009), and to discuss the relationships between knowledge and general attitudes towards science (Durant et. al., 2000, Allum et. al., 2008, Bauer, 2009) at individual or country level.
There is a substantial body of methodological reflection dedicated to the measurement of factual scientific knowledge (Miller and Pardo, 2000, Pardo and Calvo, 2004, Bann and Schwerin, 2004, Allum et. al., 2008). A review of the methodological literature, and of the empirical use of the scale in quantitative models shows that the scale has been used as a uni‐dimensional measure of scientific knowledge or ignorance, after recoding items into dichotomous variables. While there are references to systematic sources of error such as the acquiescence bias (Pardo and Calvo, 2004) the uni‐dimensionality of the knowledge scale has only been empirically tested for the dichotomously recoded items, for example in Miller (2000), and in Bann and Schwerin (2004). Bann and Schwerin investigate in depth the scale properties for a longer and a shorter version of the instrument. The authors observe that an exploratory factor analysis indicates the plausibility of a single‐factor solution or a two‐factor solution, and they conduct further analysis to finally establish that the single factor solution is the most appropriate. 3 Part of this work was carried out at the European Data Laboratory for Comparative Social Research (EUROLAB) ‐ GESIS. Access to the EUROLAB was supported by the European Community under the “Structuring the European Research Area” specific programme Research Infrastructures Action in the 6th Framework Programme.
4 The first author is grateful to Maria Rohlinger for her insightful advice on the general use of multiple correspondence analysis, and hopes that this paper avoids some of the pitfalls she warned about. The authors are also thankful to the two anonymous reviewers for their relevant observations and advice.

EDUCATION AND SCIENTIFIC KNOWLEDGE IN EUROPEAN SOCIETIES.
177
At the same time, the Cronbach’s alpha statistic for measuring the reliability of the scale has been criticized for being relatively low, ranging in between 0.60 and 0.70. For example, the estimates are 0.70 in Bann and Schwerin (2004), 0.66 in Pardo and Calvo (2004), and 0.60 in von Roten (2004).
When knowledge scores are computed, items are generally scored dichotomously, distinguishing between correct answers, on one hand, and incorrect or “don’t know” answers, on the other hand (see for example Bann and Schwerin 2004; Pardo and Calvo 2004; von Roten 2004). In some cases, authors do not explicitly discuss the treatment of “Don’t know” answers (Miller and Pardo, 2000; Mejlgaard and Stares, 2009), but items are consistently analyzed as dichotomous. The issue of DK answers is particularly relevant because of the high proportion of respondents who choose this option. For example, in STISOC 2009 the proportion of Romanian respondents who answered “Don’t know” ranges between 3% and 38% (see Table 2); in Eurobarometer 63.1 2005, proportions of “Don’t know” answers in different country samples range between 3% and 27% for the item on antibiotics, and between 8% and 41% for the item on mother’s genes (see Table 4). Also, in the context of a knowledge scale, these answers are substantially meaningful, as they explicitly indicate lack of knowledge.
A more sophisticated analysis of the factual knowledge items, also coded as binary answers, is discussed in Miller and Pardo (2000), based on an Item Response Theory model. The authors estimate for each item from the discussed scale three parameters: a threshold parameter, indicating the difficulty of the item; a slope parameter, indicating its discriminating power; and a guessing parameter, indicating the probability of a correct answer for a respondent with no substantive knowledge.
From another perspective, Bauer (1996) conducts a detailed investigation of the “Don’t know” answers for the items in the factual knowledge scale, by dichotomizing the items into self‐attributed ignorance (DK answer) and other answers (either correct or incorrect). Respondents’ scores are calculated as the sum of DK answers over all items, and the scale has a surprisingly high Cronbach’s alpha coefficient of 0.82 (Bauer, 1996). The author analyzes the self‐attributed ignorance of science as a relatively stable disposition of the respondent, while acknowledging that:
First, the DK‐response is not a one‐to‐one indicator of ignorance. It may well indicate factors other than ignorance, such as disinterest, irrelevance, exclusion, fear or some other state of affairs. Second, if DK‐responses do indicate ignorance, this ignorance has various meanings. Depending on the context, it may be related t shame, opposition and challenge, irrelevance, division of labour, confidence or refusal, as the other papers in this issue of the journal cogently explore (Bauer, 1996: 46‐47).

COSIMA RUGHINIŞ AND ROXANA TOADER
178
This approach raises several conceptual questions. On one hand, how is the ‘self‐attributed ignorance of science’ related to the ‘low scientific knowledge’ assessed by the correct/incorrect answer dichotomization? More specifically, is there a response style factor involved in differentiating the DK from the incorrect answers, or are they interchangeable indicators for the same latent dimension?
In what follows, we propose a theoretical measurement model that includes two style factors and two substantive factors, and we explore its plausibility by multiple correspondence analysis. In particular, we will discuss the distribution of DK answers in relation to correct and incorrect answers, and possible interpretations.
A measurement model for factual scientific knowledge
The review of measurement literature on knowledge items indicates that respondents’ answers may be understood as indicators for their levels of scientific knowledge, their possible guessing behavior, and their response styles. In addition to acquiescence, defined as a tendency to answer ‘Yes’ or, in this context, “True”, irrespectively of item’s content, a second relevant style factor may involve the disposition towards answering “Don’t know”, instead of guessing, when confronted with uncertainty or lack of knowledge (Mondak and Davis, 2001).
Overall, we may formulate the following guiding statements based on the measurement model presented by Mondak and Davis (2001):
Correct answers = Well‐informed answers + Acquiesced answers + Guessed answers + Other random error
Positive Items
Incorrect answers = Misinformed answers + Guessed answers + Other random error Correct answers = Well‐informed answers + Guessed answers + Other random error
Negative Items
Incorrect answers = Misinformed answers + Acquiesced answers + Guessed answers + Other random error
Guessed answers include a significant component of random error, but they may reflect some degree of substantive scientific knowledge or misconception, of which the respondent may not even be aware. Therefore, the guessed answers may fall more heavily in the “correct” or in the “incorrect” category depending on items’ and respondents’ characteristics.

EDUCATION AND SCIENTIFIC KNOWLEDGE IN EUROPEAN SOCIETIES.
179
A graphical representation of this measurement model is presented in Graph 1 below. The model depicts the four unobserved variables and, for reasons of graphical clarity, only two of the observed items, each with three response options: “True”, “False” and “Don’t know’. The item above is a positive item, insofar the “True” answer is correct, while the item below is a negative item, insofar the “False” answer is incorrect.
In this model, scientific knowledge is an unobserved, respondent specific feature that influences positively (full‐line arrows) the probability of answering correctly a given item, and negatively (dotted arrows) the probability of answering incorrectly or ‘Don’t know’. Acquiescence is the unobserved response style factor, also respondent specific, that influences positively the probability of answering “True” (irrespective of whether this is the correct or incorrect answer) and negatively the probability of “False” or “DK” answers. A third unobserved variable is the respondent specific disposition to answer “Don’t know” when uncertain, instead of volunteering a guessed answer.
The fourth unobserved variable refers to sharing a scientific misconception, versus some sort of “unstructured” ignorance. Scientific misconceptions are of course variables at individual level but they are also item specific since they refer to a certain topic and therefore they may be irrelevant to answers for items concerning other topics. For example, in the case of the item “the Sun goes around the Earth”, it is unlikely that respondents actually believe, with any arguments, that it is true. Incorrect answers reflect errors, some probably due to a misunderstanding of the actual formulation of the item, and respondent’s ad‐hoc response choices when confronted with a question for which they did not have an answer. On the contrary, other items may actually elicit stable answers, scientifically considered as misconceptions. A clear example refers to the evolution vs. creationism debate: a religious worldview may be associated with the belief that “The earliest humans lived at the same time as the dinosaurs” and with the rejection of the assertion that “Human beings, as we know them today, developed from earlier species of animals.” These answers may not reflect just lack of scientific knowledge, but a stable, defended opinion. Also, respondents may actually believe that “Antibiotics kill viruses as well as bacteria”, based on intuitive reasoning supported by stable (although incorrect) behavior patterns of generalized use of antibiotics. Therefore, an incorrect answer may indicate a misconception or it may indicate lack of knowledge, depending on the item, and also depending on the social context in which scientific facts are being communicated and debated. Pardo and Calvo (2004) discuss precisely such cultural variation in items related to evolution and to radioactivity, as indication that “some population segments might be influenced in their appropriation of a scientific proposition by values or beliefs in their society’s culture” (p. 209).

COSIMA RUGHINIŞ AND ROXANA TOADER
180
The unobserved factors may be correlated: for example, the level of scientific knowledge may be associated with sharing a specific scientific misconception. Also, some other variables, such as the level of education or age may be associated with scientific knowledge and response style factors at the same time, thus generating covariance. It is to be expected that the level of school education is positively associated with the level of scientific knowledge, as schools are one of the main social settings for discussing scientific findings.
Graph 1. A measurement model for scientific knowledge, including unobserved variables and two observed items: a positive item (above) and a negative item
(below). Random errors and correlations among factors are not depicted for clarity reasons.
Such a measurement model with four unobserved factors measured by
nominal‐level indicators is difficult to estimate statistically. In what follows, we shall explore its plausibility by using multiple correspondence analysis. The purpose of the investigation is to clarify the meaning of “scientific knowledge”, as measured by the factual scientific knowledge items and scales, and to discuss the frequent approximations used in quantitative models. It may well be that such approximations are cost‐effective means of measurement; still, a discussion of their assumptions and possible consequences is useful for a better interpretation of empirical results.
True/Correct
False / Incorrect
DK
False/Correct
True / Incorrect
DK
Scientific Knowledge (respondent
specific)
Scientific misconception
(item and respondent
specific)
Disposition to answer DK
when uncertain (respondent
specific)
Acquiescence (respondent
specific)

EDUCATION AND SCIENTIFIC KNOWLEDGE IN EUROPEAN SOCIETIES.
181
Methodology
Our data include the Eurobarometer 2005 63.15 and a recent survey on scientific knowledge and attitudes towards science in Romania, STISOC 2009. We have analyzed the scientific knowledge items in relation to education, which is measured as educational level in STISOC 2009 and as categories of graduation age, in the Eurobarometer.
STISOC 2009 also includes a special scale for health literacy (see items in Table 3), which we have also analyzed for comparative purposes.We have chosen multiple correspondence analysis because it is useful in highlighting dimensionality of nominal variables, and in exploring the response patterns by mapping them in a lower dimensional space. Similar analyses are presented in Didow, Perreault and Williamson (1983), Thiessen and Blasius (1998), and Greenacre (2007).
We use the SPSS 16.0 Optimal Scaling procedure. For each model we have first estimated a model with 5 or more dimensions, depending on the number of items, in order to see their relative contribution, and we have then plotted the joint categories in a two‐dimensional chart, including other supplementary variables of interest, such as education, perceived respondent interest in the survey, or the survey country.
Research results
Measuring scientific literacy in Europe
The measurement model in Graph 2 indicates that scientific knowledge items may be dichotomized in three ways and then assembled in scales with a different significance. When items are coded as correct vs. incorrect or DK, the result is the scale of scientific knowledge, as it is used in current literature. When we recode items as DK answers vs. correct or incorrect answers, we obtain a scale for “self‐attributed scientific ignorance”, as used in Bauer (1996). Last, but not least, when we recode all positive and negative items as “True” vs. “False” or DK answers, the result is a scale for acquiescence response style. Of course, each of these scales incorporates the influences of the other factors, which represent systematic sources of error.
In Table 1 below we have computed Cornbach’s alpha coefficients for each version of the scale, in 24 country samples from the Eurobarometer 63.1 2005. The acquiescence scale has the lowest coefficients. An interesting observation, in line with Bauer’s estimate (1996), is that the self‐attributed ignorance scale generally has higher Cronbach reliability coefficients than the usual scientific knowledge scale. 5 Available online on the ZACAT ‐ GESIS data portal at: http://zacat.gesis.org/webview/index.jsp
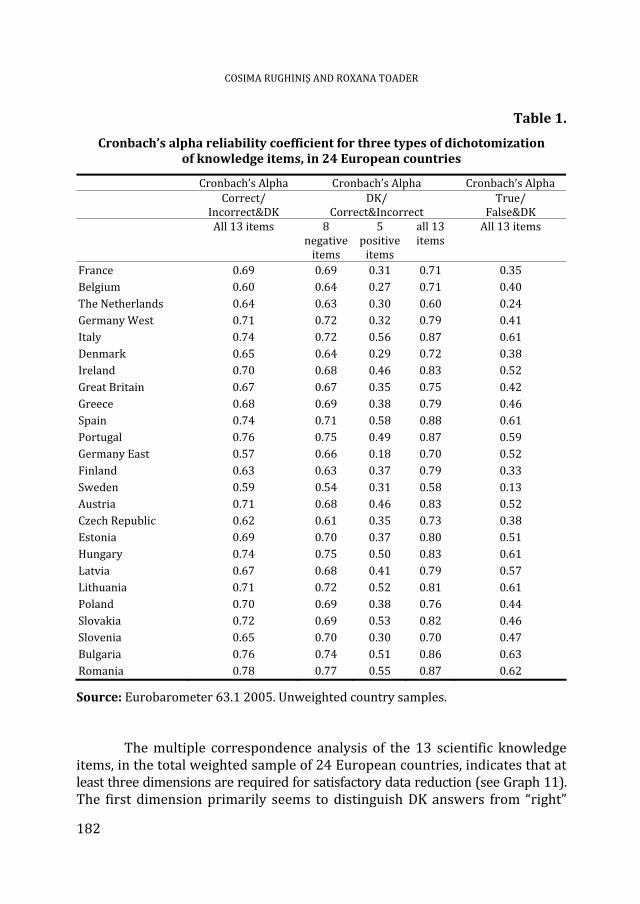
COSIMA RUGHINIŞ AND ROXANA TOADER
182
Table 1.
Cronbach’s alpha reliability coefficient for three types of dichotomization of knowledge items, in 24 European countries
Cronbach’s Alpha Cronbach’s Alpha Cronbach’s Alpha Correct/
Incorrect&DK DK/
Correct&Incorrect True/
False&DK All 13 items 8
negative items
5 positive items
all 13 items
All 13 items
France 0.69 0.69 0.31 0.71 0.35 Belgium 0.60 0.64 0.27 0.71 0.40 The Netherlands 0.64 0.63 0.30 0.60 0.24 Germany West 0.71 0.72 0.32 0.79 0.41 Italy 0.74 0.72 0.56 0.87 0.61 Denmark 0.65 0.64 0.29 0.72 0.38 Ireland 0.70 0.68 0.46 0.83 0.52 Great Britain 0.67 0.67 0.35 0.75 0.42 Greece 0.68 0.69 0.38 0.79 0.46 Spain 0.74 0.71 0.58 0.88 0.61 Portugal 0.76 0.75 0.49 0.87 0.59 Germany East 0.57 0.66 0.18 0.70 0.52 Finland 0.63 0.63 0.37 0.79 0.33 Sweden 0.59 0.54 0.31 0.58 0.13 Austria 0.71 0.68 0.46 0.83 0.52 Czech Republic 0.62 0.61 0.35 0.73 0.38 Estonia 0.69 0.70 0.37 0.80 0.51 Hungary 0.74 0.75 0.50 0.83 0.61 Latvia 0.67 0.68 0.41 0.79 0.57 Lithuania 0.71 0.72 0.52 0.81 0.61 Poland 0.70 0.69 0.38 0.76 0.44 Slovakia 0.72 0.69 0.53 0.82 0.46 Slovenia 0.65 0.70 0.30 0.70 0.47 Bulgaria 0.76 0.74 0.51 0.86 0.63 Romania 0.78 0.77 0.55 0.87 0.62
Source: Eurobarometer 63.1 2005. Unweighted country samples. The multiple correspondence analysis of the 13 scientific knowledge
items, in the total weighted sample of 24 European countries, indicates that at least three dimensions are required for satisfactory data reduction (see Graph 11). The first dimension primarily seems to distinguish DK answers from “right”
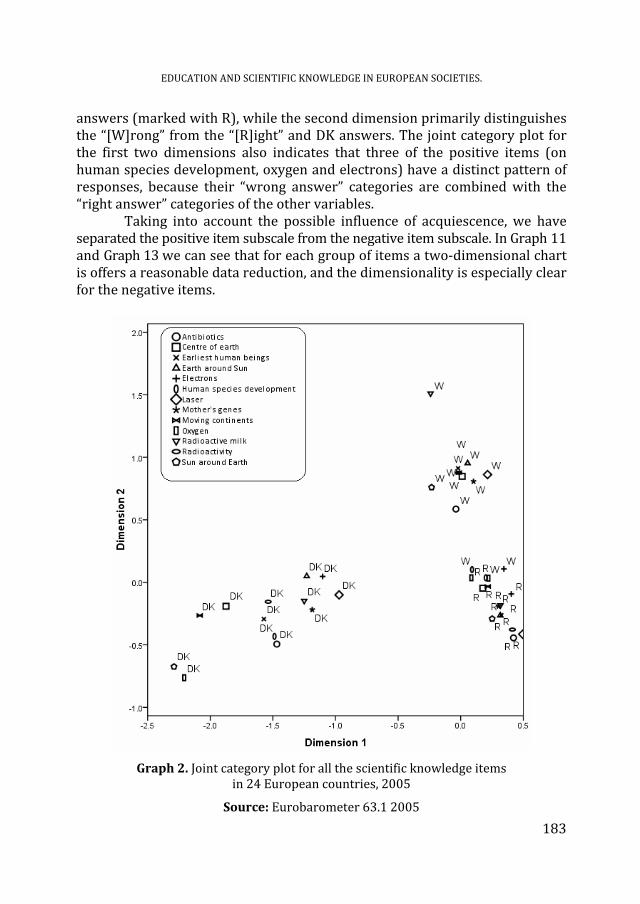
EDUCATION AND SCIENTIFIC KNOWLEDGE IN EUROPEAN SOCIETIES.
183
answers (marked with R), while the second dimension primarily distinguishes the “[W]rong” from the “[R]ight” and DK answers. The joint category plot for the first two dimensions also indicates that three of the positive items (on human species development, oxygen and electrons) have a distinct pattern of responses, because their “wrong answer” categories are combined with the “right answer” categories of the other variables.
Taking into account the possible influence of acquiescence, we have separated the positive item subscale from the negative item subscale. In Graph 11 and Graph 13 we can see that for each group of items a two‐dimensional chart is offers a reasonable data reduction, and the dimensionality is especially clear for the negative items.
Graph 2. Joint category plot for all the scientific knowledge items
in 24 European countries, 2005
Source: Eurobarometer 63.1 2005
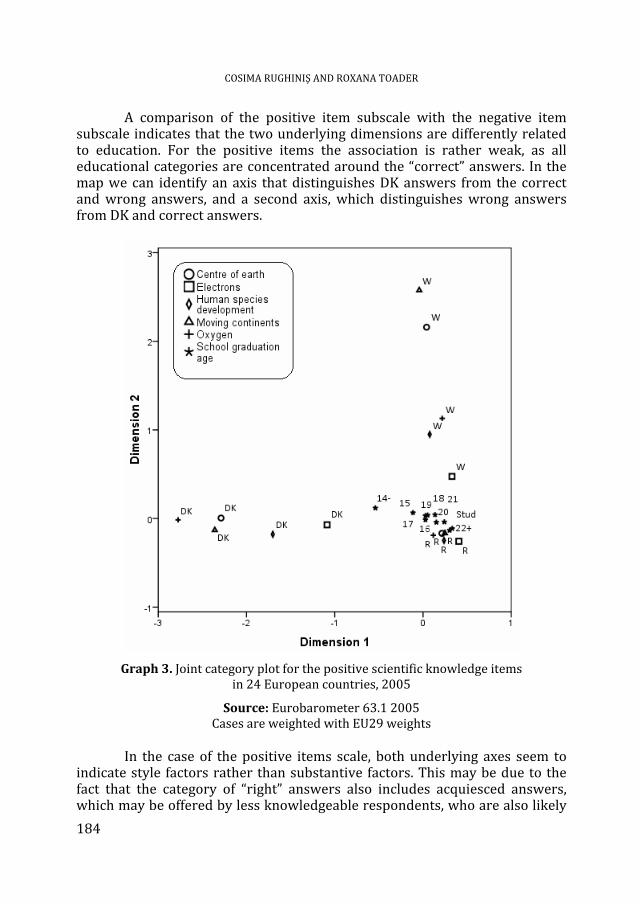
COSIMA RUGHINIŞ AND ROXANA TOADER
184
A comparison of the positive item subscale with the negative item subscale indicates that the two underlying dimensions are differently related to education. For the positive items the association is rather weak, as all educational categories are concentrated around the “correct” answers. In the map we can identify an axis that distinguishes DK answers from the correct and wrong answers, and a second axis, which distinguishes wrong answers from DK and correct answers.
Graph 3. Joint category plot for the positive scientific knowledge items
in 24 European countries, 2005
Source: Eurobarometer 63.1 2005 Cases are weighted with EU29 weights
In the case of the positive items scale, both underlying axes seem to
indicate style factors rather than substantive factors. This may be due to the fact that the category of “right” answers also includes acquiesced answers, which may be offered by less knowledgeable respondents, who are also likely

EDUCATION AND SCIENTIFIC KNOWLEDGE IN EUROPEAN SOCIETIES.
185
to offer DK or wrong answers to other items. This mixture of style and content in the meaning of “right” answers may also account for the low Cronbach’s alpha coefficients for the subscale of 5 positive items.
In the map for the negative items, we can draw an axis that distinguishes right from wrong and DK answers, and a second axis which differentiates respondents who prefer DK answers, from those who answer either right or wrong. The first would indicate the substantive scientific knowledge, while the second would indicate a DK response style.
Graph 4. Joint category plot for the negative scientific knowledge items
in 24 European countries, 2005
Source: Eurobarometer 63.1 2005 Cases are weighted with EU29 weights
Graph 5 plots the country profiles in the map of the negative knowledge
items scale. Four items are also plotted in order to indicate relative positions. Countries differ in their knowledge rates and in their average DK style. For

COSIMA RUGHINIŞ AND ROXANA TOADER
186
example, respondents from Romania, Bulgaria and Poland are more likely to offer DK answers than the others, while respondents from Netherlands, Finland and Sweden seem the most likely to offer correct answers.
Graph 5. Joint category plot for country and selected negative scientific
knowledge items in 24 European countries, 2005
Source: Eurobarometer 63.1 2005 Cases are weighted with EU29 weights.
Measuring scientific literacy in presentday Romania
Results in the Romanian sample of STISOC 2009 survey are similar with results from the Eurobarometer sample. The Cronbach’s alpha reliability coefficient for the 13‐item scale, with dichotomized correct vs. incorrect and DK answers, is 0.691 (for the unweighted sample). The coefficients are 0.745 for the negative items subscale, and 0.437 for the positive items subscale.

EDUCATION AND SCIENTIFIC KNOWLEDGE IN EUROPEAN SOCIETIES.
187
Table 2.
Frequency distribution for scientific knowledge items, Romania 2009
Item ID
Item type Item [R]ight answer
[W]rong answer
[DK] Don’t know
Non response
[2] Positive The oxygen we breathe comes from plants (Oxigenul pe care il respiram provine de la plante)
89 7 3 0
[5] Positive The continents on which we live have been moving for millions of years and will continue to move in the future. (Continentele pe care traim se misca de milioane de ani si vor continua sa se miste si in viitor)
79 8 12 1
[1] Positive The centre of the Earth is very hot (Centrul Pamantului este foarte fierbinte)
77 9 14 1
[12] Negative The Sun goes around the Earth. (Soarele se invarte in jurul Pamantului)
52 42 6 1
[11] Positive Human beings, as we know them today, developed from earlier species of animals.(Fiintele umane, asa cum le stim noi azi, au evoluat din specii stravechi de animale)
47 36 15 2
[13] Negative It takes one month for the Earth to go around the Sun. (Pamantului ii trebuie o luna sa inconjoare Soarele)
47 20 32 1
[3] Negative Radioactive milk can be made safe by boiling it (Laptele radioactiv devine sigur pentru consum prin fierberea sa)
44 34 21 1
[4] Positive Electrons are smaller than atoms (Electronii sunt mai mici decat atomii)
44 19 35 2
[7] Negative The earliest humans lived at the same time as the dinosaurs (Primele fiinte umane au trait in aceeasi perioada cu dinozaurii)
44 30 24 1
[10] Negative All radioactivity is man‐made (Toata radioactivitatea provine din activitati umane)
39 38 22 1
[6] Positive It is the father’s genes that decide whether the baby is a boy or a girl (Genele tatalui sunt cele care determina daca copilul va fi o fata sau un baiat)
34 34 31 1
[9] Negative Lasers work by focusing sound waves. (Laserele functioneaza prin concentrarea undelor sonore)
34 26 38 2
[8/ Ab]
Negative Antibiotics kill viruses as well as bacteria (Antibioticele distrug atat virusii cat si bacteriile)
21 66 12 1
Source: STISOC 2009

COSIMA RUGHINIŞ AND ROXANA TOADER
188
The bi‐dimensional joint category plot for all items does not offer a clear distinction of wrong and right answer categories.
A multidimensional correspondence analysis of all 13 items indicates that at least 3 or 4 dimensions are needed for an adequate representation of the data. For the positive and negative subscales two‐dimensional representations seem to offer an adequate data reduction (see Appendix) with the dimensionality being clearer for the negative items.
As in the case of the European sample, in the map for the positive items subscale we can identify an axis that differentiates wrong answers from the DK and correct answers, and a second axis that differentiates DK answers from the right and wrong answers. The interpretation of the two axes in relation to the substantive factor of scientific knowledge is not clear.
Graph 6. Joint category plot for the scientific knowledge items, Romania 2009
Source: STISOC 2009 Post‐stratification weights are applied. Optimal Scaling with
Variable Principal Normalization For the negative items we can identify in the map an axis that differentiates
the correct [R] answers from the DK and incorrect [W] answers, presumably indicating substantive knowledge, and a second axis that differentiates DK answers from the others, presumably indicating a response style.

EDUCATION AND SCIENTIFIC KNOWLEDGE IN EUROPEAN SOCIETIES.
189
For the negative items, respondent education6 is clearly associated with both axes: respondents with primary and lower secondary education are closer to the DK and “[W]rong” regions of the map, while respondents with higher secondary and university education are located in the “[R]ight” region. Respondents with gymnasium‐level education or less (Educ1) are more likely to offer DK answers than the others, while respondents with lower secondary education are more likely to offer wrong answers than the others. Therefore, the association between the DK‐style factor and education may be non‐linear, finding the largest difference in the propensity of volunteering a DK answer between respondents with primary education and respondents with lower secondary education.
Graph 7. Joint category plot for the positive scientific knowledge items, Romania 2009
Source: STISOC 2009 Post‐stratification weights are applied. Optimal Scaling with Variable Principal Normalization. Respondent education is plotted as a supplementary variable.
6 Education categories are: Educ1 (no schooling, primary school and gymnasium – 0‐8 grades); Educ2 (incomplete high‐school and vocational school); Educ3 (high school and postlyceal education), and Educ4 (high education).

COSIMA RUGHINIŞ AND ROXANA TOADER
190
Graph 8. Joint category plot for the negative scientific knowledge items,
Romania 2009
Source: STISOC 2009 Post‐stratification weights are applied. Optimal Scaling with Variable Principal Normalization. Respondent education is plotted as a supplementary variable.
In Graph 9 we can see that the respondents’ interest in the survey, as perceived by the interviewer, is associated with both dimensions: respondents who were “Very Much” and “Much” interested (VM, respectively M) range in the proximity of [R]ight answers, while respondents who were [L]ittle interested and especially those who where [V]ery [L]ittle interested are closer to the DK answers. On the other hand, respondents’ bias towards social desirability, as perceived by the interviewer, is not associated with the response patterns.

EDUCATION AND SCIENTIFIC KNOWLEDGE IN EUROPEAN SOCIETIES.
191
Graph 9. Perceived respondent interest and perceived social desirability tendency in relation to the two dimensions of the knowledge scale for the 7 negative items
Source: STISOC 2009 Post‐stratification weights are applied. Optimal Scaling with Variable Principal Normalization. Perceived interest and perceived social desirability are plotted
as supplementary variables, besides 4 selected negative items.
Measuring health knowledge in presentday Romania
STISOC 2009 includes a series of items dedicated to measuring health knowledge – in addition to the items on antibiotics included in the scientific knowledge scale. Their distribution is presented in Table 3.

COSIMA RUGHINIŞ AND ROXANA TOADER
192
Overall, the proportion of DK answers is lower, ranging between 2% and 15%. In order to explore the scale dimensionality, we have selected six of the eight items, excluding the ones on sunlight, tuberculosis and diabetes because of their low variance. Therefore, the MDS analysis includes for items on swine flu, the item on HIV/AIDS, the item on the flu shot and also the scientific knowledge item on antibiotics.
Table 3.
Frequency distribution of answers to health literacy questions
Item ID
Item type Item [R]ight Answer(%)
[W]rong Answer (%)
[DK] Don’t know (%)
Non‐response (%)
[HIV] Negative If we drink water from the same cup with a person infected with HIV/AIDS, we are likely to get infected. (Dacă bem apă după o persoană infectată cu HIV/SIDA este foarte probabil să ne infectăm şi noi)
60 35 5 1
[V] Positive To be efficient a flue shot should be repeated every year. (Pentru a fi eficient, vaccinul antigripal trebuie repetat în fiecare an)
78 14 8 1
[S] Positive Exposure to strong sunlight (the beach) increases the risk for skin cancer. (Expunerea la soare puternic (la plajă) creşte riscul cancerului de piele)
91 4 5 1
[T] Positive Tuberculosis is a contagious disease. (Tuberculoza este o boală contagioasă)
89 6 5 1
[D] Negative People that suffer from diabetes should eat more sweets. (Persoanele bolnave de diabet zaharat trebuie să manânce multe dulciuri)
93 4 2 0
[SF1] Negative Swine flu is caused by the same virus as avian flu. (Gripa porcină este produsă de acelaşi virus ca gripa aviară)
64 20 15 1
[SF2] Negative The flu is not transmited from person to person. (Gripa porcină nu se transmite de la om la om)
69 23 8 1
[SF3] Positive Washing your hands with soap and water prevents swine flu. (Spălatul pe mâini cu apă şi săpun previne gripa porcină)
75 20 5 1
[SF4] Negative Swine flu is transmitted by eating pork. (Gripa porcină se transmite mâncând carne de porc)
60 30 10 1
Source: STISOC 2009. Post‐stratification weights are applied.
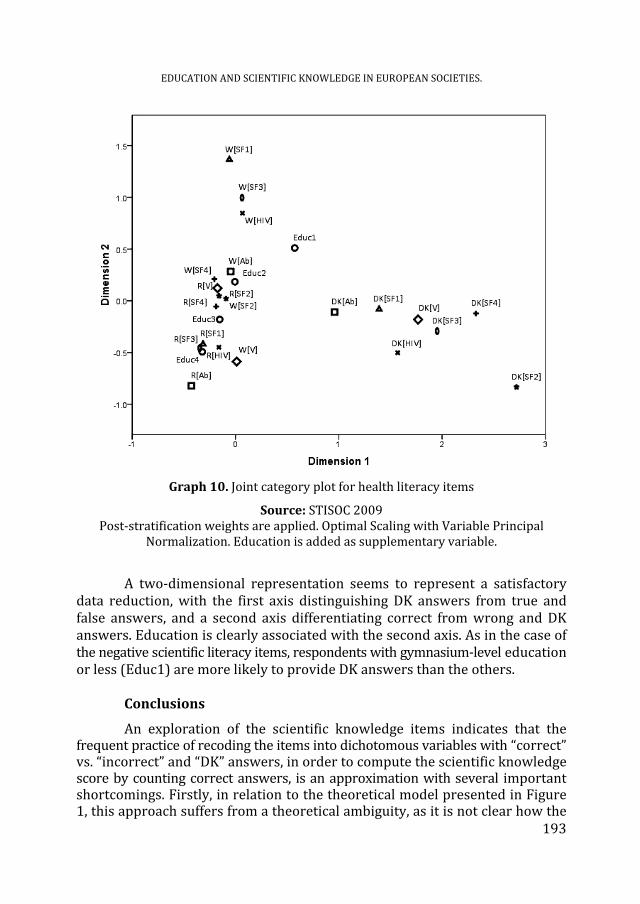
EDUCATION AND SCIENTIFIC KNOWLEDGE IN EUROPEAN SOCIETIES.
193
Graph 10. Joint category plot for health literacy items
Source: STISOC 2009 Post‐stratification weights are applied. Optimal Scaling with Variable Principal
Normalization. Education is added as supplementary variable.
A two‐dimensional representation seems to represent a satisfactory data reduction, with the first axis distinguishing DK answers from true and false answers, and a second axis differentiating correct from wrong and DK answers. Education is clearly associated with the second axis. As in the case of the negative scientific literacy items, respondents with gymnasium‐level education or less (Educ1) are more likely to provide DK answers than the others.
Conclusions
An exploration of the scientific knowledge items indicates that the frequent practice of recoding the items into dichotomous variables with “correct” vs. “incorrect” and “DK” answers, in order to compute the scientific knowledge score by counting correct answers, is an approximation with several important shortcomings. Firstly, in relation to the theoretical model presented in Figure 1, this approach suffers from a theoretical ambiguity, as it is not clear how the

COSIMA RUGHINIŞ AND ROXANA TOADER
194
dichotomization of correct vs. incorrect and DK answers relates to the “self‐attributed ignorance of science” scale. Secondly, acquiescence introduces errors in the levels of the scientific knowledge score, because of the positive items, for which acquiescent answers are coded as “correct” answers. Thirdly, the dichotomization of DK vs. correct and incorrect answers also generally leads to higher levels of the Cronbach’s alpha coefficient – thus indicating that the DK style factor is an important contribution to the response pattern.
When items are analyzed as nominal variables and DK answers are taken into account, a satisfactory data reduction analysis by optimal scaling relies, on one hand, on a distinction between positive and negative items, and, on the other hand, on the deployment of two dimensions. In the map of the negative items subscale, one axis may be identified and interpreted as a substantial knowledge factor, while a second axis may be interpreted as a DK response style.
As expected, respondent school education is associated with the “scientific knowledge” dimension, thus offering convergent validity support for the MCA representations. The fact that respondents who are most likely to volunteer DK answers are the ones with the lowest school education levels and the ones who are perceived to be uninterested in the survey may be understood in the context of the interview interaction: manifesting explicit ignorance is more comfortable when claiming disinterest, or when one is socially expected to be ignorant of science by virtue of social status.
The results are consistent for a weighted sample of 24 countries from the Eurobarometer 63.1 2005 survey, and for the Romanian STISOC 2009 sample. A similar pattern of answers may be identified for the health knowledge items included in STISOC 2009, indicating that a two‐dimensional model with a DK factor may be the appropriate conceptualization for understanding answers to knowledge items on different topics.
The theoretical model indicates that positive items and negative items should have different response patterns, due to the influence of acquiescence. This difference can indeed by observed in the MCA charts. The interpretation of dimensions in the case of positive items is not clearly related to the scientific knowledge factor, reflecting instead the style factors. Therefore, when scientific knowledge scores are computed from dichotomous items with “correct” vs. “incorrect” and DK answers, it seems advisable to include only the negative items, thus avoiding the error induced by acquiescent answers.
Methodological research on measurement models for scientific knowledge scales is particularly relevant for policy oriented research that seeks to estimate levels of public knowledge in specific areas. For example, the Eurobarometer 72.5 report on “Antimicrobial resistance” (2010) employs a similar scale of factual knowledge on antibiotics including two positive items and two negative items, relying on a score to compare levels of information across European countries. Style factors may bias estimates of average levels of knowledge, as well as estimates of association measures with other relevant indicators.

EDUCATION AND SCIENTIFIC KNOWLEDGE IN EUROPEAN SOCIETIES.
195
Further research should be conducted on the use of structural equation models to estimate the scientific knowledge factor as a latent variable, together with or separately from the two style factors. This approach could be employed to test the cultural equivalence of the scientific knowledge scale across different countries or social contexts, therefore facilitating comparative research at a time when cross‐cultural research becomes a norm rather than an exception.
REFERENCES
Allum, N., Sturgis, P., Tabourazi, D., Brunton‐Smith, I. (2008). Science knowledge and attitudes across cultures: A meta‐analysis. Public Understanding of Science 17: 35‐54.
Bann, C. and Schwerin, M. (2004). Public Knowledge and Attitudes Scale Construction: Development of Short Forms. RTI International.
Bauer, M. (1996). Socio‐demographic correlates of DK‐responses in knowledge surveys: Self‐attributed ignorance of science. Social Science Information, 35 (1): 39‐68.
Bauer, M. (2009). The evolution of public understanding of science discourse and comparative evidence. Science, Technology & Society, 14(2): 221‐240.
Bauer, M., Allum, N., Miller, S. (2007). What can we learn from 25 years of PUS survey research? Liberating and expanding the agenda. Public Understanding of Science, 16:79‐85.
Didow, N., Perreault, W., Williamson, N. (1983). A cross‐sectional optimal scaling analysis of the Index of Consumer Sentiment. The Journal of Consumer Research, 10(3): 339‐347.
Durant, J. et. al. (2000). Two cultures of public understanding of science and technology in Europe. In M. Dierkes and C. von Grote (eds.): Between Understanding and Trust. The Public, Science and Technology. Oxon: Routledge, pp. 131‐153.
Eurobarometer 55.2 (2001). Europeans, Science and Technology. Accessed online on March 12, 2010 at http:// ec.europa.eu/research/press/2001/pr0612en‐report.pdf
Eurobarometer 63.1 (2005). Europeans, Science and Technology – Special Eurobarometer 224 / Wave 63.1. Accessed March 12, 2010 at http://ec.europa.eu/public_opinion/ archives/ebs/ebs_224_report_en.pdf
Eurobarometer 72.5 (2010). Antimicrobial Resistance – Special Eurobarometer 338 / Wave 72.5. Accessed April 30, 2010 at http://ec.europa.eu/public_opinion/archives/ ebs/ebs_338_en.pdf
Greenacre, M. (2007). Correspondence Analysis in Practice. London: Chapman & Hall/CRC. Hayes, B. and Tariq, V. (2000). Gender differences in scientific knowledge and attitudes
toward science: A comparative study of four Anglo‐American nations. Public Understanding of Science, 9: 433‐447.
COSIMA RUGHINIŞ AND ROXANA TOADER
196
Mejlgaard, N. and Stares, S. (2009). Participation and competence as joint components in a cross‐national analysis of scientific citizenship. Public Understanding of Science OnlineFirst, published on June 26, 2009 as doi:10.1177/0963662509335456, pp. 1‐16.
Miller, J. (1992). Towards a scientific understanding of the public understanding of science and technology. Public Understanding of Science, 1: 23‐26.
Miller, J. (1998). Measurement of civic scientific literacy. Public Understanding of Science, 7: 203‐223.
Miller, J. (2000). The development of civic scientific literacy in the United States. In Kubar, D.D., Chubin, D. E. (eds.): Science, Technology and Society. A Sourcebook on Research and Practice. New York: Kluwer Academic / Plenum Publishers, pp. 21‐ 47.
Miller, J. (2004). Public understanding of, and attitudes toward scientific research: What we know and what we need to know. Public Understanding of Science, 13: 273‐294.
Miller, J. and Pardo, R. (2000). Civic scientific literacy and attitude to science and technology: A comparative analysis of the European Union, the United States, Japan and Canada. In M. Dierkes, C. von Grote (eds.): Between Understanding and Trust. The Public, Science and Technology. Oxon: Routledge, pp. 81‐129.
Mondak, J. and Creel Davis, B. (2001). Asked and answered: Knowledge levels when we will not take “Don’t Know” for an answer. Political Behavior, 23(3): 199‐224.
Pardo, R. and Calvo, F. (2004). The cognitive dimension of public perceptions of science: Methodological issues. Public Understanding of Science, 13: 203‐227.
Thiessen, V. and Blasius, J. (1998). Using multiple correspondence analysis to distinguish between substantive and nonsubstantive responses. In J. Blasius, M. Greenacre (eds.): Visualization of Categorical Data. London: Academic Press, pp. 239‐252.
Von Roten, F.C. (2004). Gender differences in attitudes toward science in Switzerland. Public Understanding of Science, 13: 191‐199.

EDUCATION AND SCIENTIFIC KNOWLEDGE IN EUROPEAN SOCIETIES.
197
APPENDIX
Graph 11. Dimensions in optimal scaling of scientific knowledge,
with all items included, in 24 European countries
Source: Eurobarometer 63.1 2005
Graph 12. Dimensions in optimal scaling of positive scientific knowledge items
in 24 European countries.
Source: Eurobarometer 63.1 2005. Cases are weighted with EU29 weights.

COSIMA RUGHINIŞ AND ROXANA TOADER
198
Graph13. Dimensions in optimal scaling of negative scientific knowledge items
in 24 European countries
Source: Eurobarometer 63.1 2005. Cases are weighted with EU29 weights
Graph 14. Dimensions in optimal scaling of scientific knowledge –
all items included, Romania 2009
Source: STISOC 2009
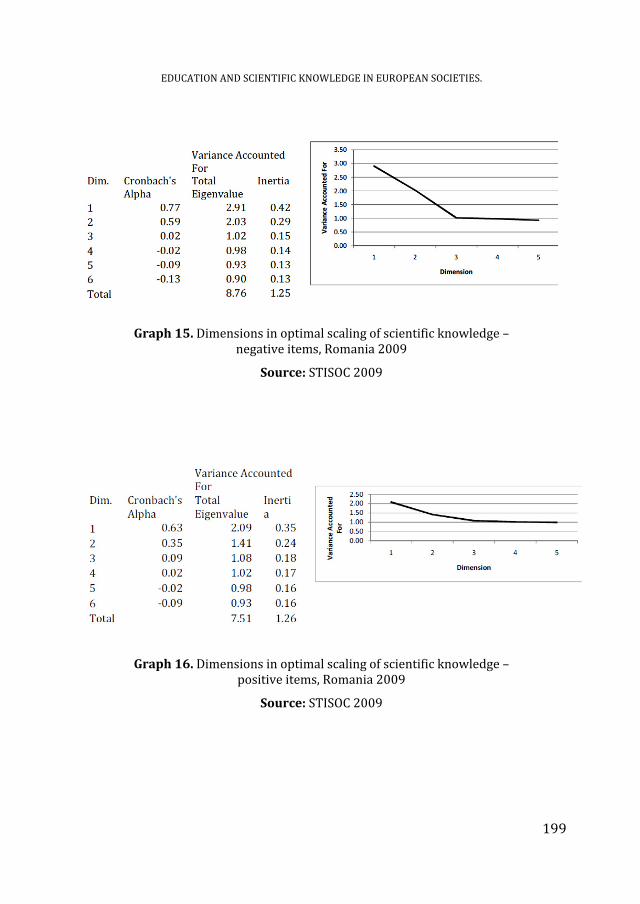
EDUCATION AND SCIENTIFIC KNOWLEDGE IN EUROPEAN SOCIETIES.
199
Graph 15. Dimensions in optimal scaling of scientific knowledge – negative items, Romania 2009
Source: STISOC 2009
Graph 16. Dimensions in optimal scaling of scientific knowledge –
positive items, Romania 2009
Source: STISOC 2009

COSIMA RUGHINIŞ AND ROXANA TOADER
200
Graph 17. Dimensions in optimal scaling of health knowledge items, Romania 2009
Source: STISOC 2009
Graph 18. Dimensions in optimal scaling of items, Romania 2009
Source: STISOC 2009

EDUCATION AND SCIENTIFIC KNOWLEDGE IN EUROPEAN SOCIETIES.
201
Graph 19. Dimensions in optimal scaling of items, Romania 2009
Source: STISOC 2009
Table 4.
Answers to knowledge items on antibiotics and mother’s genes in 24 European countries
Antibiotics kill viruses as well as bacteria
(Row %)
It is the mother’s genes that decide whether the baby
is a boy or a girl (Row %)
True (‘Wrong’)
False (‘Right’)
Don’t know True (‘Wrong’)
False (‘Right’)
Don’t know
France Fr 34 59 7 14 71 15 Belgium Be 35 61 3 21 71 8 Netherlands Nl 26 69 6 12 79 10 Germany West WG 45 46 10 17 68 15 Italy It 40 45 14 26 56 18 Denmark De 42 53 6 9 81 10 Ireland Ir 33 56 12 16 66 18 Great Britain GB 39 53 8 18 69 12 Greece Gr 47 32 20 19 63 19 Spain Sp 46 36 18 27 52 21 Portugal Po 44 29 27 27 47 26 Germany East EG 52 40 8 19 71 11 Finland Fi 19 77 5 13 78 9 Sweden Sw 18 78 4 13 77 11

COSIMA RUGHINIŞ AND ROXANA TOADER
202
Antibiotics kill viruses as well as bacteria
(Row %)
It is the mother’s genes that decide whether the baby
is a boy or a girl (Row %)
True (‘Wrong’)
False (‘Right’)
Don’t know True (‘Wrong’)
False (‘Right’)
Don’t know
Austria Au 40 40 20 22 52 26 Czech Republic Cz 44 47 9 21 65 14 Estonia Est 68 23 10 22 56 22 Hungary Hu 41 49 11 27 57 16 Latvia Lv 72 14 15 20 52 28 Lithuania Li 68 21 11 14 62 25 Poland Po 68 22 10 21 58 22 Slovakia Sk 67 25 8 20 63 18 Slovenia Sl 44 50 6 21 66 13 Bulgaria Bu 55 18 27 19 43 38 Romania Ro 53 25 22 16 43 41
Source: Eurobarometer 63.1 2005. Cases are weighted with national weights (weight results from target).

Romanian Sociology Today
Editorial note:
This is a special section dedicated to research articles from the field of Romanian sociology.


STUDIA UNIVERSITATIS BABEŞ‐BOLYAI, SOCIOLOGIA, LV, 1, 2010
THE STRUCTURE OF NARRATIVE FORMS
IMRE PÁSZKA*
(translated from Hungarian by István Volford and Zsuzsanna Volford)
ABSTRACT. This work is a single segment of a monograph (Pászka 2007; 2009), which compares the structure of life story with that of autobiography. It argues that both of them share the same comprehension and interpretational scheme, and describes their characteristics in both methodological and theoretical ways. The narrative story forms, such as life story, autobiography and all other story types, which focus on everyday life, are interdisciplinary fields. Beyond sociological approaches, it requires social‐psychological, theory‐historical, literature‐theoretical, cultural and social‐anthropological knowledge. All these different approaches can be derived from hermeneutical phenomenology (Husserl, Schutz, Gadamer and Weber). The transformation method created by the expansions is different from the old and new biographical methods, in that the narrative parts are considered talk‐acts, in which the mental view of the society is discursively constructed and becomes objective in sentences. This method requires therefore an operation which clarifies the representation of experiences in oral texts, reading, writing and perceiving. The aim of the study was to widen and expand these theoretical frameworks, using basically genetic, longitudinal, synchronic and comparative methods. New concepts are introduced, which refer to the comprehension of the narrative story forms, using aggregates. Keywords: narrative story forms, life story, autobiography
Introduction
Based on their way of procedure, narrative story forms can be divided into two different types: life story and autobiography. The autobiography should not be mixed up with biography or with life story. The biography can refer back only to the past and can only be told by a third person and cannot be interrupted by the actual person’s comments, explanations, experiences, etc. Biography will turn into autobiography at the moment, when the personal comments, explanations, reflections are added to the facts by the subject of the acts. Although the biography is similar to autobiography in its structure, it cannot be handled the same way. If it
* Sociology Department, Faculty of Arts, University of Szeged, e‐mail: [email protected]

IMRE PÁSZKA
206
is viewed from the aspect of text creation, not the autobiography, but the biography is the one which is closer to oral texts and which requires the researcher as a third person. The CV form what is required by different offices is a more detailed, compact sketch which is more like a biography, not a continuous and coherent narrative like an autobiography. The biographical form, when it is written by a third person, resembles the method of anthropologists or historians. The sociological recreation of one’s life is somehow similar to the case when the oral text is recorded into a written text in a simpler and compact way. With this act the person of the author becomes questionable. In this study the traditional “I” and “you” relationship is mixed up, and “I” was used to describe the actor of a biography and not the researcher, since the actor is the most important “I” in such researches. Despite the fact that the researcher put a lot of work into gathering the information, the examined person must always be in the focus of our interest. The researcher, observer will have a more dominant role in the analysis and interpretation of the data. This research method opposes any researches in which the life story teller is the expert of his or her own life, where the researcher is “invisible”, because in that case there would be no need for a researcher at all. This perspective also requires a way of thinking, in which the data with different terminologies like life story, life history, personal history, case history etc. cannot be examined as single parts but they are integrated units of the narrative story forms. The concept behind this approach is that life is a whole totality, a unit in which the relevancy of the different episodes may only be understood from the whole “life‐story”.
The Basic Structure of Life Story
Life Story Walk of Life Narration Institutional, Correctional World of Experiences Reality (Objective) (Subjective/Inter‐subjective) Chronological Diachronic‐Synchronic Past Future Present Perspective
Figure 1. Source: Author’s composition.

THE STRUCTURE OF NARRATIVE FORMS
207
After the general characteristics of typological narrative forms have been discussed, the basic structure of life stories will be observed, which can also be related to autobiographies but this chapter deals exclusively with biographies. The dual structural scheme of the life story – walk of life, narration – refers to the fact that each and every story narrated from the subjective point of view relies on the facts of the objective walk of life (course of life), it constructs the narrator’s horizon of experience from that. The analytic scheme calls the attention to the basic structure and the perspective of time, whereas a written life story produced in a dialogical situation can be considered to be a unified whole of the narration and the walk of life. These two components presume each other, they form an organic unit, since they are parts of the same unit, created in the same situation of text‐production, and moreover, they are both implemented to the contexts of the pasts and the futures of everyday lifestyles. The recognition of their idiosyncrasies and their identification can be found in the different processes of text‐production which affects the way of interpretation. In other words, text‐production itself is an interpretative process, since the questions and the answers are reflected, which makes further – procedural and following – interpretation possible. It is not simply the confrontation of interpretations1, the interpretations of the narrator and the researcher overlap each other. Not only the actual narration – as it is stated by others –, but also the walk of life is structured and interpreted by the narrator. In other words, the narrator reflects on himself while he recalls his life story, his recollection is a self‐reflexive process, he recollects and selects from the perspective of his present.
Since life story gives rise to several different or identical analyses originated in different concepts, the previously mentioned termini of story, history, etc. and their variants and domains may be analytic and operational segments of narrative forms. All these depend on how the researcher realizes his “authoritative” intentions.
The basic structure of life stories – the walk of life and the narration – in which the past and the future enable the researcher to unfold diverse themes and their operations, and construct them from the perspective of the present. These are integrative parts of contrived and narrated life, since the contrived and narrated life of an individual is a totality itself.
Narrative forms (life stories, autobiographies) have a specific feature: walk of life is the synchronicdiachronic game, or the dialectics of contrived life and experiences. Walk of life (or the course of life) is objective, clear, controllable and chronological. Narration is diachronic and synchronic, since the individual
1 See also: N. Denzin 1985:10., vs. M. Kohli 1978: 9‐31., and Péter Nidermüller 1987: 376–387., and M. Burgos, (18. 1), 1979: 27–43.

IMRE PÁSZKA
208
takes part in different situations in everyday life and has got different imaginations, which have changing chronology. The individual attempts to find solutions using already elaborated or contemporary lifestyle‐patterns, rules and strategies. The individual also has the possibility to choose2 from these readymade patterns, rules and strategies. Walk of life bears a socio‐cultural pattern, moreover it has become an institution together with modernism and displays the dynamic, correctional and reproductive process of collective actions and as such it forms the objective basis of every narration, thus it is observable, comparable and standardizable3.
Narration – the narration of the life story – is subjective; the past of the narrator is constructed from the present’s point of view. It can be characterized by the overlap of synchronic and diachronic processes. There are characteristics which are visible, there are characteristics which are not, and thus narrations are the matter of understanding. There is a difference in quality between narrations and walks of life even if they presume each other, namely, walks of life lay the foundation of narrations. At first, narrations are constructed; they are created by the interactions of researchers and narrators, which are the products of idiomatic sociological and psychological situations. The hermeneutical dialogues can be clearly seen at this point: the understandings and interpretations, which mean text‐production on the one hand, and the understanding and the interpretation of the text on the other. These meanings overlap each other. The observer and the researcher become part of the text since with his questions affect the ratio content of the respondent with which he becomes active participant of the creation of the product, namely life story, which is manifested in a narrative construction. Narrations recollect the experiences, desires, intentions, etc., gained during walks of life motivationally, and tell them according to the standardization and conventions of the patterns of everyday life. Furthermore, it allows the reader to get an insight into the deeper latency of everyday life, which cannot be approached by any other ways. At this point, the contents of the narration are emphasized although it is separable from the structure of those narrative texts which provide its form4. The narration of experiences, desires, intentions, etc. require a longer period of time in practice, thus narration is unfolded, tale‐like and subjective (the way how the subject sees/saw/gets things seen). Contrary to narration, walk of life is chronological and clear (since it is socio‐demographic or socio‐geographical data, or years spent in institutions of socialization, etc.).
Contrived life, according to hermeneutical phenomenology and understanding, sociology and narration, presume two different demonstrations
2 The typological scheme of life is adapted to life story (see: A. Schütz– Th. Luckmann 1984: 269–321). 3 Walk of life as an institution and its contexts in society (see: M. Kohli 1990: 175–212). 4 Ken Plummer differentiates among the types of: naturalistic life story, researched life story, reflexive and recursive life story (see: K. Plummer 1983:11‐12).

THE STRUCTURE OF NARRATIVE FORMS
209
of chronology, which will not be displayed here, although two questions, which are usually neglected, are to be asked concerning this statement. The first one is related to narrations: narrations are not simple speech‐acts but also sequences of actions where the characters of narrations have to be identified since characters are identical to narration, their part is originated from the same understanding of the narration as the action. In other words, the character, whose perspective of time is different at the moment of the narration from that time when he contrived those events. The definition of narrations refers to the contents, to the interval under which an event undergoes. Not only can it be extended to the course of events (the chronological list of events), but it can also be extended to those, which the active part can connect to these events from an earlier or later perspective of time, such as the interpretation of experiences, opinions, thoughts and images. The second question concerns “the narration yet to be told” which has been outlined according to two particular relevancies. The first case is psychoanalytic (Roy Schafer), which presumes that the narration of life starts from repressed narrations and narrations never told to the direction of such real events, which the subject has undertaken and considers to be a part of his personality. The search for this personal identity provides the continuity among the potential, undertaken and narrated life story5. The second case can be described with the procedure of a judge who tries to understand the undergoing of an action or a character by puzzling out the network of those actions, which surround the suspect. The emphasis is on the “network of actions” in accordance with W. Schapp. The passive form of the verb expresses that the event had happened to someone before it was told. The “network of actions” is rather the “pre‐narration” of the narration, its starting point is chosen by the narrator. This “pre‐narration” can be considered to be the “background” of narration, from which narration emerges6. On the one hand, all these refer to the fact that the individual is “entangled into existence created by the network of narrations”. On the other hand, they state that narration is a secondary process, that is, it is the creation of narration which becomes well‐known. It has to be remarked that there have always been narrations yet to be told with complex motivations besides narrations. All in all, the life of the individual is entangled into the network of stories. Their “outlines” get lost, but the narrations of the stories yet to be told indicates that they among the necessities of the individual7. 5 The core of the meta‐psychological concepts of Freud can be considered to be the regulations and the ranking of retold life stories (see: R.Schafer 1976., cited by: Ricoeur 1999:290).
6 Luhmann reconsiders the problem in Schapp’s dimension of chronological sociology (see: W. Schapp 1976: 85–101).
7 There are references to the fact that the aims of some narrations are the fading and camouflages of its events, for example, evangelist Mark thought the Apologues of Jesus, which were narrated, to be not understood. In other words, there are narrations which can only be understood by the “internals”, namely the insiders, thus this is a form of exclusion (see: F. Kermoke, The Genesisi of SocietyOn the Interpretative of Narrative. cited by: Ricoeur 1999: 292).

IMRE PÁSZKA
210
The contents of the previous paragraphs are not only related to the interpretation of the definition of life story, but also to the possibility of entangling into several questions, for example: to what extent is the contrived life of the individual part of a collective action, how is it attached and fitted into them. In this whole process, perceived in the perspective of individual and social time, collected (social) time is perceived on the side of individual time. Is the individual oriented by itself or is this orientation model governed by rules which are influenced by his acquired socio‐cultural set of patterns, when he puts his events and experiences to a certain perspective? The narrator of life story, who displays his walk of life with experiences, is governed by rules and circumstances. The subjects are not aware of that, similarly to the researcher, thus none of them can use such elements (within or outside of the text) which creates a contradiction between contrived and narrated life. Incongruencies are present in a latent or a manifested way and researchers have to discover, explain and interpret them. The Structure of Autobiography
On the one hand, the autobiographer being self‐conscious may draft such a time scheme, which has got the present in the centre and gets unfolded in a bidirectional perspective of time, which may be independent from conceit, although it forms a unity:
Past PRESENT Future
On the other hand, the witness and the interpretation are also present in narrations of life story and autobiography, namely the link between the time‐managing functions of mimesis and diegesis explicated by Ricoeur.8 Autobiography starts with a certain witness‐discourse, which give an account of such stories and events, in which the narrator may not have participated, he may have just been the witness or the observer of them. Witness‐discourse is usually written in past tense and it often uses the verbs to see and to hear, with which the witness creates a specific existential immediacy for the reader and himself. He aims to represent the facts displayed to be ontologically given in the world, which can be interpreted as a kind of mimesis. Autobiography contains and interpretative discourse either besides witness‐discourse, which equals to diegesis in the classical sense, it creates facts fitting into the given
8 It has to be handled with care that Bruner and his colleagues developed their concept on the basis of spontaneously narrated life stories, similar time management are present in 40% of the life stories observed with which they proved their presumptions to be true, for example: upon reflection I realized that I should have never left that job (J. Bruner 1993:45).
THE STRUCTURE OF NARRATIVE FORMS
211
necessities (time and space), similarly to legislation, it creates facts fitting into its expectations (sexual harassment, violation of a contract, guardianship, etc.). If clearly visible facts speak for themselves, diegesis has the task to provide them with greater significance, to organize the components of being witness (carrier, the years of decline, etc.) and to compose them into an evaluation frame (fight, loyalty, etc.). Diegesis is more subjective than mimesis, since it takes difficulties and unaccustomed ways into consideration, it tends to use the verbs to know and to believe instead of the verbs to hear and to see, and last but least, it is usually hidden in the present or in chronology (J. Bruner 1993: 45).
Autobiographies always involve some kind of an orientation, which display the internal and external position of the author, namely the relationship between the “self” and the “world”, which is present in the author’s way of explanation as opposed to everyday discourse, which presumes motivations and intentions. This orientation can be linguistically characterized by features latently neglecting information, for example “I am just…” (I am just a worker; I used to be just an executive in the party, etc.). These features may manage to implement some substance into the mimetic and diegetic time‐managing construction of autobiography. It has to be stated that autobiography, as a creative text including the combination of explanation, conclusion and orientation, aims to create such a report on the self, which is real and readable at the same time. The reality of this report is connected to credibility, since it can be proved with that, it is like a plea at the court. However, the autobiographer does not have to confront the delinquent, to assault the reader with cross‐questions or to take an oath as Ph. Lejeune states. The reality of autobiographies is based on some definitions representing values, which are not easy to capture. The autobiographer’s position is analogue compared to the solicitor, who is delivering his plea, in which he wants to build up a persuasive “reality”. Reality also depends on the insertion of genres and images depicting everyday events as facts. The “victim of circumstances” type does not fit to a mobster politician, even if he wants to blunt or hide his action.
Autobiographical genres are usually compared to the way how the representatives of Annales School placed histoire in the scale of histoirechroniqueannales. Annales means mere facts (bad weather conditions, poor harvest, assassinations, the fall of a politician, etc.). These facts together form chronique (prisons were overloaded during Stalinism), which may be transposed into a wider context, namely histoire (the fall of Stalinists had been triggered by the Hungarian revolution of 1956, which then led to the fall of the utopia of communism). However, not all histoires correspond to the collection annales available, similar to autobiographies. It does not matter that the author has got real facts if he represents them far‐fetchedly, artificially and badly in writing, the reader’s impression will still be that the author is frivol, grandiloquent or

IMRE PÁSZKA
212
monotonous. Martin Buber has got a well‐known story, which highlights the features that the autobiographer should possess. Its key statement is Goethe’s “be‐yourself” formula, which means that the author should represent himself, since it is the only way to prove his credibility for the reader.9
The autobiographer is trapped in the mimetic interpretation of particular details and the expectation of creating a readable (profitable) text, namely to be able to get embedded into the dialogues on life. It is a common belief that stories on life have always got some kind of a narrative form and each and every culture possesses some kind of a canonized form concerning autobiography and narration. Hungarian culture is chronologic, the major segments of life are grouped together with major events and they usually reach the public sphere through the private sphere. They are voluntary and turning points and crises play an important role within them.10 Chronology may have fallen apart in other cultures; the main character is usually the toy of external powers.11 Moreover, it can be clearly seen that autobiography is a canonized form, which is implemented to the give cultural space, in order to correspond to the narration of lives in that given space, thus they can only be understood and interpreted within the canon of that given space. Some researchers raise the question of why autobiography is literary, innovative and inventive. There is no commonly accepted answer to the question; the possible answer has to be found in the reinterpretative possibilities of the nature of the “self”, which means that autobiography has got important political reflections. The present or actual self is a rather everyday figure when he endeavours to compose his autobiography, since he interprets himself, provides meaning to his life, with which he criticises what used to be in contradiction with what is now. Bad old memories are glorified in the process of recollection, thus they are often recalled in comical and ironic rhetoric.
These ways of orientation, explicated by explanations, are observed by the researcher as texts. Each and every approach, which tries to observe life, life story and autobiography interpreting life apart from the text, is such a useless enterprise as if a physicist endeavoured to find such a nature which is independent from those theories, according to which he/she is able to analyze phenomena. The primary force of culture and society, more precisely socio‐cultural formation, are narrations, since they cover the forms of life, which
9 The story of Martin Buber is: Having arrived to heaven, a Mr Rev Moshe apologises to Saint Peter for not being as caring as Albert Scwitzer and for not being as intellectually talented as Albert Einstein, Saint Peter paused then he looked into the Great Book and said: it is no problem that you were not like Schwitzer or Einstein, although it concerns me that you were not like Rev Moshe (cited by J. Bruner. 1986:127).
10 The eight periods of the individual, namely the periods of the formation of the identity (see: E. H. Erikson 2002: 243–266).
11 The Moroccan example of V. Crapanzaro (cited by J. Bruner 1993:49).

THE STRUCTURE OF NARRATIVE FORMS
213
cannot be abstracted, since these are the individuals themselves. The form of life is imagination at first, then it is defined by experience, thus narrative forms on life story are the combinations of imaginations and experiences.
If the researcher desires to acquire knowledge of the objects of narrative forms and experiences implied in them, he has to analyze the life story manifestations of autobiography. These manifestations can only become objects of scientific analysis if they are made available, which means that they get transformed into a written piece of work. However, data of the given individual’s life can also be found in other resources, for example in pictures, photographs, objects, books, correspondence, etc. It has to be remarked that the interpretation of these resources create an approach and a terminological environment, which differ from the original, although further contextualization and reconstructive processes are required to the transmission of subjective meanings.
In case of trying to draft a kind of typological scheme based on formal criteria, it has to be emphasized that narrative forms can be verbal, spontaneous narrations, direct, non‐verbal products, typical autobiographies or narrative forms with the author’s contribution. All these together are the texts of narrative forms. The verbal forms are the most prevailing communicational forms applied in real life. These become useful for scientific research when they are written down. The development of the interview’s equipment (tape recorder and video cassette recorder) enabled improvisational narrations to be the object of the analysis. In other words, the object of the analysis is widened with those dialogues in which individuals share their experiences with others spontaneously or they narrate the life story of others during a contrived experience or a simple dialogue at meetings, celebrations or during a journey. These are complemented by several institutional situations, for example if an individual has to provide data of his life to the doctor, in case of applying for a job or during school years, confessions, trials, etc.
Spontaneous life story interviews for research purposes in institutional situations are categorized into the texts of narrative forms. However, in case of this paper, namely in case of the research on narrative forms, the object and the theme of observation are those autobiographies and narrative forms, which were produced with life story interview technique and which were directly written down. However, besides manifestation, namely typical autobiographies, directly written down, there are similar but not identical forms, for example life stories, diaries, memoires, correspondences and literary or epical forms of other written memories or the recordings of them made by another individual, thus these recordings are usually written in the first or the third person singular. There are huge differences among these forms of text types in their surroundings of composition, ways of production, chronology, ways of performance, contents of information, values of expression and the effectiveness of their topic.

IMRE PÁSZKA
214
Contrarily to the previous paragraph, the topic of this paper involves life story and typical autobiography in the research of the author of this paper because both of them have got almost identical or at least similar problems concerning interpretation and understanding. Highlighting these two characteristic forms from texts does not mean that the author of this paper considers them being identical. Furthermore, the author of this paper emphasizes that they also differ from each other in form, structure, surroundings of composition, way of performance, contents of information and way of production. A major characteristic of them is considering content and being formal. Recollections and experiences are self‐narrations, thus their interpretations can be inserted to the same theme. Although the experience’s ratio content is greatly dependent on the writer, the producer(s) and how it is produced and to which context it will be inserted.12 The idiosyncrasy of autobiography, closely connected to memoire, is in the chosen topic, what the author writes about his life. In contradiction with the previous statements, it is possible to schematize the structural components, which enables the reader to identify general and specific features. This is one possible structural construction scheme of the traditional model of the autobiography. The improvements are in the details, the scheme of the autobiography does not give any information, also like the memoir written with interview, namely the elements of the coherence among the experiences, about the thematically significant experiences and with the reactions given for them. However, its feature of putting forward the descriptive nature and meaning‐content emphasizing autobiography, this scheme can guarantee a quite appropriate basis for the comparison with life story, or rather for the implication of common interpretational frames. It must be seen, at the same time, that contrarily to life story, autobiography possesses some quality, namely its author’s observations, analysis, linguistic mouldiness, differentiation and flexibility etc., what the narrators of story do not possess. The reason for this is not that they do not have the competence for this all, but because two people take part in the production and the researcher is the one who stirs towards the line of the discussion. In other words, life story lacks the sophisticated self‐reflection, the complexity of the interpretation of personal experience, the depth of empathy towards other people’s fates etc. However literarily constructed autobiography is a neglected field of social science.13
12 Fr. Schütze highlighted two “characteristic” forms of narrative life stories, when he created the methodology of improvisational narrations (1983), life story created with interviews and autobiography. The significance of the former type can be captured in the fact that it expresses that segment of experiences, which are the most actual in the given period, it observes the structure and crucial points of that. It allows the researcher to look into the whole of the life story and the context of experiences with the help of analytic instruments (see: G. Rosenthal – W. Fischer 2000: 456–465).
13 For example the notes of history of sociology, the social history cannot lack the autobiographies of P. Sorokin, W. Wundt, K. Bücher, D. Gusti etc.

THE STRUCTURE OF NARRATIVE FORMS
215
Introduction Narration Conclusion/
Ending Forward reference Story ‐‐‐‐ ‐‐‐‐‐‐‐‐‐‐ ‐‐‐‐‐‐‐‐‐Experience Moralizing Title Past – Distance‐ Present Era closing.
Perspective “Autobiographic contract”
Retrospective Introspectiv
Objects, scene External ‐ Dialectic ‐Internal Variable Constant Local Local Realistic Empirical, based
on facts, controllable, experience
Explanation, commentary, analysis, interpretation
Timeframe Sequential, phases of life: home‐school‐work
Totality extensive Intensive Genre Literary, non‐literary, reminiscent Mental constitution Worldview Limits narrow cut, point of view, representation, first person
singular, style
Figure 2. Construction of the Autobiography.
Source: Author’s composition.
As regards the reliability of autobiography it is controversial whether
it can be considered to be a genre of literary work (fiction) or an informative contemporary period portrayal, in which subjective intent makes the validity of the document of the autobiography‐writer’s report doubtful. The point here is the subjective method of truth, the sight of reality, consequently the they are not valuable in the sense that they reveal the truth, the reality with the research, but in the sense that the given individual or group of individuals in the given place and time experiences the milieu and all that the individual sees/ displays from the perspective of his present time. We have already mentioned in the beginning that our aim is to create a common interpretative framework for autobiography and life story. The axis of both can be identified by a PAST‐PRESENT‐FUTURE scheme, which refers not only to the temporal frame but to the visual frame to the narrator as well. Despite of this common basis there are some differences between life story and autobiography. Although I am not a memory researcher, taking the modes of recollecting the past into consideration we can claim on the basis of our empirical evidence that there are two types of recollecting the past. The narrator of the life story recollects the

IMRE PÁSZKA
216
past spontaneously, less thoroughly, a little superficially, in contrast to the narrator of the autobiography. Temporal frames are also different. In general, narrators of autobiographies tell us the first 25‐30 years of their life. In the case of the life story, researcher intention plays a role in shaping temporal frames. However, all this depends upon the narrator’s age as well. E. g. an older narrator’s field of experience and temporal frame is broader than that of young people. In the case of the two types,the point of view, the way the narrator views things may also be different. Autobiographies can be moralising or they can summarize a certain phase of the lifework of an artist or a scientist. In this respect, autobiography is an integral part of the oeuvreI. It is not the case with life story, which is stimulated by the researcher; the narrator doesn’t speak spontaneously and is driven neither by moralisation nor by summarising eras, though moralisation may be present in judging some issues. A further difference is that the author of the autobiography lays a strong emphasis on his/her childhood, the landscape, objects, his/her experiences, the intellectual climate of the era, ideologies, persons, etc., and, last, but not least, the interpretation and meaning of these. A life story narrator is much less talkative in this respect because even the intentions of researcher are not obvious for him/her, the physical presence of the researcher and the fact that temporal frames are fixed in advance have a constraining effect. Besides, there are some events a life story narrator is not very keen on speaking of, rather, he/she suppresses them. However, it can be said about both narrative story forms that complete and perfect recollection of the past is almost impossible. In these two types of narrative story forms – see Figure 1 and 2 ‐ , despite of the differences mentioned above, their form can be seen as common. Both have an introduction, discussion and an end; both are sequential, that is, as for their content, home – school – work is the spatial‐temporal frame. Both view the past and the future from the perspective of the present. Their basic structure is also common; the basis of the elaboration of the narrated stories (experiences, desires) is the narration of the life course. Both are documents; the reliability of life course can be checked by involving other archival data. The narrated story belongs to the category of subjective truth. From a phenomenological point of view, it is of key importance because it is the narrated story that shows us the way the narrator sees himself, how he makes himself seen and how he constructs his identity in the context of lived experience and what meaning he attributes to this. For the social researcher14, understanding interpreting and explaining this is as important as the factual data of life course. This is why we have suggested, in opposition to the Chicago School and contemporary German and
14 See Pászka 2009:284.

THE STRUCTURE OF NARRATIVE FORMS
217
Englisg „biography method” that analyses the life story of one person, the interpretation of life story sets, which investigates the sociodemographical and sociogeographical life story database of several persons by an interpretative, contextualist method. In this method life course data can be transformed into statistical data sets the same way as in the case of survey data. The difference is that the former consist of much more and more diversified information. This can open new interperational perspectives for the researcher (of course, this depends on his intentions.) Narrated stories can be divided into thematic fields where chronologised life course episodes are confronted by synchronical episodes. Here, there is an opportunity for the researcher to contextualise the worldview of the narrator, in other words, to embed his knowledge into a given social space. In both narrative story forms narrators emphasize spatial, temporal and and social boundaries directly experiencable for them: here or there, we or them, sooner or later, before or after, at a time etc. It is these boundary markers that make it possible to create a unified perspective, a Gestalt, the profile of a narrative story form. Meanwhile, for the individual, these boundaries are full of Lebensgefühl. However, relating intratextual (life story, autobiography) and extratextual (sociocultural context) grounds to each other makes a kind of knowledge set inevitable. We can obtain this only by studying as many narrative story as possible. Thus, we can visualize the way the the knowledge elements of nowadays are integrated and those of the old ones are actualised and associated in the narrated life stories of the given persons (in aggregated form: groups). Summarizing the topic; individuals arrange and form relations with others in the events consciously or unconsciously in their everyday interrelation, the point of these relations, namely why they were formed, and how they are operated, give the raw material for analyzing the narrative historical‐story forms. When analyzing narrative story forms, the attention is not on the events but on the fact how individuals experience and interpret – how do they see, how did they see, and how they let them see – their roles in the events as they reflect upon them.
REFERENCES
Bruner, J. (1986). Actual Minds. Possible Worlds. Cambridge: Harvard University Press. Bruner, J. (1993). The Auobiographical Process. In R. Falkenflik (ed.): The Culture of
Autobiography. Constructions of SelfRepresentation. Stanford: Stanford University Press, pp. 38‐56.
Burgos, M. (1979). Sujet historique au sujet fictiff: le probléme de l’histoire de la vie. Information sur les sciences socials, 18., (1): 27‐43.

IMRE PÁSZKA
218
Denzin, K.N. (1985). A Contraversy Over the ‘Method’ vs. ‘Interpretation’. Biography and Society. Newsletter 4: 5‐10.
Erikson, E.H. (2002). Gyermekkor és társadalom [Childhood and Society]. Budapest: Osiris Kiadó.
Geertz, C. (1983). Local Knowledge. Fact and Law in Comparative Perspective. In: Local Knowledge. New York: Basic Books, pp. 167‐234.
Greimas, A. (1987). Essais Semantiques. Paris. Seuil. Heller, Á. (1998). Bicikliző majom. Életés korrajz [The Biking Monkey. Life and Narratives].
Budapest: Múlt és Jövő Könyvek. Kohli, M. (1978). Soziologie des Lebenslauf. Darmstadt: Luchterland. Kohli, M. (1990). Társadalmi idő és egyéni idő. Az életút a modern társadalom
szerkezetválozásában [Social time and individual time]. In Gellériné Lázár Mária (ed.): Időben élni. Történetiszociológiai tanulmányok. Budapest: Akadémiai Kiadó, pp. 175‐212.
Kovách, I. (2006). Társadalmi metszetek. Hatalom, érdek, individualizáció és egyenlőtlenségek a mai Magyarországon. [Social Portrays. Power, Interest, Individualiation and Inequalities in Hungary]. Budapest: Napvilág Kiadó.
Mattelart, A. (1991). La communicationmonde: histoire des idées et des strategies. Paris: La Découverte.
Niedermüller, P. (1988). Élettörténet és életrajzi elbeszélés [Biographies and Life Narratives]. Etnográphia. XCIX: 376‐388.
Pászka, I. (2007). Narratív történetformák a megértő szociológia nézőpontjából. [Life narratives from the point of view of comprehensive sociology]. First Edition. Szeged: Belevedere Kiadó
Pászka, I. (2007). Narratív történetformák a megértő szociológia nézőpontjából. [Life narratives from the point of view of comprehensive sociology]. Second Edition (Revised). Szeged: Belevedere Kiadó
Pászka, I. (2010). Elit, elitek a lokális kistérségi társadalomban [Elites, and elites in localized small communities]. Szeged: Szegedi Egyetem Kiadó.
Plummer, K. (1983). Documents of Life. London: Allen and Inwin. Ricoeur, P. (1999). Válogatott irodalomelméleti tanulmányok. Budapest. Osiris Kiadó. Rosebthal, G. and Fischer, R.W. (2000). Analyse narrative‐biografischer Interviews. In: U.
Flik (Ed.) Qualitative Forschung. Eine Handbuch. Stuttgart: Ronolt, pp. 456‐467. Sartre, J.P. (1976). Módszer, történelem, egyén [Method, History, and the Individual].
Budapest. Gondolat Kiadó. Schapp, W. (1976). In Geschichten verstrickt. Wiesbaden: B. Heymann. Schütz, A. and Lukmann, Th. (1984). Az életvilág strukúrái [The Structure of the Lifeworld].
In M. Hernádi, and M. Vajda (eds.) A fenomenológia a társadalomtudományokban [Phenomenological Approaches in Social Sciences]. Budapest: Gondolat Kiadó. pp. 269‐320.
Szilágyi, M. (2003). Irodalom és társadalomtörténet [Literature and Social History]. In Z. Bódy and J. Kovács (eds.): Bevezetés a társadalomtörténetbe, pp. 559‐572.

STUDIA UNIVERSITATIS BABEŞ‐BOLYAI, SOCIOLOGIA, LV, 1, 2010
Methodological Forum:
Creative and Critical Sociology for the TwentyFirst Century
Foreword
NORBERT PETROVICI*, RALUCA SOREANU**, ANCA SIMIONCA***
ethodology does not unfold as a separate domain of scholarly practice, isolated from epistemology and ontology. It is not a technical domain. While
it is often construed as autonomous, it remains a site of struggle, of conflict and alliance, where both the opening and the foreclosure of thinking space can occur. In this forum, we chose to treat it as a site for expressing our sociological imagination, rather than a site for an organised exercise of technical skill, implicated in the construction and confirmation of epistemic authority. The pursuit of an integrated view on methodology, epistemology and ontology, and the affirmation of methodology as one of the domains of the sociological imagination are not without critical stakes. The link from methodology to precision, in the sense of following strict protocols for generating and organising evidence, is a positivist route, and it often produces deeply impoverishing consequences for the sociological endeavour. Therefore, a critique of positivism, and of its institutional, intellectual, and emotional modes of operation is part and parcel of this revisiting of what methodology is and what it can be. Norbert Petrovici argues that methodology reduced to a set of technicalities has become a credible proxy for scientific objectivity given the particular fields of power in which sociology has been practiced in Romania since the 70s. The way of imagining the space and the objects that populate it made certain brands of methodologies plausible. These methodologies were further enforced by the expectations of politicians, bureaucrats and later on by those of the managers employing the sociologist. Raluca Soreanu shows how metaphors can be used in the realm of methodology, with critical aims, so as to put localities in a state
* Faculty of Sociology and Social Work, “Babeş‐Bolyai” University Cluj‐Napoca, [email protected]
** New York University and University College London, [email protected] *** Central European University, simionca_anca@ceu‐budapest.edu
M
NORBERT PETROVICI, RALUCA SOREANU, ANCA SIMIONCA
220
of emergence and to reveal hierarchy. The fact that metaphor often remains unacknowledged in the activity of social critique is seen as an effect of positivism being a complex and enduring regime of resonance with objects, emerging in a particular historical conjuncture, having its preferred emotional modalities, and its distinctive stylistic choices. Anca Simionca draws attention to the fact that by producing accounts about people’s understandings and practices of work, social scientists become implicitly involved in a process that can both reinforce and challenge societal definitions of subjects of worth. She discusses the potential of several methodological approaches – among which Sequence Analysis – for making this involvement a politically aware and responsible one. Our politics is that of heterogeneous alliance: the voices of this forum come from or go to different theoretical homes, either Marxian, feminist, poststructuralist, or pragmatist, to name but some of the lineages of thought that run through our discussion. In our current epistemological conjuncture, where the demise of positivist modalities is often postulated, but rarely generates its effects in the activities of knowledge production, alliances are much needed. We contrast our politics of heterogeneous alliance with a politics of synthesis: in other words, we do not aspire to any post‐positivist synthesis. A politics of synthesis stifles creative difference and claims space in the name of a deradicalised middle ground; a politics of heterogeneous alliance cultivates difference and claims space for dialogue between distinct positions. We thus aim to contribute to strengthening the possibilities for dialogue of post‐positivist sociologies, and their specific creativities, rather than reinforcing the distinction between positivism and post‐positivism. As the spirit of our argument goes, the possibilities for creative, critical, and often untoward alliances exist beyond academic publication. They depend on local amalgamations of people, objects, and ideas, in individual departments, institutes, universities, or even between them. Ultimately, we are in search of local epistemic fields of debate, where the investment in understanding hierarchy in knowledge production goes along with an investment in destabilising hierarchy, with the aim of a more pluralist sociology, in both exercises of contestation and in exercises of alliance. The critical sociologist of the twenty‐first century is not one given to cynicism, to technicalism, to narrow specialism, to descriptivism, and to a sociology of surfaces; she is, instead, committed to understanding the conditions that make her knowledge a possibility in the first place, attentive to her own inwardness, and to the historical forces that draw her to and pull her away from objects.

STUDIA UNIVERSITATIS BABEŞ‐BOLYAI, SOCIOLOGIA, LV, 1, 2010
CORRUPT KNOWLEDGE AND THE QUEST FOR OBJECTIVITY: A CRITIQUE OF THE ROMANIAN POSITIVIST SOCIOLOGY
NORBERT PETROVICI* ABSTRACT. The paper engages the case of the Romanian resurgent positivism after 1970s in the line of criticism opened by postmodernist, Marxist and feminist thinking. I situate Romanian positivism in the wider world system transformations as a plausible and pertinent strategy of doing science in particular fields of power with a certain historicity. I do not deconstruct science as a corrupt endeavour or reject science altogether, but I engage positivism critically through an alternative way of imagining objectivity as a process of creating falsifiable theories. Data has meaning only in relation to some theory, in relation to the effort of disproving some theoretical statement by accommodating anomalies in a continual effort to reconstruct some analytical framework. This is not just an alternative way of doing science, which can assist and counterbalance the specific weaknesses of positivism. In fact, these are two competing perspective for envisioning objectivity in social sciences, with hegemonic claims, coded in institutions, individual careers, and intelligibility maps with policy effects.
Keywords: positivism, Romanian sociology, critical social science, representativity, generalizable explanations
As social scientists our daily lives are interwoven in complicated ways with the very world and people that we are supposed to investigate. We inhabit the very object of our study. This condition triggers two different responses, manifested in two ways of engaging society: containment or involvement. The first strategy is to take all necessary precautions to sterilize the intervention of the researcher, so as not to contaminate the evidence extracted from the investigated reality. Objectivity and the scientific character of science are produced by bracketing the external influences, in order to guarantee the accuracy and replicability of data and their interpretation. This is the positivist strategy. The second approach is to take this peculiar predicament of being in the world and transform it into the very possibility of investigation. The analyst engages the object of study by minimizing the distance to the subject, through participation and involvement. As part of the investigated world, the researcher approaches it through dialogue, and uses theory as the main tool to make sense of it. This is the critical strategy.
* Faculty of Sociology and Social Work, “Babeş‐Bolyai” University Cluj‐Napoca, [email protected]

NORBERT PETROVICI
222
Following the line opened by Kuhn (1962), Popper (1963), and Lakatos (1978), Burawoy argues that, for the critical researcher, “objectivity is not measured by procedures that assure an accurate mapping of the world, but by the growth of knowledge, that is, the imaginative and parsimonious reconstruction of theory to accommodate anomalies” (2009: 21).1 Objectivity and the scientific character of science are produced through cognitive mapping of the world, by generalizable explanations and falsifiable theories, while engaging it actively. Burawoy (2009) further argues that these are two parallel strategies for doing science that can and must coexist as complementary methods. Reflexivity, both as individual self‐monitoring of behaviour and as group‐monitoring of the scientific results by scientists, has different pertinent rules for the two strategies. Positivist reflexivity monitors the context effect of the production and interpretation of data and the possible contamination effects of the object of study by the subjectivity of the researcher. Critical reflexivity monitors the power effects of the dialogical involvement in the world, by constantly questioning the cognitive maps through which the scientist involves the world practically. These two research strategies, however, are not just complementary, but competing. The critical strategy has long pointed that the object‐subject distance is an active product of interactional and emotional “detachment” (see Soreanu, 2010 in this issue) that produces and depends on unproblematized relations of power. The process of distancing from the object of study obscures the actual field of power in which the distancing is produced. Postmodernist and feminist scholarship heavily criticizes the positivist focus on minimization of distortion through reliable and stable instruments (Houghton, 2008). Lyotard (1984) historicized the stable social objects of research, by pointing out that they were embedded in the ‘grand histoire’ of ‘modernist metanarratives,’ destabilized by the postindustrial emerging multiplicity of ‘petites histories.’ Derrida (1974) criticized the stability of significance and interpretation through deconstruction and grammatology. Foucault (1972, 1980) showed that knowledge is produced in fields of power, and that truth is always a product of ‘regimes of truth.’ Clifford and Marcus (1986) and the whole ‘writing culture’ movement addressed the normalization and objectification effect produced by positivist distancing Haraway (1991) pleaded for networks of ‘situated knowledge,’ that acknowledge the political character of knowledge production. Despite extensive discussion of the effects of power involved in the process of research, positivism has been ‘surprisingly resilient’ (Steinmetz, 2005). The enduring presence of positivism is not just a matter of some social science internal dynamics, but there are wider forces at work conspiring for its continuous vitality (Foucault, 1972; Lukács, 1972/1922; Latour, 1993; Adorno, 2000/ 1957; Bourdieu, 2004; G Steinmetz, 2005). 1 Burawoy distinguishes between positivist science and reflexive science. Positivism nevertheless is reflexive about research strategies, devised to minimize contaminations of the data. I use the label ‘critical’ in the sense of the critical tradition concerned with the power/knowledge nexus.

CORRUPT KNOWLEDGE AND THE QUEST FOR OBJECTIVITY: A CRITIQUE OF THE ROMANIAN POSITIVIST SOCIOLOGY
223
Positivism can be understood as a composite formed by particular (a) epistemological prescriptions, (b) ontological presuppositions, and (c) practices in organizing science production. Certain social formations make possible specific ontologies and scientific practices, conducing to specific epistemologies. Steinmetz (2005) argues that the postwar positivist consensus in sociology was linked to the Fordist mode of production and regulation of the workforce. In the postwar context, the Fordist standardization of space, time, and culture through national economies of scale and through mass production and mass consumption, made plausible the ontological assumption of a flat world of stable entities within national state spaces, quantifiable into predictive models. In addition, the specific practices of managing science by the nation‐state and private funding favored a scientist sociology enrolled in the logic of offering a competitive edge to the core capitalist nation, as opposed to competing other nation‐states in a particular polarized geopolitical context (Mirowski, 2005; G Steinmetz, 2005; Nugent, 2010). The 1970s post‐Fordist transformation of the world‐system put under considerable strain the previous stable core capitalist ontology. A growing literature argues that under the current neo‐liberal regulatory framework and uneven development in governance instruments, space has become increasingly fragmented (Taylor, 2003; Brenner, 2004; Thrift and Olds, 2004). It is difficult to maintain epistemologies that assume a stable and smooth world, in the context of unequal and incoherent globalization, which affects not just the peripheries, as was previously the case, but the core economies too. New types of epistemologies are thus made possible: feminist, historical, cultural or Marxist turns are becoming more and more important in Western universities. Still, they are a long way from becoming established, and under the risk of being domesticated by hegemonic positivism and its associated practices of social organization of science (Calhoun, 1996). Given the fragmentary geographies of neoliberalism, the conditions of possibility of positivism are not uniform across the world‐system. The local structures of micropower are subverting, altering and remodeling the wider forces at work, producing particular local ontologies and epistemic readings of the social world. Focusing on the Romanian sociological field, I address positivism through the specificity of a case. The post 1970s socialist economy of scale and its distinct ontology and practices set the basis for a strong positivist orientation, while the postsocialist reconfiguration of the state and the emerging markets transformed, yet maintained positivism as dominant strategy. In what follows I engage the case of the peripheral Romanian resurgent positivism after 1970s in the line of criticism opened by postmodernist and feminist thinking. I situate Romanian positivism as a plausible and pertinent strategy of doing science in particular fields of power with a certain historicity. This does not mean I will attempt to deconstruct science as a corrupt endeavor. Postmodernism has done much to objectify power effects in the structuring of knowledge, yet “rather than make do with an inadequate science, it rejects
NORBERT PETROVICI
224
science altogether” (Burawoy, 2009:25). While not rejecting science altogether, I find problematic Burawoy’s (2009) argument that the positivist and the critical models of science can assist each other to counterbalance their specific weaknesses. I see them as rather competing visions with hegemonic claims, coded in institutions, individual careers, and intelligibility maps with policy effects. It is not just a case of internal scientific divide, in which scientists are fighting in uncommitted ways for their quest for knowledge. At stake is what science in itself is and what kind of statements pass as empirically grounded. In the next section I advance a working definition of positivism. I then discuss the plausibility of positivism in socialism and postsocialism in Romania. In the final section I consider comparatively the two models of science and grounded statements. Positivism as link between epistemology, ontology and practice
Positivism in sociology originates in Auguste Comte’s project to replace metaphysics with a science of society based on universal laws. Present day positivism is more tributary to the Chicago School and Paul Lazarsfeld than to Comte’s attempt to create a master science integrating all other disciplines for the greater benefit and progress of human mankind (Banniste, 1987). At the core of this strategy of engaging the social world is the rigorous demarcation of an external world, for which general law‐like statements are to be produced. To this end, researchers have to follow certain epistemological guidelines for obtaining procedural objectivity, ontological assumptions insuring that such procedural objectivity is possible, and a set of practices aiming to maximize the chance of estrangement. Positivist epistemological prescriptions can be best synthesized with Katz’s (1983) ‘4Rs’: reactivity, reliability, replicability, representativeness (see also Mills and Huberman, 1994; Burawoy, 2009). The researcher should keep appropriate distance from the object of inquiry to avoid distorting the results; this requirement is to prevent reactivity. Reliability refers to the search for trans‐subjective criteria that produce stable observations across time and space. The instruments used for probing the reality and the techniques used to interpret the data should measure and reduce the infinite reality in the same manner on every instance. The purpose is to create selection codes that can be used for cross‐validation by other scientists that replicate the research (if certain conditions are controlled for). The researcher examines typical cases, phenomena, situations or processes in order to assess if they are representative for the totality they stand as part. This type of epistemological prescription for data and interpretation accuracy is based on a set of minimal ontological assumptions about reality, which ensure that objects can indeed be separated from subjects: reality is composed of discrete and stable entities displayed on a visible surface (empiricism); these

CORRUPT KNOWLEDGE AND THE QUEST FOR OBJECTIVITY: A CRITIQUE OF THE ROMANIAN POSITIVIST SOCIOLOGY
225
entities are linked causally in a steady way across time and space (Humean causality); and quantifying these entities and their relations offers the chance of prediction (scientism) (Kolakowski, 1993; Collier, 2005; G Steinmetz, 2005). Empiricism is linked with the idea that the reality is single layered and can be reduced to its phenomenality. Unobserved entities and relations are excluded from analysis, which comprises only observable behaviors and objects. If current social statistics works with latent variables and abstract entities, in this particular empiricist ontology they serve only a classificatory purpose, summarizing the variance of observable entities that share the same ontological status with manifest variables. In this flat world, relations are represented in terms of Humean ‘constant conjunctions’ causality, where entities retain their identity across space and time, and the relations among them are an effect of their ontological stability. Scientism refers to the preference for decontextualization through quantification, following the logic of natural sciences. Estrangement rests on a set of practices that enable the separation of the various phases of engaging the reality: formulation of research questions, design of instruments, investigation, basic interpretation, and theorizing. Conception is disconnected from execution, and sociological experts divide research operations into minute tasks within an encompassing division of labor, in order to minimize contamination effects. The standardization of the process through predefined protocols ensures replicability and guarantees a certain level of quality for the data. Theory can be bracketed, if protocols for data production are followed. This generates a clear division between theoretical work and technical work. Even if it plays an important role in crafting reliable instruments, theory is reduced to simply a tool. Substantial interpretation of data, beyond statistical technicalities and visual representation of results, is externalized to specialists in theory. This division of labor is especially well suited for survey analysis, but in practice it is also employed in analyzing semi‐standardized interviews and focus‐groups. Qualitative data too is gathered according to the injunctions of the 4Rs (Katz, 1983; Mills and Huberman, 1994). I argue that, as a model of engaging social reality beyond the internal dynamics of the social scientific field, positivism is linked with the way objects are constituted in the greater fields of intelligibility and praxis in society. While sociological fields have their inner logic of selecting relevant research themes and constituting research objects, there is continuity between folk and scientific theories of envisioning and appropriating reality. The structure of the wider social world favors particular ways of imagining objects and their relations, generating particular uses and appropriations of reality. Next I discuss some aspects of the socialist and postsocialist imaginaries of object‐space distribution, and their relation to sociological imagination in Romania. This will reveal how the ways objects are appropriated in research are linked to praxis.
NORBERT PETROVICI
226
Socialism: neutral functionalism
Ontology. Starting with the 1970 and the advent of Ceausescu’s nationalist neo‐Stalinism, Romania embarked on a second industrialization, departing from the course of moderate marketization adopted by most countries of the socialist bloc. New economies of scale embedded in nationalist triumphalism were changing the face of the major cities of the country. New infrastructural projects were unmaking and remaking the fate of various regions in Romania. Mass production and standardized products were reaching the population according to pre‐given quotas and algorithms devised by the socialist regime. One peculiarity of such plan‐based coordination was that each level relied on inferior levels, bringing the system heavily dependent of the lowest level (Kornai, 1992; Kideckel, 1993). Disciplinary power in the socialist factory did not target workers at capillary level, individualizing them, quite to the contrary, it relied on autonomous collectivities (N. Petrovici, 2010). The totalizing effect of the plan was not intentional. Rather, it resulted from constraints on the disciplinary power of the management, exercised by the bargaining power of the lower levels. The neo‐Stalinist power techniques however targeted particular individuals as political entities, as socialist politics relied on productive docile bodies depleted of political strength. Acts of open dissatisfaction were tolerated only as long as they were a strict response to productive duties; the same gestures could have been given differently sanctioned if read as acts of insubordination (Petrovici, 2009). The socialist world was composed of totalizing orders and collectivities, where individualization occurred only in the form of political subjects. This generated a strange ontology of the social world, made of bounded spaces of subjects negotiating their place in totalizing hierarchies, while avoiding individualization as political subject. The neo‐Stalinist disciplinary regimes produced unexpected totalizing geographies, with parochial local orders assembled together through chaotic hierarchies (Petrovici, 2009). Practices. Working for planning agencies, sociologists were given the task to measure the social, and to distribute resources according to bureaucratic mechanisms and political negotiations. The sociologists employed by the university in Cluj in the 1980s, for example, were involved in gathering data about all localities in the county, in order to classify them by to their economic and social importance. The process was consequential for the fate of localities, because centrally redistributed resources were negotiated according to this classification. Officially, during the 1980s, sociology had been dismantled as formal academic discipline, on the grounds of being a bourgeois science. However, through local negotiations and hierarchy struggles, it survived institutionally as a sub‐department within history and philosophy faculties, and as a practice in planning institutions. Max Weber’s theory of social action and value‐neutral social science became instrumental in a system that sought the de‐conceptualization of the discipline and its transformation into a harmless and uncritical statistical

CORRUPT KNOWLEDGE AND THE QUEST FOR OBJECTIVITY: A CRITIQUE OF THE ROMANIAN POSITIVIST SOCIOLOGY
227
instrument. As long as sociology integrated in the productive order of planning and offered valuable technical narratives, it was permitted to survive and reproduce. At the beginning of the 1980s, half of the university graduates in Romania were engineers, ready to fill the vacancies in the expanding industrial sector. The greatest part of the Romanian intelligentsia was technically oriented, and the technicist and depoliticized world‐view became dominant in the wider fields of power (see Culic, 1999; Tismăneanu, 2003). A technical sociology with scientist claims about the population was instrumental for other professionals (such as planners or architects) to obtain leverage in local negotiations. Functionalist and methodological positivism constituted a means to communicate social research results to those who demanded them, and to a wider audience. Sociology thus progressively combined a value‐free structural‐functionalist theoretical position with a scientist methodology concerned to capture in numbers the de‐politicized social reality. Weber was filtered through Merton and rational actor theory in order to empirically capture quality of life, organization efficiency, urbanization processes and demographical change. During this period of time, a new generation of sociologists, educated abroad, entered the scene. Taking advantage of the regime opening at the end of the 1960s, they experienced the critical movement against functionalism emerging in both European and American universities. New theories and epistemologies traversed for a fleeting moment the Romanian academic milieu, in synchronization with western scholarship. This, however, did not last long, as macrostructural conditions and parochial social geographies summoned sociology back to its technicist and scientist purpose. Power and knowledge. This orientation of the Romanian sociology constituted itself as an important opportunity during the postsocialist transformations. Formally reinstated as academic discipline, sociology flourished through the new generations of sociologists, trained in the spirit of sound technical‐methodological proficiency and sophisticated abstract theorizing, if partial to functionalism and rational actor theory. They inherited the commandment of value‐free social science, understood as political sterilization of knowledge, and the practice of reflexivity curtailed to discussions about measurement errors and soundness of data.
First socialist decade: neutral political advisers
Ontology. The beginning of neoliberal policies in Romania can be traced already in the 1990s. Unemployment soured, violent social movements disrupted the fragile social fabric, and marginality and social inequalities became highly visible. The first postsocialist debates concerned the logic and pace of privatization, regarded as the main means to create capitalist property and responsible management. They were fueled by the Washington Consensus, IMF and World

NORBERT PETROVICI
228
Bank, and the neoliberal prescription to deregulate and roll back the state. In advanced neoliberal democracies, the modern experience of power is a result of the rules of ordering put in motion by complex networks of political apparatuses and non‐political organizations. The rolling back of the core capitalist states, while supposedly the market takes over, is in fact a new way of organizing state power (Rose and Miller, 2008), in which self‐regulated locales achieve increased importance. In the Eastern European periphery, the new power technologies display severe disfunctionalities. The infrastructurally weak Romanian state lacked the power instruments to penetrate society and economy, directly impacting its capacity to access resources and collect revenues. It thus forced new waves of regulations, which ended up thickening the bureaucratic procedures, without actually enhancing its infrastructural penetration. Their effect was to weaken state’s extraction capacity even more, calling for further tides of national regulation strategies. As a consequence, the back‐and‐force state became a constant presence throughout the national space, creating bounded spatial effects on a faint vision of self‐regulating market.2 Such a system continued to support an ontological reading of the social as a centrally organized container space, inhabited by clear‐cut objects, and determined by causality. Its methodological counterpart however was driven by practical necessity. Practices. The political parties of the first postsocialist decade were composed mostly of engineers (Stefan, 2004; Petrovici, 2006) with a technicist and de‐politicized understanding of issues of population control (Culic, 2002; Popescu, 2004). They translated social problems into technical problems of managing the needy, which required the intervention of qualified ‘population technicians’ (Pasti, 1997). Sociologists were summoned to draft social policies, to survey the population, to make transparent people’s opinions, fears and expectations, to manage the image of politicians, and, most importantly, to propose solutions to an ever greater range of social problems emerging as the state retreated from the economy. New sociological departments formed at the major universities in the country. Research institutes specializing in various policy areas were set up, managed by former socialist planners and taking over emerging services markets. While not quite attaining power in steering state affairs (Pasti, 1997; Boda, 1999; Zamfir, 2009), sociologists were part of the process of reforming the state as advisors of top politicians, providers of key resources in understanding ‘the real world’ through ‘scientifically’ produced data. In the new realignment of the postsocialist state, methodological positivism and various functionalist orientations proved to be instrumental once again. Power and knowledge. The relations between the social conditions of knowledge production and its epistemic prescriptions did not enter professional debates of postsocialist sociology. The value‐free sociology requirement, driven 2 For a more elaborate argumentation and field research see Petrovici (2009). For similar arguments see Culic (2010).
CORRUPT KNOWLEDGE AND THE QUEST FOR OBJECTIVITY: A CRITIQUE OF THE ROMANIAN POSITIVIST SOCIOLOGY
229
by containment strategies and policy questions about the best ways to reform the postsocialist state, continued to inhibit epistemological reflexivity. In fact, epistemological reflexivity narrowly focused on technical fidelity and validity measurement issues. Reality became an ever flat layer to be interrogated with specific tools: properly formulated research questions and appropriately designed surveys, providing objective solutions. Sociology became a tool for finding out causal mechanisms, offering the politician or state bureaucrat the possibility to make the right decision: ‘savoir pour prevoir, prevoir pour pouvoir’. The close knit between knowledge needs of policy‐making and ‘scientific’ arguments to justify it shaped the major issues of Romanian sociology (social values, mentalities, quality of life, the welfare state, top down modernization, institutional reforms, etc.). While I do not maintain that power corrupts knowledge, I argue that reality is concept‐dependent and cases do not exist entirely independent of the observer and their interest. Reality is not a fabrication of the analytical perspective distorted by power, and it unquestionably has some exteriority to the researcher and their definition of the object of study. Reality is an important exterior ingredient in the texture of the analytical endeavour. Or, in Bashkar’s (1993:4) critical realist celebrated formulation, a position that I also endorse, ‘ontology is in fact irreducible to epistemology’, the domain of the real cannot be reduced to the domain of the actual – that which is available through human senses. To discover reality we need analytical lenses that go beyond the world available through direct experience. The conceptual and practical expectations are extremely important in producing meaningful images about a rich multi‐layered world. This has been a crucial point for the epistemological reconstructions of sociology in the post‐Kuhnian era. Foucault (1972) argues that discourses are not just groups of signs that reflect or represent social meaning, but that they organize any meaningful thought. Objects cannot be imagined as something external to discourses, the very epistemological existence of an object is granted through discursive meaning. Laclau and Mouffe (1985) radicalize the concept of discourse by emphasizing that nothing can exist outside discourses because while a discourse creates certain possibilities, it excludes others. A discourse both enables and constraints what can be known, it mediates the social existence of objects. Critiques pointed out that society became ‘a totally open discursive field’ (Hall, 1996:146). Yet, as Carrabine (2004) correctly observes, Laclau and Mouffe’s assertion refers to the fact that objects, either material or social entities, do not have fix meaning but they become meaningful in a discursive formation. Objects may have an extradiscursive existence, but they acquire social and historical meaning only through discourses. Thus, knowledge is neither corrupted by, nor independent of the social relations within which it is produced. The relational character of meaning and its organization in discourses makes impossible a final fixation. The crux of Laclau and Mouffe’s argument (1985) is that power lies not in the content of

NORBERT PETROVICI
230
knowledge, but in its form; power reigns in all historical fixed meaning. The issue is not if something represents or misrepresents, but how is something fixed in a representation. This is because the relationship between discourses and subjectivity is not one of distortion or dishonesty. Reality cannot be known indisputably, and social sciences may approach it through empirically falsifiable explanations. Meaning cannot mask reality; it can only represent different possibilities and the relation of these possibilities with each other. Power cannot be bracketed; the position of the researchers, clients and their analytical expectation cannot be put aside. Second Postsocialist decade: neutral marketers
Ontology. In the second postsocialist decade many Romanians benefited from the opportunities offered by the European labor market, academic institutions or tourist resorts. The Romanian national space though was still not vanishing. The European Union put pressure on central state institutions to devolve regulatory powers to the market and intermediate bodies, similar to its core capitalist states. This only added to the chaotic back and forth waves of institutionalization and retreat of the first postsocialist decade (see also Dunn, 2008). The political discourse of ‘big corruption’ that prevailed during these years insisted that had the state been managed by law‐abiding politicians, the whole nation would have had a different fate. Here is the same logic of a centrally dependant world of objects sustained or destroyed by centralized forces: an imaginary world that makes possible ontologies where objects inhabit contained spaces, with clear prime movers and fields of causality. Practices. In addition to the stability of these ontologies, positivism was reinforced and remade by the changing practices of doing sociology. A particularly important turning point was 1997 when a liberal government embarked in massive economic reforms and privatization. The present day successful firms had been founded at that time, and their managers, most of them former socialist engineers or polytechnics graduates (Pasti, 2006), defined themselves and their businesses in opposition to the old socialist managerial style that had been prevalent in the first postsocialist decade (see also Yurchak, 2003). Formed at the school of informal adjustment and tough resource negotiation in a shortage economy, the latter were undoubtedly prepared for the unregulated and disorganized market, and enjoyed important political connections. They had gradually become obsolete with the advent of a group of young managers in their thirties, whose de‐novo firms were organized around a new set of competitive codes and practices (A. Petrovici, 2010). What distinguished, among others, one cohort from the other, was the set of neo‐liberal values, and, more significantly, contrasting versions of entrepreneurial masculinities, to use the term coined by Allen (Allen et al., 1998). While older managers pulled their identity around the values of paternalism

CORRUPT KNOWLEDGE AND THE QUEST FOR OBJECTIVITY: A CRITIQUE OF THE ROMANIAN POSITIVIST SOCIOLOGY
231
and consensual approach, the young managers practiced, like their core capitalist states counterparts, a more macho and aggressive masculinity (McDowell, 1997). The macrostabilization and economic growth that began in 2000 in Romania led to a new spatial reorganization around several new urban junctions, and cities like Bucharest, Cluj, Iasi, and Timisoara enjoyed developing markets with a thriving service sector. During these years, a new generation of market research firms and sociological institutions were set up in the major Romanian cities. Sociologists did not escape this kind of repositioning and they too played the card of hard‐nose competitive masculinity. Most of the sociologists in the academia and at the top of research firms were men, and interacted with other men on the service market. Moreover, the boundary between academia and business was frail, as the managers of the most important research firms also held academic positions. Women, too, were important, and they were especially central in appropriating resources, funds and opportunities distributed through various NGOs, multinational research institutions and international academic teams. Especially important, in this respect were The World Bank’ Social Capital Initiative launched at the beginning of 1997 and the Open Society Foundation’s Public Opinion Barometer program re‐defined under a different concept in 1998. But the emerging ethos was that of an entrepreneurial masculinity technically oriented and increasingly neoliberal. The ‘managerial report’ became the dominant sociological product, in which the market was presented to investors through frequencies, cross tabulations, graphics, and interview quotations. More importantly, various market research practices and styles of reporting entered academia and academic research. Power and knowledge. The main aim in market research is to target and survey consumer behavior across space and time. Therefore, the national space is divided in subpopulations, whose behaviors are readily available for scrutiny through various methodological means. The market report is distorted when some individuals evade observation or hide some information. Thus, the central challenge becomes to cover all relevant cases and to account for possible non‐answers, in order to obtain a representative description of consumer satisfaction and needs. A multi layered deep reality is highly problematic for this kind of research, because unobservable entities have to be defended analytically in theoretical terms, a very delicate issue for the relationship with non‐specialist clients. This problem is bypassed by drawing a clear distinction between applied sociology and theoretical sociology, between the practitioner and the theorist. The practitioner presents the data to the client as such – the way reality presents itself, with minimal effort at interpretation, to avoid distortion. The job of the theoretician is to theoretically speculate on the basis of the data. Such an imagined division of labour reproduces the expectation of a value‐free sociology, in which the researcher offers a clean image of the world to the client. Yet, most of the time, such innocent analytical strategies offer a highly ideological account, replacing analytical endeavour with pre‐given rudiments of

NORBERT PETROVICI
232
theory taken from, or responding to, client expectations. Practitioner’s version is attuned to the neoliberal schematic market‐based theories, following passable explanations; the theoretician employs more sophisticated arguments, circulated in academic debates. Interviews with managers and various professionals reveal that they experience a complex Romanian bureaucracy, heavily bearing on their daily activities. Therefore, some legislative coherence is needed and more space for self‐regulation. The implication, if such visions are followed, is that the state should retreat and give more room for self‐responsibility. However, a different story is possible using exactly the same narratives, a story that implies a reality with more levels, a deep‐reality with no directly observable entities. A reality in which the state becomes increasingly bureaucratic as it retreats and weakens. The liberal individual capable of self‐regulation on an unconstraint market is possible only if complex technologies of power are put in motion by a strong state. The Romanian state lacks such capabilities, in fact, the increasingly burdensome regulations it creates to fill its regulatory weakness is only deepening it. For a practitioner, a deep reality becomes problematic when reported, because the neo‐liberal manager will hardly buy the story of the regulatory weakness, and the need for policies that give an upper hand to the state. Unobservable entities however, are no less real because they are not observable. Precisely because, as Laclau and Mouffe (1985) argue, objects are not something exterior to discourses, both directly observable and unobservable objects are enabled discursively. Procedural objectivity in the reading of epistemological positivism thus stands, in itself, as guarantee of the validity of the data, while theory is put aside as an inconvenient technicality that can be bought independently as expertise. Yet, expertise is always embodied in concrete persons with a certain legitimacy and authority linked with personal charisma. It rarely stands as disembodied knowledge the same way technicalities of estrangement stand for the practitioner. Theory in this sense is rarely science, it is wisdom. This criticism does not aim to put an embargo on applied sociology, but to engage the practices and ways of envisioning reality that are brought into academia in order to sustain a particular brand of epistemological positivism. Theory, practice and science
Chasing the dream of objectivity in an ontologically delimited world, the neoliberal peripheral brand of positivism equates reliability and replicability with science. A growing Romanian literature addresses the complicated issue of producing accurate measures of the social reality, controlling for the possible influences and distortion brought by the social position of the interviewer and interviewee. It however give little, if any attention to the very position of the researcher in the social field. The issue of power/knowledge is displaced by means of covering all empirical relevant cases across the national space, and
CORRUPT KNOWLEDGE AND THE QUEST FOR OBJECTIVITY: A CRITIQUE OF THE ROMANIAN POSITIVIST SOCIOLOGY
233
controlling for possible systematic bias. Searching for patterns of correlations in population and representativity has been made the leading analytical game, played to achieve goal of scientific generalizable statements. This is the case for both quantitative and qualitative research. Positivist qualitative analysis aspires to cover all relevant situations, logically and empirically. The interpretation is done by coding and recoding in order to decontextualize and reach to generalizations through systematic inspection of data. Theory is an emergent result surfacing the analysis in a grounded way, by accounting in a systematic fashion the variation across situations (Glaser and Strauss, 1967; Strauss, 1987). Other researchers can follow and replicate the steps of the analysis, where categories obtained inductively derive in a clear cut manner from the initial data. Representativity is attained through ‘theoretical sampling’, by covering both typical and extreme cases, and cross‐situational comparison. Theory itself is only an optional stage, arrived at after many complex procedures of data crunching and mining. A stage which, after all, requires the comfort of the academic armchair. This model of imagining science, crucially, conflates empirical generality with conceptual generality. From an analytical point of view, both a single case and a whole representative sample are singularities pertaining to the universality of theory. A lot of energy went into debating the small N sample problem ‐ how many cases are pertinent to draw general conclusions (Skocpol and Somers, 1980; Abbott, 1992; Somers, 1996; Goldthorpe, 2000; G. Steinmetz, 2004). In anthropology, lively debates concentrated on the issue of the accuracy of single ethnographic case studies (Becker, 1958; Hammersley, 1992; Harper, 1992; Mitchell, 2006). They troubled Romanian researchers too, and occupy an important place in debates clarifying the concept of representativity. Yet empirical induction is hardly the basis for theoretical universality. Both a single case and a set of representative cases are singularities that cannot ground universal statements. Popper’s falsification solution to the problem of induction transforms singularities in the very strength of grounding scientific statement in a deductive manner. Both the singular case and the sample play the role of the black swan mobilized as arguments in a recursive process through which theories become less and less bad. In this respect representativity does not equates with producing universal statements – it is only a procedure for establishing the typical character of a case or a relation. A correlation on a sample when generalized to the whole population still remains a singularity that finds its meaning for science only by some reference to a set of theoretical universal statements. In addition, from the Popper‐Kuhn debate it became obvious that the black swans or, in other words, finding anomalies, is a collective effort of whole scientific communities; data has meaning only in relation to some theory, in relation to the effort of disproving some theoretical statement. Theory and data are parallel efforts joint in a recursive way during the research process.
NORBERT PETROVICI
234
Positivism decouples theory from data production and transforms reliability, replicability and representativity in the main tools for generating universality. Certainly, theory is produced in situated fields of power and is always disputable, but bracketing it does not make science more scientific; on the contrary, it deprives the scientist of the instruments of understanding the very positionality of its production. Data matters if they make a difference with regard to some concept, if they say an analytical story, regardless of the fact that an observation holds for all cases in the population or is specific to particular cases. The positivist and critical strategies are not simply options in a neutral academic contest. The logic of statistical representativeness has captured time after time the imagination of social scientists, becoming a legitimate methodological quest for any researcher. Moreover, it has become a prime argument in academic disputes, a powerful dismissive one. To take one example, discussing Brubaker et al.’s (2006) analysis of nationalism in the city of Cluj, Blomqvist (2009) criticizes the lack of representativeness of the city for the whole spectrum of nationalism. Blomqvist (2009:148) notes: ‘the study is not about but in Cluj, but they [the authors] do not really address the question of how representative Cluj is for the rest of Transylvania and how valid the results are for other parts’. He argues that since there are more types of Transylvanian cities by ethnic composition, any theory having Cluj as starting point has to be treated with great caution if some generalization is intended. However, it is beside the point whether Cluj is representative for the way in which nationalism is reframed in postsocialist Transylvania, or more generally in Central and Eastern Europe – most probably, it is not. The purpose of Brubaker and his colleagues was to see whether the case of Cluj can inform an understanding of neo‐nationalism, by suggesting the limits or conditions of this phenomenon, or by providing accounts of interaction and mechanisms. As a particular locality, Cluj plays the role of the falsifying instance in such epistemological strategy, in which the general and the abstract is confronted with the concrete. On the contrary, we may perhaps criticize Brubaker and his colleagues for not being local enough (Poenaru and Pulay, 2009; N. Petrovici, 2010), but not for lack of sampling. The purpose is conceptual adjustment, not empirical generalization. The local becomes in this case a strategic field to refine and deepen the scope of theory. Conclusion
In this essay I discussed several pitfalls of resilient positivism in the social sciences, and the specific situation of Romanian positivism. I also pleaded for a critical approach that reaches objectivity by continual adjustment of theoretical statements through empirical research. The two strategies are not options coexisting peacefully, but two competing visions on what science is and how it is done. In Romania, positivism has become the hegemonic vision in sociology and I argue that this can be attributed to the wider social context, which makes possible specific ontologies and favours particular practices and ways of organizing

CORRUPT KNOWLEDGE AND THE QUEST FOR OBJECTIVITY: A CRITIQUE OF THE ROMANIAN POSITIVIST SOCIOLOGY
235
sociological research. While rooted in socialism, positivism has been fostered by postsocialist transformations of the state. I briefly outlined its major moves and drawbacks, showing how it reduces reality to a thin observable layer that can be understood and deemed objective by minimizing researcher’s involvement in the world, upholds that counting cases or accounting situations suffice for deciphering the analytical texture of a phenomenon, and conceives induction and representativity as the means to attain generalizable explanations. I also showed that much of this research is strongly un‐reflexive and unaware of its ideological dimension, and that it serves an entrepreneurial masculine appetite to tame a passive reality in power games of male managers. These assumptions are present not only in academic texts and the organization of research work. They are entrenched in institutional codes and practices, in the way undergraduate and graduate performance and research work are supervised and assessed. They can be traced in the structure of academic curricula and in the format of internal debates within social science departments. Epistemology has direct effects on careers and life chances of those who pursue an academic path. Acknowledgements
I would like to thank Anca Simionca and Raluca Soreanu for all the support and constant help to clarify my argument. I am grateful to Calin Cotoi, Florin Faje, Calin Goina and Cristina Raț, for ideas, suggestions, and critical comments on earlier drafts of this essay. I am especially indebted to Irina Culic for the great and constant help and pressure put on me clarifying my methodological strategies and the great deal of help in editing and writing this paper. Of course, I alone am responsible for both the opinions and arguments developed in the essay. I am especially indebted to Irina Culic for the great and constant help and pressure put on me, clarifying my methodological strategies and the great deal of help in editing and writing this paper.
REFERENCES
Abbott, A. (1992). What Do Cases Do? In C. Ragin and H. Becker (eds.): What is a Case?
Exploring the Foundations of Social Inquiry. Cambridge: Cambridge University Press, pp. 58‐82.
Adorno, T. (2000/1957). Sociology and Empirical Research. In B. O'Connor (Ed.), The Adorno Reader. Malden: Blackwell Publishers, pp. 174‐193.
Allen, J., Massey, D., and Cochrane, A. (1998). Rethinking the Region. London: Routledge. Banniste, R. (1987). Sociology and Scientism: The American Quest for Objectivity, 18801940.
Chapel Hill: University of North Carolina Press. Becker, H. (1958). Problems of Inference and Proof in Participant Observation.
American Sociological Review, 23: 652‐660.

NORBERT PETROVICI
236
Bhaskar, R. (1993). Dialectic: The Pulse of Freedom. Verso: London. Blomqvist, A. (2009). Competing Historical Narratives. East Central Europe, 36(1): 138‐146. Boda, I. (1999). Cinci ani la Cotroceni [Five Years at Cotroceni]. Bucharest: Evenimentul
Romanesc. Bourdieu, P. (2004). Science of Science and Reflexivity. Cambridge: Polity Press. Brenner, N. (2004). New State Spaces: Urban Governance and the Rescaling of Statehood.
Oxford: Oxford University Press. Brubaker, R., Feischmidt, M., Fox, J., and Grancea, L. (2006). Nationalist Politics and Everyday
Ethnicity in a Transylvanian Town. Princeton: Princeton University Press. Burawoy, M. (2009). The Extended Case Method. Berkeley: University of Califorina Press. Carrabine, E. (2004). Power, Discourse, and Resistance: A Genealogy of the Strangeways
Prison Riot. Aldershot and Burlington: Ashgate Publishing. Clifford, J. and Marcus, G. (1986). Writing Culture. Berkeley: University of California Press. Collier, G. (2005). Critical Realism. In G. Steinmetz (ed.): The Politics of Method in the
Human Sciences: Positivism and its Epistemological Others. Durhaim: Duke University Press, pp. 327‐345.
Culic, I. (1999). The Strategies of Intellectuals: Romania under Communist Rule in Comparative Perspective. In A. Bozóki (ed.): Intellectuals and Politics in Central Europe. Budapest and New York: Central European University Press, pp. 43‐72.
Culic, I. (2002). Câştigătorii. Elita politică şi democratizare în România 19892000 [The Winners. The Political Elite and Democratization in Romania, 19892000]. Cluj‐Napoca: Limes.
Culic, I. (2010). State of Imagination: Embodiments of Immigration Canada. The Sociological Review, 58(3) (forthcoming).
Derrida, J. (1974). Of Grammatology. Baltimore: John Hopkins University Press. Dunn, E. (2008). Postsocialist Spores: Disease, Bodies, and the State in the Republic of
Georgia. American Ethnologist, 35(2): 243‐258. Foucault, M. (1972). The Archaeology of Knowledge. London: Tavistock. Foucault, M. (1980). Power/Knowledge: Selected Interviews and Other Writings, 1972
1977. Brighton: Harvester. Glaser, B., and Strauss, A. (1967). The Discovery of Grounded Theory. Chicago: Aldine. Goldthorpe, J. (2000). Current Issues in Comparative Macrosociology. In On Sociology.
Oxford: Oxfrod University Press, pp. 45‐64. Hall, S. (1996). Who Needs 'Identity’? In Stuart Hall and P. Du Gay (eds.): Questions of
Cultural Identity. New York: Sage Publications. Hammersley, M. (1992). What's Wrong with Ethnography?: Methodological Explorations.
London and New York: Routledge. Haraway, D. (1991). Simians, Cyborgs, and Women. New York: Routledge. Harper, D. (1992). Small Ns and Community Case Studies In C. Ragin and H. Becker
(eds.): What is a Case? Exploring the Foundations of Social Inquiry. Cambridge: Cambridge University Press, pp. 139‐158.

CORRUPT KNOWLEDGE AND THE QUEST FOR OBJECTIVITY: A CRITIQUE OF THE ROMANIAN POSITIVIST SOCIOLOGY
237
Houghton, D.P. (2008). Positivism `vs' Postmodernism: Does Epistemology Make a Difference? International Politics, 45(2), pp. 115‐128.
Katz, J. (1983). A Theory of Qualitative Methodology: The Social System of Analytical Fieldwork. In R. Emerson (ed.): Contemporary Field Research. Prospect Heights: Waveland Press, pp. 127‐148.
Kideckel, D. (1993). The Solitude of Collectivism: Romanian Villagers to the Revolution and Beyond. Ithaca: Cornell University Press.
Kolakowski, L. (1993). An Overall View of Positivism. In M. Hammersley (ed.): Social Research: Philosophy, Politics, and Practice, London, Thousand Oaks, New Delhi: Sage Publications, pp. 1‐9.
Kornai, J. (1992). The Socialist System: The Political Economy of Communism Princeton: Princeton University Press.
Kuhn, T. (1962). The Structure of Scientific Revolutions. Chicago: University of Chicago Press. Laclau, E., and Mouffe, C. (1985). Hegemony and Socialist Strategy: Towards a Radical
Democratic Politics. London: Verso. Lakatos, I. (1978). The Methodology of Scientific Research Programs. Cambridge: Cambridge
University Press. Latour, B. (1993). The Pasteurization of France. Cambridge: Harvard University Press. Lukács, G. (1972/1922). History and Class Consciousness: Studies in Marxist Dialectics.
Cambridge: MIT Press. Lyotard, J. (1984). The Condition of Postmodernity: A Report on Knowledge. Manchester:
Manchester University Press. McDowell, L. (1997). Capital Culture: Gender at Work in the City. Malden: Wiley‐Blackwell
Publishers. Mills, M., and Huberman, A. (1994). Qualitative Data Analysis: An Extended Sourcebook.
Thousand Oaks, London and New Delhi: Sage Publications. Mirowski, P. (2005). How Positivism Made a Pact with the Postwar Social Sciences in
the United States. In G. Steinmetz (ed.): The Politics of Method in the Human Sciences: Positivism and Its Epistemological Others. Durham: Duke University Press, pp. 142–172.
Mitchell, C. (2006). Case and Situation Analysis. In Terry Evens and D. Handelman (eds.): The Manchester School: Practice and Ethnographic Praxis in Anthropology. Oxford and New York: Berghahn Book s, pp. 23‐43.
Nugent, D. (2010). Knowledge and Empire: The Social Sciences and United States Imperial Expansion. Identities, 17(1): 2‐44.
Pasti, V. (1997). The Challenges of Transition: Romania in Transition. New York: Columbia University Press.
Petrovici, A. (2010). Neoliberalizing Resistance: Working Time and Overtime Pressure. Conference paper prepared for, Entity, Construction, Relation: Critical Approaches to Time/Space, the State and Knowledge Production in Sociology and Social Anthropology. Budapest, June 11‐13.
Petrovici, N. (2006). Relații de putere în cadrul elitei politice româneşti la sfârşitul anilor ’80 şi începutul anilor ’90 [Power Relations in the Romanian Political Elite at the End of the 80s and the Begining of the 90s]. Sociologie Romaneasca, IV(1): 119‐145.

NORBERT PETROVICI
238
Petrovici, N. (2009). Reconfiguration of Urban Spaces from Socialism to Postsocialism, PhD Thesis. Babes‐Bolyai University, Cluj‐Napoca.
Petrovici, N. (2010). Articulating the Right to the City: Working Class Neo‐Nationalism in Postsocialist Cluj, Romania. In D. Kalb and G. Halmai (eds.): Headlines of Nationalism, Subtexts of Class. New York and Oxford: Berghahn Books (forthcoming).
Poenaru, F., and Pulay, G. (2009). Why Ethnicity? Everyday Nationalism in a Transylvanian Town. East Central Europe, 36(1): 130‐137.
Popescu, L. (2004). Politicile sociale esteuropene între paternalism de stat şi responsabilitate individuală [EastEuropean Social Policies Between State Paternalism and Individual Responsability]. Cluj‐Napoca: Presa Universitara Clujeana.
Popper, K. (1963). Conjectures and Refutations. London: Routledge and Kegan Paul. Skocpol, T., and Somers, M. (1980). The Uses of Comparative History in Macrosocial Inquiry.
Comparative Studies in Society and History, 22(2), pp. 174‐197. Somers, M. (1996). The Historic Turn in the Human Sciences In T. McDonald (Ed.), The
Historic Turn in the Human Sciences. Ann Arbour: University of Michigan Press, pp. 53‐90.
Soreanu, R. (2010). Metaphor in the Social Sciences: Creative Methodologies and Some Elements for an Epistemological Reconstruction. Studia Sociologia (this issue).
Stefan, L. (2004). Patterns of Political Recruitment in PostCommunist Romania. Ziua: Bucharest.
Steinmetz, G. (2004). Odious Comparisons: Incommensurability, the Case Study, and "Small N's" in Sociology. Sociological Theory, 22(3): 371‐400
Steinmetz, G. (2005). Scientific Authority and the Transition to Post‐Fordism: The Plausibility of Positivism in U.S. Sociology since 1945. In G. Steinmetz (Ed.): The politics of method in the human sciences: positivism and its epistemological others, Durhaim: Duke University Press, pp. 275‐325.
Strauss, A. (1987). Qualitative Analysis for Social Scientists. New York: Cambridge University Press.
Taylor, P. (2003). The State as Container: Territoriality in the Modern World‐System. In N. Brenner, B. Jessop and G. MacLeod (eds.): State/Space. Malden and Oxford: Blackwell Publishing, pp. 101‐113.
Thrift, N., and Olds, K. (2004). Reconfiguring the Economic in Economic Geography. In T. Barnes, E. Sheppard, J. Peck and A. Tickell (eds.): Reading Economic Geography. Malden and Oxford: Wiley‐Blackwell, pp. 59‐71.
Tismăneanu, V. (2003). Stalinism for all Seasons: A Political History of Romanian Communism. Berkeley and London: University of California Press.
Yurchak, A. (2003). Russian Neoliberal: The Entrepreneurial Ethic and the Spirit of "True Careerism". Russian Review, 62(1): 72‐90.
Zamfir, C. (2009). O istorie subiectivă în sociologia românească din 1944 până în prezent [A Subjective History of Romanian Sociology from 1944 up to Now]. Iasi: Polirom.

STUDIA UNIVERSITATIS BABEŞ‐BOLYAI, SOCIOLOGIA, LV, 1, 2010
METAPHOR IN THE SOCIAL SCIENCES: CREATIVE METHODOLOGIES AND SOME ELEMENTS FOR AN EPISTEMOLOGICAL RECONSTRUCTION
RALUCA SOREANU* ABSTRACT. Metaphor is often reduced to decorative expression in the social sciences. While sociologists rely heavily on metaphor to anchor theory, they fail to acknowledge its use and they treat it as disconnected from the activity of social critique. The essay discusses the capacity of metaphor to put localities in a state of emergence and to reveal hierarchy. A vignette about feminist knowledge production shows how metaphors can be used in sociology without totalising ambitions, even in the realm of methodology, which is often reserved to aspirations of precision. This exposition allows for a critique of positivism, which is not seen as a mere “idea” grounding methodologies; instead, I regard it as a regime of resonance emerging in a time of war, for the efficient organisation of war machines, through an association between the state, the military, and some continental logical positivist ideas. I elaborate on the impoverished emotional modalities of positivism, and on its distinctive stylistics, which shows a preference for metonymy among metaphors. Finally, I reflect on some elements for an epistemological reconstruction. Keywords: metaphor, creativity, epistemology, positivism, feminist theory.
Metaphor in the Social Science: Masters, Space and Silences
Metaphors are ubiquitous in the social sciences, but their emergence, their functions and their particular modes of operation in the worlds of thought of social analysts are often obscured. From Parson’s society as a “cybernetic system” (1961), to Goffman’s “theatre” (1959), to Bourdieu’s “field” (1985a), metaphor is placed robustly at the core of theory itself and offers a condensed image of the organisation of the social world. Among all these metaphors, spatial ones have a distinctive place, fixating sociology as a modern science, fascinated with space and also using space as a trope for anchoring theory.1 Postmodern and anti‐modern metaphors often retain the spatial resonance, while suggesting
* New York University and University College London, [email protected] 1 As Michel Foucault (1986: 23) has argued: “In any case I believe that the anxiety of our era has to do fundamentally with space, no doubt a great deal more than with time. Time probably appears to us only as one of the various distributive operations that are possible for the elements that are spread out in space”.

RALUCA SOREANU
240
dislocations and interruptions of space. Instances of such spatial tropes are Foucault’s “archaeology of knowledge” and his account of decentred power (1970); Habermas’s “public sphere” and the “colonization” of private life‐worlds by the market and by state bureaucracies (1989); or De Certeau’s “spaces” of resistance, “géographie de l’éliminé”, and culture as “espace désarmé” (1980). The present “lure” of space in social theory seems to function like a “return of the repressed”. After several decades at the end of the nineteenth and the beginning of the twentieth century, when historicism dominated the theoretical imagination, and spatial consciousness was lost to mainstream Marxism,2 space makes a vigorous return. The starting point of critique in this essay is not the mere fact that these – otherwise very different – theoretical constructs have a spatial resonance. Rather, I reflect on metaphor‐in‐use, on what a metaphor does in relation to understanding; on how it inhabits the space it claims; and on its implication in the activity of social critique. All these attributes of metaphor‐in‐use are tied up with the readiness of its producers neither to turn it against itself, nor to use it for sustaining hierarchies among forms of knowledge.
Metaphor can thus function as a tool of seduction into a theoretical construction via the powerful resonance of the category of space. Master metaphors in sociology also silently reflect a hierarchy of disciplines – and the aspiration to sciencificity written into the making of sociology as an academic field. Thus, metaphors from physics and computer science are more compelling and also “safer” than metaphors from literary studies and the arts and they also seduce us into the ways of anti‐rhetorical rhetoric: “what is being argued is beyond rhetoric, it is rooted in some facticity, some quality of the world as it is”. This hierarchy is expressed in a positive orientation to the natural sciences as a reservoir of inspiration for construing sociological tools. The paradoxical ramification of this state of affairs is that the “masters of metaphor” de‐legitimise metaphor as a form of understanding in sociology, in the same breath with using “strong” spatial metaphors from the natural sciences as their core concepts. The road ahead, thus, is to seek critical distance from the master metaphors which deny their acknowledgement as metaphors, or from the metaphors of the great sociological masters, and to experiment with the masterful use of smaller metaphors, which do not claim to offer a condensed expression of how the world works, but which put a locality in a state of emergence, and which reveal hierarchy. Any theoretical construct, metaphor, or “model” which makes demands of “application” from us is bound to be depoliticising.3 Metaphor‐in‐use is hardly about mere stylistics, 2 This bracket of the spatial consciousness ends with Henri Lefebvre (1973; 1974). 3 Here, we would need to reflect on the way in which new developments in sociological theory, which are at present very alluring, and are gaining important ground, operate under the logic of master metaphors demanding application from followers who have no take on ontology (or epistemology), flowing from their own situatedness. It is the case of the Latourian sociology of translation, which

METAPHOR IN THE SOCIAL SCIENCES: CREATIVE METHODOLOGIES AND SOME ELEMENTS
241
it is about politics. In the current epistemological conjuncture, metaphor becomes a tool of social critique if it manifests itself along the lines of Marcuse’s reflection on the two facets of protest: “revolt against false fathers, teachers and heroes”; and “solidarity with the wretched of the earth” (1966: xvi).
Some telling tensions with metaphor are found in Pierre Bourdieu’s concept of “field”. As Silber (1995) notes, Bourdieu made very few remarks on the operation of this concept in the natural sciences (physics especially) and he developed it as if its meaning could unfold independently of the metaphor in physics. In Bourdieu’s definition, “[t]he social field can be described as a multi‐dimensional space of positions such that every actual position can be defined in terms of a multi‐dimensional system of co‐ordinates whose values correspond to the values of the different pertinent variables” (Bourdieu, 1985b: 724). While the traces of the source and the modes of use of metaphor are effaced, Bourdieu denigrates metaphor as a tool of thinking (Silber, 1995), reduces it to a decontextualising artifice of language, and displaces it by the more reliable operation of “analogy”. What Bourdieu does not elucidate are the hierarchical inscriptions that the sociologist makes when she operates under the more seductive and the more comforting, safer, and more docile terms of “as if” (i.e. the analogy).
Far from functioning as mere metaphors, guided by rhetorical intentions at persuasion, the methodical transfers of models founded on the hypothesis that there exist structural and functional homologies among all fields, possess an eminent heuristic virtue, the one that epistemological tradition recognizes in analogy… Rather than viewing the transfer as responsible for object construction – such as in cases where one borrows from a preferably prestigious universe, ethnology, linguistics or economics, a decontextualized notion, a mere metaphor whose function is purely emblematic – it is the object construction which calls for the transfer and establishes it (Bourdieu, 1985a: 18‐19).
Still, to decide that something is “as if” something else is precisely a point of thought that is charged with all the repetitions and the hierarchical impulses inscribed in our cultural imaginaries. Bourdieu’s “as if” shows that even when used by critical theorists, metaphors can remain underexplored in their potential for social critique.
makes claims in the name of the facticity of the world of objects/actants, which refuses to treat social relations as deep ontological realities, and demands the study of surfaces. The call for a new descriptivism – as Latour (2005: 137) proposes, “[n]o scholar should find humiliating the task of description. This is, on the contrary, the highest and rarest of achievement” – is paradoxically accompanied by a heavy reliance on experimental, modernist literary forms, by aphoristic formulations, by dramatisations, and by systems of metaphors of agonism and combat. This literary mobilisation is depoliticising, since categories such as gender and race do not survive the analysis.

RALUCA SOREANU
242
The function of metaphor, which Bourdieu fails to engage with, is that of enlarging our repertoire and allowing us to tell stories about the social world in a transformed and transforming vocabulary. This agenda is reflected in Jameson’s idea of “transcoding” (1981: viii), Rorty’s “recontextualising redescription” (1989: 78‐80), and Shapiro’s “self‐conscious antagonistic metaphor” (1985/1986). All these notions have in common the act of putting a code in a state of emergence or of performing an “act of reverberation”4 by which one domain is refigured by being described in a code that belongs to another one (Soreanu and Hudson, 2008). Metaphor is not just adornment to cognitive expression and exposition, but it can create meaning by itself. There is an emancipatory agenda in the use of untoward metaphors (Soreanu and Hudson, 2008). To put it in Rorty’s terms, “instead of using metaphors to get closer to something not ourselves, we should use metaphors of enlargement, of making ourselves bigger and better” (Rorty, 2000: 819). Metaphors are at the same time descriptive and subversive, and it is through the intersection of these two qualities that they can take us closer to understanding the articulation of particular subjectivities – the first of which is always our own, not in the sense of importance, but perhaps in the sense of a sequence: when metaphor reverberates, it touches first the subjectivity which puts the code in a state of emergence. They also take us closer to understanding the re‐figurative or transformative qualities of subjectivities – or their irreducible politicality. As discussed here, metaphor is never a source of private language, but it is a political and an ethical way of engaging the world.
Methodological Vignette: A Visual Metaphor of Knowledge Production
From metaphors crafted by masters, while inhabiting a scopic condition – where the world seemingly reveals its essence to them – I migrate to small, nearly mundane metaphors, which can infuse the way we tell sociological stories. My methodological vignette is taken from an analysis of the status of feminist scholarship in the academic discipline of International Relations (IR).5 The vignette is about the critical use of citation analysis and network analysis, accompanied by a system of untoward linguistic and visual metaphors, so as to discuss how feminist literature stands in International Relations, and to discuss disciplinary change and stasis more broadly. Ultimately, the vignette shows that there is a way to be committed to self‐conscious political use of metaphor in the social sciences (or, in other words, there is a way to be committed to social critique), even in the realm of methodology.
4 See Bachelard (1964: xxiii) on poiesis, understood as “creativity that comes from an act of reverberation, or putting language in a state of emergence, in which life becomes manifest through its vivacity”.
5 The extended discussion around this vignette appears in Soreanu and Hudson (2008).

METAPHOR IN THE SOCIAL SCIENCES: CREATIVE METHODOLOGIES AND SOME ELEMENTS
243
Figure 1. Reproduction of an emotional landscape
Source: Soreanu and Hudson (2008).
The journey to the visual metaphor I describe here started with counting, in an unextraordinary fashion, the number of times the feminist contributions to a special issue of a critical journal in the discipline of International Relations were cited in the field, and in the social sciences more broadly, as reflected in the Social Science Citation Index.6 The special issue was published in 1988, and it represents one of the first feminist events in the field of IR. In a discipline at the time centred on rational choice theories, and its game theoretical derivations,
6 Our analysis focused on the 1988 Millennium: Journal of International Studies articles in the special issue on women and international relations. Counting the references to these articles represents a first wave of citations. We proceeded by recording the occasions when the authors who cited the Millennium contributions are in turn cited by other authors. This represents a second wave of citation. The analysis is not restricted to IR publications, but it includes all citations, within the social sciences and beyond. The recorded entries are processed further by resorting to relational analysis. We used HistCite to gather the citation data from ISI’s Web of Science and then produced the visual representation of the data using NetDraw. Thus, in the original map, the points represent articles and lines that connect the points are an indicator of a “relationship of citation”, meaning that they link a citing author with an author being cited. The use of relational analysis means that the authors who are frequently cited produce “cluster effects” on the map, alerting us to the disciplinary zones with a high emotional charge.

RALUCA SOREANU
244
feminist thought about peace, war, statehood, and the international brought important challenges (see Enloe, 1989; Peterson, 1992; Tickner, 1994; and Sylvester, 1994). To stop here, or to look at citation clusters in terms of centrality, would have meant reconfirming the notions of prestige which animate the disciplinary imaginary of International Relations, and recasting feminists as inhabiting the margins. Thus, as an attempt to re‐politicise feminist knowledge production, and in an attempt to stimulate methodological reflexivity, we created an ink hand drawing, reproducing the original statistical output that resulted from citation counts and network analysis. The reproduction invites a holistic treatment of the relational map, and disturbs the assumptions of neatness, stability, and precision that usually accompany the use and presentation of statistical work. The map is purposefully untidy, fluid, and imprecise, because the links between the authors in it talk about emotional attachments, not about field positionality and cultural capital concentrations. The nodes of the network are not indices of centrality, but of zones where emotional energies converge. By this visual “trick” we get International Relations scholars to think in terms of an emotional organisation of their discipline and to view the black‐ink signs as traces of disciplinary emotions.7
There are many important observations that follow, once we step inside the map. First, the articles in the 1988 Millennium issue are cited less in IR publications and more in publications belonging to other fields, such as sociology, cultural studies, or even geography and especially law. Second, for IR publications, we discover a zone of very intense concentration of emotional energy around Alexander Wendt.8 The convergence around Wendt does not make him central to the debate around feminism as such – since he is tied into the network via the second wave of citations – but speaks more about his locus in the emotional organisation of IR more broadly. Wendt is the carrier of a disciplinary subculture of synthesis: his version of state‐centric constructivism (or “middle ground constructivism”) provides the safe terrain where both mainstream rationalist IR and critical IR can talk to each other.9 The considerable emotional energy surrounding Wendt could, however, point to some dangerous forms of forgetfulness in relation to other strands of radical constructivism,10 while sustaining the illusion of a very strong subculture of dissidence. Third, the map shows that feminist contributions are spread out in the spaces of interstice between IR and other disciplines, revealing that while feminists do not structure the dialogues and
7 The methodological “trick” is anchored in the theoretical choice to make emotions central to understanding change in intellectual fields. See Soreanu and Hudson (2008), and Collins (1998).
8 For two of his most cited contributions, see Wendt (1992, 1999). 9 For overviews of the propositions of middle ground constructivism, see Adler (1997, 2002), and Hopf (1998).
10 For a comment on the normalising implications of Wendtian theorising, see Kratochwil (2002).

METAPHOR IN THE SOCIAL SCIENCES: CREATIVE METHODOLOGIES AND SOME ELEMENTS
245
emotional exchanges in IR, they do structure the relation between IR and other disciplines. The notion of multisourcing is crucial here: the very act of importing ideas from several domains of knowledge, and doing some work of translation and elaboration on them, so that they resonate and fit the structural rivalries of the receiving knowledge culture, encourages creativity. The map captures this “creative condition” of IR feminists in relating IR to other disciplines. Even when going beyond the map and thinking in terms of “who feminists cite” rather than “whom they are cited by”, we can confidently make a case for multisourcing: feminists in IR practice importing from philosophy of science, sociology, or anthropology (Tickner, 1997, 2005a, 2005b). Also, they often fall for more unconventional love‐objects, such as literary works (Zalewski, 2006), paintings (Sylvester, 2007), or films (Weber, 1999). By becoming implicated in this two‐way multisourcing (so, by citing and being cited by other fields) feminists are silently creating the conditions for a substantive reorganisation in the IR field.
Thus, we come closer to an untold story about the condition of feminists in IR: feminists are not marginal, but they occupy an equally uneasy and creative spot, in areas where the emotional energies of several disciplines meet. How and why is this story important? The first reason is the disenchantment feminists feel in relation to talking about the status of their niche of scholarship in the field of International Relations. It often appears that there is nothing to add to the discussion of feminist “marginality” or “lack of impact”, without becoming undone in this talk. Still, as I have shown elsewhere, feminist “talk of self” in IR does important work on the disciplinary imaginary of the field, and pluralises the way we think about the units in the organisation of knowledge (Soreanu, 2010). It is thus important to preserve the ability to practice some descriptors of the state of the discipline – in the form of a sociology of thinking or even in the form of internalist reflections on the state of the field – without being locked in the reifying language of marginality. The second reason why this visual metaphor works as a tool in the activity of social critique is that it allows us to unsettle the given roles in an account of the type orthodoxy‐meets‐heterodoxy: while orthodoxy usually appears as the active part, able to perform operations of domestication, fragmentation or ghettoisation on the challengers, heterodoxy appears as the passive part, which is mostly being done, rather than doing (Soreanu, 2010). Here, the observation of the creative interstices where feminist scholarship lives means that we can assert the fact that heterodoxy can also be the active part, it can do. Yet a third reason to create this metaphor is a crisis about reflexivity in the discipline of IR. Confronted with an increasing number of invitations to reflect on the organisation of knowledge, some voices in IR are concerned that the “stuff” of the world will fall out of sight: what about the agglomerations of war machines, the guns, the soldiers, and (occasionally) one or two foreign policy documents? Such “materiality

RALUCA SOREANU
246
calls” obscure the fact that an even more disturbing form of materiality – dead bodies piled up in war – are the consequence of certain ideas about conflict and the polity, which are in part generated in fields of knowledge such as International Relations. They also obscure the fact that whatever materiality we have in mind, it will rest on an emotional fabric: as Cynthia Enloe (2000) has shown, modern war could not be fought by national states without the mobilisation of the emotion of soldiers’ mothers; it could also not be fought without a long line of historical investments, symbolisations, and interventions along the lines of construing a certain kind of aggressive masculinity. Finally, the fourth aim of this metaphor is to draw theoretical attention to the fact that disciplines have an emotional organisation, and that historically this organisation has been centred on a limited number of voices conceived as authors11, with often impoverishing consequences for knowledge production.
The visual metaphor is accompanied by a critique of citation analysis. Citation belongs to a broader communicative, expressive, and affective system of practice, which is particular to intellectuals as cultural producers. The nature of the relationship between citations as symbolic entities, the process behind their production (here, scholars forming coalitions), and the politics of the process (here, the hierarchies and exclusions that are expressed in the coalitions) is still not easily or readily grasped (Soreanu and Hudson, 2008). Our eccentric and subversive use of citation analysis as a ground for a better understanding of citational practices in the field of IR is an attempt to address some of the most problematic assumptions of this method. First, The Institute for Scientific Information (ISI) has built citation analysis into a technique for assessing productivity, based on the Science Citation Index (SCI) and the Social Sciences Citation Index (SSCI). Citation analysis has allowed the commodification of citation; its incorporation into circuits of academic prestige and fashion, rather that into circuits of meaning‐making and circuits of recognition of affinities; and its operation as a central tool of self‐normalisation, in which scholars record the reception of their own work. Second, citation analysis is underlain by a radical methodological individualism, as it is based in a counting of referenced authors as separate and unproblematic entities. This act of counting separate entities performs acts of dis‐invention in relation to other auctorial entities, such as the ones that result from co‐authorship, for instance. Although citation analysis “counts” the same way, surely, the case of two authors writing together cannot be equated with the case of the same authors writing two papers separately. Third, through counting we assume that the author is identical to the work, and to her other auctorial occurrences carrying the same signature at different points in time. A way out of these traps is perhaps to allow a re‐
11 For a discussion on the case of sociology see Sprague (1997).

METAPHOR IN THE SOCIAL SCIENCES: CREATIVE METHODOLOGIES AND SOME ELEMENTS
247
eroticisation of counting, and to reveal that counting is erotic to start with. To count is never to perform a neutral, rational, and distanced act, in the position of a dispassionate investigator. To count is to enact a fantasy of the world, populated by neat, docile, alike entities, which give themselves to counting. The way forward is to anchor counting in different fantasies, and to count for discovering affinities, rather than centralities and marginalities.
Positivist Regimes of Resonance, Positivist Emotionality, Positivist Stylistics
The invitation to re‐eroticise counting on better terms actually belongs to the sphere of a broader observation: every epistemological modality is underlain by an emotional modality. But emotions are often something we are silent about in our epistemological pursuits. Evelyn Fox Keller elaborates on the way the opposition between love and knowledge is at the core of the development of modern science and of the making of the western man: “Most of us are psychosocially constituted to see love and power as irreconcilable alternatives; we do not know how to speak of them in the same breath” (Fox Keller, 1985: 116). As a result of such psychosocial constitution, emotions are seen usually as a source of distortion for the observations conducive to the creation of knowledge (Jaggar, 1998; Fox Keller, 1985). To say that each epistemological mode is underlain by an emotional mode is to say that knowledge production runs in continuation of our way of becoming entangled with human and non‐human objects encountered in our everyday journeys.
In talking about the operation of positivism in the social sciences, we need to cease relating to it as a “mere idea”. To treat it as an idea would mean that the current forms of positivism are derivations from Comte’s programme, and they are thus one choice among many in the philosophy of science. A discussion of positivism in the sciences would thus ponder over its particularities as epistemological discourse and over its core tenets. First, positivism comes with a commitment to assembling laws, that is, to the identification of Humean “constant conjunctions” of events; or to the probabilistic variants of covering laws that were considered legitimate by logical positivist philosophers in the mid‐twentieth century. Second, it brings an empiricist ontology, according to which there is a correspondence between scientific statements and observable events. Third, positivism is a carrier of a scientist perspective, that is, the belief that the social and natural sciences are to approach their objects of study in an identical fashion. For the social sciences, this means that its objects are treated as brute material facts whose identity is independent of what people think about them. It also means that social facts, just like natural ones, are subject to “invariable natural Laws” independent of time and place.

RALUCA SOREANU
248
But positivism is more than an idea: it is a regime of resonance with objects, emerging from a historical alliance produced in the twentieth century between the state, the military, and seventeenth century ideas of logical positivist continental philosophers of science. This regime of resonance has had such longevity12 in the social sciences precisely because it emerged from such strong “elective affinities” (Wobbe, 1996; Klein, 1971; Steinmetz, 2005a, 2005b; Mirowski, 2005). Thus, the current form of domination of positivism in the social sciences is intimately linked with a political story in the US and with a particular institutional regime in the organisation of science. As Philip Mirowski (2005) shows, the Operations Research (OR) profession emerged in the Second World War as a practical response to the problems of the military planning and organisation of science. Through the institution of OR, scientists were co‐opted for assisting the state in the generation of rational strategies and tactics for battle; this resulted in applying abstract models of physics on abstract agglomerations of war machines (Mirowski, 2005). What emerged from here was a concept of a free‐floating academic community, distinguished by its possession of expertise rooted in the generic scientific method, and having a considerable degree of autonomy. Thus, we see how a regime in the organisation of sciences, with specific forms of funding and management, and marked particularly by the domination of the military, was implicated in stabilising a vision of pure science practiced by a scientist who observes and makes iterations while neatly delineated and secured from the incursions of the actual research object. According to Mirowski (2005) the Operations Research framework created the conditions for scientists to stabilise a “delicate amalgam of engagement and aloofness” which stands at the root of an autarkic model of the scientific community. Thus, positivism is a regime of resonance with objects which emerged in a time of war, and while seeking an efficient organisation of the war machine.13
There is a deep layer of emotionality underlying this historical alliance, in which ideas and institutions become resonant with each other, to produce further ideas and institutions. In order to become entangled and sustain such amalgamations of resources, people must “feel” the same, they must have important communalities in their dispositions towards objects. Also, the longevity of this complex historical alliance and of the amalgamations of resources it
12 As Steinmetz (2005a) puts it, positivism has had a “surprising longevity” in the social sciences. 13 The emotionality specific to a time of war and to the efficient deployment of the war machine is further complicated in times of peace with emotions associated to the hierarchical arrangement of scientific disciplines and of the different disciplinary locations. Although it is not within the scope of this essay to map the diffusion of US sociological narratives, we can at least note that these forms of US sociology discussed here (such as empiricism, scientism and the appetite for numerical tabulations) “travel” and become central in other localities, as well.

METAPHOR IN THE SOCIAL SCIENCES: CREATIVE METHODOLOGIES AND SOME ELEMENTS
249
presupposes only work to further stabilise and confirm some very particular emotional modalities as the “viable” ones. To follow Jaggar, we can say that “in our present social context, the myth of dispassionate investigation is a classist, racist, and especially masculinist myth” (Jaggar, 1998: 395). Under the guise of detachment and value neutrality, we uncover precisely emotions, which are mostly characteristic to men in certain historical periods (i.e. middleclass White men in modern or late modern times), and which come to constitute modern epistemology. Feminist theorists have reflected on such emotions, such as separation anxiety and paranoia (Flax, 1983; Fox Keller, 1985; Bordo, 1987), or an obsession with control and fear of contamination (Schott, 1988). Research objects are therefore not loved, but inspected from afar, as if on a screen, so as to confirm the illusion of autonomy of the observer. Ultimately, positivism signals a profound problem with boundaries, individuality, and the generation of personal meaning; it lacks a modality of integrating in a mature way both separation and connection, both sameness and difference.
Positivism as emotional modality is anchored in a stylistics, as well. I argue that positivist iterations employ metonymic forms: nothing is ever treated as a whole; a whole will be negated, segmented, and replaced by its parts.14 Such preference for metonymy among metaphors is wrapped up in an anti‐rhetorical rhetoric: positivist stories claim to be the fruit of some facticity, of the world as it is, and thus they claim to be beyond the realm of persuasion. Positivist stylistics is most often committed to “genre thickening” which means “tightly coded descriptions” and “semiotic denseness” (Brown, 1990: 57). This comes with a tendency to repeat what we know already, and to submit to strict protocols of organising what we know. The genre’s rules of representation are thus never challenged, but always confirmed. It is deeply concerning that in our times important publication outlets in sociology become almost exclusive sites of genre thickening: it is the case of the American Journal of Sociology, where the ethics of coverage (i.e. proving the capacity to map out an entire knowledge domain) and where the conformity to a tight sequence in the organisation of knowledge (i.e. from theory, to methodology, to findings) actually work to stifle both meaning and social critique. The creative alternative to genre thickening is “genre stretching” (Brown, 1990). Here, we allow ourselves to rely on the polysemic properties of language, so as to put a domain (social, not only linguistic) in a state of emergence. We purposefully collapse the imperatives of representation only to allow new meaning to coagulate. To embrace genre thickening and metonymy as our main stylistic devices in the organisation of our knowledges is to become invested in sustaining the impoverishing positivist emotionality and the positivist regime of resonance, which is the child of times of war and calculated destruction.
14 Norbert Petrovici’s (2010) contribution to this forum, and his discussion of the insistence on the logic of representativity counts as an elaboration on the metonymic iterations of positivism.

RALUCA SOREANU
250
That positivism comes as a regime of resonance, with an associated emotional modality, and with a stylistics, is only to alert us that it can and does arrive at powerful local manifestations. Just as fields of knowledge have an emotional organisation, so do universities, departments, research groups, or institutes. They too can become engrenages of people, objects, and resources implicated in confirming and re‐confirming the Name of the Father, in obstructing rather than cultivating the circulation of knowledge (especially in intergenerational relationships) as an expression of a deep fear that meaning might proliferate fluidly and uncontrollably. Localities mobilised in sustaining positivist regimes of resonance display Oedipal emotional configurations of rivalry; or Achillean configurations of humiliation, where the scene in which men humiliate other men in hierarchically inferior positions is central, and it also becomes a way of “rehearsing” acts which enable the regime of domination over women.
Such local manifestations of positivism are further complicated when they unfold alongside a trend of “corporatisation” of the university, by which the dynamics associated to neoliberal capitalism manage to silence and incorporate the university, one of the last sites where effective critiques of neoliberalism can emanate from (Calhoun, 2006a). In what follows, I refer to an instance where some structural changes in the university become entangled with a poor management of the intergenerational relationship, and crystallise a new spatial discipline in universities. In the past decade we have seen an important shift in universities to corporate models of spatial organisation, which are know as “cubicles” or “open space”. In this model, some of the office units have no walls or doors. One possible interpretation for the emergence of this new spatial discipline would be that the changes in the management of the university – with academic institutions not becoming merely akin to corporations, but corporations in a true sense (Calhoun, 2006a, 2006b) – come along with the imitation of the corporate logic of space organisation. In the US, while universities are becoming more and more dependent on private funds, and are attempting to secure them in different ways, from student fees, to corporate investments, and to selling their own intellectual products, the very autonomy of fields of knowledge production is undermined, and, as Craig Calhoun puts, it collapses into markets (2006b: 18). The activities of universities are subsumed under a logic of profit, and “knowledge products” are marketised to the public just like any other commodity. While all these profound changes in management could indeed lead to a mimicry of corporate spatial models, there is more to the new spatial discipline than mere contamination from the corporate world: an impoverished intergenerational relationship. In universities, the “cubical” and other varieties of the “open plan” are reserved to doctoral students, research assistants, and other temporary positions, while senior academics still occupy individually enclosed workspaces,

METAPHOR IN THE SOCIAL SCIENCES: CREATIVE METHODOLOGIES AND SOME ELEMENTS
251
thus producing a model of space that is marking status in stronger terms than the old cellular office model. In the new open plans, the degree of transparency varies with and is inversely proportional to the place in the hierarchy of the profession or of the department. In the “open plans” some bodies are always available, subject to interruptions, and to constant surveillance. Open plans are voyeuristic spaces, antithetical to focus, and corrosive of the inwardness of those who fill them. This critique is not to romanticise solitary intellectual, engaged in the production of grand ideas behind closed doors, while talking to herself. It is also not meant to idealise or naturalise a cellular model of space, comprising of individual enclosed units. Such spaces also have a history, starting with monastic cells, and continuing with the rooms provided for scholars in Oxbridge colleges, and with the rise of the cellular office in purpose built blocks for both government agencies and corporate headquarters in the postwar period. It is meant, however, to show how the “open space” as an arrangement of surveillance can come to prevent us from using inwardness as a resource for social critique. We are thus socialising intellectuals who cannot inhabit their inwardness, whose inner conversations are impoverished, and who mimic the attention deficits of the corporate culture at large. In the midst of such engrenages of people, objects, and resources, and while inhabiting space that has a status‐driven and a generation‐driven organisation, emotional/intellectual investments in broken tasks of numerical tabulation are structurally favoured over investments in fluent activities of critique.
Conclusion: Some Elements for an Epistemological Reconstruction
While being critical of the institutional, emotional, and stylistic modalities of positivism, it is important not to construe yet another artificial dichotomy between “positivist sociology” and “critical sociology” when it comes to the use of metaphor. While we do want to preserve our ability to talk about the operation of positivism in the social sciences as a regime of resonance of objects, it is also true that several post‐positivist or anti‐positivist theorists fail to acknowledge the value of metaphor for understanding. A more meaningful difference, I argue, is that between a regime of using metaphor with totalising intentions, while effacing the genesis and affinities of the metaphor in use, and with no implications for revealing hierarchy; and a regime of using it in artisanal ways, while being aware of and while referencing its journeys from other knowledge domains, and while practising an ethical commitment to putting a locality in a state of emergence and to exposing hierarchy. Fredric Jameson’s (1991) reflection on the relationship between totalising constructs and critical capacity is illuminating in stabilising this distinction between the two regimes of using metaphor:

RALUCA SOREANU
252
What happens is that the more powerful the vision of some increasingly total system or logic – the Foucault of the prisons book is the obvious example – the more powerless the reader comes to feel. Insofar as the theorist wins, therefore, by constructing an increasingly closed and terrifying machine, to that very degree he loses, since the critical capacity of his work is thereby paralysed, and the impulses of negation and revolt, not to speak of those of social transformation, are increasingly perceived as vain and trivial in the face of the model itself.
After having understood the connection between the politics of protest and the very scale which we reserve for our theoretical iterations, it remains to craft political ways of “being small”. At times, totalistic metaphors and ambitions are carefully disguised in varieties of (non‐positivist) empiricism. It is the case of Bruno Latour’s new descriptivism presented as a commitment to “earthly things” (2007), but which is actually a striking form of ontological and epistemological monism; and which thus undermines all possibilities of critical theoretical alliance. To counter and subvert historical regimes of resonance of objects, such as neoliberal capitalism, alliances are much needed. In other words, the time is ripe for discarding epistemologies of separation and embracing epistemologies of connection.
As a part of our pursuit for epistemologies of connection, it is crucial to restore a sense of wholeness to the way we engage the world as researchers. This can be achieved by confronting the bluntness and immensity of a core feminist tenet: the way we make knowledge runs in continuation to the way we make life, to the way we circulate across objects, and the way we orchestrate our daily interactions (Fox Keller, 1985). The scientist’s relation to the natural world is the same with her relation to the human world, within and without acts of knowledge production. The capacity to become immersed in an object of study is very similar to the capacity for love and empathy towards our human others: it requires unfaltering attention, which in its turn rests on a sense of self secure enough to tolerate both difference and similarity, both interruption and continuity (Fox Keller, 1985). Keller (1985) illuminates that it is possible to achieve a feeling of one‐ness with the object of research that is not the equivalent to Freud’s “oceanic feeling” (1949); such an oceanic feeling would connote a regression to infantile states, when self and reality are not yet experienced as separate. It is possible to attain unity that is not regressive, not similar to the return to the womb, but unity that is a higher level of personal development, based on loving relatedness to others and to the world at large. Here, loving attention for the object of research obscures egocentric pursuits (Schachtel, 1959). A mature subject, capable of an unimpoverished and creative engagement with the world on the whole and with the objects that make it up is precisely one able to experience both separation and connectivity. As Loewald puts it, “owning in part to analytic research, there is growing awareness of the force and validity of another striving, that for unity,

METAPHOR IN THE SOCIAL SCIENCES: CREATIVE METHODOLOGIES AND SOME ELEMENTS
253
symbiosis, fusion, merging, or identification – whatever name we wish to give to this sense of and longing for nonseparatedness and undifferentiation” (1980: 402). Thus, a profound reconstruction of epistemologies starts with a reconstruction of our emotional lives.
Metaphor is at the heart of such an epistemological reconstruction, because it comes with the possibility of productive displacements, which function as an invitation to think about the concepts we use to understand other concepts with (Haraway, 2000). The idea that we can ever stand outside affiliations, affinities, borrowings, introjections, and “travelling concepts” from other fields of knowledge is surely an illusion, resembling Oedipal revolt. The challenge that we face is how we inhabit these elements of inheritance. Paraphrasing Donna Haraway (2000) in her reflection on the concepts we understand concepts with, I argue that one of the greatest carriers of ethical social theory is the act of thinking about what metaphors we understand concepts with. Haraway (1976) does this very act in the field of biology, in her early work Crystals, Fabrics and Fields: Metaphors of Organicism in TwentiethCentury Biology, which shows how core biological notions have their roots in Western philosophical ideas, in literary traditions, and in the ways in which these are filtered in the emotional and linguistic preferences of key figures in biology. Effacing the traces of metaphor, in the name of older and newer forms of descriptivism, does not accomplish more than to uproot us from both ethical and political engagements. Abstractions are always in a persistent, even stubborn connection with texturised fleshy concreteness. Abstractions are “lures”, to put it in Whitehead’s terms (Whitehead, 1948; Stengers, 2002). It is our task to unpack for ourselves and others why a certain abstraction allures us, and also to always work towards better abstractions, which are more pluralistic and more generative of life, rather than to conflate the illusion that we are committed to some sort of undisturbed, fierce, demanding concreteness.
REFERENCES
Adler, E. (1997). Seizing the Middle Ground: Constructivism in World Politics. European
Journal of International Relations, 3(3): 319‐63. Adler, E. (2002). Constructivism and International Relations. In W. Carlsnaes, T. Risse
and B. A. Simmons (eds.): Handbook of International Relations. London: Sage Publications, pp. 95‐118.
Bachelard, G. (1964). The Poetics of Space. Boston: Beacon Press. Bordo, S.R. (1987). The Flight to Objectivity: Essays on Cartesianism and Culture. Albany:
SUNY Press. Bourdieu, P. (1985a). The Genesis of the Concepts of Habitus and Field. Sociocriticism,
2(1): 1‐24.

RALUCA SOREANU
254
Bourdieu, P. (1985b). The Social Space and the Genesis of Groups. Theory and Society, 14(6): 723‐744.
Bourdieu, P. (1993). The Field of Cultural Production: Essays on Art and Literature. New York: Columbia University Press.
Brown, R. (1990). Social Science and the Poetics of Public Truth. Sociological Forum, 5(1): 55‐74.
Calhoun, C. (2006a). The University and the Public Good. Thesis Eleven, 84(1): 7‐43. Calhoun, C. (2006b). Is the University in Crisis? Society, 43(4): 8‐18. Collins, R. (1998). The Sociology of Philosophies: A Global Theory of Intellectual Change.
Cambridge: Belknap Press. Daston, L. (1992). Objectivity and the Escape from Perspective. Social Studies of Science,
22(4): 597‐618. De Certeau, M. (1980). La Culture au pluriel. Paris: C. Bourgeois. Enloe, C. (1989). Bananas, Beaches and Bases: Making Feminist Sense of International
Relations. London: Pandora Press. Enloe, C. (2000). Maneuvers: The International Politics of Militarizing Women's Lives.
Berkeley: University of California Press. Flax, J. (1983). Political Philosophy and the Patriarchal Unconscious: A Psychoanalytic
Perspective on Epistemology and Metaphysics. In S. Harding and M. Hintikka (eds.): Discovering Reality: Feminist Perspectives on Epistemology. Dordrecht: D. Reidel Publishing, pp. 245–281.
Foucault, M. (1970). The Order of Things: An Archaeology of the Human Sciences. New York: Pantheon Books.
Foucault, M. (1977). Discipline and Punish: The Birth of the Prison. New York: Pantheon Books.
Foucault, M. (1986). Of Other Spaces. Diacritics, 16(1): 22‐27. Fox Keller, E. (1985). Reflections on Gender and Science. New Haven: Yale University Press. Freud, S. (1949). Civilization and Its Discontents. London: Hogarth Press. Goffman, E. (1959). The Presentation of Self in Every Day Life. Doubleday: Anchor Books. Habermas, J. (1989). The Structural Transformation of the Public Sphere: An Inquiry
Into a Category of Bourgeois Society. Cambridge: MIT Press. Haraway, D. (1976) Crystals, Fabrics and Fields: Metaphors of Organicism in Twentieth
Century Biology. New Haven and London: Yale University Press. Haraway, D. (1999). Situated Knowledges: The Science Question in Feminism and the
Privilege of Partial Perspective. In E. Fox Keller and H.E. Longino (eds.): Feminism & Science. Oxford: Oxford University Press, pp. 249‐263.
Haraway, D. (2000). How Like a Leaf. New York: Routledge. Hopf, T. (1998). The Promise of Constructivism in International Relations Theory.
International Security, 23(1): 171–200. Jaggar, A.M. (1997). Love and Knowledge: Emotion in Feminist Epistemology. In D. Tietjens
Meyers (ed.): Feminist Social Thought: A Reader. London: Routledge.

METAPHOR IN THE SOCIAL SCIENCES: CREATIVE METHODOLOGIES AND SOME ELEMENTS
255
Jameson, F. (1981). The Political Unconscious. New York: Cornell University Press. Jameson, F. (1991). Postmodernism, Or: The Cultural Logic of Late Capitalism. London:
Verso. Klein, V. (1971). The Feminine Character: The History of an Ideology. London: Routledge. Kratochwil, F. (2000). Constructing a New Orthodoxy? Wendt’s Social Theory of International
Politics and the Constructivist Challenge. Millennium: Journal of International Studies, 29(1): 73‐101.
Latour, B. (2005). Reassembling the Social: An Introduction to ActorNetworkTheory. Oxford: Oxford University Press.
Latour, B. (2007). A Plea for Earthly Sciences. Keynote lecture for the annual meeting of the British Sociological Association, East London, April. http://www.bruno‐latour.fr/articles/article/102‐BSA‐GB.pdf (January 2010).
Lefebvre, H. (1973). La Survie du capitalisme. Paris: Anthropos. Lefebvre, H. (1974). La Production de l’espace. Paris: Anthropos. Loewald, H.W. (1980). Papers in Psychoanalysis. New Haven: Yale University Press. Marcuse, H. (1966). Eros and Civilization: A Philosophical Inquiry into Freud. Boston:
Beacon Press. Mirowski, P. (2005). How Positivism Made a Pact with the Postwar Social Sciences in
the United States. In G. Steinmetz (ed.): The Politics of Method in the Human Sciences: Positivism and Its Epistemological Others. Durham: Duke University Press, pp. 142–172.
Novick, P. (1988). That Noble Dream: The “Objectivity Question” and the American Historical Profession. Cambridge: Cambridge University Press.
Parsons, T., Shils, E., Naegele, K.D. and Pitts, J.R. (1961) (eds.). Theories of Society: Foundations of Modern Sociological Theory. New York: Free Press.
Peterson, S.V. (1992). Gendered States: Feminist (Re)Visions of International Relations Theory. New York: Lynne Rienner.
Petrovici, N. (2010). Corrupt Knowledge and the Quest for Objectivity: A Critique of the Romanian Positivist Sociology. Studia Sociologia (this issue).
Rorty, R. (1989). Contingency, Irony, and Solidarity. Cambridge: Cambridge University Press. Rorty, R. (2000). Pragmatism, International Journal of PsychoAnalysis, 81(4): 819‐823. Schachtel, E.G. (1959). Metamorphosis. On the Development of Affect, Perception, Attention,
and Memory. New York: Basic Books. Schott, R.M. (1988). Cognition and Eros: A Critique on Kantian Paradigm. Boston:
Beacon Press. Shapiro, M. J. (1985/1986). Metaphor in the Philosophy of the Social Sciences. Cultural
Critique, 2 Winter: 191–214. Silber, I.F. (1995). Space, Fields, Boundaries: The Rise of Spatial Metaphors in Contemporary
Sociological Theory. Social Research, 62(2): 323‐355. Soreanu, R. (2010). Feminist Creativities and the Disciplinary Imaginary of International
Relations. International Political Sociology, 4(4) (forthcoming).

RALUCA SOREANU
256
Soreanu, R. and Hudson, D. (2008). Feminist Scholarship in International Relations and the Politics of Disciplinary Emotions. Millennium: Journal of International Studies, 37(1): 123‐151.
Sprague, J. (1997). Holy Men and Big Guns: The Can[n]on in Social Theory. Gender & Society, 11(1): 88‐107.
Steinmetz, G. (2005a). Positivism and Its Others in the Social Sciences. In G. Steinmetz (ed.): The Politics of Method in the Human Sciences: Positivism and Its Epistemological Others. Durham: Duke University Press, pp. 1‐56.
Steinmetz, G. (2005b). The Epistemological Unconscious of U.S. Sociology and the Transition to Post‐Fordism: The Case of Historical Sociology. In J. Adams, E.S. Clemens and A. Shola Orloff (eds.): Remaking Modernity: Politics, History and Sociology. Durham: Duke University Press, pp. 109‐157.
Stengers, I. (2002). Pensez avec Whitehead. Paris: Seuil. Sylvester, C. (1994). Feminist Theory and International Relations in a Postmodern Era.
Cambridge: Cambridge University Press. Sylvester, C. (2007). Wither the International at the End of IR. Millennium: Journal of
International Studies, 35(3): 551‐573. Tickner, A.J. (1992). Gender in International Relations: Feminist Perspectives on Achieving
Global Security. New York: Columbia University Press. Tickner, A.J. (1997). You Just Don’t Understand: Troubled Engagements between
Feminists and IR Theorists. International Studies Quarterly, 41(4): 611‐632. Tickner, A.J. (2005a). Gendering a Discipline: Some Feminist Methodological Contributions
to International Relations. Signs: Journal of Women in Culture and Society, 30(4): 2173‐2188.
Tickner, A.J. (2005b). What Is Your Research Program? Some Feminist Answers to International Relations Methodological Questions. International Studies Quarterly, 49(1): 1‐21.
Weber, C. (1999). IR: The Resurrection of New Frontiers of Incorporation. European Journal of International Relations, 5(4): 435‐450.
Wendt, A. (1992). Anarchy Is What States Make of It: The Social Construction of Power Politics. International Organization, 46(2): 391‐425.
Wendt, A. (1999). Social Theory of International Politics. Cambridge: Cambridge University Press.
Whitehead, A.N. (1948). Science and the Modern World. New York: Mentor Books. Wobbe, T. (1996). On the Horizons of a New Discipline: Early Women Sociologists in
Germany. Journal of the Anthropological Society of Oxford, 26(3): 283‐289. Zalewski, M. (2006). Distracted Reflections on the Production, Narration, and Refusal of
Feminist Knowledge in International Relations. In B. Ackerly, M. Stern and J. True (eds.): Feminist Methodologies for International Relations. Cambridge: Cambridge University Press, pp. 42‐61.

STUDIA UNIVERSITATIS BABEŞ‐BOLYAI, SOCIOLOGIA, LV, 1, 2010
METHODOLOGY AND THE QUALITY OF RESEARCH: REFLECTIONS ON AN UNEASY YET
PROMISING RELATIONSHIP
ANCA SIMIONCA* ABSTRACT. This paper starts from the observation that the work experience of people and their understandings related to it occupy an important position far beyond the realm of sociological or anthropological research interests. For this reason, I find it crucial to evaluate the quality of research primarily in relation to its having met the challenge of the political implications. The rich domain of methodological concerns emerged in close connection with the idea of maximizing the extra value added by the scientific accounts in comparison to mere opinions or speculations; in this sense, methodology should be strictly instrumental to a goal that is higher than itself. However, the methodological realm has gained a considerable degree of autonomy in relation to both epistemological preoccupations and those related to more encompassing definitions of the quality of research. It is in this semi‐autonomy of the methodological realm that I find both one of the biggest threats and a great resource for social scientists. Anchoring my discussion in the substantive topic of the realm of work, I describe a mechanism by which both survey methodology and in‐depth anthropological research may end up displacing political implications from the concerns over quality. I continue by arguing in favour of a reflexive and responsible use of methods and devote some space for describing both the potentials and the perils of utilising Sequence Analysis. Keywords: work ethic, managerial careers, flexibility, sequence analysis
The realm of methodology1 occupies a privileged position in relation to assessing what is recognised as good quality research of the social. The rich domain of methodological concerns and discussions emerged in close connection with the idea of maximizing the degree to which the accounts produced by social scientists add an extra value in comparison to mere opinions or speculations; in this sense, methodology should remain strictly instrumental to a goal higher than * Central European University, simionca_anca@ceu‐budapest.edu 1 I refer to the broadest understanding of methodology, that of ideas and rules about how to transform ongoing life into observations that are further the object of analysis and reporting; the specifications for “how to do research” and “how to check whether research was done properly”. Further in the paper, I use more clearly specified definitions of the various methodological aspects I refer to.

ANCA SIMIONCA
258
itself, namely the overall quality of the research outcome. However, I argue that the methodological realm has gained a considerable degree of autonomy in relation to both epistemological preoccupations and those related to more encompassing definitions of the quality of research. First, I refer to the attention given to technicalities in surveys and to practicalities in anthropological research as examples of two mechanisms derived from this autonomy, with different content, but equivalent negative implications for quality. Second, I argue that the relative autonomy from epistemological positions of methodology can be turned to the advantage of the researcher and will further discuss the positive potentialities and the dangers of Sequence Analysis. The main claim of the future discussion is that a conscious and critical instrumentalisation of methodology towards the broader understanding of quality research is not only an effort that might be rewarded, but one that researchers cannot afford moving away from.
While I believe in their wider relevance, I use the substantive topic of individual understandings and practices of work throughout the paper in order to better ground my arguments. Before plunging into the methodological discussion, I will spend some time on substantiating my claim that all accounts centred on the experience of work and the understandings people have of it are intrinsically political in order to alert the reader of the imperative of taking this into consideration when discussing the quality of research.
The intrinsic political tensions of the realm of work
A recurrent concept in conversations concerned with both describing the situation of post‐1989 Romania and with hypothesizing about its causes is mentality. A generously encompassing umbrella, it can stand for issues on a variety of levels: how “Romanians” define what they are entitled to expect from their employer, from the state, from the free market, from the schooling system, from their families or peers; complementarily, how they understand their own role and due contribution vis‐à‐vis these entities. From poverty, inefficient bureaucracy, the outdated educational system to urban landscapes and interactions, mentalities play their role in everything. Mentalities are meta‐individual in the sense that they are shared by a wide category of people; however, the fact that every individual is an embodiment of those mentalities frames the individual responsibility in a particular way. They become a privileged explicatory factor, allowing links to be drawn between individual behaviour and beliefs and a broader societal situation. Consequently, it is the way individuals understand the world and the practices associated with this understanding that account for the aspects for which the new (i.e. post socialist) reality is found faulty. Also, the past and the present become causally connected, so that it is the past that prevents the present from taking the desired shape through having favoured the formation of the wrong (and disturbingly resistant) mentalities; every embodied individual is a carrier and further perpetrator.

METHODOLOGY AND THE QUALITY OF RESEARCH: REFLECTIONS ON AN UNEASY YET PROMISING RELATIONSHIP
259
It is not hard to grasp that the mentality related to work captures most of these tensions: it hints not only to dimensions of proper behaviour within work activities, but carries implicit understandings on the role of the individual in the wider social mechanisms. The over‐usage of this term might rise by now some suspicion against its potential to offer refined understandings of given situations. However, it is far from being an idiom that only populates the explanatory imageries of the “laypeople”, but has a privileged role in the intellectual circles2.
While it has indeed its interesting local flavours, the reason why people’s work ethic is of such significance goes beyond the Romanian (or post‐socialist) context. In a sense, Boltanski and Chiapello (following in a particular way Weber’s initial discussion) also place mentalities at the centre of their understanding of the dynamics of capitalism by attributing such importance to its “spirit”. The way people conceptualise their work is at the heart of the functioning of capitalism itself. Capitalism needs to translate its functioning into categories that people can grasp, which they can relate to and which they would find adequate to justify their engagement in an otherwise absurd system (Boltanski and Chiapello, 2005). Different understandings of the boundaries of work, the ways of and reasons for engagement go together with different overall logics of capitalism. Establishing the hegemony of a certain way for people to understand themselves is vital for the very functioning of capitalism. At the same time, struggles for challenging the hegemony of a certain systemic logic manifest themselves as struggles at the level of individual understandings of the adequate work ethic and conduct.
The attitudes towards work are embedded more or less unequivocally in particular visions of the functioning of the entire social system. More importantly, struggles over the different visions of the macro functioning have their corollaries in one or more aspects of the work ethic of people. Discussions about the understandings of work are inescapably political. The relevant consequence for the current argument is the fact that the account of the social scientist about this realm is delivered in the midst of tensions and is therefore by default political. The quality of the research should not be thought about outside of what it brings to this political space; on the contrary, I argue for bringing the layer of the political implications of framing and reporting research at the centre of the concerns for its quality. 2 For an interesting review of the debates over the way “mentalities” are used, see Heintz, 2005. She argues that they enable convenient causal models for Romanian politicians to responsibilise the individual and by this minimise the role of their own activity. In line with my further argument of the reasons why the work ethic of people is so important, I would draw attention to the more general trend of responsibilizing the individual in the increasingly pervasive neoliberal vein. This is an important point to make, because it takes this responsibilisation from the realm of “incompetent local politicians trying to get away with their incompetence” to its deeper roots. While it can indeed come in handy for such hiding of incompetence, the resonance with wider political discourse remains central.

ANCA SIMIONCA
260
Measuring the understanding and practices of work in surveys
The sociologist presenting a report about various aspects of people’s understandings of work based on a representative sample survey speaks from a powerful position. The report does not come across as just another opinion about reality that is being uttered, but as the result of neutral and distanced analysis; the fact that its language resembles that of the hard sciences and that evidence comes in the form of percentages and coefficients increases the credibility. The array of possible critical questions to ask in order to test whether a given report is legitimately presented as a scientific one is wide. Whether indeed it was measured correctly that 54% of the people in the sample value job security very much and whether indeed all the required conditions are fulfilled so that we can be 95% sure that the actual percentage in the whole population of Romania assigning this importance to job security is somewhere between 51 and 57% would be a small example. These tests of quality are sophisticated and question all the steps, from the design of the questionnaire until the last details of the statistical significance of any difference between two categories that is reported in a footnote. As a consequence, being capable to design and conduct a survey which can stand the test of quality as required by the technical voice is anything but an easy task.
Paradoxically, the strictness of the technical voice can end up significantly factoring into a mechanism that reduces the quality of the research in the broader sense. The multiplicity of issues raised by this one hard to please voice creates the appearance of a consistent and sufficient self‐critical space, which can make its fundamental univocality hard to notice. As technical concerns can easily become a full‐time job, drawing the boundaries of the responsibility of the researcher in a way that would strictly contain them and exclude others – in a logic of the division of labour – seems almost natural: the decisions about the dimensions worth investigating are externalised to other actors, as is the embedding of the findings into wider explanatory discourses.
At the entry edge of the space of responsibility carved in this way, all the researcher does is to help translate the agenda of the actors who have decided (for reasons outside his/her concern span) that the understandings of work are a significant topic into questionnaire items. Whether this step is of good quality or not is again decided in dialogue with the technical voice only; it raises concerns about whether the response scales are well balanced, whether the right decision was taken about including or not a middle option and whether, linguistically speaking, the items are neutrally formulated so that the correct answer is not implied. At the exit end, the sociologist only needs to make sure that the reader is rightly made aware of all the possible sources of (technical) error of the report, that the language is neutral and not

METHODOLOGY AND THE QUALITY OF RESEARCH: REFLECTIONS ON AN UNEASY YET PROMISING RELATIONSHIP
261
explicitly expressing any value judgment about what the new description of empirical reality. Again, the political nature of the lack of any engagement with the ways in which the categories which have just been upgraded to the level of “empirically documented” ones will be further embedded in discourses is effaced.
What is a proper understanding of work and of oneself as a working subject is at the centre of normative projects stemming from different interested positions. Perhaps the strongest one at the moment is the one trying to legitimate an understanding of society as being centred on a flexible economy. The individuals who populate it should therefore understand themselves as autonomous and independent entities, the sole (or at least main) responsible for their success, and consequently expecting a minimum of protection or security from the state, trade unions or their employers; who see their working place as the source of self‐fulfilment, as the place where their potentialities have the chance of being accomplished, where they should invest their creative energies; they should seek and find meaning in constantly upgrading their skills, in reinventing themselves so that they do not become outdated and stay in the way of a harmonious economic development. The flexibility of the economic action requires individuals to value an understanding of actorship that would fit that logic. 3
Therefore, if the questionnaire comprises different dimensions of the operationalised concept of “flexibility”, if we ask questions about “how many jobs have you changed”, “how important is security for you” and “how important is it for you to have the possibility to constantly learn and upgrade your skills” we decide that these are the important dimensions, the dimensions worth being evaluated. The fact that the questionnaire has just ossified the set of categories in which a terrain of multi‐faceted struggles such as the realm of work can be further talked about goes conveniently unnoticed. The uneasiness which would come with acknowledging the deeply political nature of the act that was actually being performed by the research team when designing the questionnaire can be relieved by displacing these concerns into the strict but comforting space of technicality.
The fact that the sociologist is very careful in phrasing the report and does not imply at any point that valuing the security of the work place is another proof of the socialist legacy which is still visible in “Romanians’ mentality”
3 Problematising the existence of shared expectations around the characteristics of a worthy subject might resonate at first glance with the type of concerns quantitative sociologists have for “desirability” as a source of error in measurement. This problem I refer to is at a completely different level and it concerns the researcher rather than the interviewee: questionnaire items trying to grasp “flexibility” are not susceptible to it because respondents have sensed that it is desirable to answer the questions in such ways as to prove their flexibility, but because the researcher does not address the fact that flexibility is an interested category in itself, embedded in a normative vision of the workings of capitalism.

ANCA SIMIONCA
262
does not take away the responsibility of the two acts that were depoliticised through technicality: the responsibility of having included this category in this particular way in the survey and that of not having made the effort of embedding the result in an alternative explanatory discourse, which gives job security another status, while being directly engaged with this possibility4.
What I want to point out as the fundamental problem in the (admittedly extreme) scenario I described above is the way the space of voices that the researcher needs to account for in order to justify the quality of his/her work is structured, namely its technicality centred univocality. The argument that I make throughout this paper is one for a hierarchical plurivocality within these spaces. In this case, it means that the technical voice is indeed important for large scale research borrowing from the insights of probability theory. But more fundamentally, it means that its role should always be subsumed to those drawing the attention to the political acts that any research performs in the end: setting the categories in which a phenomenon can be talked about and opening up the potential of their appropriation into broader discourses as empirically laden facts. Otherwise, just as any other method, the survey could be used in a politically conscious and engaged way. Actually, its legitimacy as a scientific endeavour could be in principle turned around and used as a powerful tool for consciously challenging the grammars of interested actors instead of uncritically reproducing and further empowering them. The fact that the actually existing surveys are unlikely to do it for a great number of reasons is a different (and perhaps fundamental) aspect.
What the voices linking the quality of research directly with its political nature and implications do to the researcher’s overall uneasiness is very different from what the technical one does. The technical voice is harsh, sets high standards and has complex rules to follow, but is at the same time predictable, logical and knowable for sure. At the end of a conversation with it, the researcher might be unhappy with the verdict having specified the degree to which s/he reached the standards, but lives with the comforting sensation that the extent to which the standards were met is entirely knowable; and so are the steps for future improvement. Quite differently, the inbuilt tension in dialogues with the other voices can never be dealt away with completely, nor
4A clarification is needed about my position towards the recent developments which gradually make Romania part of the established international surveys. Rather than implying that nothing meaningful is found out about people’s experiences, I made an effort to show that despite the effort and resources that is being (laudably) channeled into assuring the highest technical standards of conducting research, the empirical material obtained and their embedding in a report or argument is not neutral and a‐political. One of the background narratives which such data is most prone to be integrated in is that of regional or national differences standing for differences in the properness of the work ethic of the people.

METHODOLOGY AND THE QUALITY OF RESEARCH: REFLECTIONS ON AN UNEASY YET PROMISING RELATIONSHIP
263
can the researcher afford the peace of mind coming from the certainty of having done the right thing to the end. Having realised a new layer of political implications of one’s account of reality just delivered in an article does not come with clear steps to be followed towards the improvement. This has profound unsettling qualities for the lived experience of the researcher as a person. One of the important venues for maintaining univocal critical spaces is a more or less conscious effort of dealing away with an unsettling condition on the researcher’s behalf.
Going anthropological?
The anthropological logic of doing research might come to mind as the first place to look for alternatives, given its fundamentally different approach to the relationship between the researcher and the researched world. Its history as a discipline intimately entangled in the colonialist project has favoured various types of self‐other encounters which urged for the problematisation of the role of the researcher as a non‐neutral entity in several ways5. The power asymmetries present both in the process of doing fieldwork and when writing about it, as well as the status of empirical observations as obtenu rather than data are not dealt away with, but rather given crucial importance6.
These epistemological considerations resonate best with certain practices of research and of writing. Prolonged and participant research, in which the researcher spends a long time doing fieldwork, following different threads of informants, treating everything around as a possible source of data, keeping field diaries which contain detailed notes of events, many of which centred on the researcher herself/himself are the usual elements of the anthropological “how to”. The practical voice of this logic of research does not ask questions about neutral formulations or statistical significance of tests, but about the degree of in‐depth‐ness, length of contact and reflexivity.
The anthropological practices of research spring from an epistemological position which takes the political nature of the act of research seriously, as well as the constant need to rethink the implications on this level. However, following these practices does not automatically make the research outcome
5“The desire to speak for others is often born of a desire for mastery, to privilege oneself as the one who more correctly understands the truth about another’s situation or as one who can champion a just cause and thus achieve glory and praise. And the effect of the practice of speaking for others is often, though not always, erasure and a reinscription of sexual, national and other kinds of hierarchies” (Alcoff, 1991:29).
6“We would be better off looking for the natives’ points of view to realise their vision of their worlds while at the same time acknowledging that “we” do not speak from a position outside “their” worlds, but are implicated in them too: through fieldwork, political relations and a variety of global flows” (Narayan, 1993:676).

ANCA SIMIONCA
264
in line with the epistemological nuances they should be embedded in. While raising substantively different issues than the technical voice of the survey, the practicalities voice of the ethnography has an equally limited power in ultimately leading to good research. And can have the exact role of comforting the researcher worried about the quality of her or his endeavour, by judging whether enough time was spent in the field, enough fieldnotes were taken, and whether the self‐reflexivity diary is consistent enough and giving a verdict about the quality based on these parameters.
Shifting back the discussion to the substantive topic of the understandings of work: Monica Heintz rightly notices the centrality of the “mentalities” in the popular, political and policy attempts to make sense of the changes occurring, diagnosing problems and the crafting of solutions (Heintz, 2005). Not only does the political significance of her topic not escape her, but she puts great effort into documenting the extent and depth of this aspect. The crucial step of realizing that how we talk of work and mentalities is of importance, and implicitly that the account of the anthropologist would be integrated in such a tense realm is successfully made. Furthermore, the researcher expresses her commitment to bring a displacement to the lay opinions on the issue and add some extra understanding coming from the anthropological endeavour.
The displacement effort of this piece of research stays at the level of the causes: it is not an essential Romanianness which makes people have the wrong mentalities, but a complex of social and economic factors to which they were equally subjected (Heintz, 2005). While saving the work ethic (introduced as an alternative concept for mentality, one that would be more appropriate for the scientific discourse) from the level of essential national characteristics is indeed a laudable gesture, merely assigning it to a different causal constellation does not do much for challenge already existing discourses. The categories of the discussion remain the same: Romanians (while differently determined), their work ethic, an implicit description of a work ethic that would be the “right” one7 and the wrong socialist mentalities; what follows is playing around with various comparisons using these categories.
The overall argument bluntly reproduces the discourse which presents the socialist Other as having to yet make some effort to rid itself of the (undoubtedly) wrong “socialist legacy” and grasp the proper categories of thought and behaviour that are (just as undoubtedly) found in the free market societies. Anthropological research has not only been used in a way that does not disrupt such a well entrenched meta‐narrative (which was rightly spotted
7 ‐ oddly enough using Max Weber’s “protestant ethic” as an “ideology free” yardstick for empirical reality to be measured against, quite contrary to both the way in which Weber uses it and the understanding stemming from here that Boltanski and Chiappelo give to the “spirit of capitalism”

METHODOLOGY AND THE QUALITY OF RESEARCH: REFLECTIONS ON AN UNEASY YET PROMISING RELATIONSHIP
265
by the researcher as being insinuated at all levels and playing an important role as a justifying token for various reform and policy directions), but it reinforces it and brings the aura of the in‐depth study to its use.
I referred to this example not only because it is one of the few pieces of writing referring to the substantive topic of “work ethic” in Romania, but mainly because it serves instrumental purposes in my overall argument about the role of methodology. I wanted to stress that the main arena for discussing the quality of a piece of research cannot be that of the technical voice versus the practicalities one8. A discussion on the level of “how to” does not automatically neither mirror nor invoke one at the epistemological level. While deeply entangled in the epistemological pillars of the discipline they might be primarily associated with, the “how to”, the “methodology” does have a degree of autonomy from them, or it can negotiate it for itself. Just as we can imagine a scenario in which a survey is used in a political conscious and responsible manner, through the categories it proposes and the way it is embedded back into the discursive realm, it does not take much imagination to see how “in‐depth fieldwork” can be conducted and reported in a way that does not meet any of the epistemological subtleties of anthropology.
By this observation, I wanted to draw attention to a recurring dangerous move: that of using methodological positions as a proxy for epistemological ones. Awareness of the roots of a methodology is important, but it has a limited predictive power over the type of research endeavour it can become embedded in. The centrality of either the technical or the practicalities voice in the space of discussion of the quality of the research is dangerous in a similar way. By the same token, engaging primarily with the toolkit of the “how to” of the other imagined camp does not automatically result in a substantive engagement with neither the underlying assumptions nor the arguments made.
I have described so far ways in which the degree of autonomy of methodology from clear epistemological positions is mainly a negative move. Simply following the methodological standards of any disciplinary niche does not guarantee much else apart from assuring for oneself a space within which the legitimacy of the endeavour is not disputed. However, I would like to stress the positive and constructive potential of this degree of autonomy. I argue that from the fact that methodology can be used to serve different purposes, conscious effort should be put towards instrumentalising it towards the goal of doing aware and responsible research. While it does not guarantee quality outcomes it can be a powerful ally.
8 The practicalities voice could have maybe insisted more on the selection of the organizations to be included in the study; also, for the quantitative sociologist, the way personal anecdotes are included to support arguments with the justification that they speak beyond their singularity might be a scandal; in an anthropological logic, this is a perfectly legitimate practice.

ANCA SIMIONCA
266
How can methods help? The example of Sequence Analysis
In what follows, I will present Sequence Analysis9 as a lens for looking at empirical material that has positive disruptive potentials for talking about the work experience and the understandings people have of it. I argue that the particularities of SA can be mobilised towards the higher goal of research, namely engaging substantively and responsibly with the consequences of the cultural significance of its topic. However, the main status of this presentation is not that of a plea for the proliferation of the use of SA. The plea remains one for awareness of the role and implications of any methodology, for its critical and creative use.
Careers as sequences
SA can be used to engage with longitudinal data obtained in any way. When used with empirical material gathered in the form of working life story interviews, which stand in themselves, the role of SA as simply a lens enabling the analysis to take a particular shape becomes even more salient. Through the way it sets the researcher to look at the empirical material, it promises to operate several welcome disturbances in the way we account for this realm.
As it was introduced partly as a critique to cross‐sectional approaches, SA has incorporating temporality at its core. The unity of a trajectory is taken as the starting point, making salient the evolution in time of a person’s situation and escaping the risk of taking episodes out of the broader life context in which
9 Sequence analysis is a method that was adopted by social scientists from biology, where it was used to analyse protein and DNA sequences (See Abbott, 1990; Abbott and Hrycak, 1990; for a recent critical discussion see Aisenbrey and Fasang, 2010; Brzinsky‐Fay and Kohler, 2010). Sequence data can come from a variety of fields of inquiry, among the most frequent ones are occupational careers, life course research and criminal careers. It is an exploratory method, which aims to discover patterns in the data, by generating typologies of sequences empirically. The entire career (or meaningful selections of it) becomes the unit of analysis. For each dimension on which the career is considered, there is a finite set of “states” in which a person can be at a given moment in time. The definition of these states is the responsibility of the researcher, and the results of the algorithms that are further applied heavily depend on the way these states were conceived. Then, a time unit is chosen (a year, half a year), and for each of these points in time, the adequate category is being assigned. The next step is to compare the coded trajectories to each other. One of the logics of comparison is with a theoretically significant trajectory. The other logic is to establish the degree of difference among each pair of trajectories. The way the comparisons are made is by estimating a distance between them: the minimum combination of replacements and insertions/deletions that need to be performed in order to transform one of the sequences into the other. Different replacements can be assigned different “costs” (matrix of costs between each pair of states) if there is a theoretical reasoning behind this differentiation. The matrix of distances that results between all the pairs of trajectories (after the algorithm is applied) is being further analysed by either cluster analysis or multidimensional scaling, and the final outcome is represented by these empirically generated typologies of sequences.

METHODOLOGY AND THE QUALITY OF RESEARCH: REFLECTIONS ON AN UNEASY YET PROMISING RELATIONSHIP
267
they are embedded. To take an example: in a simple cross‐sectional approach, what an episode of 6 months of unemployment is preceded and followed by in a person’s life is lost for the analyst; the only layer of information that ends up being represented in the “data” is the existence of a case of unemployment in the sample. While easy to consider formally as the same situation, it makes a crucial difference whether this episode was followed by a better position than the one preceding it, or if there is significant difference in the domain in which the person worked before and after. Also, if this episode is part of a succession of unemployment – employment states, it should figure differently in the analysis.
SA allows a focus on subsequences. While maintaining the unity of a trajectory is good when an alternative for a cross‐sectional view, it might be too totalizing. Other levels of zooming in might be of interest: the important similarities or differences between careers might be at smaller levels. It might be the case that what is important is the recurrence of a certain pattern regardless of when in the career of an individual it occurs. Larger scale processes might be visible in the recurrence of a certain pattern at the same historical moment, while in different positions within the various careers themselves.
The algorithms for grouping trajectories can be adapted to serve the logic of accounting for variety which best mirrors the theoretical argument: searching for similarities, exploring crucial types of differences, or comparisons with a theoretically relevant ideal‐type of a trajectory.
These are all relevant potentialities for trying to come up with an account of the understandings and practices of work in Romania, as they help the empirical material oppose resistance to three major dimensions of homogenization as a simplifying gesture: in social time, personal time and across cases. It allows difference to become visible under alternative coordinates than the usual demographic variables. The representativity of the sample of interviewees (even in its qualitative understanding of “conceptual saturation”) would not address these issues. While the way SA is structured as a lens potentates this visibility, it takes the researcher to actually deal with that difference made visible.
Flexibility, sequences and categories
At a first glance, SA's inbuilt necessity for specifying clear categories to which people can be assigned at a given moment makes it particularly unfit when trying to engage with empirical fluidity and fuzziness. However, I will argue that the main unsettling potential the method has in accounting for individual careers comes exactly from what it does to and with categories.
I have hinted before at the centrality of the concept of flexibility and the political stake around people valuing an understanding of themselves as flexible actors. Any argument revolving around flexibility or flexibilization has

ANCA SIMIONCA
268
an underlying imagery of the (most times materialised) potentiality of change. Therefore, the assumption that there are categories among which people switch throughout their career is not something artificially imposed by the method, but one intrinsic to this level of argumentation. What happens most of the times, however, is that what “change” consists of remains underspecified. In what way exactly people have changed or should be eager to change is conveniently left semi‐implicit. This semi‐implicitness on the abstract level of definitions can be instrumental in concrete situations, when the concept of flexibility can be stretched to mean different things serving different purposes.
SA forces spelling out the definitions of “change” that we operate with: the dimensions on which change is to be documented; as well as the space of change – the possible states in which a person can be and then stop being. To take an example: a first legitimate temptation would be to consider the position in an organizational hierarchy and working within a certain firm as two dimension on which change can occur in one’s trajectory.
The interviews I have conducted with middle managers in Cluj made salient the importance of people's trajectories being entangled with the trajectory of a firm. One recurring empirical observation I made was that of people whose enthusiasm and involvement as managers in the firm comes from the fact that they had been with that firm from its beginning or early stages; they have been there at crucial moments in the survival of the firm and feel they had played an important role; their coordination functions came together with centrality in the firm and with their willingness to factor the firms' interest into their decisions because they found it a meaningful entity. A different source of enthusiasm for being a manager, empirically recurrent as well, is managing itself, as a configuration of duties and activities, which is more or less independent of the actual content being managed. People report the tensions of these turning point as being about the new duties, about the increased complexity and responsibility of their job and only secondarily about the firm. Even if the upgrade happens within the same firm, it is not the fact that this firm in its singularity will be a more prosperous one due to their input that elicits most enthusiasm, but the newly arisen opportunity to manage more complexity and to shape the direction of a firm (which might have as well been another one) to a greater extent.
The difference between the two ways of thinking of oneself as a manager and the progression of one’s career that I described above would be lost if that first temptation was followed and their careers were looked at as a succession of positions in a firm and (simultaneously or in parallel) as a succession of positions in the labour market. It was SA's inbuilt necessity for such specification that made visible the understanding of change that I was holding and alerted me to what I was implicitly treating as an identical experience.

METHODOLOGY AND THE QUALITY OF RESEARCH: REFLECTIONS ON AN UNEASY YET PROMISING RELATIONSHIP
269
There is no restriction over the type of categories to be used with SA and they can be brought at the theoretical level needed, and with the content needed. Therefore, an alternative is to inquire into the stakes and tensions of the turning points involving changing firms and/or changing positions on the ladder and to allow these newly emerging dimensions of differentiation to become the categories that SA is fed with. It is a significant step towards unpacking flexibility, decoupling the idea of change (and, more importantly that of stagnation) from it and re‐embedding it in different discursive categories.
While not thick enough in itself, the difference between the two logics in which people can conceive themselves as managers starts opening a space in which the relationship between attachment, willingness to change, involvement and commitment to quality can be reassembled in a different way than the narrative of the flexible individual pushes us to. Attachment to a firm, for example, can be re‐told in a different narrative, that does not stigmatise it as a propensity to stagnation, indicating the negative shadow of the socialist legacy threatening over people's mentality.
SA defined a space to discuss variety and difference, forced out the spelling of the assumptions and acted as a constant reminder that theoretical decisions are taken at every moment as to how the final account is produced. Arguably, this significant dimension of differentiation could have become visible without such an explicit analytical strategy. Indeed, there are many studies that end up presenting typologies of trajectories as a way to convey an argument about variety, without using SA. I would argue that using the method significantly increases the chances of making alternative dimensions of difference visible, as complexity is quite high. Also, it allows for a suggestive conveying of the new categories and dimensions.
Concluding remarks
I have argued that methodology has a certain degree of autonomy from epistemological assumptions and theoretical positions. I have spent some time on delineating what I see as some negative potentialities of this autonomy. However, my main argument is that the methodological level should be seen not only as a dangerous source of perverted legitimization mechanisms, but as an important instrument in the attempt to convey accounts of the social. If held accountable firstly to the political voices in a space of discussion about the quality of research, the voice of technicality or of practicalities can prove sharp and lucid.
I have presented Sequence Analysis as such a potential ally in an attempt to disrupt well entrenched discourses about people's understanding and practices of work. It is hopefully apparent from my discussion that the place I have assigned

ANCA SIMIONCA
270
to the technical voice is a subordinate one. Formal methods – such as Sequence Analysis or Social Network Analysis – come with the great danger of turning their use in attempts to legitimise the scientificity of the endeavour. SA displaces one of the pillars of a positivist view of the world by incorporating temporality and processuality. SNA dissolves another pillar, the view of individuals as isolated entities. In this sense, they are both a shade of critique to inferential statistics and its underlying assumptions about the social. The pillar of scientificity, however, is not explicitly of concern. This makes research based on this type of methodology extremely susceptible of not engaging to the end with the other critical voices, which problematise the status of the social scientists' account. The very introduction to the reader of SA as a method that was adopted from biology plays implicitly to some extent the card of credibility derived from the resemblance to the hard sciences.
Choosing SA as the example for discussing my overall argument in favour of turning methodologies into allies had two reasons: one of them comes from my genuine belief that it is a useful analytical tool. The other reason is related to its problematic status as a methodology rooted only partially in an explicit critique to positivism, which is visible in its in‐built tension with the card of scientificity.
REFERENCES
Abbott, A. (1990). A Primer on Sequence Methods. Organization Science, 1(4), pp. 375‐392. Abbott, A., and Hrycak, A. (1990). Measuring Resemblance in Sequence Data: An Optimal
Matching Analysis of Musicians' Careers. The American Journal of Sociology, 96(1), pp. 144‐185.
Aisenbrey, S., and Fasang, A. (2010). New Life for Old Ideas: The second wave of Sequence Analysis. Bringing the Course back into the Life Course. Sociological Methods Research, 38(3), pp. 420‐462.
Alcoff, L. (1991). The problem of Speaking for Others. Cultural Critique, 20, pp. 5‐32. Boltanski, L., and Chiapello, E. (2005). The New Spirit of Capitalism. London: Verso. Brzinsky‐Fay, C., and Kohler, U. (2010). New Developments in Sequence Analysis.
Sociological Methods Research, 38(3), pp. 359‐364. Heintz, M. (2005). Recycle yourself, be European! Changing Ethic of Work in Romania.
Halle: Halle Studies in the Anthropology of Eurasia Narayan, K. (1993). How Native is a “Native” Anthropologist? American Anthropologist, 95(3),
pp. 671‐686.