SOCIOECONOMIC STATUS, SENSE OF COHEmN(X, · 2005. 2. 12. · University of Alberta SOCIOECONOMIC...
162
University of Alberta SOCIOECONOMIC STATUS, SENSE OF COHEmN(X, AND EIEALTH IN CANADIAN WOMEN JOAND. ING @ A Thesis submitted to the Faculty of Graduate Studies and Research - in partial fùlfillment of the requirements for the degree of MASTER OF NURSING Faculty of Nursing Edmonton, Alberta Spnng 1999
Transcript of SOCIOECONOMIC STATUS, SENSE OF COHEmN(X, · 2005. 2. 12. · University of Alberta SOCIOECONOMIC...

University of Alberta
SOCIOECONOMIC STATUS, SENSE OF COHEmN(X,
AND EIEALTH IN CANADIAN WOMEN
JOAND. ING @
A Thesis submitted to the Faculty of Graduate Studies and Research
- in partial fùlfillment of the requirements for the degree of
MASTER OF NURSING
Faculty of Nursing
Edmonton, Alberta
Spnng 1999

National Library 1+m OfCa",, Bibliothèque nationale du Canada
Acquisitions and Acquisitions et Bibliographie Services services bibliographiques
395 Wellington Street 395. rue Wellington Ottawa ON K1A ON4 Ottawa ON KI A ON4 Canada Canada
The author has granted a non- L'auteur a accordé une licence non exclusive licence allowing the exclusive permettant à la National Library of Canada to Bibliothèque nationale du Canada de reproduce, loan, distribute or seli reproduire, prêter, distribuer ou copies of this thesis in microfonn, vendre des copies de cette thèse sous paper or electronic formats. la fome de microfiche/nlm, de
reproduction sur papier ou sur format électronique.
The author retains ownership of the L'auteur conserve la propriété du copyright in this thesis. Neither the droit d'auteur qui protège cette thèse. thesis nor substantial extracts fkom it Ni la thèse ni des extraits substantiels may be printed or othenvise de celle-ci ne doivent être imprimés reproduced without the author's ou autrement reproduits sans son permission. autorisation.

Abstract
The social and economic environment is recognized as a powerfùl determinant of the
health of Canadian women. The purpose of this study is to explore the role of sense of
coherence (SOC) in the relationship between socioeconomic status (SES) and health
arnong Canadian women. These associations are exarnined usin% the data from the 1994-
95 National Population HeaIth Survey. Results are based on a sarnple of 6,747 women
aged 20-64. Path analyses indicate that SOC mediates the relationship between SES and
health when SES is measured by each of the indicators of income, education, and
occupation. No statistical interaction was identified between SOC and income, or
between SOC and education, but a small interaction effect behveen occupation and SOC
was detected. Results from this analysis suggest that SOC is a psychosocial factor that
intervenes in the SES and health relationship, but SOC does not function as an interactive
buffer to arneliorate the adverse effects of low SES on self-rated health. Implications for
research and for public health nursing practice are discussed.

Acknowledgements
There are many people who have helped me, in one way or another, in the
completion of this work, and to whom 1 convey my sincere thanks.
I wish to acknowledge the contribution made by my committee members. My
thesis supervisor, Dr. Linda Reutter, hm demonstrated immense patience throughout the
many drafls, and her generous donation of her time has been appreciated. 1 am grate£Ûl for
her guidance, thoughtfûlness, and thoroughness. 1 am aIso indebted to Dr. Herb Northcott
whose questions stimulated and shaped this work. Hïs encouragement and wiliingness to
discuss the issues proved valuable. 1 would like to thank Dr. Deanna Williamson for her
insight and suggestions that helped to improve this study. AIthough not a cornmittee
member, the assistance provided by Dr. Chuck Humphrey at the Data Library needs to be
acknowledged.
Finally, 1 must acknowledge my indebtedness to my family for their understanding
and support. To my parents, who have assisted in innumerable ways, 1 offer my gratitude.
To my children, Tara and Christine, who have long since tired of this process, 1 cornmend
them for their understanding. Words are inadequate to express my thanks to rny husband,
Murray, who has patiently endured and supported me through the years.

Table of Contents
Chapter Page
1 . Introduction ....................................................................................................... 1
Statement of the Problem ............................................................................ 5
................................................................................... Purpose of the Study 6
Research Questions ..................................................................................... 6
..................................................................................... Definition of Terms 6
................................................................................... 2 . Review of the Literature -9
............................................................. Socioeconomic Status and Health 10
The Utility of the SocioeconoMc Status hdicators ............................ 11
Ernpiricd Evidence for the Association Between SES and Health ....... 13
........................................................................................ Incorne 13
Education ................................................................................ 14
................................................................................. Occupation 15
.................................... Explanations for the SES-Health Relationship 16
................................................................................... Sense of Coherence 18
................................................................. Sense of Coherence and Health 19
Structurai Factors and Sense of Coherence ................................................ 23
.................................. Family and Comrnunity Infiuences in Early LXe 23
Income and Education ........................................................................ 24
........................................................................................ Occupation 26
Summary .................................................................................................. 27
3 . Methodology ................................................................................................... 29
The Sample ......................................................................................... 29
The Sample Frame ............................................................................. 29
............................................................................ The Sample Design 30
Protection of Human Rights .......................... .. ............................................. 31

Chapter Page
...................................................................................................... Variables 31
.................................................................................. Sense of Coherence 3 2
Self-Rated Health ......................................... .... ........................................ 3 5
............................................................. ........ Educational Attainment ... -36
............................................................... Household Incorne Adequacy 3 6
.......................................................................................... Occupation 3 6
................ Age ... ............................................................................... 3 6
Marital Status .......... .. ......... ... ............................................................... 3 7
Validity of the Survey Instrument ................... ........... ....................................... 37
................................................................................................. Data Analysis 3 7
.......................................................................... Statistical Considerations 38
................................................................................................. Weighting 38
Sample Size .............................................................................................. 39
Data Exploration .............................................................................................. 40
Creation of New Variables ................................................................... 40 . . ............................................................................................. Missmg Data 42
........................................................................................ Methods-of Analysis 44 . . . .
Descriptive Statistics ................................................................................. 44
Bivariate Statistics .................................................................................... 44 . . .............................................................................. Multivanate Analysiç 45
Research Question #1: 1s SOC an Intervening Variable in the SES and Health Relationship? ................................................................................. 46
Research Question #2: Does the Relationship Between Socioeconomic Status and Hedth Vary as a Function of Sense of Coherence? ......................... 48
Multiple Regression With Multiplicative Interaction Terms ....................... 48
Subgroup Anaiysis .................................................................................... 49

Chapter Page
...................................................................................... 4 . Fiidings ............ ... 5 0
......................................................................... Description of the Sample 5 0
........................................ ..................... Demographic Variables ... 5 0
........................................................................ Socioeconomic Status 50
........................................................................ Sense of Coherence 5 5
Self-Rated Kealth ....... .. ...................................................................... 55
Mean and Standard Deviation of the Variables ................................... 5 6 . . ............................................................................ Bivanate Relationships 5 6
.................................................................................. SES and Health 57
....................................................... ......................... SOC and HeaIth : 61
SES and SOC .................................................................................... 62
......................................................................... Multivariate Relationships 69
Data Screening ................................................................................... 69
Research Question #1: 1s SOC an Intervening Variable in the .................................................................. SES-Health Relationship? 70
Regression Analysis Using Incorne as the SES Variable .................................................................................... (Mode1 1) 70
Regression Analysis Using Education as the SES Variable ..................................................... ........................ (Mode1 2) .. 7 4
Regression Analysis Using Occupation as the SES Variable .................................................................................... (Mode1 3) 78
Regression Analysis Using Incorne. Education, and Occupation ....................................... as the SES Variables (Models 4 and 5 ) 8 3
Summary of the Five Path Models ............................................... 91
Research Question #2: Does the Relationship Between SES ............................................. and Health Vary as a Function of SOC? 93
The Interaction of Income and SOC ............................................ 94

Page
The Interaction of Education and SOC ........................................ 97
The Interaction of Occupation and SOC .................................... 100
................................... Surnmary ......................................... .... 103
...................... Discussion ... ....................................................................... 105
............................................................ The SES and Heaith Relationship 105
........................ The Relationship Between SOC and Self-Rated Heaith .,. 109
1s SOC an Intervening Variable in the SES and Heaith Relationship? ...... -110
SOC as a Mediator in the Income and Health Relationship ............... 111
SOC as a Mediator of the Education and HeaIth Relationship ........... 113
SOC as a Mediator in the Occupation and Heaith Relationship ......... 114
.......................................... Age and Marital Status as Predictors of SOC 116
Summq ................................................................................................ 117
Does the SES and Health Relationship Vary as a Function of SOC? ........ 118 . . .
Study Limitations .................................................................................... 119
...................... Recommendations for Future Research .................... .... 121
............................................................ Implications for Nuning Practice 122
................................. .......................................................... Conclusion ... 125
References ............................................................................................................ 126
Appendix A: Sense of Coherence Scale ................................................................. 135
..................... Appendix B : 12 Category Denved Educational Attainment Variable 138
.................................. Appendix C: Income Adequacy in Five Discrete Categories 139
Appendix D: 16 Category Denved Pineo Socioeconornic Occupational
Classification .................................................................................... 140
Appendix E: NPHS Age Cohorts ......................... ..... ..................................... 141

List of Tables
Table Page
Age and Marital Status .................................... .... ................................. .... 51
...................................................... Denved HousehoId Income Adequacy ..... .. 52
............................................................... Highest Level of Education Attained 53
.......................................... Pineo Socioeconomic Classification of Occupation 54
............ ........................................................--..-...-............ Self-Ebted HeaIth ..-. 55
Mean and Standard Deviation of Heaith, SOC. Incorne. Education, Occupation, Marital Status. and Age ........... .. .................................................. 56
Cross-Tabulation of Self-Rated Health by Income Adequacy ........................ ... 57
Cross-Tabulation of Self-Rated Health by Highest Level of Education Attained .......................................................................................... 59
..................................... Cross-Tabulation of Self-Rated Health by Occupation 60
Cross-Tabulation of Self-Rated Health by SOC ............................................. 62
Zero Order CorreIations Between SeK-Rated Health, SOC. Incorne. Education, Occupation. Marital Status. and Age .............................................. 68
Regression Anafysis of SOC on Marital Status. Age. and Incorne .................... 71
Regression Analysis of Self-Rated Health on Marital Status. Age. Incorne. and SOC .......................................................................................... 7 1
Effects of Marital Status. Age. and Income on SOC and Self-Rated Health ...... 74
Regression Analysis of SOC on Age. Marital Status. and Education ............... 75
Regression Analysis of Self-Rated Health on Age. Marital Status. Education and SOC ......................................................................................... 76
Effects of Marital Status. Age. and Education on SOC and Self-Rated Health ............................................................................................ 78
Regression Analysis of SOC on Marital Status. Age. and Occupation ....................................................................................................... (Mode1 3) 7 9
Regression Analysis of Self-Rated Health on Marital Status. Age. Occupation, and SOC ........................................................................................................ 80

Page Table
20. Effects of Marital Status, Age, and Occupation on SOC and SeKRated Heaith ......................~....~.....~.~........................................................ 83
Regression Analysis of SOC on Marital .. -. Status, Age, Incorne, Education, and Occupation ..................................~............................................................ 84
Analysis of Self-Rated Heaith on Marital Status, Age, Income, Education, Occupation, and SOC ..................... .... ........................................................ 86
Effects of Marital Status, Age, Incorne, Education, and Occupation on SeIf-Rated Heaith and SOC (Mode1 4) ........................................................ 88
Effects of Marital Status, Age, Income, and Education on SOC and .......................................................................... SelGRated Healt h (Mode1 5) -9 1
Hierarchical Regression Analysis of Self-Raed Health on Marital ........................................................ Status, Age, Income, and Income x SOC .95
Regression Analysis of Self-Rated Health on Marital Status, Age, and Income by Three Groups of SOC ..........................~.~........~.............................. 96
Hierarchical Regression Analysis of Self-Rated Heait h on Marital Statu, Age, Education, SOC, and Education x SOC ....................................... 98
Regression Analysis of Self-Rated Health on Marital Status, Age, and Education by Three Groups of SOC .......................................................... 99
Hierarchical Regression Analysis of Self-Rated Health on Marital .......................................... Status, Age, Occupation, and Occupation x SOC 101
Regression Analysis of Self-Rated Health on Marital Status, Age, and Occupation by Three Groups of SOC .......................................................... 102

Figure
List of Figures
Page
Conceptual Mode1 of SOC as an Intervening Variable ...................................... 46
................................. Conceptual Mode1 of SOC as a Moderathg Variable .... 48
.................... ............ Mean of SOC Within Income Adequacy Categories .... 6 3
Mean of SOC Within Education Categories ................... .... ................. 64
................................................... Mean of SOC Within Occupation Categories 66
Mean of SOC Within Five Occupation Categories ............................................ 67
Path Mode1 1 With Income ............................................................................. 73
Path Mode1 2 With Education ........................................................................ 77
........................................................................ Path Mode1 3 With Occupation 82
Path Mode1 4 With Income, Education, and Occupation ................................... 87
....................................................... Path Mode1 5 With Income and Education 90

CaAPTER 1
INTRODUCTION
The link between socioeconomic status (SES) and health has been observed
throughout the world and over the centuries (Syme & Berkman, 1976; Williams, 1990). In
Canada this association has not gone unnoticed (Epp, 1986; Lalonde, 1974). In 1986 the
Honorable Jake Epp (1986) released a paper entitled Achieving Health for AU: A
Framework for Heulth Promotion which described the need to "tind ways of reducing
inequities in hedth of low- versus hi&-income groups in Canada" (p. 4) as a national
hedth challenge. This challenge, coupled with the 1st International Conference on HeaIth
Promotion that resulted in the publication of the Ottawa Charter on Health Promotion
(World Health Organization [WHO], 1986), fonnalized the Canadian socio-ecological
approach to health which links the individual's health with his or her environment. The
social and economic environment is now recognized to be a powerful determinant of the
health of Canadians (British Columbia Provincial Health Office, 1994; C P W 1997).
In the period since the release of the Ottawa Charter, other international
conferences and meetings have continued to examine the social, economic, and political
determinants of health. The 3rd International Conference on Health Promotion in
Sundvall Sweden, in 199 1 emphasized the need for a supportive environment for health
where people live, work, and play; and the 4th International conference on Health
Promotion in Jakarta (WHO, 1997) built on the prerequisites for health that were first
described in the Ottawa Charter (WHO, 1986). This conference proclaimed poverty as the
greatest threat to health. The prerequisites for health as outlined in the Jakarta Delcarion
include peace, shelter, social secunty, social relations, food, income, empowerment of
wornen, a stable ecosystem, sustainable resource use, social justice, respect for human
rights, and equity. A challenge was issued to tackle these health determinants in the 21st
century.

Gender is also considered a determinant of health (Kaufert, 1996). Social,
economic, and politicai factors innuence the health of ail Canadians, but because women
are disproportionately located at the lower ecd of the socioeconomic hierarchy, the impact
of these determhants on Canadian women is particdarly relevant (Cohen, 1994; Kaufert,
1996; Love, Jackson, Edwards, & Pederson, 1996; Reutter, Neufeld, & Harrison, 1996).
Social and economic factors may affect men and women dserently, prompting research
on the detemiinants of health that considers gender (Lefebvre, 1996; Love et ai., 1996).
Research has reveded a difEerence in Canadian women's health across the socioeconomic
groups (Adams, 1993; Clarke, 1996; Health Statistics Division, 1995a), yet most of the
research addressing SES and health in women is conducted outside of Canada. Because
the social, economic, and political circumstances ii which women Iive, work, and play
Vary from country to country, research that examines the effect of these factors on the
health of Canadian women is important (Reutter, Neufeld, & Harrison, 1996).
Many theones have been developed to explain how the social and economic
conditions affect health, and a variety of psychosocial, behavioral, biological, and
environmentai factors have been proposed as iduencing this relationship &abonte, 1993;
Williams, 1990). The exact mechanism of influence, however, often remains undetermined.
One factor that has received only limited attention in the exploration of the relationship
between SES and health is a sense of coherence (SOC).
The search for salutogenesis, or the origin of health, led Aaron Antonovsky (1979)
to a belief in the construct he called a "sense of coherence." A sense of coherence is
descnbed as a global orientation that enables one to perceive events of the world as
cornprehensible, manageable, and meaningfûl (Antonovsky, 1 996a). The salutogenic
theory suggests that the strength of one's SOC facilitates the movement toward health
(Antonovsky, 1996b).
Studies from a vanety of populations have supported Antonovsky's (1996a)
speculated link between SOC and health. A relationship between SOC and health has been

found when health has been operationalized by various measures of mental, physical, and
overail health (Antonovsky, 1993; Antonovsky, 1996b; Coe, Romeis, Tang, & Wolinsky,
1990; Nyamathi, 199 1). Research results have shown that those with a strong SOC are
healthier than those with a weaker SOC (Antonovsky, 1996b; Coe et ai., 1990; ~ ~ a m a t h i ,
1991). Evidence of this correlation sparks an interest in exploring the factors that infiuence
the development of a strong SOC, as well as the mechanism by which SOC could
influence heaIth.
If SOC does promote health (although Antonovslq [1996a] recognized the
difficulty in determinhg causality), then how does it work? From studies with Holocaust
survivors, Antonovsky (1979, 1987) contended that those with a strong SOC experience
hardship while remaining healthy. He suggested that in cornpanson to those with a weak
SOC, persons with a strong SOC are more likely to perceive events as nonstressors or to
believe that they can adapt to the dernand imposed by the stressor (Antonovsky, 1987).
SOC, then, is proposed to work by preventing "tension from being transformed into
stress" (p. 13 5) because events are perceived as manageable, comprehensible, and
rneaningful; and the appropriate strategy or resource is selected and mobilized to meet the
demand. Antonovsk (1987) hypothesized that damage to persons with a strong SOC may
also be averted through mobilization of neuroimmunological and neuroendocrinologica1
resources. Thus, a strong SOC may work to protect the individual from the effects of life's
inevitable hardships or stressful events.
Three types of life experiences are said to shape one's SOC: consistency,
underload-overload balances, and participation in socially valued decision making
(Antonovsky, 1996a). According to Antonovsky, these experiences are molded by one's
position in the social structure and by culture. Antonovsky's speculation prompts the
question of the relationship between SES and SOC. Those with inadequate financiai or
educational resources rnay expenence living and working conditions that are not
conducive to the development of a sense of comprehensibility, rnanageability, and

meaningfulness. A low SES could be related to a weak SOC. Perhaps there is a
socioeconomic gradient in SOC as well as in health.
Psychosocial factors, such as stress, social support, perceptions of control, and
health behaviors, have been described by Williams (1990) as potential intervening variables
through which social stratification influences health. If social and econornic environments
influence the formation of SOC, which in tum affects health, then SOC could be added to
the list of psychosocial factors that act as intervening variables in the relationship between
SES and health.
Low SES has been associated with hardships and stressfûl events. Canadian
women with few econornic and education resources suffer fiom the fears and concerns
that arise from a lack of money for basic needs (Seguin, Potvin, St.-Denis, & Loiselle,
1995). Economically disadvantaged women may also be employed in occupations that
require few skills, offer few challenges, and provide little opportunity for autonomy or for
meaningful participation in society. Perhaps SOC acts as a buffer, or a moderator variable
(Wheaton, 1985), by attenuating the negative impact of low SES on health. If SOC acts as
a buffer, then the SES and health relationship would Vary as a function of SOC.
Knowledge of the relationship of SES, SOC, and health in Canadian women has
implications for public health. Because one of the stated prionties of health promotion in
Canada is to reduce inequities in health (Epp, 1986), the identification of the factors that
influence the relationship of socioeconornic status (SES) and health could have
implications for both individuai and population health. If SOC is found to moderate the
deleterious effects of low SES on health, then cornmunities and health workers could
work together to create environrnents that strengthen SOC. If SOC is found to be socially
pattemed, then another explanation for the socioeconornic health gradient could be put
foward. Although psychosocial factors do not provide the entire explanation for the
socioeconomic/health gradient, the recognition that salutogenic factors such as SOC are
socially pattemed would underscore the importance of health promotion strategies that

focus on the sociai and environmental context in which individuals live (Labonte, 1993).
More specifically, public health practitioners need to advocate for living and working
conditions that enhance both health and SOC.
Statement of the Problem
There is a paucity of research on the relationship of SES, SOC, and heaith.
Although there is a theoretical basis for an association between SES and SOC
(Antonovsky, 1996b), empiricai evidence of this correlation has been limited.
Identification of the structural sources of SOC might be obtained by using SOC as a
dependent variable, yet few studies have been conducted this way. Research studies that
include both SOC and socioeconornic indicators have tended to use education, income,
and occupation as control variables (Amon, Rosennueig, & Shwarunann, 1993; Midanik,
Soghikian, Ransom, & Polen, 1992) rather than as variables to be studied. A few studies,
however, have reported a positive correlation between the SES indicators of education,
income, and occupation with SOC (George, 1996; Hood, Beaudet, & Catlin, 1996).
Education, however, has not been shown to be associated with SOC in al1 studies Ofood
et al., 1996; Nyamathi, 1993).
The mechanisrn for the influence of SOC on health has been studied, but with few
conclusions or consistent results. It has been shown that those with a strong SOC perceive
events as less threatening (Antonovsky, 1986; George, 1996; Nyamathi, 1993). Thus,
SOC may indeed operate through the primary appraisal of stressors, contributing to the
perception of the environment as being less of a threat to well-being. The author of a
study of SOC in homeless minority women described the SOC as a "shield (Nyamathi,
1993) fiom the effects of the environment. The protective role of a SOC, however, has
not yet been confirmed. Sense of coherence has not been found to buffer the effects of
stress on depression or psychological distress (Flannery & Flamery, 1990), nor the effects
of recent life events on health (Carmel, Anson, Levenson, Bonneh, & Maoz, 1991; Hood

et al., 1996). The role of SOC as a buffer to the socioeconomic effects on heaith has not
yet been empirically studied.
The relationship of the socioeconomic indicators of education, income, and
occupation with SOC and heaith has not been studied for Canadian women. Multivariate
analysis using both health and SOC as dependent variables could contribute to the
knowledge of this relationship.
Purpose of the Study
The purpose of this study was to explore the relationship between SES, SOC and
health in Canadian adult women by using the 1994-1995 National Population Health
Survey.
Research Questions
The following research questions were addressed:
1. 1s SOC an intervening variable in the SES and health relationship?
2. Does the relationship between SES and health Vary as a function of SOC?
Definition of Terms
Sense of Coherence
Sense of cohererm (SOC) is defined as
a global orientation that expresses the extent to which one has a pervasive, endunng though dynamic feeling of contidence that (a) the stimuli deriving from one's intemal and extemal environments in the course of living are structured, predictable, and explicable; (b) the resources are available to one to meet the demands posed by these stimuli; and (c) these demands are challenges, worthy of investment and engagement. (Antonovsky, 1987, p. 19)
These three core components of SOC are called comprehensibility, manageability, and
meaningfûlness, respectively. Sense of coherence was measured by the scores of the
Orientation to Life Questionnaire (SOC-13) developed by Antonovsky (1987).

Heal t h
The Ottaw~ Charter for Health Promotion (WHO, 1986) described heaith as a
"positive concept emphasizing social and personal resources, as well as physical
capacities." Therefore health is more than the absence of disease and includes aspects of
physical, mental, and social well-being. To achieve health, "an individual or group must be
able to identiQ and to realize aspirations, to satisG needs, and to change or cope with the
environment" (WHO, 1986).
In this study, self-rated health was used as an indicator of health. Self-rated health
is the respondent's perception of his or her own hedth and was measured by the response
to the question, "In general, would you Say that your health is excellent, very good, good,
fair, or poor?" (Health Statistics Division, 1995b). The definition of health that the
individuals use to rate their health is unknown, but they may have considered their
physical, mental, and social well-being.
Socioeconomic Status
The term socioeconomic statzis (SES) is used to describe the "inequality in ranking
that exists in society" (Williams, 1990, p. 83). This stratification results in differences in
opportunities, resources, and quality of life (Link & Phelan, 1995; Ross & Wu, 1995).
Income, education, and occupation are dimensions of social stratification (Liberatos, Link,
& Kelsey, 1988; Williams, 1990) and are cornmody used as indicators of SES. In this
study, SES refers to one or more of the three indicators of income, education, or
occupation.
Income. hcome is an indicator of SES. It has been described as a proxy for the
measure of quality of life (Wilkinson, 1996), matenal circumstances (Arber, 1990), and
access to and control over resources (Macran, 1996). In this study, income is measured by
a five-category derived variable of household income adequacy, which is based on the
total household income and the number of household members.

Education. Edtrcatiorz is an indicator of SES and is considered to be a dimension
of SES that structures income and occupation (Ross & Wu, 1996). In this study,
educational attainment is a 12-category denved variable based on attendance and
completion of educational programs.
Occu~ation. Occupation is an indicator of SES. The respondent's occupational
status was ranked according to the Pineo socioeconomic class&cation system. The
derived 16-category variable is based on the respondent's main job in the previous 12
months.
Marital Status
In this study, current marital stattrs was grouped into t hree categories:
married/cornmon-law/partner, single, and widowed/divorced/separated.
AduIt Women
Fernales who are 18 years and older are considered adtrlt women. In this study,
however, because the age variable is released in cohorts, the adult wornen included in this
study will be between the years of 20 and 64, inclusive.
Intervenine Variable
An intenteribig variable is a variable that is dependent on some other variable but
is also a cause of another dependent variable. In this study, SOC would be an intervening
variable if it was dependent on SES and was also a variable that influenced self-rated
health. In this thesis, the terms brterveriing and mediating are used synonymously.
Moderator Variable
The terms moderator and buffer will be used interchangeably in this study. Sense
of coherence will be considered a moderator if it interacts with SES and reduces the
adverse effect of low SES on health.

CHAPTER 2
REVIEW OF THE LITERATURE
This chapter will provide an o v e ~ e w of the literature that addresses relationships
among SES, SOC, and health. The literature review is organized into four main areas: the
relationship between SES and health, SOC, the association between SOC and health, and
the association between structurai factors and SOC. The review begins with a brief
introduction of the influence of gender, or, more specincally, the iduence of being fernale,
on SES.
It is well documented that SES is a determinant of health; health inequities have
been found to be associated with disadvantages in education, income, and occupation.
Women, however, may be multiply disadvantaged, for not only is gender itself a
determinant of health (Kaufert, 1996), but women are also more likely to belong to the
low SES group. Therefore, women's roles "ampli@ structural inequalities" (Arber, 1990,
p. 37).
One of the determinants of poverty (as rneasured by Statistics Canada low incorne
cutoffs) in Canada is family type. In 1996 single-parent mothers were found to have the
highest poverty rate (6 1 -4%) (and for women under 25 yean, this rate nses to 9 1.3%),
followed by unattached women over 65 years (45.4%) and unattached women under 65
years (39.5%) (National Council of Welfare, 1998). Although women of ail ages are more
likely to be poor compared to their male counterparts, the greatest gender discrepancy is
between older unattached women (45.4%) and older unattached men (29.3%). Women's
poverty is thought to be more visible because an increasing number of women are living
without men (Cohen, 1994). Thus, although they are not the only Canadians living with
low incomes, women are particularly subject to the effects of an unstable or inadequate
income (Vanier Institute of the Farnily, 1994).

Canadian statistics also indicate that education is related to poverty (National
Council of Welfkre, 1998). Individuals with a university degree have a lower rate of
poverty than those with less education. The poverty rate for single-parent mothers with
Iess than high school education is 87.2%, compared to a rate of 51.8% of those who
completed high school. There is a reciprocal relationship between education and poverty,
however, because poverty may. also influence educational oppominities. Family
Ncumstances such as pregnancy and motherhood rnay contnbute to departure from high
school (National Council of Welfue, 1995), and single parenthood may limit opportunities
to retum to school.
The number of women participating in the labor force has steadily increased since
World War II., and today the majority of women are employed (Vanier Institute of the
Family, 1994). However, the average employrnent earnings for women in 1993 was only
72% of the earnings of men (Kaufert, 1996). This may be related to gender difference in
either pay or occupation because women eam Iess than men at al1 leveis of educational
attainrnent (Kaufert, 1996). Women's employment in lower-paying jobs may also
accommodate their need for flexibility to attend to family circumstances (McDaniel,
1993). McDaniel descnbed women who place childcare and farnily care over their own
education and ~ccupation as being "scnpted to care" (p. 170). This "script" may also
structure women's econornic secunty and SES.
Socioeconomic Status and Health
The link between SES and health has been documented for centuries. Athough
there is some randormess in health, ilfness, and length of life, historical records point to
inequities across social groups (MacIntyre, 1994, 1997). Variations in death, disease, and
illness have been observed to be socially pattemed (Li& & Phelan, 1995), and the range
of conditions related to SES suggests that it is a social phenornenon, not merely a spurious
association with a few nsk factors (Wilkinson, 1996). Not oniy is the health differential
evident between the highest and the lowest social group, but research has also

accumulated which points to a socioeconomic gradient in health (Adler et ai., 1994;
Canadian Public Health Association, 1997; Health Statistics Division, 1995a; MacIntyre,
1994). This linear association between SES and heaith is important to consider in the
exploration of the pathways which produce the socioeconomic differentials in health.
The social and econornic environment continues to be considered an important
determinant of health for Canadians living in the 20th centuq. Health inequities remain
despite changes in disease patterns, advances in modem medicine, institution of public
health measures, and the introduction of universal access to health care (Canadian Public
Health Association, 1997; Shah, 1994). The accumulation of Canadian evidence of the
health impacts of socioeconomic status on the working poor, the unemployed, children,
families, women, and seniors (BC Ministry of Hedth, 1 994; CPHq 1997; Dy Arcy &
Siddique, 1985; Mustard & Roos, 1994; Reutter, in press; Roberge, Berthelot, &
Wolfson, 1995) supports socioeconomic factors as detexminants of health.
The Utility of the Socioeconomic Status Indicators
Although much of the research in health is concemed with socioeconornic status as
either a confounder, risk factor, or explanatory variable of heaith status, the various
measures of socioeconomic status were developed pnmarily by sociologists in an attempt
to quanti@ relative position in society (Liberatos et al., 1988). The t e m sorioeconornic
sfahrs is used to describe the "inequality in ranking that exists in society7' (Williams, 1990,
p. 83). Liberatos et al. traced the development of the socioeconomic indicators to the
views of social class held by Karl Marx and Max Weber. Marx emphasized economic
inequaiity, but Weber rooted societal position in three separate but related dimensions of
class, status, and party (or power). Weber's notion of class has an econornic base, status
captures the prestige or honor in the community, and party has a political aspect.
Three indicators of socioeconomic status measures (income, occupation, and
education) are commonly used in North America. These indicators are conceptudly linked
to Weber's class and statu dimensions and, Iike his dimensions, are intertwined. Each of

the three SES indicaton has utility in the investigations of the SES-health relationship and
has aiso been used in the investigation of the socioeconomic differentiaIs in health in
women.
hcome has been descnbed as a proxy for the measure of quality of life (Wilkinson,
1996), as well as access to and control over resources (Liberatos et al., 1988; Macran,
1996). From her studies of women, Arber (1990) has concluded that income, and in
particular household income, has utility as a rneasure of material circumstances. The
influence that income has on opportunities for education as well as access to different
lifestyles and prestige are examples of how incorne overlaps with the education and
occupation dimensions (Liberatos et al., 1988)' and thus may be a descriptor for
something ot her than material circumstances.
Educational attainment is considered a stable, robust, and universal indicator of
SES (Ross & Wu, 1996; Williams, 1990). Because education ofien precedes occupation
and income, it is thought that education is the socioeconomic dimension least affected by
health; it is therefore used when there is concem for the establishment of the causal order
of events. Ross & Wu (1995) described education as the SES dimension most important
to health because it structures both occupation and incorne; therefore it is the "key to
one's position in the stratification system" (p. 720). Education can therefore be used as a
proxy for either economic resources or for lifestyle and social networks (Liberatos et al.,
1988). Education has been found to be a usefiil SES indicator for women because
education is less likely to be influenced by the occupational downgrading that can occur
for women subsequent to leaving the labor market to assume family responsibilities.
Education also has utility as an indicator of health in unemployed women (Arber, 1996).
Occupation can be ranked by two approaches (Liberatos et al., 1988). The prestige
perspective reflects the public opinion of the occupation's level of esteem in the
comrnunity. The socioeconomic approach ranks occupation according to the educational

requirements and monetary benefits. Thus, occupation can be W e d to both the stahis and
class domains of Weber's social class conceptualkation-
The use of occupation as an SES indicator in women is compiicated by the
difficulty in classifjing women who are not currently employed (Arber, 1990; 1996;
Najman, 1993; Ross & Wu, 1995). The alternatives to using current occupation for the
nonemployed are to use the occupational class of the head of the household, use the
individuaïs last main occupation, classiQ the individual as hornernaker, or exclude the
nonemployed from the analysis (Arber, 1996). Arber argued that the last occupation
should be used for the unemployed because the exclusion of this group nom analysis
weakens the observed class inequalities. She contended, however, that using the previous
occupational class provided "fewer clues" about unernployed women's health than it does
about men's.
Which of the SES indicators is best to use to study health has not yet been
detemllned (Liberatos et al., 1988). Some researchers have chosen to use income or
education because of the ramifications for social and educational programs (Najman,
1993; Ross & Wu, 1995). Education may aiso be favored because of the strong direct
effect on health as well as the indirect effect on health through jobs and income (Ross &
Wu, 1995). Yet the indicators of SES may not al1 be rneasuring the same concept; rather,
it is thought that they are rneasuring many dimensions of social stratification that are
synergistically related (Liberatos et al., 1988). This supports the evidence that some
diseases and health outcomes are related to different SES indicators (Arber, 1996; Cairney
& Arnold, 1998; Liberatos et al., 1988).
Empirical Evidence for the Association Between SES and Health
Incorne. The ubiquitous observation of the relationship between health and income
has prompted one observer to ask if they cal1 it "poor health" for a reason (Shweder,
1997). In 1991'79% of Canadian women f?om the lowest income adequacy category
reported health problems, in contrast to 60% of those in the highest income groups

(Statistics Canada, 1994). The 1994-95 National Population Health Survey also reported
an income and health relationship (Health Statistics Division, 1995a). In this survey, 74%
of women in the highest household income group described their health as excelient or
very good compared to only 51% of women in the lowest income adequacy group. A
difference in the proportion of women reporting excellent or very good health was also
evident between each of the household income groups, providing additional evidence for
the socioeconornic gradient in health. Using the 1991 General Social S w e y on Heaith,
Caimey & Arnold (1 998) studied socioeconomic position and health in working aged
Canadians (1 8-64 years). They found that income was significantly related to emotional
disorders, migraines, respiratory problems, stomach ulcers, arthritis, digestive problems,
and self-rated health when the effects of 'risS.' Mestyle behaviors, education, and
occupation were controlled.
Education. The positive relationship between educational anainment and health
has been obsewed using a variety of statistical methods (Ross & Wu, 1995). In a British
study of women between the ages of 20 and 59, Arber (1996) noted that the odds of
"poor health" (a category of self-rated health) were 2.47 times greater in women without
postsecondary education than in those with a university degree. Aithough education was
previously disregarded as a SES indicator, this 199 1-92 British General Household survey
showed that educational qualifications showed a sharper gradient than did occupational
class for women's self-assessed health. The authors of a Nowegian study of women also
noted an appreciable correlation (-30) between years of schooling and self-reported health
(Fylkesnes & Forde, 1992).
Canadian studies have also employed education as an SES indicator in the analysis
of inequalities of health (Shah, 1994). The 1994-95 National Population Health Suwey
(Health Statistics Division, 1995a) revealed an association between health and education
in the Canadian population. Seventy-two percent of those individuals who completed
postsecondary education descnbed their health as either excellent or very good, compared

to only 49% of those without postsecondary education. The positive correlation between
educational attainment and self-rated heaIth remained when self-rated health was regressed
on the demographics variables of age, income, education, race, and marital status (Hood
et al., 1996). In Canadian women, the results from the 1991 Canadian General Social
Survey reveded a deterioration of health with age that was iduenced by education. The
influence of education on health status, measured by the health stahis index (HSI), became
apparent at age 45 and continued throughout the older age groups (Roberge, Berthelot, &
WoKson, 1995).
Occuoation. Much of the research comecting occupation with health has been
conducted in the U.K, where by long tradition social class has been defined by occupation
(Marmot, Kogevinas, & Elston, 1987). Evidence of the SES gradient on women's health
when their last or current occupation was used (Arber, 1996), as well as the interest in
occupation as a determinant of health sparked by the British Whitehall studies of British
civil servants (Evans, 1994), prompts fûrther investigation of health differentials using
occupation as an SES indicator. The Whitehall studies, conducted in one occupational
setting with one employer and in the absence of exposure to a hazardous physical work
environment, proved useful in examining the effects of a social hierarchy on health. These
studies examined the mediating effects of psychosocial factors on the relationship between
social position and rnorbidity znd mortality (Marmot et a[., 1987).
Reports from the British Health and Lifestyle Survey (Macran, Clarke, & Joshi,
1996) and the British General Household Survey (Arber, 1996) reveal that women whose
current or last occupation was in the nonmanual occupations (such as professionals,
teachers, nurses, or clencal workers) had significantly better self-assessed health than
women in the unskilled reference group. This effect continued when income and education
were entered into the modeIs (Macran et al., 1996).
Although Canada has produced studies linking exposure to biological, chernical,
and physical agents in the work environment to specific diseases (Shah, 1994), few

16
Canadian midies have used occupation as an SES indicator in the investigation of social
patternhg of health and illness (Caimey & Arnold, 1996, 1998). Ushg the 1991 General
Social Suwey for adults over 65, Caimey & Roberts (1996) coliapsed the Pineo, Porter,
and McRoberts classifkation of the respondents' last occupation into six categones:
professionals, managers and technicians, skilled, semiskiiied, unskilled, and homemakers.
Using logistic regression, the occupation categories were significantly related to self-rated
health when entered as a set of predictors. Using the same survey, but with 18- to 64-year-
olds, the analysis revealed that only the occupations of f m e r s and nonemployed were
related to any of the health conditions (Cairney & Arnold, 1998). However, in this sarne
data set Roberge et al. (1995) revealed a differentid in health (measured by the health
status index) between the unskilied female workersaged 35 to 64 and their skilled or
professional counterparts.
Ex~lanations for the SES-Health Reiationshi~
The Black Report published in 1980 in Britain outlined four explanatory models
for inequalities in health. These explanations, referred to as the arfi$uct, socid selecrion.
behuvioral. and rn~terialis~/strucïuralist explanations, have continued to stimulate
discussion (Machtyre, 1 997). The artifact explanation highlights the dficulty in
measuring social phenomenon and thus raises the possibility that the observed relationship,
or at least the magnitude of the relationship, may depend on the data. The social selection
explanation, sometimes called the 'drift' explanation, contends that the health of the
individual can influence his or her socioeconomic class; thus there is a downward drift in
status due to poor heaith. The culturalhehavioral explanation, on the other hand, suggests
that the socioeconomic status does influence health, evident by the social patternhg of
health damaging behaviors. Thus, the chosen Mestyle of individuals and the personal
decisions that they make rnediate the socioeconornic status and health relationship.
Machtyre (1997) suggested that although the Black Report working group recognized

the role of these three explanatory rnodels, they espoused the materialist/structuralist
explanation as being the main explanatory model of the inequities in heaith.
The matenalistlstmcturalist explanation recognizes the role of economic and social
factors in the distribution of health and well-being. The physical or matenal conditions of
Me, largely influenced by economic resources, produce differences in health. But the
authors of the Black Report acknowledged the role of the other dimensions of
occupational class that also affect health, such as the degree ofjob stability and security,
job satisfaction, and a physically and mentally stressfil environment (MacIntyre, 1997).
Support has grown for the identification of mechanisms other than the lack of matenal
resources that contribute to the relationship between social status and health (Machtyre,
1994). Investigators have been searching for factors that account for the differentials in
health observed throughout the SES hierarchy, not simply the correlates of poverty
(Adler, 1994; Link & Phelan, 1995; Wilkinson, 1996). Evidence of the socioeconomic
gradient in health has pushed for explanations that go beyond matenal deprivation and
access to resources to explanations that include the role of psychosocial factors.
Williams' (1990) rnodel of the pathways through which SES influences health
includes the role of psychosocial factors. Psychosocial factors, such as stress, social
support, perceptions of control, and health behaviors are described as the intermediate
mechanisms, or the pathways through which the effects of social stratification are
mediated to the individual. This model is congruent with the socioecological or
socioenvironmental view of health that recognizes the social and environmental context in
which individuals live and incorporates psychosocial risk factors and socioenvironmental
nsk conditions (Labonte, 1993). One factor that may be included in the list of
psychosocial factors is sense of coherence (SOC), a construct first described by
Antonovsky (1 979).

Sense of Coherence
Antonovsky (1987) was intrigued with the question, m a t moves people dong
the continuum toward health?'His curiosity was piqued as he interviewed Holocaust
women survivors and discovered that despite unimaginable hardships in their lives, some
continued to be healthy. Antonovsky (1996b) descnbed a salutary factor, or a factor that
promotes the movement toward health, that he called a sense of coherence (SOC). SOC
may provide part of the explanation of how, in a world full of crisis, chronic burdens, and
stressfûl events, some people are able to find "order out of chaos" and remain healthy. In
his search for the crucial elements of the SOC, AntonovsS. (1987, 1996b) untangled three
threads: comprehensibility, manageability, and meaningfulness. These interrelated
components combine ta create a global orientation to life, or a way of viewing the world
with a belief "that things will work out as well as can reasonably be expected"
(Antonovsb, 1987, p. xiii).
Comprehensibility is the component of SOC that allows one to make sense out of
events in the world. Stimuli from the interna1 and extemal environments are perceived as
ordered or structured, rather than chaotic (Antonovsky, 1987). Events are thus viewed as
predictable or, if unexpected, explainable. Comprehensibility anses from "knowing the
rules of the garne" (Ryland & Greenfield, 1991, p. 41).
Manageability is the perception that there are sufficient resources available to meet
demands (Antonovsky, 1987). These resources rnay be controlled by the individual or by a
legitimate other. The belief in the availability of resources that are controlled by oneself, a
spouse, a family member, fnends, colleagues7 or God is gennane to the perception of
manageability.
Central to the SOC is the component of meaningfiilness, the motivational element
of SOC. It describes the extent to which the game is considered "worthy of playing"
(Ryland & Greenfeld, 1991). Those with a strong SOC will have areas of life about which
they care or to which they are cornmitted. Problems are considered challenges, and

demands are worthy of the investment of tirne and energy, as "life makes sense''
(Antonovslq, 1987, p. 18).
The three components are al1 essentid, yet some components take on greater
importance. Meaningfilness is crucial to a SOC. Without this caring or c o d t m e n t ,
comprehensibility and rnanageability are soon at risk because there is no motive to seek
understanding and to search for resources (Antonovsky, 1987). And, without an
understanding of the demand, or comprehensibility, it is udikely that one can consider the
available resources and assess manageability. Despite the differential importance of each
component of SOC, however, Antonovsky believed that successttl coping with the
ubiquitous stressors in life depends on the SOC "as a whole" (Antonovsky, 1987, p. 22),
and it is this successful coping that is the Iink between SOC and health.
Sense of Coherence and HeaIth
As a broad construct, salutogenesis seeks to understand health. Sense of coherence
provides an explanation for how a multitude of resources contribute to health. Because
there is no one resource that is effective in al1 situations, a strong SOC enables individuals
to select and mobilize the appropnate resource to deal with the demand that is
encountered. These resources are labeled generalired resistatice resorrrces (GRRs) and
include material resources such as wealth; persona1 resources such as knowledge and
intelligence; and community and family resources such as social support, cultural!
community identity, and stability (Antonovsky, 1987).
The salutogenic theory suggests that the strength of one's SOC facilitates the
movement toward health (Antonovsky, 1996a). Studies fiom a variety of populations have
confinned this hypothesis by using various measures of mental health (Carmel et al., 199 1;
Dahlin, Cederblad, Antonovsky, & Hagneli, 1990; Dangoor & Florian, 1994; Ryland &
Greenfeld, 1991), physical health (Carmel et al., 199 1; Coe et al., 1990), and self-rated
health (Hood et al., 1996).

Research has dso supported an association between heaith and SOC in the
Canadian population, and authors have noted very little difference in the SOC distribution
by gender (Hood et al., 1996). Three measures of health were used in the 1994- 1995
Canadian National Population Health Survey (NPHS): health utility index, self-rated
health, and chronic conditions. Although there were dserences in the strength of the
associations, SOC is correlated with al1 of these heafth measures. The health utility index,
which incorporates the self-rated fùnction of eight areas of personal health, has the
strongest correlation with SOC (-3 l), followed by self-rated health (.21) and nurnber of
chronic conditions diagnosed by a health professional (. 10). The NPHS is reported to be
the first large-scale survey to incorporate a measure of SOC, and holds promise for future
study .
Most of the SOC Iiterature has been based on cross-sectional surveys
(Antonovsky, 1993; Geyer, 1997). This research method has limitations, specifically the
inability to determine causality. Does a strong SOC lead to perceived good health and to
situations that promote health, or do these factors strengthen SOC? Antonovsky (1996b)
also acknowledged the nonstatic property of SOC and the role of health as a life situation
that can strengthen or debilitate the SOC (Antonovsb, 1987, p. 162). Although the
NPHS 1994-95 is a cross-sectional survey, Statistics Canada has incorporated a
longitudinal component. This may allow for future study to address the concerns of causal
order in the relationship between SOC and health.
The evidence of an association between health and SOC prompts the question,
How does a strong SOC promote health? Antonovsky (1987) believed that the discussion
of the mechanism of the effect of SOC on health needs to include the role of stressors,
tension, and coping. Health status is hypothesized to be reinforced or improved by the
successfùl management of tension. Antonovsky (1996a) believed that whatever the life
situation, the person with a strong SOC is more likely to prevent tension from being
transformed into stress by mobilizing emotional and cognitive intra- and interpersonal and

material resources to cope with problems, as weii as neuroimmunological and
neuroendocrinologicai resources through the central nervous system, which prevents
damage to the organism (Antonovsky, 1987, p. 160). Sense of coherence also affects the
appraisal of stimuli. The individual with a strong SOC is more likely to define a stimulus as
a nonstressor, or if it is considered a stressor, to regard it as benign.
There is increasing empirical support for the contention that SOC infiuences
appraisai. In a shidy of home health care workers, George (1 996) found that those with a
strong SOC perceived the environment to be less threatening than did those with a weak
SOC. A negative correlation between SOC and trait anxiety (a chronic disposition to react
with anxiety) c o h e d AntonovsIq and Sagy's (1986) hypothesis that a person with a
high SOC would perceive situations as less anxiety arousing. Nyamathi's (1993) study of
the relationship of SOC, concerns, appraisai of threat, and emotionai distress in minority
women at high risk for HIV infection revealed that women with a strong SOC perceived
their concerns and threats as less serious than did those with a weak SOC. Using path
analysis, Nyamathi found that the relationship between SOC and distress was mediated by
the women's appraisal of threat fiom the environment. These studies supported the
hypothesis that the more one perceives one's world as predictable, manageable, and
comprehensible, the more likely one is to perceive events and situations as nonthreatening.
Antonovse (1996a) raised the question of whether SOC acts as a buffer. The term
bufler has been used in stress research to refer to a resource that reduces the impact of
social stressors on health outcomes. One of the models that depict this stress-buffering
effect is the interactive effect buffering model. In this model, stress has less impact on
health when the coping resource is present (Wheaton, 1985). Whereas the main effect
model describes an overaII beneficial effect of the resource, the buffering model predicts a
protection fiom the adverse effect of stress. Thus, individuals with low SES and low SOC
will show disproportionately poorer health than those with Iow SES and high SOC (Cohen
& Wills, 1985).

The literature descnbes two rnethods to detect an interaction. One method is to
mode1 interaction in a multiple regression with a multiplicative term (Cohen & Wills,
1985; Hayduk & Womacott, 1980; Wheaton, 1985). Another way to identify an
interaction is to compare regression lines of different levels of the coping resource as the
control variable (Agresti & Finlay, 1986).
The moderating effect of sense of coherence has been tested in a number of studies
using multiplicative interaction terms. In an Amencan sample of adult evening college
students, SOC was not found to buffer the effects of life stress on psychological distress
(Flannery & Flannery, 1990). An Israeli study explored the relationship between recent Life
events (RLE), SOC, and measures of health for men and women living on a kibbutz
(Carmel et al., 199 1). When psychological well-being, physical well-being, and functional
ability were each regressed on sex, age, RLE, and SOC, SOC reduced to a small extent
the negative effect of EUE on health; however, the interaction terrn of RLE and SOC was
not statistically significant. The authors concluded that SOC did not buffer the effect of
1ife events on health.
Canadian researchers have used the National Population Health Survey to explore
the relationship of stress events, SOC, and health by using interaction variables of SOC
with recent life events and with traumatic events during childhood or young adulthood
(Hood et al., 1996). The interaction variable (life events x SOC) was significant for the
regressions in only one of the three health rneasures (health utility index). The authors
suggested that the nonsignificant findings for the other health variables may be related to
the recent life events measure, which inciuded events that occurred to the subject and to
those "close7~ to the respondent. The interaction variable (traumatic events x SOC),
however, was significant for al1 of the health measures. Further analysis found that those
who were exposed to trauma in childhood had a lower mean health utility score than those
who were not, but the difference between the groups was greater for those with a low

SOC. The authors concluded that a strong SOC diminished the impact of traumatic events
during childhood on health.
Structural Factors and Sense of Coherence
The evidence for an association between SOC and health has resulted in a search
for the factors influentid in the development of SOC. What are the sources of SOC?
Antonovsky (1987, p. 127) speculated that SOC develops as a result of life experiences
that provide consistency, an underload-overload balance of stimuli, and participation in
socialIy valued decision making. The family, community, and society may pattern these life
experiences. These life expenences are ofken stmcturally or socially patterned, hence
providing the link between SES and SOC.
Familv and Communitv Influences in Earlv Life .
Antonovsky (1987) and Ryland and Greenfeld (199 1) considered the life
experiences of childhood, adolescence. and the first decade of adulthood to be crucial to
the formation of SOC. Antonovsky (2996b) suggested that a person's SOC is more or Iess
stabilized by the age of 30, the time at which one has spent a number of years in the work
and farnily situation of one's culture and subculture. Suppon for the contention that SOC
is relatively stable by the age of 30 is difficult to ascertain in the cross-sectional studies.
Some studies have noted a positive correlation of SOC with age (Antonovsky & Sagy,
1986; Ryland & Greenfeld, 199 1). Analysis from the NPHS indicated a positive (-22)
correlation (Hood et al., 1996).
Research has described the charactenstics of childhood life experiences that
promote a strong SOC. Sagy and Antonovsky (1996) conducted partially structured life-
story in-depth interviews with two retired Israeli women to evaluate the extent to which
their childhoods were characterized by order and clear messages, appropnate demands,
and a sense of belonging. This qualitative research found that these experiences differed in
individuals with contrasting SOC, and the authors concluded that childhood life
experiences shape coping ability and SOC. Although this case study was limited by the

sarnple size, the study's conclusion has also been supported by evidence nom the
Canadian NPHS of a negative correlation between SOC and traumatic events in childhood
Wood et al., 1996). The identification of cornmunity stability as a predictor of SOC in a
cross-sectional study of Israeli high school students, some of whom were to be evacuated
from the Sinai, also supports the importance of consistency in early life (Antonovslq &
Sagy, 1986).
The extent to which early life experiences are consistent and load balanced, and
ailow for participation in socialiy vaiued decision making may vaiy with SES. Children
raised in homes with insufficient resources (for food, shelter, or clothing; or to participate
in meaningfûl leisure/cultural activities); teenagers attending school with little support
from home; or young adults facing unemployrnent may not have the opportunities for
expenences that strengthen SOC.
Although SOC is thought to be an individual dispositional orientation that is
influenced by family, genetics, chance, and other personality-shaping factors in early life
(Antonovsb, 1996a), Antonovsky (1992) also acknowledged the structural sources of
SOC in later Iife. Sense of coherence is thought to be determined by the pattern of life
expenences that are molded by "one's position in the social structure and by one's
culture" (Antonovsky, 1996% p. 15). Because SES is a measure of one's position in the
social structure, a theoretical premise can be made for an association between SOC and
SES.
Income and Education
The role of resources seems cntical to the discussion of the link between SOC and
SES. In addition to the use of SES as an indicator of one's ranking in society (Williams,
1990), SES is also used as a measure of the access to resources such as knowledge,
money, power, prestige, and social connectedness (Link & Phelan, 1995). Social class and
societal conditions influence the availability of generalized resistance resources, which in
tum affect the formation and maintenance of SOC (Antonovsky, 1987, p. 91). But there is

a synergistic relationship between SOC and GRRs. Resources detemîne and reinforce
SOC, and SOC detennines the extent to which available resources are utilized (Sullivan,
1993). This reciprocal relationship is important to consider in discussions of SOC and
SES.
Although intuitively it would seem that women with inadequate financial or
educational resources might be in situations that are not conducive to the creation andlor
maintenance of a strong SOC, few researchers have used SES variables to predict SOC.
Nyamathi (1993) investigated the relationship of SOC, concems, appraisal of threat,
emotional distress, and high-nsk behavior in 581 minonty women considered to be at risk
for HIV infection. In this study, homelessness, a life situation that may be considered a
dimension of SES, was not related to SOC. Education was dso not associated with SOC,
which led the authors to speculate that SOC may reflect a belief system, cognitive
structure, or "orientation to Me" that is unaEected by skill acquisition.
A study using the 1994- 1995 NPHS data reported the correlation coefficients
between SOC and socio-demographic factors (Hood et al., 1996). In this study, the
income and education variables were treated as categorical. Those in the lowest income
group had a lower SOC than did dl other income groups. Education also shows a general
trend: the more education, the stronger the SOC. However, this relationship is weaker
than for income.
Further analysis of the relationship of SOC with education and income is
wmanted. A study of Amencan home health care workers reported a significant
association between education and SOC (George, 1996), yet the Nyamathi (1993) study
of minority wornen did not. The relationship of education and SOC in the NPHS study,
which included both males and fernales, was weak Wood et al., 1996). The role of income
in the relationship with SOC is relatively unexplored, yet the bivariate correlation in the
NPHS study prompts fùrther consideration.

Occu~ation
Antonovsky (1 987) hypothesized that one's work is a life expenence that can
provide consistency, load balance, and participation in decision making, and hence may
influence SOC. Joy and pnde in one's work as well as the cultural value of the work may
enhance meaningfulness, as may the opportunity for choice in tasks, sequence, and Pace of
work, often referred to as decisiotz latitude (Antonovsky, 1 9 87). B ecause the perception
of manageability is iduenced by experiences of appropriate load balance, the availability
of resources at work is significant to prevent situations of overload. Antonovslq ((1987)
also wamed, however, of the dangers of underload that can occur with work positions that
disregard individual potential. Perhaps this has implications in situations where low-wage
jobs require few skills and are not socially valued, situations that are particularly relevant
for women who are clustered in jobs as clerical, factory, and service workers (Cohen,
1994; Kaufert, 1996). Finally, a sense of cornprehensibility is thought to be created by
consistent work experiences, shared values and expectations, and job security
(Antonovslq, 1987, p. 1 15).
A few studies have explored SOC in occupational settings. Sense of coherence has
been studied as part of work stress research with occupations such as university professors
(Ryland & Greenfeld, 199 1) and nephrology nurses (Lewis, Borner, Campbell; Cooper, &
Willard, 1994). Oniy one study was found that compared SOC in different occupations in
the same work environment. George (1996) reported that when home health field workers
were divided into occupational groups, home health care aides had the lowest SOC,
followed by registered nurses and social workers. The authors concluded that factors
contnbuting to the low SOC of home health aides were their perceived inability to rehse
assignments that had a potential for nsk and their position at the "lowest end of the totem
pole" in home health care. This study, however, did not disentangle the effects of income
or education fiom occupation.

Although Antonovsky (1987) described the different work environments that
hypothetically could infiuence the formation and maintenance of SOC, research has not yet
confkned the relationship. Research concerning the variations of SOC among diEerent
occupations and work situations has been limited.
Summary
In surnmary, the relationship between SES, SOC, and health has not been
adequately explored. Many researchers have described the relationship between SES and
health, yet empincal evidence for an association between SES and SOC has been lirnited.
Although some studies have used the SES indicators as control variables (Anson,
Rosemeig, & Shwarunann, 1993; Midanik, Soghikian, Ransom, & Polen, 1992), there
has been a paucity of studies that have specifically examined the infiuence of SES on SOC.
Identification of the stnictural sources of SOC might be obtained by using SOC as a
dependent variable, yet few studies have been conducted this way. Although the literature
has focused on other psychosocial factors that mediate the effect of SES on health (Adler,
1994; Williams, 1990), SOC has not been identified as an intervening variable in the SES
and health relationship.
The mechanisrn for the influence of SOC on health has been examined, but with
inconsistent results. Sense of coherence has not been found to buffer the effects of stress
on depression or psychological distress (Flannery & Flannery, 1990), nor the effects of
recent life events on health (Carmel, Anson, Levenson, Bomeh, & Maoz, 199 1). Using
the NPHS data, Hood et al. (1996) found that the interaction variable of recent life events
and SOC was significant only in the regression using the health utility index as a dependent
variable, yet the interaction variable (traumatic events x SOC) was significant for al1 of the
health measures. The role of SOC as a buffer to the socioeconornic effects on health has
not yet been empiricaliy studied.
There is a gap in the literature on the impact of the social and economic
environment on the health of Canadian women. Few studies utilized the SES indicators of

income and education as explanatory variables of women's health, and even fewer
discussed the eEect of occupation. Although much of Antonovsky's (1987) original work
was conducted by examining the experiences of women, and he related SOC to the roles
and occupations of women, few studies explaining the role of SOC have been specific to
women or have descnbed the relationship between occupation and SOC.

CHAPTER 3
METHODOLOGY
A correlational study was employed to describe the relationship among the
variables of SES, SOC, and health in Canadian women between the ages of 20 and 64.
This chapter will describe the data source and sample, the variables used in this study, and
the methods of data analysis.
The Sample
The 1994-1995 National Population Health Suwey was used as the source of the
data. The NPHS is a cross-sectional survey of Canadian health status, health services, nsk
factors, and demographic and socioeconomic charactenstics (Tambay & Catlin, 1995).
Basic information such as socioeconomic charactenstics, health care utilization, restriction
of activities, and chronic conditkns are gathered on al1 members of the selected household
through face-to-face computer-assisted interviews. Health information pertaining to the
individual's self-perception of health and health behaviors, however, was collected for
only the randomly selected household individual who became known as the panel
respondent. These panel respondents will be i n t e ~ e w e d at 2-year intervals for up to 20
years, providing the NPHS with a longitudinal component. In this study, only the cross-
sectional data fiom the 1994- 1995 interviews with panel respondents were utilized.
The S a m ~ l e Frame
The NPHS target population includes individuals fiom al1 of the provinces and
territories. An attempt was also made to sample those individuals in long t em care or
residential care facilities. Not included are those living on Indian Reserves, in some remote
areas, and on Canadian Forces Bases (Tambay & Catlin, 1995).

The Sample Design
The NPHS utilized a multistage stratified sampling method, similar to that used by
the Labor Force Survey. Clusters were defined by geography and/or socioeconomic
characteristics and then sampled using a randomized probability-proportional-to-sire
(PPS) sampling scheme, where size is the number of households. Dwelhg lists of the
sampled clusters were obtained, and households were then selected using the
predetennined sample rates. When this resulted in an excessive sample yield, subsarnphg
occurred, and the design weights were altered. Four data-collection penods were utilized:
June, August, and November 1994, as well as March 1995. A cluster was visited during
only one collection period (Tarnbay & Catlin, 1995).
This sample design varied somewhat with the regions. The NPHS Quebec sample
was selected from the dwellings participating in a 1992-93 health survey, which also
utilized clust ers stratified by socioeconomic charactenstics, and selected using PPS
sampling (Tambay & Catlin, 1995). The Northwest Tenitones sample was obtained by
randomly selecting households fiom each cornmunity with a population greater than 100.
In the Yukon, random digit dialing was used in four communities, and a PPS sample was
selected elsewhere.
The provincial sample size was determined by population sizes according to the
199 1 household Census. The disadvantage of this method is that the sample size for
certain regions may be inadequate for provincial use. As a result, some provinces chose to
buy-in or to augment their sample in order to satisfy their own requirements.
Consideration was given to the technique of selecting the panel respondent. The
probability of the selection of one member ofthe household is the inverse of the number of
people in the household, possibly resulting in a panel that overrepresents individuals from
small households, such as the single and the elderly, and underrepresents those fiom large
households, such as parents and dependent children. A "rejective" technique was applied
to the selection of household panel respondents to compensate for this tendency. A

portion of the identified sarnple households was rejected if the household did not have at
l e s t one member under age 25 (Tambay & Catlin, 1995).
The 1994-95 NPHS sarnple size of 26,430 households included the provincial buy-
ins and those households eligible for rejection. Nomesponse biases the sample, because the
sample will dBer f?om the population fiom which it was drawn. Procedures to reduce
nonresponse were implemented. If the household did not agree upon first contact to
participate in the NPHS, the interviewers were instructed to send a letter foliowed by
another visit. Refusals were followed up by senior in te~ewers or supervisors. Numerous
call-backs were made to those households where no one was at home, and appointments
were made for fkture contact if the interviewer's visit was inconvenient. These strategies
resulted in an 88.7% household response rate (Health Statistics Division, 1995b).
Protection of Human Rights
The National Population Health Survey public use file was utilized as the source of
data for this study. In an effort to protect human rights, Statistics Canada releases to the
public use file only information that will not reveal the identity of the respondents. Three
techniques are employed to ensure anonymity in the public use microdata file: Only large
geographic units are reported, detailed response categones are replaced with more general
categories, and some vanables are suppressed (Health Statistics Division, 199%).
Variables
A restricted number of variables were chosen as indicators of the three main
constructs of SES, SOC, and health. The variables of household income adequacy,
educational attainment, and occupation were selected as the SES indicators. S elf-rated
health was selected as the measure to tap the health construct, and the SOC- 13 was used
to measure the sense of coherence constmct. Other variables fiom the data set were age,
marital status, and the statistical weight variable for the female panel respondents. Ody
data from the women aged 20 to 64 were used. Because age and marital status may be

related to the SES indicators, SOC, and self-rated health, age and marital status were used
as control variables.
Sense of Coherence
The construct sense ofcoherence (SOC) was conceptualized in this NPHS survey
as a healthy outlook on life (Hood et al., 1996), or the extent to which individuals perceive
events as comprehensible, manageable, and meaningfbl (Health Statistics Division, 1995b).
The 13-item questionnaire that operationalized the SOC concept includes four items
addressing the concept of rnanageability, four items addressing meaningfulness, and five
items addressing cornprehensibility. The i n t e~ewer read to the panel respondents 13
questions and asked them to respond with a number between O and 6 . The adjectives
describing the anchors of O to 6 were provided by the interviewer for each question, the
responses were summed, and a total SOC score was calculated (measured by the variable
DVSC 194). The higher the total SOC score, the greater the sense of coherence (Hood
et al., 1996).
The SOC construct was first operationalized by Antonovsky (1987) with a
29-item, 7-point semantic differential scale called the Orientation to Life Questiomake.
Based on Guttman's work, Antonovsb developed the scale using a mapping sequence
that required a different element of four facets (modality, source, demand, time), as well as
one of the three SOC components in each item. This formula resulted in each item having
a different facet structure. He later published a shortened version of this questionnaire
(SOC-13), and it was these 13 questions that were utilized in the NPHS (Antonovsky,
1993; Hood et al., 1996) (see Appendix A).
There is one difference in the scale used by NPHS and that of the published
SOC-13, however, making comparison between studies difficult. In the NPHS, each item
is scored from O to 6; the SOC-13 scored each item fiom 1 to 7. The NPHS coding
produced a total SOC score that ranged fiom the lowest possible score of O to t h e highest
possible score of 78.

Previous research has established the reliability of both the original 29-item
questionnaire and the shortened version of 13 items (Antonovsky, 1993). Reliability is a
rneasure of the extent to which the instrument's scores are consistent and repeatable, and
the reiiability coefficient reflects the variance in the test that is attnbuted to a true or
nonrandom variation (Mishel, 1989). Intemal consistency of the SOC and the test-retest
reliability have been reported.
The Cronbach alpha measure of intemal consistency is a measure of the
homogeneity of the various items in an instrument, and a coefficient alpha of greater than
-80 is considered to be an adequate level for research (Nunnally, 1978). The Cronbach
coefficient alpha for SOC-13 has ranged corn -74 to -91, with a mean of .8 î (Antonovslq,
1993). The NPHS SOC Cronbach alpha was reported to be -83 (Hood et al., 1996) and
thus may be considered to have attained an acceptable level of intemal consistency.
The measure of stability, or the test-retest reliability, is an appropnate test for a
concept o r trait thought to be stable over the testing time period. The higher the
coefficient, the more stable the measurement instrument is thought to be. It is generally
used to measure the stability of the instrument and not of the concept being tested (Mishel,
1989). Although research has not yet established the stability of the SOC construct
(Greyer, 1996), Antonovsb (1993) considered SOC to be stable after young adulthood,
and as such has calculated and reported the test-retest reliability. The SOC-29 test-retest
correlations in a group of 33 Israeli medical students was .41 after two years and -91 in a
two-week test-retest situation for 307 US college students (Antonovsky, 1993). The
SOC-13 test- retest reliability coefficient has been calculated in a study of US veterans to
be -77 after 6 months (Coe et al., 1990). The variation of results over time may be related
to the dzerence in the interval of time between testing, or it may be a reflection of a true
change in the construct and not indicative of the reliability of the instniment.
The validity of the SOC-13 is the extent to which the SOC-13 measures what it is
supposed to measure. Colleagues assisted Antonovslq (1993) in the operationalization of

SOC and reviewed the questionnaire items for content and face validity. Since publication
of the SOC instrument, empincal evidence supporting construct validity of SOC has been
reported in the literature. A valid instrument must also be able to discriminate between
other constructs, an issue that remains controversial in the operationakation of SOC.
Convergent validity is a component of construct validity that attempts to cab
validity by using different methods to measure the sarne concept. Attempts to produce a
scale to measure SOC, pnor to the publication of Antonovsky's (1993) scale, enabled
researchers to correlate the different scales to establish convergent validity. Antonovsky
reported that the unpublished correiations ranged ftom -39 to -72.
The means of the SOC-13 questionnaire have aiso been shown to differ with
groups in the predicted direction, and Antonovsky (1993) believed that this evidence
supports the validity of the scale. Nyamathi's (199 1) study of homeless women reported a
mean of 55 that contrasts with the mean of 66 for American female university faculty
members (Ryland & Greenfeld, 199 1) and the mean of 73 -8 for Arnerican home care social
workers (George, 1996).
The extent to which SOC is correlated with constructs to which it is theoretically
iinked provides support for construct validity via extemal association (Mishel, 1989).
Afier the development and publication of the Orientation to Life Questionnaire used to
measure the SOC constmct (Antonovslq, 1987), investigation focused on the relationship
of SOC with various measures of stress, coping, and health outcornes, as well as with
other constmcts that share similar elements with SOC. SOC is positively correlated with
constructs such as interna1 locus of control, self-esteem, hardiness, coping resources, and
trait anxiety, and is negatively correlated with work load, perceived stressors, and distress
(Antonovsky, 1993; Carmel et al., 1991; Dahlin et ai., 1990; Flamery & Flannery, 1990;
Lewis et al., 1994; Nyamathi, 199 1).
Although this correlation with theoretically linked constmcts supports the validity
of the SOC scale? questions are raised if the correlations are too high. Strong correlations

between SOC and depression (r = .75) and mental health (r = 30) have been found
@angoor & Florian, 1994; Flannery, Perry, Penk, & Flannery, 1994), and consequently
have raised concerns about the possible overlap of content items in the SOC scale and the
mental health questionnaire (Dangoor & Florian, 1994), and in the SOC scale and the BDI
depression (Flannery & Flannery, 1990). The ability of the SOC instrument to measure
SOC as a distinct constmct, and not as an inverse measure of depression, is a concem yet
to be addressed (Geyer, 1997). This is not considered an issue for this proposed study
because mental health measures are not directly utilized.
Self-Rrited HeaIth
The NPHS survey utilized the question, "In general would you Say that your health
is excellent, very good, good, fair or poor?" to measure the individual's perception of his
or her own well-being (Health Statistics Division, 1995b). This question has been used as
a measure of health in many surveys, and the literature has reponed support for the
validity of this question as a rneasure of health. It is thought to tap the individual's
evaluation of his or her own health, as well as his or her interpretation of the overall
constmct of health (Bergner & Rothman, 1987; Fylkesnes & Forde, 1992). Because of the
subjectiveness of this measure, a change in physical or psychological functioning may not
necessady affect interpretation of healt h. Nevert heless, self-rated or self-perceived health
has been shown to correlate with other measures of health.
Self-rated health has been correlated with specific health problems, the use of
health care senices, and mortality (Adams, 1993). Self-rated health has been reported to
predict 3- and 6-year mortality in the elderly (Mossey & Shapiro, 1982), and in a 9-year
follow-up study, the relative nsk of cardiac and total mortality for those who reported
poor health was 2.52 compared to those who rated their health as good (Kaplan &
Carnacho, 1983).
The reliability of self-rated health has not been established because a single-item
question cannot be tested for intemal consistency, and test-retest results are not applicable

for this highly subjective measure, which is subject to fluctuations (Bergner & Rothman,
1987). Although reliability cannot be measured, the correlations with other measures of
health provide support for the construct validity of self-perceived health.
Educational Attainment
In this study educational attainrnent was measured with a derived variable
(DVEDC294) based on the individual's response to questions conceming attendance and
completion of educational prograrns (see Appendix B). The categories were coded fiom 1
to 12, with 12 representing the highest level of education.
HousehoPd Income Adequacv
Income adequacy (DMNC594) is derived from the number of people living in the
household and the total household income from al1 sources in the past 12 months.
Individuals are classified into one of five household income groups: lowest income, lower
middle, middle income, upper middle, and highest income (see Appendix C). This derived
variable is more likely than total household income to reflect purchasing power or the
woman's financial ability to provide for the household's basic needs.
Occupation
The Pineo socioeconornic classification is used to derive the occupation variable
(DVPIN94) based on the individual's main job in the previous 12 months. Although the
information on occupation is captured in a four-digit occupation code, only 16 categories
are released to the NPHS public use microdata file (see Appendix D).
Age
The NPHS public use microdata file releases age in five-year cohorts (see
Appendix E). The age variable (AGEGRP) was used to select only the individuals who
were between 20 years and 64 years.

Marital Status
Current marital status (MARSTATG) was grouped into three categories:
married/cornmon-law/partner, single, and widowed/divorcecVçeparated.
Validity of the Survey Instrument
The Computer Assisted Interview process (CAI) was utilized by the NPHS. The
reliability of a survey instrument is enhanced by the interviewer asking the same questions
to al1 respondents using the sarne words (Fowler, 1993). Closed questions, as used in this
study, with the provision of a list of acceptable answers is another way to ensure reliability
because the respondents have the same perception of what constitutes an adequate
answer.
The survey instrument was tested though focus groups and field tests prior to
implementation. Efforts were made to reduce the nonsampling errors in the survey by
implementing quality assurance measures in the data collection (Health Statistics Division,
1995b).
Data Analysis
The NPHS data set for this secondary data analysis was obtained from the
University of Alberta Data Library. Variables which were requested included SOC, self-
rated health, income, education, occupation, age, marital status, and the statistical weight
variables for the fernale panel respondents of the 1994-1995 National Population Health
Survey. Ody data fiom women aged 20-64 were used in this study. Analysis was
conducted using the Statistical Package for Social Sciences (SPSS) Version 8.0 for
Windows, using a .O5 significance level.
The NPHS Public Use Microdata Documentation guidelines that relate to rounding
of estimates and the publication recornmendations were followed (Hedth Statistics
Division, 1995b). Estimates and sums in the main body of a statistical table were rounded
to the nearest hundred units, whereas averages, proportions, rates, and percentages were
computed from unrounded components and then rounded to one decimal.

Statistical Considerations
The type of measurement scale dictates the statistical analysis that is appropriate.
Although traditionally parametric tests have been used only for interval or ratio scales, the
use of these tests on ordinal data has not made a significant difference to the data analysis
resuits (Brink & Wood, 1994). For this study, ordinal variables such as the SES and the
self-rated health vanables were considered to be interval data.
The parameters of the population, or the charactenstics of the population f?om
which the sample was drawn, are of interest to this study. Although these parameters are
unknown, we can make inferences based on the sample data statistics (Agresti & Finlay,
1986). The probability sample design, as described above, enables the employment of a
variety of statisticai toois that can estimate the precision of the sample estimates (Fowler,
1993).
Weighting
Statistics Canada provides a weight variable (Wt6) in their data sets to permit
findings to be generalized to the Canadian population. In a survey in which the results of
the sample are to be generalized to the population, it is assumed that each person in the
sarnple represents him- or herself, as well as several other people not in the sarnple. The
weight is allocated to indicate the number of people that each person represents. Whereas
in a simple probability sample the weight is the same for all individuals, in this complex
rnultistage stratified national survey the weight differs for each individual (Health Statistics
Division, 1995b). The weight (Wt6) variable was used as recomrnended by Statistics
Canada to denve estimates of the population. This weighting procedure, while producing
correct estimates, also calcuIates variances that are almost rneaningless. It also
overestimates the number of cases in each ce11 derived fiom cross-tabulation procedures.
Therefore, in the bivariate and regression analyses the weights on the records were
rescaled so that the average weight (wt) was one (Health Statistics Division, 1995b).

Samole Size
There are several issues to consider when determining the adequacy of the size of
the sample. There are two methods used to determine sample size: ratio of predictors to
cases and power andysis (Polit, 1996).
A quick method of estimating the sarnple size requirement is to calculate the
number of cases based on a ratio of predictors to cases. Tabachnick and FideII (1989)
recommended that for standard multiple or hierarchical regression, at least 20 cases should
be used for each predictor variable. In this study with a maximum of six predictor
variables, at least 120 cases were needed, yet the requirement was saîd to increase ifthe
dependent variable was skewed, the effèct size was srnail, or if measurement error was
expected fiom unreliable variables.
Another more specific method of determining the sample size is to conduct a
power analysis. The power of a study is equal to 1 - B, and a power analysis determines
the sarnple size requirernents needed to reduce the nsk of a Type II error. A Type II error
occurs when the researcher concludes that there is no relationship when in reality there is
(Polit, 1996). To cdculate the sample size needed for use in this multiple regression, the
estimated effect size (small or .02), the number of predictors (6), the desired power (.80),
and the significance criteria (a = -05) were used in the following formula:
where N = estimated number of cases needed; h = tabled value for the specified alpha,
power and 6 predictors (1 3.62); y = estimated effect size; and k = number of predictor
variables. Using this formula, the calculated sample size needed with an estimated small
effect size is 681 cases.
It is apparent that the sample f?om the NPHS will fùlfill the sample size
requirements based on either method. There continues to ex& however, a controversy
about the use of power analysis in detennining the sample size of a survey (Fowler, 1993).

Fowler (1993) cornmented that it is difficult to estimate the desired level of precision or
the specific acceptable rnargin for error in advance. This artificial precision tends to imply
that the onIy source of error is the sampling error, when in reality there will be error fiom
sources other than sampling.
Data Exploration
Frequency tables and histograrns were examined as the first step in data screening
to ensure the inclusion of reIevant variables, the assignment of missing values, the
identification of out-of-range values, and an adequate nurnber of valid cases. Measures of
central tendency, variability, and normality of the variables were also calculated and used
in the creation of new variables.
Creation of New Variables
This study's prernise that the higher the SES and SOC, the greater the self-rated
health was reflected in the original scoring of al1 variables except for occupation and self-
rated health. These two variables were reverse scored to better reflect this study's
conceptual definitions. The occupation variab 1 e was reverse scored to change the
representation of the highest value from farm laborer to self-employed professional. Self-
rated health was reverse scored to change excellent health to represent a high value
(excellent = 5) fiom its previous value of 1.
To facilitate cross-tabulation and subgroup analysis, a new SOC3 variable was
created d e r reviewing the values, distribution, and fiequencies of the SOC variable.
SOC3 was created by considering those within one standard deviation of either side of the
mean as being 'med SOC' and considering those cases outside of this range as either 'high
SOC' or 'Iow SOC.' Because the SOC mean for this study was 57.7 and the standard
deviation was 12.5, the values used to create the SOC3 categories were 0-44 (low SOC),
45-70 (medium SOC), and 7 1-78 (high SOC). About two thirds of those surveyed were
'medium SOC,' one sixth were 'high SOC,' and one sixth were 'low SOC.' This new
variable was labeled as SOC3 and used in the cross-tabulation and subgroup analysis.

The 12-category denved education variable was used in three forms: original 12
categories, collapsed to I l categories, and collapsed to 5 categories. The 12-category
ordinal variable was used in the descriptive analysis and multiple regression, but the 'no
schooling' and 'elementary' categories were collapsed to 'elementary or less' for use in
the anaiysis of variance. This variable was further collapsed to 5 categories to increase the
ce11 fiequency and to enhance ease of interpretation in cross-tabulation. The five
categories were: no schooling/less than e l e m e n t ~ s o m e secoridory =l ; seco~i&ry school
grodratiion = 2; other beyond high schooLhome trade school/some cornmzinity
college/some univrrsiiy = 3 ; trade school/commurtity college certificate/diplorna = 4; and
bachelor/master/rnedicine/PhD = 5.
To describe the relationship between health and specific occupational groups
through cross-tabulation, the occupation variable was collapsed into five categories
labeled as zrnskille~ srrniskilk~ skilkd, matiagerial/techtzical. and professional. Farm
laborers, unskilled manual, and unskilled clerical/sales were labeled as z~nskilled ( I ) ,
semiskilled manual and semiskiIled clericaVsales were f abeled as serniskilled (2). The
farmers, skilled crafts/trades, and the skilled clericaVsales/service were coded as skilied
(3), and the forewomen, supervisors, middle management, and technicians were coded as
ma~tageriaI/technical(4). Finally, the semiprofessional, high-levei management, employed
professionals, and self-employed professionals were categorized as professionals (5). This
facilitated companson with other studies examining health and occupation (Caimey &
Arnold, 1996).
The three categories of marital status (married/common-law/partner, single, and
widowed/divorced/separated) were collapsed to create a dichotomous variable. Attached
(mamed/common-law/partner) was equal to 1, and unattached (single/ widowed/divorced/
separated) was equal to O.
Multiplicative interaction terrns were created by taking the product of the SES
variable and the SOC variable. Three terms were created: Income x SOC, Education x

SOC, and Occupation x SOC. Multicollinearity and the resulting idated standard errors
are recognized concems with the use of interaction terms. To reduce this nsk, the SES
and SOC variables were 'centered' by using the deviation fiom the mean scores, prier to
forming the multiplicative terms (Jacard, Tumsi, & Wan, 1990). For example, Centered
SOC was computed by taking the actual value of SOC and subtracting the SOC mean of
57.7. The variance of these new variables was unchanged from their original form, and
these new centered terms had low correlations with their component parts.
Missinp Data
Missing data in survey research results Rom some subjects refùsing or failing to
respond to certain items while responding to others (Cohen & Cohen, 1983). The
frequency tables for this cohort indicated that the survey collected complete information
for the age, marital status. and self-rated health variables. A proportion of respondents did
not provide responses for the variables of derived income adequacy (4. lx), derived
education, (. 1 %), occupation (3 1.2%), and SOC (4.2%).
Missing data can be treated by either deleting the cases with rnissing values
(listwise deletion), deleting the variables, or substituting the missing value with a group
mean (Tabachnick & Fidell, 1989). Because there is a minimal number of variables being
used in this study, it was problematic to delete the occupation variable with a large number
of missing responses. The large percentage of missing data for the occupation variable
(3 1.2%) can be attributed to the "not applicable" response (28.5%) that was generated if
the respondents had not been employed in the last year. Because this study is interested in
the effect of occupation on health and SOC, occupation was included in this analysis
despite the missing data, resulting in a smaller sample size in the data analysis that utilized
the occupation variable. When occupation was not used as an SES indicator, however, the
complete data set was utilized, allowing for representation from those women not
employed in the previous year.

Missing data are a concem ifthey are not randomly distributed throughout the
wnple. When the presencdabsence of data is related to either the dependent variable or
another predictor variable (Cohen & Cohen, 1983), the deletion of these respondents with
rnissing data (listwise deletion) might bias the sample. Tabachnick and Fide11 (1989)
recommended that the data be tested to determine whether or not the missing responses
are randomly distributed; thus, a dichotomous variable (1 = absent data, O = present) was
created for the income and SOC variables. The presentlabsent SOC variable and the
presentlabsent income variable were then used in regressions. These variables were found
to be statistically insignificant in the regressions with self-rated health as the dependent
variable. When SOC was regressed on the presedabsent income variable, however, the
variable was statistically significant @ = -007). The results of the missing data anaiysis
suggest that the missing income data may be related to the SOC variable.
The regression analysis was then conducted with the incomplete income data cases
by adding the group mean. The regression using the complete and incomplete data cases
was compared, and the dserence was found to be inconsequential, probably related to the
srnall percentage of missing data. Because the substitution of the missing value with the
group mean did not make a significant difference to the regression, only the results of the
regression using listwise deletion is presented.
In summary, the variables with the highest percentage of missing data were
occupation (3 1.2%), SOC (4.2%)- and income (4.1 74). These variables were not deleted
fiom the study. Painvise deletion was used in the bivarïate andysis, and listwise deletion
was used for the multivariate analysis.

Methods of Analysis
Three different methods of analysis were used in this study: descriptive statistics,
bivariate statistics, and multivariate statistics. The data were first explored with descriptive
statistics. The relationship between the SES, SOC, and seif-rated health variables was then
examined with bivariate and multivariate andysis. Multivariate analysis was used to
address the two research questions.
Descriptive Statistics
Descriptive statistics were computed for the age, marital status, incorne adequacy,
educational attainment, occupation, SOC, and self-rated health variables. Information
about the characteristics of the sample was gleaned from an examination of the fiequencies
and frequency histograms. As the underlying assumption for many of the statisticai
procedures concerns the variable's distribution, the measures of central tendency,
measures of dispersion, and results Born the tests of normdity were also reviewed. These
calculations were made with the sampling weight (Wt6) provided by the NPHS.
Bivariate Statistics
An initial indication of the relationship between variables was gamered from cross-
tabulations or cross-classification tables (Agresti & Finlay, 1986). Cross-tabulation was
used to describe the relationship between the independent SES variables and the
dependent self-rated health variable. To make the interpretation more manageable, the
collapsed education and occupation variables were used. Findly, the new SOC3 variable
was cross-tabulated with the dependent self-rated health variable.
In this rnethod of data analysis, information about the relationships is garnered
through the celi entries and the measures of association. The independent variables were
used as the row variables and row percentages were requested. The results were
interpreted by comparing the row percentages down the colurnns. The nature of the
association between the variables was calculated with the Kendall's tau-b. The KendalPs
tau-b measure of association describes the extent to which the ranking of the

respondent on one variable is statistically associated with the ranking on another variable
and takes ties into account (Agresti & Finlay, 1986).
A significant difference arnong the SOC means of the various SES categories
provides evidence of a relationship between SOC and SES. The group mean of the
interval SOC variable was calculated within the categories of the income, education, and
occupation variables. The interval nature of the SOC variables allows for a comparison of
group means by using the analysis of variance (ANOVA) procedure (Agresti & Finlay,
1986; Munroe & Page, 1993). The Tamhane method of post hoc multiple comparison was
conducted to identie which means were different and the extent to which they were
different. The Tamhane rnethod was selected because the Levene's Test for Equality of
Variance was significant for al1 the SES variables, indicating a difference in variability in
SOC between the various SES groups. This t-test adjusts for unequal variance (Nomsis,
1993, #83).
Linear association was then calculated among the marital status, age, income,
education, occupation, SOC, and self-rated health variables. The linear relationship among
the variables was quantified with the Pearson product moment correlation coefficient (E).
Multivariate Analvsis
Although the bivariate analysis provides an initial picture of the relationship
between the variables, multivanate analysis was necessary to address the research
questions. The regression analysis was first explored, however, to determine if the data
met the assumptions of statistical tests. The two research questions were then investigated
utilizing multiple linear regression to conduct path analysis and to explore interactions.

Research Question #l: 1s SOC an Intervening Variable
in the SES and Health Reiationship?
An intervening variable is a term used in path analysis that descnbes a variable that
is both a dependent variable and a predictor variable for another dependent variable. This
study used path analysis, the statistical procedure that utilizes linear regression models to
test theories of causai relationships (Agresti & Finlay, 1986; Musil, Jones, & Wamer,
1998) among the variables. A path model, conceptually displayed in Figure 1, was created
based on a hypothesis of causal order.
SES Healt h
Figzcre 1. Conceptual model of SOC as an intervening variable.
In this rnodel, two dependent variables, SOC and self-rated health, were used. It
was postulated that the SES indicator variables (income, education, and occupation)
contribute to both SOC and health. The mode! tested for a direct SES effect on health as
well as an indirect effect through SOC. SES was proposed to influence SOC, which in
turn affects health. This causal hypothesis describes the indirect effect of SES on health
through SOC.
In this study five path models were analyzed and compared. The first three models
compared the effects of the different SES indicators of income, education, and occupation
on SOC and self-rated health. One of the assumptions, however, of multiple regression
using ordinaty least squares (OLS) estimation is that the variables not specified in the
rnodel and subsumed under the error term are not correlated with variables within the
model. Because the three SES variables are correlated, an omission of the other SES

variables fiom the mode1 could bias or infiate the regression coefficients (Musil, Jones, &
Wamer, 1998; Pedhazur, 1982). In consideration of this potential model specification
error, al1 of the SES variables were then added to the fourth path model. Because the
inclusion of the occupation variable eliminated a substantial proportion of the sample,
specifically the nonworking women, only the education and income SES variables were
used in the fifth path model.
The direct, indirect, and total effects were calculated from the path coefficients.
The direct effects were obtained from the multiple regressions, and the indirect effects
were computed by the product of the coefficients in the chah of effects that leads fiom
SES to health through SOC. The total effects were calculated as the sum of the direct
effect plus the indirect eEect. The unanalyzed components in these path models were the
correlated exogenous variables (Polit, 1996). This included the SES indicaton as well as
the marital status and age variables. Marital status and age were used as control variables
because they were thought to be related to the other variables.
Path coefficients represent the impact one variable has on another in the causal
model and can be represented by standardized coefficients (Bs) or unstandardized
coefficients (b). Both standardized and unstandardized path coefficients have been used in
the past with advocates for both methods. The advantage of standardized path coefficients
is that they are scale fiee and can be compared across different variabies (Pedhazur, 1982).
The major shortcorning of standardized coefficients, however, is that they are population
specific. Information about the variance of the variables is inherent within the standardized
or p coefficient, prompting Duncan (1975) and others (Kim & Mueller, 1976) to urge the
use of bs or mstandardized coefficients, particularly when the objective is to establish
causal models that are invariant across populations. Sewal Wright (as cited in Pedhanir,
1982), who developed the path analysis method, concluded that each method provides a
different perspective of the quantitative information that can be gleaned fiom path

analysis. It is hoped that the blend of the methods wiII enhance the interpretation of the
data. In this study, both unstandardized and standardized coefficients were reported.
Research Question #2: Does the Relationship Between Socioeconomic
Status and Health Vary as a Function of Sense of Coherence?
The second research question sought to h d evidence for an interaction between
each of the three SES indicators and SOC. Statistical interaction is said to occur when the
relationship between two variables changes as the level of a third variable changes (Agresti
& Finlay, 1986). SES and SOC may interact in their effect on the dependent variable of
heafth, SOC could then be described as a moderator variable because the nature of the
relationship between SES and health varies depending on the SOC level (Jaccard, Tumsi,
& Wan, 1990). This moderated causai relationship is modeled with a conceptual diagram
in Figure 2.
SES 1 Health 1
Figure 2. Conceptual mode1 of SOC as a moderating variable.
Two methods were used to address the research question: a multiplicative
interaction term in multiple regression and subgroup anaiysis.
Multi~~le Rearession With Multi~iicative Interaction Terms
A cross-product term or a multiplicative interaction term c m be added to a
multiple regression equation to mode1 interaction (Agresti & Finlay, 1986).
H = a + biSES + bz SOC + b3 SES x SOC + b4Age + bsMS + e (1)
where H = heaith and MS = marital status.
To identi& the effect that SES has on health, equation 1 can be rearranged as suggested
by Hayduk and Wonnacott (1980) and re-expressed as in equations 2 and 3.

H=a+(b1+b3SOC)SES+bzSOC+b4Age+b5MS+e (2)
or H = a + (bz+ b3SES)SOC + b1SES + b4 Age + b~ MS + e (3
It becomes clearer with equation 2 that the impact of SES on health depends on the level
of SOC.
Three regression equations were mn, one for each of the SES variables (incorne,
occupation, education), controlling for age and marital status. Self-rated health was
regressed on the SES indicator, age, marital status, and SOC. To test for an interaction
effect, the multiplicative interaction term was then added to each of the regressions. The
significance of the interaction term and of the ~ ~ c h a n ~ e was noted. The regression
equations used to test for an interaction effect were:
H = a + bJNC + bzSOC -t b3SOC x INC + b4AGE + bsMS + e (4)
H = a + blED + b2SOC + b3SOC x ED + b4AGE + bsMS + e (5)
H = a + brOCC + b2SOC + b3SOC x OCC + bjAGE + bsMS + e (6)
Sub~rour, Analvsis
SeIf-rated health was regressed on each of the socioeconornic indicators for each
of the three subgroups of SOC (low, medium, and high). The or the unstandardized
coefficients of the SES variables were compared across the SOC groups to determine
whether the relationship between SES and health varied with the level of SOC. The
significance of the variation in the bs was calculated with the following equation (Jacard
et al., 1990):

CHAPTER 4
FINDINGS
This chapter reports the findings of the relationship between socioeconomic status,
sense of coherence, and self-rated health in Canadian women between the ages of 20 and
64. It begins with a description of the sample in t ems of age, marital status, income,
education, occupation, SOC (sense of coherence), and self-rated hedth. FolIowing these
descriptive statistics, the analysis of the various bivariate relationships is presented.
Finally, the two research questions are addressed using multivariate analysis.
Description of the Sample
The sarnple for this study included 6,747 females aged 20 to 64. The reported
fiequency statistics will differ fkom this number because the weight (Wt6) variable was
used to derive estimates of the population, as recommended by Statistics Canada.
Demoeraphic Variables
The frequencies of the age and marital status variables are presented in Table 1.
Almost one third (30.1%) of the women were between 30 and 39 years of age. As
expected, there were fewer women in the older cohorts. Only 15.1% of the sample were
reported to be between 55 and 64. Most of the women (69%) were mamed or had a
cornmon-law relationship. More women were single (17.9%) compared to divorced,
separated, or widowed (1 3%). There were no missing responses for these variables.
Socioeconomic Status
Three SES indicators are used in this study: household income adequacy, highest
level of education attained, and occupation.

Table 1
Age and Marital Status
Frequency (in thousands) Percentage Cumulative %
Age
20 to 24 years 902.1 10.4% 10.4%
25 to 29 years 1,058.4 12.2% 22.5%
30 to 34 years
35 to 39 years
40 to 44 years 1,117.7 12.8% 65.6%
45 to 49 years
50 to 59 years
55 to 59 years 684.6 7.9% 92.8%
60 to 64 years 624.8 7.2% 100.0%
Total 8,706.5 100.0%
Marital status
MamecUcommon-law 6,009.0 69.0% 69.0%
Single 1,560.7 17.9% 87.0%
Widowed/divorced/sep. 1,133.6 13.0% 100.0%
Total 8,706.5 100.0%
Note. Cases weighted by sarnpling weight (Wt 6).
The frequency in thousands and the percentage of those in each of the five income
adequacy categories are presented in Table 2. The percentage of those in the upper rniddle
income quintile (3 7.1%) was greater than the other income brackets, while 16.2% were in
the highest income bracket and only 6.3% of the survey population were categorized in
the lowest income quintile.

Table 2
Denved Household Income Adeauacv
Frequency (in thousands) % Valid %
Lowest income quintile 525.6 6.0% 6.3%
Lower rniddle income quintile 1,019.8 1 1.7% 12.2%
Middle income quintile 2,35 1.7 27.0% 28.2%
Upper rniddle income quintile 3,100.5 35-6% 37.1%
Highest income quintile 1,348.9 15. 5% 16.2%
Total
Not stated
Tot al 8,706.5 100.0%
Note. Cases weighted by sampling weight (Wt6).
The frequency of the 12 levels of highest education attained is listed in Table 3.
Not surprisingly, the percentage of those who reported 'no schooling' was only -1%.
Although one fifth (20%) of the surveyed population had not completed high school,
about one third (34.8%) had completed a postsecondary prograrn. At the high end of the
educational attainment scale, 2.3% had attained a master's, doctorate, or medical degree.
Table 4 presents the frequencies of the 16 occupation categories. The semiskilled
clencaVsales/service category had the largest percentage of respondents (20.8%), followed
by skilled clencal/sales/service (14.4%), unskilled clerical sales/services (12.4%), and
semiprofessionals (1 1.9%). Very few respondents repocted the occupations of forewomen
(.3%), famers (.5%), self-employed professionals (.7%), farm laborers (.fi%), and skilled
craftshrades (-9%). Although there were relatively few self-employed professionals (.7%),

Table 3
Hinhest Level of Education Attained
Frequency in thousands 'Y0 Cumulative %
No schooling 13 .O .1% -1%
Elementary school
Some secondary school
Secondary school graduation
Other beyond high school
Some trade school etc.
Some comrnunity college
Some university
Trade school dipkert.
Community college dip/cert.
Bachelor degree (incl. LLB)
Master/doctorate/medicine deg.
Total
Not stated (missing) -- - - - -- -
Note. Cases weighted by sampling weight (Wt6).

Table 4
Pineo Socioeconomic Classification of Occupation
Frequency (in thousands) % Valid % Cumulative %
Farm laborer
Unskilled manud
Unskilled clerical/safes/service
Semi-s kiUed manual
Semi-skilled cIericaVsales/service
Farrners
S killed craftdtrades
Skilled clericai/sales/service
Farmers
Skilled crafts/trades
S killed cIerical/sales/service
Forewomen
Supervisors
Middle management
Technicians
Semiprofessionals
High-level management
Employed professionals
Self-employed professionals - - - - - -
Total 5993.9 68.8% 100%
Missing: not applicable 2483 -2 28.5%
Missing: not stated 229.6 2.6%
Total missing 27 12.7 3 1.2%
Note. Cases weighted by sampling weight (Wt 6).

9.1% were ernployed professionals. The occupation questions were not applicable for
28.5% of the women.
Sense of Coherence
The SOC values ranged frorn a low of 4 to a high of 78 (possible range of O to 78).
The mean, median, and mode of the SOC variable were 57.7, 60, and 64, respectively.
Most of the respondents had SOC values at the upper end of the range. The distribution of
the SOC values was negatively skewed (-.778), but with a positive kurtosis of -417.
Self-Rated Health
Table 5 shows the distnbution of the seIf-rated heaIth variable. Just under two
thirds of the sample (63.6%) described their health as 'very good' (37.1%) or 'excellent'
(26.5%), with the most common response being 'very good.' About one quarter (26.7%)
rated health as 'good,' and only about 10% of the women rated their health as either 'fair'
(7.5%) or 'poor' (2.2%). Similar to the distribution of the SOC variable, the fiequency
distribution of the self-rated health variable is also slightly negatively skewed (-.56),
because most of the respondents reported their health to be in the upper range of the five-
category scale. The survey obtained responses to this question fiorn al1 respondents.
Table 5
Self-Rated Health
Value Frequency in thousands YO Cumulative % Poor 187.2 2.2% 2.2%
Fair 653.7 7.5% 9.7%
Good 232 1.4 26.7% 36.3%
Very good 3234.3 37.1% 73.5%
Excellent 2309.8 26.5% 100.0%
Total 8706.5 100.0%
Note. Cases weighted by sampling weight (Wt 6).

Mean and Standard Deviation of the Variables
The mean and standard deviation of the variables are presented in Table 6. Because
these descriptive statistics were derived for the correlation and regression procedures, they
were weighted with the rescaled weight (wt).
Table 6
Mean and Standard Deviation of Health, SOC, Income, Education, Occupation, Marital
Status, and Age
-
Variable - M - SD - n
Self-rated hedth 3.78
SOC 57.70
Household income adequacy 3 -45
Educational attainment 6.70
Occupation 7.83
Marital status (aîtached = 1) -69
AW 6.56
Note. Cases weighted by rescaled weight (wt).
Bivariate Relationships
In this section 1 present the cross-tabulations of the SES and SOC3 variables with
the dependent self-rated health variable, the cornparison of the SOC means within the SES
categories, and the zero-order correlations. Al1 bivariate relationships were analyzed using
pairwise deletion of rnissing data, and the data were weighted using the rescaled weight
variable (wt).

SES and Health
Cross-tabulations were employed to describe the relationship of the three SES
variables and health. The Kendall's tau+ was used to measure the association between the
row and colurnn variable. The data were weighted using the rescded weight variable (wt).
The cross-tabulation of self-rated health by income is presented in Table 7. The
positive relationship between income and health indicated by the measure of association
(Kendall's tau-b= .166, g = -000) is also evident f?om the ce11 statistics. In this study the
lowest income quintile described health as 'poor' or 'fair' at almost five tirnes the rate of
the highest income quintile. At the other end of the health scale. 37.9% of the highest
income group described their health as 'excellent,' in contrast to 15.3% of the lowest
income group.
Table 7
Cross-Tabulation of Self-Rated Health bv Income Adequacv
Self-rated health
Income adequacy Poor Fair Good good Excellent Total
Lowest income
% within row
Lower middle
% within row
Middle
% within row
Upper middle
% within row
63 413
15.3% 100%
148 80 1
18.5% 100%
410 1850
22.2% 100%
706 243 8
29.0% 100%
(fable continues)

Self-rated health
Very Income adequacy Poor Fair Good good Excellent Total
Highest 5 35 224 395 402 1061
% within row -5% 3.3% 21.1% 3 7.2% 37.9% 100%
Total 13 1 498 1742 2463 1729 6563
% within column 2.0% 7.6% 26.5% 37.5% 26.3% 100%
Note. The independent variable is the row variable. Row percentages were requested. The percentages should be compared down the colurnns. Cases weighted by rescale weight (wt). Kendall's t a u - = -166, p = -000.
The results of this cross-tabulation also provide evidence for an income and health
gradient. With each increment in income categories, a smaller proportion of women
descnbed their health as 'poor,' 'fair,' or 'good'; and a larger proportion of women
described their health as 'excellent. '
Table 8 provides a summary of the cross-tabulation of health by education. To
sirnpli@ interpretation and increase the ce11 frequencies, the education variable was
collapsed into five categories. The results reved a significant positive reiationship between
education and self-rated health (Kendall's tau-6 = .166, = .000), as well as a graded
association with health at al1 levels of education. Whereas 18.9% of women with Iess than
high school education described 'poor' or 'fair' health, only 8.9% of those who had
completed high school and 4% of those with a university degree similarly rated their
health. There were also fewer women (1 6.0%) from the lowest education category than
fiom the highest education category (37.2%) who described their health as 'excellent.' A
greater proportion of women reported 'excellent' health with each increase on the
educational scale.

Table 8
Cross-Tabulation of Self-Rated Health bv Highest LeveI of Education Attained
SeKrated health Highest IeveI of
education Poor Fair Good Very good Excellent Total < High school 57 200 476 413 218 1364
% within row 4.2% 14.7% 34.9% 30-3% 16.0% 100%
High schooI 23 86 340 48 1 3 02 1232
% wit hin row 1.9% 7.0% 18.6% 27.6% 24.5% 100%
Some trade/coll/ univ/other
% within row 1.9% 6.0% 25.9% 39.6% 26.6% 100%
Trade/comm.college 23 8 1 307 528 417 1356
% within row 1.7% 6.0% 22.6% 3 8.9% 30.8% 100%
University degree 9 32 222 3 83 383 1029
% within row -9% 3.1% 2 1.6% 3 7.2% 37.2% 100%
Total 147 51 1 1826 2540 1815 6839
%withincoIumn 2.1% 7.5% 26.7% 37.1% 26.5% 100%
Note. The independent variable is the row variable. Row percentages were requested. Percentages should be examined down the columns. Kendall's tau& = .166, g = -000. Cases weighted by rescaled weight (wt).
The results of the cross-tabulation of health by occupation are displayed in
Table 9. In this analysis, the five category occupation variable was used to increase the ce11
fiequencies. The Kendall's tau-b (-092) was significant (g = -000). When this statistic is
compared with the other health by SES cross-tabulations, the association between
occupation and health is statistically weaker than the relationship of income and education
with health. This is also apparent by examining the ce11 fiequencies. The diEerence
between those who reported 'poor' or 'fair' health at the bottom of the occupational

hierarchy (6.8%) and those at the top (4.1%) was not as substantial as found in the
previous cross-tabulations, and the graded association between health and each level of
the occupational hierarchy was not as distinct.
Table 9
Cross-Tabulation of Self-Rated Health by Occu~ation
- . . . . . - .- .. - . . - - - . . . . .. -
Self-rated heaith
V e v Occupation Poor Fair Good good Excellent Total Uns killed 10 53 25 1 381 234 929
% within row 1.1% 5.7% 27.0% 41.0% 25.2% 100%
% within row -5% 5 -2% 28.6% 42.0% 23.7% 100%
S killed 7 32 196 273 240 748
% within row -9% 4.3% 26.2% 36.5% 32.1% 100%
% within row 5 -9% 25.4% 36.0% 32.8% 100.0%
Professional 13 34 210 460 429 1146
% within row 1.1% 3 .O% 18.3% 40.1% 37.4% 100%
~ o t a l 36 222 1179 1872 1404 4713
% within column -8% 4.7% 25.0% 39.7% 29.8% 100%
Note. Independent variable is the row variable. Row percentages were requested. Percentages should be compared down the columns. Kendall's t a u - = -109, = -000. Cases weighted by rescaled weight (wt).

This cross-tabulation highlights an important difference between the SES
indicators. When the occupation variable is used in the data analysis, the sample is reduced
by 3 1.2% because of the high proportion of women (28.5%) for whom the occupational
questions were not applicable. Only the employed women were included when occupation
was used as an SES variable. This change in sample size also aitered the distribution of
respondents in the self-rated health categones. For example, 9.7% of the respondents in
the hl1 sampie described their health as either 'poor7 or 'fair,' but the cross-tabulation of
health by occupation shows that only 5.5% of this smaller sample similarly rated their
health. A smaller proportion of employed women compared to the total sample of
employed and unemployed women have 'poor' or 'fair' health.
In surnmary, the bivariate anaIysis of the relationship between SES and health
revealed that a greater proportion of the women who described their health as 'poor' or
'fair' were from the lowest-income households, had not completed high school, and were
employed in unskilled jobs. High-income household women, university graduates, and
professionals were more likely than those in any other SES categones to describe their
health as 'excellent. '
SOC and Health
The resu1ts of the cross-tabulation of health 5y the collapsed SOC variabie (SOC3)
are displayed in Table 10. Those with low SOC were more Iikely to describe their health
as 'poor' or 'fair' (21 -3%) than those with high SOC (6.0%). A gradient is also evident at
the other end of the health scale, with 45.2% of those with low SOC describing their
health as 'excellent' or 'very good' compared to 65.5% of those with medium SOC, and
72.9% of those with high SOC. The Kendall's taud for ordinal data was significant
(Kendall's tau+ = -196, p = .000) as the measure of association.

Table 10
Cross-Tabulation of Self-Rated Health by SOC
Self-rated health
V e v Poor Fair Good good Excellent Total
Low SOC 6 1 155 338 330 127 101 1
% within row 6.0% 15.3% 33.4% 32.6% 12.6% 100%
Medium SOC 59 293 1223 1786 1205 4566
% within row 1.3% 6.4% 26.8% 39.1% 26.4% 100%
High SOC 9 5 0 188 324 413 984
% within row -9% 5.1% 19.1% 32.9% 42.0% 100%
Total 129 498 1749 2440 1745 6561
% within row 2.0% 7.6% 26.7% 37.2% 26.6% 100%
Note. The independent variable is the row variable. Row percentages were requested. Percentages should be examined across the columns. KendaIl's tau-b = -196, g = -000. Cases weighted by rescaled weight (wt).
SES and SOC
To identfi a relationship between SOC and SES, the SOC means were calculated
for each SES category and compared. Anaiysis of variance (ANOVA) was used to test for
differences among the group means, and the Tamhane post hoc cornparison procedure was
used to determine which of the means were significantly different fiom the others.
The mean of the SOC variable increased with each incrernent in the household
income adequacy scale, as shown in Figure 3, and the analysis of variance was signifiant
(F[4, 63071 = 47.75, e = -000). The SOC mean ofthe lowest-income adequacy group
(53.23, = 14.08) was significantly lower than that of al1 other groups except the lower
middle-income group (53.43, = 14.63). The SOC mean of the highest-income group
(60.04, = 1 1.00) was found to be significantly higher than the means of al1 other

income categories. The difference between the middle income (57.69, = 12.3 1) and the
upper-middle income group (58.59, = 1 1-83), however, was insignificant.
Lowest lncome Middle lncome Highest Incorne Lower Middle lncurne Upper Middle lncome
lncome Adequacy
Figure 3. Mean of SOC within income adequacy categones, N = 63 12.
The positive relationship between SOC and income is apparent in this bivariate
analysis, but it is interesting to also note the difference in the range of SOC scores within
income groups. Whereas the lowest income group had a SOC range from 4 to 78, the
highest income group's SOC ranged ftorn 21 to 78.
Figure 4 plots the SOC means within the education categories. For this analysis,
the education variable that collapsed 'no schooling' and 'less than elernentary' was used
because of the small group (n = 5) with 'no schooling' who responded to the SOC
question. The results of the ANOVA indicate that the difference in means was significant
(F [IO, 65451 = 10.3, Q = .000), and the Tarnhane post hoc multiple cornparison test
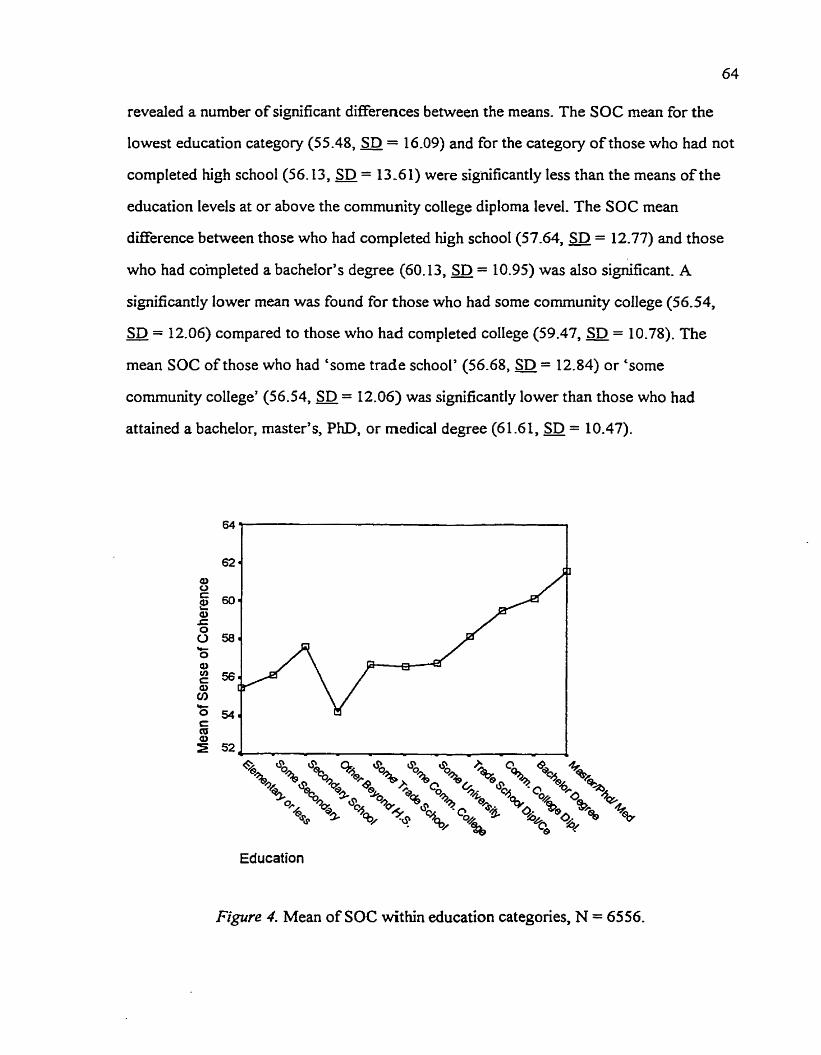
revealed a number of significant differences between the means. The SOC mean for the
lowest education category (55.48, = 16.09) and for the category of those who had not
completed high school(56.13, = 13 -6 1) were significantly less than the means of the
education levels at or above the community college diplorna Ievel. The SOC mean
difference between those who had completed high schooI(57.64, = 12.77) and those
who had completed a bachelor's degree (60.13, = 10.95) was also significant. A
significantly lower mean was found for those who had some community college (56.54,
SD = 12.06) compared to those who had completed college (59.47, = 10.78). The - mean SOC of those who had 'some trade school' (56.68, = 12.84) or 'some
community college' (56.54, = 12.06) was signifkantly lower than those who had
attained a bachelor, master's, PhD, or medical degree (61 -61, = 10.47).
Education
Figure 4. Mean of SOC within education categories, N = 6556.

One interesting trend in these results is noteworthy. Generally, these results
indicate that the greater the education, the higher the SOC level. The SOC means of the
respondents from the educational categories of 'other beyond high school,' 'some trade,'
'some comrnunity college,' and 'some university,' however, were Iower than the SOC
mean of those who had only a high school education. Although a deviation fkom the linear
trend, this difference in the SOC mean between these groups and the mean of the hi&
schooI graduates was not statistically significant.
The SOC means for the 16 difTerent occupations were then compared (Figure 5).
The differences between the means were significant @ [15,4558] = 6.47, Q = .000), and
the post hoc multiple cornpanson tests revealed significant differences in 13 comparisons.
Generally, the SOC means of those in the Iower occupational categories were Iower than
those in the higher occupationa1 categories; however, several deviations fiom this are
evident. The SOC means for farm laborers (60.93, SD = 11 -86) and farmers (60.72,
SD = 1 1.5 1) were surprisingly high considering their placement in the occupational -
hierarchy. It is interesting also to note the relatively low SOC mean (56.48, = 1 1 -77)
of the highest occupational category, the self-employed professionals. It must be noted,
however, that the categories of farmers, farm laborers, and self-employed professionals
had a small sample size, and the SOC means of these three categories were not found to
be significantly different from the other groups.
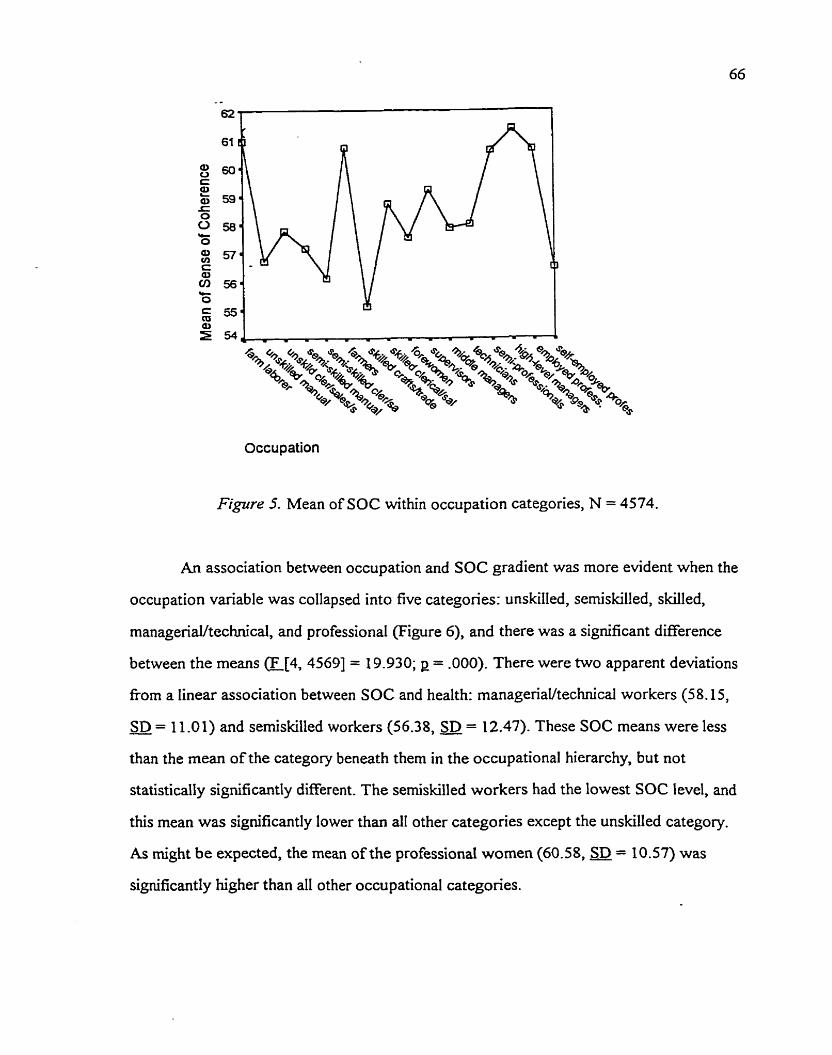
Occupation
Figure 5. Mean of SOC within occupation categories, N = 4574.
An association between occupation and SOC gradient was more evident when the
occupation variable was collapsed into five categories: unskilled, semiskilled, skilled,
managenaihechnical, and professional (Figure 6), and there was a significant diEerence
between the means (F[4, 45691 = 19.930; p = -000). There were two apparent deviations
from a linear association between SOC and health: manageriaVtechnica1 workers (58.15,
SD = 1 1 .O 1) and semiskilled workers (56.38, a = 12.47). These SOC means were less - than the mean of the category beneath them in the occupational hierarchy, but not
statistically significantly different. The semiskilled workers had the lowest SOC level, and
this mean was significantly lower than al1 other categories except the unskilled category.
As might be expected, the mean of the professional women (60.58, = 10.57) was
significantly higher than al1 other occupational categories.

occupation 5
Figure 6. Mean of SOC within five occupation categories, N = 4574.
In surnmary, the cornparison of the SOC mean within the SES categories identified
many statistical differences indicative of a positive relationship between SES and SOC.
Generally, the SOC mean was lower for those at the lower levels of the SES hierarchy and
higher at the upper Ievels.
CorreIations
The Pearson product moment correlations are displayed in Table 11. Analysis was
done using pairwise deletion of the missing data. Al1 relationships were significant at the
p c .O 1 level. As anticipated, self-rated health was positivefy correlated with both SOC
and the three SES variables. The higher the SOC, income, education, and occupation
level, the greater the ratings of heaIth, although the correlation with occupation was not
strong (. 121). There was a positive but weak = .046) relationship between self-rated

health and marital status, with those attached having better health. Not surprisingly, health
was negatively correlated with age (1 = -. 175).
Table 1 1
Zero Order Correlations Between Self-Rated Health. SOC. Income. Education,
Occupation, Marital Status. and Aee IN = 47 10 to 6846)
Mari t a1 Health SOC Income Education Occupation status Age
Self-rated health -275"' .207** .204** .121** -046" -.175**
SOC scaIe - -161"' .103** .log** .155** .112**
Income - .278** 283 ** .299** .046**
Education - .480** -.034** -,163 ** Occupation - O * .069**
Marital Status - .152**
Note. **pc -01, two-tailed. Cases weighted by rescaled weight (wt). Marital status (attached = 1 ; unattached = 0).
SOC had a positive relationship with al1 the variables used in this study, although
the correlation coefficients were small. The variable that had the strongest correlation with
SOC was self-rated health (1 = .275), and, of the SES variables, income had the strongest
correlation with SOC (1 = -16 1). There was, however, a stronger correlation between
SOC and the dichotomous marital status variable (r = .155) (attached = 1, unattached = 0)
than with SOC and the SES variables of education (1 = -103) and occupation (1 = -109).
As expected, the SES variables of income, education, and occupation were
positively correlated with each other. The strongest SES correlation was between
education and occupation (E = .480), followed by income and occupation (L = 283) and
then income and education (.278). Income and occupation were also positively associated

with marital status, yet there was a negative association between education and marital
status. Income and occupation were weakly but positively associated with age, but
education and age had a negative relationship.
Multivariate Relationships
Multiple regression was used to fbrther explore the relationship of SES, SOC, and
health and to address the two main research questions. It was predicted that SOC would
be an intervening variable in the SES-health relationship. It was also postulated that SOC
would act as a moderator variable and interact with SES to affect heaith.
Data Screening
Two methods of treating rnissing data were used. The analysis was conducted
using listwise deletion of missing data and repeated by replacing the missing income data
with the series mean. The difference between the two results was inconsequential, and
thus the results using the listwise deletion of data analysis is reported.
Prior to analysis, various exploratory techniques were used to determine whether
or not there were violations of the assumptions important for multiple regression. The data
were reviewed for normality, homeoscedasticity, and linearity by plotting the standardized
regression residuals against the standardized predicted Y's. Partial plots between the
variables were reviewed, and a cornparison was also made of the observed and the
expected cumulative distributions. The regression residual scatterplot showed a slight
deviation fkom horneoscedasticity, but the relationships between the variables appeared
linear. The addition of the Quadratic forrn of the independent variables did not result in a
significant it2 increment. Multivariate normality was then explored by superimposing a
normal curve on a histogram of observed frequencies of regression standardized residuals.
The histograrns of the regressions that included the occupation variable deviated the most
fiom normality. From this analysis, major violations of the underlying assumptions for the
statistical tests were not detected.

Multivariate outliers represent an extreme combination of predictor variables and
can have an impact on the regressions (Tabachnick & Fidell, 1989). Outliers are dehed as
standardized residual values of greater than + or - 3 (Polit, 1996) and identified through an
analysis of the residuals. It was interesting to note that al1 the outliers were negative in
value, a situation that anses when the observed scores of the dependent variables were
lower than expected. These outliers were retained in the sample because elimination did
not significantly alter the explained variance.
Research Ouestion #1: 1s SOC an Intervenine Variable in the SES-Health
Relationshio?
The first research question addresses the role of SOC as an intervening variable
between SES and health by the use of path analysis. Multiple regressions were conducted
using SOC and health as dependent variables and the three SES indicators as predictor
variables, along with the control variables of age and marital status. This question focused
on the identification of an indirect effect of SES on health through SOC. Both
standardized and unstandardized coefficients are reported.
Re~ression analvsis usine income as the SES variable (Mode1 1). SOC was
first regressed on age, marital status, and income. These three predictor variables
explained 4.5% (adjusted R~ = .O451 of the variance of SOC (F [3,6308] = 99.060;
p = -000). The results reveal that income adequacy does indeed contnbute to the variance
of the SOC variable, controlling for age and marital status (Table 12). For every increase
in income quintile, the SOC level increased 1.425 points.
SeIf-rated health was then regressed on marital status, age, income adequacy, and
SOC (Table 13). These predictor variables explained 14.6% (adjusted R~ = -146) of the
variance of self-rated health (F [4, 63071 = 271 -0%; e = .000). Both income adequacy and
SOC made a statistically significant contribution to the variance in self-rated health, when
controlling for marital status and age.

Table 12
Regression Analvsis of SOC on Mantal Status. Aee. and Income (N = 63 12)
Variable - B - SE B a P Constant 47.828 .65 1 .O00
Marital status 2.863 .3 55 -105 .O00
Income adequacy 1 -425 ,149 -124 .O00
Note. F [3,6308] = 99.060. Adjusted R* = -045; e = -000. Cases weighted by rescaled weight (wt). Mantal status (1 = attached; O = unattached).
Table 13
Regression AnaIvsis o f Self-Rated Health on Marital Status. Aee. Income. and SOC
(N = 63 12)
Variable B - SE B fl P Constant 2.482 .O77 .O00
Marital status .O4 1 .O 17 .O30 .O 16
Income -164 .O1 1 -182 .O00
SOC .O22 .O0 1 -276 .O00
Note. F [4, 63071 = 271.054. Adj IZ2 = -146; p = -000. Cases weighted by rescaled weight -- variable (wt). Marital status (1 = attached; O = unattached).

Figure 7 presents the path diagram of the model Iabeled with the path coefficients
derïved h m the regressions above. The exogenous variables of income, marital status,
and age can influence health directly, or indirectly by influencing SOC, which in tum
influences health. The path model shows that ail paths were significant; thus the three
exogenous variabfes al1 had a direct effect on SOC and on self-rated heaith. There was
also a direct path from SOC to self-rated health. Al1 path coefficients were positive except
the path fiom age to health.
Table 14 examines the direct, indirect, and total effect of the exogenous variables
on the endogenous variables of SOC and self-rated health. Note that the direct effects
correspond to the path coefficients, and the indirect effects are the product of the
variables' direct effect on SOC and the direct effect of SOC on health. The total effects
were cornputed as the sum ofthe direct and indirect effects. Results confirmed the
postulated contribution of income to self-rated health by a direct effect (b = .164), as well
as an indirect effect [b = -03 1 (1.425 x .022)] through SOC. It was calculated that 84Y0 of
the total effect of income on health (b = -195) was through a direct effect, but 16% was
mediated through SOC. Because a portion of incorne's effect on health was through SOC,
it can be concluded that SOC acted as a mediating or intervening variable in the
relationship between income and health.

Note. Stafidardized and unstandardized path coefficients are reported. Unstandardized coefficients are parenthesized. Unexplained variance = e. * p 5 .O5 ** p < .O1 two-tailed test
Figzire 7. Path Mode1 1 with income.

Table 14
Effects of Marital Status. Ase. and Income on SOC and Self-Rated Health OI = 63 12)
Unstandardized coefficients S tandardized coefficients Variable Direct Indirect . Total Direct Indirect Total
On SOC Marital status 2.863
*ge .44 1
Income 1.425
On self-rated health Marital stattis .O4 1 .O63 -104
Income -164 .O3 1 ,195
SOC .O22 .O22
Note. Indirect effects calculated as product of each variable's direct effect on SOC and SOC'S direct effect on health. Total effect calculated as sum of direct and indirect effects.
Regression analvsis u s i w education as the SES variable (Mode1 2). Two
multiple regression analyses (Tables 15 and 16) were conducted using the 12-category
variable of the highest level of education attained as the SES variable. The path model
(Figure 8) was then calculated corn the regression data.
The first regression utilized SOC as a dependent variable (Table 15). This
regression explained 4.7% of the variance in SOC (F 13, 65501 = 108.594; p = .000),
which was very similar to the variance explained with the income variable (4.5%). Al1 of
the variables were significant, but the marital status variable exerted the strongest effect on
SOC. Ifone was mamed or living cornmon-law, the mean of the SOC level increased by
almost 4 points. Regression analysis conlïrmed that education also had a positive
relationship with SOC when controlling for the variables of age and marital status. The

Table 15
Regression Anaivsis of SOC on Aee. Marital Status. and Education M = 6554)
Variable B SE P P Constant 47.7 12 -626 -000
Marital status 3.859 -33 1 -142 .O00
Education -5 16 .O50 - 125 .O00
Note. E [3, 65501 = 108.594. Adj. R~ = -047; g = -000. Cases weighted by rescaled weight variable (wt).
unstandardized coefficients reveal that for every increase in the 12-category education
variable, the rnean of the SOC value increases only approximately -5 .
The second regression regresses self-rated health on SOC, education, age, and
marital status (Table 16). This regression explained 13 -6% (adjusted R'= -136) of the
variance of ser-rated health (F [4,6549] = 258.341; p = .000), a comparable result to the
14.6% of the variance of health explained when income was employed as the SES
indicator. This regression analysis confirmed a positive relationship of the variables of
study with health, with the exception of age. Self-rated health increased with each gain in
the level of education attained. Aiso congruent with the findings using the income variable,
the variable that exerted the strongest effect on health was SOC. Indeed, a comparison of
the unstandardized regression coefficients of SOC when education was entered as the SES
indicator @ = -021) and income as the SES indicator @ = -022) reveals almost no
difference.

Table 16
Re-ression Analvsis of Self-Rated Health on Aee. Marital Status. Education. and SOC
(N = 6554)
-
Variable 8 S E p P Constant 2.652 .O64 .O00
Marital status .O68 .O25 ,032 ,006
Education .O48 -004 .149 . O00
SOC .O22 .O0 1. -274 .O00
Note. F[4, 65491 = 2 16-03 5 . Adj. R* = -136; p = .000. Cases weighted by rescale weight variable (wt).
Path Mode1 2 (Figure 8) depicts the direct significant efFect of education, marital
status, and age on SOC and self-rated health. There is also a direct path fiom SOC to self-
rated health. Thus, it can be seen that SOC intervenes in the SES and heaIth relationship
when education is used as an SES variable.
The direct, indirect, and total effects of education, marital status and age on SOC
and self-rated health were cornputed and displayed in Table 17. The direct effect of
education on health (b = -048) combined with the indirect effect of education through
SOC @ = -0 1 1) derived the total effect of .OS9. Thus, for every increase in the
12-category education scale, health would increase .O59 on the 5-point health scale. The
effect of education through SOC was significant; 18.6% of education's effect on health
was mediated through SOC.

Note. Standardized and unstandardized path coefficients are reported. Unstandardized coefficients are ~arenthesized. Unex~lained variance = e.
Figure 8. Path Mode1 2 with education.

Table 17
EEects of Marital Status, Age. and Education on SOC and Self-Rated Health (N = 6554)
Unst andar diied coefficients Standardized coefficierks Variable Direct Indirect Totai Direct Indirect Total
Marital status 3 -859 3.859
A S -585 -585
Education -5 16 -5 16
On self-rated health
Marital status .O68 .O80 -148 ,032 .O39 .O7 1
Age -.O73 .O 10 -.O63 -. 176 .O30 -. 146
Education .O48 .O1 1 ,059 -149 .O34 .183
SOC .O2 1 .O2 1 -274 -274
Note. Indirect effects calculated as product of each variable's direct effect on SOC and SOC'S direct effect on health. Total efFect calculated as sum of direct and indirect effects.
Regression analysis usin2 occupation as the SES variable (Mode1 3). Two
regressions were run using the 16-category occupation variable as the SES indicator. The
first regression (Table 18) of SOC on marital status, age, and occupation explained 4.3%
(adjusted R* = -043) of the variance of SOC @ p,4568] = 68.75 1; g = .000), just slightly
less than the explained variance when income (adjusted R~ = -045) and education
(adjusted R~ = -047) was used as the SES variable. Thus, each of the three regressions
explained about the same amount of variance in SOC.

Table 18
Regession Analvsis of SOC on Marital Status. Aee. and Occuuation mode1 3)
Ir\r = 4572)
Variable B SE P P Constant 50.243 -610 .O00
Marital status 2.960 -378 .I 16 -000
A S -622 .O8 I -113 .O00
Occupation -265 -040 -097 .O00
Note
-
F (3,45681 = 68.75 1. Adj. R ~ = -043; e = -000. Cases weighted by rescale weight - variable (wt).
For the employed women who were represented in this regression, occupation was
positively related to SOC when the effects of marital status and age were controlled. For
each increase in the 16-category occupation scale, the mean of the SOC value would
increase -265. In this group, however, the standardized regression coefficient (P = -097)
indicates that occupation had the weakest effect on SOC compared to marital status and
age, a result not found when education and income were used as the sole SES indicators.
The second regression used self-rated health as the dependent variable (Table 19).
When self-rated health was regressed on marital status, age, occupation, and SOC, ody
8.8% (adjusted IZ? = -088) of the variance of self-rated health was explained @ [4, 45671 =
11 1.724; g = -000). This contrasts to the 14.6% and 13.6% explained variance when
income and education, respectively, were used as the SES indicators. It should aiso be
noted that marital status was negatively comelated with health, although the relationship
was no longer significant in this regression.

Table 19
Regression Analvsis of S elf-Rated Health on Marital Status. Aee. Occupation, and SOC
mode1 3) M = 4572)
Variable B SE l3 P Constant 2.956 .O7 1 .O00
Marital status -.O28 .O28 -.O14 -325
Age -.O53 .O06 -. 127 -000
Occupation .O2 1 .O03 -102 -000
SOC .O20 .O0 1 -26 1 .O00
Note. F [4, 45671 = 1 1 1.724. Adj. R~ = -088; p = .000. Cases weighted by rescale weight W)-
In this group of employed women, the results show a positive and significant
relationship between occupation and health when controlling for the effects of SOC,
marital status, and age. For each category increase in the 16-category occupational
hierarchy, the mean of the 5-point health scale also increases .021. This was not as strong
an effect on health (j3 = -102) as that exerted by age (P = -. 127) or SOC (P = -261).
Nevertheless, it can be concluded that, with working women, a difference in occupation
made a difference in health when the effects of SOC, age, and marital status were
considered.
SOC exerted the strongest effect on health (j3 = -261). The unstandardized
regression coefficient of SOC in this regression @ = -020) was almost indistinguishable
fiom the SOC coefficient fiom the regression with incorne (b = -022) and from the
regression with education @ = .021).
The regression results are plotted on the path mode1 depicted in Figure 9, and all
paths are significant, except for the path fiom marital status to health. There is a direct
path fiom occupation to health, a direct path fiom occupation to SOC, as well as a path

£tom SOC to health. Thus, SOC intervenes in one of the causal pathways from occupation
to hedth.
The decomposition of the effects are displayed in Table 20. An examination of the
size of the indirect effect of occupation on health through SOC @ = -005) suggests that
the indirect effect is weak. The different scales of the SES indicators do not allow a direct
comparison between SES variables, but the unstandardized indirect effect of the
16-category occupation variable on health was smaller than the indirect effect of the 5-unit
income @ = -03 1) or the 12-unit education (b = -01 1) variables-
The indirect effect of occupation on health through SOC represented 19.7% of the
total effect. This is slightiy larger than the proportion attributed to the indirect effect on
health though SOC using the income variable (16%) or the education variable ( I 8.6%).
The comparison of results, of course, is difficult considering the varying sample size that
occurs with the use of difTerent SES variables. Regardless, there is an indirect effect of
occupation on health through SOC, and thus SOC can be considered as an intervening
variable.
To summanze the results of the three models, the regression results have identified
SOC as a variable that mediates some of the effects of socioeconornic status on health
when income, education, and occupation were each used as the sole SES indicator. Al1 of
the SES variables had a direct effect on SOC. The regressions of SOC on SES controlling
for marital status and age explained a similar proportion of variance in SOC when income
(4.5%), education (4.7%), and occupation (4.3%) were each used as the sole SES
indicator. The three regressions of self-rated health on SOC and an SES indicator,
controlling for marital status and age, revealed that these variables had a direct effect on
heaith, but the arnount of explained variance differed. The regression with income
explained the most variance (14.6%), followed by education (13.6%) and then occupation
(8.8%). The effect that SOC had on health appeared relatively constant in the three
regressions. The decomposition of effects indicated that each of the SES variables exerted

Occupation -- S C h
Note. Standardized and unstandardized path coefficients are reported. Unstandardized coefficients are parenthesized. Unexplained variance = e.
Figure 9. Path Mode1 3 with occupation.

Table 20
Effects of Marital Status, Age. and Occupation on SOC and Self-Rated Health
Unstandardized coefficients S tandardized coefficients
Variable Direct Indirect Total Direct Indirect Total On SOC
Maritai status 2.960 2.960 . I 16 -116
Occupation .265 -265 -097 .O97 -- - -- - -- - -
On self-rated health Marital status .OS9 ,059 .O3 0 .O30
Occupation -02 1 .O05 .O26 - 102 .O25 -127
SOC .O20 ,020 -26 1 26 1
Note. Indirect effects calculated as product of each variable's direct effect on SOC and SOC'S direct effect on health. Total effect calculated as sum of direct and indirect effects.
an indirect effect on health through SOC. The proportion of the total effect on health that
was rnediated through SOC for the income, education, and occupation variables was 16%,
1 8.6%' and 19.7%, respectively.
Reeression analysis usine income, education, and occupation as the SES
variables (Models 4 and 5). It is assumed in regression analysis that the variables not
specified in the model, and subsumed under the error term, are not correlated with
variables within the model. Al1 three of these SES indicators are correlated. Occupation is
correlated with incorne (Z = -283; g = -000) and education (r = -480; p = -000). Education
and incorne are also correlated (r = .278; p = .000). To fùrther the understanding of the
unique contribution that each of the SES indicators has on SOC and self-rated health, al1
of the SES variables were added to the regression (Mode1 4). To retain the sample size

and to better reflect the total population that includes both employed and nonemployed
women, Model 5 includes only the income and education SES variables.
The regression results using SOC as the dependent variable are displayed in
Table 21. Al1 coefficients were statistically significant. The age and marital status variables
exerted the strongest effect on SOC in Model 4, but the effect of education (p = -103) and
age (p = -100) were equivaient in Model 5.
Table 21
Remession Analysis of SOC on Marital Status. Aee. Income. Education. and Occu~ation
Mode1 4 Mode1 5 Variable B SE B D B SE B D
Constant 46.622 -859 .O00 45.460 -713 .O00
Marital status 2.680 .401 -105 .O00 3.154 .355 -116 .O00
Income -613 -190 .OS2 .O01 1.049 156 .O91 .O00
Education -355 ,069 .O88 .O00 -427 .O54 -103 ,000
Note: Model 4 adjusted R~ = -050; F [ S , 44001 = 47.424; E= -000, a = 4406. Mode1 5 adjusted R~ = -054; F(4, 63 041 = 90.83 3; g = .000, n = 63 09. Cases weighted by rescaled weight variable (wt).
When SOC was regressed on al1 three SES variables, controlhg for marital status
and age (Model 4), education had the strongest effect on SOC (P = -088) compared to
income (p = -052) and occupation (B = -044). Although statistically significant, this effect
is relatively small, particularly the effect of occupation on SOC. For each increase in the
16 occupation categories, the SOC level would increase -12 1 points on a 78-point scale
when controlling for the other variables. #en just income and education were used as
SES indicators (Model 5) , the effect of income (P = .091) was comparable to the effect of
education (p = -103) on SOC. Model 4 explained 5% of the variance in SOC, and Mode1 5
explained 5.4%.
Table 22 displays the regression results of self-rated health on SOC and three SES
variables (Model 4), and of self-rated health on SOC and two SES variabIes (income and
education; Model 5) while controlling for the effects of marital status and age. The
utilkation of three SES indicators in Model 4 renders the effect of the occupation variable
on self-rated health statistically and substantially insignificant (b= .005, g = -174). Income
(p = -099) and education (p = -098) exerted sirnilar effects on health. When occupation
was omitted fiom the regressions (Model 5), income exerted a greater effect (P = -147)
than education (p = .108), and the effect of marital status on self-rated health became
insignificant. The effect of SOC on health in Model 4 (b = -019) was comparable to the
effect on health in Model 5 (b = .021), demonstrating the consistent and strong effect of
SOC on health that varied little with the number or type of SES indicators entered in the
regressions.
Model 4 had one more SES indicator (occupation) than Model 5 did; however,
contrary to the effect that is usually seen with the entry of another predictor variable,
Model 4 explained less variance (adjusted R ~ = .107) than Model 5 (adjusted R' = -156).
This highlights the difference of the sample size and sample characteristics between
Model 4 with the occupation variable (a = 4406) and Model 5 without occupation
(a = 6314).

TabIe 22
Re-gression of Self-Rated HeaIth on Marital Status. Aee, Income, Education, Occuoation,
and SOC
Mode1 4 Mode1 5 Variable B SE P P B SE fJ P
Constant 2.613 .O81 .O00 2.421 .O68 .O00
Income -088 -014 .O99 .O00 .133 ,012 -147 .O00
Education .O30 .O05 .O98 .O00 .O35 ,004 -108 .O00
Occupation .O05 .O03 -023 -174
SOC .O19 .O01 .253 .O00 .O21 .O01 -265 .O00
Note: Model 4: adjusted R* = -107; F [6,4399] = 89.180; g = -000, a = 4406. Mode1 5: adjusted R~ = -156; E [5, 63081 = 233.868; = -000, g. = 63 14.
The path mode1 for Model 4 is depicted in Figure 10. There were direct significant
paths from al1 of the variables to SOC, and fiom SOC to health. Thus, SOC acted as an
intervening variable. There was no significant direct path From occupation to health in this
rnodel; however, occupation continued to exert an effect on health indirectly through the
mediating variable of SOC.
The direct, indirect, and total effects of Mode1 4 are reported in Table 23. When
heaith was regressed on the three SES variables, income and education had an equivalent
direct effect. The indirect effect rnediated through SOC, however, was greater for
education (p = -022) than for income (P = -013). This resulted in a total effect of
education on health (P = -120) that was slightly greater than the total effect of income
(p = - 1 12). The indirect effect of education through SOC, 18.3% of its total effect on

Note. Standardized and unstandardized path coefficients are reported. Unstandardized coefficients are parenthesized. Unexplained variance = e. * p < .O5 ** p l . 0 1
FIgtrre IO. Path Mode1 4 with income, education, and occupation.

Table 23
Effects of Marital Status. Age. Income. Education, and Occuoation on Self-Rated Health
and SOC (Model4)
Unstandardized coefficients Standardized coefficients Variable Direct Indirect Total Direct Indirect Total
On SOC
Marital status 2.680 2.680 -105 -105
Income -613 .613 .O52 .O52
Education -3 55 .355 .O88 .O88
Occupation -121 -121 .O44 .O44 On self-rated health
Marital status -.O75 .O5 1 -. 024 -.O39 .O27 -.O12
Income .O88 .O12 -100 .O99 .O13 .112
Education .O3 O .O07 .O37 .O98 .O22 -120
Occupation .O02 .O02 .O 1 1 .O 1 1
SOC .O19 .O 19 .253 -253
Note. Indirect eEects calculated as product of each variable's direct effect on SOC and SOC'S direct effect on health. Total effect calculated as sum of direct and indirect effects.
health, boosted the effect that education had on health. The indirect effect of income on
health through SOC, however, was only 1 1.6% of income's total effect. The direct effect
of occupation on self-rated health was statistically insignificant when the income and
education variables were used in the model, but there remained a small indirect effect
@ = -002; P = -01 1) through SOC. Al1 of the effect of occupation on health was through
SOC.

The path model for Model 5, which omits occupation and uses oniy income and
education as the SES variables, is depicted in Figure 1 1. The path coefficients were
denved fiom the regressions of SOC and self-rated health as reported in Tables 2 1 and 22.
As with the other models, there were two pathways fiorn the variables to health: a direct
path and a path through SOC. In this mode[, marital status had oniy an indirect path
through SOC, because the direct path to health was insignificant. Both income and
education had a direct and an indirect path to health.
Table 24 presents the indirect, direct, and total effects on the endogenous variables
of Model 5. The decomposition of effects revealed some differences between Models 4
and 5. Whereas education had the greatest total effect on health in Model 4, in this model
income had the stronger total effect (P = -17 1) on self-rated health compared to education
(p = -13 5) . The indirect effects of education (P = -027) and of income (j3 = -024) of
Model 5, however, were equivalent. The SOC variable mediated 14% of the total effect of
income on self-rated heaith and 20% of the total effect of education on health.

Note. Standardized and unstandardized path coefficients are reported. Unstandardized coefficients are parenthesized. Unexplained variance = e. * p r -05 ** p 2-01
Figrrre II. Path Mode1 5 with income and education.

Table 24
Effects of Marital Status. Age. Income. and Education on SOC and Self-Rated Health
(Model 5 )
Unstandardized coefficients S tandardized coefficients Variable Direct Indirect Total Direct Indirect Total
On SOC - - - -
Marital s t a tu~ 3.154 3.154 - 116 -116
Age -53 I -53 1 - 1 O0 .IO0
Income
Education -427 ,427 -103 -103
On self-rated health Marital status .O66 .O66 .O3 1 .O3 1
Income .132 .O22 ,154 ,147 .O24 -171
Education .O3 5 .O09 .O44 -108 .O27 -135
SOC .O2 1 .O2 1 -265 .265
Note. Indirect effects calculated as product of each variable's direct effect on SOC and SOC'S direct effect on self-rated health. Total effect was calculated as the sum of the direct and indirect effects.
Summarv of the five ~ a t h models. In sumrnary, five path modets were used to
identi@ the role of SOC as an intervening variable. The path models differed by the
employment of the vanous SES variables. Income (Model l), education (Model 2), and
occupation (Model 3) were each used as the sole SES indicator in the first three models.
Al1 of the SES variables were then entered into the regressions in Model 4. Model 5 used
only income and education to utilize the full sarnple of both employed and nonemployed
wornen.

All five models showed that there was a direct path fiom SES to SOC, regardless
of the number or type of SES variables entered into the model. The regressions of SOC on
a single SES indicator, controlling for marital status and age, explained a similar
proportion [income (4.5%), education (4.7%), and occupation (4.3%)] of the variance of
SOC. When al1 three SES indicators were used in Model4, the regression explained 5.0%
of the variance in SOC, which was less than the variance explained in Model 5 (5.4%) that
added only two SES indicators (income and education).
There were also direct paths fiom income, education, and occupation to self-rated
health. The regressions of self-rated health on SOC, SES, marital status, and age indicated
significant relationships between SES and health. Occupation, however, although exerting
a direct significant effect on health (b = -02 1, p = .000) in Mode[ 3, did not have a
significant direct effect in Mode1 4 (b = .005, E = .I74) when controlling for income and
education. Thus, there was no unique contribution to health that could be attributed to
occupation when education and income were added to the regression.
The amount of explained variance in self-rated health differed depending on the
SES variable component. The first two models that used income (14.6%) and education
(1 3 -6%) as the sole SES indicator explained a sirnilar amount of variance; and, used
together (Model 5), they explained 15.6% of variance in health. The regression with
occupation as the sole SES indicator (Model 3) explained the least amount of variance in
health (8.8%); and even when education and income were added to the model (Model4),
only 10.7% of the variance in health was explained when the tmncated sarnple of ody
employed women was used.
In every regression of self-rated health on.SOC, SES, marital status, and age, SOC
exerted a strong and consistent effect on health. The unstandardized regression coefficient
of the SOC variable ranged from -019 in Model 4 with al1 three SES variables to .O22 in
the regression with incorne. SOC was also the variable that exerted the strongest effect on

health. The standardized regression coefficients for SOC ranged fiom .276 in the
regression with income, to -253 with income, education, and occupation.
All five path models revealed that SOC mediated the effects of SES on health. The
regressions showed that there was a direct path fiom SES to SOC, as well as a strong
effect of SOC on health. Each of the three SES indicators exerted an indirect effect on
hedth through the SOC variable. When only one SES indicator was used, 16% of
income's total effect on heaIth was through SOC, 18.6% of education's, and 19.7% of
occupation's. When al1 three variables were used, 11.6% of income's effect on health was
mediated through SOC, and 18.3% of education's. In this model (4), 100% of
occupation's effect on health was mediated through SOC, because there was no direct
effect on health from occupation. Uihen income and education were entered as the SES
component in Mode1 5, most of income's effect on health was through a direct effect
(86%), but education's indirect effect through SOC represented 20% of its total effect on
health. The indirect effects through SOC accounted for a small proportion of the total
effects on health. The path model analysis supports the assertion that SOC mediates a
portion of the effect of the SES variables on self-rated health.
Research Question #2: Does the Reiationshir, Between SES and Health Varv as a
Function of SOC?
To evaluate this hypothesized moderated relationship, Jaccard et al. (1990)
recommended addressing three issues: (a) the presence of an interaction in the sample
data, (b) the strength of the effect, and (c) the nature of the effect. To identiQ statistical
interaction, multiplicative interaction terms were added to the regressions, and the
hierarchical F test (F A) was used to determine statistical significance. The strength of the
effect was measured by the difference of the squared multiple correlations (lX2 A) when the
interaction terms were used. To discern the nature of the effect, the slope or the h of the
interaction term was examined.

The presence of an interaction was first explored by e n t e ~ g centered
multiplicative product terms into a regression with their centered component parts. These
interaction terms were equal to the product of the centered SES variable and the centered
SOC variable and had low correlations with their component parts.
Subgroup analysis was also conducted as an alternative approach to product-term
analysis (Jacard et al., 1990). Three groups were created by using the SOC 3 variable. The
unstandardized coefficient for the SES variable was compared across the low SOC,
medium SOC, and high SOC groups. The dBerence between the slopes and the statistical
significance of this difference were calculated using equation 7:
The interaction of incorne and SOC. The results of the hierarchical regressicn of
self-rated health on mantal status, age, and income and the cross-product term are
displayed in Table 25. When added to the regression, the Income x SOC term was
statistically insignificant @_= -0003, p = .732), and there was no change in the amount of
explained variance (lX2 A = .000, g= .73 2).
Subgroup analysis also failed to detect an interaction between income and SOC.
The sample was split into three levels of SOC. Self-rated health was then regressed on
incorne, mantal status, and age for each of the groups. Table 26 presents the results of the
regressions as well as the means of the variables. The unstandardized regression
coefficient representing the effect of income on health in the high SOC group (. 180) was
only slightly higher than in the medium SOC (. 170) and low SOC (. 171) groups. Each of
the unstandardized regression coefficients for the income variables were then statisticaily
compared with the income coefficient fkom the other SOC groups by using the t test
identified in equation 7. The three g tests were al1 insignificant and ranged fiom -03 1 for
the difference between Iow and medium SOC to -3 1 for the difference between medium

Table 25
Hierarchicd Remession Analvsis of Self-Rated Health on Marital Status. Aee. Income,
and Income x SOC
Step 1
Constant
Marital status
Age
Income
SOC
S t e ~ 2
Constant
Marital status
Age
Income
SOC
Income x SOC
Note. Step 1: F[4, 63071 = 270.386,s = -000, N = 63 12. Step 2: F[5, 63061 = 216.302, g = -000. Cases weighted by rescaled weight (wt).

Table 26
Regession Analysis of Self-Rated Health on Marital Status. Aee. and Income bv Three
Groups of SOC
- - - - - - --
Adjusted Variable Mean B SE P P F P
Low SOC
Constant
Marital status
Age
Income
Medium SOC
Constant
Marital status
Age
Incorne
High SOC
Constant
Marital status
Age
Income
Note. Low SOC: Mean of self-rated health = 3.302, n = 983. Medium SOC, Mean of self- rated health = 3.83, n = 4394. High SOC, Mean of self-rated health = 4.12, n = 935. Cases weighted by rescaied weight variable (wt).
SOC and low SOC. Thus, a difference in the income and health relationship between SOC
groups was not identified.
The subgroup analysis also shows that the three SOC groups differed in other
characteristics. The mean of income in the low SOC group (3.10) was lower than the
mean of the medium SOC (3 -49) and high SOC (3 -6 1). This difference in the means of
income between SOC groups is indicative of the positive relationship between income and
SOC- The mean of the age and marital status variables also increased with each SOC
group, again reflecting the positive relationship of age and marital status with SOC.
The interaction of education and SOC. Table 27 presents the summary of the
hierarchical regression analysis using education as the SES variable. There was no change
in the arnount of explained variance (R'A = .000) with the addition of the Education x
SOC term, and the probability of the F change was not significant (g = -479). The slope of
the interaction term was small and statistically insignificant @ = -0002, p = -479). The
presence of an interaction between education and SOC was not detected through
hierarchical regression analysis with a cross-product term.
Self-rated health was then regressed on education, marital status, and age for the
three groups of SOC (Table 28)- and the effects of education on heaIth were compared.
The slopes of the education variable varied slightly arnong the three groups (.O48 for the
low SOC, -051 for the medium SOC, and .O55 for the high SOC), but the differences were
not statistically significant. The 1 values ranged from .O41 for the difference between the
low SOC and the high SOC groups and -223 for the difference between the low and
medium SOC groups. As the effects of education on health did not Vary substantially with
the level of SOC, an interaction effect was not identified.

Table 27
Hierarchical Remession Analvsis of Self-Rated Health on Marital Status. Ane. Education,
SOC. and Education x SOC
Variable B SE P P R ~ A F A p o f F A S t e ~ 1 ,136 258.341 .O00
Constant 4.219 .O3 6 .O00
Maritai status -068 -025 -032 .O06
Education .O48 .O04 -149 ,000
SOC .O22 .O0 1 .274 .O00
Constant 4.2 19 .O36 .O00
Marita1 status .O68 .O25 .O3 2 .O06
Education .O48 .O04 -148 .O00
SOC .O22 .O0 1 .276 ,000
Education x SOC -0002 . O00 .O08 -479
Note. N = 6553. Step 1,F [4,6549] = 258.341, p = -000. Step 2, F[5,6548] = 206.757, p = -000. Cases weighted by rescaled weight (wt).

Table 28
Regession Analvsis o f Self-Rated Health on Marital Status. Aee. and Education bv Three
Groups of SOC
Adjusted Variable Mean B SE P P R~ F P
Low SOC
Constant
Marital status
Age
Education
Medium SOC
Constant
Marital status
Age
Education
High SOC
Constant
Marital status
Age
Education
Note. Low SOC: Mean of self-rated health = 3.30, n = 10 1 1 . Medium SOC, Mean o f self- rated health = 3 -83, n = 4560. High SOC, Mean of self-rated heaith = 4.10, n = 983. Cases weighted by rescaled weight (wt).

The means of variables within the subgroups were then examined. The regression
of SOC on education, marital status, and age (Table 15) indicates a positive relationship
between the 12-category education variable and SOC @ = .5 16); that is, the higher the
education, the greater the SOC. The calculation of the means in this subgroup analysis was
not entirely consistent with this relationship. Predictably, the mean of the low SOC
education variable (5.91) was less than the other SOC groups. The education mean of the
medium SOC (6.93), however, was slightly greater than the mean of the hÏgh SOC group
(6.76).
The interaction of occupation and SOC. Finally, the SES variable of occupation
was explored as a variable that rnay interact with SOC to Vary the nature of the SES-
health relationship. Table 29 surnmarizes the results of the hierarchical regression that
used occupation as the SES variable and Occupation x SOC as the product term. The
change in the explained variance with inclusion of the product term was measurable but
small (R2 A = .001; F change = 4.89, p = .027). This means that the interaction effect
accounted for -1% of the variance in self-rated health, a very small effect size.
The dope of the product t e m indicates how the relationship between occupation
and health varies across the SOC levels. For every SOC unit increase, the slope of health
on occupation changes .O006 (Jacard et al., 1990). Aithough the size of the coefficient
indicates that the dope changes very little per unit change in SOC, the positive nature of
this product term regression coefficient indicates that at higher levels of SOC, the slope
increases. At high SOC levels, therefore, occupation has a greater positive effect on
health.

Table 29
Hierarchical Remession Analvsis of Self-Rated Health on Marital Status. Age, -
Occu~ation, and Occu~ation x SOC
Variable B SE P P R'A F A p o fF A
Step 1
Constant
Marita1 status
Age Occupation
SOC
Step 2
Constant
Marital status
Age
Occupation
SOC
Occupation
x soc
Note. N = 457 1. Step 1 , F [4,4567] = 1 1 1.724. Step 2, E[5,4566] = 90.433. Cases weighted by rescaled weight (wt).
The sample was then split by the three SOC levels, and the unstandardized
coefficients of the occupation variable were compared (Table 30). The slope of the high
SOC @ = -034) was greater than the coefficients for the medium SOC (b = -023) and the
low SOC (b = -005) groups. The difference between the slope of the occupation variable
in the low SOC group was statistically different from the slope of the high SOC group
(t = 2.37, &< -05). The slopes of the low SOC and the medium SOC were also
significantly different (g = 2.2, p < .OS), but the difference between the medium SOC and
the high SOC were statistically insignificant (l = 1.447, p > -05). The cornparison of the

Table 30
Remession halvsis of Self-Rated Health on Marital Status. Aee. and Occupation by
Three Grou~s of SOC
Adjusted Variab le Mean B SE P P IP F P
Low SOC
Constant
Mantal status
Age
Occupation
Medium SOC
Constant
Marital status
Age
Occupation
High SOC
Constant
Mantal status
Age
Occupation
Note. Low SOC: Mean of self-rated health = 3.52, n = 623. Medium SOC: Mean of self- rated health = 3 -94, n = 3279. High SOC: Mean of self-rated health = 4.25, n = 67 1. Cases weighted by rescaled weight (wt).

slopes of health on occupation among the three groups with dflering SOC levels indicated
that the slope of the low SOC group is statistically lower than the other groups. Indeed, at
low levels of SOC, there was no relationship between occupation and health. The effect of
occupation on health, then, varied with the SOC level.
The computation of the means of the variables for each SOC group provided an
opportunity to explore the characteristics of women with varying levels of SOC. From this
analysis, it is evident that the mean of age, marital status, and occupation increased as the
SOC group increased. The mean of the 16-category occupation variable was 6.73 for the
low SOC group, 8.02 for the medium SOC group, and 8.17 for the high SOC group. A
sirndar effect was evident with the mean of the income and education variables. In sum,
women with low levels of SOC may be more Likely to be fiom low household income
levels, less educated, employed in lower occupational status jobs, younger, and less likely
to be attached. Although this confirms the results from the zero-order correlations, the
data from this analysis indicate that the difference between means of the medium SOC and
high SOC groups may not be as substantial as the difference between the means of the low
SOC and the other groups.
Summarv. In summary, to answer the second research question, the SOC variable
was explored as a moderating variable that modifies the nature of the SES-health
relationship. This relationship was addressed by using the SES x SOC product term in
hierarchical regression and by subgroup andysis whereby the effect of SES variables on
health was compared across three SOC levels. The results did not discem an interaction of
the SOC variabIe with the income and education variables. However, there was a
statistically significant interaction effect of SOC on the occupation and health relationship.
At low levels of SOC an increase in occupation category did not result in greater health.
At higher levels of SOC an increase in occupation did result in greater self-rated health.
However, the difference was very small. A parsimonious explanation for the effect of SOC

o n the SES and heaith relationship would be t o Say that SOC exerts a main, rather than a
moderator, effect on the SES and health relationship.

C W T E R 5
DISCUSSION
This secondary data analysis of the 1994-1995 NPHS survey was conducted to
examine the relationship between selected measures of socioeconornic status, sense of
coherence, and self-rated health in Canadian women aged 20 to 64. In this chapter 1
discuss the findings, using the existing literature as a backdrop. The chapter concludes
with a discussion of the limitations of this study, recommendations for further research,
and the implications for nursing.
The bivariate and multivanate analysis revealed associations between the study
variables of SOC, income, education, occupation, age, and marital status with self-rated
health. Of particular importance to the role as SOC as a mediator and as a moderator in
the SES and health relationship is the relationship between SES and health, and SOC and
heaith.
The SES and Health Relationship
The underlying supposition of the two main research questions is that there is a
iink between socioeconomic status and health. Given the mounting evidence for
socioeconomic disparities in health. the results from this study are perhaps not too
surprising. The findings fiom the bivanate analysis reveal a socioeconomic status and
health gradient, and the multivanate analysis contirms a relationship among the three SES
indicators of income, education, and occupation with self-rated health. More specifically,
this study found evidence to support the premise that income, education, and occupation
are determinants of health in Canadian women.
The association between income and health cannot be disputed. About three
quarters (75.1%) of the highest incorne quintile reported 'very good' or 'excellent' health,
compared to just under half (49.2%) of the lowest income quintile. At the other end of the
health scale, the women in the lowest income group were about five times more Iikely to

report 'poor' or 'fair' health (1 8.9%) than were those in the highest income quintile
(3.8%). Not only was this inequity evident by comparing the top and bottom income
quintdes, but with each increase in income category, the frequency of reporting 'poor' or
'fair' health decreased. It appears that there is a Iinear relationship between income and
health that is consistent with the gradient effect observed in SES and health relationships
(Adler, 1994; MacIntyre, 1996). Even when income, education, occupation, SOC, marital
status, and age were controlling for one another in the multivariate analysis, there was a
significant income and health relationship. Thus, regardless of a woman's education,
occupation, SOC, age, or marital status, a low income was detrimental to her health. This
observation of a persistent relationship between income and self-rated health when
controlling for education and demographic variables is consistent with Cairney & Arnold's
(1 998) study in working-age Canadians.
Health inequities based on education were also evident. The women who had not
completed high school were almost five times more likely to report 'poor' or 'fair' health
(18.9%) than were those with a university degree (4%). Again a gradient effect was
observed. The relationship between education and self-rated health persisted even when
controlling for income, occupation, SOC, marital status, and age. This finding is congruent
with the evidence h m Canada (Cairney & Robert, 1998) and the U.K. (Arber, 1996) that
reports a relationship between education and self-rated health, even when the effects of
other SES indicators that measured financial resources and demographic variables were
held constant. This observation lends support to the contention that material or economic
resources may be only part of the explanation for the SES and health relationship (Evans,
1994; Ross & Wu, 1995; Wilkinson, 1 W6), because education made a significant
independent contribution to health.
The findings f?om this study also reveal a link between occupation and health. The
professional workers were more likely to report better health than were the women
employed in jobs that did not require specific skills. This association between health and

occupation was evident even f i e r controlling for marital status, age, and SOC. This study
did not find evidence to support Arber's (199 1) British study that described a curved
occupational class gradient for women, but the findings are congruent with the sîudy
conducted by Macran et al. (1996). which descnbed significantly better self-rated health in
British women whose current or last job was in nonmanual occupations than in the
unskiUed group (controlling for age, employment status, and household composition).
The results also point to dgerences between the relationship of occupation and
health and the relationships of the other SES variables and health. The gradient effect was
not as obvious between the occupational categories in the middle of the hierarchy. This
study concurs with Arber's (1996) British study which noted that the occupational class
gradient of women's self-rated health was not as sharp as the gradient evident in health
when educational classification was used.
Although occupation had a significant effect on health when controlling for SOC,
marital status, and age, occupation (along with SOC, MS, and age) did not explain as
much variance in health as did income or education. This effect was evident even when al1
three SES variables were entered into the regressions. Thus, for the tnincated sample of
only employed women, the SES variables were not as effective in explaining the variance
in health. This study also found that the fiequency of response for each self-rated health
category varied between the employed women and the total sample. Ross & Wu (1995)
stated that a sample of employed women "eliminates the most disadvantaged: those who
are unemployed, those who are engaged in unpaid domestic labor, or retired" (p. 721).
They concluded that this results in less variation in SES, and thus the effect of SES
inequality on health is attenuated. Arber (1 996) also found that excluding the
nonemployed women fiom the analyses of the effects of SES on health would weaken the
class inequalities; however, not to the same degree as with men. This supports the
observation from this study, while also acknowledging that this study did not include older
women.

This finding raises the question about the difference between the health of the
employed versus the nonemployed, an issue that has been described as complex in women
(Arber, 1991). Employment is hypothesized to lead to either heaith benefits fkom
participation in a socially vaiued activity or detrimental health effects as women attempf to
balance their domestic and work obligations (Arber, 1991; Bartley, Popay, & Plewis,
1992). Longitudinal data ffom the U.S. has found that full-tirne employrnent predicted
slower declines in self-rateci health for women (Ross & MirowsSl, 1995). However,
reverse causation has fiot been ruled out in the health of homemakers (Arber, 1991, 1996).
Responsibilities for children, domestic conditions, marital status, number of paid hours,
and type of work are al1 important factors to consider when disentangling the effects of
employment on heaith (Arber, 198 5). Interactions with employment have been observed
when marital status pickenson, 1992), occupation, and domestic conditions (Arber,
1991; Bartley et al., 1992) have been examined. It is evident that the living and working
conditions -of women need to be considered when exploring the effects of employment
status and occupation on health.
This study's resdts make it difficult to interpret the effect of occupation on health
in women. The cross-tabulations show that there is a relationship, yet the multiple
regressions indicate that there is no independent contribution fiom occupation that is not
already explained by the other variables. Occupation was also the only SES variable that
did not exert a significant effect on health when the three SES variables were controlling
for one another; thus, it is possible that the association between occupation and health may
be spurious. In the "real world," however, we do not control for the effects of educatior?
and income. We examine the links to health of various factors that exist in the population.
One of the findings from this study is that self-rated health varies with occupation. Thus,
occupation can be described as a determinant of health for Canadian working women, with
women at the upper end of the occupational classification experiencing better health than
those below.

The ReIationship Between SOC and Self-Rated Health
The findings from this study reveal a significant association between SOC and seK
rated health. The bivariate correlation between SOC and self-rated health (r = -275,
p < -01) was slightly higher in this study than the correlation (r = .21) reponed by Hood
et al. (1996) using data from NPHS househoid respondents age 18 and over (including
males), but was generally consistent with the correlation of health measures reported in
other midies (Antonovsky, 1993; Carmel et al., 1991).The multivariate analysis indicated
that the relationship between SOC and self-rated health remained even afier controiiing for
the effects of SES, marital status, and age. When self-rated health was regressed on the
study variables, SOC contnbuted relatively more to the explained variance than did any
other study variable.
Antonovsky (1996b) quened whether "there was a linear effect in SOC, or if
having a particularly weak SOC (or a particularly strong) SOC is what matters" (p. 16).
Those with hi& SOC (74.9%) were more likely than those with medium (65.5%) or low
SOC (45.2%) to describe their health as 'excellent' or 'very good,' and the converse was
tme for those reporting 'fair' and 'poor' health. These results suggest that there is a
SOCheaIth gradient, but this analysis cannot nile out a threshold effect because the
differences between low SOC and medium SOC were greater than the differences between
medium and high SOC. The strength of this effect will J so vary with the cutofFpoints
used to determine the SOC levels.
Although the results from this study may provide fuxther support for
Antonovsky's (1987) contention that SOC is a determinant of health, there are several
other possible explanations for this finding. One explanation for the positive association
between SOC and heaith is that poor heaith is a determinant of the SOC level. h o t h e r
study using the NPHS data has shown a correlation between pain and SOC ( M c C k ~ o n -
Leong, 1997). The more pain that one expenences, the lower the SOC level. It is
plausible, therefore, that illness or poor health is a burden that has a deleterious effect on

SOC, a relationship that was not modeled in this study. Nternatively, the positive
relationship between SOC and health may be the result of a spurious association with
variables not in the regression. For example, sense of control, a construct theoretically
similar to (Antonovsky, 1987) and potentially correlated with SOC, is also related to self-
rated health (Lachman & Weaver, 1998). Constructs that are correlated with SOC, such
as self-esteem (Nyamathi, 199 1 ), depression (Beaudet, 1 996), and anxiety (Flannery &
Flannery, 1990), may also be part of the explanation for the SOC and health association.
The purpose of this study was not to provide causal explanations for the SOC and
health relationship; nevertheless, these alternative explanations for the observed
relationship highlight the importance of more studies to investigate the mechanism of the
effect of SOC on health. Clearly, longitudinal studies are necessary to identiQ this effect
because the cross-sectional nature of this and other studies precludes the establishment of
causal order.
Although empincally the evidence for a causal relationship may be lacking (Geyer,
1997), Antonovsky (1987) suggested that a strong SOC is critical to successtùl coping
with the inescapable stressors of life and, by extension, to health maintenance. This study
was unable to support or rehte this speculation because it did not address the coping
measures or the neuroendocrinologica1 mechanisms thought to mediate the SOC and
health relationship (Antonovsky, 1987, 1996a; Nyamathi, 1993). The persistent findings of
a positive association between SOC and health, however, warrants fùrther investigation.
1s SOC an Intervening Variable in the SES and Health Relationship?
The first research question explored the role of sense of coherence (SOC) as a
variable that mediates or intervenes in the socioeconomic status (SES) and health
relationship. The results of this study lend support to the hypothesis that socioeconomic
status shapes SOC, which in tum influences health.
The postulation of societal structural sources of SOC was sparked by
Antonovsb's (1987) belief that the "stressors that inhibit the SOC and the GRRs that

enhance if' (p. 94) are not randomly distrïbuted in societies. This study supports his
hypothesis that SOC varies with social groups, because SOC was found to d z e r with
household incorne adequacy, educational attainment, and the occupation of Canadian
women. The next section discusses the role of SOC as a mediator or intenrening variable
for each of the three relationships: income and health, education and health, and
occupation and health.
SOC as a Mediator in the Encorne and Health Relationship
Determination of the effects of income on self-rated health revealed that 16% of
income's total effect on health was mediated through SOC. SOC continued to rnediate a
portion of the effects of income on health (1 1.6%) when education and occupation were
added to the regressions. Part of the explanation for these findings is the relationship
between income and SOC.
This study revealed a positive relationship between income adequacy and SOC.
The greater the income, the higher the SOC. The mean level of SOC increased with each
of the five household incorne adequacy categones, and income and SOC were significantly
correlated (g = -16 1). Very little research was found regarding the relationship between
income and SOC, but the direction of the relationship found in this study is the same as
that found in another study of adults based on the NPHS data (Hood, Baudet, & Catlin,
1996). In my study, when SOC was used as a dependent variable, the positive relationship
between income and SOC remained afier controlling for the effects of age, marital status,
education, and occupation.
Why are income and SOC reiated? This study was unable to untangle the
relationship of SES with the three components of SOC (manageability, comprehensibility,
and meaningfilness), but it is reasonable to suggest that income is related to al1 three
components of SOC.
Adequate income may provide "opportunities to influence the events that affect
their lives" (Lachman & Weaver, 1998, p. 764). The ability to shape life experiences that

financial resources can provide rnay enhance the perception that Me is predictable (sense
of comprehensibility), and it may d o w for participation in rneaningful pursuits (sense of
meaningfidness). There are many hancial obstacles for women that prevent them from
obtaining employment in a more satisfjing job, making decisions to return to school, or
even enrolling in a community continuhg education class, all of which are activities that
might increase their SOC.
The positive relationship found in this study between household income adequacy
and SOC may also be related to the perception that there are financial resources at one's
disposal, thereby enhancing the sense of manageability. Economic hardship has been linked
with a low sense of control (Lachman & Weaver, 1998; Ross & Wu, 1995), a construct
that shares some sirnilarities with the SOC component of manageability (Antonovsky,
1987; Sullivan, 1993). Certainly, the greater number of "undesirable financial events"
(McLeod & Kessler, 1990, p. 163), such as job losses and the inability to pay bills or feed
the family, to which low-income women are subject, may indeed lead to a 'load
imbalance.' It may be an understatement to describe the overwhelming life circumstances
that some low-income women encounter as not being conducive to a sense of
manageability, comprehensibility, and rneaningfulness. These speculations provide possible
explanations for the link between income and SOC which was observed in this study.
SOC was found to mediate some of the effects of income on health; thus it can be
considered an intervening variable. It is not clear if it is the psychosocial effects associated
with income adequacy or the purchasing power and material benefits that accompany
income or both which contribute to health (Wilkinson, 1996). The observation nom this
study that SOC intervenes in the relationship between income and health, however,
suppons the notion that the psychosocial effects of income adequacy on health are
relevant. But clearly, the proportion of incorne's total effect on heaith which was mediated
through SOC was small. This smali, indirect effect is only further evidence that the exact
mechanism of the effect of income in the SES-health relationship is unknown. The findings

indicate, however, that most of the effect of incorne on health is a direct effect, reatfirming
that income is a findamental determinant of health which probably affects health through
multiple mechanisms &ink & Phelan, 1995).
SOC as a Mediator of the Education and Health Relationshi~
SOC was also found to rnediate the education and health relationship. Depending
on the number of SES indicaton included in the regression equation, and controlling for
marital statu and age, between 18.3% and 20% of education's total effect on self-rated
health was through SOC. Education was the SES variable that had the strongest effect on
SOC in the regression analysis when controlling for al1 the other variables. Consequently,
of the three SES indicators, education was the variable that exerted the greatest total
effect on self-rated health when the indirect effects of education on health through SOC
were considered. These findings underscore education's influence on SOC.
Ofthe three SES indicators, education had the lowest correlation with SOC yet
explained the most variance in SOC when used as the sole SES indicator and in
combination with income and occupation. The standardized regression coefficient
(P = -125) of the education variable was greater than the bivariate correlation between
SOC and education (r = -103). Age, negatively correlated with education, may be
suppressing the effect of education on SOC in the zero order correlation, and the
standardized regression coefficient may appropriately reflect the causal effect (Cohen &
Cohen, 1983).
Nyamathi (1993), in her study of minority women at risk for HIV, did not find a
correlation between education and SOC. One explanation for her finding is that any
beneficial influence of education on SOC is overshadowed by the persona1 and economic
circumstances expenenced by Nyamathi's sample of women. However, Nyamathi
hypothesized that SOC may not be shaped by the skills acquired through education.
In this study, evidence was found to support the postulated relationship between
education and SOC, and arguments can be made for a theoretical basis for this

relationship. Anaiytical skills, logic, and the ability to gather information, interpret, and
solve problems are skills acquired through education (Ross & Wu, 1995). These resources
may enhance the perception that the encountered stimuli are "structured, predictable, and
explicable" (Antonovslq, 1987, p. 19) and that one has the skills and idormation to deal
with demands. The social connections and social support that are also related to education
(Ross & Wu, 1995) may numire a sense of purpose. Thus, education may affect the
comprehensibility, manageability and meaningfidness components of SOC.
To tap the sense of manageability, the SOC questionnaire includes a question that
asks the respondent about feeling Like a "sad sack or losef' (Antonovsky, 1987), a feeling
that may be experienced more often in those with Iittle education. Self-esteem (Nyamathi,
1991) and a sense that one can successfully master or control one's experiences, or a
sense of control (Ross & Wu, 1995) have been found to be diminished in those with Little
education. This study revealed that the mean of the SOC value generally increased with
educatioial categories; however, the SOC mean of those who did not complete
postsecondary education was lower than the mean of those who had completed high
school (although not statistically signifiant). A sigdicant difference in SOC means was
found, however, between the women who had some community college and those who
had cûmpleted community college. Perhaps the sense of failure which might accompany
incomplete education has an impact on the sense of manageability. Thus, SOC may not be
related to the number of yean of education, but to the completion of prograrns, or both-
SOC as a Mediator in the Occupation and Health Relationship
In the third relationship exarnined, SOC was found to mediate the occupation and
health relationship. Sense of coherence mediated 19.7% of the effect that occupation had
on heaith, controliing for marital status and age. This was greater than the indirect effect
through SOC of either income or education. Furthemore, because occupation di<: not
have a significant direct effect on health when controliing for al1 other variables, it was
ody the indirect effect of occupation through SOC that influenced self-rated health. Al1 of

the effect of occupation on health was mediated through SOC, although this effect was
very srnail.
The positive relationship between SOC and occupation was evident in this study.
Generally speaking, the higher the occupation on the Pineo socioeconoMc classification
scale, the greater the SOC. This confims the work of George (1996), who found
significant differences between the SOC of four groups based on the occupations of home
health field workers. A concem with the George study, however, was the failure to control
for the effects of education and income. In my study, when education and income were
controlled, occupation remained a significant contnbutor to the variance in SOC. Based
on these findings, occupation may be considered a deteminant of SOC.
Antonovsiq (1 987) hypothesized that work conditions, and perhaps more
important, the historicaVcultural context of the work, are pertinent to the development of
SOC. Although this study did not address the work environment associated with the
occupational categories, the results showed that different occupations had different SOC
levels. It is ptausible that unskilled/semiskilled workers, the occupational group with the
lowest SOC rnean, may expenence work demands that exceed their resources, job
insecurity, unpredictability, and Iittle opportunity for the use and development of new
skills (Evans, 1994; Kaufert, 1996). It is also feasible that professionals, the occupational
group with the highest SOC mean, are able to balance their work demands, understand job
expectations, and participate in decision making in jobs that are socially valued.
Occupational categories may be a proxy for the work conditions and job characteristics
that structure the expenences influentid to SOC.
The individual's position in the occupational hierarchy, however, may be oniy a
crude indicator of the conditions important to the formation of SOC. Occupation
explained only a small proportion of the variance in SOC. The location on the
occupationai hierarchy did not consistently predict the SOC level. Famers, ranked in the
middle of the occupational classification, were the occupational group with the highest

SOC rnean (60.72). It is difncult to estimate the degree of rneaningf'ulness, manageability,
or comprehensibility that a faxmer expenences simply on the basis of location in the
occupationai classification.
Even though the specific aspect of the job that is influentid to SOC is currently
empirically unknown, the results 6om this study support the notion that parîicular
occupations have either SOC-enhancing or SOC-inhibithg characteristics. The job
characteristics that Antonovsky (1 987) hypothesized to shape SOC-involvement in
socially valued decision making, decision latitude (skill discretion and authority over
decisions) and job security-are dso being investigated as factors influentid to the
occupation and health relationship (Hibbard & Pope, 1985; Marmot & Theorell, 1988;
Wilkinson, 1996). Meaninal work has also been descnbed as a prerequisite for health
(CPHA, 1997), which is congruent with Antonovsky's contention that participation in an
enterprise that is socially valued wiU foster a sense of meaningnilness, the motivational
component of SOC central to the theory of salutogenesis. It is perhaps not surprising that
SOC was found in this sîudy to mediate the occupation and health relationship.
Age and Marital Status as Predictors of SOC
Antonovsb (1996a) challenged researchers to use SOC as a dependent variable.
Results fkom the path analysis provided information about the predictor variables
important to SOC. The relationships between SOC and the SES variables revealed that
SOC varies with socioeconomic status, which has already been discussed. The relationship
between SOC and the control variables of marital status and age were also significant.
One of Antonovsky's (1987, 1996a) postulates of the development of SOC was
that SOC would be stabilized after the first decade of adulthood. The relative stability of
SOC, however, has not been empiricaily tested (Antonovsb 1996b; Geyer, 1997). If
Antonovsl@s assumption of stability is correct, there should be little association between
age and SOC. This study, however, found that age and SOC were positively correlated
(r = -1 12, p < .01) and were aiso significant in the regression analysis which controlled for

marital status and SES. The older cohorts had a stronger SOC than did their younger
counterparts. This positive but small relationship between age and SOC has also been
noted in other studies (George, 1996; Hood et al., 1996; Ryland & Greenfeld, 199 1). In
summary, a positive correlation between age and SOC has been reported in populations
that include individuals past the first decade of adulthood. Further longitudinal study is
necessary to establish the stability of SOC over years.
This study also revealed a positive relationship between marital status and SOC
which held when the effects of age and SES were considered. Thus, at any stage of Sie or
in any socioeconomic circumstances, manied or common-law women experienced greater
SOC. The relationship between marital status and a sense of manageability,
comprehensibility, and meaningfulness in women is unknown; however, marital status may
in some way shape the life expenences conducive to a strong SOC.
Summary
The results fiom this study indicate that SOC mediates a srnali proportion of the
effect of the SES variables on self-rated health. Although no studies were found which
also examined this question, the literature supported the role of psychosocial resources as
mediators in the SES-health relationship (Adler et al., 1994; Lachman & Weaver, 1998;
Marmot & Theorell, 1988; Ross & Wu, 1995; WiIliarns, 1990). Williams described
psychosocial factors such as health practices, social ties, perceptions of control, and stress
as the "patterned response of social groups to the realities and constraints of the extemal
environment" (p. 82). As intervening variables of the SES and health relationship, these
psychosocial factors provide a way of understanding how differentials in health are
created. From this study, it was determined that one of the pathways through which the
SES variables influence health is through SOC. This study has shown that SOC is another
psychosocial factor that, dong with those identified by Williams, mediates the SES and
health relationship in women when SES is measured by each of the indicators of income,
education, and occupation.

Does the SES and Health Retationship Vary as a Function of SOC?
Two methods were used to explore the role of SOC as a variable that interacts
with socioeconomic status to rnoderate the socioeconomic status and health relationship.
SOC was not found to interact with income and education to Vary the SES and health
relationship. However, the results showed that SOC did interact with occupation. At low
levels of SOC, occupation did not influence health. At higher levels of SOC, an increase in
occupation resulted in greater self-rated health. However, the dEerence, although
statistically significant, was very small.
Sometimes the term buffer is used when discussing interaction effects. The role of
SOC as a buffer has been previously explored, but with inconsistent results (Flannery &
Flannery, 1990; Nyamathi, 1991). In this study, SOC was considered to have a buffenng
effect if two criteria were met: (a) evidence of an interaction with the SES variables, and
@) evidence of SOC'S greater protective effect on health at lower SES levels (Cohen &
Wills, 1985; Wheaton, 1985). Aithough occupation interacts with SES, SOC had a health-
boostering effect at high occupational levels, not low. Therefore, based on this definition,
the results did not support the premise that SOC could buffer the effects of lower levels of
income, education, or occupation on se&rated health. In sumrnary, the findings lend
support for htonovsky's (1996b) speculation that SOC makes direct and roughly equal
contributions to heaith for all persons. The one observed exception to this premise occurs
among occupational groups.
In an attempt to understand these unanticipated hdings, the hypothesized
mechanism for the effect of SOC on health needs to be considered again. Antonovsky
(1996b) stated that "the person with a strong SOC, believing that she or he understands
the problem and sees it as a challenge, wiii select what is believed to be the most
appropnate tool for the task at hand" (p. 172). A possible explanation for the failure to
detect a buffering effect is that there are very few resources to select and utilize Zone is at
the lowest SES levels. Thus, the effect of the strong SOC is the most evident at

occupational Ievels that provides resources at one's disposal to deal with encountered
situations (Geyer, 1997).
It is difficult to explain, however, why this effect was apparent only in occupation
and not in income or education. It rnay be that the GRRs important to both health and
SOC accompany the working conditions of the higher occupational categories. These
particular GRRs rnay not be related to income or education. Socially valued work,
participation in decision making, and decision latitude rnay be examples of resources that
have been shown to be important in the occupation and health relationship (Marmot &
Theorell, 1988) as well as theoretically linked with SOC (Antonovsky, 1987). These
resources, all linked with a sense of meaningfülness, are thought to be associated with the
higher occupational categories. Perhaps it is this particular component of SOC (sense of
meaNngfûlness) that is tapped by the experiences of those at the higher rung of the
occupational ladder.
In short, the results of this study indicate that the relationship between occupation
and hedth varies with the level of SCC, but SOC does not buffer the deletenous effects of
low SES on health. Instead, a high SOC level has a sdutogenic effect, particularly at high
occupational levels. The aspects of the working conditions that are relevant to health, a
strong SOC, and high occupational status cm be speculated. These occupational
characteristics may be conducive to a sense of meaningfulness, which is thought to be
important to a strong SOC. However, any interpretation of this data must take into
consideration the very smail effect size of the interaction between occupation and hedth.
Study Limitations
A major shortcoming of this study is the use of a cross-sectional survey. The
direction of causality cannot be detemined through statistical analysis of data collected at
one po. in tirne. This is a consideration in describing the relationship between SES and
health, and particularly the relationship between SOC and the other variables. Subsequent
to the publication of the Orientation to Life Questionnaire by Antonovsky (1987), there

have been several studies that included the SOC constmct, yet few have been longitudinal,
and none have determined the causal relationship between SOC and health or the stabiiity
of the SOC construct (Antonovslqr, 1993; Geyer, 1997). This study was able to support
the proposed causal modeling, but it does not eliminate the possibility that these same data
may also validate other causal models. Other explanations for the findings, such as the
reciprocal relationship between SOC and health, carmot be refbted in this study.
Theoretical consideration was given to the selection and the number of variables
used in this study. Because the purpose of this study was not to predict SOC or health, but
to describe the relationship among the three constnicts of SES, SOC, and health, only a
few variables were used. There is a risk, however, that the regression coefficients may be
inflated with the omission of variables that are either correlated with the predictor or
dependent variables (Pedhazur, 1982). The models were also unable to detect spurious
relationships between the variables. The correlation between the variables may be related
to relationships to the variables not included in the model.
This study was confined by the use of the variables within the NPHS 1994-95
survey and, more specifically, to those released for public use. Other socioeconomic status
indicators might have been beneficial to this study. The NPHS survey captured only the
availability of resources and circumstances at the present time rather than from penods
which rnay have been influential in the SOC development. The income adequacy,
educational attainment, and occupation of one's family of ongin might also be contnbuting
socioeconornic factors to SOC, if the experiences fiom the early years of life are important
to the development of SOC ( A n t o n o v s ~ 199613).
This study was also limited by the denved occupation variable that included only
responses fiom those women who had worked in the previous 12 months. Therefore, the
findings involving the occupation variable are generalizable only to working women, and
the extent to which previous occupation influenced SOC or health in Canadian
nonworking women is not known.

The SOC variable was a derived variable fiom the SOC-13 questionnaire, and only
the total SOC score was released for pubtic use. This is consistent with Antonovsky's
(1993) contention that the scaie measures the SOC constmct as a global orientation, not
the individual components of comprehensibility, manageability, or meaningfulness. One
consequence of this was the inability to explore the particular components of SOC that
may be related to self-rated hedth, income, education, or occupation. Another limiting
factor in the SOC scaie used in the NPHS is the scoring of the items with anchors of O and
6 rather than 1 and 7 as suggested by Antonovsky (1987). This prectudes accurate
comparison of SOC levels with other populations and groups that are reported in the
literature. Only cornparisons with groups from the NPHS data or from those using the
sarne scaie can be made.
Recommendations for Future Research
There is a paucity of research using the SOC variable in longitudinal studies. 1s
SOC stable after the first decade of adulthood, or can economic and personal
circumstances modiQ sense of manageability, comprehensibility, and meaningfulness? 1s
health a life experience that influences SOC? Longitudinal studies rnay aid in detemiinhg
causal ordering. Fortunately, the NPHS has a longitudinal component, and examination of
future NPHS cycles that utilize the SOC construct is recommended.
This study explored the role of SOC as a moderator of the SES and health
relationship. SOC was originally conceived as a constmct that explains how individuals
manage stress and stay well (Antonovsky, 1987). SES was used in this study to represent
the persona1 and economic circumstances which determine the extent of stresshl life
conditions. The results did not detect an income and education interaction with SOC and
identified only a srnaIl interaction effect between occupation and SOC. SOC may be a
moderator, however, when other more proximal measures of stress are used. Future
research should consider using variables that operationalize work stress or financial stress.

Additiondy, this study has highfighted the need for more Canadian research that
addresses occupational status in women. Specifically, research should be conducted that
addresses the relationship of SOC and health to the conditions of the work place
environment, the degree of participation in socidy valued decision making, and the social
value of the work. Future research should aiso utilïze occupational variables that capture
previous occupation, a factor particularly relevant to occupational studies with women.
Findy, there is a need for quditative work that could elucidate some of the
quantitative findings. In-depth interviews may be necessary to understand what it is about
income, education, and occupation that contnbutes to meaningfùlness, manageability, and
comprehensibility.
Implications for Nursing Practice
This study adds to the growing evidence of the relationship between
socioeconomic status and health, lends support for a relationship between SOC and self-
rated health, and describes the social patteming of sense of coherence in Canadian women.
Therefore, the results of this study give support for public health interventions that target
the socioeconomic conditions that influence health, and for strategies that foster the
development of a strong sense of coherence.
The inherent danger in the identification of another psychosocial construct that
intervenes in the SEShealth relationship is that it may give undue emphasis to this factor
rather than to the fundamental cause of the health inequities (Le., SES) (Link & Phelan,
1995). Wilkinson (1996) stated that "when trying to explain the effects of socioeconornic
circumstances on health, psychosociai factors are relevant only to the extent that they are
responses to those circumstances" (p. 18 1). The recognition that salutogenic factors, such
as SOC, are patterned by social, political, and economic forces should only underscore the
importance of health promotion strategies that focus on the socid and environmental
context in which individuals live, rather than on individuals themselves (Labonte, 1993;
Link & Phelan, 1995).

A socioenvironmental approach to health promotion considers the social and
environmental living conditions as prerequisites to heaith (Labonte, 1993; Reutter, in
press; WHO, 1986). Moreover, this approach considers these living conditions to
influence psychosocial factors (such as SOC). Ant onovsky (1 996a) stated that a
sdutogenic orientation to health promotion should ask the question "What can be done in
this community [emphasis mine] . . . to strengthen the sense of comprehensibility,
manageabiiity, and meaningfùlness of the persons who constitute it?" (p. 16). As Living and
working conditions improve for Canadian women, so does the availability of resources,
which are key to the development of SOC.
The socioeconomic status and health relationship is a relationship not unfafniiiar to
public health professionais. Public health nurses witness the living and working conditions
of those in the most disadvantaged level of the socioeconomic status hierarchy, and are
aware of the social, political, and economic forces that influence health (Blackburn,
1 99 1 ;Butter£ïeld, 1 990). These experiences have fostered heaith promotion strategies that
focus on the persona1 level to address immediate concerns, and on the community level to
advocate for structural change (Labonte, 1993; Reutter, in press; Stevens & Hall 1992).
The public health nurse's contact with families, small groups, and communities
provides various oppominities to shape life experiences (CPHA, 1990; Reutter, in press).
Strategies to foster experiences that provide consistency, underload-overload balance, and
participation in socially valued decision making for individuals throughout life's continuum
should be considered.
Traditionaily, the public health nurse has provided education and support to
families. If the experiences in the early years of life are critical to human development
(Hertzman, Frank, & Evans, 1994), as weli as to the development of a strong sense of
coherence (Antonvosky, 1987), then this lends support for the public heaith nursing
activities that target young families. Examples of these activities include home visits to
new-parents and Iow-income families, and early intervention prograrns that assist children

and families experiencing persona1 and econornic crises. Programs that offer opportunities
and resources may nurture a sense of manageability, comprehensibility, and
meaningfbiness.
Community development approaches that foster communiîy participation and
empowerment are strategies that are increasingly being used by public health professionals
(Labonte, 1993). There are many benefits arising eom community projects, such as
community gardens, collective kitchenq and HeaIthy Cornmunities projects. Cornmunity
development projects may be considered as 'SOC enhancing' and 'hedth-enhancing' as
participation in socially valued decision making is fostered. Community empowerment
may also lead to changes in the environment or health conditions (Wallerstein, 1992).
However, it is perhaps at the level of public policy that the socioeconornic
environment can best be addressed. The public hedth cornmunity is challenged to
stimulate public debate about polices that can address social and economic issues (CPHA,
1997; DrevdahI, 1995; Reutter & Williamson, in press). The Canadian Public Health
Association (1997) stated that "the first priority of healthy public policy must be to ensure
al1 Canadians have access to adequate amounts of nutritious foods, adequate housing,
meaningfbl work and adequate income, and that al1 Canadians have basic literacy skills and
heaith knowledge." Public health nurses can advocate for policy change that infiuences
heaith through their involvement in intersectord cornmittees at the comunity level and
through professional organizations meutter, in press).
Public policies that relate to socioenvironmental factors include income security
programs (employrnent insurance, social assistance, workers' compensation, child tax
benefits), afEordable housing, and universal and accessible health care services (CPHA,
1997). Socioeconomic inequalities can aiso be aEected by public policies that encourage
investment in education, Ne-long leamïng, on-the-job training, and skill development
(CPHA, 1997; Najman, 1993; Ross & Wu, 1995). Policies that facilitate a retum to school
or work d e r childbearing, such as the provision of Sordable, high-quality child care, are

125
particularly relevant to women (CPHA, 1997). Labor legislation that addresses minimal
wages and benefits (CPHA, 1997) also has implications for Canadian women in low-
paying jobs.
Conclusion
This cross-sectional study added to the knowledge of the determinants of health in
Canadian women. Evidence was found of a direct effect of income, education, and
occupation on self-rated health in wornen, as well as a small indirect effect through SOC.
Thus, this study provided empirical support for another psychosocial variable that
mediates the SES and health relationship. Sense of coherence, however, was not found to
function as an interactive buffer to ameliorate the adverse effects of low SES on health.
In keeping with Antonovsky7s (1987) belief in a salutogenic effect of sense of coherence,
SOC was found to have a protective effect on health regardless of SES. These findings
point to the need for further research that explores this relationship using longitudinal
studies and qualitative rnethods. The results of this study, however, suggest that public
hea1th nursing interventions should be targeted to enhancing socioenvironrnental
conditions that contribute to both SOC and health.

REFERENCES
Adams, O. (Ed.). (1993). Health status. Ottawa: Heaith and Welfare Canada.
Adler, N. E., Boyce, T., Chesney, M. A., Cohen, S., Folkman, S., Kahn, R. L., & Syme, S. L. (1994). Socioeconornic status and heaith: The challenge of the gradient. American Psvchologist. 49(I), 15-24.
Agresti, A, & Finlay, B. (1986). Statistical Methods for~the Social Sciences (2nd ed.). San Francisco: Dellen.
Anson, O., Rosenzweig, A, & Shwarzma~, P. (1993). The health of women married to men in replar army sewice: women who cannot &ord to be ill. Women & Health, 20(1), 3345-
Antonovsky, A. (1979). Health. stress. and copine: New persoectives on mental and ~hvsical weI1-beine. San Francisco: Jossey-Bass.
Antonovsb, A. (1987). Unraveline the mvsterv of health: How stress and stay well. San Francisco: Jossey-Bass.
Antonovsky, A (1992). Complexity, confiict, chaos, coherence, coercion and civility. Soc. Sci. Med.. 3 7(8), 969-98 1.
AntonovsS., A. (1993). The structure and properties of the sense of coherence scale. Soc. Sci. Med.. 36(6), 725-733.
Antonovsky, A. (1996a). The salutogenic mode1 as a theory to guide health promotion. Health Promotion International. 1 1 (I) , 1 1- 18
Antonovsky, A. (19966). The sense of coherence: An historicaI and fùture perspective. Isr. J. Med. Sci.. 32, 170-178
Antonovsky, H., & Sagy, S. (1986). The development of a sense of coherence and its impact on responses to stress situations. Journal of Social Psycholoq. 126(2), 213- 225.
Arber, S. (1990). Opening the 'Black BOX': Inequalities in women's health. In P. Abbott & G. Payne (Eds.), New directions in the sociolow of health (pp. 37-56). London: Falmer Press.
Arber, S. (1991). Class, paid ernployment and family roles: M a h g sense of structural disadvantage, gender and hedth status. Social Science Medicine, 32(4), 425- 436.

Arber, S. (1996). Xntegrating nonemployment into research on health inequalities. International Journal of Health Services, 26(3), 445-48 1.
Arber, S., Gilber, G., Nigel, & Dale, A (1985). Paid employment and women's health: a benefit or a source of role strain? Socioloav of Health and I1Iness. 7(3), 375-400.
Bartley, M., Popay, J., & Plewis, 1. (1992). Domestic conditions, paid employment and women's experience of iIi-health. Socioloav of Health & Illness, 14(3), 3 13-343.
Beaudet, M. P. (1996). Depression. Health Reports 7(4), 11-22.
Bergner, M., & Rothman, M. L. (1 987). Health status measures: AD overview and guide for selection. In L. Breslow (Ed.), Annual review of ~ublic health (Vol. 8, pp. 191- 210). PaIo Alto, CA: Annuai Reviews.
Blackburn, C. (1991). Poverty and health: Workine with families. Philadelphia: Open University Press.
Brink, P., & Wood, M. (1994). Basic stem in planning nursine. research fiom auestion to proposal. (4th ed.). Boston: Jones and Bartlett.
British Columbia Ministry of Health and Ministry Responsible for Seniors. (1994). Report on the heaith of British CoIumbians: Provincial Health Officer's Annual Report, 1994. Victoria: Author.
Butterneld, P. G. (1990). Thinking upstream: Nurturing a conceptual understanding of the societai context of health behavior. Advances in Nursing Science, 12(2), 1-8. -
Caimey, J., & Arnold, R. (1996). Social class, health and aging: Socioeconomic det erminant s of self-reported morbidity among non-institutional elderly in Canada. Canadian Journal of Public Heaith, 87(3), 299-203.
Cairney, J., & Arnold, R. (1998). Socioeconomic position, lifestyle and health among Canadians aged 18 to 64: A multi-condition approach. Canadian Journal of Public Health. 89(3), 208-212.
Canadian Public Health Association. (1996). Action statement for health promotion in Canada. Ottawa: Author.
Canadian Public HeaIth Association. (1997). Health impacts of social and economic conditions: Im~lications for public policv (Board of Directors Discussion Paper). Ottawa: Author.
Carmel, S., h s o n , O., Levenson, A., Bomeh, D. Y., & Maoz, B. (1991). Life events, sense of coherence and heaith: Gender differences on the kibbutz. Social Science Medicine. 32(l O), 1089- 1096.

Clarke, J. N. (1996). Health. illness. and medicine in Canada (2nd ed.). Toronto: Odord University Press.
Coe, R. M., Romeis, J. C., Tang, B., & Wolinsky, F. D. (1990). Correlates of a measure of coping in older veterans: A prelirninary report. Journal of Community Heaitk 15(5), 287-296.
Cohen, J., & Cohen, P. (1 983). Applied multiple regressionkorrelation analvsis for the behavioral sciences (2nd ed.). Hiilsdale, NJ: Lawrence Erlbaum Associates.
Cohen, M. (1994). Impact of poverty on women's health. Canadian Family Phpician, 4O(May), 949-957.
Cohen, S., & Wills, T. A (1985). Stress, social support, and the bufYering hypothesis. Arnerican Psvcholo.gica1 Association 98(2), 3 10-3 5 7.
D'Arcy, C., & Siddique, C. M. (1985). Unemployment and health: an analysis of the Canada Health Survey. International Journal of Health Service. 15, 609-635.
Dahiin, L., Cederblad, M., Antonovslq, A., & Hagneli, 0. (1990). Childhood vuinerability and adult invincibility. Acta Psvchiatric Scandinavia 82, 228-232.
Dangoor, N., & Florian, V. (1994). Women with chronic physical disabilities: Correlates of their long-term psychosocial adaptation. International Journal of Rehabilitation Research, 17, 159- 168.
Dickinson, H., Schissel, B., & Andre, G. (1992). Wornen's health, labor force participation, and lifestyles: Selected findings fiom the 1985 General Socid Survey, Canada. International Journal of Contemporary Sociolow, 29(2), 163- 1 86.
Drevdahl, D. (1 995). Corning to voice: The power of emancipatory community interventions. Advances in Nursina Science, 1 8(2) 13 -24.
Duncan, O. D. (1975). Introduction to structural equation models. New York: Acadernic Press
Epp, J. (1986). Achievine health of ail: A framework for heaith promotion. Ottawa: Ministry of Supply & SeMces.
Evans, R., G. (1994). Introduction. In R. G. Evans, L. M. Barer, & R T. Marmor (Eds.), Whv are some people healthy and others not? The detenninants of health of
ulations @p. 3-26). New York: Walter de Gruyter.
Flannery, R B., & Flannery, G. J. (1990). Sense of coherence, life stress, and psychological distress: A prospective methodological inquiry. Joumal of Clinical Psvcholo~. 46(4), 4 15-420.

129
FIannery, R B-, Perry, J. C., Penk, W. E., & Flannery, G. J. (1994). Validating Antonovsky's sense of coherence scale. Journal of Clinical Pwcholow. 50(4), 575-577.
Fowler, F. J. (1 993). Su- research methods (2nd ed.; Vol. 1). Newbury Park CA: Sage.
Fylkesnes, K-, & Forde, O. H. (1992). Determinants and dimensions involved in self-evaiuation of health. Sociai Science Medicine. 35, 271-279.
George, V. D. (1996). Field-workers' sense of coherence and perception of nsk when making home visits. Public Health Nursing. 13(4), 244-252.
Geyer, S. (1997). Some conceptual considerations on the sense of coherence. Social Science Medicine. 44(12), 1 77 1- 1779.
Hayduk, L. A. (1987). Structural eauation modeline with LISREL: Essentials and advances. Boston: Johns Hopkins University Press.
Hayduk, L. A., & Womacott, Y. H. (1980). "Effect equations" or "effect coefficients": A note on the visual and verbal presentation of multiple regression interactions. Canadian Joumal of Sociolow, 5(4). 399-404.
Health Statistics Division. (1995a). National Population Health Survey overview 1994-1 995 (Catalogue 82-567). Ottawa: Statistics Canada.
Hertel, B. R. (1976). Miniminng error variance introduced by missing data routines in survey analysis. Sociological Methods & Research. 4(4), 459-474.
Hertzman, C., Frank, J., & Evans, R. G. (1994). Heterogeneities in health status and the deterrninants of population health. In R G. Evans, M. L. Barer, & T. R Maimor (Eds), Why are some peoole healthy and others not? (pp. 67-92). New York: Adine De Gruyter.
Hïbbard, J., H., & Pope, C., R. (1985). Employrnent status, employment charactenstics, and women's health. Women and Health 10(1), 59-77.
Hood, S. C., Beaudet, M. P., & Catlin, G. (1996). A healthy outlook. Health Reports, 7(4), 25-32.
Jaccard, J., Tumsi, R, & Wan, C. K. (1990). Interaction effects in multiple remession. Newbury Park: Sage.
Kaplan, G. A., & Camacho, T. (1983). Perceived health and mortality: A nine year follow-up of the Human Population Laboratory Cohort. Am. J. Epidemiol.. 177, 292.
Kaufert, P. (1996). Gender as a determinant of health. On-line, http://www. hc- SC-gc. ca/canusa/paperslcanada/englisWgender. htm.

]Kim, J. O., & Muelier, C. W. Standardized and unstandardized coefficients in causal anaiysis: An expository note. Socioloaical Methods & Research 4(4), 423-437.
Labonte, R (2993). Health promotion and emr>owerment: Practice h e w o r k s . Toronto, ON: Centre for Hedth Promotion University of Toronto & ParticipAction.
Labonte, R. (1994). Death of a program, birth of metaphor: The development of health promotion in Canada. In A Pederson, M. O'Neill, & 1. Rootman (Eds.), Health promotion in Canada: Provincial. national & international uerspectives @p. 72-90). Toronto: W. B. Saunders Canada.
Lachman, M. E., & Weaver, S. L. (1998). The sense of control as a moderator of social class dserences in health and weil-being. Journal of Personalitv and Social PSVC~OIOEEY, 74(3), 763-773.
Lalonde, M. (1974). A new ~ers~ect ive on the health of Canadians. Ottawa: Ministry of Supply and SeMce.
Lefebvre, Y. (1996). Women's health research in Canada. (On line: http ://www. hc-sc.gc.ca~canusa/papers/canada~english/research. htm).
Lewis, S. L., Bonner, P. N., Campbell, M. A-, Cooper, C. L., & Willard, A. (1994). Personality, stress, coping, and sense of coherence among nephrology nurses in dialysis setting. ANNA Journal, 2 1 (6), 325-3 3 5.
Liberatos, P., Link, B. G., & Kelsey, J. L. (1988). The measurement of social class in epidemiology. Eoidernioloaic - Reviews, 10, 87- 12 1
Link, B., C., & Phelan, J. (1995). Social conditions as fundamental causes of disease. Journal of Health and Social Behavior(Extra Issue), 80-94.
Love, R, Jackson, L., Edwards, R, Pederson, A. (1996). Gender and other social deterrninants. (On Line: http://www.hc-sc.gc.ca~canusa/papers/c/.
MacIntyre, S. (1994). Understanding the social patteming of health: The role of the social sciences. Journal of Public Health Medicine. l6(l), 53 -59.
MacIntyre, S. (1997). The Black report and beyond. What are the issues? Social Science Medicine. 44(6), 723 -245.
Macran, S., Clarke, L., & Joshi, H. (1 996). Women's health: Dimensions and differentids. Social Science Medicine.. 42(9), 1203 - 12 16.
Marmot, M. G., Kogevinas, M., & Elston, M. A. (1987). Social/economic status and disease. Annual Review of Public Health, 8, 1 1 1 - 136.

Marmot, M., & Theorell, T. (1988). Social class and cardiovascular disease: the contribution of work. The social production of disease and illness @pi 93-105).
Mcclemon-Leong, J. (1997). Alternative health care provider use in chronic non- malismant min po~ulation. Unpublished master's thesis, University of Alberta, Edmonton.
McDanie1, S. A (1 993). Where the contradictions meet: Women and f e l y security in Canada in the 1990's. Ln National Forum on Family Secunty @de) Family securitv in insecure times @p. 163-180). Ottawa: National Forum on Family Security.
McLeod, J., & Kessler, R C. (1990). Socioeconomic status difEerences in vulnerability to undesirable Me events. Journal of Heaith and Social Behavior. 3 1, 162- 172.
Midanik, L. T., Soghikian, K., Ransom, L. J., & Polen, M. R. (1992). Alcohol problems and sense of coherence among older adults. Soc. Sci. Med.. 34(1), 43-48.
Mishel, M. H. (1989). Methodological studies: Instrument development. In P. Brink & M. J. Wood (Eds.), Advanced design in nursing research (pp. 238-284). Newbury Park, CA: Sage.
Mossey, J. M., & Shapiro, E. (1982). Self-rated health: A predictor of mortality among the elderly. American Journal of Public Health 13 5, 854.
Munro, B. H., & Page, E. B. (1993). Statistical methods for health care research (2nd ed.). Philadelphia: J. P. Lippincott.
Musil, C. M. (1998). Structural equation modeling and its relationship to multiple regression and factor analysis. Research in Nursinn & Health, 2 1, 27 1-28 1.
Mustard, C., & Roos, N. (1994). The reIationship of prenatal and pregnancy complications to birthweight in Winnepeg, Canada. Arnerican Journal of Public Health, 84, 1450-1457.
Najman, J. M. (1993). Health and poverty: Past, present and prospects for the future. Social Science Medicine. 36(2), 1 57- 166.
National Council of Welfare. (1 997). Povertv profile 1995. Ottawa: Author.
Norusis, M. (1993). SPSS for Wmdows, Base svstem user's guide release 6.0. Chicago: SPSS.
Numally, J. C. (1978). Psychometric theory. New York: McGraw-Hill.
Nyamathi, A. M. (1991). ReIationship of resources to emotional distress, somatic complaints, and high-risk behaviors in dmg recovery and homeless minonty women. Research in Nursing & Hedth, 14, 269-277.

Nyamatbi, A. M. (1993). Sense of coherence in minonty women at risk for HIV infection. Public Health Nursinn, 1 O(3), 15 1- 158.
Pedhanir, E. J. (1982). Multiple remession in behavioral research. New York: Holt, Rinehart, and Winston.
Polit, D. F. (1996). Data analysis & statistics for nursing research. S t d o r d , CT: Appleton & Lange.
Reilly, S. M. (1995). Community heaith promotion model for practice. In M. J. Stewart (Ed.), Communitv nursing: Promoting Canadians' heaith @p. 493 -5 12). Toronto: W. B. Saunders Canada.
Reutter, L. (1995). Socioeconomic deterrninants of health. In M. J. Stewart (Ed.), Community nursine: Promoting Canadian's heaith (pp. 223-245). Toronto, ON: W. B. S aunder S.
Reutter, L. 1. (in press). Socioeconornic determinants of health. In M. J. Stewart (Ed.), Cornmunitv nursing. Promoting Canadians' hedth (2nd ed.). Toronto: W. B. Saunders.
Reutter, L., Neufeld, A., & Harrison, M. (1 996, July 3). Research on the health of low-income Canadian women. Paper presented at the Canadian Public Health Association Annuai Convention, Vancouver, BC.
Reutter, L., & Williamson, D. L. (in press). Advocating healthy public policy: implications for baccalaureate nursing education. Journal of Nursinn Education.
Roberge, R., Berthelot, J.-M., Wolfson, M. (1995). Canadian Social Trends. 37, 15-19.
Ross, C. E., & Mirowsky, J. (1995). Does employment affect health. Journal of Health and Social Behavior, 36(September), 230-243.
Ross, C. E., & Wu, C.-L. (1 995). The links between education and health. Amencan Socio1og;icd Review. 60, 7 19-745.
Ross, C., E., & Wu, C.-L. (1996). Education, age, and the cumulative advantage in health. Journal of Health and Social Behavior. 3 7(March), 104- 120.
Ryland, E., & Greenfeld, S. (1991). Work stress and well-being: An investigation of A n t o n o v s ~ ' ~ çense of coherence model. Journal of Social Behavior and ~ersonalitv, 6(7), 3 9-54. -
Sagy, S., & Antonovsb H. (1996). Structurai sources of the sense of coherence: Two life stories of holocaust survivors in Israel. Israeli J Medical Science. 32, 200-205.

Seguin, L., Po* L., St.-Denis, M., & Loiselle, J. (1 995). Chronic stressors, social support and depression during pregnancy. Obstetrics and Gvnecolom. 85(4), 583- 589.
Shah, C., P. (1994). Public health and meventive medicine in Canada (3rd ed.). Toronto: University of Toronto Press.
Shweder, R, A. (1997, March 9). It's called poor health for a reason. The New York Times, p. ES.
Statistics Canada. (1 994). Health status of Canadians. Ottawa: Author.
Stevens, P. E., & Hall, J. M. (1992). Applying critical theories to nursing in comrnunities. Public Health Nursina. 9(2), 2-9.
Sullivan, G. C. (1993). Towards clarification of convergent concepts: Sense of coherence, will to meaning, locus of control, learned helplessness and hardiness. Joumal of Advanced Nursing, 18, 1772-1778.
Syme, S., Leonard, & Berhan, L., F. (1976). Social class, susceptibility, and sickness. American Journal of E~idemiolonv. 104(1), 1-8.
Tabachnick, B. G., & Fidell, L. S. (1989). Using multivariate statistics (2nd ed.). New York: HarperCollins.
Tambay, J.-L., & Catlin, G. (1995). Sample design of the National Population Health Survey. Health Reports, 7(1), 29-3 8.
Vanier Institute of the Family. (1994). Profihg Canada's families. Ottawa: Author.
Wallerstein, N. Powerlessness, empowerment, and health: Implications for health promotion prograrns. American Journal of Health Promotion, 6(3), 197-205.
Wheaton, B. (1985). Models for the stress-buffenng knctions of coping resources. Journal of Health and Social Behavior. 26, 3 52-364.
Wilkinson, R G. (1996). Unhealthy societies: The afflictions of inequalitv. London: Routledge.
Williams, D., R (1990). Socioeconomic differentials in health: A review and redirection. Social Psycholonv Quarterly. 53 (2), 8 1-99.
World Health Organization. (1986). Ottawa charter for health promotion. Ottawa: Canadian Public Health Association.
World Health Organization. (1 99 1). The Sundsvall statement on supportive environments for healt h. (On line: http ://www.ldb .org/vvtop/sundsval.htm).

World Health Organization. (1997b). The Jakarta declaration on heaith promotion into the 2 1 st century. (On line: h~p:!!~.v.w.dnttmmro/arspms/jakarta. htmi).

APPE,NDIX A
SENSE OF COaERENCE SCAlJC (DVSC194)
Inte~ewer: Next is a series of questions relating to various aspects of people's ïives. For each question please answer with a number between O and 6. Take your time to think about each question before answering.
SCOH-Q 1 : In this question O means s e l . or never and 6 means very often- How often do p u have the feeling that you don't really care about what goes on around you? (reverse scored)
6 Very ofteri
DK, R (Go to next section)
SCOH-Q2: In this question O means it has never happened and 6 means il hm a h y s hoppened How often in the past were you surprised by the behavior of people whom you thought you knew well? (reverse score4
O Never happened
6 Aiways happened
SCOH-Q3: In this question O means that i! h m never hcppened and 6 means it has ahvays happened How often have people you counted on disappointed you? (reverse scored)
O Never hap pened
6 Aiways happened
SCOH-Q4: In this question O means very open and 6 means very seldom or never. How often do you have the feeling you're being treated unfairly?
O Very often
6 Very seldom or never
SCOH-QS: In this question O means very oflen and 6 means v e v seldom or never. How often do you have the feeling you are in an unfamiliar situation and don't know what to do?
O Very often
6 Very seldom or never

SCOH-Q6: In this question O means very o f l n and 6 means very seldom or never. How often do you have very mixed-up feeliigs and ideas?
O Very often
6 Very seldom or never
SCOH-Q7: In this question O means very often and 6 means very seldom or never. How oAen do you have feelings inside that you would rather not feel?
O Very often
6 Very seldom or never
SCOH-Q8: In this question O means very seldom and 6 means very ofteen. Many people- even those with a strong character-sometimes feel like sad sacks (losers) in certain situations. How often have you felt this way in the past? (reverse score4
O Very seldom or never
6 Very often
SCOH-Q9: In this question O means very oflen and 6 means very seldom or never. How oflen do you have the feeling that there's iittle meaning in the things you do in your daily life?
O Very ofien
6 Very seldom or never
SCOH-Q10: In this question O means very often and 6 means very seldom or never. How ofien do you have feelings that you're not sure you can keep under control?
O Very ofien
6 Very seldorn or never
SCOH-Q1 1 : In this question O means no cZem goals orpurpose and 6 means very clear goals andpurpose. Until now your life has had no clear goals or purpose, or has it had very clear goals and purpose?
O No clear gods or no purpose at al1
6 Very clear goals and purpose

SCOH-Q 12: In this question O means you overestimate or underestimate importance and 6 means you see things in the rightproporfion. When something happens, do you generaiiy find that you overestimate or underestimate its importance, or do you see things in the nght proportion?
O Overestimate or underestimate its importance
6 See things in the right proportion
SCOKQ 13 : In this question O means a source of greai pleanrre and satisfaction and 6 means a source ofpain and boredom. 1s doing the things you do every day a source of great pleasure and satisfaction or a source of pain and boredom? (reverse scored)
O A great deaI of pleasure and satisfaction
6 A source of pain and boredom

1.
2.
3.
4.
5.
6 .
7.
8.
9.
1 o.
I l .
12.
APPENDIX B
DERIYED EIGHEST LEVEL OF EDUCATLON OBTAINED (DVEDC294)
Elementary
Some secondary
Secondary
Some trade, technical, vocational school, or business coUege
Some cornrnunity college, CEGEP or nursing school
Some university
Diploma or certificate nom trade, technical, or vocational school; or business college
Diploma or certificate £?om community college, CEGEP, or nursing school
B-achelor's or undergraduate degree or teacher's college (Bk BSc, LLB)
Master's degree (e-g., MA, MSc, MEd)
Degree in medicine, dentistry, vetennary medicine, or optometsr (MD, DDS, DMD, DVM, OD); eamed doctorate (e.g., PhD, DSc, EdD)

APPENDIX C
INCOME ADEQUACY IN FIVE DISCRETE CATEGORIES (DVINC594)
This variable is based on household income and the size of the household.
Code Description Income HH size L Lowest income Less than $10,000 1 to 4 persons
Less than $15,000 5 or more persons
2 Lower middle income $10,000 to $14,999 Z or 2 persons
$10,000 to $14,999 3 or 4 persons
$15,000 to $29,999 5 or more persons
3 Middle income $1 5,000 to $29,999 1 or 2 persons
$20,000 to $39,999 3 or 4 persons
$30,000 to $59,999 5 or more persons
4 Upper middle income $30,000 to $59,999 1 or 2 persons
$40,000 to $79,999 3 or 4 persons
$60,000 to $79,999 5 or more persons
5 Highest Incorne $60,000 or more I or 2 persons
$80,000 or more 3 persons or more
9 Unknown Not stated Not applicable

APPENDIX D
PINE0 SOCIO-ECONOMIC CLASSIFICATION
OF OCCUPATION ( D V P I N ~ ~ )
Self-Employed Professional
Employed Professional
fi&-Level Management
Semiprofessional
Technician
Middle Management
Supervisors
Forewomen
Skilled ClencaVSales/Services
S killed Crafts/Trades
Farrners
Semiskilled ClericaVSales
Semiskilled Manual
Unskilled ClericaVSalesISe~ces
Unskilled Manual
Farm Laborers
Not AppIicable
Not Stated

Marmot, M., & Theoreil, T. (1988). Social class and cardiovascular disease: the contribution of work. The social oroduction of disease and illness @p: 93-105).
McClemon-Leong, 1. (1 997). Alternative health care provider use in chronic non- matirnant pain ~ooulation. Unpublished master's thesis, University of Alberta, Edmonton.
McDanieI, S. A. (1993). Where the contradictions meet: Women and family security in Canada in the 1990's. In National Forum on Family Security (Ed.) Family securitv in insecure times (pp. 163-1 80). Ottawa: National Forum on Family Security.
McLeod, J., & Kessler, R C. (1990). Socioeconomic status dserences in vulnerability to undesirable life events. Journal of Health and Social Behavior, 3 1, 162- 172.
Midanik, L. T., Soghikian, K., Ransom, L. J., & Polen, M. R (1992). Aicohol problems and sense of coherence among older adults. Soc. Sci. Med.. 34(1), 43-48.
Mishel, M. H. (1989). Methodological studies: Instrument development. In P. Brink & M. J. Wood (Eds.), Advanced design in nursing research @p. 238-284). Newbury Park, CA: Sage.
Mossey, J. M., & Shapiro, E. (1982). Self-rated health: A predictor of mortdity among the elderly. Amencan Journal of Public Healtb 135, 854.
Munro, B. H., & Page, E. B. (1993). Statistical methods for health care research (2nd ed.). Philadelphia: J. P. Lippincott.
Musil, C. M. (1998). Structural equation modeling and its relationship to multiple regression and factor analysis. Research in Nursine. & Health 2 1, 27 1-28 1.
Mustard, C., & Roos, N. (1994). The relationship of prenatd and pregnancy complications to birthweight in Winnepeg, Canada. Amencan Journal of Public Health,
Najman, J. M. (1993). Health and poverty: Past, present and prospects for the fùture. Social Science Medicine, 3 6(2), 157- 166.
National Council of Welfare. (1997). Poverty profile 1995. Ottawa: Author.
Norusis, M. (1993). SPSS for Wmdows. Base svstem user's guide release 6.0. Chicago: SPSS.
Numally, J. C. (1 978). Psvchometnc theory. New York: McGraw-Hill.
Nyarnathi, A. M. (1 99 1). Relationship of resources to emotional distress, somatic complaints, and high-risk behaviors in dmg recovery and homeless minority women. Research in Nursin~ & Health. 14, 269-277.

Nyamathi, A. M. (1993). Sense of coherence in minority women at risk for HIV infection. Public Health Nursinn 10(3), 15 1-1 58.
Pedhazur, E. J. (1982). Multiple re~ession in behavioral research. New York: Holt, Rinehart, and Winston.
Polit, D. F. (1996). Data analvsis & statistics for nursine research. Stamfiord, CT: Appleton & Lange.
Reilly, S. M. (1995). Community health promotion mode1 for practice. In M. J. Stewart (Ed.), Cornmunitv nursinp: Promoting Canadians' health (pp. 493-5 12). Toronto: W. B. Saunders Canada.
Reutter, L. (1995). Socioeconomic determinants of health. In M. J. Stewart (Ed.), Community nurs in~ Promoting Canadian's health (pp. 223-245). Toronto, ON: W. B. Saunders.
Reutter, L. 1. (in press). Socioeconornic determinants of health. In M. J. Stewart (Ed.), Community nursing. Promoting Canadians' health (2nd ed.). Toronto: W. B.Saunders.
Reutter, L., Neufeld, A., & Harrison, M. (1 996, July 3). Research on the health of low-incorne Canadian women. Paper presented at the Canadian Public Health Association Annual Convention, Vancouver, BC.
Reutter, L., & Williamson, D. L. (in press). Advocating healthy public policy: implications for baccalaureate nursing education. Journal of Nursine Education.
Roberge, R., Berthelot, J.-M., Wolfson, M. (1995). Canadian Social Trends. 37, 15-19.
Ross, C. E., & Mirowslq, J. (1995). Does employrnent &ect health. Journal of Health and Social Behavior. 36(September), 230-243.
Ross, C. E., & Wu, C.-L. (1995). The links between education and hedth. Arnencan SocioIogical Review. 60, 7 19-745.
Ross, C., E., & Wu, C.-L. (1996). Education, age, and the cumulative advantage in health. Journal of Health and Social Behavior. 37(March), 104-120.
Ryland, E., & Greenfeld, S. (1991). Work stress and well-being: An investigation of Antonovsky's sense of coherence model. Joumal of Social Behavior and Personalitv, 6(7), 39-54. -
Sagy, S., & Antonovslq, H. (1996). Structural sources of the sense of coherence: Two life stories of holocaust survivors in IsraeI. Israeli J Medical Science. 32, 200-705.

Seguin, L., Potvin, L., St.-Denis, M., & Loiselle, 1. (1 995). Chronic stressors, social support and depression during pregnancy. Obstetrics and Gvnecolow. 8 5(4), 5 83 - 589.
Shah, C., P. (1994). Public health and meventive medicine in Canada (3rd ed.). Toronto: University of Toronto Press.
Shweder, R, A (1997, March 9). Tt's called poor health for a reason. The New York Times, p. E5.
Statistics Canada. (1994). Health status of Canadians. Ottawa: Author.
Stevens, P. E., & Hall, J- M. (1 992). Applying cntical theories to nursing in cornmunities. Public Health Nursing, 9(1), 2-9.
Sullivan, G. C. (1993). Towards clarification of convergent concepts: Sense of coherence, will to meaning, locus of control, learned helplessness and hardiness. Joumal of Advanced Nursing. 18, 1772- 1778.
Syme, S., Leonard, & Berlunan, L., F. (1976). Social class, susceptibility, and sickness. American Journal of Epiderniolom. 1 O4(l), 1-8.
Tabachnick, B. G., & Fidell, L. S. (1989). Usine; multivariate statistics (2nd ed.). New York: HarperCohs.
Tambay, LL., & Catlin, G. (1995). Sample design of the National Population Health Survey. Health Reports. 7(1), 29-3 8.
Vanier Institute of the Family. (1 994). Profiline Canada's families. Ottawa: Author.
Wallerstein, N. Powerlessness, empowerment, and health: Implications for health promotion programs. American Journal of Health Promotion, 6(3), 197-205.
Wheaton, B. (1985). Models for the stress-buffenng functions of coping resources. Journal of Health and Social Behavior. 26,3 52-364.
Wilkinson, R. G. (1996). Unhealthv societies: The afllictions of ineauality. London: Routledge.
Williams, D., R. (1990). Socioeconomic differentials in health: A review and redirection. Social Psvcholo~;v Quarterly, 53(2), 8 1-99.
World Health Organization. (1 986). Ottawa charter for health promotion. Ottawa: Canadian Public Health Association.
World Health Organization. (1 99 1). The Sundsvall statement on supportive environments for health. (On line: http://www.ldb.org/~top/sundsval. htm).

World Heaith Organization. (1 997b). The Jakarta declaration on heaith ~romotion into the 2 1 st centurv. (On line: http://www.dn~ro/arsprns/jakarta. htm1)-

APPENDIX A
SENSE OF COHERENCE SCALE ~mvsci94)
Interviewer: Next is a series of questions relating to various aspects of people's lives. For each question please answer with a number between O and 6. Take your tirne to think about each question before answering.
SCOH-QI: In this question O means seldom or never and 6 means very open- How often do you have the feeling that you don't reaily care about what goes on around you? (reverse scored)
O Very seldom or never
6 Very often
DK, R (Go to next section)
SCOH-Q2: In this question O means il has never hoppened and 6 means it haF a b q s huppened How often in the past were you surprised by the behavior of people whom you thought you knew well? (reverse score4
O Never happened
6 Always happened
SCOH-Q3 : In this question O means that it hm never hcppened and 6 means it has ahays happeneil How often have people you counted on disappointed you? (reverse scored)
O Never happened
6 Always happened
SCOH-Q4: In this question O means very ofien and 6 means very seldom or never. How ofien do you have the feeling you're being treated unfairly?
O Very ofien
6 Very seldom or never
SCOH-QS: In this question O means very offn and 6 means v e v seldom or never. How often do you have the feeling you are in an unfarniliar situation and don? know what to do?
O Very often
6 Very seldom or never

SCOH-Q6: In this question O means very oftn and 6 means very seldom or never. How often do you have very mixed-up feelings and ideas?
O Very often
6 Very seldom or never
SCOH-Q7: In this question O means very often and 6 rneans very s e l . or never. How often do you have feelings inside that you would rather not feel?
O Very ofien
6 Very seldom or never
SCOH-Q8: In this question O means very seldom and 6 rneans very ofte,t. Many people- even those with a strong character-sometimes feel like sad sacks (losers) in certain situations. How ofien have you felt this way in the past? (reverse scored)
O Very seldom or never
6 Very ofien
SCOH-Q9: In this question O means very oftn and 6 means very seldum or never. How ofien do you have the feeling that there's little meaning in the things you do in your daily life?
O Very often
6 Very seldom or never
SCOH-Q10: In this question O means very of tn and 6 rneans very seldom or never. How ofien do you have feelings that you're not sure you can keep under control?
O Very often
6 Very seldom or never
SCOH-QI 1 : In this question O means no clear g d s orpuvose and 6 means very cleor goals andpurpose. Until now your life has had no clear goals or purpose, or has it had very clear goals and purpose?
O No clear goals or no purpose at ali
6 Very clear goals and purpose

SCOH-Ql2: In this question O means you overestimate or underestimate importunce and 6 means you see things in the rightproporfion. When something happens, do you generaiiy find that you overestimate or underestimate its importance, or do you see things in the nght proportion?
O Overestirnate or underestimate its importance
6 See things in the right proportion
SCOH-Q 13 : In this question O means a source of great tpleanrre ami sarisfaction and 6 means a source ofpain and boredom. 1s doing the things you do every day a source of great pleasure and satisfaction or a source of pain and boredom? (reverse score4
O A great deal of pleasure and satisfaction
6 A source of pain and boredom

APPENDIX B
DE-D HIGHEST LEVEL OF EDUCATION OBTAINED (DVEDC294)
No schooling
Elementw
Some secondary
Secondary
Some trade, technical, vocationai school or business college
Some cornrnunity college, CEGEP or nursing school
Some university
Diploma or certificate fiom trade, technical, or vocational school; or business college
Diploma or certificate 60m community coilege, CEGEP, or nursing school
Bachelor's or undergraduate degree or teacher's coiiege (BA BSc, LLB)
Master's degree (e-g., Mq MSc, MEd)
Degree in medicine, dentistry, veterinary medicine, or optometry (MD, DDS, DMD, DVM, OD); earned doctorate (e.g., PhD, DSc, EdD)

This variable is based on household income and the size of the househoid.
Code Description lncome . - - - HH size :>L U I G U I ~ C : L ~ S S tha ui % 10,UUO 1 to 4 persons
Less than $15,000
2 Lower middle income $10,000 to $14,999
$10,000 to $24,999
$1 5,000 to $29,999
3 Middle incorne $15,000 to $29,999
$20,000 to $39,999
$30,000 to $59,999
4 Upper rniddle income $30,000 to $59,999
$40,000 to $79,999
$60,000 to $79,999
5 Highest Income $60,000 or more
$80,000 or more
9 Unknown Not stated
5 or more persons
1 or 2 persons
3 or 4 persons
5 or more persons
1 or 2 persons
3 or 4 persons
5 or more persons
1 or 2 persons
3 or 4 persons
5 or more persons
1 or 2 persons
3 persons or more
Not applicable

APPENDIX D
PINEO SOCIO-ECONOMIC CLASSIFICATION
OF OCCUPATION (DVPIN94)
Self-Employed Professional
Employed Professionai
High-Level Management
Semiprofessional
Technician
Middle Management
Supervisors
Forewomen
Skilled ClericaVSales/Services
Skilled Craftd'ïrades
Fanners
Semiskilled ClericaVSales
Unskilled ClericaVSales/Services
Unskilled Manual
Farm Laborers
Not Applicable
Not Stated

12to 14years
1Sto 19years
20 to 24years
25 to 29 years
30 to 34 years
APPENDIX E
NPHS AGE COEORTS (AGEGRP)
35 to 39years 60 to 64years
40 to 44years 65 to69years
45 to 49 years 70 to 74 years
50 to 54 years 75 to 79 years
55 to 59years 80+ years