Socioeconomic Status and Academic Achievement: A … · Review of Educational Research Fall 2005,...
37
Review of Educational Research Fall 2005, Vol. 75, No. 3, pp. 417–453 Socioeconomic Status and Academic Achievement: A Meta-Analytic Review of Research Selcuk R. Sirin New York University This meta-analysis reviewed the literature on socioeconomic status (SES) and academic achievement in journal articles published between 1990 and 2000. The sample included 101,157 students, 6,871 schools, and 128 school dis- tricts gathered from 74 independent samples. The results showed a medium to strong SES–achievement relation. This relation, however, is moderated by the unit, the source, the range of SES variable, and the type of SES–achieve- ment measure. The relation is also contingent upon school level, minority sta- tus, and school location. The author conducted a replica of White’s (1982) meta-analysis to see whether the SES–achievement correlation had changed since White’s initial review was published. The results showed a slight decrease in the average correlation. Practical implications for future research and policy are discussed. KEYWORDS: achievement, meta-analysis, SES, social class, socioeconomic status. Socioeconomic status (SES) is probably the most widely used contextual vari- able in education research. Increasingly, researchers examine educational processes, including academic achievement, in relation to socioeconomic back- ground (Bornstein & Bradley, 2003; Brooks-Gunn & Duncan, 1997; Coleman, 1988; McLoyd, 1998). White (1982) carried out the first meta-analytic study that reviewed the literature on this subject by focusing on studies published before 1980 examining the relation between SES and academic achievement and showed that the relation varies significantly with a number of factors such as the types of SES and academic achievement measures. Since the publication of White’s meta- analysis, a large number of new empirical studies have explored the same relation. The new results are inconsistent: They range from a strong relation (e.g., Lamdin, 1996; Sutton & Soderstrom, 1999) to no significant correlation at all (e.g., Ripple & Luthar, 2000; Seyfried, 1998). Apart from a few narrative reviews that are mostly exclusive to a particular field (e.g., Entwisle & Astone, 1994; Haveman & Wolfe, 1994; McLoyd, 1998; Wang, Haertal, & Walberg, 1993), there has been no systematic review of these empirical research findings. The present meta-analysis is an attempt to provide such a review by examining studies published between 1990 and 2000. McLoyd (1998), in her review of recent research on SES and child develop- ment, and Entwisle and Astone (1994), in their review of SES measures, identified a number of major factors that differentiate the research published during the 1960s 417
Transcript of Socioeconomic Status and Academic Achievement: A … · Review of Educational Research Fall 2005,...
Review of Educational ResearchFall 2005, Vol. 75, No. 3, pp. 417–453
Socioeconomic Status and Academic Achievement:A Meta-Analytic Review of Research
Selcuk R. SirinNew York University
This meta-analysis reviewed the literature on socioeconomic status (SES) andacademic achievement in journal articles published between 1990 and 2000.The sample included 101,157 students, 6,871 schools, and 128 school dis-tricts gathered from 74 independent samples. The results showed a mediumto strong SES–achievement relation. This relation, however, is moderated bythe unit, the source, the range of SES variable, and the type of SES–achieve-ment measure. The relation is also contingent upon school level, minority sta-tus, and school location. The author conducted a replica of White’s (1982)meta-analysis to see whether the SES–achievement correlation had changedsince White’s initial review was published. The results showed a slightdecrease in the average correlation. Practical implications for futureresearch and policy are discussed.
KEYWORDS: achievement, meta-analysis, SES, social class, socioeconomic status.
Socioeconomic status (SES) is probably the most widely used contextual vari-able in education research. Increasingly, researchers examine educationalprocesses, including academic achievement, in relation to socioeconomic back-ground (Bornstein & Bradley, 2003; Brooks-Gunn & Duncan, 1997; Coleman,1988; McLoyd, 1998). White (1982) carried out the first meta-analytic study thatreviewed the literature on this subject by focusing on studies published before 1980examining the relation between SES and academic achievement and showed thatthe relation varies significantly with a number of factors such as the types of SESand academic achievement measures. Since the publication of White’s meta-analysis, a large number of new empirical studies have explored the same relation.The new results are inconsistent: They range from a strong relation (e.g., Lamdin,1996; Sutton & Soderstrom, 1999) to no significant correlation at all (e.g., Ripple& Luthar, 2000; Seyfried, 1998). Apart from a few narrative reviews that aremostly exclusive to a particular field (e.g., Entwisle & Astone, 1994; Haveman &Wolfe, 1994; McLoyd, 1998; Wang, Haertal, & Walberg, 1993), there has been nosystematic review of these empirical research findings. The present meta-analysisis an attempt to provide such a review by examining studies published between1990 and 2000.
McLoyd (1998), in her review of recent research on SES and child develop-ment, and Entwisle and Astone (1994), in their review of SES measures, identifieda number of major factors that differentiate the research published during the 1960s
417
3179-04_Sirin.qxd 9/2/05 2:07 PM Page 417
Sirin
418
and the 1970s from that published in recent years. The first of these is the changein the way that researchers operationalize SES. Current research is more likely touse a diverse array of SES indicators, such as family income, the mother’s educa-tion, and a measure of family structure, rather than looking solely at the father’seducation and/or occupation.
The second factor is societal change in the United States, specifically in parentaleducation and family structure. During the 1990s, parental education changeddramatically in a favorable direction: Children in 2000 were living with better-educated parents than children in 1980 (U.S. Department of Education, 2000).Likewise, reductions in family size were also dramatic; only about 48% of 15-to-18-year-old children lived in families with at most one sibling in 1970, ascompared with 73% in 1990 (Grissmer, Kirby, Berends, & Williamson, 1994).
A third factor is researchers’ focus on moderating factors that could influencethe robust relation between SES and academic achievement (McLoyd, 1998). Withincreased attention to contextual variables such as race/ethnicity, neighborhoodcharacteristics, and students’ grade level, current research provides a wide rangeof information about the processes by which SES effects occur.
Thus, because of the social, economic and methodological changes that haveoccurred since the publication of White’s (1982) review, it is difficult to estimatethe current state of the relation between SES and academic achievement. Thisreview was designed to examine the relation between students’ socioeconomic sta-tus and their academic achievement by reviewing studies published between 1990and 2000. More specifically, the goals of this review are (a) to determine the mag-nitude of the relation between SES and academic achievement; (b) to assess theextent to which this relation is influenced by various methodological characteris-tics (e.g., the type of SES or academic achievement measure), and student charac-teristics (e.g., grade level, ethnicity, and school location); and (c) to replicateWhite’s meta-analysis with data from recently published studies.
Measuring Socioeconomic StatusAlthough SES has been at the core of a very active field of research, there seems
to be an ongoing dispute about its conceptual meaning and empirical measurementin studies conducted with children and adolescents (Bornstein & Bradley, 2003).As White pointed out in 1982, SES is assessed by a variety of different combina-tions of variables, which has created an ambiguity in interpreting research findings.The same argument could be made today. Many researchers use SES and socialclass interchangeably, without any rationale or clarification, to refer to social andeconomic characteristics of students (Ensminger & Fothergill, 2003). In generalterms, however, SES describes an individual’s or a family’s ranking on a hierar-chy according to access to or control over some combination of valued commodi-ties such as wealth, power, and social status (Mueller & Parcel, 1981).
While there is disagreement about the conceptual meaning of SES, there seemsto be an agreement on Duncan, Featherman, and Duncan’s (1972) definition of thetripartite nature of SES that incorporates parental income, parental education, andparental occupation as the three main indicators of SES (Gottfried, 1985; Hauser,1994; Mueller & Parcel, 1981). Many empirical studies examining the relationsamong these components found moderate correlations, but more important, thesestudies showed that the components of SES are unique and that each one measures
3179-04_Sirin.qxd 9/2/05 2:07 PM Page 418

Socioeconomic Status and Academic Achievement
419
a substantially different aspect of SES that should be considered to be separatefrom the others (Bollen, Glanville, & Stecklov, 2001; Hauser & Huang, 1997).
Parental income as an indicator of SES reflects the potential for social and eco-nomic resources that are available to the student. The second traditional SES com-ponent, parental education, is considered one of the most stable aspects of SESbecause it is typically established at an early age and tends to remain the sameover time. Moreover, parental education is an indicator of parent’s incomebecause income and education are highly correlated in the United States (Hauser& Warren, 1997). The third traditional SES component, occupation, is ranked onon the basis of the education and income required to have a particular occupation(Hauser, 1994). Occupational measures such as Duncan’s Socioeconomic Index(1961) produce information about the social and economic status of a householdin that they represent information not only about the income and educationrequired for an occupation but also about the prestige and culture of a givensocioeconomic stratum.
A fourth indicator, home resources, is not used as commonly as the other threemain indicators. In recent years, however, researchers have emphasized the signif-icance of various home resources as indicators of family SES background (Cole-man, 1988; Duncan & Brooks-Gunn, 1997; Entwisle & Astone, 1994). Theseresources include household possessions such as books, computers, and a studyroom, as well as the availability of educational services after school and in the sum-mer (McLoyd, 1998; Eccles, Lord, & Midgley, 1991; Entwisle & Astone).
Aggregated SES MeasuresEducation researchers also have to choose whether to use an individual stu-
dent’s SES or an aggregated SES based on the school that the student attends (Cal-das & Bankston, 1997) or the neighborhood where the student resides(Brooks-Gunn, Duncan, & Aber, 1997). School SES is usually measured on thebasis of the proportion of students at each school who are eligible for reduced-priceor free lunch programs at school during the school year. Students from familieswith incomes at or below 130% of the poverty level are eligible for free meals.Those with incomes between 130% and 185% of the poverty level are eligible forreduced-price meals. Neighborhood SES, on the other hand, is usually measuredas the proportion of neighborhood/county residents at least 20 years old who,according to the census data, have not completed high school (Brooks-Gunn,Denner, & Klebanov, 1995). School and neighborhood SES indicators vary in howthey assess SES, but they share the underlying definition of SES as a contextualindicator of social and economic well-being that goes beyond the socioeconomicresources available to students at home (see Brooks-Gunn, Denner, & Klebanov).
Using aggregated SES measures may introduce the issue of “ecological fallacy”into the interpretation of results from various studies with differing units of analy-sis. The ecological fallacy is simply a misinterpretation wherein an individual-levelinference is made on the basis of group aggregated data. In the context of the cur-rent review it refers to the erroneous assumption that research findings at the schoolor neighborhood level also represent within-school or within-neighborhood rela-tionships, and vice versa. Aggregated SES data on the school or neighborhood lev-els cannot be interpreted as if they represented family SES variables, nor shouldstudent-level SES data be used to explain differences between schools.
3179-04_Sirin.qxd 9/2/05 2:07 PM Page 419

420
Student CharacteristicsSocioeconomic status is not only directly linked to academic achievement but
also indirectly linked to it through multiple interacting systems, including students’racial and ethnic background, grade level, and school/neighborhood location(Brooks-Gunn & Duncan, 1997; Bronfenbrenner & Morris, 1998; Eccles, Lord, &Midgley, 1991; Lerner 1991). For example, family SES, which will largely deter-mine the location of the child’s neighborhood and school, not only directlyprovides home resources but also indirectly provides “social capital,” that is, sup-portive relationships among structural forces and individuals (i.e., parent–schoolcollaborations) that promote the sharing of societal norms and values, which arenecessary to success in school (Coleman, 1988; Dika & Singh, 2002). Thus, inaddition to the aforementioned methodological factors that likely influence therelation between SES and academic achievement, several student characteristicsalso are likely to influence that relation.
Grade Level
The effect of social and economic circumstances on academic achievement mayvary by students’ grade level (Duncan, Brooks-Gunn, & Klebenov, 1994; Lerner,1991). However, the results from prior studies about the effect of grade or age on therelation between SES and academic achievement are mixed. On the one hand, Cole-man et al.’s (1966) study and White’s (1982) review showed that as students becomeolder, the correlation between SES and school achievement diminishes. White pro-vided two possible explanations for the diminishing SES effect on academic achieve-ment. First, schools provide equalizing experiences, and thus the longer students stayin the schooling process, the more the impact of family SES on student achievementis diminished. Second, more students from lower-SES backgrounds drop out ofschool, thus reducing the magnitude of the correlation. On the other hand, resultsfrom longitudinal studies have contradicted White’s results, by demonstrating thatthe gap between low- and high-SES students is most likely to remain the same as stu-dents get older (Duncan et al., 1994; Walker, Greenwood, Hart, & Carta, 1994), ifnot widen (Pungello, Kupersmidt, Burchinal, & Patterson, 1996).
Minority Status
Racial and cultural background continues to be a critical factor in academicachievement in the United States. Recent surveys conducted by the National Cen-ter for Education Statistics (NCES) indicated that, on average, minority studentslagged behind their White peers in terms of academic achievement (U.S. Depart-ment of Education, 2000). A number of factors have been suggested to explain thelower academic achievement of minority students, but the research indicates threemain factors: Minorities are more likely to live in low-income households or in sin-gle parent families; their parents are likely to have less education; and they oftenattend under-funded schools. All of these factors are components of SES andlinked to academic achievement (National Commission on Children, 1991).
School Location
The location of schools is closely related to the social and economic conditionsof students. A narrative review of research on school location (U.S. Department of
3179-04_Sirin.qxd 9/2/05 2:07 PM Page 420

Socioeconomic Status and Academic Achievement
421
Education, 1996) showed that even after accounting for family SES, there appearto be a number of significant differences between urban, rural, and suburbanschools. Data from the National Assessment of Educational Progress, for example,indicated that the achievement of children in affluent suburban schools was signif-icantly and consistently higher than that of children in “disadvantaged” urbanschools (U.S. Department of Education, 2000).
In summary, the relation between SES and academic achievement was thefocus of much empirical investigation in several areas of education research inthe 1990s. Recent research employed more advanced procedures to best exam-ine the relation between SES and academic achievement. The present meta-analytic review was designed to assess the magnitude of the relation betweenSES and academic achievement in this literature. Further, it was designed toexamine how the SES–achievement relation is moderated by (a) methodologicalcharacteristics, such as the type of SES measure, the source of SES data, and theunit of analysis; and (b) student characteristics, such as grade level, minoritystatus, and school location. Finally, it was designed to determine if there has beenany change in the correlation between SES and achievement since White’s 1982study.
MethodsCriteria for Including Studies
To be included in this review, a study had to do the following:
1. Apply a measure of SES and academic achievement. 2. Report quantitative data in sufficient statistical detail for calculation of
correlations between SES and academic achievement. 3. Include in its sample students from grades kindergarten through 12.4. Be published in a professional journal between 1990 and 2000.5. Include in its sample students in the United States.
Identification of StudiesSeveral computer searches and manual searches were employed to gather the
best possible pool of studies to represent the large number of existing studies onSES and academic achievement. The computerized search was conducted usingthe ERIC (Education Resources Information Center), PsycINFO, and Sociolog-ical Abstracts reference databases. For SES, the search terms socioeconomicstatus, socio-economic status, social class, social status, income, disadvantaged,and poverty were used. For academic achievement the terms achievement,success, and performance were used. The search function was created by usingtwo Boolean operators: “OR” was used within the SES set and the academicachievement set of search terms, and “AND” was used between the two sets.Because the majority of studies used SES as a secondary or control variable and,therefore, the computerized databases did not always index them by using oneof the above search terms as a keyword, the search was performed by using the“anywhere” function, not the “keyword” function. All databases were searchedfor the period 1990 to 2000 (on November 24, 2001). The search yielded 1,338PsycINFO documents, 953 ERIC documents, and 426 Sociological Abstracts
3179-04_Sirin.qxd 9/2/05 2:07 PM Page 421

Sirin
422
documents. After double entries were eliminated, there remained 2,014 uniquedocuments.
Next, the Social Science Citation Index (SSCI) was searched for the studies thatcited either Coleman et al.’s (1966) or White’s (1982) review, or both, becauseboth of those publications have been highly cited in the literature on SES and aca-demic achievement. Through this process, an additional 170 articles that refer-enced White’s study and 266 articles that referenced Coleman’s report wereidentified. In addition, I received 27 leads from previous narrative reviews andfrom studies that had been identified through the initial search. In total, the finalpool contained 2,477 unique documents.
After the initial examination of the abstracts of each study, I applied the inclu-sion criteria to select 201 articles for further examination. I made the final deci-sions for inclusion after examining the full articles. Through this process, I selected58 published journal articles that satisfied the inclusion criteria.
Coding ProcedureA formal coding form was developed for the current meta-analysis on the basis
of Stock et al.’s (1982) categories, which address both substantive and methodolog-ical characteristics: Report Identification, Setting, Subjects, Methodology, Treat-ment, Process, and Effect Size. To further refine the coding scheme, a subsample ofthe data (k = 10) was coded independently by two doctoral candidates. Rater agree-ment for the two coders was between .80 and 1.00 with a mean of 87%. The coderssubsequently met to compare their results and discuss any discrepancies betweentheir ratings until they reached an agreement upon a final score. The coding formwas further refined on the basis of the results from this initial coding procedure. Thefinal coding form included the following components:
1. The Identification section codes basic study identifiers, such as the year ofpublication and the names and disciplines of the authors.
2. The School Setting section describes the schools in terms of location fromwhich the data were gathered.
3. The Student Characteristics section codes demographic information aboutstudy participants including grade, age, gender, and race/ethnicity.
4. The Methodology section gathers information about the research methodol-ogy used in the study, including the design, statistical techniques, as well assampling procedures.
5. The SES and Academic Achievement section records data about SES and aca-demic achievement measures.
6. The Effect Size (ES) section codes the statistics that are needed to calculatean effect size, such as correlation coefficients, means, standard deviations, ttests, F ratios, chi-squares, and degrees of freedom on outcome measuresused in the study.
Interrater AgreementAll studies were coded by the author. A doctoral student who helped design the
coding schema coded an additional random sample of 10 studies. Interrater agree-ment levels for the six coding categories ranged from 89% for the methodologysection to 100% for the names of the coding form.
3179-04_Sirin.qxd 9/2/05 2:07 PM Page 422

423
Analytical Procedures
Calculating Average Effect Sizes The effect size (ES) used in this review was Pearson’s correlation coefficient r.
Because most results were reported as a correlation (k = 45), the raw correlationcoefficient was entered as the ES measure. There were 8 studies that did not orig-inally report correlations but provided enough information to calculate correlationsusing the formulas taken from Hedges and Olkin (1985), Rosenthal (1991), andWolf (1986) to convert the study statistic to r. Correlations oversestimate the pop-ulation effect size because they are bounded at –1 or 1. As the correlation coeffi-cients approach –1 or 1, the distribution becomes more skewed. To address thisproblem, the correlations were converted into Fisher’s Z score and weighted by theinverse of the variance to give greater weight to larger samples than smaller sam-ples (Lipsey & Wilson, 2001). The average ESs were then obtained through az-to-r transformation with confidence intervals to indicate the range within whichthe population mean was likely to fall in the observed data (Hedges & Olkin). Theconfidence interval for a mean ES is based on the standard error of the mean and acritical value from the z distribution (e.g., 1.96 for ! = .05).
Statistical Independence There are two main alternative choices for the unit of analysis in meta-analysis
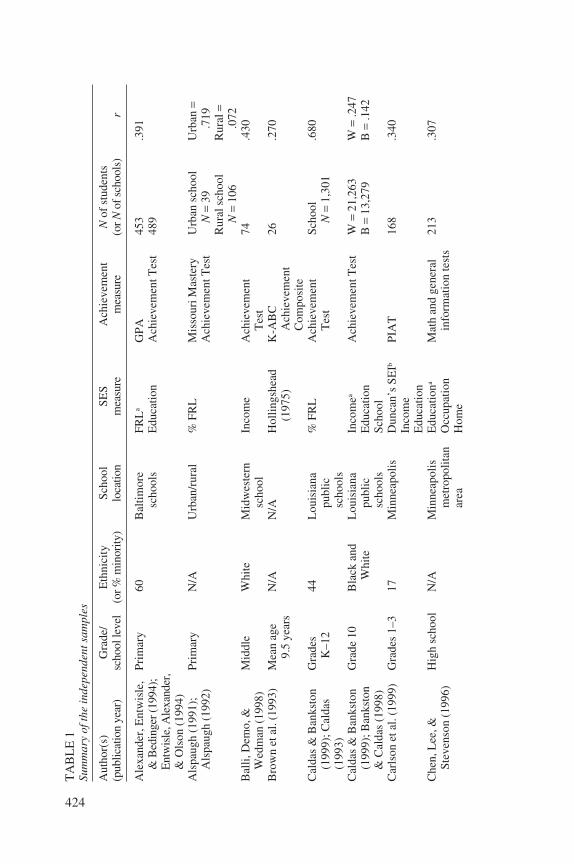
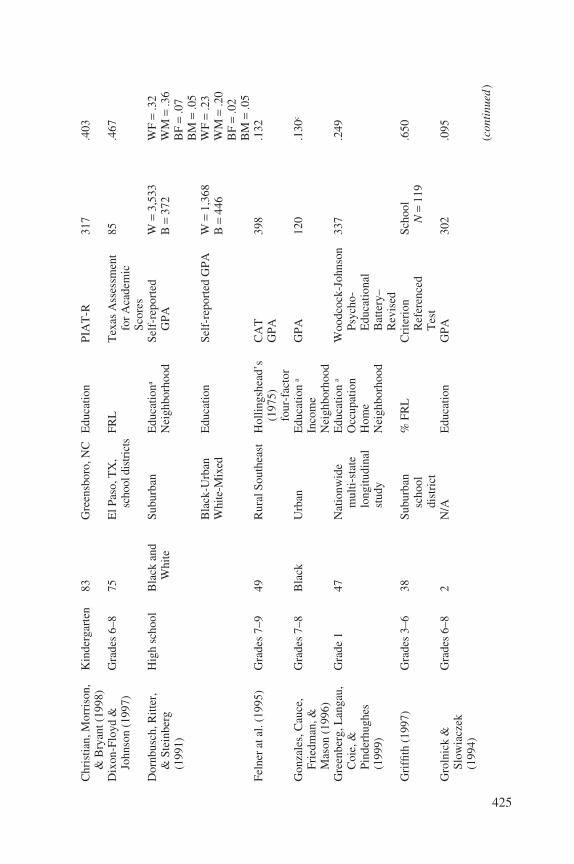
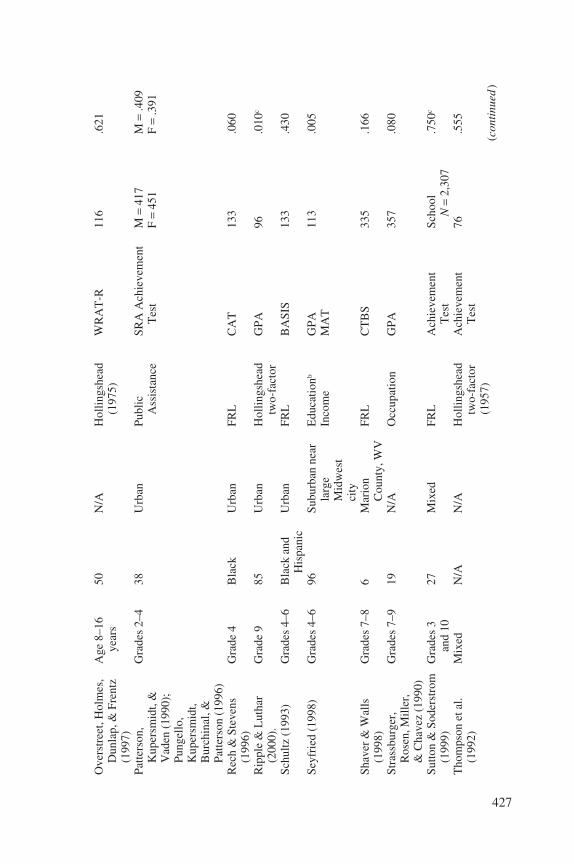
(Glass, McGaw, & Smith, 1981). The first alternative is to use each study as the unit ofanalysis. The second approach is to treat each correlation as the unit of analysis. Bothof these approaches have shortcomings. The former approach obscures legitimate dif-ferences across multiple correlations (i.e., the correlation for minority students versusthe correlation for White students), while the latter approach gives too much weight tothose studies that have multiple correlations (Lipsey & Wilson, 2001). A third alterna-tive, which was chosen for this study, is to use “a shifting unit of analysis” (Cooper,1998). This approach retains most of the information from each study while avoidingany violations of statistical independence. According to this procedure, the averageeffect size was calculated by using the first alternative; that is, one correlation wasselected from each independent sample. The same procedure was followed when thefocus of analysis was a student characteristic (e.g., minority status, grade level, orschool location). For example, if a study provided one correlation for White studentsand another for Black students, the two were included as independent correlations inthe same analysis. The only exception to this rule was the moderation tests for themethodological characteristic (e.g., the types of SES or academic achievement mea-sure). For example, if a study provided one correlation based on parental education andanother based on parental occupation, they were both entered only when the modera-tor analysis was for the type of SES measure. In both alternatives, there was only onecorrelation from each study for each construct. When studies provided multiple corre-lations for each subsample, or multiple correlations for each construct, they were aver-aged so that the sample on which they were based contributed only one correlation toany given analysis. Thus, in Tables 1 (page 424) and 2 (page 429), the correlation foreach study is the average correlation (r) for all constructs for that specific sample.
Fixed and Random Effects ModelsThere is an ongoing discussion about whether one should use a fixed or random
effects model in meta-analysis (Cooper & Hedges, 1994; Hedges & Vevea, 1998).
3179-04_Sirin.qxd 9/2/05 2:07 PM Page 423
424
TA
BL
E1
Sum
mar
yof
the
inde
pend
ents
ampl
es
Aut
hor(
s)G
rade
/E
thni
city
Scho
olSE
SA
chie
vem
ent
Nof
stud
ents
(pub
licat
ion
year
)sc
hool
leve
l(o
r%m
inor
ity)
loca
tion
mea
sure
mea
sure
(orN
ofsc
hool
s)r
Ale
xand
er,E
ntw
isle
,Pr
imar
y60
Bal
timor
eFR
La
GPA
453
.391
&B
edin
ger(
1994
);sc
hool
sE
duca
tion
Ach
ieve
men
tTes
t48
9E
ntw
isle
,Ale
xand
er,
&O
lson
(199
4)A
lspa
ugh
(199
1);
Prim
ary
N/A
Urb
an/r
ural
%FR
LM
isso
uriM
aste
ryU
rban
scho
olU
rban
=A
lspa
ugh
(199
2)A
chie
vem
entT
est
N=
39.7
19R
ural
scho
olR
ural
=N
=10
6.0
72B
alli,
Dem
o,&
Mid
dle
Whi
teM
idw
este
rnIn
com
eA
chie
vem
ent
74.4
30W
edm
an(1
998)
scho
olT
est
Bro
wn
etal
.(19
93)
Mea
nag
eN
/AN
/AH
ollin
gshe
adK
-AB
C26
.270
9.5
year
s(1
975)
Ach
ieve
men
tC
ompo
site
Cal
das
&B
anks
ton
Gra
des
44L
ouis
iana
%FR
LA
chie
vem
ent
Scho
ol.6
80(1
999)
;Cal
das
K–1
2pu
blic
Tes
tN
=1,
301
(199
3)sc
hool
sC
alda
s&
Ban
ksto
nG
rade
10B
lack
and
Lou
isia
naIn
com
eaA
chie
vem
entT
est
W=
21,2
63W
=.2
47(1
999)
;Ban
ksto
nW
hite
publ
icE
duca
tion
B=
13,2
79B
=.1
42&
Cal
das
(199
8)sc
hool
sSc
hool
Car
lson
etal
.(19
99)
Gra
des
1–3
17M
inne
apol
isD
unca
n’s
SEIb
PIA
T16
8.3
40In
com
eE
duca
tion
Che
n,L
ee,&
Hig
hsc
hool
N/A
Min
neap
olis
Edu
catio
naM
ath
and
gene
ral
213
.307
Stev
enso
n(1
996)
met
ropo
litan
Occ
upat
ion
info
rmat
ion
test
sar
eaH
ome
3179-04_Sirin.qxd 9/2/05 2:07 PM Page 424
425
Chr
istia
n,M
orri
son,
Kin
derg
arte
n83
Gre
ensb
oro,
NC
Edu
catio
nPI
AT
-R31
7.4
03&
Bry
ant(
1998
)D
ixon
-Flo
yd&
Gra
des
6–8
75E
lPas
o,T
X,
FRL
Tex
asA
sses
smen
t85
.467
John
son
(199
7)sc
hool
dist
ricts
forA
cade
mic
Scor
esD
ornb
usch
,Ritt
er,
Hig
hsc
hool
Bla
ckan
dSu
burb
anE
duca
tiona
Self
-rep
orte
dW
=3,
533
WF
=.3
2&
Stei
nber
gW
hite
Nei
ghbo
rhoo
dG
PAB
=37
2W
M=
.36
(199
1)B
F=
.07
BM
=.0
5B
lack
-Urb
anE
duca
tion
Self
-rep
orte
dG
PAW
=1,
368
WF
=.2
3W
hite
-Mix
edB
=44
6W
M=
.20
BF
=.0
2B
M=
.05
Feln
erat
al.(
1995
)G
rade
s7–
949
Rur
alSo
uthe
ast
Hol
lings
head
’sC
AT
398
.132
(197
5)G
PAfo
ur-f
acto
rG
onza
les,
Cau
ce,
Gra
des
7–8
Bla
ckU
rban
Edu
catio
na
GPA
120
.130
c
Frie
dman
,&In
com
eM
ason
(199
6)N
eigh
borh
ood
Gre
enbe
rg,L
anga
u,G
rade
147
Nat
ionw
ide
Edu
catio
na
Woo
dcoc
k-Jo
hnso
n33
7.2
49C
oie,
&m
ulti-
stat
eO
ccup
atio
nPs
ycho
-Pi
nder
hugh
eslo
ngitu
dina
lH
ome
Edu
catio
nal
(199
9)st
udy
Nei
ghbo
rhoo
dB
atte
ry–
Rev
ised
Gri
ffith
(199
7)G
rade
s3–
638
Subu
rban
%FR
LC
rite
rion
Scho
ol.6
50sc
hool
Ref
eren
ced
N=
119
dist
rict
Tes
tG
roln
ick
&G
rade
s6–
82
N/A
Edu
catio
nG
PA30
2.0
95Sl
owia
czek
(199
4)(c
ontin
ued
)
3179-04_Sirin.qxd 9/2/05 2:07 PM Page 425

426
TA
BL
E1
(Con
tinue
d)
Aut
hor(
s)G
rade
/E
thni
city
Scho
olSE
SA
chie
vem
ent
Nof
stud
ents
(pub
licat
ion
year
)sc
hool
leve
l(o
r%m
inor
ity)
loca
tion
mea
sure
mea
sure
(orN
ofsc
hool
s)r
Gul
lo&
Bur
ton
Kin
derg
arte
n21
Urb
anFR
LM
etro
polit
an1,
573
.124
(199
3)R
eadi
ness
Tes
t(N
urss
&M
cGau
vran
,19
74)
Jim
erso
n,G
rade
136
Urb
anD
unca
n’s
SEIb
Ach
ieve
men
t14
3.3
00E
gela
nd,
Edu
catio
nT
est
Srou
fe,&
Occ
upat
ion
Car
lson
(200
0)In
com
eJo
hnso
n&
Lin
dbla
dG
rade
633
Eas
tern
city
FRL
SRA
Ass
essm
ent
1,68
6.1
75(1
991)
Surv
eyK
enne
dy(1
992)
Prim
ary
Bla
ckan
dM
ixed
Edu
catio
nbA
chie
vem
ent
WM
=1,
328
WM
=sc
hool
Whi
teO
ccup
atio
nT
est
BM
=1,
028
.330
BM
=.1
60K
linge
le&
Gra
de4
19A
rkan
sas
%FR
LM
AT
-6Sc
hool
.54
War
rick
(199
0)sc
hool
N=
332
dist
rict
sL
amdi
n(1
996)
Gra
des
79B
altim
ore
%FR
L%
ofst
uden
tsSc
hool
.73
K–1
2sc
hool
sab
ove
med
ian
N=
97C
AT
scor
esM
cDer
mot
t(19
95)
Mix
ed31
Mix
edE
duca
tion
Ach
ieve
men
tTes
t1,
200
.315
Miy
amot
oet
al.
Gra
des
76H
awai
ian
Edu
catio
nG
PA69
6.1
80(2
000)
9–12
O’B
rien
,G
rade
1160
Lar
geIn
com
ePr
e-Sc
hola
stic
415
.150
Mar
tinez
-Pon
s,m
etro
polit
anA
ptitu
deT
est
&K
opal
a(1
999)
area
Otto
&A
tkin
son
Gra
de11
28N
orth
Car
olin
aE
duca
tiona
CA
T33
5.2
02(1
997)
rura
lcou
ntie
sO
ccup
atio
n
3179-04_Sirin.qxd 9/2/05 2:07 PM Page 426
427
Ove
rstr
eet,
Hol
mes
,A
ge8–
1650
N/A
Hol
lings
head
WR
AT
-R11
6.6
21D
unla
p,&
Fren
tzye
ars
(197
5)(1
997)
Patte
rson
,G
rade
s2–
438
Urb
anPu
blic
SRA
Ach
ieve
men
tM
=41
7M
=.4
09K
uper
smid
t,&
Ass
ista
nce
Tes
tF
=45
1F
=.3
91V
aden
(199
0);
Pung
ello
,K
uper
smid
t,B
urch
inal
,&Pa
tters
on(1
996)
Rec
h&
Stev
ens
Gra
de4
Bla
ckU
rban
FRL
CA
T13
3.0
60(1
996)
Rip
ple
&L
utha
rG
rade
985
Urb
anH
ollin
gshe
adG
PA96
.010
c
(200
0).
two-
fact
orSc
hultz
(199
3)G
rade
s4–
6B
lack
and
Urb
anFR
LB
ASI
S13
3.4
30H
ispa
nic
Seyf
ried
(199
8)G
rade
s4–
696
Subu
rban
near
Edu
catio
nbG
PA11
3.0
05la
rge
Inco
me
MA
TM
idw
est
city
Shav
er&
Wal
lsG
rade
s7–
86
Mar
ion
FRL
CT
BS
335
.166
(199
8)C
ount
y,W
VSt
rass
burg
er,
Gra
des
7–9
19N
/AO
ccup
atio
nG
PA35
7.0
80R
osen
,Mill
er,
&C
have
z(1
990)
Sutto
n&
Sode
rstr
omG
rade
s3
27M
ixed
FRL
Ach
ieve
men
tSc
hool
.750
c
(199
9)an
d10
Tes
tN
=2,
307
Tho
mps
onet
al.
Mix
edN
/AN
/AH
ollin
gshe
adA
chie
vem
ent
76.5
55(1
992)
two-
fact
orT
est
(195
7)( c
ontin
ued
)
3179-04_Sirin.qxd 9/2/05 2:07 PM Page 427

428
TA
BL
E1
(Con
tinue
d)
Aut
hor(
s)G
rade
/E
thni
city
Scho
olSE
SA
chie
vem
ent
Nof
stud
ents
(pub
licat
ion
year
)sc
hool
leve
l(o
r%m
inor
ity)
loca
tion
mea
sure
mea
sure
(orN
ofsc
hool
s)r
Tru
sty,
Wat
ts,&
Gra
des
4–6
Bla
ckR
ural
Edu
catio
nbSt
anfo
rdF
=26
5F
=.1
50H
ouse
(199
5)FR
LA
chie
vem
ent
M=
298
M=
.210
Tes
tT
rust
y,W
atts
,&G
rade
s7–
8B
lack
Rur
alE
duca
tionb
Stan
ford
F=
157
F=
.200
Lim
(199
6)FR
LA
chie
vem
ent
M=
129
M=
.260
Tes
tT
rust
y,Pe
ck,&
Gra
de4
55M
ixed
Edu
catio
nbSt
anfo
rd39
2.4
40M
athe
ws
(199
4)FR
LA
chie
vem
ent
Tes
tU
nnev
er,K
erck
hoff
,G
rade
11N
/AV
irgi
nia’
s12
8N
eigh
borh
ood
Ach
ieve
men
tSc
hool
dist
rict
.540
&R
obin
son
scho
olSE
ST
est
N=
128
(200
0)di
stri
cts
Wal
ker,
Gre
enw
ood,
Prim
ary
48K
ansa
sci
tyE
duca
tiona
Ach
ieve
men
t29
.334
c
Har
t,&
Car
tasc
hool
area
.O
ccup
atio
nT
ests
(WR
AT
-R,
(199
4)In
com
eM
AT
,CT
BS)
Wat
kins
(199
7)G
rade
s2–
523
Mid
wes
tern
Edu
catio
nG
PA15
0.3
60ci
tyW
hite
,Rey
nold
s,M
ixed
N/A
Urb
anFR
LA
chie
vem
ent
15,0
45.1
54T
hom
as,&
Tes
tSc
hool
Scho
ol=
Gitz
laff
(199
3)N
=10
2.7
20
Not
e.r
=ef
fect
size
;N/A
=in
form
atio
nno
tava
ilabl
e;K
-AB
C=
Kau
fman
Ass
essm
entB
atte
ryfo
rC
hild
ren;
FRL
=fr
eeor
redu
ced-
pric
elu
nch;
W=
Whi
te;B
=B
lack
;SE
I=So
cioe
cono
mic
Inde
x;PI
AT
=Pe
abod
yIn
divi
dual
Ach
ieve
men
tTes
t;PI
AT
-R=
Peab
ody
Indi
vidu
alA
chie
vem
ent
Tes
t–R
evis
ed;F
=fe
mal
e;M
=m
ale;
CA
T=
Cal
ifor
nia
Ach
ieve
men
tTes
t;W
RA
T=
Wid
eR
ange
Ach
ieve
men
tTes
t;SR
A=
Scie
nce
Res
earc
hA
ssoc
iate
s;B
ASI
S=
Bas
icA
chie
vem
entS
kills
Indi
vidu
alSc
reen
er;W
RA
T-R
=W
ide
Ran
geA
chie
vem
entT
est–
Rev
ised
;MA
T=
Met
ropo
li-ta
nA
chie
vem
entT
est;
CT
BS
=C
ompr
ehen
sive
Tes
tofB
asic
Skill
s.a T
his
stud
yre
port
edin
depe
nden
tres
ults
perS
ES
com
pone
nt.b
Thi
sst
udy
com
bine
dth
ese
com
pone
nts
inits
SES
mea
sure
.c Onl
yth
efir
stw
ave
ofda
taw
ere
used
toca
lcul
ate
ES
from
this
long
itudi
nals
tudy
.
3179-04_Sirin.qxd 9/2/05 2:07 PM Page 428

429
TA
BL
E2
Sum
mar
yof
natio
nwid
est
udie
sin
clud
edin
the
met
a-an
alys
is
Gra
de/s
choo
lE
thni
city
(or%
Ach
ieve
men
tN
ame
ofsu
rvey
Publ
ishe
dda
taso
urce
leve
lm
inor
ity)
SES
mea
sure
mea
sure
sN
ofst
uden
tsr
Nat
iona
lEdu
catio
nal
Ken
nedy
(199
5)fo
rNE
LS
Gra
de8
Asi
anE
duca
tiona
GPA
AF
=74
1A
F=
.190
Long
itudi
nal
base
year
;Lev
ine
&A
mer
ican
Occ
upat
ion
AM
=78
5A
M=
.240
Stud
y:88
/90/
94Pa
inte
r(19
99)f
orIn
com
em
ultip
leSE
SB
lack
Edu
catio
naG
PAB
F=
1,53
8B
F=
.280
corr
elat
ions
;Roj
ewsk
i&O
ccup
atio
nB
M=
1,46
7B
M=
.230
Yan
g(1
997)
form
ultip
leIn
com
eac
hiev
emen
tcor
rela
tions
;H
ispa
nic
Edu
catio
naG
PAH
F=
1,53
8H
F=
.180
Sing
h&
Ozt
urk
(200
0)O
ccup
atio
nH
M=
1,63
0H
M=
.200
forN
EL
S:88
and
Inco
me
follo
w-u
psa
mpl
esW
hite
Edu
catio
naG
PAW
F=
8,16
6W
F=
.330
Occ
upat
ion
WM
=8,
151
WM
=.3
50In
com
eN
atio
nal
Ric
ciut
i(19
99);
Kin
derg
arte
nN
/AE
duca
tion
PIA
TW
=28
0W
=.2
15Lo
ngitu
dina
lD
ubow
&Ip
polit
o(C
ohor
t1)
Inco
me
B=
235
B=
.235
Stud
yof
Yout
h:(1
994)
H=
256
H=
.256
Chi
ldre
nof
Kin
derg
arte
nN
/AE
duca
tion
Ach
ieve
men
tW
=44
0W
=.1
65m
othe
rs19
86,
(Coh
ort2
)In
com
eT
est
B=
260
B=
.153
Coh
orts
I&II
H=
240
H=
.215
Long
itudi
nalS
tudy
Rey
nold
s&
Gra
de7
38%
Hom
eaN
EA
PM
ath
3,11
6.5
88of
Am
eric
anW
albe
rg(1
992a
)m
inor
ityE
duca
tion
Tes
tYo
uth:
Thr
ee-
Exp
ecta
tions
wav
es,p
anel
Gal
lagh
er(1
994)
Gra
de7
Edu
catio
nN
EA
P1,
166
.320
stud
y:fa
ll,19
87;
Scie
nce
spri
ng19
87;f
all
Tes
t19
88R
eyno
lds
&G
rade
s38
%E
duca
tiona
NE
AP
2,53
5b G
rade
10W
albe
rg(1
992b
)10
–11
min
ority
Dun
can’
sSc
ienc
e=
.535
SEI
Tes
tE
xpec
tatio
nsN
atio
nalT
rans
ition
Cha
n,R
amey
,K
inde
rgar
ten
43%
Edu
catio
ncA
chie
vem
ent
378
.225
Dem
onst
ratio
nR
amey
,&m
inor
ityIn
com
eT
est
Pro
ject
:Con
trol
Schm
itt(2
000)
sam
ple
Not
e.E
Sr=
effe
ctsi
zer;
A=
Asi
anA
mer
ican
;B=
Bla
ck;H
=H
ispa
nic
Am
eric
an;W
=W
hite
;F=
Fem
ale;
M=
Mal
e;PI
AT
=Pe
abod
yIn
divi
dual
Ach
ieve
men
tT
est;
NE
AP
=N
atio
nalE
duca
tiona
lAss
essm
ents
ofSt
uden
tPro
gres
s.aT
his
stud
yco
mbi
ned
mul
tiple
SES
com
pone
nts
inth
eSE
Sm
easu
re.b
Onl
yth
efir
stw
ave
ofda
taw
asus
edto
calc
ulat
eE
Sfr
omth
islo
ngitu
dina
lstu
dy.c
Thi
sst
udy
repo
rted
sepa
rate
resu
ltsfo
reac
hSE
Sco
mpo
nent
.
3179-04_Sirin.qxd 9/2/05 2:07 PM Page 429

Sirin
430
A fixed effects model allows for generalizations to the study sample, while the ran-dom effects model allows for generalizations to a larger population. For the pres-ent review, both fixed and random methods results are provided for the main effectsize analysis. For the moderator analyses, fixed methods were chosen to makeinferences only about the studies reviewed in this meta-analysis.
Test of Homogeneity The variation among correlations was analyzed using Hedges’s Q test of homo-
geneity (Hedges & Olkin, 1985). This test uses the chi-square statistic, with thedegree of freedom of k " 1, where k is the number of correlations in the analysis.If the test reveals a nonsignificant result, then the correlations are homogenous andthe average correlation can be said to represent the population correlation. If thetest reveals a significant result, that is, if the correlations are heterogeneous, thanfurther analyses should be carried out to determine the influence of moderator vari-ables on the relation between SES and academic achievement.
Test for Moderator Effects To test for the significance of the moderating factors, the homogeneity analysis
outlined by Hedges and Olkin (1985) was followed. For this step of the analysis,fixed-effects analyses were used to fit homogeneous effect sizes into either analy-sis of variance (ANOVA) or a modified weighted least squares regression modelto examine whether the variability in effect sizes could be accounted for by mod-erator variables. The statistical procedure for this analysis involves partitioning theQ statistics into two proportions, Q-between (Qb), an index of the variabilitybetween the group means, and Q-within (Qw), an index of variability within thegroups. Therefore, a significant Q-between would indicate that the mean effectsizes across categories differ by more than sampling error. Regression analysis wasperformed only for the minority status moderation analysis. The rest of the analy-ses were performed using the weighted ANOVA procedure. To keep the resultssection consistent, when the moderator variables were investigated, I reported theQ-between statistics alone.
Publication BiasIt is well documented in meta-analysis literature that there is a publication bias
against the null hypothesis (Lipsey & Wilson, 2001; Rosenthal, 1979). We used twomethods to evaluate publication bias in the current review. First, publication bias inthis review would be minimal partly because the SES–achievement relation was notthe primary hypothesis for most studies, as the bias toward significant results is likelyto be contained within the primary hypothesis (Cooper, 1998). To empirically testthis assumption, we determined whether the SES–achievement relation was one ofthe main questions in each study by checking the title, abstract, introduction, researchquestions and/or hypotheses. Of the 58 articles included in the review, 24 articles hadthe SES–achievement relation as one of the main questions (i.e., central variable) ofthe study. The remaining 34 articles did not have the SES–achievement relation as acentral variable, but instead used it as a control variable. To examine the possibilityof bias, articles in which the SES achievement relation was a main question weretreated as the central group, and articles in which the relation was a control variablewere treated as a control group. On the basis of the student-level data (N = 64), there
Sirin
3179-04_Sirin.qxd 9/2/05 2:07 PM Page 430
Socioeconomic Status and Academic Achievement
431
were 21 independent samples using SES–achievement relation as a main hypothesisand 43 independent samples using the SES–achievement relation as a controlvariable. The results showed that the central group effect size (.28) was slightlyhigher than the control group effect size (.27). This difference, however, was notstatistically significant, Q(1, 63) = .13, p = .72.
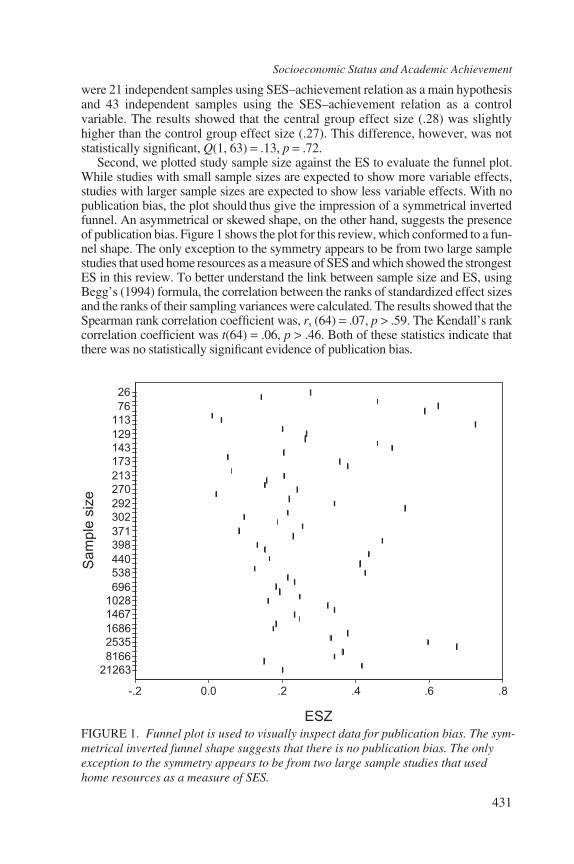
Second, we plotted study sample size against the ES to evaluate the funnel plot.While studies with small sample sizes are expected to show more variable effects,studies with larger sample sizes are expected to show less variable effects. With nopublication bias, the plot should thus give the impression of a symmetrical invertedfunnel. An asymmetrical or skewed shape, on the other hand, suggests the presenceof publication bias. Figure 1 shows the plot for this review, which conformed to a fun-nel shape. The only exception to the symmetry appears to be from two large samplestudies that used home resources as a measure of SES and which showed the strongestES in this review. To better understand the link between sample size and ES, usingBegg’s (1994) formula, the correlation between the ranks of standardized effect sizesand the ranks of their sampling variances were calculated. The results showed that theSpearman rank correlation coefficient was, rs (64) = .07, p > .59. The Kendall’s rankcorrelation coefficient was t(64) = .06, p > .46. Both of these statistics indicate thatthere was no statistically significant evidence of publication bias.
Samplesize
26761131291431732132702923023713984405386961028146716862535816621263ESZ .8.6.4.20.0-.2
FIGURE 1. Funnel plot is used to visually inspect data for publication bias. The sym-metrical inverted funnel shape suggests that there is no publication bias. The onlyexception to the symmetry appears to be from two large sample studies that usedhome resources as a measure of SES.
3179-04_Sirin.qxd 9/2/05 2:07 PM Page 431

432
ResultsThe results are presented in three subsections. First, to address the first ques-
tion, the magnitude of the relation between SES and academic achievement, wereported general findings of the review. To address the second question, testing forthe effects of methodological and student characteristics, we reported the resultsof the moderator tests. Finally, to compare our findings with that of White’s (1982)review, we reported results from another set of analyses that was conducted usingWhite’s procedures.
General Characteristics of the Studies
Table 1 contains information about the studies used in this analysis and the vari-ables for which they were coded. There were 75 independent samples from 58 pub-lished journal articles. Summary of nationwide studies, including data from theNational Educational Longitudinal Study, the National Longitudinal Study ofYouth, and the Longitudinal Study of American Youth are presented in Table 2.Of 75 samples, 64 used students as the unit of analysis, while 11 used aggregatedunits of analyses (i.e., schools or school districts). The total student-level dataincluded 101,157 individual students. The sample sizes for this group ranged from26 to 21,263, with a mean of 1,580.58 (SD = 3,726.32) and a median of 367.5. Theaggregated level data included 6,871 schools and 128 school districts.
Although the publication years of the studies were limited to the period of1990–2000, the actual year of data collection varied from 1982 to 2000.The datacollection year was reported in most of the articles (k = 36). The year 1990 had thelargest number of studies (k = 7) followed by 1988 and 1992 with 6 studies each.A weighted regression analysis revealed no statistically significant associationbetween publication year and the effect sizes, # = ".03, n.s.
The Effect Size (r)
Most studies had multiple indicators of the variables of interest. As a result,there were 207 correlations that could be coded. Overall, correlations ranged from.005 to .77, with a mean of .29 (SD = .19) and a median of .24.
For the samples with the student-level data, the average ES for the fixed effectsmodel was .28 with a 95% confidence interval of .28 to .29, and it was significantlydifferent from zero (z = 91.75, p <.001). The average ES for the random effectsmodel was .27 with a 95% confidence interval of .23 to .30, and it was significantlydifferent from zero (z = 14.26, p < .001).
For the samples with the aggregated level data, however, the correlations rangedfrom .11 to .85, with a mean of .60 (SD = .22). The weighted ES ranged from .11 to1.25. The average ES for the fixed effects model was .67 with a 95% confidence inter-val of .66 to .67, and it was significantly different from zero (z = 147.56, p < .001).The average ES for the random effects model was .64 with a 95% confidence inter-val of .57 to .70, and it was significantly different from zero (z = 13.27, p < .001).
To avoid committing the ecological fallacy, only studies with student-level datawere investigated for the remainder of data analysis. The Q test of homogeneitywas significant, indicating that the correlations were heterogeneous and other fac-tors beyond sampling error may be involved in the explanation of the differencesacross the studies Q(1, 64) = 1,844.95, p < .001. The possible factors leading to
3179-04_Sirin.qxd 9/2/05 2:07 PM Page 432

Socioeconomic Status and Academic Achievement
433
differences across the correlations will be the focus of the rest of the results sec-tion. The results of the Q statistic along with the mean ES and the variation aroundthe mean ES value that encompasses the 95% confidence interval for the differentlevels of each moderator variable are presented in Tables 3 and 4.
The Methodological Moderators
There were 102 unique correlations that provided information about one ormore components of SES. Table 3 presents the results of the methodological mod-erator analyses. The average ES for this distribution (k = 102) was .31. This ES issignificantly different from zero (z = 144.12, p < .001). The test for homogeneitywas significant, indicating that the correlations in this set were not estimating thesame underlying population value, and therefore it is appropriate to look for pos-sible moderators, Q(1, 102) = 2,068.36, p < .001. The number of SES componentsin each study, the type of SES components, and the source of SES data were con-sidered as methodological moderators.
TABLE 3Methodological characteristics moderators of the relationship between SES and academic achievement
Q- Mean "95% +95% Moderator Categories k between ES CI CI
Type of SES 79 587.14* .32 .32 .33components
Education 30 .30 .30 .31Occupation 15 .28 .26 .29Income 14 .29 .27 .31Free or reduced- 10 .33 .32 .34
price lunch Neighborhood 6 .25 .22 .28Home 4 .51 .49 .53
SES range 102 238.65* .32 .32 .33restriction
No restriction 78 .35 .35 .363 to 7 SES groups 15 .28 .28 .292 SES groups only 9 .24 .22 .27
SES data source 62 775.55* .29 .28 .30Parents 31 .38 .37 .39Students 18 .19 .19 .20Secondary sources 13 .24 .21 .26
Achievement 167 884.21* .29 .28 .29measures
General 45 .22 .22 .23achievement
Verbal 58 .32 .32 .33Math 57 .35 .34 .36Science 7 .27 .27 .29
Note. k = number of effect sizes; ES = effect size; CI = confidence interval for the averagevalue of ES.
*p < .005.
3179-04_Sirin.qxd 9/2/05 2:07 PM Page 433
434
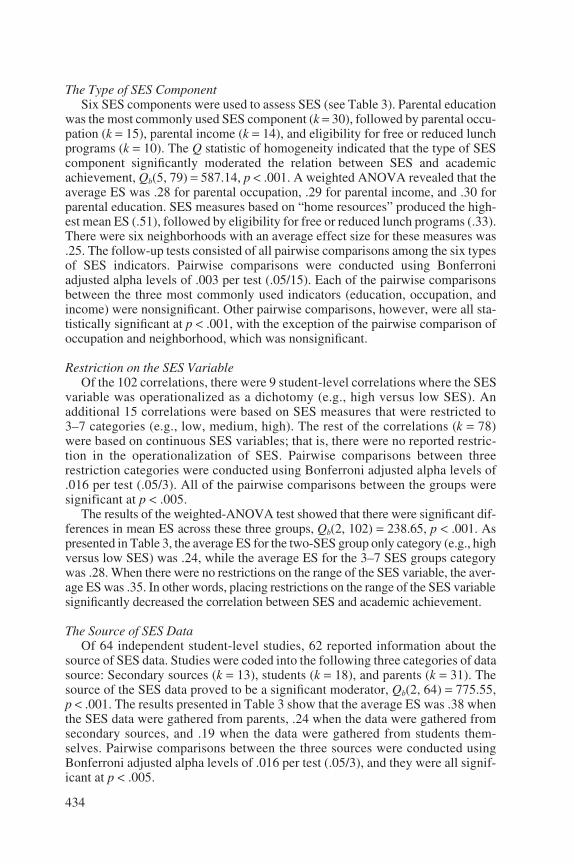
The Type of SES ComponentSix SES components were used to assess SES (see Table 3). Parental education
was the most commonly used SES component (k = 30), followed by parental occu-pation (k = 15), parental income (k = 14), and eligibility for free or reduced lunchprograms (k = 10). The Q statistic of homogeneity indicated that the type of SEScomponent significantly moderated the relation between SES and academicachievement, Qb(5, 79) = 587.14, p < .001. A weighted ANOVA revealed that theaverage ES was .28 for parental occupation, .29 for parental income, and .30 forparental education. SES measures based on “home resources” produced the high-est mean ES (.51), followed by eligibility for free or reduced lunch programs (.33).There were six neighborhoods with an average effect size for these measures was.25. The follow-up tests consisted of all pairwise comparisons among the six typesof SES indicators. Pairwise comparisons were conducted using Bonferroniadjusted alpha levels of .003 per test (.05/15). Each of the pairwise comparisonsbetween the three most commonly used indicators (education, occupation, andincome) were nonsignificant. Other pairwise comparisons, however, were all sta-tistically significant at p < .001, with the exception of the pairwise comparison ofoccupation and neighborhood, which was nonsignificant.
Restriction on the SES VariableOf the 102 correlations, there were 9 student-level correlations where the SES
variable was operationalized as a dichotomy (e.g., high versus low SES). Anadditional 15 correlations were based on SES measures that were restricted to3–7 categories (e.g., low, medium, high). The rest of the correlations (k = 78)were based on continuous SES variables; that is, there were no reported restric-tion in the operationalization of SES. Pairwise comparisons between threerestriction categories were conducted using Bonferroni adjusted alpha levels of.016 per test (.05/3). All of the pairwise comparisons between the groups weresignificant at p < .005.
The results of the weighted-ANOVA test showed that there were significant dif-ferences in mean ES across these three groups, Qb(2, 102) = 238.65, p < .001. Aspresented in Table 3, the average ES for the two-SES group only category (e.g., highversus low SES) was .24, while the average ES for the 3–7 SES groups categorywas .28. When there were no restrictions on the range of the SES variable, the aver-age ES was .35. In other words, placing restrictions on the range of the SES variablesignificantly decreased the correlation between SES and academic achievement.
The Source of SES DataOf 64 independent student-level studies, 62 reported information about the
source of SES data. Studies were coded into the following three categories of datasource: Secondary sources (k = 13), students (k = 18), and parents (k = 31). Thesource of the SES data proved to be a significant moderator, Qb(2, 64) = 775.55,p < .001. The results presented in Table 3 show that the average ES was .38 whenthe SES data were gathered from parents, .24 when the data were gathered fromsecondary sources, and .19 when the data were gathered from students them-selves. Pairwise comparisons between the three sources were conducted usingBonferroni adjusted alpha levels of .016 per test (.05/3), and they were all signif-icant at p < .005.
3179-04_Sirin.qxd 9/2/05 2:07 PM Page 434
435
Type of Academic Achievement Measure Moderator AnalysisTo estimate the effect of the choice of academic achievement measure on the
relation between SES and academic achievement, a separate database was con-structed using studies that reported correlations on single or multiple academicachievement variables. In total, there were 167 independent correlations with amean ES of .29. As presented in Table 3, there were four different measures usedto assess academic achievement: math achievement (k = 57), verbal achievement(k = 58), science achievement (k = 7), and general achievement (k = 45). The choice of academic achievement measure was a significant moderator of thecorrelation between SES and academic achievement, Qb(4, 167) = 884.21, p <.001. The mean ES was .22 for general achievement outcomes. When the stud-ies chose a single achievement indicator, the average ES was .27 for scienceachievement outcomes, .32 for verbal achievement outcomes, and .35 for mathachievement outcomes. Pairwise comparisons between four achievement mea-sures were conducted using Bonferroni adjusted alpha levels of .008 per test(.05/6). All of the pairwise comparisons between the measures were significantat p < .001.
Student Characteristics Moderators
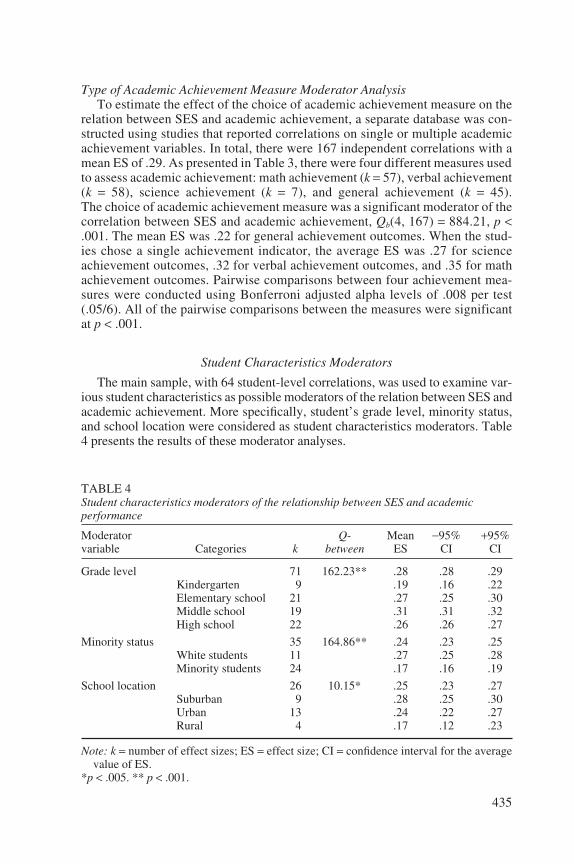
The main sample, with 64 student-level correlations, was used to examine var-ious student characteristics as possible moderators of the relation between SES andacademic achievement. More specifically, student’s grade level, minority status,and school location were considered as student characteristics moderators. Table4 presents the results of these moderator analyses.
TABLE 4Student characteristics moderators of the relationship between SES and academic performance
Moderator Q- Mean "95% +95% variable Categories k between ES CI CI
Grade level 71 162.23** .28 .28 .29Kindergarten 9 .19 .16 .22Elementary school 21 .27 .25 .30Middle school 19 .31 .31 .32High school 22 .26 .26 .27
Minority status 35 164.86** .24 .23 .25White students 11 .27 .25 .28Minority students 24 .17 .16 .19
School location 26 10.15* .25 .23 .27Suburban 9 .28 .25 .30Urban 13 .24 .22 .27Rural 4 .17 .12 .23
Note: k = number of effect sizes; ES = effect size; CI = confidence interval for the averagevalue of ES.
*p < .005. ** p < .001.
3179-04_Sirin.qxd 9/2/05 2:07 PM Page 435

436
Grade LevelThe sample used for this analysis had 71 correlations, which included the orig-
inal 64 student-level correlations and 7 additional correlations that came from thelongitudinal studies that provided multiple correlations for the same students overtime. Because some studies presented data from multiple grades without furtherspecification, the grade data were coded as Kindergarten (1), Elementary School(2), Middle School (3) and High School (4).
Student’s grade level was found to be a significant moderator of the correlationsbetween SES and academic achievement, Qb(3, 70) = 162.23, p < .001. As pre-sented in Table 4, the mean ES was .19 for the kindergarten students, .27 for theelementary school students, .31 for middle school students, and .26 for high schoolstudents. Thus, with the exception of the high school students, there seems to be atrend of increasing ES from kindergarten to middle school. Pairwise comparisonsbetween the four grade levels were conducted using Bonferroni adjusted alpha lev-els of .008 per test (.05/6). All of the pairwise comparisons between the four groupswere significant at p < .001, with the exception of the pairwise comparison of ele-mentary school and high school ES.
Minority Status Moderator AnalysesMore than half of the studies in the student-level data (k = 35) reported separate
correlations for White (k = 11) and minority students (k = 24). The Q-between sta-tistics suggested a significant difference between these two groups, Qb(1, 35) =164.86, p < 001. The mean ES for White student samples (.27) was significantlylarger than the mean ES for minority student samples (.17).
Because there were 21 additional studies that provided information about thenumber of minority students in their sample, an additional analysis was conductedby taking the ratio of minority students in each sample as a predictor of the corre-lation between SES and academic achievement. To evaluate the associationbetween the ratio of minority students and the magnitude of the correlation coeffi-cient between SES and academic achievement, a modified weighted least squaresregression was run. There were 56 independent correlations used in this analysis.The minority ratio was the predictor and the ES was the criterion variable. The pro-portion of minority students in the sample was a significant predictor of the corre-lation between SES and academic achievement, Q(1, 56) = 131.70, p < .001. Theincrease in the number of minorities in a study sample was negatively associatedwith SES–achievement correlations, # = ".30. In other words, the correlationbetween SES and academic achievement was minimized with the increase in theproportion of minorities in the study sample.
School Location Moderator AnalysesThere were only 26 studies (out of a possible 64) with data about the geograph-
ical location of the schools. These studies were categorized in one of the follow-ing three groups: suburban (k = 9), urban (k = 13), and rural (k = 4). The Q test ofhomogeneity provided evidence for a significant geographic location effect, Qb(2,26) = 11.62, p < .005. As presented in Table 4, the average ES for the suburbanschools was the largest (.28), and the average ES for the rural schools was thesmallest (.17). The average ES for urban schools was also .23. These results sug-gest that the relation between SES and academic achievement is stronger for stu-
3179-04_Sirin.qxd 9/2/05 2:07 PM Page 436

Socioeconomic Status and Academic Achievement
437
dents in suburban schools than for students in rural or urban schools. Pairwise com-parisons between three school locations were conducted using Bonferroni adjustedalpha levels of .016 per test (.05/3). The only significant pairwise comparison wasbetween suburban school and rural schools, p < .001.
Replicating White’s (1982) Meta-Analysis
One of the main goals of this meta-analysis was to replicate White’s (1982)meta-analysis using journal articles published from 1990 to 2000. However, itis difficult to compare the findings reported so far in this review with the find-ings from White’s review for three reasons. First, White’s calculation of themean ES was based on the average of the unweighted correlations. This proce-dure is likely to overestimate the results because it treats each correlationequally by not weighting them with appropriate sample size parameters (Lipsey& Wilson, 2001). Second, White’s review allowed for multiple correlationsfrom the same sample to be used in the data analysis as independent correla-tions. The problem with this approach is that it violates the principle that therewould be only one unique correlation from one unique sample According toWhite’s procedure, for example, one study would have 5 correlations andanother study would have only 1 correlation, but for meta-analytic purposes, thefirst study would be represented with 5 ESs, whereas the second study wouldonly be represented with 1 ES. This approach, therefore, assigns disproportion-ate influence to studies that included multiple measures of SES and/or schoolachievement. Finally, the inclusion criteria were different between the tworeviews. For example, unlike the current review, White’s review accepted IQscores as a measure of achievement and did not limit its samples to U.S. stu-dents. For these reasons, to allow for a comparison between these two meta-analyses, a new meta-analysis was conducted using the same proceduresoutlined in White’s study for this section of the results.
Replication SampleFollowing sampling procedure in White’s (1982) review, the comparison sam-
ple included 207 correlations. This number is comparable to the 219 correlationsin White’s review. The two reviews were also comparable in terms of the numberof journal articles. The current review was based on 58 journal articles publishedbetween 1990 and 2000, and White’s review was based on 59 journal articles pub-lished between 1918 and 1975.
The Average Correlation The following are results of the current meta-analysis and of White’s (1982)
meta-analysis based on journal articles from the two year spans:
Present review (1990–2000): M = .299, SD = .169, k = 207White’s review (1918–1975): M = .343, SD = .204, k = 219
The average correlation in the present review was .299, as compared with White’saverage correlation of .343. Although it is not possible to provide statistically sig-nificant evidence for the change over time, it is safe to suggest that the magnitudeof the relation between SES and school achievement is not as strong in the presentreview as it was in White’s review.
3179-04_Sirin.qxd 9/2/05 2:07 PM Page 437

Sirin
438
Comparisons across the two meta-analyses also showed that for both studies,parental education was the most frequently used measure of SES, but parentalincome and parental occupation also continued to be commonly used as a singlemeasure of SES. Among these traditional three components of SES, income wasthe strongest correlate in both meta-analyses.
DiscussionThe general goals of this study were to (a) determine the extent to which a sig-
nificant relation exists between SES and academic achievement based on researchpublished between 1990 and 2000; (b) assess the influence of several moderatingfactors in this relation; and (c) estimate whether this relation has changed in com-parison with the findings from White’s (1982) study.
What Is the Relation Between SES and Academic Achievement?
Using Cohen’s (1977) guidelines, the overall ES of the present study reflects amedium level of association between SES and academic achievement at the stu-dent level and a large degree of association at the school level. This interpretation,however, is limited because, as Cooper (1998) pointed out, one has to interpret aparticular ES in comparison with other findings in that particular area of research.The overall finding from this study compares quite favorably with results fromLipsey and Wilson’s (1993) review of more than 300 meta-analyses (r = .27, trans-formed to Cohen’s d = .56 for comparison purposes). Of all the factors examinedin the meta-analytic literature, family SES at the student level is one of thestrongest correlates of academic performance. At the school level, the correlationswere even stronger.
This review’s overall finding, therefore, suggests that parents’ location in thesocioeconomic structure has a strong impact on students’ academic achievement.Family SES sets the stage for students’ academic performance both by directly pro-viding resources at home and by indirectly providing the social capital that is nec-essary to succeed in school (Coleman, 1988). Family SES also helps to determinethe kind of school and classroom environment to which the student has access(Reynolds & Walberg, 1992a). Past research that compared low-SES schools withhigher-SES schools found several important differences in terms of instructionalarrangements, materials, teacher experience, and teacher-student ratio (Wenglin-sky, 1998). Finally, in addition to the quality of instruction, family SES also influ-ences the quality of the relationship between school personnel and parents(Watkins, 1997). The overall finding, therefore, not only reflects the effect ofresources at home but also may reflect the effect of social capital on academicachievement.
SES and Academic Achievement: Unraveling a Complex Relationship
Beyond the main findings, the results from this review also show that the mag-nitude of the relationship between SES and academic achievement is contingentupon several factors. More specifically, methodological characteristics, such as thetype of SES measure, and student characteristics, such as student’s grade, minor-ity status, and school location, moderated the magnitude of the relationshipbetween SES and academic achievement.
3179-04_Sirin.qxd 9/2/05 2:07 PM Page 438

439
Methodological Issues
The findings show that the studies used several conceptual frameworks to cap-ture students’ social and economic background. Overall, this meta-analysis pro-vides empirical evidence regarding how the type of SES measure affects thestrength of correlations found. This information suggests that researchers shouldconsider the following four factors when conceptualizing SES: (a) the unit ofanalysis for SES data; (b) the type of SES measure; (c) the range of the SES vari-able; and (d) the source of SES data.
Unit of Analysis for SES DataAs expected, when researchers chose an aggregated unit of analysis for their SES
variable, the average ES doubled in magnitude in comparison with would beobserved if the student were the unit of analysis. When aggregated SES data wereused to examine the SES–achievement relationship at the student level, the findingswere likely to be contaminated because of the ecological fallacy. In other words, itis problematic to make assumptions at the student level from aggregated data.
Type of SES MeasureThe type of SES measure changed the relationship between SES and academic
achievement. The average correlations between SES and academic achievementranged from .25, when SES was operationalized by using neighborhood character-istics as an indicator of family SES, to .47, when SES was operationalized by usinghome resources as an indicator of family SES. These two indicators, however, werebased on a limited number of studies. More commonly used SES components suchas education, occupation, income, and eligibility for school lunch programs pro-duced similar results.
Range of the SES Variable The findings suggest that the studies that used dichotomous SES variables—
that is, low as opposed to high SES—were less likely to produce stronger correla-tions than the studies that did not dichotomize the SES variable. This finding is notsurprising considering the statistical principle of correlations with artificiallydichotomized measures. Because both school achievement and SES are believedto be continuous in nature (i.e., variables that are normally distributed in the pop-ulation) placing constraints in the measurement process creates artificial cate-gories. As a statistical rule, when one of the variables in the correlation isartificially categorized, as was the case for many of the studies in this review,observed correlations will be lower than would be observed if a continuous mea-sure had been used (Hunter & Schmidt, 1990). In other words, when SES has anartificially restricted range, the correlation will be pushed closer to zero and thedegree of attenuation will increase as the skew of the dichotomy increases (Lipsey& Wilson, 2001). Thus, artificially restricting student’s SES significantly reducesthe magnitude of the interaction between SES and school achievement.
Source of SES Data When students provided the data about their family’s SES, the magnitude of the
relationship between SES and academic achievement was the smallest. When the
3179-04_Sirin.qxd 9/2/05 2:07 PM Page 439

Sirin
440
SES data were collected from parents, however, the results were likely to be muchhigher. As Entwisle and Astone (1994) suggest, information about students’ SESshould be collected from parents, as they are the authoritative source on their ownsocioeconomic status. One could, therefore, argue that students are likely to over-estimate their family background, which would artificially limit the variability ofthe SES measure by pushing it upward. It is also possible that they overestimatetheir family resources, because they might be reluctant to admit having limitedresources. In a recent study, Ensminger et al. (2000) examined the extent to whichadolescents accurately report their family’s SES. Both mothers and adolescentscompleted questionnaires that included measures of SES. Although the resultsshow relatively high agreement on SES measures between the two sources of infor-mants, the agreement level varied by age, family structure, and school perfor-mance. Older students, students from two-parent households, and higher-achievingstudents were more likely to report accurately than were younger students, studentsfrom single-parent households, and lower-achieving students.
Achievement MeasuresStudies reviewed in this analysis assessed students’ academic achievement
using different types of academic achievement measures. Single subject achieve-ment measures, such as verbal achievement, math achievement, and scienceachievement, yielded significantly larger correlations than general achievementmeasures (e.g., GPA or a composite achievement test). It is possible that globalachievement measures conceal differences between subject areas (math and ver-bal achievement, for example) and therefore obscure meaningful differencesbetween subject domains. For example, when the studies assessed academicachievement at the subject level, the correlations were strongest with math achieve-ment as compared with verbal and science achievement.
Student’s Grade Level
Unlike the results presented by White (1982) and Coleman et al. (1966), the cur-rent review suggests that the relationship between SES and academic achievementincreases across various levels of schooling, with the exception of the high schoolsamples. The overall trend was that the magnitude of the SES–academic achieve-ment relationship increased significantly by each school level, starting fromprimary school and continuing to middle school. For the high school samples,however, the average ES was similar to that of elementary school samples. Ingeneral, this finding is in agreement with the findings from longitudinal studies,which show that the gap between low- and high-SES students is most likely toremain the same, if not to widen. In addition, because academic achievementtypically is a cumulative process, in which early school achievement provides abasis for subsequent educational achievement in later years of schooling, it is pos-sible that those students who are doing poorly in elementary school because of theirfamily SES are more likely to drop out of school in later years and therefore arenot included in research samples in the later years of schooling.
This finding should be interpreted with caution because only longitudinalstudies can provide accurate estimates of true intra-individual change over time.Although the present review included some longitudinal studies (Carlson et al.,1999; Chen, Lee, & Stevenson, 1996; Gonzales, Cauce, Friedman, & Mason, 1996;
3179-04_Sirin.qxd 9/2/05 2:07 PM Page 440
Socioeconomic Status and Academic Achievement
441
Walker et al., 1994; and data from nationwide longitudinal studies such as NELSand NLSY), the majority of the studies included were one-time-only assessmentsof SES and academic achievement. Thus, because this review examined grade lev-els cross-sectionally, not longitudinally, the findings reported here do not reflectthe influence of SES over time on an individual basis.
The Role of Minority Status
Socioeconomic status was a stronger predictor of academic achievement forWhite students than for minority students. Additional evidence that minority sta-tus acts as a moderating factor came from the significant association between thepercentage of minority students in a sample and the magnitude of the correlationbetween SES and academic achievement. Stated differently, the more minority stu-dents in a sample, the weaker the association between SES and achievement.
The finding that family background variables such as parental education, income,and occupation are less predictive for minorities should be of concern not only forreasons of future research methodology, but also for its for social policy implica-tions. Although few in number, some studies suggest that neighborhood and schoolSES, not family SES, may exert a more powerful effect on academic achievementin minority communities, particularly in African American communities. For exam-ple, Gonzales et al. (1996) examined the combined effect of family and neighbor-hood influences on the school performance of African American high schoolstudents. They found that family SES variables were not as predictive of academicachievement as were neighborhood SES factors. Neighborhood factors were relatedto lower grades and also moderated several other factors such as parenting supportand control. In a large-scale examination of the same issue, Dornbusch, Ritter, andSteinberg (1991) compared the differential effects of parental SES and neighbor-hood SES in relation to academic achievement. They reported that the ability offamily SES to influence academic achievement is minimized when students, regard-less of their ethnic background, live in a census tract with a substantial proportionof minority residents. In other words, the weaker SES–achievement correlationamong minorities in general and African Americans in particular is not solelybecause of their minority status but partly because most of these families, and fewerWhites, live in neighborhoods with higher educational risk factors.
The Role of School Location
The relationship between family SES and academic achievement was the weak-est for urban schools as compared with non-urban schools. This result should beinterpreted in the context of economic segregation of people (Wilson, 1987, 1996),because the location of the school largely determines the financial resources avail-able for education. In a nationwide study of more than 17,000 school districts, Par-rish, Matsumoto, and Fowler (1995) found that higher neighborhood SES, asmeasured by the value of owner-occupied housing or by residents’ educationalattainment, is significantly related to greater school expenditures per student. Inaddition to this nationwide analysis, several statewide surveys showed the samephenomenon, in which differential resources were available for schools in differ-ent locations. For example, Unnever et al. (2000) examined Virginia data indicat-ing that resources are associated with a school district’s SES characteristics andthat resources were related to students’ academic achievement. Thus the role of
3179-04_Sirin.qxd 9/2/05 2:07 PM Page 441
Sirin
442
school location, combined with the finding that higher concentrations of minoritystudents in a sample decrease the correlation between SES and school perfor-mance, suggest that the influence of family SES on school performance is contex-tual. In other words, the impact of family SES varies for individuals depending onwhere they live and the cohort with whom they go to school.
Comparisons With White’s (1982) Review
The final question that this review addressed was whether the relationshipbetween SES and school achievement is any different in the 1990s from thatreported in White’s (1982) study. To provide a comparison across the two studies,I used the same meta-analytical procedures adopted by White. The findings for thisreplication study are, therefore, slightly different from the ones presented so farbecause White’s meta-analytical procedures were different from the ones adoptedby the present meta-analysis.
Overall, the magnitude of the SES–school achievement relationship is not asstrong as was reported in White’s (1982) meta-analysis. Studies published before1980 reported a mean correlation of .343, which is higher than what was found inthis meta-analysis (.299). This is the most comparable finding because both corre-lations were drawn from published journal articles. The decline is in line withWhite’s observation that there was a slight trend toward lower correlationsbetween SES and school achievement for the more recent studies in his sample.The weaker correlation between SES and school achievement in the current reviewmay be attributed to several factors, including changes in research on SES andschool achievement, and changes experienced in the larger social and economiccontext. As outlined before, unlike the earlier research, which conceptualized SESas a static phenomenon, recent research emphasizes a contextual developmentalapproach to both SES and school performance. As a result, there is an increasingemphasis on using more precise measurements of social and economic background(Entwisle & Astone, 1994). For example, traditional research measured the fatheror father figure’s social and economic characteristics, such as education and laborforce status, as the most salient indicators of SES, whereas current research gener-ally tries to gather information from both mothers and fathers. It is also possible thatthe weaker correlation in the current review, as compared with White’s (1982)review, may reflect social and overall policy changes over time. For example, theincreasing access to learning materials such as books, TV, and computers, as wellas the availability of compensatory education, may have helped to reduce the impactof SES on academic achievement in recent years. More important, unlike the ear-lier research that overlooked and understudied students from diverse ethnic back-grounds, there seems to be more emphasis on diverse students in recent decades(McLoyd, 1998). Likewise, the economic desegregation between urban and non-urban schools was not as pronounced as it currently is. Hence the correlationreported in this study is likely to be reduced partly because of the increasing num-ber of minority and urban students in published studies, as reported correlations forboth of these groups were significantly lower than for the rest of the student body.
Limitations of This Review
The results of this review should be interpreted with caution for several reasons.First, its focus is limited to studies published during a certain period: 1990–2000.
3179-04_Sirin.qxd 9/2/05 2:07 PM Page 442

Socioeconomic Status and Academic Achievement
443
This was the most recent data available on the topic when the review was con-ducted. Although this study failed to find statistically significant evidence of dif-ferences between data collected in the 1980s and in the 1990s, a more direct testof this assumption was not possible because of the partial data available in thisreview.
Second, although we found no statistically significant evidence for publicationbias in this review, in the absence of unpublished data the review was limited topublished journal articles. White’s (1982) meta-analysis shows that effect sizesfrom published studies were 17% larger than effect sizes from unpublished stud-ies. This overestimate is much smaller in comparison with other meta-analyseswhere effect sizes from published studies were 36% larger than effect sizes fromunpublished studies (Lipsey & Wilson, 1993). Nevertheless, this study did notempirically test the impact of publication types as a possible moderator factor;therefore, the results are likely to be overestimated and should be interpreted withcaution.
Third, the sample for this study was limited to students in the U.S. schoolingsystem. Therefore, it is not possible to draw conclusions about how SES and aca-demic achievement relate in the context of other countries. This would be animportant direction for future research because educational systems are an integralpart of every country’s unique social and economic system.
Fourth, although every effort was made to locate all relevant studies, there wasno way to be certain that the sample of this meta-analysis included all of the stud-ies that examined the relationship between SES and achievement that were pub-lished during the 1990s. We primarily used electronic databases (i.e., PsycINFO,ERIC, and Sociological Abstracs) and manually searched the Social Science Cita-tion Index for relevant studies. The only manual searches were of studies cited innarrative reviews. Thus it is likely that some relevant studies were not found.
Finally, each meta-analysis is limited by the quality of the research on which itrelies (Glass et al., 1981). For the purposes of this study, there was no effort toeliminate studies on the basis of quality. Although study quality was indirectlytested through several moderator variables that were geared to assess the studydesign (e.g., type of SES and academic achievement measures, unit of analysis,and SES data source), these variables were only proxy indicators of quality. Thislimitation, however, is not detrimental, as past research on the association betweenthe study quality and effect sizes found no significant correlation (Glass et al.,1981; Harris & Rosenthal, 1985).
Implications for Research
Despite these limitations, the results of this meta-analysis provide some practi-cal guidelines for education researchers. As the overall finding suggests,researchers must continue to assess student’s SES as part of their understanding offamily effects on academic performance. The decision about how to measure SES,however, is a complicated one. On the basis of the results from this meta-analysis,the following points may help researchers to better capture students’ social andeconomic background in education research.
First, the unit of analysis is of critical importance. The availability of school-and/or neighborhood-level SES data, through many state and nationwide datasets,increasingly puts researchers at risk of committing the ecological fallacy. Because
3179-04_Sirin.qxd 9/2/05 2:07 PM Page 443

Sirin
444
of the magnitude of the difference between the student level and the school/neighborhood levels of analysis, future research should consider using aggregatedata appropriately in understanding individual-level processes. For example mul-tilevel modeling techniques can now be used for combining individual-level datawith school- or aggregate-level data. This method can deal with the issue of theecological fallacy because it simultaneously estimates individual and school-leveleffects (Bryk & Raudenbush, 1992).
Second, socioeconomic status is a multi-dimensional construct, and differ-ent components yield different results. Of six major components of SES,researchers most often choose the three traditional ones—income, education, andoccupation—as the basis for their SES conceptualization. Researchers shouldmake an effort to use multiple components of SES in their operationalizationbecause, when only a single component is chosen, the results are more likely tooverestimate the effect of SES.
Third, the use of participation in school lunch programs as a measure of SES,though common, is conceptually problematic. The process of determining eligibil-ity is open to mistakes; and, more important, the effect that participation in a schoollunch program itself might have on students’ school performance is difficult to dif-ferentiate from the effect of SES. Furthermore, research shows that eligibility forfull or partial school lunch programs only weakly correlates with academicachievement as grade level rises, possibly because adolescents are less likely thanyounger children to file applications (McLoyd, 1998). Despite these limitations,eligibility for lunch programs is still one of the most commonly used SES measurein the current literature on academic achievement, partly because it is easier toobtain than school records and does not require having to gather data from studentsand parents. As was also pointed out by Hauser (1994), researchers should avoidusing school lunch eligibility as an SES indicator for students.
Fourth, the findings of this review suggest that only a small number of studiesconsidered neighborhood characteristics as part of their assessment of students’social and economic background. Research on neighborhood SES has generallyused census tract data to assess neighborhood SES structure. This approach has itslimitations because it may refer to many communities with different features, andit only provides a distal marker for community SES, which may not best reflect thecommunity SES itself. Despite these limitations, the census tract may providesome insight into the relationship between SES and academic achievement thatmay not be possible to delineate with family SES variables alone. In addition toneighborhood census tract data, future research should find new ways to incorpo-rate neighborhood characteristics into the operationalization of SES. There arepromising alternatives, such as various neighborhood risk measures (for examples,see Gonzales et al., 1996; Greenberg, Lengua, Coie, Pinderhughes, 1999). Thesealternatives may provide more accurate ways to capture the effects of family SESin relation to the overall socioeconomic well-being of the neighborhood where theylive and send their children to school.
Fifth, SES seems to have different meanings for students from different ethnicbackgrounds. One of the main findings of this review was that, for minorities, SESdid not seem to be as strongly related to academic achievement as it was forWhites. For White students, SES is an essential variable that should continue to beexamined; but for minorities, it is limited in its capacity to capture students’ social
3179-04_Sirin.qxd 9/2/05 2:07 PM Page 444

Socioeconomic Status and Academic Achievement
445
and economic background. Although this could be partly explained by the variancedifferences in two groups (that is, studies with minority samples are likely to haveless variance in SES variables than studies with White samples), when researchersinvestigate SES with minority students they should consider using other indicatorsof SES, such as home resources and accumulated wealth. As Krieger and Fee(1994) have demonstrated, although the median family income of White house-holds is 50% greater than that of Black households, the median wealth, meaningthe distribution of capital assets such as home and estate ownership, is about tentimes greater. Researchers should use home resources and/or accumulated wealthas part of their operationalization of SES or present their findings separately fordifferent ethnic groups.
Sixth, it is important to decide from whom the SES data should be collected. Asthe results show, studies that collect SES data from students yield much smallercorrelations with achievement than do studies that collect data from parents. If weassume that parents are the ultimate authority on their SES (Entwisle & Astone,1994), then it should be of concern to researchers that students’ reports of SES maynot be accurate. Future research should make an attempt to gather SES data fromparents rather than students.
Finally, the location of schools should be an integral part of research on stu-dents’ SES and academic achievement. The results of this review suggest that forurban students SES–achievement relationships were not as strong as they were forsuburban students. Thus, without consideration of the geographical location of theschool, the observed correlations between SES and academic achievement arelikely to confound the differences between rural, urban, and suburban schools.
Implications for Educational and Social Policy
The results of this review have important policy implications. Both White’s(1982) review and this review strongly suggest that the impact of SES on schoolachievement was much higher when the focus was on schools, not individual stu-dents. These results should not be surprising for those who are familiar with theschool funding system. In the United States, family SES is the most importantdeterminant of school financing, as nearly half of all public school funding is basedon property taxes within a school district (National Research Council, 1999).Although districts with limited local funds are compensated within a state, in mostcases this outside financial support fails to create financial equity between schooldistricts (Parrish et al., 1995). For example, in Illinois financial disparity in per-pupil expenditures ranged from $3,000 to $15,000 in 1995–1996 (National Con-ference of State Legislatures, 1998). Thus current school financing policies createa situation where students who come from lower-family-SES backgrounds arelikely to be in school districts that are at best financially inferior to schools in morewealthy districts, and at worst, in financial crisis.
As the main finding of this review shows, school success is greatly influenced bystudents’ family SES. This finding indicates that our society may be failing in one ofthe greatest commitments of every modern society, that is, the responsibility to pro-vide educational opportunities for each student regardless of social and economicbackground. Unfortunately, many poor students come to schools without the socialand economic benefits held by many middle- to high-SES students. At present, onein five children in the United States lives in poverty, which puts many of these stu-
3179-04_Sirin.qxd 9/2/05 2:07 PM Page 445

Sirin
446
dents at risk for poor school performance or failure (Dalaker & Proctor, 2000). Thus,to significantly reduce the gap in achievement between low-and high-SES students,policy decisions at the local, state, and federal levels must aim at leveling the play-ing field for students deemed to be at risk academically as a result of their family SES.
Furthermore, poverty in the 1990s has become more concentrated in inner-cityneighborhoods and among minorities (Wilson, 1996), two groups for whom, as thepresent review indicates, the influence of family SES on academic achievement issignificantly lower than it is for other student groups. Thus, even when the currentschool financing system achieves its goal of financial equity between poor andwealthy school districts, it does not necessarily achieve a comparable “ecologicalequity”—because students in poor and wealthy school districts do not enjoy compa-rable living circumstances outside school (Clune, 1994). In addition to differencesat the family-SES level, children who live in poor school districts, as compared withchildren who live in wealthy school districts, also have to deal with limited socialservices, more violence, homelessness, and illegal drug trafficking (Wilson, 1987,1996). Likewise, many poor urban and rural schools need more financial incentivesto attract and keep qualified teaching staff and thus need more funding than theircounterparts in suburban areas (Wenglinsky, 1998). To address these social andeducational inequalities, policymakers should focus on adequacy—that is, sufficientresources for optimal academic achievement—rather than equity as a primary edu-cation policy goal (Clune, 1994). Poor school districts have more than their equalshare of challenges to deal with, and consequently they need adequate financialresources that may be more than equal to those needed by wealthier schools.
As a result of current educational and social policies, students who are at riskbecause of family SES are more likely to end up in schools with limited financialresources. Despite these limitations, there have been many interventions that havesuccessfully improved the educational achievement of those who might otherwisefail in school because of their family background. For example, small school andclass size (Glass & Smith, 1989), early childhood education, federal programs suchas Title 1 and Head Start, after-school programs and summer school sessions(Entwisle & Alexander, 1994), and financially qualified school personnel (Wang etal., 1993), all have been found to be important factors in reducing the achievementgap between children of the “haves” and the “have-nots.” Future educational andsocial programs should provide more support for these and other innovative pro-grams that can lift the educational achievement of those who are at risk for schoolfailure because of family SES. Without such support, the current system is likely toproduce an intergenerational cycle of school failure because of family SES.
ConclusionsThis meta-analysis is the second review of literature relating to SES and school
achievement, the last having been conducted 20 years ago (White, 1982). SinceWhite’s review, there have been several changes both in the literature on theSES–achievement relationship and in meta-analytical procedures. The currentreview uses these advances in research methodology, provides an empirically validand conceptually rich statistical summary of the literature, and offers a criticalexamination of how several moderating factors influence the relationship betweenSES and academic achievement. The findings of this review will serve a practicaluse for education researchers and policymakers in their efforts to better assess the
3179-04_Sirin.qxd 9/2/05 2:07 PM Page 446

Socioeconomic Status and Academic Achievement
447
implications of family SES on educational processes and to provide equal educa-tional opportunities for all.
This meta-analysis also provides several areas where future research should fur-ther test the complex nature of SES–achievement relationships. As the overall find-ings suggest, researchers must assess student’s family background regardless oftheir main research focus. Although the ongoing trend in the study of school per-formance suggests that the social and economic context is key in understandingschool success, it is still a common practice to mention SES in the introduction anddiscussion sections of journal articles without actually incorporating it in the mea-surement model. Researchers should no longer limit themselves by discussing onlythe context but rather should actually measure and evaluate the social and eco-nomic context in relation to their special area of interest.
In addition to these general points, this meta-analysis also provides severalmethodological challenges for future research in education. For example, given thefinding that there is only a weak relationship between SES and academic achieve-ment among minority students, should we continue to use SES as an important con-textual indicator of school success for minority students? Or, given the finding thatthere is a discrepancy between the data collected from parents and others, shouldwe continue to ask students or school administrators to provide SES data? Theresults of this study can act as a springboard for research that addresses theseimportant questions.
NoteI would like to thank Lauren Rogers-Sirin, Jacqueline Lerner, Penny Hauser-Cram,
David Blustein, Albert E. Beaten, and four anonymous reviewers for their feedback onearlier versions of this article.
ReferencesBegg, C. B. (1994). Publication bias. In H. Cooper & L. V. Hedges (Eds.), Handbook
of research synthesis (pp. 399–409). New York: Russell Sage Foundation.Bollen, K., Glanville, J. A., & Stecklov, G. (2001). Socioeconomic status and class in
studies of fertility and health in developing countries. Annual Review of Sociology,27, 153–185.
Bornstein, M. C., & Bradley, R. H. (Eds.). (2003). Socioeconmic status, parenting, andchild development. Mahwah, NJ: Lawrence Erlbaum.
Bronfenbrenner, U., & Morris, P. A. (1998). The ecology of developmental processes.In W. Damon (Series Ed.) & R. M. Lerner (Vol. Ed.), Handbook of child psychol-ogy: Vol. 1. Theory (5th ed.). New York: Wiley.
Brooks-Gunn, J., Denner, J., & Klebanov, P. K. (1995). Families and neighborhoodsas contexts for education. In E. Flaxman & A. H. Passow (Eds.), Changing popula-tions changing schools: Ninety-fourth yearbook of the National Society for the Studyof Education, Part II (pp. 233–252). Chicago: National Society for the Study ofEducation.
Brooks-Gunn, J., & Duncan, G. J. (1997). The effects of poverty on children. The futureof children, 7(2), 55–71.
Brooks-Gunn, J., Duncan, G. J., & Aber, J. L. (Eds.). (1997). Neighborhood poverty:Context and consequences for children: Vol. 1. New York: Russell Sage FoundationPress.
Bryk, A. S., & Raudenbush, S. W. (1992). Hierarchical linear models. Newbury Park,CA: Sage.
3179-04_Sirin.qxd 9/2/05 2:07 PM Page 447

Sirin
448
Caldas, S. J., & Bankston, C. (1997). Effect of school population socioeconomic sta-tus on individual academic achievement. Journal of Educational Research, 90(5),269–277.
Clune, W. H. (1994). The shift from equity to adequacy in school finance. EducationalPolicy, 8(4), 376–394.
Cohen, J. (1977). Statistical power analysis for the behavioral sciences (rev. ed.). NewYork: Academic Press.
Coleman, J. S. (1988). Social capital in the creation of human capital. American Jour-nal of Sociology, 94, S95–S120.
Coleman, J. S., Campbell, E. Q., Hobson, C. J., McPartland, J., Mood, A. M., Wein-feld, F. D., & York, R. L. (1966). Equality of educational opportunity. Washington,DC: Government Printing Office.
Cooper, H. M. (1998). Synthesizing research: A guide for literature reviews (3rd ed.).Newbury Park, CA: Sage.
Cooper, H., M., & Hedges, L. V. (Eds.). (1994). Handbook of research synthesis. NewYork: Russell Sage Foundation.
Dalaker, J., & Proctor, B. D. (2000). U.S. Census Bureau, current population reports,Series P60-210: Poverty in the United States, 1999. Washington, DC: GovernmentPrinting Office.
Dika, S., & Singh, K. (2002). Applications of social capital in educational literature: Acritical synthesis. Review of Educational Research, 72(1) 31–60.
Duncan, G. J., & Brooks–Gunn, J. (1997). Income effects across the life span: Integra-tion and interpretation. In G. J. Duncan & J. Brooks–Gunn (Eds.) Consequences ofgrowing up poor (pp. 596–610). NY: Russell Sage Foundation Press.
Duncan, G., J. Brooks-Gunn, & P. Klebanov. (1994). Economic deprivation and earlychildhood development. Child Development 65(2), 296–318.
Duncan, O. D. (1961). A Socioeconomic index for all occupations. In A. J. Reiss, Jr.(Ed.), Occupations and Social Status (pp. 139–161). NY: Free Press.
Duncan, O. D., Featherman, D. L., & Duncan, B. (1972). Socio-economic backgroundand achievement. NY: Seminar Press.
Eccles, J. S., Lord, S., & Midgley, C. (1991). What are we doing to early adolescents?The impact of educational context on early adolescents. American Journal of Edu-cation, 99, 521–542.
Ensminger, M., Forrest, C. B., Riley, A.W., Kang, M., Green, B. F., Starfield, B., Ryan,S. (2000). The validity of measures of socioeconomic status of adolescents. Journalof Adolescent Research,15(3). 392–419.
Ensminger, M. E. & Fothergill, K. E. (2003). A Decade of measuring SES: What it tellsus and where to go from here. In Bornstein & Bradley (Eds.). Socioeconomic status,parenting, and child development (pp. 13–27), Mahwah, NJ: Lawrence ErlbaumAssociates.
Entwisle, D. R. & Astone, N. M. (1994). Some practical guidelines for measuringyouth’s race/ethnicity and socioeconomic status. Child Development, 65(6),1521–1540.
Glass, G. V, McGaw, B., & Smith, M. L. (1981). Meta-Analysis in Social Research.Beverly Hills, CA: Sage Publications.
Glass, G. V. & Smith, M. L. (1989). Meta-analysis of the relationship between classsize and achievement. Educational Evaluation and Policy Analysis, 1, 2–16.
Gottfried, A. (1985). Measures of socioeconomic status in child development research:Data and recommendations. Merrill-Palmer Quarterly, 31(1). 85–92.
Grissmer, D. W., Kirby, S. N. Berends, M., & Williamson, S. (1994). Student achieve-ment and the changing American family. Santa Monica, CA: RAND Corporation.
Harris, M. J., & Rosenthal, R. (1985). Mediation of interpersonal expectancy effects:31 meta-analyses. Psychological Bulletin, 97, 363–386.
3179-04_Sirin.qxd 9/2/05 2:07 PM Page 448

Socioeconomic Status and Academic Achievement
449
Hauser, R. M. (1994). Measuring socioeconomic status in studies of child development.Child Development, 65(6), 1541–1545.
Hauser, R. M. & Huang, M. H. (1997). Verbal ability and socioeconomic success: ATrend Analysis. Social Science Research, 26, 331–376.
Hauser, R. M. & Warren, J.R. (1997). Socioeconomic indexes for occupations: AReview, update, and critique. In A. E. Raftery (Ed.) Sociological Methodolog,(pp.177–298), Cambridge, MA: Basil Blackwell.
Haveman, R., & Wolfe, B. (1994). Succeeding generations: On the effects of invest-ment in children. NY: Russell Sage.
Hedges, L. V. & Olkin, I. (1985). Statistical methods for meta-analysis. NY: AcademicPress.
Hedges, L.V. & Vevea, J.L. (1998). Fixed and random-effects models in meta-analysis. Psychological Methods, 3, 486–504.
Hunter, J. & Schmidt, F. (1990). Methods of meta-analysis: Correcting error and biasin research findings. Beverly Hills CA: Sage.
Krieger, N. & Fee, E. (1994) Social class: the missing link in the U.S. health data. Inter-national Journal of Health Services, 24, 25–44.
Lerner, R. (1991). Changing organism-context relations as the basic process of devel-opment: A developmental contextual perspective. Developmental Psychology, 27,27–32.
Lipsey, M. W., & Wilson, D. B. (1993). The efficacy of psychological, educational,and behavioral treatment: Confirmation from meta-analysis. American Psychologist,48, 1181–1209.
Lipsey, M. W. & Wilson, D. B. (2001). Practical meta-analysis. Thousand Oaks, CA:Sage Publications.
McLoyd, V. (1998). Socioeconomic disadvantage and child development. AmericanPsychologist, 53, 185–204.
Mueller, C.W., & Parcel, T.L. (1981). Measures of socioeconomic status: Alternativesand recommendations. Child Development, 52, 13–30.
National Commission on Children (U. S.) (1991). Beyond rhetoric: A new Americanagenda for children and families. Washington, D.C.: National Commission on Children.
National Conference of State Legislatures (1998). The Education Partners Project.Educational adequacy: Building an adequate school finance system. Denver:Author.
National Research Council. (1999). Equity & adequacy in education finance: Issuesand perspectives. Washington, D.C.: National Research Council Committee on Edu-cation Finance.
Parrish, T. B., Matsumoto, C. S., & Fowler, W. J., Jr. (1995). Disparities in publicschool district spending 1989–90: A multi-variate, student-weighted analysis,adjusted for differences in geographic cost of living and student need. Washington,DC: National Center for Education Statistics, U.S. Department of Education.
Rosenthal, R. (1979). The “file drawer problem” and tolerance for null results. Psycho-logical Bulletin, 86, 638–641.
Rosenthal, R. (1991). Meta-analytic procedures for social research (Rev. ed). New-bury Park, CA: Sage.
Stock, W. A, Okun, M., Haring M., Miller W., Kenney, C., & Ceurvorst, R. (1982).Rigor in data synthesis: A case study of reliability in meta-analysis. Journal of Edu-cational Research, 11(6), 10–14.
U.S. Department of Education, National Center for Education Statistics. (1996). Loca-tion, Poverty and Schools. Washington, D.C.: Government Printing Office.
U.S. Department of Education, National Center for Education Statistics. (2000). TheCondition of Education 2000, NCES 2000-602. Washington, DC: Government Print-ing Office.
3179-04_Sirin.qxd 9/2/05 2:07 PM Page 449

Sirin
450
Wenglinsky, H. (1998). Finance equalization and within-school equity: The relation-ship between education spending and the social distribution of achievement. Educa-tional Evaluation and Policy Analysis, 20(4), 269–283.
White, K. (1982). The relation between socioeconomic status and academic achieve-ment. Psychological Bulletin, 91, 461–481.
Wilson, W. J. (1987). The hidden agenda. In W. J. Wilson (Ed.), The truly disadvan-taged: The inner city, the underclass and public policy (pp. 140–164). Chicago: Uni-versity of Chicago Press.
Wilson, W. J. (1996). When work disappears: The world of the new urban poor. NewYork: Alfred A. Knopf.
Wolf, F. M. (1986). Meta-analysis: Quantitative methods for research synthesis. Bev-erly Hills, CA: Sage.
The following sources were included in the meta-analysis:Alexander, K. L., Entwisle, D. R., & Bedinger, S. D. (1994). When expectations work:
Race and socioeconomic differences in school performance. Social PsychologyQuarterly, 57(4), 283–299.
Alspaugh, J. (1991). Out-of-school environmental factors and elementary-schoolachievement in mathematics and reading. Journal of Research and Development inEducation, 24(3), 53–55.
Alspaugh, J. W. (1992). Socioeconomic measures and achievement: Urban vs. rural.Rural Educator, 13(3), 2–7.
Balli, S. J., Demo, D. H., & Wedman, J. F. (1998). Family involvement with children’shomework: An intervention in the middle grades. Family Relations: Interdiscipli-nary Journal of Applied Family Studies, 47(2), 149–157.
Bankston, C. L., III, & Caldas, S. J. (1998). Family structure, schoolmates, and racialinequalities in school achievement. Journal of Marriage & the Family, 60(3),715–723.
Brown, R. T., Buchanan, I., Doepke, K., Eckman, J. R., & et al. (1993). Cognitive andacademic functioning in children with sickle-cell disease. Journal of Clinical ChildPsychology. 22(2), 207–218.
Caldas, S. J. (1993). Reexamination of input and process factor effects on public schoolachievement. Journal of Educational Research, 86(4), 206–214.
Caldas, S. J., & Bankston, C. (1998). The inequality of separation: Racial composi-tion of schools and academic achievement. Educational Administration Quarterly,34(4), 533–557.
Caldas, S. J., & Bankston, C. L., III. (1999). Multilevel examination of student, school,and district-level effects on academic achievement. Journal of EducationalResearch, 93(2), 91–100.
Carlson, E. A., Sroufe, L. A., Collins, W. A., Jimerson, S., Weinfield, N., Hen-nighausen, K., et al. (1999). Early environmental support and elementary schooladjustment as predictors of school adjustment in middle adolescence. Journal ofAdolescent Research, 14(1), 72–94.
Chan, D., Ramey, S., Ramey, C., & Schmitt, N. (2000). Modeling intraindividualchanges in children’s social skills at home and at school: A multivariate latentgrowth approach to understanding between-settings differences in children’s socialskill development. Multivariate Behavioral Research, 35(3), 365–396.
Chen, C., Lee, S. Y., & Stevenson, H. W. (1996). Long-term prediction of academicachievement of American, Chinese, and Japanese adolescents. Journal of Educa-tional Psychology, 88(4), 750–759.
Christian, K., Morrison, F. J., & Bryant, F. B. (1998). Predicting kindergarten academicskills: Interactions among child care, maternal education, and family literacy envi-ronments. Early Childhood Research Quarterly, 13(3), 501–521.
3179-04_Sirin.qxd 9/2/05 2:07 PM Page 450

Socioeconomic Status and Academic Achievement
451
Dixon-Floyd, I., & Johnson, S. W. (1997). Variables associated with assigning studentsto behavioral classrooms. Journal of Educational Research, 91(2), 123–126.
Dornbusch, S. M., Ritter, P. L., & Steinberg, L. (1991). Community influences on therelation of family statuses to adolescent school performance: Differences betweenAfrican Americans and non-Hispanic whites. American Journal of Education [Spe-cial issue: Development and education across adolescence], 99(4), 543–567.
Dubow, E. F., & Ippolito, M. F. (1994). Effects of poverty and quality of the home-environment on changes in the academic and behavioral adjustment of elementaryschool-age-children. Journal of Clinical Child Psychology, 23(4), 401–412.
Entwisle, D. R., Alexander, K. L., & Olson, L. S. (1994). The gender gap in math: Its pos-sible origins in neighborhood effects. American Sociological Review, 59, 822–838.
Felner, R. D., Brand, S., DuBois, D. L., Adan, A. M., Mulhall, P. F., & Evans, E. G.(1995). Socioeconomic disadvantage, proximal environmental experiences, andsocioemotional and academic adjustment in early adolescence: Investigation of amediated effects model. Child Development, 66, 774–792.
Gallagher, S. A. (1994). Middle school predictors of science achievement. Journal forResearch in Science Teaching, 31(7), 721–734.
Gonzales, N. A., Cauce, A. M., Friedman, R. J., & Mason, C. A. (1996). Family, peer,and neighborhood influences on academic achievement among African-Americanadolescents: One-year prospective effects. American Journal of Community Psy-chology, 24(3), 365–387.
Greenberg, M. T., Lengua, L. J., Coie, J. D., & Pinderhughes, E. E. (1999). Predictingdevelopmental outcomes at school re-entry using a multiple-risk model: Four Amer-ican communities. Developmental Psychology, 35, 403–417.
Griffith, J. (1997). Linkages of school structural and socioenvironmental characteris-tics to parental satisfaction with public education and student academic achievement.Journal of Applied Social Psychology, 27(2), 156–186.
Grolnick, W. S., & Slowiaczek, M. L. (1994). Parents’ involvement in children’sschooling: A multidimensional conceptualization and motivational model. ChildDevelopment, 65(1), 237–252.
Gullo, D. F., & Burton, C. B. (1993). The effects of social class, class size andprekindergarten experience on early school adjustment. Early Child Development &Care, 88, 43–51.
Jimerson, S. R., Egeland, B., Sroufe, L. A., & Carlson, B. (2000). A prospective lon-gitudinal study of high school dropouts: Examining multiple predictors across devel-opment. Journal of School Psychology, 38(6), 525–549.
Johnson, R. A., & Lindblad, A. H. (1991). Effect of mobility on academic performanceof sixth grade students. Perceptual & Motor Skills, 72(2), 547–552.
Kennedy, E. (1992). A multilevel study of elementary male black students and whitestudents. Journal of Educational Research, 86(2), 105–110.
Kennedy, E. (1995). Correlates of perceived popularity among peers: A study of raceand gender differences among middle school students. Journal of Negro Education,64(2), 186–195.
Klingele, W. E., & Warrick, B. K. (1990). Influence of cost and demographic factorson reading achievement. Journal of Educational Research, 83(5), 279–282.
Lamdin, D. J. (1996). Evidence of student attendance as an independent variable ineducation production functions. Journal of Educational Research, 89(3), 155–162.
Levine, D. I., & Painter, G. (1999). The NELS curve: Replicating the bell curve analy-ses with the National Education Longitudinal Study. Industrial Relations, 38(3),364–401.
McDermott, P. A. (1995). Sex, race, class, and other demographics as explanations forchildren’s ability and adjustment: A national appraisal. Journal of School Psychol-ogy, 33(1), 75–91.
3179-04_Sirin.qxd 9/2/05 2:07 PM Page 451

Sirin
452
Miyamoto, R. H., Hishinuma, E. S., Nishimura, S. T., Nahulu, L. B., Andrade, N. N.,& Goebert, D. A. (2000). Variation in self-esteem among adolescents in anAsian/Pacific-Islander sample. Personality & Individual Differences, 29(1), 13–25.
O’Brien, V., Martinez-Pons, M., & Kopala, M. (1999). Mathematics self-efficacy, eth-nic identity, gender, and career interests related to mathematics and science. Jour-nal of Educational Research, 92(4), 231–235.
Otto, L. B., & Atkinson, M. P. (1997). Parental involvement and adolescent develop-ment. Journal of Adolescent Research, 12(1), 68–89.
Overstreet, S., Holmes, C. S., Dunlap, W. P., & Frentz, J. (1997). Sociodemographicrisk factors to intellectual and academic functioning in children with diabetes. Intel-ligence, 24(3), 367–380.
Patterson, C. J., Kupersmidt, J. B., & Vaden, N. A. (1990). Income level, gender eth-nicity, and household composition as predictors of children’s school based compe-tence. Child Development, 61, 485–494.
Pungello, E. P., Kupersmidt, J. B., Burchinal, M. R., & Patterson, C. J. (1996). Envi-ronmental risk factors and children’s achievement from middle childhood to earlyadolescence. Developmental Psychology, 32(2), 755–767.
Rech, J. F., & Stevens, D. J. (1996). Variables related to mathematics achievementamong black students. Journal of Educational Research, 89(6), 346–350.
Reynolds, A. J., & Walberg, H. J. (1992a). A process model of mathematics achieve-ment and attitude. Journal for Research in Mathematics Education, 23(4), 306–328.
Reynolds, A. H. & Walberg, H. J. (1992b). A structural model of science achievement.Journal of Educational Psychology, 83(1), 97–107.
Ricciuti, H. N. (1999). Single parenthood and school readiness in white, black, and His-panic 6- and 7-year-olds. Journal of Family Psychology, 13(3), 450–465.
Ripple, C. H., & Luthar, S. S. (2000). Academic risk among inner-city adolescents: Therole of personal attributes. Journal of School Psychology, 38(3), 277–298.
Rojewski, J. W., & Yang, B. (1997). Longitudinal analysis of select influences on ado-lescents’ occupational aspirations. Journal of Vocational Behavior, 51(3), 375–410.
Schultz, G. F. (1993). Socioeconomic advantage and achievement motivation: Impor-tant mediators of academic performance in minority children in urban schools.Urban Review, 25(3), 221–232.
Seyfried, S. F. (1998). Academic achievement of African American preadolescents:The influence of teacher perceptions. American Journal of Community Psychology,26(3), 381–402.
Shaver, A. V., & Walls, R. T. (1998). Effect of parent involvement on student readingand mathematics achievement. Journal of Research & Development in Education,31(2), 90–97.
Singh, K., & Ozturk, M. (2000). Effect of part-time work on high school mathematicsand science course taking. Journal of Educational Research, 91(2), 67–74.
Strassburger, L. A., Rosen, L. A., Miller, C. D., & Chavez, E. L. (1990). Hispanic-Anglo differences in academic achievement: The relationship of self-esteem, locusof control and socioeconomic level with grade-point average in the USA. SchoolPsychology International, 11(2), 119–124.
Sutton, A., & Soderstrom, I. (1999). Predicting elementary and secondary schoolachievement with school-related and demographic factors. Journal of EducationalResearch, 92(6), 330–338.
Thompson, R. J., Gustafson, K. E., Meghdadpour, S., Harrell, E. S., Johndrow, D. A.,& Spock, A. (1992). The role of biomedical and psychosocial processes in the intel-lectual and academic functioning of children and adolescents with cystic fibrosis.Journal of Clinical Psychology, 48(1), 3–10.
Trusty, J., Peck, H. I., & Mathews, J. (1994). Achievement, socioeconomic status andself-concepts of fourth-grade students. Child Study Journal, 24(4), 281–298.
3179-04_Sirin.qxd 9/2/05 2:07 PM Page 452

Socioeconomic Status and Academic Achievement
453
Trusty, J., Watts, R. E., & House, G. (1996). Relationship between self-concept andachievement for African American preadolescents. Journal of Humanistic Educa-tion & Development, 35, 29–39.
Trusty, J., Watts, R. E., & Lim, M. G. (1995). Multidimensional self-concepts andachievement in African-American middle school students. Education, 114, 522–529.
Unnever, J. D., Kerckhoff, A. C., & Robinson, T. J. (2000). District variations in edu-cational resources and student outcomes. Economics of Education Review, 19(3),245–259.
Walker, D., Greenwood, C., Hart, B., & Carta, J. (1994). Prediction of school outcomesbased on early language production and socioeconomic factors. Child Development,65(2), 606–621.
Wang, M. C., Haertel, G. D., & Walberg, H. J. (1993). Toward a knowledge base forschool learning. Review of Educational Research, 63(3), 249–294.
Watkins, T. J. (1997). Teacher communications, child achievement, and parent traitsin parent involvement models. Journal of Educational Research, 91(1), 3–14.
White, S. B., Reynolds, P. D., Thomas, M. M., & Gitzlaff, N. J. (1993). Socioeconomicstatus and achievement revisited. Urban Education, 28(3), 328–343.
AuthorSELCUK R. SIRIN is an Assistant Professor in the Department of Applied Psychol-
ogy, New York University, East Building, 239 Greene Street #409, New York, NY10003; e-mail [email protected]. His research examines the impact of developmentalchallenges on the lives of minority and low-income children and ways to increaseprofessionals’ ability to address those challenges. His most recent research exam-ines developmental trajectories of Muslim-American youth.
3179-04_Sirin.qxd 9/2/05 2:07 PM Page 453