
SOCIO–ECONOMIC PROFILE AND CONSUMPTION PATTERN: CHANGING...
46
Chapter III Chapter III Chapter III Chapter III SOCIO–ECONOMIC PROFILE AND CONSUMPTION PATTERN: CHANGING TRENDS IN KERALA Contents 3.1 Socio-Economic Profile of Kerala 3.2 Change in Consumption Pattern from Food to Non-Food Items One of the best ways to judge the well-being of the people of a nation is to examine the standards of health attained by ordinary people. Healthy living condition and access to good quality health care for all citizens are not only basic human rights but also essential pre-requisites for social and economic development. Health is studied as a function of medical care, income, education, age, sex, race marital status, environmental pollution and also certain personal behaviour like smoking habits, exercise and the like (Rout and Nayak 2007). Kerala has received international acclaim for its conscious policy intervention for high levels of human development. A large scale migration that began in the early 1970’s raised the economy into a higher orbit of economic and social development. Kerala has been witnessing many changes in its social, economic and health scenario since the turn of 1990’s. Changing trends in the social outlook, economic status, consumption style etc show that the state is heading towards a different era. Consumerism and issues related to new lifestyle present a vivid picture of modern Kerala. A
Transcript of SOCIO–ECONOMIC PROFILE AND CONSUMPTION PATTERN: CHANGING...
Chapter IIIChapter IIIChapter IIIChapter III
SOCIO–ECONOMIC PROFILE AND CONSUMPTION PATTERN:
CHANGING TRENDS IN KERALA
Contents
3.1 Socio-Economic Profile of Kerala
3.2 Change in Consumption Pattern
from Food to Non-Food Items
One of the best ways to judge the well-being of the people of a
nation is to examine the standards of health attained by ordinary people.
Healthy living condition and access to good quality health care for all
citizens are not only basic human rights but also essential pre-requisites for
social and economic development. Health is studied as a function of
medical care, income, education, age, sex, race marital status,
environmental pollution and also certain personal behaviour like smoking
habits, exercise and the like (Rout and Nayak 2007).
Kerala has received international acclaim for its conscious policy
intervention for high levels of human development. A large scale migration
that began in the early 1970’s raised the economy into a higher orbit of
economic and social development. Kerala has been witnessing many
changes in its social, economic and health scenario since the turn of 1990’s.
Changing trends in the social outlook, economic status, consumption style
etc show that the state is heading towards a different era. Consumerism and
issues related to new lifestyle present a vivid picture of modern Kerala. A

CCCChapter IIhapter IIhapter IIhapter IIIIII –––– SocioSocioSocioSocio----Economic Profile and Consumption Economic Profile and Consumption Economic Profile and Consumption Economic Profile and Consumption Pattern: Changing Trends in KeralaPattern: Changing Trends in KeralaPattern: Changing Trends in KeralaPattern: Changing Trends in Kerala
LIFESTYLE DISEASES IN KERALA: AN ANALYSIS OF SOCIO-ECONOMIC STATUS, CONSUMPTION
PATTERN AND ADOLESCENT OBESITY IN KOTTAYAM DISTRICT 59
close look at the development journey of the state reveals certain interesting
as well as disturbing trends that need special attention.
3:1 Socio-Economic Profile of Kerala
Kerala stands unique in the era of globalisation. The socio-
economic scenario of Kerala constituted by net state domestic product, per
capita state income, demographic trends, structural changes, employment
scenario, family structure, food culture, leisure time activities etc have
changed drastically with the advent of globalisation. There is a leap in the
economic growth and development of Kerala since 1991.
The health status of a country is related to and determined by
numerous factors such as per capita income, way of life, marital status,
housing, sanitation, water supply, infrastructure, social organization,
structure of the economy, nutrition, education, health services provided by
the government, political and administrative setup, geography, climate and
religious belief (Rao, 2004).
There are five major factors which influenced the economic
progress of Kerala (Prakash, 2006). They are the impact of economic
reforms implemented by the government of Kerala, state policies and
public expenditure, considerable progress in population control, increase in
investment and migration and flow of remittances.
3.1.1 Net State Domestic Product (NSDP)
The analysis of performance of the state in terms of Net State
Domestic Product indicates that Kerala belongs to the group of seven states
with accelerated growth in the 90’s (Pushpangadan, 2006). This notable
feature of uptrend in its growth process is shown in Table 3.1.
CCCChapter IIhapter IIhapter IIhapter IIIIII –––– SocioSocioSocioSocio----Economic Profile and Consumption Economic Profile and Consumption Economic Profile and Consumption Economic Profile and Consumption Pattern: Changing Trends in KeralaPattern: Changing Trends in KeralaPattern: Changing Trends in KeralaPattern: Changing Trends in Kerala
LIFESTYLE DISEASES IN KERALA: AN ANALYSIS OF SOCIO-ECONOMIC STATUS, CONSUMPTION
PATTERN AND ADOLESCENT OBESITY IN KOTTAYAM DISTRICT 60
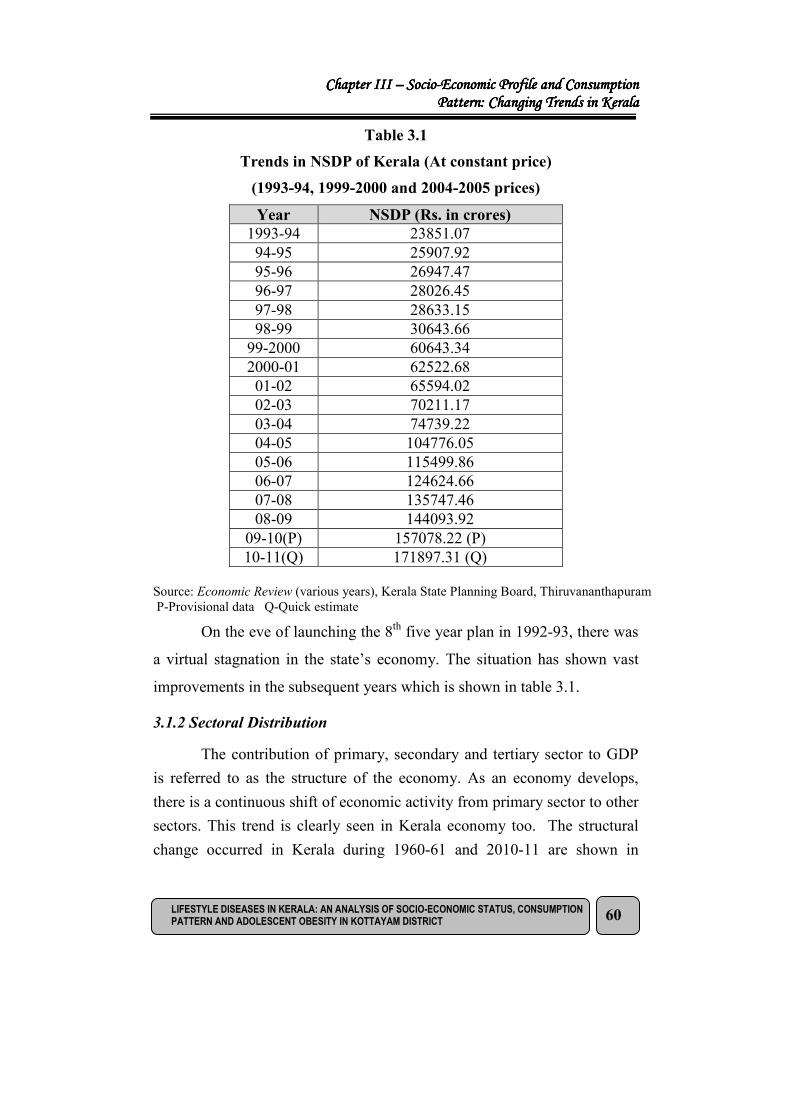
Table 3.1
Trends in NSDP of Kerala (At constant price)
(1993-94, 1999-2000 and 2004-2005 prices)
Year NSDP (Rs. in crores)
1993-94 23851.07
94-95 25907.92
95-96 26947.47
96-97 28026.45
97-98 28633.15
98-99 30643.66
99-2000 60643.34
2000-01 62522.68
01-02 65594.02
02-03 70211.17
03-04 74739.22
04-05 104776.05
05-06 115499.86
06-07 124624.66
07-08 135747.46
08-09 144093.92
09-10(P) 157078.22 (P)
10-11(Q) 171897.31 (Q) Source: Economic Review (various years), Kerala State Planning Board, Thiruvananthapuram
P-Provisional data Q-Quick estimate
On the eve of launching the 8th five year plan in 1992-93, there was
a virtual stagnation in the state’s economy. The situation has shown vast
improvements in the subsequent years which is shown in table 3.1.
3.1.2 Sectoral Distribution
The contribution of primary, secondary and tertiary sector to GDP
is referred to as the structure of the economy. As an economy develops,
there is a continuous shift of economic activity from primary sector to other
sectors. This trend is clearly seen in Kerala economy too. The structural
change occurred in Kerala during 1960-61 and 2010-11 are shown in

CCCChapter IIhapter IIhapter IIhapter IIIIII –––– SocioSocioSocioSocio----Economic Profile and Consumption Economic Profile and Consumption Economic Profile and Consumption Economic Profile and Consumption Pattern: Changing Trends in KeralaPattern: Changing Trends in KeralaPattern: Changing Trends in KeralaPattern: Changing Trends in Kerala
LIFESTYLE DISEASES IN KERALA: AN ANALYSIS OF SOCIO-ECONOMIC STATUS, CONSUMPTION
PATTERN AND ADOLESCENT OBESITY IN KOTTAYAM DISTRICT 61
Figure 3.1 which depicts the sectoral distribution of Gross State Domestic
Product (GSDP) of the state.
Figure 3.1
Sectoral Distribution of GSDP-Kerala
During 1960, as shown by Figure 3.4, the contributions from
primary, secondary and tertiary sectors to GSDP were 56% 15% and 29%
respectively. This structure of the economy has changed drastically in
favour of secondary and tertiary sectors during 2011. The contributions
from primary, secondary and tertiary sectors to GSDP constitute 11%, 20%
and 69% respectively during 2011. While analysing the sectoral
distribution of state income, it is seen that the contribution from primary
sector is decreasing. But secondary sector keeps almost the same level of
about 22%. Tertiary sector witnessed a boom which also generated large
employment opportunities in that sector.
3.1.3 Per Capita Income (PCI)
The growth of state per capita income is another important indicator
for measuring the growth of an economy. During 1992 – 93, the per capita
income of Kerala was Rs.1932 which was lower than that of India
(Rs.2216) with 1980-81 prices. The per capita income of Kerala has shown
1 9 6 0
P rim a ry
5 6%
S e c o n d
a ry
1 5 %
Te rt ia ry
2 9 %
P rim a ry S e c o n d a ry T e rt ia ry
2011
Primary
11%
Secondary
20%
Tertiary
69%
Primary Secondary Tertiary
Economic Review (2011), Kerala State planning Board, Thiruvananthapuram, p.30.

CCCChapter IIhapter IIhapter IIhapter IIIIII –––– SocioSocioSocioSocio----Economic Profile and Consumption Economic Profile and Consumption Economic Profile and Consumption Economic Profile and Consumption Pattern: Changing Trends in KeralaPattern: Changing Trends in KeralaPattern: Changing Trends in KeralaPattern: Changing Trends in Kerala
LIFESTYLE DISEASES IN KERALA: AN ANALYSIS OF SOCIO-ECONOMIC STATUS, CONSUMPTION
PATTERN AND ADOLESCENT OBESITY IN KOTTAYAM DISTRICT 62
vast improvements since 1993-94. The per capita income growth of the
state is above the all India average (Ahluwalia, 2002). Table 3.2 and Figure
3.2 compare PCI of India and Kerala.
Table 3.2
The growth of State Per Capita Income and Per Capita National
Income (1980-81, 1993-94 and 1999-2000, 2004-05 prices)
Year PCI of Kerala
(Rs)
Per. Capita National
Income (Rs)
1990-91 1815 2213
1991-92 1826 2167
1992-93 1932 2216
1993-94 7788 7698
1994-95 8417 8068.8
1995-96 8728 8478.9
1996-97 9039 8987
1997-98 9381 9241.6
1998-99 9807 9647
1999-2000 19294 15839
2000-01 19724 16133
01-02 20519 16762
02-03 21699 17075
03-04 22848 18517
04-05 36278 24143
05-06 39601 26015
06-07 42382 28067
07-08 45733 30322
08-09 47900 31754
09-10(P) 51791 33843
10-11(Q) 56107 35993 Source: Economic Review (various years), Kerala State Planning Board, Thiruvananthapuram
P-Provisional data Q-Quick estimate
Figure 3.2 compares the growth in PCI in India and Kerala and
highlights the steady growth in Kerala's PCI after 1993-1994.

CCCChapter IIhapter IIhapter IIhapter IIIIII –––– SocioSocioSocioSocio----Economic Profile and Consumption Economic Profile and Consumption Economic Profile and Consumption Economic Profile and Consumption Pattern: Changing Trends in KeralaPattern: Changing Trends in KeralaPattern: Changing Trends in KeralaPattern: Changing Trends in Kerala
LIFESTYLE DISEASES IN KERALA: AN ANALYSIS OF SOCIO-ECONOMIC STATUS, CONSUMPTION
PATTERN AND ADOLESCENT OBESITY IN KOTTAYAM DISTRICT 63
Figure 3.2
Growth Rate of Per Capita Income: Kerala and India
16133
56107
39601
19724
8728
1815
35993
26015
8478.9
2213
0
10000
20000
30000
40000
50000
60000
70000
80000
1990-91 1995-96 2000-01 2005-06 2010-11
PCI of Kerala Percapital National Income
Source: Economic Review (various Years), State Planning Board, Thiruvananthapuram
Till 1993-94 the PCI of the state was lower than per capita national
income. The per capita state income increased from 39601 in 2005-06 to
56107 in 2010-11, registering a growth rate of 41.68%. The per capita
national income increased by 38.35% during the same period. During 2010-
11 the growth rate was 8.33% in Kerala. There are many factors like
economic reforms, IT boom, migration and flow of remittances that
influenced the economic progress of Kerala since 1991.
CCCChapter IIhapter IIhapter IIhapter IIIIII –––– SocioSocioSocioSocio----Economic Profile and Consumption Economic Profile and Consumption Economic Profile and Consumption Economic Profile and Consumption Pattern: Changing Trends in KeralaPattern: Changing Trends in KeralaPattern: Changing Trends in KeralaPattern: Changing Trends in Kerala
LIFESTYLE DISEASES IN KERALA: AN ANALYSIS OF SOCIO-ECONOMIC STATUS, CONSUMPTION
PATTERN AND ADOLESCENT OBESITY IN KOTTAYAM DISTRICT 64
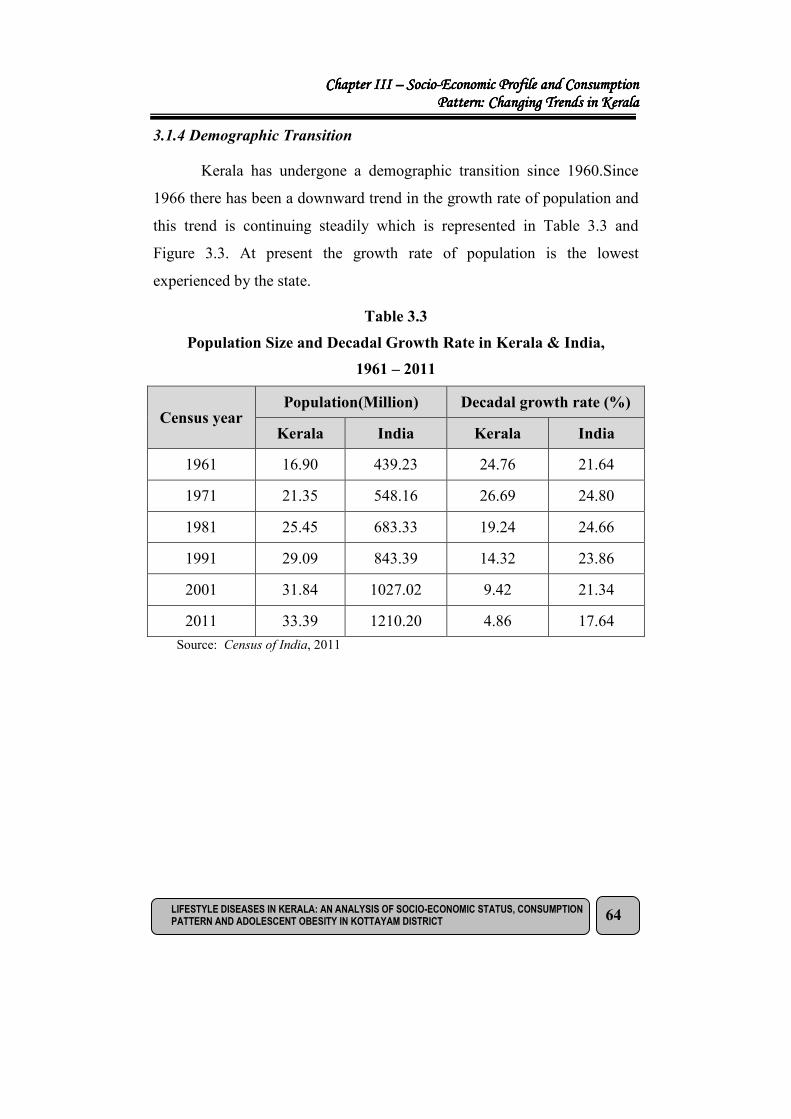
3.1.4 Demographic Transition
Kerala has undergone a demographic transition since 1960.Since
1966 there has been a downward trend in the growth rate of population and
this trend is continuing steadily which is represented in Table 3.3 and
Figure 3.3. At present the growth rate of population is the lowest
experienced by the state.
Table 3.3
Population Size and Decadal Growth Rate in Kerala & India,
1961 – 2011
Census year Population(Million) Decadal growth rate (%)
Kerala India Kerala India
1961 16.90 439.23 24.76 21.64
1971 21.35 548.16 26.69 24.80
1981 25.45 683.33 19.24 24.66
1991 29.09 843.39 14.32 23.86
2001 31.84 1027.02 9.42 21.34
2011 33.39 1210.20 4.86 17.64
Source: Census of India, 2011
CCCChapter IIhapter IIhapter IIhapter IIIIII –––– SocioSocioSocioSocio----Economic Profile and Consumption Economic Profile and Consumption Economic Profile and Consumption Economic Profile and Consumption Pattern: Changing Trends in KeralaPattern: Changing Trends in KeralaPattern: Changing Trends in KeralaPattern: Changing Trends in Kerala
LIFESTYLE DISEASES IN KERALA: AN ANALYSIS OF SOCIO-ECONOMIC STATUS, CONSUMPTION
PATTERN AND ADOLESCENT OBESITY IN KOTTAYAM DISTRICT 65
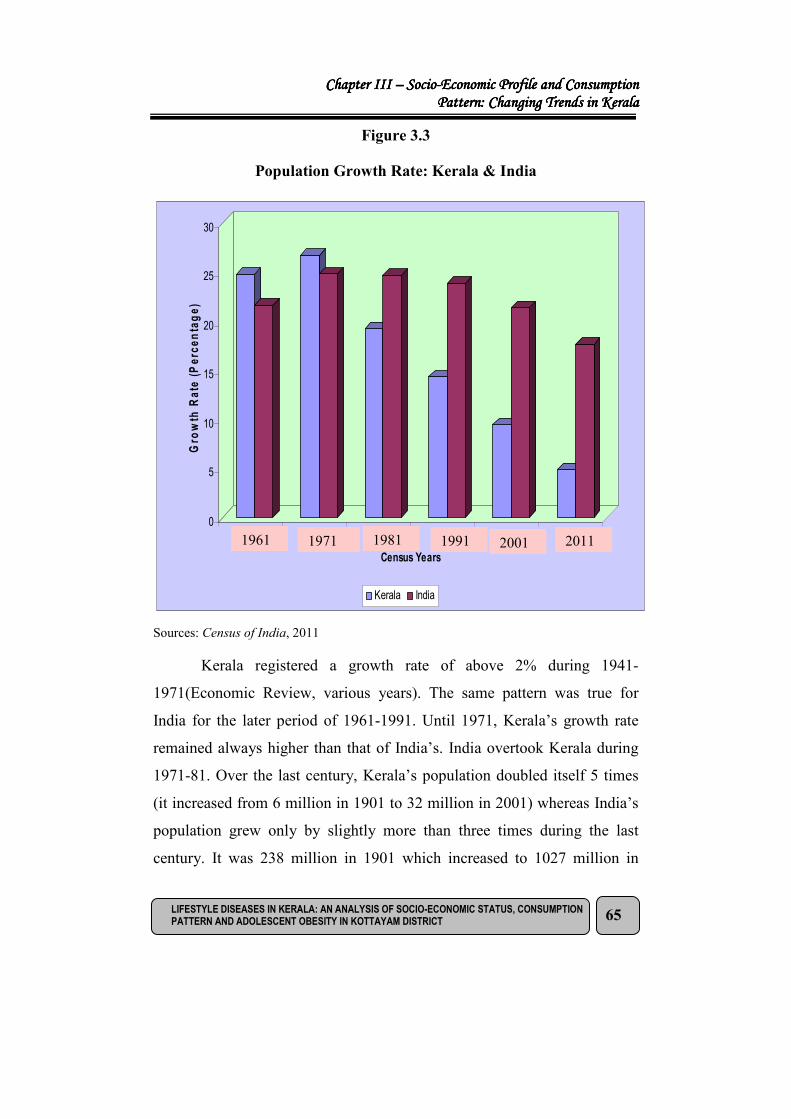
Figure 3.3
Population Growth Rate: Kerala & India
0
5
10
15
20
25
30
Gro
wth
Rate
(Perc
enta
ge)
1 2 3 4 5 6
Census Years
Kerala India
Sources: Census of India, 2011
Kerala registered a growth rate of above 2% during 1941-
1971(Economic Review, various years). The same pattern was true for
India for the later period of 1961-1991. Until 1971, Kerala’s growth rate
remained always higher than that of India’s. India overtook Kerala during
1971-81. Over the last century, Kerala’s population doubled itself 5 times
(it increased from 6 million in 1901 to 32 million in 2001) whereas India’s
population grew only by slightly more than three times during the last
century. It was 238 million in 1901 which increased to 1027 million in
1961 1971 2011 1981 1991 2001

CCCChapter IIhapter IIhapter IIhapter IIIIII –––– SocioSocioSocioSocio----Economic Profile and Consumption Economic Profile and Consumption Economic Profile and Consumption Economic Profile and Consumption Pattern: Changing Trends in KeralaPattern: Changing Trends in KeralaPattern: Changing Trends in KeralaPattern: Changing Trends in Kerala
LIFESTYLE DISEASES IN KERALA: AN ANALYSIS OF SOCIO-ECONOMIC STATUS, CONSUMPTION
PATTERN AND ADOLESCENT OBESITY IN KOTTAYAM DISTRICT 66
2001(Census of India, various years). However, the growth rate of
population during the past decade 2001-2011 was a mere 48%, the lowest
rate experienced since the formation of the state of Kerala. The growth rate
during 2001-2011 in Kerala was the lowest in India.
3.1.5 Sex Ratio in Kerala & India (1951-2011)
Kerala, being the only state which has a population of females in
excess of the population of males. The rate has 1084 females per 1000
males in 2011.
Table 3.4
Sex Ratio in Kerala and India, 1951 – 2011
Census year Sex ratio
Kerala India
1951 1028 946
1961 1022 941
1971 1016 930
1981 1032 934
1991 1036 927
2001 1058 933
2011 1084 940
Source: Census of India, 2011
Kerala is the only state in the country in which the excess of female
has been growing during the entire 20th century. Since the beginning of 20
th
century, Kerala has shown a situation of 4 excess females per 1000 males
in 1901 to 84 excess of females for 1000 males in 2011(Census of India,
various years).
CCCChapter IIhapter IIhapter IIhapter IIIIII –––– SocioSocioSocioSocio----Economic Profile and Consumption Economic Profile and Consumption Economic Profile and Consumption Economic Profile and Consumption Pattern: Changing Trends in KeralaPattern: Changing Trends in KeralaPattern: Changing Trends in KeralaPattern: Changing Trends in Kerala
LIFESTYLE DISEASES IN KERALA: AN ANALYSIS OF SOCIO-ECONOMIC STATUS, CONSUMPTION
PATTERN AND ADOLESCENT OBESITY IN KOTTAYAM DISTRICT 67
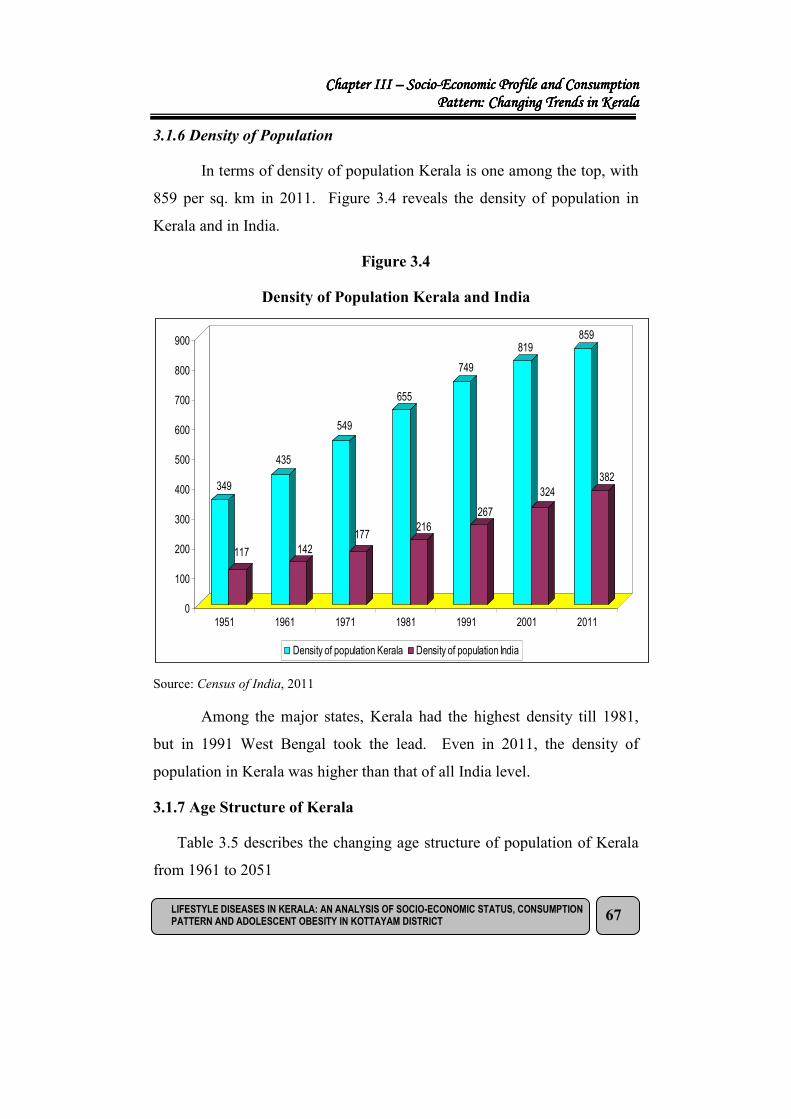
3.1.6 Density of Population
In terms of density of population Kerala is one among the top, with
859 per sq. km in 2011. Figure 3.4 reveals the density of population in
Kerala and in India.
Figure 3.4
Density of Population Kerala and India
349
117
435
142
549
177
655
216
749
267
819
324
859
382
0
100
200
300
400
500
600
700
800
900
1951 1961 1971 1981 1991 2001 2011
Density of population Kerala Density of population India
Source: Census of India, 2011
Among the major states, Kerala had the highest density till 1981,
but in 1991 West Bengal took the lead. Even in 2011, the density of
population in Kerala was higher than that of all India level.
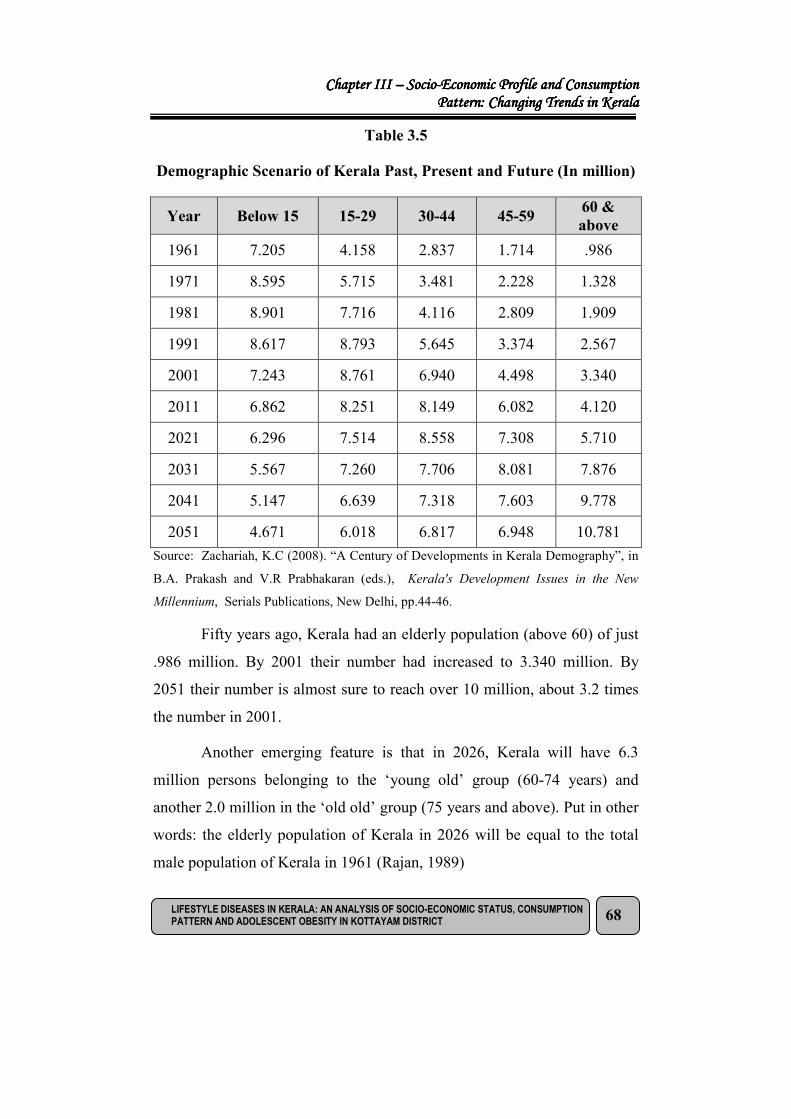
3.1.7 Age Structure of Kerala
Table 3.5 describes the changing age structure of population of Kerala
from 1961 to 2051
CCCChapter IIhapter IIhapter IIhapter IIIIII –––– SocioSocioSocioSocio----Economic Profile and Consumption Economic Profile and Consumption Economic Profile and Consumption Economic Profile and Consumption Pattern: Changing Trends in KeralaPattern: Changing Trends in KeralaPattern: Changing Trends in KeralaPattern: Changing Trends in Kerala
LIFESTYLE DISEASES IN KERALA: AN ANALYSIS OF SOCIO-ECONOMIC STATUS, CONSUMPTION
PATTERN AND ADOLESCENT OBESITY IN KOTTAYAM DISTRICT 68
Table 3.5
Demographic Scenario of Kerala Past, Present and Future (In million)
Year Below 15 15-29 30-44 45-59 60 &
above
1961 7.205 4.158 2.837 1.714 .986
1971 8.595 5.715 3.481 2.228 1.328
1981 8.901 7.716 4.116 2.809 1.909
1991 8.617 8.793 5.645 3.374 2.567
2001 7.243 8.761 6.940 4.498 3.340
2011 6.862 8.251 8.149 6.082 4.120
2021 6.296 7.514 8.558 7.308 5.710
2031 5.567 7.260 7.706 8.081 7.876
2041 5.147 6.639 7.318 7.603 9.778
2051 4.671 6.018 6.817 6.948 10.781
Source: Zachariah, K.C (2008). “A Century of Developments in Kerala Demography”, in
B.A. Prakash and V.R Prabhakaran (eds.), Kerala's Development Issues in the New
Millennium, Serials Publications, New Delhi, pp.44-46.
Fifty years ago, Kerala had an elderly population (above 60) of just
.986 million. By 2001 their number had increased to 3.340 million. By
2051 their number is almost sure to reach over 10 million, about 3.2 times
the number in 2001.
Another emerging feature is that in 2026, Kerala will have 6.3
million persons belonging to the ‘young old’ group (60-74 years) and
another 2.0 million in the ‘old old’ group (75 years and above). Put in other
words: the elderly population of Kerala in 2026 will be equal to the total
male population of Kerala in 1961 (Rajan, 1989)

CCCChapter IIhapter IIhapter IIhapter IIIIII –––– SocioSocioSocioSocio----Economic Profile and Consumption Economic Profile and Consumption Economic Profile and Consumption Economic Profile and Consumption Pattern: Changing Trends in KeralaPattern: Changing Trends in KeralaPattern: Changing Trends in KeralaPattern: Changing Trends in Kerala
LIFESTYLE DISEASES IN KERALA: AN ANALYSIS OF SOCIO-ECONOMIC STATUS, CONSUMPTION
PATTERN AND ADOLESCENT OBESITY IN KOTTAYAM DISTRICT 69
The worst affected group is the children below the age of 15. From
8.617 million in 1991 their number declined to 7.243 million in 2001 and it
would decline consistently to about 4.671 million in 2051(Kerala
Development Report, 2008b).
3.1.8 Ageing Population
The ageing scenario of Kerala is unique among the states of India.
Although the increasing proportion of older persons is a worldwide and
also a national phenomenon, the process is happening much faster in
Kerala. One of the greatest challenges of Kerala in 21st century would be in
managing the ever increasing number of elderly population who are
progressively getting older.
Kerala had 10.5 per cent of its population in the age group of 60
years and above as against only 7.5 per cent in all – India. Given the
advanced stage in Kerala’s demographic transition, the share of the aged in
the population will continue to increase through the next couple of decades.
Caring the elderly people will therefore emerge as a new challenge in the
area of social security and welfare in the coming decades (Kannan, 2006).
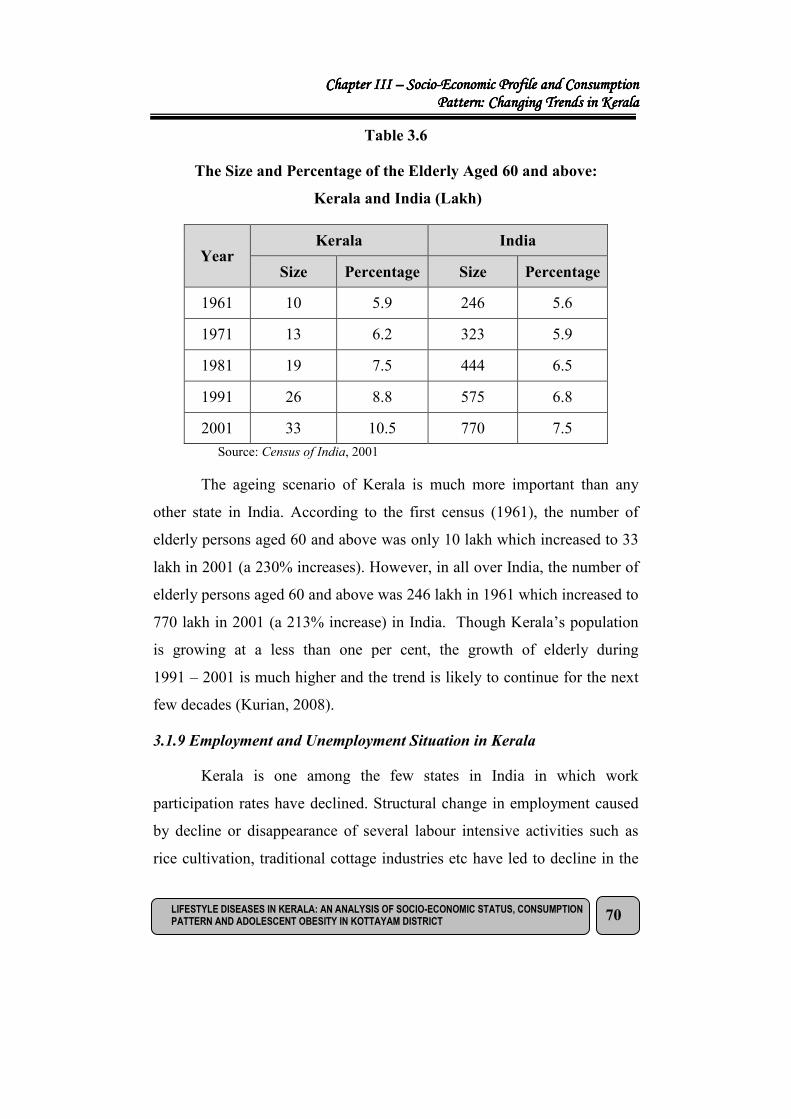
Table 3.6 shows the size and percentage of elderly people in Kerala
and India.
CCCChapter IIhapter IIhapter IIhapter IIIIII –––– SocioSocioSocioSocio----Economic Profile and Consumption Economic Profile and Consumption Economic Profile and Consumption Economic Profile and Consumption Pattern: Changing Trends in KeralaPattern: Changing Trends in KeralaPattern: Changing Trends in KeralaPattern: Changing Trends in Kerala
LIFESTYLE DISEASES IN KERALA: AN ANALYSIS OF SOCIO-ECONOMIC STATUS, CONSUMPTION
PATTERN AND ADOLESCENT OBESITY IN KOTTAYAM DISTRICT 70
Table 3.6
The Size and Percentage of the Elderly Aged 60 and above:
Kerala and India (Lakh)
Year Kerala India
Size Percentage Size Percentage
1961 10 5.9 246 5.6
1971 13 6.2 323 5.9
1981 19 7.5 444 6.5
1991 26 8.8 575 6.8
2001 33 10.5 770 7.5
Source: Census of India, 2001
The ageing scenario of Kerala is much more important than any
other state in India. According to the first census (1961), the number of
elderly persons aged 60 and above was only 10 lakh which increased to 33
lakh in 2001 (a 230% increases). However, in all over India, the number of
elderly persons aged 60 and above was 246 lakh in 1961 which increased to
770 lakh in 2001 (a 213% increase) in India. Though Kerala’s population
is growing at a less than one per cent, the growth of elderly during
1991 – 2001 is much higher and the trend is likely to continue for the next
few decades (Kurian, 2008).
3.1.9 Employment and Unemployment Situation in Kerala
Kerala is one among the few states in India in which work
participation rates have declined. Structural change in employment caused
by decline or disappearance of several labour intensive activities such as
rice cultivation, traditional cottage industries etc have led to decline in the
CCCChapter IIhapter IIhapter IIhapter IIIIII –––– SocioSocioSocioSocio----Economic Profile and Consumption Economic Profile and Consumption Economic Profile and Consumption Economic Profile and Consumption Pattern: Changing Trends in KeralaPattern: Changing Trends in KeralaPattern: Changing Trends in KeralaPattern: Changing Trends in Kerala
LIFESTYLE DISEASES IN KERALA: AN ANALYSIS OF SOCIO-ECONOMIC STATUS, CONSUMPTION
PATTERN AND ADOLESCENT OBESITY IN KOTTAYAM DISTRICT 71
work participation rates, particularly of women. Work participation rates of
men and women in Kerala were 50.6 per cent and 15.3 per cent respectively
in 2001. Wide significant differences do not exist in work participation
rates as between urban and rural areas. It was the agriculture sector that was
the main source of rural employment while it was the tertiary sector that
created the most employment opportunities in urban areas (Development
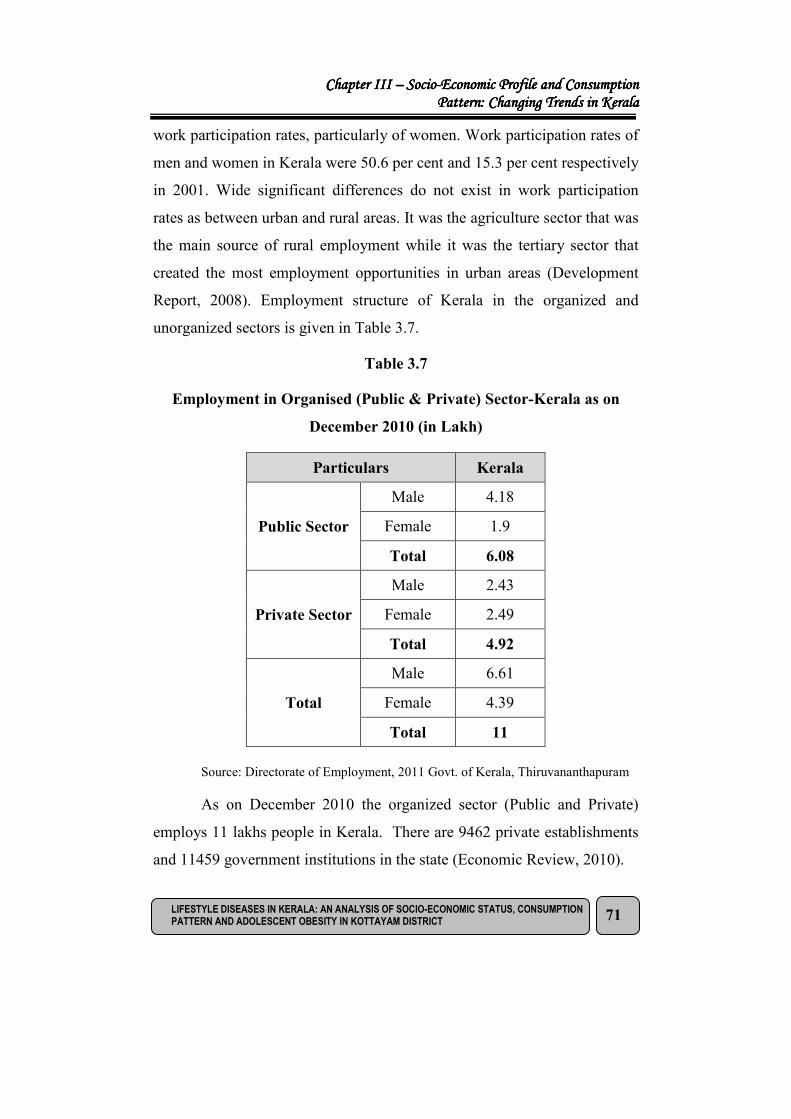
Report, 2008). Employment structure of Kerala in the organized and
unorganized sectors is given in Table 3.7.
Table 3.7
Employment in Organised (Public & Private) Sector-Kerala as on
December 2010 (in Lakh)
Particulars Kerala
Public Sector
Male 4.18
Female 1.9
Total 6.08
Private Sector
Male 2.43
Female 2.49
Total 4.92
Total
Male 6.61
Female 4.39
Total 11
Source: Directorate of Employment, 2011 Govt. of Kerala, Thiruvananthapuram
As on December 2010 the organized sector (Public and Private)
employs 11 lakhs people in Kerala. There are 9462 private establishments
and 11459 government institutions in the state (Economic Review, 2010).

CCCChapter IIhapter IIhapter IIhapter IIIIII –––– SocioSocioSocioSocio----Economic Profile and Consumption Economic Profile and Consumption Economic Profile and Consumption Economic Profile and Consumption Pattern: Changing Trends in KeralaPattern: Changing Trends in KeralaPattern: Changing Trends in KeralaPattern: Changing Trends in Kerala
LIFESTYLE DISEASES IN KERALA: AN ANALYSIS OF SOCIO-ECONOMIC STATUS, CONSUMPTION
PATTERN AND ADOLESCENT OBESITY IN KOTTAYAM DISTRICT 72
From the above table it is clear that in 2010, the share of female
employees in the organised sector in Kerala is 39.9 per cent. In the private
sector, share of female workers is 50.6 per cent. The private sector
accounts for 44.72 per cent of the employment in the organised sector in
Kerala.
Table 3.8 shows the distribution of employment in public sector in Kerala.
Table 3.8
Employment in Public Sector in Kerala ( In Lakhs)
Year
(at the end of
December)
Central
Govt.
State
Govt.
Quasi
Govt.
Local
Bodies Total
2001 0.97 2.94 2.28 0.26 6.45
2002 0.83 2.89 2.39 0.27 6.38
2003 0.81 2.72 2.39 0.27 6.19
2004 0.78 2.8 2.31 0.26 6.15
2005 0.77 2.78 2.29 0.25 6.09
2006 0.77 2.77 2.27 0.26 6.07
2007 0.76 2.76 2.32 0.26 6.1
2008 0.63 2.66 2.51 0.27 6.07
2009 0.62 2.68 2.6 0.27 6.17
2010 0.6 2.64 2.58 0.26 6.08
2011 0.61 2.65 2.6 0.26 6.12
Source: Directorate of employment, 2011, Govt.of Kerala, Thirivananthapuram.
The total employment in the public sector increased from 6.07 lakh
in 2008 to 6.12 lakh in December 2011. The branch-wise analysis shows
that employment opportunities in central government and state government
show a decreasing trend and local bodies show a positive trend. Figure 3.5
depicts the distribution of employment in the public sector in March 2011.

CCCChapter IIhapter IIhapter IIhapter IIIIII –––– SocioSocioSocioSocio----Economic Profile and Consumption Economic Profile and Consumption Economic Profile and Consumption Economic Profile and Consumption Pattern: Changing Trends in KeralaPattern: Changing Trends in KeralaPattern: Changing Trends in KeralaPattern: Changing Trends in Kerala
LIFESTYLE DISEASES IN KERALA: AN ANALYSIS OF SOCIO-ECONOMIC STATUS, CONSUMPTION
PATTERN AND ADOLESCENT OBESITY IN KOTTAYAM DISTRICT 73
Figure 3.5
Distribution of Employment in the Public Sector (March 2011)
Central Quasi
15%
State Quasi
28%
Local Bodies
4%
State Government
43%
Central Government
10%
Local Bodies Central Government State Government Central Quasi State Quasi
Source: Directorate of Employment, 2011, Govt.of Kerala, Thiruvananthapuram.
The overall sector-wise employment in Kerala is given in Table 3.9.
Table 3.9
Sector-wise Employment in Public and Private
Establishments in Kerala
Sector Percentage of persons employed
2005 2006 2007 2008 2009 2010
Primary 8 9 8 8 7 7
Secondary 25 22 24 25 25 25
Tertiary 67 69 68 67 68 68
Source: Directorate of Employment, 2010, Govt. of Kerala, Thiruvananthapuram.
Analysis of the sector-wise growth of employment in public and
private sector in Kerala in March 2010 reveals that the highest employment

CCCChapter IIhapter IIhapter IIhapter IIIIII –––– SocioSocioSocioSocio----Economic Profile and Consumption Economic Profile and Consumption Economic Profile and Consumption Economic Profile and Consumption Pattern: Changing Trends in KeralaPattern: Changing Trends in KeralaPattern: Changing Trends in KeralaPattern: Changing Trends in Kerala
LIFESTYLE DISEASES IN KERALA: AN ANALYSIS OF SOCIO-ECONOMIC STATUS, CONSUMPTION
PATTERN AND ADOLESCENT OBESITY IN KOTTAYAM DISTRICT 74
is in the tertiary sector (68%) followed by secondary sector (25%) and the
lowest employment is in primary sector (7%).
In Kerala from 1970 onwards there has been a rapid rise in the
number of women seeking wage employment. Though the supply of work
seekers increased, the demand for them did not increase proportionally. As
a consequence, there was an alarming increase in unemployment rate from
time to time. Unemployment increased in Kerala due to several factors such
as low rate of economic growth and the slow growth of organized sector.
The unemployment rate is increasing in both rural and urban areas. An
important feature of Kerala economy is the out-migration of labour force
particularly to Gulf regions and inflow of huge remittances into the state.
Huge out migration is because of lack of employment opportunities within
the state.
The unemployment rate according to Current Daily Status approach
(CDS) based on 2009-2010 survey for Kerala is given below in Table 3.10.
Table 3.10
Unemployment Rate (per 1000) for all Persons According to Current
Daily Status approach (Based on 2009-2010 survey), Kerala
Sector Male Female Male + Female
Rural 129 274 173
Urban 121 213 148
Rural+Urban 127 259 167
Source: Key Indicators of employment and unemployment in India, 2011,
National Sample Survey Organization.
Educated unemployment is the core of the unemployment problem
in Kerala. Unemployment rates were higher among SSLC and HSE
CCCChapter IIhapter IIhapter IIhapter IIIIII –––– SocioSocioSocioSocio----Economic Profile and Consumption Economic Profile and Consumption Economic Profile and Consumption Economic Profile and Consumption Pattern: Changing Trends in KeralaPattern: Changing Trends in KeralaPattern: Changing Trends in KeralaPattern: Changing Trends in Kerala
LIFESTYLE DISEASES IN KERALA: AN ANALYSIS OF SOCIO-ECONOMIC STATUS, CONSUMPTION
PATTERN AND ADOLESCENT OBESITY IN KOTTAYAM DISTRICT 75
certificate holders than among the professionally qualified, the post
graduates and the higher degree holders.(Kerala Development Report,
2008a).
2009-2010 survey reveals that among the Indian states, Kerala
(16.7%) has highest unemployment rate (UR) based on Current Daily
Status Approach (CDS): followed by Nagaland (15%). In Kerala UR
among male was 12.7% and that of female 25.9% based on CDS approach.
In rural area the UR is estimated at 17.3% (male-12.9% and female-
27.4%); where as in urban area it is estimated that 14.8% (male-12.1% and
female- 21.3%). (Economic review, 2011).
The structural change in terms of employment and its consequences
can be summarized as follows.
1. The share of employment in tertiary sector has gone up, but the
structural change has not led to a reduction in its share in the
primary sector.
2. There has not been much increase in the share of employment in the
secondary sector.
3. Employment in Kerala is still informal in nature comprising mostly
self-employment and casual employment.
4. Economic growth has failed to generate more employment
opportunities in the organised public and private sectors.
5. There has been a substantial increase in the incidence of
unemployment especially educated unemployment.
6. The employed youth were forced to migrate to other parts of India
and abroad since 1970s.
CCCChapter IIhapter IIhapter IIhapter IIIIII –––– SocioSocioSocioSocio----Economic Profile and Consumption Economic Profile and Consumption Economic Profile and Consumption Economic Profile and Consumption Pattern: Changing Trends in KeralaPattern: Changing Trends in KeralaPattern: Changing Trends in KeralaPattern: Changing Trends in Kerala
LIFESTYLE DISEASES IN KERALA: AN ANALYSIS OF SOCIO-ECONOMIC STATUS, CONSUMPTION
PATTERN AND ADOLESCENT OBESITY IN KOTTAYAM DISTRICT 76
7. The unprecedented rate of emigration and consequent inflow of
large volume of remittances has significant influence on the labour
market, construction, saving, investment and income distribution.
3.1.10 Economic Infrastructure
The basic facilities like energy, transportation and communication
provide supportive services in the main areas of industrial and agricultural
production, domestic and foreign trade and commerce. These facilities have
a direct impact on the working of the system which increase the
productivity of the factors production and improve the quality of life of the
people.
Economic infrastructure has been playing a pivotal role in the
development of Kerala economy since last five decades.
3.1.10.1 Energy
Energy is a basic requirement for every walks of our life. It is also
basic human need and is a critical infrastructure on which the socio
economic development of a country relies. In Kerala, Kerala State
Electricity Board (KSEB) is the sole organization to supply the power to
different categories of the consumers. Increasing the capacity of hydel
generation by harnessing the untapped potential in the state without many
disturbances to the forest and its bio-reservoirs is the key strategy adopted
by the KSEB.

CCCChapter IIhapter IIhapter IIhapter IIIIII –––– SocioSocioSocioSocio----Economic Profile and Consumption Economic Profile and Consumption Economic Profile and Consumption Economic Profile and Consumption Pattern: Changing Trends in KeralaPattern: Changing Trends in KeralaPattern: Changing Trends in KeralaPattern: Changing Trends in Kerala
LIFESTYLE DISEASES IN KERALA: AN ANALYSIS OF SOCIO-ECONOMIC STATUS, CONSUMPTION
PATTERN AND ADOLESCENT OBESITY IN KOTTAYAM DISTRICT 77
Table 3.11
Energy Source in Kerala as on 31.03.2011
Sl. No. Source of energy Installed capacity (MW)
1 Hydel : KSEB 1997.80
2 Thermal : KSEB 234.60
3 Wind : KSEB 2.03
4 NTPC 359.58
5 Thermal : IPP 188.93
6 Hydel : Captive 33
7 Hydel : IPP 10
8 Wind : IPP 31.65
Total 2857.59
Source: Economic Review (2011), Kerala State Planning Board, Thiruvananthapuram, P. 252
Table 3.11 depicts energy sources and installed capacity in Kerala.
Power System in Kerala consisted of hydel, thermal and wind sources.
Hydel energy is the most reliable and dependable source in Kerala. Of the
total installed capacity of 2857.59 MW during 2011, the lion's share of
2040.80 MW of installed capacity comes from 24 hydel stations; 783.11
MW is from the thermal projects including NTPC at Kayamkulam which is
Kerala's dedicated thermal station. Kanjikode wind farm, Palakkad has an
installed capacity of 2.03 MW. Wind energy from IPP is 31.65 MW.
Capacity addition during 2010-2011 was only 111.40 (4%).
Some of the challenges that Kerala’s power sector faces today are
1. Kerala’s installed capacity to generate electricity is not
sufficient to feed an annual economic growth of 7 per cent.
CCCChapter IIhapter IIhapter IIhapter IIIIII –––– SocioSocioSocioSocio----Economic Profile and Consumption Economic Profile and Consumption Economic Profile and Consumption Economic Profile and Consumption Pattern: Changing Trends in KeralaPattern: Changing Trends in KeralaPattern: Changing Trends in KeralaPattern: Changing Trends in Kerala
LIFESTYLE DISEASES IN KERALA: AN ANALYSIS OF SOCIO-ECONOMIC STATUS, CONSUMPTION
PATTERN AND ADOLESCENT OBESITY IN KOTTAYAM DISTRICT 78
2. High transmission and distribution loss
3. Inadequate private sector power generation.
4. High power tariffs and prolonged power cuts in different parts
of the state.
5. Thermal power sector faces shortage of raw materials.
3.1.10.2 Transportation
Transportation is an integral part of the economic and social
development of a nation. Kerala can be proud of the fact that it has
developed a good road net work compared to other states in India.
Transport infrastructure of Kerala consists of 1.62 lakh km of road, 1148
km of railways, 1687 km of inland waterways and 111 statute mile of
airways and 18 ports. However, the development of road, railway and air
transport is less than proportionate to the increase in the number of motor
vehicles. The number of motor vehicles having valid registration as on
31-03-2010 is 5397652. About 1276 vehicles are newly added to vehicle
population every day out of which 870 are two wheelers. Density of
vehicle is high in Kerala. It is 10358 vehicles per sq. km. or 12641 per
100000 people. The transport system in Kerala is consumer oriented and
passenger movement accounts for major portion of transportation.
3.1.10.3 Telecommunication
Telecommunication is one of the fastest growing sectors of Kerala
economy and has immense potential of growth in future.
The state has telephone density of 191 per 1000 population with
BSNL connections. The number of telephone connections is 60.96 lakhs
(Land line – 36.03, WLL – 4.33 and mobile 20.60). Kerala telecom circle

CCCChapter IIhapter IIhapter IIhapter IIIIII –––– SocioSocioSocioSocio----Economic Profile and Consumption Economic Profile and Consumption Economic Profile and Consumption Economic Profile and Consumption Pattern: Changing Trends in KeralaPattern: Changing Trends in KeralaPattern: Changing Trends in KeralaPattern: Changing Trends in Kerala
LIFESTYLE DISEASES IN KERALA: AN ANALYSIS OF SOCIO-ECONOMIC STATUS, CONSUMPTION
PATTERN AND ADOLESCENT OBESITY IN KOTTAYAM DISTRICT 79
has the 2nd largest telecom net work out of 24 territorial circles in the
country. The growth of telephone connections in Kerala has been steadily
increasing particularly since 2003. Both rural and urban areas are targeted
for telephone connections.
The revenue from the telecommunications sector is one of the
lowest in Kerala among the states due to the fact that a major portion of
telephone connections in the state is in rural areas in which tariffs are
lower. New method of communications such as internet, and integrated
digital services has been gaining importance in recent years.
The major challenge for Kerala is the provision of cost-effective
connectivity to rural areas and accommodating its rapidly rising tariff
growth. The telecommunication infrastructure and services should become
capable of playing a key role in balancing the developments through e-
education, tele-medicine and e-governance.
3.1.10.4 Postal Service
Kerala postal circle provides postal needs of the whole Kerala state,
Union Territory of Lakshadeep and Mahe, a part of Union Territory of
Pondicherry. There are 5067 post offices functioning in the state during
2010-2011.
Besides the traditional postal services, money orders, value payable
services, post office saving Bank, Postal Life Insurance etc are efficiently
done by department of posts. It also does agency services like international
Money Transfer Services (MTS), sale of various application forms,
passport services etc with its vast network. In MTS, Kerala Postal Circle
ranks second position in the country. With effect from 01.09.2007, speed
CCCChapter IIhapter IIhapter IIhapter IIIIII –––– SocioSocioSocioSocio----Economic Profile and Consumption Economic Profile and Consumption Economic Profile and Consumption Economic Profile and Consumption Pattern: Changing Trends in KeralaPattern: Changing Trends in KeralaPattern: Changing Trends in KeralaPattern: Changing Trends in Kerala
LIFESTYLE DISEASES IN KERALA: AN ANALYSIS OF SOCIO-ECONOMIC STATUS, CONSUMPTION
PATTERN AND ADOLESCENT OBESITY IN KOTTAYAM DISTRICT 80
post booking facility has been extended to all post offices of this postal
circle, which is first time in the country.
3.1.11 Education
Education is a good indicator of social position and often seen as
the easier way of measuring socio-economic status because it precedes
other indicators such as income or occupational based social position.
Kerala’s stupendous achievements in the field of social development and
high quality of living are mainly attributed to the educational advancement
that the state has made over several years. The educational structure of
Kerala has passed through several changes during the past centuries.
Massive spread of education by Christian community created a conducive
climate for rapid social changes in all the communities (Mahadevan and
Sumangala, 1987).
Kerala has successfully solved the first generation problems of
illiteracy and inadequate school enrolment. Literacy is a basic step towards
education, which is a process of life learning and entry point to the world of
communication and information. A comparison of Kerala with India in the
matter of literacy rate is shown in Table 3.12 and Figure 3.6
Table 3.12
Literacy Rate in Kerala & India (Percentage)
Year Kerala India
1951 47.18 18.33
1961 55.08 28.3
1971 69.75 34.45
1981 78.85 43.57
1991 89.81 52.21
2001 90.86 64.84
2011 93.91 74.04 Source : Census of India (Various years)

CCCChapter IIhapter IIhapter IIhapter IIIIII –––– SocioSocioSocioSocio----Economic Profile and Consumption Economic Profile and Consumption Economic Profile and Consumption Economic Profile and Consumption Pattern: Changing Trends in KeralaPattern: Changing Trends in KeralaPattern: Changing Trends in KeralaPattern: Changing Trends in Kerala
LIFESTYLE DISEASES IN KERALA: AN ANALYSIS OF SOCIO-ECONOMIC STATUS, CONSUMPTION
PATTERN AND ADOLESCENT OBESITY IN KOTTAYAM DISTRICT 81
Figure 3.6
Literacy Rate: Kerala & India (Percentage)
93.9190.8689.81
78.85
69.75
55.08
47.18
74.04
64.84
52.51
43.57
18.33
28.3
34.45
0
10
20
30
40
50
60
70
80
90
100
1951 1961 1971 1981 1991 2001 2011
Kerala India
Source: Economic review, various years
Since 1951 Kerala is at the top position among the states of India in
terms of literacy.
School education is widespread between sexes, across regions and
among all social groups. Compulsory and free school education, basic
education, direct payment of salaries of private school teachers, reduction
of inter community and inter regional differences in school access,
promotion of female education, school feeding programme, promotion
policies and travel concessions to students have been the policy measures
through which the state achieved high literacy rate as early as by 1991.
CCCChapter IIhapter IIhapter IIhapter IIIIII –––– SocioSocioSocioSocio----Economic Profile and Consumption Economic Profile and Consumption Economic Profile and Consumption Economic Profile and Consumption Pattern: Changing Trends in KeralaPattern: Changing Trends in KeralaPattern: Changing Trends in KeralaPattern: Changing Trends in Kerala
LIFESTYLE DISEASES IN KERALA: AN ANALYSIS OF SOCIO-ECONOMIC STATUS, CONSUMPTION
PATTERN AND ADOLESCENT OBESITY IN KOTTAYAM DISTRICT 82
The average size of schools is larger in Kerala than in the rest of the
country at all the stages of school. The student class room and student
teacher ratios are more favorable in Kerala than in many of the other states.
The quality of education in Kerala is higher in terms of teacher
qualification, drop out, grade repetition rates and examination results than
in several other states.
Kerala had remained a relatively under-developed region among the
states of India in respect of higher education till the beginning of the
1990’s. Till 1990 conventional degree courses were very popular. But now
they are no longer very popular. The reason for this phenomenon could be
the amazing proliferation of Engineering and Medical colleges and the
popularity enjoyed by non-intellectual disciplines like Commerce,
Management Studies and Computer Applications which appear to attract a
large number of top scoring students who would otherwise have joined for
pure Arts/Science streams. The progress made by the state during the past
decade and a half has been phenomenal. The growth was marked by the
opening up of self-financing institutions in the areas of Engineering,
Information Technology and also in Medicine.
Arts and science colleges dominate the higher education sector in
Kerala. 342 arts and science colleges of the state distributed under various
universities is shown in Table 3.13.

CCCChapter IIhapter IIhapter IIhapter IIIIII –––– SocioSocioSocioSocio----Economic Profile and Consumption Economic Profile and Consumption Economic Profile and Consumption Economic Profile and Consumption Pattern: Changing Trends in KeralaPattern: Changing Trends in KeralaPattern: Changing Trends in KeralaPattern: Changing Trends in Kerala
LIFESTYLE DISEASES IN KERALA: AN ANALYSIS OF SOCIO-ECONOMIC STATUS, CONSUMPTION
PATTERN AND ADOLESCENT OBESITY IN KOTTAYAM DISTRICT 83
Table 3.13
University-wise Arts and Science College, 2011
SL.
No. Name of University Government Aided Unaided
1 Kerala 9 37 15
2 Calicut 17 45 58
3 Mahatma Gandhi 7 56 54
4 Kannur 6 12 26
Total 39 150 153 Source: Directorate of Collegiate Education, Thiruvananthapuram, 2011
Apart from the government and aided colleges, unaided arts and
science colleges are also functioning in the state. A total of 153 unaided
colleges are affiliated to these universities.
The number of engineering colleges has increased manifold in
recent years. The number of engineering colleges at the end of the 9th five
year plan has almost doubled now.
Table 3.14
University- wise Number of Engineering Colleges in Kerala – 2011
SL.No. Name of University Number of College
1 University of Kerala 39
2 Mahatma Gandhi 40
3 Calicut 33
4 Kannur 8
5 Cochin University of Science
And Technology 20
6 Agricultural University 2
Total 142
Source: Directorate of Technical education, Govt. of Kerala, 2011.
CCCChapter IIhapter IIhapter IIhapter IIIIII –––– SocioSocioSocioSocio----Economic Profile and Consumption Economic Profile and Consumption Economic Profile and Consumption Economic Profile and Consumption Pattern: Changing Trends in KeralaPattern: Changing Trends in KeralaPattern: Changing Trends in KeralaPattern: Changing Trends in Kerala
LIFESTYLE DISEASES IN KERALA: AN ANALYSIS OF SOCIO-ECONOMIC STATUS, CONSUMPTION
PATTERN AND ADOLESCENT OBESITY IN KOTTAYAM DISTRICT 84
At present there are 142 engineering colleges in the state with a
sanctioned intake of 45147 in 2011. Out of 142 colleges, 11 are
government colleges, 3 in the private aided sector and 128 are self
financing.
Medical education in the government sector in the state is imparted
through 5 medical colleges 3 dental colleges and five nursing colleges.
During 2011, Government has allotted additional fund to start four new
Medical Colleges at Idukki, Kasargode, Pathanamthitta and Malappuram.
The Directorate of Ayurveda Medical Education has now 16 institutions: 3
are in Government sector, 2 in private sector and 11 in self financing sector.
The Homoeo Medical Education Department is also formed to
promote education, research and training in the field of homeopathy. Now
there are 6 homoeo colleges in Kerala: 1 in Government sector 3 is in
Government aided sector and one in unaided sector.
3.1.12 Types of Dwelling
One major factor which is a good measure of standard of living and
has a positive influence on health status is the housing pattern of the
people. Kerala has witnessed high growth in housing investment and
construction during the last 30 years. The average housing in Kerala is far
ahead of the rest of India. While at the all India level, 51.8 per cent
households live in permanent and 30 percent in semi- permanent houses,
the corresponding proportion in Kerala is 68 and 21.6 per cent respectively
(Census of India, 2011). The Census 2001 indicates that on an average, a
house in Kerala had three rooms while the all India average is only two.

CCCChapter IIhapter IIhapter IIhapter IIIIII –––– SocioSocioSocioSocio----Economic Profile and Consumption Economic Profile and Consumption Economic Profile and Consumption Economic Profile and Consumption Pattern: Changing Trends in KeralaPattern: Changing Trends in KeralaPattern: Changing Trends in KeralaPattern: Changing Trends in Kerala
LIFESTYLE DISEASES IN KERALA: AN ANALYSIS OF SOCIO-ECONOMIC STATUS, CONSUMPTION
PATTERN AND ADOLESCENT OBESITY IN KOTTAYAM DISTRICT 85
Table 3.15
Types of Dwelling Kerala & India 2006
Type of house Kerala India
Rural Urban Rural Urban
Pucca 73% 84.7% 48% 84.2%
Kutcha 7.2% 2.4% 18% 4.3%
Source: Economic review (various years), Govt. of Kerala
In Kerala, size and condition of dwelling units are good in rural as
well as urban areas when compared to all India and neighboring states. In
Kerala 73 per cent of rural population and 84.7 per cent of urban population
are living in pucca houses while the corresponding figures at all India level
are 48 per cent and 84.2 per cent respectively. The percentage of rural and
urban population living in kutcha houses in Kerala are 7.2% and 2.4%
respectively.
3.1.13 Family Structure
Another aspect of social condition is the family structure. The joint
family system based on marumakkathayam* used to be the pattern among
several communities in Kerala. Under the system, the property was jointly
owned by the tharavad and was impartibly and inalienable except by
common consent. It was managed by Karnavar, the senior male member. A
protracted legal battle and agitation which started during the last decades of
19th century finally resulted in the passage of legislation permitting division
of tharavad property. With this the process of family nucleation was started.
Today, among almost all communities the joint or extended family has
*A system of matrilineal inheritance. Under the system descent and succession to the
property is traced through females

CCCChapter IIhapter IIhapter IIhapter IIIIII –––– SocioSocioSocioSocio----Economic Profile and Consumption Economic Profile and Consumption Economic Profile and Consumption Economic Profile and Consumption Pattern: Changing Trends in KeralaPattern: Changing Trends in KeralaPattern: Changing Trends in KeralaPattern: Changing Trends in Kerala
LIFESTYLE DISEASES IN KERALA: AN ANALYSIS OF SOCIO-ECONOMIC STATUS, CONSUMPTION
PATTERN AND ADOLESCENT OBESITY IN KOTTAYAM DISTRICT 86
given way to nuclear family in Kerala. Growth of nuclear families is
highlighted in Table 3.16.
Table 3.16
Percentage of Type of Family Households in Kerala
Type of family 1992 – 93 1998 - 99
Urban Rural Urban Rural
Nuclear 56.80 55.60 62.90 60.80
Non-Nuclear 43.20 44.40 37.10 39.20
Source: National Family Health Survey (NFHS – 1 and NFHS -2), India, 1992-93 and 98-99.
Industrialization, decline of agriculture, female employment and
migration also have played considerable role for the growth of nuclear
families in Kerala.
3.1.14 Urbanisation
Urbanisation is an important aspect in the process of economic and
social development and is associated with many problems such as
migration from villages to towns, relative cost of providing economic and
social services in the towns like housing, water supply, sanitation, transport
and power, location and dispersal of industries etc. In the context of Kerala,
the development of tertiary sector is the main cause of urbanization. It is
not the outcome of accelerated industrialization and urbanization as seen in
Tamil Nadu, Maharashtra, Andhra Pradesh and Karnataka (Economic
Review, 2011a). The urban sector of Kerala consists of 5 municipal
corporations and 53 municipalities. The growth and proportions of urban
population in Kerala is shown in Table 3.17.
CCCChapter IIhapter IIhapter IIhapter IIIIII –––– SocioSocioSocioSocio----Economic Profile and Consumption Economic Profile and Consumption Economic Profile and Consumption Economic Profile and Consumption Pattern: Changing Trends in KeralaPattern: Changing Trends in KeralaPattern: Changing Trends in KeralaPattern: Changing Trends in Kerala
LIFESTYLE DISEASES IN KERALA: AN ANALYSIS OF SOCIO-ECONOMIC STATUS, CONSUMPTION
PATTERN AND ADOLESCENT OBESITY IN KOTTAYAM DISTRICT 87
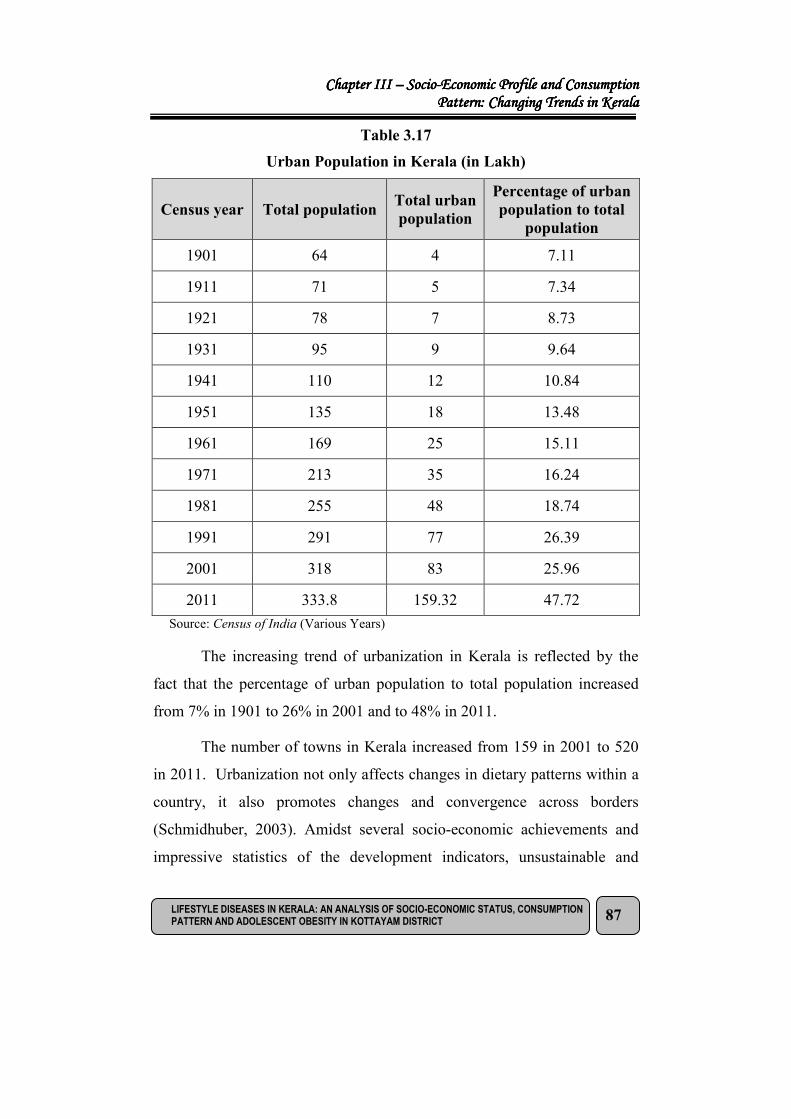
Table 3.17
Urban Population in Kerala (in Lakh)
Census year Total population Total urban
population
Percentage of urban
population to total
population
1901 64 4 7.11
1911 71 5 7.34
1921 78 7 8.73
1931 95 9 9.64
1941 110 12 10.84
1951 135 18 13.48
1961 169 25 15.11
1971 213 35 16.24
1981 255 48 18.74
1991 291 77 26.39
2001 318 83 25.96
2011 333.8 159.32 47.72
Source: Census of India (Various Years)
The increasing trend of urbanization in Kerala is reflected by the
fact that the percentage of urban population to total population increased
from 7% in 1901 to 26% in 2001 and to 48% in 2011.
The number of towns in Kerala increased from 159 in 2001 to 520
in 2011. Urbanization not only affects changes in dietary patterns within a
country, it also promotes changes and convergence across borders
(Schmidhuber, 2003). Amidst several socio-economic achievements and
impressive statistics of the development indicators, unsustainable and
CCCChapter IIhapter IIhapter IIhapter IIIIII –––– SocioSocioSocioSocio----Economic Profile and Consumption Economic Profile and Consumption Economic Profile and Consumption Economic Profile and Consumption Pattern: Changing Trends in KeralaPattern: Changing Trends in KeralaPattern: Changing Trends in KeralaPattern: Changing Trends in Kerala
LIFESTYLE DISEASES IN KERALA: AN ANALYSIS OF SOCIO-ECONOMIC STATUS, CONSUMPTION
PATTERN AND ADOLESCENT OBESITY IN KOTTAYAM DISTRICT 88
unplanned urban development is taking the state to severe tribulations in
environment and in human health (Raj and Azeez, 2010). The rate of
increase in the problem of obesity has been felt most dramatically in urban
settings (Rao et al, 2010). Though urbanization is an important aspect in the
process of economic and social development, it is associated with many
problems such as spread of consumerism, improper waste management in
towns, lack of social relation, over exploitation of natural resources etc.
3.1.15 Tourism
The tourism industry has taken Kerala to the global map with its
branding ‘God’s Own Country’. The brand ‘God's Own Country’ has
become popular around the world. Kerala has beautiful hills, valleys, lakes,
backwaters, lagoons and sea shores associated with rich heritage of art,
culture, indigenous medicines coupled with ideal climatic conditions create
a paradise for tourists. Today Kerala tourism is recognized as a pioneer and
trend setter in the country.
The rapid increase in the number of tourists in the state has a
tremendous impact on social, cultural and economic spheres of Kerala. The
effect of tourism on traditional societies is massive. Huge traveling
population has definitely brought about diverse cultural attributes and
behavioral patterns. Traditional or indigenous characteristics of the society
have been disappearing. The art, language, literature, luxuries, professions,
food habit, consumption pattern, dress, fashions etc have been showing
new trends due to contact with foreign tourists especially with western
society. Leisure industry is growing at a faster pace in Kerala. Modern
changes in the industry in the form of resorts, star hotels, ayurvedic
massage parlours, jungle safari, house boating, trekking amusement parks
etc cater to the needs of western tourists and which in turn results in inter-

CCCChapter IIhapter IIhapter IIhapter IIIIII –––– SocioSocioSocioSocio----Economic Profile and Consumption Economic Profile and Consumption Economic Profile and Consumption Economic Profile and Consumption Pattern: Changing Trends in KeralaPattern: Changing Trends in KeralaPattern: Changing Trends in KeralaPattern: Changing Trends in Kerala
LIFESTYLE DISEASES IN KERALA: AN ANALYSIS OF SOCIO-ECONOMIC STATUS, CONSUMPTION
PATTERN AND ADOLESCENT OBESITY IN KOTTAYAM DISTRICT 89
mingling and mixing of different cultures and social outlook in Kerala
(Thomas, 2007).
The share of Kerala in the nation’s tourist market has been
increasing in recent decades as represented in Table 3.18.
Table 3.18
Tourist Arrivals in Kerala (2005-11)
Year
Number of Foreign
Tourists arrivals in
Kerala
Number of Domestic
Tourists arrivals in
Kerala
2005 346499 5946423
2006 428534 6271724
2007 515808 6642941
2008 598929 7591250
2009 557258 7913537
2010 659265 8595075
2011 732985 9381455
Source: Department of tourism, Govt. of Kerala, 2012
The year 2010-2011 has been recorded as a year of revival
compared to the previous years. International Tourist arrival continued to
decline due to the impact of Global Economic crisis in the previous years.
But the year 2011 marked significant improvements. The number of
domestic tourists to Kerala in the year 2011-2012 was 9381455 against
8595075 in 2010-2011. It shows an increase of 9.14% over the previous
years.
Table 3.19 reveals that the tourism industry is a major contributor
to the NSDP of Kerala's economy.

CCCChapter IIhapter IIhapter IIhapter IIIIII –––– SocioSocioSocioSocio----Economic Profile and Consumption Economic Profile and Consumption Economic Profile and Consumption Economic Profile and Consumption Pattern: Changing Trends in KeralaPattern: Changing Trends in KeralaPattern: Changing Trends in KeralaPattern: Changing Trends in Kerala
LIFESTYLE DISEASES IN KERALA: AN ANALYSIS OF SOCIO-ECONOMIC STATUS, CONSUMPTION
PATTERN AND ADOLESCENT OBESITY IN KOTTAYAM DISTRICT 90
Table 3.19
Earning from Tourism in Kerala (Rs. in crores)
Year Foreign exchange
earning
Earning from
domestic tourists
Total revenue
(Direct, Indirect)
2002 705.67 3011.31 4931.00
2003 983.37 3492.68 5938.00
2004 1266.77 3881.92 6829
2005 1552.31 4281.42 7738
2006 1988.40 4891.94 9126.00
2007 2640.94 5978.65 11433.00
2008 3066.52 6832.13 13130.00
2009 2853.16 7122.18 13231.00
2010 3797.37 9282.68 17348
2011 4221.99 10131.97 19037
Source: Department of tourism, Govt. of Kerala, 2012
The total revenue generated from tourism comes to Rs. 19037
crores showing an increase of 9.73 per cent over the last year and the
tourism contribution to state’s GDP is around 9 per cent. The total
employment generated from tourism is about 10 lakhs including skilled,
semi-skilled and unskilled employment.
Tourism industry in Kerala not only facilitates infrastructure
development but also help in balanced and sustainable regional growth by
generating income and creating employment opportunities. However,
tourism is associated with many problems such as high infiltration of
foreign culture to our society, threat of pollution, entry of consumerism etc.
Threats to the tourism industry in Kerala

CCCChapter IIhapter IIhapter IIhapter IIIIII –––– SocioSocioSocioSocio----Economic Profile and Consumption Economic Profile and Consumption Economic Profile and Consumption Economic Profile and Consumption Pattern: Changing Trends in KeralaPattern: Changing Trends in KeralaPattern: Changing Trends in KeralaPattern: Changing Trends in Kerala
LIFESTYLE DISEASES IN KERALA: AN ANALYSIS OF SOCIO-ECONOMIC STATUS, CONSUMPTION
PATTERN AND ADOLESCENT OBESITY IN KOTTAYAM DISTRICT 91
1. Global warming and changing weather pattern
2. Global economic recession
3. Differing monsoon pattern
4. Threat of pollution
5. Opening of Srilanka as a safe tourist destination.
Apart from the scenic beauty and cultural heritage, tourists are
being attracted to Kerala by Ayurveda, Yoga, Kathakali, Martial arts, rich
Folklore and art forms, different festivals and above all facilities for
research in Malayalam and Sanskrit (Vijayakumar, 1993).
The economic impact of tourism on state’s economy is reflected in
its capacity to generate income, foreign exchange and employment.
Besides, it supports to regional development by providing infrastructural
facilities also. Human resource development is another major area in
tourism development.
3.1.16 Migration
Migration has been playing an important role in determining
economic, social and cultural changes since many decades in Kerala. In
2008-09, 20% of total emigrants from India were from Kerala. The state
has witnessed a steadily growing trend in terms of emigrants. However, the
growth in inward remittances is much higher than the growth in emigrants
which indicates that more remittances are being sent per emigrant over
time. During 1990s the growth of remittances was much faster than the
growth of Kerala’s NSDP. Kerala tops other states in the matter of receipt
of remittances. Remittances have, if properly harnessed multiplier effects
on economic and social development. In a densely populated, land scarce,

CCCChapter IIhapter IIhapter IIhapter IIIIII –––– SocioSocioSocioSocio----Economic Profile and Consumption Economic Profile and Consumption Economic Profile and Consumption Economic Profile and Consumption Pattern: Changing Trends in KeralaPattern: Changing Trends in KeralaPattern: Changing Trends in KeralaPattern: Changing Trends in Kerala
LIFESTYLE DISEASES IN KERALA: AN ANALYSIS OF SOCIO-ECONOMIC STATUS, CONSUMPTION
PATTERN AND ADOLESCENT OBESITY IN KOTTAYAM DISTRICT 92
industrially backward economy like Kerala migration has been the basic
factor which determines, the economic well-being of the people. One major
factor that contributes to higher consumer expenditure in Kerala is the large
scale migration of Keralite workers to foreign countries, especially to the
Gulf. Migration and the flow of remittances have resulted in an
unprecedented economic changes in Kerala’s economy since the mid, of
1970’s (Prakash, 1998). Empirical casual tests undertaken in the Kerala
region indicate that higher remittance levels have led to higher per capita
income and higher levels of investment which are considered key variables
affecting poverty reduction (UNCTAD, 2010). Table 3.20 shows total
remittances to Kerala.
Table 3.20
Total Remittances to Kerala
Year Remittance
(crores)
1998 10817
2003 18465
2008 43288
2011 49695
Source: Economic Review, Govt. of Kerala, 2011
The infusion of remittances has considerable impact on the Kerala
economy. Remittances were Rs.63315 per household in 2011 and Rs.57227
per household in 2008. The net domestic product (NSDP) for Kerala was
Rs. 246212.72 crores for 2010-11. The remittance (Rs.49695 crores) comes
to about 20 per cent of the NSDP of Kerala in 2011. The remittances were
used by households for subsistence, acquisition or renovation of buildings,
CCCChapter IIhapter IIhapter IIhapter IIIIII –––– SocioSocioSocioSocio----Economic Profile and Consumption Economic Profile and Consumption Economic Profile and Consumption Economic Profile and Consumption Pattern: Changing Trends in KeralaPattern: Changing Trends in KeralaPattern: Changing Trends in KeralaPattern: Changing Trends in Kerala
LIFESTYLE DISEASES IN KERALA: AN ANALYSIS OF SOCIO-ECONOMIC STATUS, CONSUMPTION
PATTERN AND ADOLESCENT OBESITY IN KOTTAYAM DISTRICT 93
purchase of land and vehicles, education and health care of members of the
household, marriage of daughters, and acquisition of consumer durables.
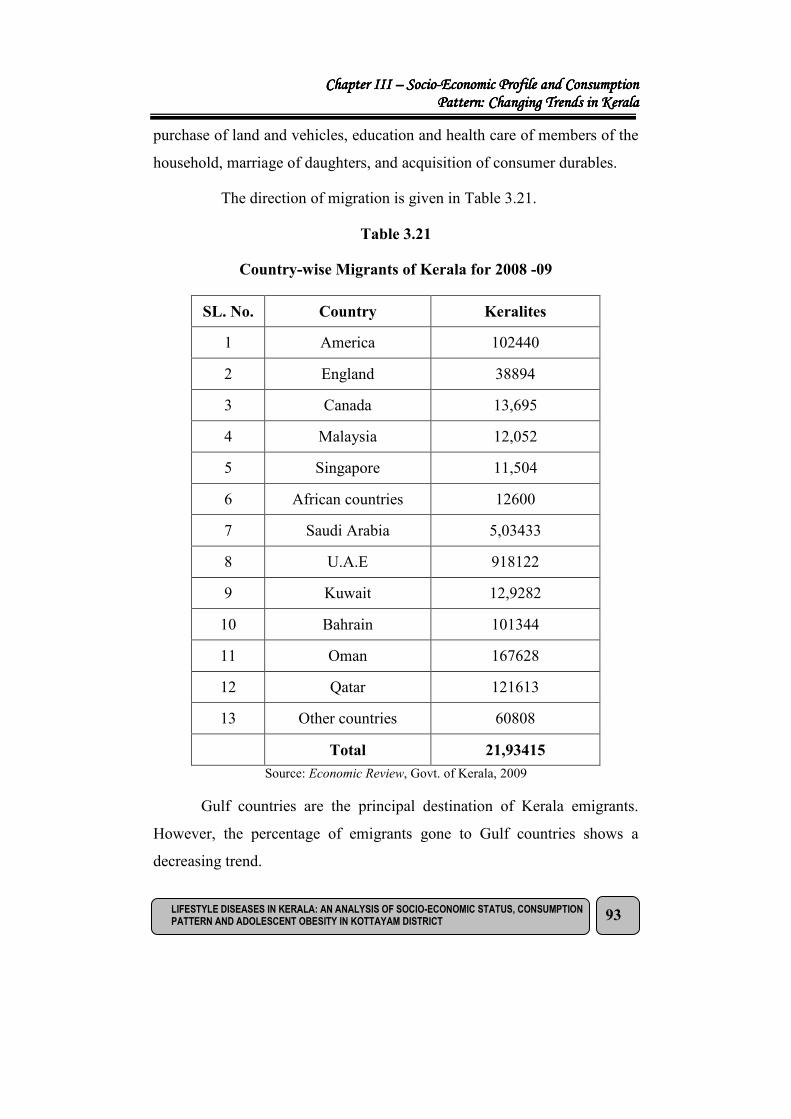
The direction of migration is given in Table 3.21.
Table 3.21
Country-wise Migrants of Kerala for 2008 -09
SL. No. Country Keralites
1 America 102440
2 England 38894
3 Canada 13,695
4 Malaysia 12,052
5 Singapore 11,504
6 African countries 12600
7 Saudi Arabia 5,03433
8 U.A.E 918122
9 Kuwait 12,9282
10 Bahrain 101344
11 Oman 167628
12 Qatar 121613
13 Other countries 60808
Total 21,93415
Source: Economic Review, Govt. of Kerala, 2009
Gulf countries are the principal destination of Kerala emigrants.
However, the percentage of emigrants gone to Gulf countries shows a
decreasing trend.

CCCChapter IIhapter IIhapter IIhapter IIIIII –––– SocioSocioSocioSocio----Economic Profile and Consumption Economic Profile and Consumption Economic Profile and Consumption Economic Profile and Consumption Pattern: Changing Trends in KeralaPattern: Changing Trends in KeralaPattern: Changing Trends in KeralaPattern: Changing Trends in Kerala
LIFESTYLE DISEASES IN KERALA: AN ANALYSIS OF SOCIO-ECONOMIC STATUS, CONSUMPTION
PATTERN AND ADOLESCENT OBESITY IN KOTTAYAM DISTRICT 94
Migration has improved the household management efficiency of
more than a million housewives, led to widening of income disparities,
empowered some strong minority section economically and politically and
revolutionalized consumption pattern and spending habits. The remittance
income, particularly from the Middle East, has improved and diversified
the household consumption decision and has accelerated the process of
educational and epidemiological transition in the state (Ibrahim, 2008).
The major factor for the relative affluence and associated lifestyle is the
emigration phenomenon and hence it is one major factor responsible for the
shifts in the diseases pattern of Kerala. Higher incidence of hypertension,
diabetes, heart diseases found among emigrant households could be
attributed largely to their food and living habits. The gulf emigrants
generally eat more fat intensive non-vegetarian items as well as finely
processed food articles. Consumption pattern of emigrant household shows
that they spend larger amount on milk, meat, fish and bakery items as
compared to non-emigrant households. The demonstration effects of the
gulf man’s style of living have engendered similar tendencies among non-
emigrant and poor households as well (Ibrahim, 2009).
3.1.17 Food Culture of Kerala
Kerala may be probably being the one society in India that has
undergone profound changes in the food culture in the last few decades. In
the past, Keralites met the basic nutritional needs from their homes where
there was plenty of rice and a lot of fruits and vegetables in the kitchen
garden. There were ‘Nellara’ (store house of wheat and rice) pazhapura
(store house for fruits) where bananas, jack fruits and papaya used to be
plenty and ‘kizhangu pura where a lot of tuber crops were stored. But today
the food diversity in Kerala has got reduced considerably. The variety of
CCCChapter IIhapter IIhapter IIhapter IIIIII –––– SocioSocioSocioSocio----Economic Profile and Consumption Economic Profile and Consumption Economic Profile and Consumption Economic Profile and Consumption Pattern: Changing Trends in KeralaPattern: Changing Trends in KeralaPattern: Changing Trends in KeralaPattern: Changing Trends in Kerala
LIFESTYLE DISEASES IN KERALA: AN ANALYSIS OF SOCIO-ECONOMIC STATUS, CONSUMPTION
PATTERN AND ADOLESCENT OBESITY IN KOTTAYAM DISTRICT 95
cereals has narrowed to one or two and eating ready made fast foods has
become the culture of people in Kerala. Food habits of the people of
Kerala have gone from bad to worse with the easy availability of calorie
rich junk food. Advent of preserved and junk food* into the daily diets
replacing locally available nutritious items has far reaching consequences
on the health of the younger generation. The demonstration effect of such
practices has affected the dietary habits of the poor household too. Western
restaurant chains, like Mc Donalds, KFC and Pizza Hut can be seen not
only in metro cities but in urban city centers too. It has been a fashion
rather than need that people go out to have their food. The neo rich society
opts for exotic packed and fast food rather than indigenous nutrient rich and
diverse food items. The traditional diet which was predominantly
vegetarian and fish based has given way to more expensive meat based
food in Kerala since 1990. The continuous increase in consumer
expenditure is shown in Table 3.22.
* An informal term for food that is of little nutritional value and often high in fat, sugar and
calories.

CCCChapter IIhapter IIhapter IIhapter IIIIII –––– SocioSocioSocioSocio----Economic Profile and Consumption Economic Profile and Consumption Economic Profile and Consumption Economic Profile and Consumption Pattern: Changing Trends in KeralaPattern: Changing Trends in KeralaPattern: Changing Trends in KeralaPattern: Changing Trends in Kerala
LIFESTYLE DISEASES IN KERALA: AN ANALYSIS OF SOCIO-ECONOMIC STATUS, CONSUMPTION
PATTERN AND ADOLESCENT OBESITY IN KOTTAYAM DISTRICT 96
Table 3.22
Tends in Average Consumer Expenditure per Person for a Period of 30
Days in Various NSS Rounds
Year and Round of
NSS Kerala India
Percentage of
variation of
Kerala over
India
1.Rural
1990 – 91 (46th )
1993 – 94 (50th )
2000 – 01 (56th )
2004 – 05 (61st )
2006 – 07 (63rd )
2007 - 08 (64th)
2009-10(66th)
2. Urban
1990 – 91 (46th )
1993 – 94 (50th )
2000 – 01 (56th )
2004 – 05 (61st )
2006 – 07 (63rd )
2007 - 08 (64th )
2009 - 10 (66th )
261.85
390.40
841.31
1013.15
1250.00
1383.00
1835.00
369.36
493.50
1203.65
1290.89
1681.00
1948.00
2413.00
202.12
281.60
494.91
558.78
695.00
772.00
1053.64
317.75
457.70
914.58
1052.36
1312.00
1472.00
1984.46
29.5
38.6
70.0
81.3
80.0
79.1
74.1
16.2
7.80
31.6
22.7
28.1
32.3
21.5 Source: Economic Review (various years), Govt. of Kerala.
Average Monthly Per Capita Consumer Expenditure (AMPCE) of
rural population of Kerala registered a growth rate of 600% during 1990 –
2010 whereas India’s AMPCE of rural people grew only by 422% during
the same period. In urban areas too Kerala’s AMPCE remained higher than
India’s AMPCE. Kerala outstrips all other Indian states in the case of
average monthly per capita consumer expenditure which is clearly shown
in Table 3.23. Kerala ranks first position with respect to MPCE in rural and
urban areas in India.

CCCChapter IIhapter IIhapter IIhapter IIIIII –––– SocioSocioSocioSocio----Economic Profile and Consumption Economic Profile and Consumption Economic Profile and Consumption Economic Profile and Consumption Pattern: Changing Trends in KeralaPattern: Changing Trends in KeralaPattern: Changing Trends in KeralaPattern: Changing Trends in Kerala
LIFESTYLE DISEASES IN KERALA: AN ANALYSIS OF SOCIO-ECONOMIC STATUS, CONSUMPTION
PATTERN AND ADOLESCENT OBESITY IN KOTTAYAM DISTRICT 97
Table 3.23
Average Monthly Per Capita Consumer Expenditure
State
Rural Urban
Average
MPCE (Rs) Rank
Average
MPCE (Rs) Rank
Andrapradesh 816 8 1550 6
Assam 799 10 1452 9
Bihar 598 14 1080 16
Chattisgarh 582 16 1503 7
Gujrat 875 4 1471 8
Haryana 1034 3 1628 5
Jaharkhant 592 15 1395 12
Karnataka 819 7 1668 3
Kerala 1383 1 1948 1
Madhya Pradesh 634 13 1190 14
Maharashtra 868 5 1709 2
Orissa 559 17 1438 10
Punjab 1273 2 1633 4
Rajastan 801 9 1265 13
Tamil Nadu 834 6 1410 11
Uttarpradesh 680 12 1121 15
West Bengal 702 11 1452 9
All India 772 1472
Source: NSSO-64th round

CCCChapter IIhapter IIhapter IIhapter IIIIII –––– SocioSocioSocioSocio----Economic Profile and Consumption Economic Profile and Consumption Economic Profile and Consumption Economic Profile and Consumption Pattern: Changing Trends in KeralaPattern: Changing Trends in KeralaPattern: Changing Trends in KeralaPattern: Changing Trends in Kerala
LIFESTYLE DISEASES IN KERALA: AN ANALYSIS OF SOCIO-ECONOMIC STATUS, CONSUMPTION
PATTERN AND ADOLESCENT OBESITY IN KOTTAYAM DISTRICT 98
3.2 Change in Consumption Pattern from Food to Non-Food items
With economic development, there has been a change in
consumption pattern from food to non food items. It has been observed that
with the growth of the economy expenditure on non food items keeps on
increasing. Available data on consumption pattern in Kerala during the last
three decades substantiate this contention. Among the non-food items,
expenditure on clothing and footwear, miscellaneous goods and services
and durable goods have shown a significant increase (Harikumar and
Sudhakar, 2008). Tables 3.24 and 3.25 show respectively the changing
trends in food and non-food items in Kerala.
Table 3.24
Trends in Percentage Distribution of Food and Non-food in Various
NSS Rounds, Kerala (percentage)
Years and Round of
NSS
Rural Urban
Food Non -food Food Non -food
1990 – 91 (46th ) 63.29 36.71 49.66 50.34
1993 – 94 (50th ) 60.45 39.55 53.90 46.10
2000 – 01 (56th ) 49.63 50.37 43.22 56.78
2004 – 05 (61st ) 44.97 55.03 39.97 60.03
2006 – 07 (63rd ) 40.43 59.57 34.43 65.57
2007 – 08 (64th) 40.79 59.21 36.10 63.90
2009 – 2010 (66th ) 45.94 54.05 40.2 59.81
Source: Economic Review,(Various Years), Govt. of Kerala.
CCCChapter IIhapter IIhapter IIhapter IIIIII –––– SocioSocioSocioSocio----Economic Profile and Consumption Economic Profile and Consumption Economic Profile and Consumption Economic Profile and Consumption Pattern: Changing Trends in KeralaPattern: Changing Trends in KeralaPattern: Changing Trends in KeralaPattern: Changing Trends in Kerala
LIFESTYLE DISEASES IN KERALA: AN ANALYSIS OF SOCIO-ECONOMIC STATUS, CONSUMPTION
PATTERN AND ADOLESCENT OBESITY IN KOTTAYAM DISTRICT 99
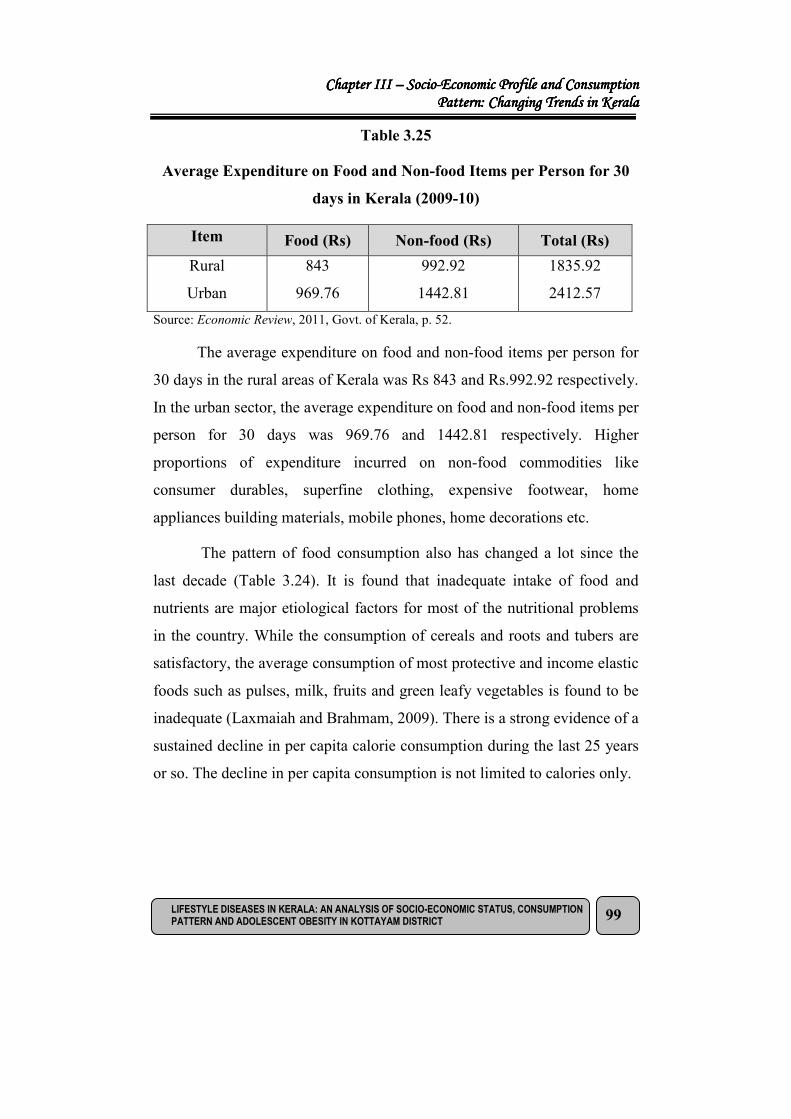
Table 3.25
Average Expenditure on Food and Non-food Items per Person for 30
days in Kerala (2009-10)
Item Food (Rs) Non-food (Rs) Total (Rs)
Rural
Urban
843
969.76
992.92
1442.81
1835.92
2412.57
Source: Economic Review, 2011, Govt. of Kerala, p. 52.
The average expenditure on food and non-food items per person for
30 days in the rural areas of Kerala was Rs 843 and Rs.992.92 respectively.
In the urban sector, the average expenditure on food and non-food items per
person for 30 days was 969.76 and 1442.81 respectively. Higher
proportions of expenditure incurred on non-food commodities like
consumer durables, superfine clothing, expensive footwear, home
appliances building materials, mobile phones, home decorations etc.
The pattern of food consumption also has changed a lot since the
last decade (Table 3.24). It is found that inadequate intake of food and
nutrients are major etiological factors for most of the nutritional problems
in the country. While the consumption of cereals and roots and tubers are
satisfactory, the average consumption of most protective and income elastic
foods such as pulses, milk, fruits and green leafy vegetables is found to be
inadequate (Laxmaiah and Brahmam, 2009). There is a strong evidence of a
sustained decline in per capita calorie consumption during the last 25 years
or so. The decline in per capita consumption is not limited to calories only.
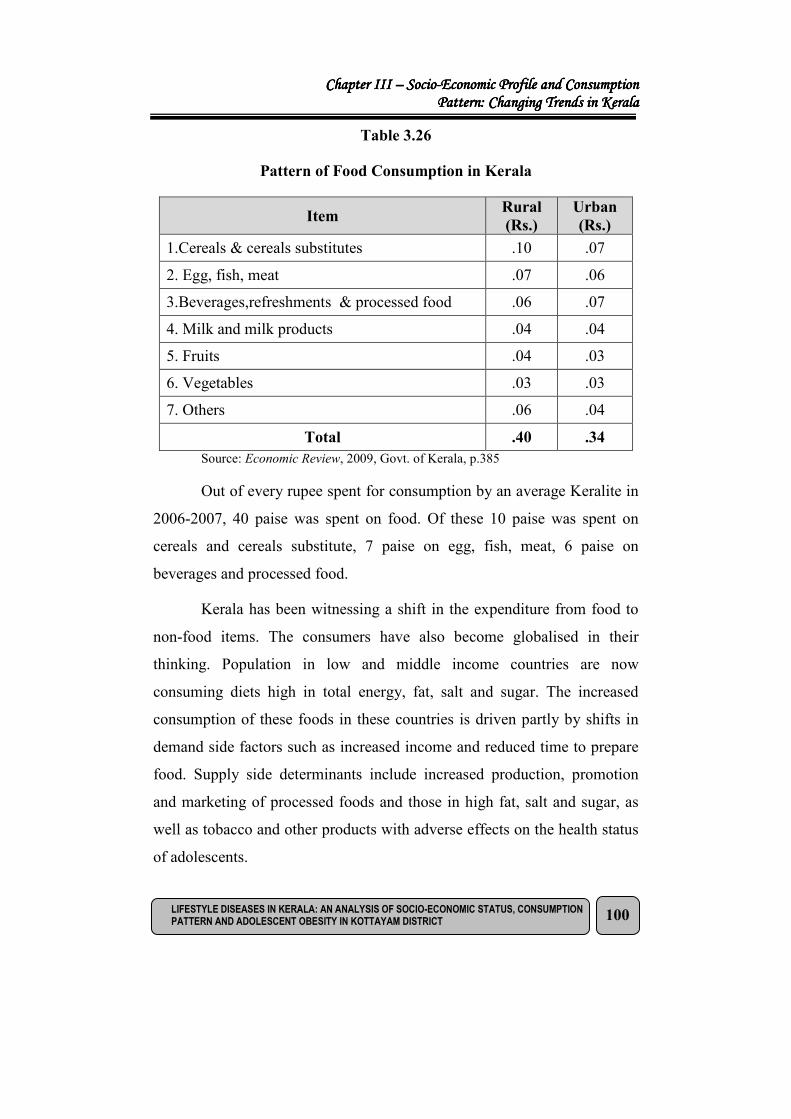
CCCChapter IIhapter IIhapter IIhapter IIIIII –––– SocioSocioSocioSocio----Economic Profile and Consumption Economic Profile and Consumption Economic Profile and Consumption Economic Profile and Consumption Pattern: Changing Trends in KeralaPattern: Changing Trends in KeralaPattern: Changing Trends in KeralaPattern: Changing Trends in Kerala
LIFESTYLE DISEASES IN KERALA: AN ANALYSIS OF SOCIO-ECONOMIC STATUS, CONSUMPTION
PATTERN AND ADOLESCENT OBESITY IN KOTTAYAM DISTRICT 100
Table 3.26
Pattern of Food Consumption in Kerala
Item Rural
(Rs.)
Urban
(Rs.)
1.Cereals & cereals substitutes .10 .07
2. Egg, fish, meat .07 .06
3.Beverages,refreshments & processed food .06 .07
4. Milk and milk products .04 .04
5. Fruits .04 .03
6. Vegetables .03 .03
7. Others .06 .04
Total .40 .34
Source: Economic Review, 2009, Govt. of Kerala, p.385
Out of every rupee spent for consumption by an average Keralite in
2006-2007, 40 paise was spent on food. Of these 10 paise was spent on
cereals and cereals substitute, 7 paise on egg, fish, meat, 6 paise on
beverages and processed food.
Kerala has been witnessing a shift in the expenditure from food to
non-food items. The consumers have also become globalised in their
thinking. Population in low and middle income countries are now
consuming diets high in total energy, fat, salt and sugar. The increased
consumption of these foods in these countries is driven partly by shifts in
demand side factors such as increased income and reduced time to prepare
food. Supply side determinants include increased production, promotion
and marketing of processed foods and those in high fat, salt and sugar, as
well as tobacco and other products with adverse effects on the health status
of adolescents.

CCCChapter IIhapter IIhapter IIhapter IIIIII –––– SocioSocioSocioSocio----Economic Profile and Consumption Economic Profile and Consumption Economic Profile and Consumption Economic Profile and Consumption Pattern: Changing Trends in KeralaPattern: Changing Trends in KeralaPattern: Changing Trends in KeralaPattern: Changing Trends in Kerala
LIFESTYLE DISEASES IN KERALA: AN ANALYSIS OF SOCIO-ECONOMIC STATUS, CONSUMPTION
PATTERN AND ADOLESCENT OBESITY IN KOTTAYAM DISTRICT 101
References
1. Ahluwalia, Montek S (2002), “State Level Performances Under
Economic Reforms in India”, in Anne O. Krueger (ed.), Economic
Policy Reforms and the Indian Economy, Oxford University Press,
New Delhi, pp. 91-128.
2. Economic Review (2010), Kerala State Planning Board,
Thiruvananthapuram, p.436.
3. Economic Review (2011), Kerala State Planning Board,
Thiruvananthapuram, p.100.
4. Economic Review (2011a), Kerala State Planning Board,
Thiruvananthapuram, p.312.
5. Harikumar,S and Sudhakar, Dhanya. (2008), “Consumption
Expenditure and Health Status : The case of Kerala”, in Meera Bai
M (ed.), Kerala Economy Slumber to performance, Serials
Publications, New Delhi, p. 276.
6. Ibrahim, P. (2008), “Impact of Emigration, on the Health Status: A
case study of Kerala”, Paper presented at the National conference
on Health Economics, January, 29-30, Nehru Arts and Science
College, Kanchangad.
7. Ibrahim, P. (2009), “Impact of Gulf Migration on the health status
of Kerala”, in A. Asokan (ed.), Perspectives of Health Economics,
Serials Publications, New Delhi, pp. 167-180.
8. Kannan, K.P. (2006), “Kerala’s Development Challenges”, in R.
Sathanumoorthy (ed.), Kerala Economy Achievements and
Challenges, lcfai University Press, Hyderabad, p. 278.

CCCChapter IIhapter IIhapter IIhapter IIIIII –––– SocioSocioSocioSocio----Economic Profile and Consumption Economic Profile and Consumption Economic Profile and Consumption Economic Profile and Consumption Pattern: Changing Trends in KeralaPattern: Changing Trends in KeralaPattern: Changing Trends in KeralaPattern: Changing Trends in Kerala
LIFESTYLE DISEASES IN KERALA: AN ANALYSIS OF SOCIO-ECONOMIC STATUS, CONSUMPTION
PATTERN AND ADOLESCENT OBESITY IN KOTTAYAM DISTRICT 102
9. Kerala Development Report (2008), Government of Kerala, p.32.
10. Kerala Development Report (2008a), Government of Kerala, p.33.
11. Kerala Development Report (2008b), Government of Kerala, p.84.
12. Kurian, Tessy (2008), “Age of Aging in Kerala”, in Meera Bai
M.(ed.), Kerala Economy Slumber to performance, Serials
Publications, New Delhi, p. 232
13. Laxmaiah, A. and Brahmam, G.N.V. (2009), “Nutritional Status of
Rural Populations in India”, Yojana, Vol.53, October, pp. 27-30.
14. Mahadevan, R and Sumangala, M. (1987), Social Development,
cultural change and Fertility Decline, Sage Publications, New
Delhi, p.18.
15. Prakash, B.A. (1998). “Gulf Migration and its Economic Impact -
The Kerala experience”, Economic and Political Weekly, Vol.33,
No.50, p.32009.
16. Prakash, B.A. (2006), “Fifty years of Kerala Economy (1956-2006)”,
Paper prepared on the occasion of golden Jubilee celebrations,
Department of Economics, university of Kerala,
Thiruvananthapuram, 2006.
17. Pushpangadan, K. (2006), “Remittances, Consumption and
Economic Growth in Kerala: 1980 – 2000”, in R.Sathanumoorthy
(ed.), Kerala Economy achievements and challenges, The ICFAI
University Press, Hyderabad, p.35.
18. Raj, P.P., Nikhil and Azeez, P.A. (2010), “Deterioration health
status of Kerala State, India: An environmental and Cultural
diagnosis”, Seronica, Vol.1 No.1, pp. 23 – 26.

CCCChapter IIhapter IIhapter IIhapter IIIIII –––– SocioSocioSocioSocio----Economic Profile and Consumption Economic Profile and Consumption Economic Profile and Consumption Economic Profile and Consumption Pattern: Changing Trends in KeralaPattern: Changing Trends in KeralaPattern: Changing Trends in KeralaPattern: Changing Trends in Kerala
LIFESTYLE DISEASES IN KERALA: AN ANALYSIS OF SOCIO-ECONOMIC STATUS, CONSUMPTION
PATTERN AND ADOLESCENT OBESITY IN KOTTAYAM DISTRICT 103
19. Rajan, Irudaya (1989), “Aging in Kerala, one more population
problem”, Asia Pacific Population Journal, Vol. 4, No.2, pp. 19-48.
20. Rao, K.N. (2004), “Trends in Health status in Andhra Pradesh: An
empirical study”, Indian Economic Journal, Vol. 5, No.1, pp. 81-
88.
21. Rao,Jahanavi A., Sultana, Goubar., Ishaq, B. Mohammed and
Prakash, K. Vanitha (2010), “Childhood Obesity and its
prevention”, Health, Vol. 88, No.10, p.5.
22. Rout, Himanshu Sekhar and Nayak, Narayana Chandra (2007),
“Health and Health Economics: A conceptual Frame Work”, in
Himanshu Sekhar Rout and Prasant Kumar Panda (eds.), Health
Economics in India, New Century Publications, New Delhi, p.13.
23. Schmidhuber, Josef (2003), Paper presentation for FAO. Scientific
workshop on globalization of the food system in Rome, October 8-
10, 2003.
24. Thomas, Sibi (2007), “Social Cultural Dualism”, Ph.D. Thesis,
M.G. University, Kottayam.
25. Vijayakumar, B. (1993), “Impact of Tourism Development in
Kovalam”, M.Phil. thesis, University of Kerala.


