Socio-Economic Impact Assessment of Integrated Watershed ...
12
Journal of Economics and Sustainable Development www.iiste.org ISSN 2222-1700 (Paper) ISSN 2222-2855 (Online) Vol.6, No.9, 2015 202 Socio-Economic Impact Assessment of Integrated Watershed Management in Sheka Watershed, Ethiopia. G/mariam Yaebiyo 1* Yayneshet Tesfay 2 Dereje Assefa 2 1.Mekelle Agricultural Research Center, Mekelle, Ethiopia 2.International Livestock Research Institute, Mekelle, Ethiopia 2.Department of Crop Science at Mekelle University, Mekelle, Ethiopia * E-mail of the corresponding author: [email protected] Abstract Integrated watershed management (IWSM) was taken as the basic operational unit to rehabilitate degraded watershed and improve agricultural productivity in Ethiopia. However, its effectiveness was rarely evaluated. Therefore, this study assessed the contribution of IWSM in selected socio-economic benefits in Sheka watershed, Ethiopia. Crop grain yield measurements and questionnaire survey data collection methods were employed. Statistical methods were used to analyze the data. The results revealed that there were significantly higher teff and sorghum grain yields in the treated sub-watershed than the untreated one. Milk yield of local dairy cow and honey bee yield was increased by 12.3% and 24.24%, respectively, after IWSM. Annual household income of downstream beneficiaries of the watershed was significantly higher than upstream beneficiaries. The highest annual income was recorded from the users of both improved livestock and irrigation. The most determinant factors for household annual income were irrigation access, livestock number, cultivated land and off-farm income. The average contribution of income generating activities of IWSM in household annual income was 31.3%. Therefore, IWSM is not only effective in increasing crop and livestock production but also it has high contribution in household annual income. But high focus should be given to the upper beneficiaries of the watershed so as to minimize the income difference between the upper and lower beneficiaries. Thus, it is better to introduce IWSM in to the untreated watershed. Key words: Integrated watershed management, upstream, downstream, Sheka watershed. 1. Introduction Watershed degradation in Ethiopia is one of the main constraints for agricultural productivity, resulting from the interaction of natural and anthropogenic factors, including erratic rainfall, rugged topography and unsustainable land management practices, both in areas of food crops and in grazing lands. Watershed degradation not only decreased land productivity but also increased social problems (Sertse, 2007, Darghouth et al., 2008). Soil erosion is one of the features of watershed degradation. In Ethiopia, soil erosion by water constitutes the most widespread and damaging process of soil degradation (Woldeamlak, 2003). It is estimated that fertile topsoil is lost at a rate of one billion cubic meters per year from all over the country, resulting in massive environmental degradation and constituting a serious threat to sustainable agriculture and forestry (Bishaw and Abdu, 2003). Several governmental and non-governmental organizations have launched integrated watershed development projects to tackle some of these generic problems (Yoganand and Tesfa, 2006). They emphasize the need to go beyond soil and water conservation (SWC) technologies to include multiple crop-livestock interventions that support and diversify livelihood opportunities for the poor and create synergies between targeted technologies, policies and institutions to improve productivity, resource use sustainability and market access (Kerr, 2001). In Ethiopia, watershed development planning has been started in 1980’s with large watersheds (MoARD, 2005). However, large efforts remained mostly unsatisfactory due to lack of effective community participation, limited sense of responsibility on assets created and unmanageable planning units (MoARD, 2005). After some years experience, the ministry of agriculture and WFP technical staff developed simple participatory and community-based watershed planning guidelines which includes integrated natural resource management interventions, productivity intervention measures and small scale community infrastructures (MoARD, 2005). The study area is one of the integrated watershed management (IWSM) projects developed in Ethiopia. Before IWSM, the watershed was known for its high erosion and nutrient depletion resulting in gully formation, silted up of cultivated and grazing lands of its downstream part. Consequently, the production and productivity of the land decreased to the extent of disabling the farming community to cover their daily food throughout the year (District Agricultural Office, unpublished). Therefore, since 1995, IWSM approach which includes physical and biological SWC measures together with enclosures and income generating technologies was launched by the integration of Relief Society of Tigray (REST) and Kolla Tembien Agricultural and Rural Development Office to overcome this problem. However, empirical data on the contribution of these measures in socio-economic benefits are lacking because no scientific research has been done in the study area. Hence, applying scientific assessment and measuring of the actual benefits gained so far by the community will create opportunity to
Transcript of Socio-Economic Impact Assessment of Integrated Watershed ...

Journal of Economics and Sustainable Development www.iiste.org
ISSN 2222-1700 (Paper) ISSN 2222-2855 (Online)
Vol.6, No.9, 2015
202
Socio-Economic Impact Assessment of Integrated Watershed
Management in Sheka Watershed, Ethiopia.
G/mariam Yaebiyo1*
Yayneshet Tesfay2 Dereje Assefa
2
1.Mekelle Agricultural Research Center, Mekelle, Ethiopia
2.International Livestock Research Institute, Mekelle, Ethiopia
2.Department of Crop Science at Mekelle University, Mekelle, Ethiopia *E-mail of the corresponding author: [email protected]
Abstract
Integrated watershed management (IWSM) was taken as the basic operational unit to rehabilitate degraded
watershed and improve agricultural productivity in Ethiopia. However, its effectiveness was rarely evaluated.
Therefore, this study assessed the contribution of IWSM in selected socio-economic benefits in Sheka watershed,
Ethiopia. Crop grain yield measurements and questionnaire survey data collection methods were employed.
Statistical methods were used to analyze the data. The results revealed that there were significantly higher teff
and sorghum grain yields in the treated sub-watershed than the untreated one. Milk yield of local dairy cow and
honey bee yield was increased by 12.3% and 24.24%, respectively, after IWSM. Annual household income of
downstream beneficiaries of the watershed was significantly higher than upstream beneficiaries. The highest
annual income was recorded from the users of both improved livestock and irrigation. The most determinant
factors for household annual income were irrigation access, livestock number, cultivated land and off-farm
income. The average contribution of income generating activities of IWSM in household annual income was
31.3%. Therefore, IWSM is not only effective in increasing crop and livestock production but also it has high
contribution in household annual income. But high focus should be given to the upper beneficiaries of the
watershed so as to minimize the income difference between the upper and lower beneficiaries. Thus, it is better
to introduce IWSM in to the untreated watershed.
Key words: Integrated watershed management, upstream, downstream, Sheka watershed.
1. Introduction Watershed degradation in Ethiopia is one of the main constraints for agricultural productivity, resulting from the
interaction of natural and anthropogenic factors, including erratic rainfall, rugged topography and unsustainable
land management practices, both in areas of food crops and in grazing lands. Watershed degradation not only
decreased land productivity but also increased social problems (Sertse, 2007, Darghouth et al., 2008). Soil
erosion is one of the features of watershed degradation. In Ethiopia, soil erosion by water constitutes the most
widespread and damaging process of soil degradation (Woldeamlak, 2003). It is estimated that fertile topsoil is
lost at a rate of one billion cubic meters per year from all over the country, resulting in massive environmental
degradation and constituting a serious threat to sustainable agriculture and forestry (Bishaw and Abdu, 2003).
Several governmental and non-governmental organizations have launched integrated watershed
development projects to tackle some of these generic problems (Yoganand and Tesfa, 2006). They emphasize the
need to go beyond soil and water conservation (SWC) technologies to include multiple crop-livestock
interventions that support and diversify livelihood opportunities for the poor and create synergies between
targeted technologies, policies and institutions to improve productivity, resource use sustainability and market
access (Kerr, 2001).
In Ethiopia, watershed development planning has been started in 1980’s with large watersheds
(MoARD, 2005). However, large efforts remained mostly unsatisfactory due to lack of effective community
participation, limited sense of responsibility on assets created and unmanageable planning units (MoARD, 2005).
After some years experience, the ministry of agriculture and WFP technical staff developed simple participatory
and community-based watershed planning guidelines which includes integrated natural resource management
interventions, productivity intervention measures and small scale community infrastructures (MoARD, 2005).
The study area is one of the integrated watershed management (IWSM) projects developed in Ethiopia.
Before IWSM, the watershed was known for its high erosion and nutrient depletion resulting in gully formation,
silted up of cultivated and grazing lands of its downstream part. Consequently, the production and productivity
of the land decreased to the extent of disabling the farming community to cover their daily food throughout the
year (District Agricultural Office, unpublished). Therefore, since 1995, IWSM approach which includes physical
and biological SWC measures together with enclosures and income generating technologies was launched by the
integration of Relief Society of Tigray (REST) and Kolla Tembien Agricultural and Rural Development Office
to overcome this problem. However, empirical data on the contribution of these measures in socio-economic
benefits are lacking because no scientific research has been done in the study area. Hence, applying scientific
assessment and measuring of the actual benefits gained so far by the community will create opportunity to
Journal of Economics and Sustainable Development www.iiste.org
ISSN 2222-1700 (Paper) ISSN 2222-2855 (Online)
Vol.6, No.9, 2015
203
improve and/or continue the existing IWSM interventions in the study area and other parts of the country with
similar agro-ecological and socioeconomic conditions. Therefore, this study was carried out to assess the impact
of IWSM technologies on crop and livestock production and evaluate its contribution to household annual
income in the upper and lower beneficiaries of the watershed.
2. Materials and methods
2.1. Description of the Study Area
This study was conducted at Sheka watershed in kolla Tembien district, Tigray, Ethiopia as shown in figure 1.
The watershed is located 130 km far away from Mekelle to the North-West direction with 13041
’42.1
’’-
13043
’26.3
’’ latitude and 38
049
’20.6’’- 38
049’21.5’’ longitude. According to unpublished secondary data of the
agricultural and rural development office, total annual rainfall of the area ranges from 500 mm to 800 mm,
which is uni-modal pattern and occurs in the months of June up to half of September. The mean annual
temperature of the area is 240
c, with a minimum of 170
c and a maximum of 300
c. Its altitude ranges from 1763 up
to 2032 m.a.s.l. According to agro climatic zonation of Ethiopia, it is categorized as Dry Weina-Dega zone. The
soil types are mostly leptosols and cambisols (BoFED, 2003).
Figure 1: Location of the study area
Total population of the study site was 6553, out of which, 50.5% were female. There were about 1150
households, with 226 female headed. Accordingly, the average size of the households was 5.7 persons. From the
total population of the site, 32.26% were beneficiaries of the watershed (District Agricultural Office,
Unpublished). Crop-livestock integrated farming system is common in the study area where crop husbandry is
the most important component of the livelihood of the farmers. The area was known for livestock production.
2.2. Measurement of Major Crops Grain Yield
So as to know the impact of IWSM on crop grain yield, the grain yield of three types of crops (maize, teff and
sorghum) from each of treated and untreated sub-watersheds with four replications in each sub-watershed was
weighted during harvesting time of the farmers. The sample of each crop was taken from a plot of 5m by 10m
(50m2) formed by systematic random sampling on transect walk of the two sub-watersheds. It was systematic
because similar slope and varieties of crop (local varieties) were considered for each type of crop in order to
minimize the effect of varieties and slope on crop productivity.
Journal of Economics and Sustainable Development www.iiste.org
ISSN 2222-1700 (Paper) ISSN 2222-2855 (Online)
Vol.6, No.9, 2015
204
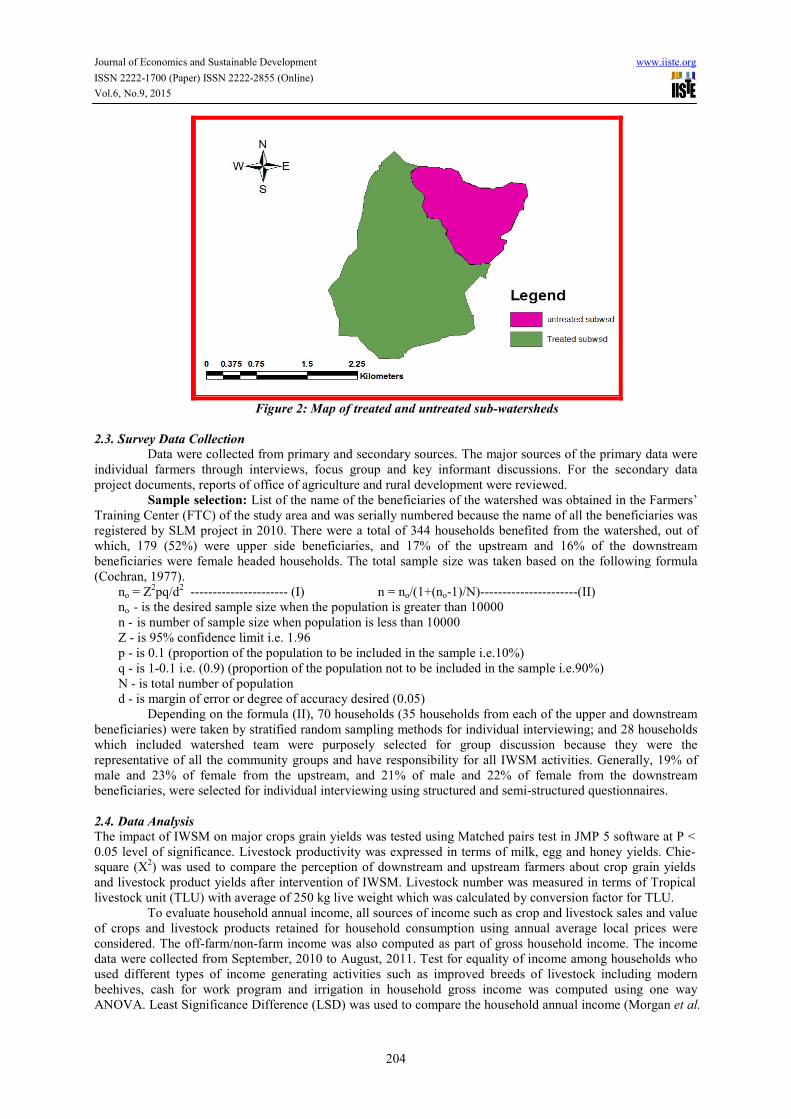
Figure 2: Map of treated and untreated sub-watersheds
2.3. Survey Data Collection
Data were collected from primary and secondary sources. The major sources of the primary data were
individual farmers through interviews, focus group and key informant discussions. For the secondary data
project documents, reports of office of agriculture and rural development were reviewed.
Sample selection: List of the name of the beneficiaries of the watershed was obtained in the Farmers’
Training Center (FTC) of the study area and was serially numbered because the name of all the beneficiaries was
registered by SLM project in 2010. There were a total of 344 households benefited from the watershed, out of
which, 179 (52%) were upper side beneficiaries, and 17% of the upstream and 16% of the downstream
beneficiaries were female headed households. The total sample size was taken based on the following formula
(Cochran, 1977).
no = Z2pq/d
2 ---------------------- (I) n = no/(1+(no-1)/N)----------------------(II)
no - is the desired sample size when the population is greater than 10000
n - is number of sample size when population is less than 10000
Z - is 95% confidence limit i.e. 1.96
p - is 0.1 (proportion of the population to be included in the sample i.e.10%)
q - is 1-0.1 i.e. (0.9) (proportion of the population not to be included in the sample i.e.90%)
N - is total number of population
d - is margin of error or degree of accuracy desired (0.05)
Depending on the formula (II), 70 households (35 households from each of the upper and downstream
beneficiaries) were taken by stratified random sampling methods for individual interviewing; and 28 households
which included watershed team were purposely selected for group discussion because they were the
representative of all the community groups and have responsibility for all IWSM activities. Generally, 19% of
male and 23% of female from the upstream, and 21% of male and 22% of female from the downstream
beneficiaries, were selected for individual interviewing using structured and semi-structured questionnaires.
2.4. Data Analysis The impact of IWSM on major crops grain yields was tested using Matched pairs test in JMP 5 software at P <
0.05 level of significance. Livestock productivity was expressed in terms of milk, egg and honey yields. Chie-
square (X2) was used to compare the perception of downstream and upstream farmers about crop grain yields
and livestock product yields after intervention of IWSM. Livestock number was measured in terms of Tropical
livestock unit (TLU) with average of 250 kg live weight which was calculated by conversion factor for TLU.
To evaluate household annual income, all sources of income such as crop and livestock sales and value
of crops and livestock products retained for household consumption using annual average local prices were
considered. The off-farm/non-farm income was also computed as part of gross household income. The income
data were collected from September, 2010 to August, 2011. Test for equality of income among households who
used different types of income generating activities such as improved breeds of livestock including modern
beehives, cash for work program and irrigation in household gross income was computed using one way
ANOVA. Least Significance Difference (LSD) was used to compare the household annual income (Morgan et al.
Journal of Economics and Sustainable Development www.iiste.org
ISSN 2222-1700 (Paper) ISSN 2222-2855 (Online)
Vol.6, No.9, 2015
205
2004). Mean comparisons of each source of household annual income and gross annual income between the
upper and downstream of the watershed were tested using Independent Sample T Test.
Determinants of total income at household level: In this analysis, the dependent variable was the
household annual income. To identify the factors that influence household annual income, multiple linear
regression model was used. Based on literature and the nature of the study, the most preferred factors expected to
affect household annual income were: sex of household head, age of household head, labour equivalent of the
household, size of cultivated area, irrigation access, size of livestock in terms of Tropical Livestock Unit (TLU),
off-farm income and education of household head.
Multicolleaniarity was examined using Variance inflation factor (VIF), collinearity diagnostics which
includes eigenvalues, condition indices (CIs) and variance proportions. Finally, a total of 8 explanatory variables
were entered in to the linear regression analysis. The analysis indicates which determinants are more important
for the improvement of total household income. Normality of the income variable was tested using histogram of
the residuals. Mathematically, the final model was expressed as:
Y= ß0 + ß1 (Sex) + ß2 (Cultivated land) + ß3 (TLU) + ß4 (Off-farm) + ß5 (Labor) + ß6 (Age) + ß7 (Irrigation) +
ß8 (Education) + Ε
The residual term Ε is assumed to be normally distributed with expectation 0 and variance δ2. The
unknown parameters ß1, ß2…, ß8 are called the regression coefficients and ß0 is constant. The explanatory
variables were expressed as:
Access to irrigation: Irrigation supplements moisture, which enables farmers to maximize agricultural
production. It is assumed to have a direct relation with the total income of a household. Access to irrigation for
household is a dummy variable, 0 if a household has access to irrigation and 1 otherwise.
Cultivated land size: Total cultivated land is the total sum of the household’s own and/or rented
in/out from/to other households and measured in hectares. This did not include the grazing and fallowing lands.
Farmland is the major input for agricultural production in rural households.
Education level of a household head: In the study area, the head of the household is responsible for
the co-ordination of the household activities. It is likely that educated farmers would more readily adopt IWSM
technologies and may be easier to train through extension support. The variable entered in the model as dummy
variable with zero if a household head can read and write, and otherwise one.
The number of livestock owned: This is a continuous variable measured in terms of TLU.
Households with higher livestock holding would lead to higher probability of getting excess livestock for selling
and hence generating additional income, particularly the owner of improved varieties of livestock including
modern beekeeping could earn higher income.
Gender of the household head: This is a dummy variable with 0 for male and 1 otherwise. Male
household heads are expected to have higher income compared to female household heads because of better
labor inputs used in male-headed households.
Age of a household head: Age is a continuous variable and measured in years. It influences whether
the household benefits from the experience of an older person, or has to base its decisions on the risk-taking
attitude of a younger farmer. Advanced aged household heads are more reluctant to accept new IWSM
technology and agricultural production styles than younger household heads. Thus, age of household head is
hypothesized to have negative contribution to household income.
Labour equivalent: This is a continuous variable measured in terms of adult labour force. It is
expected that households with more labour equivalent could have more income.
Off-farm/Non-farm income: This is a continuous variable measured in ETB. It is expected that
households with more off-farm/non-farm income could earn more gross income because they might introduce
improved technologies.
3. Results
3.1. Analysis of Major Crops Grain Yields
Teff (Eragrostis tef) and sorghum grain yields were significantly differed between treated and untreated sub-
watersheds, with that teff and sorghum yields were increased by 62 and 61%, respectively, in the treated sub-
watershed compared to the untreated sub-watershed (Table 1). Moreover, maize grain yield was increased by
27% in the treated sub-watershed over the base yield of the untreated sub-watershed (Table 1).
Journal of Economics and Sustainable Development www.iiste.org
ISSN 2222-1700 (Paper) ISSN 2222-2855 (Online)
Vol.6, No.9, 2015
206
Table 1: The effect of IWSM on major crops grain yield (Mean ± S.E)
Type of crops Treated sub-watershed
(kg/ha)
Untreated sub-watershed
(kg/ha)
P
Teff
Maize
Sorghum
1037 ± 128
3037 ± 336
2825 ± 298
640 ± 47
2400 ± 264
1750 ± 193
0.049
0.179
0.047
S.E__ Standard error of the mean; Mean value calculated from n = 4, kg_killogram, ha_hactare
Farmers’ perception about crop grain yields: Table 2 shows that most of the respondents had benefited from
the increasing of sorghum, maize and teff yields after the intervention of IWSM. From the interviewed 70
respondents, 24 (34.3%) farmers had plots of cultivated land both in the treated and untreated sub-watersheds
which were planted with sorghum. As shown in the table 2, no significant difference was observed between the
upper and lower beneficiaries of the watershed in their perception of the increase of sorghum, maize and teff
grain yields after the introduction of IWSM.
Table 2: Farmers’ perception about major crops grain yields after IWSM
Type of
crop
Location of the
respondent
Perception of the respondent on grain yield after IWSM
Increased (%) Decreased (%) No change (%) X2
Sorghum Upstream(N=35) 80 0 20 0.777
Downstream(N=35) 74 0 26
Total(N=70) 77 0 23
Maize Upstream(N=35) 80 0 20 0.513
Downstream(N=35) 88 0 12
Total(N=70) 84 0 16
Teff Upstream(N=35) 77 0 23 0.083
Downstream(N=35) 94 0 6
Total(N=70) 86 0 14
After the intervention of IWSM measures, the irrigation area was increased from zero to 14.04 ha
inside the watershed and 10 ha outside the watershed by using a canal from the watershed (District Agricultural
Office, Unpublished). Forty percent of the respondents had cultivated maize in rainfed and irrigated areas with
integration of tomato, onion, carrot, pepper, orange, papaya and banana in the irrigation area. In the study area,
90% of the respondents said that soil erosion was the main problem for their crop production before IWSM.
3.2. Perception of Farmers about Livestock Production
Thirty two percent of the respondents have increased their number of livestock after IWSM due to increasing of
forage availability and income creation. Even though the total number of livestock in the watershed had been
increased, 57% of the respondents explained that their livestock number was decreased after IWSM due to
reduction of free grazing and focused on improved breeds. REST and sustainable land management projects
provided improved livestock types like dairy cows (Barka/Begait breeds), poultry (Bovine brown and Rhod
Island Red) and modern beehives through loan. From the sampled households, 20% and 29% of the lower and
upper stream beneficiaries had introduced modern beehives, respectively. Whereas, 23% and 14.3% of the lower
and upper beneficiaries introduced improved dairy cows, respectively. Sixty-seven percent of the respondents
(Table 3) said that in addition to the introduction of modern beehives, average local honey bee yield had been
increased from 13.2 kg to 16.4 kg per year. The average honey production from modern beehive was 23.75 kg
per year per hive and it ranged from 10 to 45 kg per hive per year. Milk yield of local dairy cows was increased
from 0.89 to 1 litre per day (12.3% increment) after IWSM; and milk yield of the improved dairy cows’ ranges
from 1.5 to 3 liters per day. Egg production from the improved poultry ranges from 216 to 312 eggs per hen per
year. However, most of the respondents said that local poultry egg yields had no change after the introduction of
IWSM (Table 3). Table 3 shows that there was no significant difference between the upper and lower
beneficiaries of the watershed in their perception in the increase of milk, egg and honey yields after intervention
of IWSM.
Journal of Economics and Sustainable Development www.iiste.org
ISSN 2222-1700 (Paper) ISSN 2222-2855 (Online)
Vol.6, No.9, 2015
207
Table 33: Farmers’ perception about livestock productivity after IWSM
Type of
livestock
Location of the
respondent
Farmers’ perception on livestock products after IWSM
Increased (%) Decreased (%) No change %) X2
Local dairy
cow
Upstream (N=35) 51.4 17.1 31.4 0.57
Downstream (N=35) 45.7 11.4 42.9
Total (N=70) 48.6 14.3 37.1
Local poultry Upstream (N=35) 2.9 0 97.1 0.32
Downstream (N=35) 0 0 100
Total (N=70) 1.4 0 98.6
Local honey
bee
Upstream (N=35) 72.2 0 27.8 0.73
Downstream (N=35) 61.9 0 38.1
Total (N=70) 66.7 0 33.3
3.3. The Contribution of IWSM in Household Annual Income
Household income sources: Rain fed crop income was the major source of household annual income in both the
downstream and upstream beneficiaries. The lower beneficiaries had more and significantly different cropping
income compared to the upper beneficiaries; moreover, they had also more and significantly different total
income than the upstream beneficiaries (Table 4). The contribution of IWSM in terms of irrigation access to the
cropping income of the lower and upper beneficiaries was 35% and 2%, respectively.
Table 4: Income sources of upstream and downstream beneficiaries in ETB
Parameters Downstream hhs (N=35) Upstream hhs (N=35) Total hhs (N=70) (ETB) P
Cropping income
Rainfed income 6865 6079 6472 0.265
Irrigated income 3710 83 1896.5 0.001
Sub-total 10575 6162 8368.5 0.001
Livestock income
Local livestock income 3148 3053 3100.5 0.861
Improved livestock income 993 1337 1165 0.542
Sub-total 4141 4390 4265.5 0.804
Off-farm/non-farm income 2448 2426 2437 0.749
Total 17164 12978 15071 0.011
Hhs_ households
The total crop income contribution to annual household income of the upper and lower beneficiaries
was 47.5% and 61.6%, respectively. Livestock production and off/non-farm activities had a contribution of 29%
and 14% to the average annual income of the sampled households, respectively. Even though improved breeds of
livestock including modern beehives had high contribution (21%) in household annual income of the farmers
who introduced them; overall impact to the watershed was minimal (8%).
Household annual Income vs. access to irrigation and improved livestock: It was found that the
users of both irrigation and improved livestock had the highest average annual income; but the smallest
household annual income was observed with the non-users of irrigation and improved livestock technologies
(Table 5). The average annual income for only improved livestock users was almost similar to that of only
irrigation users. Mean annual income of the users of both improved livestock and irrigation technologies was
significantly higher than the users of only improved livestock and irrigation; furthermore, non-users of both
improved livestock and irrigation had mean annual income significantly lower than the users of improved
livestock and irrigation access (Table 5). The contribution of IWSM to overall household annual income of the
sampled households in terms of irrigation, improved livestock production and cash for work programs was
31.3%, with 37% to the lower beneficiaries and 24% to the upper beneficiaries.
Table 5: Household annual income Vs access to irrigation and improved livestock production
Description Observation Mean
income
+ S.E (ETB)
Minimum
(ETB)
Maximum
(ETB)
P
Improved livestock users 10 15241 ± 1992a 8662 27712 0.001
Irrigation users 19 14677 ± 1353a 8074 29955
Improved livestock and
irrigation users
18 21302 ± 1601b 10021 37836
None of them-users 23 10425 ± 866c 4435 19180
Total 70 15070 ± 832 4435 37836
S.E_ standard error of mean, mean calculated from n = 10, 19, 18 and 23
Determinants of total income at household level: According to table 6, the coefficient of irrigation
access was negatively and significantly associated with the household total income as expected. From the

Journal of Economics and Sustainable Development www.iiste.org
ISSN 2222-1700 (Paper) ISSN 2222-2855 (Online)
Vol.6, No.9, 2015
208
sampled households, 81.4% of them revealed that in addition to increasing of annual income, there was an
increase in the variety of foods in their diet due to the introduction of fruits and vegetables in the irrigation site.
Land size was positively and significantly associated with household total income as expected. The magnitude of
its coefficient was higher than the magnitude of the other coefficients. Livestock holding in TLU was positively
and significantly associated with household total income. Off-farm/non-farm income influenced the household
total income significantly with a positive sign (Table 6).
Table 6: Multiple Linear Regression estimates of the determinants for household income
Variable Coefficients Std.Error t P
Constant 7098.266 2782.902 2.551 0.013
Sex of household head -2698.130 1685.700 -1.601 0.115
Cultivated area 5064.662 2125.334 2.383 0.020
TLU(Tropical Livestock Unit) 886.169 306.349 2.893 0.005
Off-farm income 0.849 0.314 2.702 0.009
Labour equivalent 790.363 537.293 1.471 0.146
Age of household head -58.291 54.153 -1.076 0.286
Access to irrigation -3030.480 1120.619 -2.704 0.009
Household head education -961.374 1476.076 -.651 0.517
4. Discussion
4.1. Analysis of Major Crops Grain Yields
The significant difference in teff and sorghum grain yields between the treated and untreated sub-watersheds
reflects the difference in soil fertility status between the two sub-watersheds. This indicates that IWSM has great
contribution in increasing the yield of teff and sorghum grains. Even though maize grain yield was higher in the
treated sub-watershed than the untreated one, no significant difference was observed. This might be due to the
fact that farmers have used animal manure mostly for their plots found near their home, and most of maize crops
were sown near homesteads. Plots with stone bunds are more productive than those without such technologies in
semi-arid areas but not in higher rainfall areas, apparently because the moisture conserving benefits of this
technology are more beneficial in drier areas (Menale et al., 2007). This implies that the performance of stone
bunds varies by agro-ecological type, suggesting a need for the design and implementation of appropriate site-
specific technologies. Wani et al. (2003) studied that the maximum and minimum sorghum grain yield in
Adarsha IWSM were 3000 kg/ha and 470 kg/ha, respectively; and the maximum and minimum maize grain
yields were 3700 kg/ha and 1400 kg/ha, respectively.
Farmers of the study area appreciate soil fertility impacts due to IWSM indirectly in terms of the
colour or vigorousity of plants. The quality and amount of harvest is another important measure of soil fertility.
However, even in climatically good years, low crop yields are not perfect indicators of declining soil fertility,
since yields may be significantly affected by a range of other factors, such as weeds or pests. As the study of
Azene and Gathiru (2006) reported, farmers associate soil fertility with resistance of the crops against diseases.
This is mostly a qualitative measure, pointing to the need to help farmers calibrate and quantify such indirect
measurements. The high increased teff, sorghum and maize grain yields after the introduction of IWSM might be
related not only to SWC measures of IWSM, but also to application of chemical fertilizer, animal manure and
compost. As the farmers mentioned, even though they have used similar amount of chemical fertilizer in the
treated and untreated sub-watersheds, they were unable to get similar results in the two sub-watersheds. This
might be due to the reason that chemical fertilizers could be washed away by run-off in the untreated sub-
watershed. However, if there is no enough moisture in the soil, reduction in nitrogen fertilizer by 38% in
Veitnam, increased maize yield by 18% (Wani et al., 2010).
Increasing of irrigation access forced the farmers to introduce different fruits and vegetables. This
enables them to diversify their production cropping patterns. Intercropping of maize with vegetables was
common in the irrigation area. The increase in irrigation access could be attributed to the increase of water
availability and construction of small water harvesting structures by IWSM projects. The variation in perception
among the respondents concerning the increment of major crops grain yields after IWSM in the study area could
be explained through the difference in exposure, position of their agricultural land, understanding of their
environment or in realizing the impact of the ongoing IWSM measures in their surrounding (Belaineh and Lars,
2005).
4.2. Livestock Production
The positive contribution of IWSM in increasing of milk yield from local and cross breed dairy cows and honey
production from local and modern beehives could be attributed to the improvement of forage availability by
planting different exotic (sesbania) and local forage seedlings and closing of the area from animal and human

Journal of Economics and Sustainable Development www.iiste.org
ISSN 2222-1700 (Paper) ISSN 2222-2855 (Online)
Vol.6, No.9, 2015
209
interventions. The farmers have started to use the sesbania for their livestock as a supplementary feeding. IWSM
has also improved the availability of local forage grasses in the communal closed areas. Mulugeta and Stahr
(2010) and Tefera (2005) reported that enclosures combined with SWC had a positive impact on livestock
productivity by increasing forage availability. Improved nutrition through adoption of improved forage and
better crop residue management could substantially raise livestock productivity (Girma and Misra, 2007). Water
availability for livestock drinking was also increased after the interventions of IWSM measures.
Decreasing of livestock grazing land had led to stay livestock around homesteads. According to the
respondents and direct observation, major grazing areas available were small grazing areas near homesteads and
crop aftermath (stubble and weeds) together with farm boundaries. The flat land was totally devoted to crop
production. Introduction of modern beehives through formation of user groups and individuals has started in the
treated hillside. Beekeeping is strategically relevant as it complements natural resource management activities
and provides a means to address landless and poor households, who might not have access to other income
earning activities. It has been effective in establishing start-up with new hives for individuals and cooperatives
and efficient in that significant income is being produced with small investments (Hebert, 2010). Meaza (2010)
reported that modern beekeeping have created improved livelihood in terms of better income so as enhancing
capability to buy household demands; productive investment like buying animals, saving and expenditure in
different needs of the households.
The difference in introduction of improved livestock production technologies among the households
might be due to the fact that geographical positioning of the households in the watershed and most of the farmers
could not take two or more types of improved livestock technologies at the same time for fear of loan burden.
Furthermore, the lower beneficiaries had access to crop residue twice a year by using irrigation and had more
water access for livestock drinking. Even though improved forages like Leucaena leucocephala and Sesbania
sesban have been expanded in the communal uncultivated lands, expansion of these improved forages in
individual farmers’ fields was very limited because more attention was given to crop production rather than
forage production due to shortage of land. Similar results have been recorded by Yayneshet (2010) and Mekoya
et al. (2008). In other cases, as Beyene et al. (2011) studied in Benishangul-Gumuz, expansion of improved
forage among households was limited due to weak extension services and limited involvement and devotion of
research institutions.
The difference in farmers’ perception about the contribution of IWSM to livestock productivity could
be related to livestock management system, livestock number before and after IWSM, different in adoption of
the technologies and geographical positions among the households of the watershed. Some of the respondents
had grazing land access outside the watershed and had owned more livestock before IWSM. As it was pointed
out in the group discussion, poor farmers were able to buy livestock after IWSM and started to share grasses
from the communal area. Therefore, those who keep a high number of livestock and those who used to take the
share of the poor were the ones resisting expansion of zero grazing and said that their milk yield was decreased
after IWSM. Similar observation was recorded by Gebregziabher and Gebrehiwot (2011) in Atsbi-Wemberta
district.
4.3. Determinants of Total Income at Household Level The significant association between household’s annual income and irrigation access indicates that irrigation
through IWSM is one among many factors that increase household annual income. The magnitude of the
coefficient of access to irrigation reveals that irrigation has large impact to household annual income. Small-
scale irrigation had an important impact on food security for populations directly involved in production of
irrigated crops, also producing a greater variety of food, some of which was used for local consumption, but
most of which was sold to produce income (Hebert, 2010). Getaneh (2011) and Wagnew (2004) also reported
that households with irrigation access had more and significant total household annual income than non-users.
The positive and significant associations of TLU with total household annual income indicates that large total
livestock number have high contribution to household annual income. This could be related to the contribution of
IWSM in terms of improved breeds of livestock, increasing forage availability and introduction of modern
beehives. From the farmers’ point of view, beekeeping enabled them to purchase additional livestock feed and
livestock number like oxen and dairy cows. Livestock production contributes to total household income directly
through the sale of livestock and their products, and indirectly through use as a source of draught power and
manure for crop production activities. Even if the result of this study shows that TLU has a positive impact on
household annual income, increasing the number of livestock may increase the cost of production and might
have negative impacts to the watershed. Therefore, additional research is needed to study the cost and benefit
analysis of livestock production and the carrying capacity of the watershed for livestock production. The highest
relative advantage in household annual income contribution was recorded from the utilization of both irrigation
and improved livestock technologies in integrated way. The implication of this is that introducing of integrated
technologies through watershed management is better to improve household annual income rather than
Journal of Economics and Sustainable Development www.iiste.org
ISSN 2222-1700 (Paper) ISSN 2222-2855 (Online)
Vol.6, No.9, 2015
210
introducing only one type of technology or not using at all. The result of Pandit et al. (2007) also indicated that
household income of the watershed settlers have been improved by adopting watershed-friendly activities such
as agro-forestry and improved agriculture farming.
The significant impact of cultivated land holding to the household total income implies households
with large land size can produce more and increase their total income. Thus, land holding size is an important
input in rural poor households to increase their annual income (although it will typically be difficult for a
household to markedly increase the size of its landholding). Because agriculture is the main source of income
and livelihood for more than 85% of the country’s population (World Bank, 2008), land access is a critical issue
in Ethiopia. This result is similar to Aikaeli (2010) in Tanzania and Getaneh (2011) at Lake Tana basin of
Ethiopia that land size had a positive and significant effect on household total income. The positive and
significant association of off-farm income with the household total income shows that off-farm/non-farm has
high contribution in household total income. This could be related to participation in cash for work programs
introduced by IWSM projects. The farmers were able to purchase improved poultry, goats and modern beehives
from cash for work programs after the IWSM. Furthermore, farmers who had more off-farm/non-farm income
could able to use more chemical fertilizers. Other findings indicated that watershed management activities in
Kothapally watershed had increased household income through non-farm activities (Wani, 2003). Pender et al.
(2002) also reported that households with non-farm/off-farm income had higher total income than others in the
Tigray region. The negative sign in the coefficients of irrigation, education, age and sex indicate that no access to
irrigation, illiteracy, elder and female headed households have reduced household annual income at a rate of
961.4, 58.29 and 2698 ETB, respectively.
5. Conclusions
IWSM has a positive and significant impact on major crops grain yield. This could be related to the increasing of
soil fertility in the treated sub-watershed. Even though there was no significant difference in maize grain yield
between the treated and untreated sub-watersheds, most of the respondents expressed that maize grain yield was
increased more than by half after the intervention of IWSM because the farmers were aware of the problems of
soil erosion on their crop productivity. Irrigation access was also created after IWSM in the downstream of the
watershed, consequently, vegetables and fruits have been introduced. Furthermore, IWSM has high contribution
to livestock productivity in terms of milk, egg and honey yields. Even though there was a difference in farmers’
perception about the impact of IWSM on their livestock products, most of the farmers explained that honey and
milk yields have been increased after the intervention of IWSM due to the increment of forage and water
availability and introduction of improved breeds of livestock. Especially, expansion of modern beekeeping is
clearly observed in the rehabilitated hillside of the treated sub-watershed. After the introductions of IWSM,
farmers were able to own livestock, but free grazing was decreased (most of the farmers keep their livestock near
their home).
Income generating activities like irrigation access, improved livestock and cash for work programs
introduced by IWSM has their own contribution to household annual income. The highest household annual
income was reported in households who introduced both irrigation access and improved breeds of livestock.
Furthermore, downstream households have significantly higher mean annual income than upstream households
of the watershed because they were irrigation users. From this, we can conclude that introducing of two or more
income generating technologies of IWSM have higher contribution to household annual income rather than
introducing only one type of technology or not using at all. Multiple Linear Regression Model analysis also
shows that having more livestock, irrigation access, off-farm income and large size of cultivated land have
significant contribution in household annual income. Therefore, integrated watershed management is not only
effective in increasing crop and livestock production but it has also high contribution in household annual
income.
Acknowledgements We gratefully acknowledge Development Agents (DAs), local administrations and inhabitant of the study
watershed, for the provision of all relevant data, documents and information essential for the study. The first
author is also grateful to SIDA for providing financial support and Kolla Tembien office of Agriculture and
Rural Development for granting a study leave.
References Aikaeli, J., 2010. ‘Determinants of Rural Income in Tanzania: An Emprical Research’. Research report 10/4,
Dares Salaam, REPOA.
Azene Bekele and Gathiru Kimaru, 2006. Participatory watershed management: Lessons from RELMA’s work
with farmers in eastern Africa. ICRAF Working Paper no 22.
Belaineh, L. and Lars, D., 2005. Determinants of smallholder farmers' perceptions of risk in the Eastern
Journal of Economics and Sustainable Development www.iiste.org
ISSN 2222-1700 (Paper) ISSN 2222-2855 (Online)
Vol.6, No.9, 2015
211
Highlands of Ethiopia. J. Risk Res. 8 (5): 383-416.
Beyene Teklu, Tegene Negesse and Ayana Angassa., 2011. Effect of farming systems on livestock feed
resources and feeding systems in Benishangul-Gumuz region, western Ethiopia. Hawassa University,
Wondo Genet College of Forestry and Natural Resource, Shashamene. International Research Journal
of Agricultural Science and Soil Science Vol. 1(1) pp. 020-028.
Bishaw Badege and Abdu Abdelkadir, 2003. Agroforestry and Community Forestry for Rehabilitation of
Degraded Watersheds on the Ethiopian Highlands. College of Forestry, Oregon State University,
Corvallis, Oregon 97331, U.S.A. International Symposium on Contemporary Development Issues in
Addis Ababa, Ethiopia.
BoFED (Bureau of Finance and Economic Development), 2003. Soil map of Tigray. Tigray regional states
BoFED, physical planning development, GIS center, Tigray, Ethiopia.
Cochran, W., 1977. Sampling Techn`1iques. 3rd ed. John Wiley and sons. USA.
Darghouth, S., Ward, C., Gambarelli, G., Styger, E. and Roux, J., 2008. Watershed Management Approaches,
Policies and Operations: Lessons for Scaling Up. Water Sector Board Discussion Paper Series Paper No
11. The World Bank, Washington, DC.
Gebregziabher Gebreyohannes and Gebrehiwot Hailemariam, 2011. Challenges, Opportunities and Available
Good Practices related to Zero Grazing in Tigray and Hararghe, Ethiopia. DCG Report No. 66.
Getaneh Kebede, 2011. The Impact of Selected Small-Scale Irrigation schemes on Household income and the
Likelihood of Poverty in the Lake Tana Basin of Ethiopia. M.Sc. Thesis, Presented to the Faculty of the
Graguate School of Cornell University.
Girma Tadesse and Misra, A.K., 2007. Water and livestock for human development. Chapter 13. Livestock help
the world’s poor escape poverty, Nigeria. IWMI Part 4 Ch8-16 final.indd 485.
Hebert, P., 2010. An Evaluation of Catholic Relief Services (CRS) Integrated Watershed Management Programs
in Ethiopia.
Kerr, J., 2001. Watershed project performance in India: conservation, productivity, and equity. American
Journal of Agricultural Economics 83 (5), 1223-1230.
Meaza Gebreyohannes, 2010. Socio-Economic Analysis of Market Oriented Beekeeping in Atsbi Wemberta
District of Eastern Zone, Tigray Region. A Thesis Submitted to Master of Arts Degree in Development
Studies. Mekelle University, Mekelle, Ethiopia.
Mekoya, A., Oosting, S.J., Fernandez-Rivera, S., Van der Zijpp, A.J., 2008. Multipurpose fodder trees in the
Ethiopian highlands: Farmers' preference and relationship of indigenous knowledge of feed value with
laboratory indicators. Agricultural Systems 96, 184-194.
Menale Kassie, Pender, J., Mahmud Yesuf, Kohlin, G., Bluffstone, R. and Elias Mulugeta, 2007. Impact of Soil
Conservation on Crop Production in the Northern Ethiopian Highlands. IFPRI Discussion Paper 00733.
MoARD (Ministry of Agriculture and Rural Development), 2005. Guide line for integrated watershed
management, Addis Ababa, Ethiopia.
Morgan, A., Leech, L., Gloeckner, W. and Barrett, C., 2004. SPSS for introductory statistics use and
interpretation. 2nd ed. Publishers: Lawrence Erlbaum Associates, Mahwah, New Jersey.
Mulugeta Demelash and Stahr, K., 2010. Assessment of integrated soil and water conservation measures on key
soil properties in South Gonder, North-Western Highlands of Ethiopia. Orthodox Church Development
and Interchurch Aid Commission (EOC-DICAC), Addis Ababa, Ethiopia.
Pandit, B.H., Wagley, M.P, Neupane, R.P. and Raj, B., 2007. Watershed Management and Livelihoods:
Lessons from Nepal. Journal of Forest and Livelihood 6(2): 67-74 and 1-9.
Pender, J., Berhanu Gebremedhin and Mitiku Haile, 2002. Economic Returns And Impacts of Policies And
Programs Affecting Land Management in Tigray Policies For Sustainable Land Management in The
Highlands of Tigray, Northern Ethiopia. International Food Policy Research Institute (IFPRI), Mekelle,
Ethiopia. EPTD Workshop Summary Paper No. 14.
Sertse Sebuh, 2007. Study and design guidelines on watershed management with reference to
forestry.Unpublished. Bureau of Agriculture and Rural Development (BoARD), Mekelle, Tigray.
Tefera Mengistu, Demel Teketay, Hakan Hulten and Yonas Yemshaw, 2005. The role of communities in closed
area management in Ethiopia. Mountain Research and Development Vol 25, No 1: 44–50.
Wagnew Ayalneh, 2004. Socio economic and environmental impact assessment of community based small-scale
irrigation in the Upper Awash Basin. A case study of four community based irrigation schemes. M.Sc.
Thesis Submitted to School of Graduate Studies, Environmental Science Program, Addis Ababa
University.
Wani, S.P., Singh, H.P., Sreedevi, T.K., Pathak, P., Rego, T.J., Shiferaw, B. and Iyer, S.R., 2003. Farmer-
Participatory Integrated Watershed Management: Adarsha Watershed, Kothapally India: An Innovative
and Upscalable Approach. Case 7. Pages 123–147 in Research Towards Integrated Natural Resources
Management.
Journal of Economics and Sustainable Development www.iiste.org
ISSN 2222-1700 (Paper) ISSN 2222-2855 (Online)
Vol.6, No.9, 2015
212
Wani, S. P, Wangkahart, T., Dixin, Y., Li, Z. and Thang, N., 2010. Community watersheds for food security and
coping with impacts of climate change in rain fed areas. Global Theme on Agro ecosystems,
International Crops Research institute for the Semi Arid Tropics (ICRISAT), Patancheru.
Woldeamlak Bewket, 2003. Towards Integrated Watershed Management in high lands of Ethiopia: the Chemoga
watershed case study. Tropical Resource Management Papers, No. 44 (2003); ISBN 90-6754-708-5.
World Bank, 2008. Environmental and Natural Resources Management. Federal Democratic Republic of
Ethiopia for a Sustainable Land Management Project. Report No: 42927-ET.
Yayneshet Tesfay, 2010. Feed Resources Availability in Tigray Region, Northern Ethiopia for Production of
Export Quality Meat and livestock. Ethiopia Sanitary and Phytosanitary Standards and Livestock and
meat marketing Program (SPS-LMM) Texas A and M University System.
Yoganand, B. and Tesfa Gebremedhin, 2006. Participatory Watershed Management for Sustainable Rural
Livelihoods in India Research Paper.
The IISTE is a pioneer in the Open-Access hosting service and academic event management.
The aim of the firm is Accelerating Global Knowledge Sharing.
More information about the firm can be found on the homepage:
http://www.iiste.org
CALL FOR JOURNAL PAPERS
There are more than 30 peer-reviewed academic journals hosted under the hosting platform.
Prospective authors of journals can find the submission instruction on the following
page: http://www.iiste.org/journals/ All the journals articles are available online to the
readers all over the world without financial, legal, or technical barriers other than those
inseparable from gaining access to the internet itself. Paper version of the journals is also
available upon request of readers and authors.
MORE RESOURCES
Book publication information: http://www.iiste.org/book/
Academic conference: http://www.iiste.org/conference/upcoming-conferences-call-for-paper/
IISTE Knowledge Sharing Partners
EBSCO, Index Copernicus, Ulrich's Periodicals Directory, JournalTOCS, PKP Open
Archives Harvester, Bielefeld Academic Search Engine, Elektronische Zeitschriftenbibliothek
EZB, Open J-Gate, OCLC WorldCat, Universe Digtial Library , NewJour, Google Scholar