
Socio-Economic Benefits Study: Scoping the Value of CORS ...
81
Socio-Economic Benefits Study: Scoping the Value of CORS and GRAV-D Irving Leveson FINAL REPORT revised January 2009 Prepared for the National Geodetic Survey
Transcript of Socio-Economic Benefits Study: Scoping the Value of CORS ...

Socio-Economic Benefits Study:
Scoping the Value of CORS and GRAV-D
Irving Leveson
FINAL REPORT
revised January 2009
Prepared for the National Geodetic Survey

Socio-Economic Benefits Study:
Scoping the Value of CORS and GRAV-D
Irving Leveson
FINAL REPORT
revised January 2009
Prepared for the National Geodetic Survey National Oceanic and Atmospheric Administration
U.S. Department of Commerce
contract No. NCNL0000-8-37007 contact:
Irving Leveson Leveson Consulting 10 Inverness Lane Jackson, NJ 08527-4047 732-833-0380 cell 609-462-3112 fax 732-833-9986

Contents
SUMMARY ................................................................................................................................................... 1
OBJECTIVES ................................................................................................................................................ 1 CORS AND GRAV-D TRADE SPACE (FOOTPRINT) MEASURES ................................................................... 1 BENEFIT MEASUREMENT APPROACH .......................................................................................................... 2 INFORMATION NEEDED AND APPROACH FOR OBTAINING IT ....................................................................... 3
Information Needed ............................................................................................................................... 3 Study Components ................................................................................................................................. 3 A Strategy for Getting Started ............................................................................................................... 5
SOME ORDER OF MAGNITUDE BENEFIT ESTIMATES ................................................................................... 5
OBJECTIVES ............................................................................................................................................... 7
NGS PROGRAMS, APPLICATIONS AND USERS ................................................................................ 9
NATIONAL SPATIAL REFERENCE SYSTEM ................................................................................................... 9 CORS ......................................................................................................................................................... 9 GRAV-D PROGRAM ................................................................................................................................. 13
TRADE SPACE (FOOTPRINT) ANALYSIS .......................................................................................... 16
SURVEYING AND MAPPING EMPLOYMENT AND REVENUE ........................................................................ 16 Private Surveying and Mapping Industry Data ................................................................................... 16 Private Surveying and Mapping Product Revenue .............................................................................. 17 Employees in Surveying and Mapping Occupations ............................................................................ 18
NUMBERS OF PRECISION GNSS USERS AND SPENDING ............................................................................ 19 POTENTIAL MARKET SIZE DATA ............................................................................................................... 19
Government Activities .......................................................................................................................... 19 Occupation Data for Some Potential Users Other than Surveying and Mapping ............................... 20
CORS PARTNERS, CUSTOMERS, USAGE AND PROSPECTS ......................................................................... 21 Participating Organizations ................................................................................................................ 21 Customers ............................................................................................................................................ 22 Usage and Prospects ........................................................................................................................... 23
GRAV-D CUSTOMERS, USES AND SCENARIOS ......................................................................................... 27 Customers and Uses ............................................................................................................................ 27 Adoption by State Governments and Others ........................................................................................ 30 NGS Vision .......................................................................................................................................... 30 Scenarios ............................................................................................................................................. 31
METHODOLOGIES FOR ESTIMATING THE VALUE OF CORS AND GRAV-D ........................ 33
BENEFIT MEASUREMENT APPROACHES .................................................................................................... 33 The Economic Productivity Approach ................................................................................................. 33 The 1998 Height Modernization Study ................................................................................................ 34
USE OF AVOIDED COST TO MEASURE BENEFITS OF CORS AND GRAV-D ............................................... 35 CORS ................................................................................................................................................... 35 GRAV-D ............................................................................................................................................... 36
INFORMATION NEEDED FOR ESTIMATING THE VALUES AND HOW IT CAN BE OBTAINED ................................................................................................................................................. 40
INFORMATION NEEDED FOR A FULL STUDY .............................................................................................. 40 COMPONENTS OF A FULL STUDY .............................................................................................................. 41 BENEFIT ESTIMATION MODEL AND INFORMATION PROCESS DIAGRAMS .................................................. 43

SOME QUESTIONS FOR FORUMS, INTERVIEWS AND SURVEYS ................................................................... 45 ESTIMATING SOCIETAL BENEFITS AND CONSUMER SURPLUS ................................................................... 48 A STRATEGY FOR GETTING STARTED ....................................................................................................... 48
ESTIMATED ORDERS OF MAGNITUDE VALUES OF SOCIO-ECONOMIC BENEFITS OF NSRS, CORS AND GRAV-D .................................................................................................................... 50
VALUE OF THE NSRS: ILLUSTRATIVE ORDER OF MAGNITUDE ................................................................. 50 CORS ....................................................................................................................................................... 51
NGS’ Benefit Estimates for CORS ....................................................................................................... 51 An Illustrative Estimate ....................................................................................................................... 53
GRAV-D .................................................................................................................................................. 54 Value GRAV-D Might Have under Current Conditions ...................................................................... 54 The Value of GRAV-D Will Depend On Future Conditions ................................................................ 56
REFERENCES ........................................................................................................................................... 57
APPENDICES ............................................................................................................................................ 62
APPENDIX A: U.S. STUDIES OF SOCIO-ECONOMIC BENEFITS .................................................................... 62 Wisconsin Height Modernization Program ......................................................................................... 62 Montana Height Modernization Pilot Project ..................................................................................... 62 Value of Kentucky Geologic Maps ....................................................................................................... 62 University of Maine Study of the Use and Value of a Geodetic Reference System .............................. 63 Cost-Benefit Analysis of the National Map .......................................................................................... 63
APPENDIX B: THE IMPORTANCE OF SAVING LIFE AND LIMB ..................................................................... 64 Value of Reduced Injury and Disability ............................................................................................... 64 Value of Risk to Life ............................................................................................................................. 64
APPENDIX C: THE NATIONAL HEIGHT MODERNIZATION PROGRAM ......................................................... 66 APPENDIX D: NATIONAL CORS STATION OPERATORS, DECEMBER 1, 2008 ............................................. 68 APPENDIX E: NORTH AMERICAN INDUSTRIAL CLASSIFICATION SYSTEM 2007 CATEGORIES FOR
SURVEYING AND MAPPING ....................................................................................................................... 71
ACRONYMS .............................................................................................................................................. 73
IRVING LEVESON ─ BIOGRAPHY ...................................................................................................... 74

Preface Great challenges abound in supporting our technological society and economy and dealing with broadly defined environmental needs. These include facilitating commerce and industry and addressing issues such as the increasing concentration of population near shorelines and in other vulnerable areas, the growing importance of drought, flooding and water quality and availability, and the upswing in the solar cycle. Among the greatest concerns is climate change, bringing greater variability as well as long run effects of sea level rise. Meeting these challenges requires increasingly precise information about the world around us and systems to facilitate its use. Demands for geospatial information can be expected to grow as conditions evolve and as availability of data increases, ease of use improves and new uses arise. The National Geodetic Survey’s Continuously Operating Reference Stations (CORS) system, the new vertical datum proposed in the GRAV-D Project and the National Spatial Reference System of which they are a part are critical in providing a sound scientific basis for action. This analysis is one of a series of benefit studies sponsored by NOAA’s National Ocean Service to facilitate planning and decision-making. CORS and GRAV-D benefit measurement issues are examined in this scoping study to set the stage for a full examination of socio-economic benefits. In the present and emerging environment the need to demonstrate the value of programs has never been greater. Rapid changes are taking place in CORS and will be facilitated by GRAV-D. Better understanding of customers and applications is essential to meeting service needs and designing programs. And benefit information helps to inform decisions about allocation of resources among programs. This research has benefitted from interviews and discussions with NGS personnel Juliana Blackwell, Doug Brown, Vicki Childers, Bill Henning, Brett Howe, Dave Minkel, Dan Roman, Giovanni Sella, Renee Shields, Dru Smith, Richard Snay, Ronnie Taylor, Steve Vogel, and Dave Zenk, and external discussions with Mark Cheves, Earl Epstein, Erik Gakstatter, Lew Lapine, Mike Rasher and Peter Wiley. Their assistance and insights are greatly appreciated. .

Terms The following terms are used interchangeably:
“height” and “elevation” “GPS height” and “ellipsoid height” “geodetic leveling” and “traditional leveling”

1
Summary
Objectives This is a scoping study to provide the basis for a full analysis of the socio-economic benefits of CORS and GRAV-D to the United States. The objective is to address the questions:
1. Who benefits from CORS, GRAV-D or both?
2. What is the nature and basis of these benefits?
3. What methodology is appropriate for estimating the value of CORS and GRAV-D to society?
4. What information is needed to estimate the values and how can it be obtained?
5. What are the estimated order of magnitude values of socio-economic benefits for CORS and GRAV-D?
The NGS Continuously Operating Reference Station (CORS) system is the cornerstone of the geometric component of the National Spatial Reference System (NSRS). It provides observations from over 1,320 stations in the United States, its territories and a few foreign countries to enable precise positioning. GRAV-D ─ Gravity for the Re-definition of the American Vertical Datum is a project whose goal is to redefine the vertical datum of the United States and replace geodetic leveling in large areas with GPS measurements and a gravimetric geoid model to determine orthometric heights more efficiently and accurately than with the current datum.
CORS and GRAV-D Trade Space (footprint) Measures Surveying and mapping services amounted to $4.9 billion of direct economic activity in 2002, according to the Economic Census. In addition there were $1 billion in sales of maps and atlases in print and electronic form. Business revenue from surveying and mapping is estimated at $8.0 billion in 2008. The U.S. Bureau of Labor Statistics (BLS) estimates survey-related employment in 2006 as:
Surveyors 60,000 Cartographers and photogrammetrists 12,000 Surveying and mapping technicians 76,000
Total 148,000 The overall number of persons employed in surveying and mapping is estimated here as 170,000-200,000. Potential users of spatial information include employees in a wide range of occupations. The

2
occupational employment data show a very large concentration in construction. Hundreds of thousands of civilian federal employees are in functions that are major users of spatial information. In 2007 there were 76,000 non-school state and local governments and special districts, many of which rely on the information as well. Gakstatter and Lorimer have estimated the number of precision GPS users worldwide at 300,000 in 2008. This is consistent with Leveson’s projection of 75,000 in the U.S. in 2008 that was made in the 2006 L2C study.1 Leveson projected the number of precision users in the U.S. at 146,000 in 2012 and 333,000 in 2017. Gakstatter and Lorimer estimate purchases of GNSS equipment, software and services that can provide horizontal positioning of 10 cm or less using GNSS technology as $3 billion in 2008 under their “realistic” scenario and project $6-$8 billion globally by 2012. There were 10.6 million CORS downloads in Fiscal Year 2008, with the vast majority using the Internet’s anonymous file transfer protocol (FTP). The number of CORS data downloads, weighted by the estimated values per download of each type, has been growing by 22% per year since 2003. OPUS will continue to grow over the next several years because of the cost savings and convenience it offers. New services: OPUS-DB, OPUS-Projects, OPUS-Mapper, and CORS offerings of real time information without corrections will increase use and value. Usage could be stimulated by initiatives of large vendors. Demand for real time information will increase as surveyors, engineers and environmental and resource scientists shift from post-processing to be able to verify observations on site and avoid rework. GRAV-D will largely reduce the need for long line leveling. The amount of long line leveling per year by all organizations is estimated very preliminarily as 65,000 km, of which 26,000 km is performed by private survey firms, including work for governments. GRAV-D will provide height information for floodplain management. Approximately 100,000 buildings per year are built in special flood hazard areas of communities that participate in the National Flood Insurance Program.
Benefit Measurement Approach A preferred approach to benefit measurement is the economic productivity approach which emphasizes incremental cost savings and productivity gains to users. The use of avoided costs is a valid conceptual way of determining the efficiency gains that are at the heart of the economic productivity approach. Incremental value estimation considers the benefits above those that would have existed in the absence of a program. The approach takes into account the technological alternatives that would be manifest if CORS and GRAV-D were not available and their relative use and cost. Estimation for GRAV-D focuses on the costs avoided by not having to do long line leveling and the benefits to floodplain management. Since GRAV-D will become available in later years it is necessary to analyze its evolution and prospects under scenarios for possible future environments. Scenarios can increase understanding by organizing a collection of prospects into an overall theme. Three scenarios are presented, the
1 Eric Gakstatter, “Precision Market to Reach $8B by 2012,” GPS World (November 2998), pp.27-30 and Irving Leveson, “Benefits of the New GPS Civil Signal: The L2C Study,” Inside GNSS (July/August 2006), pp.42-56.

3
“standard” scenario in which GRAV-D is completed by 2019, a “stretched” scenario with GRAV-D beginning two years later and taking a year longer to complete, and a “climate change driven” scenario which has profound effects on the demand for GRAV-D. These are to be compared with a baseline scenario in which there is no GRAV-D.
Information Needed and Approach for Obtaining It
Information Needed The information needed for a full analysis includes:
• Technological alternatives for each user group if CORS and GRAV-D were not available.
– Including for CORS, the availability of public and private RTN’s.
• Costs of each technological alternative.
– Cost of traditional positioning. – For CORS, the cost of public and private RTNs and other alternatives. – Costs of added monumentation for state government users.
• The magnitude of the trade space (footprint) that directly benefits from the cost savings.
– For CORS, the amount of use of different technologies. – For GRAV-D, the amount of geodetic leveling longer than 2 km and the numbers
of buildings affected by improved floodplain management.
• The benefit to those that would not use traditional positioning because the value to them is less than its cost.
• The reduction in damages to buildings from improved floodplain management.
• Consumer surplus estimates.
• Estimates of broader societal benefits. A study is envisioned in which quantitative and qualitative information will be obtained from public and private providers and users. User Forum discussions, surveys and interviews will be employed to provide contexts and building blocks for benefit estimates. The information will be used along with databases and information reported in the literature to further understand customers and how NGS programs are used, identify opportunities for case studies and provide a foundation for estimates. The product of the full study will be estimates of the value of CORS and GRAV-D and supporting information.
Study Components User Forums will provide opportunities for group and individual discussion and for some surveys and interviews.

4
Several surveys and extensive interviews will be required. Interviews may be preferred over surveys where greater depth is required than is possible with the amount of time numerous participants are willing to devote to a survey. It may be possible to obtain some information on usage, costs and future plans from interviews with a few large vendors with current or potential prospects for large usage such as Trimble Navigation and TOPCON. Such cases will be explored early on to ascertain whether such interviews can provide information more economically than surveys of customers. The help of professional associations and trade publishers will be elicited in reaching their members or subscribers. NOAA has experience with a number of firms that provide contact lists and firms that conduct on-line and telephone surveys. Some have questions that have been pre-approved by OMB. There may be opportunities to build on the NGS GPRA County Scorecard Survey to obtain information from groups such as county engineers and surveyors. This survey has received fast track approval from OMB in meeting the Paperwork Reduction Act (PWA) requirements. Some surveys and interviews can be designed as components of the Performance Assessment Rating Tool (PART) required by OMB to contribute to meeting assessment requirements and facilitate PWA approval. Two types of case studies will be developed:
• Those that rely largely on information where important changes in measurement have occurred. Where possible, the case studies will compare areas with different geodetic capabilities and make before and after comparisons where CORS stations or monuments have been added and/or other improvements in measurement have been made.
• Those that obtain information from survey firms on the impacts of their efforts and information on cost savings and productivity improvements.
Several approaches to obtaining data will be selected from the following:
• Conduct CORS and Height Measurement User Forums.
• Interview large vendors of services that rely on the NSRS.
• Interview and/or survey state geodetic advisors.
• Interview and/or survey state Height Modernization Program Managers.
• Interview and/or survey private surveying firms.
• Interview and/or survey federal agencies regarding their use of CORS and elevation information and their alternatives.
• Interview and/or survey state and private RTNs.
• Interview and/or survey customers of selected state RTNs.
• Survey members of the Association of State Floodplain Managers or state floodplain management associations.
• Survey members of the National Emergency Managers Association.
• Survey members of other professional associations.
• Survey subscribers to trade publications.
• Collect information on the extent of long line leveling, damages in floodplain areas and

5
other components for estimation of benefits of GRAV-D through contacts with public officials, interviews and searches of data and reports.
• Conduct case studies of areas where improved measurement has occurred and information can be obtained for analysis of the improvements.
• Contract with survey firms to write up their information on costs of alternatives and savings from technological improvements or increased coverage.
• Conduct a separate analysis of the value of the CORS program to NOAA’s Space Weather Program.
The body of the report provides lists of possible questions to be addressed to public and private organizations and professionals.
A Strategy for Getting Started The study can begin with a first stage that moves forward with as much as can be done immediately, while setting in motion the processes that set up and enable activities that require substantial preparation and lead time. The first stage can include the following:
• Determine specific meetings, surveys and cases for analysis.
• Develop email and contact lists for surveys, interviews and forums.
• Finalize questionnaires, interview protocols, and survey methods and explore arrangements with other organizations and potential contractors.
• Submit questionnaires and interview protocols to OMB and respond to their questions.
• Estimate costs of subsequent portions of the full study, develop contract requirements and evaluate potential contractors.
• Collect data and conduct analyses that do not require OMB approval.
– e.g. User Forums, interviewing and/or surveying NGS state geodetic advisors, estimates of components of benefit analysis that are possible initially such as several components of GRAV-D benefits for floodplain management.
Some Order of Magnitude Benefit Estimates An illustrative order of magnitude of benefits of NSRS is $2.4 billion per year. This is derived by building on revenue from private surveying and mapping, adding assumptions for the government and not-for-profit sectors and adding a factor for societal benefits. The $2.4 billion per year, extended over 15 years and discounted at 7%, leads to a present value for the NSRS of $22 billion. If benefits grew at 7% per year, the discounted value would be $36 billion. An estimate of CORS benefits is made by adjusting the NGS estimates to account for the fact that not all users would be willing to pay the full cost of obtaining data from a station and adding a factor for societal benefits. The order of magnitude of CORS benefits is estimated as $758 million per year. The present value of these benefits, discounted at 7% over 15 years, is $6.9 billion even without future growth. If benefits grew at a 15% annual rate, less than the recent growth rate of 22%, the order of magnitude of the present value of CORS benefits over the next 15 years would
6
be $18.5 billion. These figures do not include deductions for government and private costs of providing CORS data. The value of benefits that GRAV-D might have under current conditions is estimated based on avoided costs of long line leveling and benefits of improved floodplain mapping through building standards in vulnerable areas and avoidance of vulnerable areas. Business receipts of firms marketing the product lines “geophysical data acquisition, processing and interpretation” are used in estimating avoided costs of long line leveling. Assumptions are made for the size of revenues of governments and not-for-profit organizations relative to those of private firms, proportions of the activities of each sector that consist of long line leveling and of benefits above user costs (consumer surplus) and societal benefits. The order of magnitude of these benefits of GRAV-D is estimated as $282 million per year. Discounting annual benefits of $282 million over 15 years at a rate of 7% yields a present value of benefits of GRAV-D from avoiding costs of long line leveling of $2.6 billion. A conjectural estimate of the benefit of GRAV-D for floodplain management under current conditions is $240 million per year. This is based primarily on the avoided cost of flood damage to buildings. The present discounted value of benefits of $240 million per year over 15 years is $2.2 billion. Combining the $2.6 billion estimate of the benefits of GRAV-D in avoided costs of long line leveling with the $2.2 billion from improved floodplain management yields a combined conjectural estimate of the present value of benefits of GRAV-D over 15 years of $4.8 billion. Properly valuing GRAV-D requires quantifying its benefits under scenarios for its evolution under future conditions.

7
Socio-Economic Benefits Study: Scoping the Value of
CORS and GRAV-D
Objectives Great challenges abound in supporting our technological society and economy and dealing with broadly defined environmental needs. These include facilitating commerce and industry and addressing issues such as the increasing concentration of population near shorelines and in other vulnerable areas, the growing importance of drought, flooding and water quality and availability, and the upswing in the solar cycle. Among the greatest concerns is climate change, bringing greater variability as well as long run effects of sea level rise. Meeting these challenges requires increasingly precise information about the world around us and systems to facilitate its use. Demands for geospatial information can be expected to grow as conditions evolve and as availability or data increases, ease of use improves and new uses arise. The National Geodetic Survey’s (NGS) Continuously Operated Reference Stations (CORS) system, the GRAV-D proposed datum for gravity-based height measurement, and the National Spatial Reference System of which they are a part are critical in providing a sound scientific basis for action. The CORS system that provides high accuracy GNSS2 data is growing and evolving with added services. GRAV-D will provide consistent vertical data at lower cost than passive monumentation, remove bias and tilt errors and monitor height changes over time. The National Spatial Reference System which encompasses these programs is an increasingly important national infrastructure. Its continued development requires greater knowledge of current and potential users and applications and the benefits society derives from its use. This is a scoping study to determine the current users of CORS and potential users of GRAV-D, to develop methods for data collection and analysis and to begin to assess the socio-economic benefits of the programs. The effort is designed to provide baseline information and to facilitate a full analysis to provide improved information on users and benefits. The questions addressed are: 1. Who benefits from CORS, GRAV-D or both? 2. What is the nature and basis of these benefits? 3. What methodology is appropriate for estimating the value of CORS and GRAV-D to society? 4. What information is needed to estimate the values and how can it be obtained? 5. What are the estimated order of magnitude values of socio-economic benefits for CORS and GRAV-D? 2 GNSS is the Global Navigation Satellite System of Systems that includes the U.S GPS system and its augmentations and the evolving positioning, navigation and timing systems of other countries.

8
The analysis focuses on the United States. Costs of CORS and GRAV-D are not considered. The programs are described, beneficiaries and the nature of the benefits are considered, methodological issues are discussed, information and approaches for estimating benefits are described and illustrative orders of magnitude estimates of benefits are developed.

9
NGS Programs, Applications and Users
National Spatial Reference System The National Spatial Reference System (NSRS) is described as follows:
“NOAA’s National Geodetic Survey defines and manages the NSRS ─ a consistent coordinate system that defines latitude, longitude, height, scale, gravity and orientation throughout the United States. NSRS comprises a consistent, accurate, and up-to-date national shoreline; a network of continuously operating reference stations (CORS) which supports 3-dimensional positioning activities; a network of permanently marked points, and a set of accurate models describing dynamic geophysical processes that affect spatial measurements.”3
CORS provides access to the National Spatial Reference System (NSRS) which is the foundation of the National Spatial Data Infrastructure. The National Geodetic Survey Geodetic Tool Kit provides extensive software that enables on-line interactive computation of geodetic values, including conversion between reference frames.4 NGS undertakes extensive modeling to improve user support and update reference frames.5
CORS The NGS Continuously Operating Reference Station (CORS) system is the cornerstone of the geometric component of the National Spatial Reference System (NSRS) with observations from over 1,320 stations in the United States, its territories and a few foreign countries to enable precise positioning in all three dimensions. 6 Each reference station is equipped with a geodetic-quality receiver capable of receiving radio signals from GPS satellites in at least two frequencies.
3 Steve Hilla, “Reference Frames for GPS Applications and Research,” NOAA GNSS Workshop, Boulder, CO, October 24-25, 2007. Also see http://www.ngs.noaa.gov/CORS/ 4 See http://www.ngs.noaa.gov/TOOLS/program_descriptions.html 5 The tools and their uses are described as follows:
• OPUS will use ITRF2000, to add UTM, State Plane Coordinates, and U.S. National Grid. • Horizontal Time Dependent Positioning (HTDP) will convert ITRFxx ↔ NAD 83 and predict
horizontal velocities. • Geoid03 used to convert NAD 83 ellipsoid heights to NAVD88 orthometric heights. • VDATUM will convert ITRFxx ↔ NAD83, NGVD29 ↔ NAVD88, Tidal Datums (MLW,
MLLW) to MSL, and between any of the above, for a finite set of locations where hydrodynamic models have been developed.
Source: Steve Hilla, “Reference Frames for GPS Applications and Research,” slides, NOAA GNSS Workshop, Boulder, CO, October 24-25, 2007. 6 For more information see Richard A. Snay and Thomas Soler, ”Continuously Operating Reference Station (CORS): History, Applications, and Future Enhancements,” Journal of Surveying Engineering (November 2008), pp.95-104.

10
The CORS network includes numerous subnetworks operated by over 200 organizations. CORS users process GPS data that they have collected at a location of interest, together with associated GPS data from a CORS site, to calculate the coordinates of their data-collection points relative to the CORS site. With its associated tools such as OPUS (Online Positioning User Service), CORS provides free access to highly accurate (centimeter level) positions in the NSRS using GPS, yielding a substantial improvement over “stand alone” GPS which can have meters of inaccuracy. CORS data are used extensively for traditionally horizontal positioning (latitude and longitude), including asset inventory as in locating property boundaries, and for establishing the relative location of natural and man made structures such as rivers, roads, buildings, water pipes and power lines. CORS data also allows monitoring of the motion of critical structures such as dams, bridges and nuclear power plants. The use of CORS for determining vertical (ellipsoid heights) information is growing, and accuracy needs are getting stricter. CORS plays a central role in maintaining the integrity of the National Spatial Reference System in all three dimensions. CORS uses include:
• Developing geographic information systems for planning and service management functions. These include boundary determination for site planning, land use regulation, hydrology and soil conservation.
• Determining legal marine and land boundaries, determining wetlands, fishing areas, mineral rights, insurance coverage, cadastral, etc.
• Shoreline mapping, primarily in ports and other areas of man-made coastal infrastructure. • Calibrating tide gauge data for monitoring sea level rise and creating accurate storm
surge models. • Determining coastal resilience and
monitoring sea level and coastal change.
• Facilitating coastal habitat restoration efforts.
• Monitoring subsidence (sinking of the earths crust) to predict vulnerability to flooding.
• Monitoring horizontal and vertical crustal motion and plate tectonics for earthquake prediction.
• Determining the travel path of a moving platform, including positions of aircraft doing photography and remote sensing. This contributes to many types of mapping, assessing airport approaches and runway obstructions and assessing hurricane damage.
• Monitoring the distribution of precipitable water vapor in the atmosphere for weather prediction.
• Mapping the distribution of free electrons in the atmosphere to predict and measure space
Most Wanted Hydrographic Services Improvements
• “Aggressively map the nation’s shorelines and
navigationally significant waters. • Integrate coastal mapping efforts and ensure
federally mandated channels, approaches, and anchorages are surveyed to the highest standard.
• Modernize heights and implement real-time water level and current observing systems in all major commercial ports.
• Strengthen NOAA’s navigation services emergency response and recovery capabilities.
• Disseminate NOAA’s hydrographic services data and products to achieve greatest public benefit.”
Hydrographic Services Review Panel, HSRP Most Wanted Hydrographic Services Improvements, Federal Advisory Committee Special Report, 2007 http://nauticalcharts.noaa.gov/ocs/hsrp/hsrp.htm

11
weather, which can have large effects on aircraft, power grids and telecommunications. CORS enables differential GPS positioning for post-processing with accuracies from 1 to 10 centimeters, or better. Users need deploy only one GPS receiver and obtain corresponding CORS data over the Internet. Centimeter accuracy is required for floodplain mapping because slight differences in elevation can cause large water flows. High accuracy also is required for precision agriculture, for determining the path of moving platforms such as aircraft engaged in remote sensing and for examining crustal motion. More than 200 digital cameras designed for use aboard aircraft are operational in the world. Together they image tens of millions of square kilometers per year.7 A minority of GIS applications requires centimeter accuracy. User Friendly CORS (UFCORS) is a Web-based utility enabling users to obtain a specific block of GPS data for a station contained in the CORS network. The On-line Positioning User Service (OPUS) is a Web-based utility that provides GPS users with easier access to the National Spatial Reference System (NSRS). OPUS enables its user to submit their GPS data to NGS. Upon receipt, the OPUS utility automatically assesses the quality of the submitted data and calculates 3-dimensional coordinates for the location where the submitted data was collected. These calculations use data corresponding GPS data from several CORS. OPUS-Static (OPUS-S), the standard version, requires users to submit at least 2 hours worth of GPS data. OPUS-Rapid Static (OPUS-RS) requires users to submit as little as 15 minutes worth of data, but the accuracy of its results are highly dependent on the geometry of the
7 Peter deSelding and Sophia-Antipolis, “Pixel Factory Provides Increasingly Popular Cheap and Easy Imaging,” Space News International (November 24, 2008), p.17.

12
CORS network in the vicinity of the location where the submitted data were collected. The OPUS online interface is shown below. OPUS-Database (OPUS-DB), which went into operation in 2008, allows users to enter OPUS-computed coordinates into the NGS database for use in combination with data in the system to improve existing geodetic control points or add new ones. Forthcoming products include:
• OPUS-Projects, which will allow users to submit observations collected simultaneously from multiple receivers.
• OPUS-Mapper, which will allow short occupation times (approximately one minute) with code data from mapping grade GPS equipment to obtain positions with accuracies of potentially one meter or less.8
In addition to its post-processing services, CORS has been providing real time GPS data, without correctors, experimentally from several government sites. NGS is considering streaming GPS observables data from about 200 federally funded CORS.9 CORS geographic coverage and OPUS-RS vertical standard errors are indicated in the following two figures. OPUS-RS standard errors in each horizontal dimension (north-south and east west)
8 William Stone, “The Evolution of the National Geodetic Survey’s Continuously Operating Reference Station Network and Online Positioning User Service,” National Geodetic Survey and University of New Mexico, Albuquerque, NM, n.d., pp.9-10 and Daniel J. Martin, “CORS ─ What It is, What It Was, What It Shall Be,” slides, Maine Society of Land Surveyors, January 24, 2008. 9 William Henning, “NGS Expands Its Role in Real-Time Network Positioning,” Professional Surveyor Magazine (November 2008).

13
at a given location may be estimated by dividing the corresponding vertical standard error depicted in the second figure by a factor of 3.5.
GRAV-D Program GRAV-D ─ Gravity for the Re-definition of the American Vertical Datum is a project whose goal is to redefine the vertical datum of the United States and replace geodetic leveling in large areas with GPS measurements and a gravimetric geoid model to determine orthometric heights more efficiently and accurately than with the current datum. GRAV-D will redefine and improve the vertical component of the National Spatial Reference System, improving orthometric height accuracy to within 2cm (wherever possible) compared to as much as 2m today. While GPS provides ellipsoid heights, orthometric heights (sometimes colloquially called “heights above sea level”) based on gravity are required to accurately determine the direction water will flow. GRAV-D will provide a vertical datum that is accessed more economically than traditional leveling when carried out over horizontal distances greater than about 2 km.10
10 Geodetic leveling meets the need for more accurate measurement for more local applications.
Because the geoid changes slowly, the investment in GRAV-D is expected to pay off for a long time.

14
GRAV-D will provide measurements that are geographically continuous rather than the present “cloud of points” based on physical monuments. It will reduce the costs of flood plain and other mapping, eliminate errors from use of inconsistent data across sites, enable greater use of real time data and monitor changes over time. Problems associated with the destruction of passive marks and their costly replacement will be eliminated.11 Once the program is completed, NAD 83 and NAVD 88 will be replaced by newer, more accurate datums.12
GRAV-D is expected to remove a bias of approximately 40 cm, as well as a tilt of 1 meter across the lower 48 states that exists in NAVD 88. It will eliminate errors of up to 2 meters in Alaska, provide a consistent vertical datum across all the islands of Hawaii, produce a regionally consistent and accurate vertical datum for Puerto Rico and the Virgin Islands, and provide an accurate vertical datum across the entire regions of Guam, the Northern Marianas Islands and American Samoa. It will encourage the use of a single standard among U.S. agencies and it will facilitate interoperability with datums of other nations. Because the geoid changes slowly, the investment in GRAV-D is expected to pay off for a long time.
GRAV-D functions, improving on and extending those of NAVD 88, will advance height measurement and topographical mapping. The need for orthometric height measurement to accurately measure the direction of water flow is increasingly important in an era of rising concern about climate change. One observer suggests that “GRAV-D will be used by every surveyor that uses real time or post-processing techniques.” GRAV-D will contribute to:
• Storm surge modeling. • Monitoring sea level rise. • Monitoring subsidence, flooding
and drought. • More accurately measuring the
11 NGS estimates that at $3,000/km, re-leveling NAVD 88 would cost $2.25 billion. See Dru A. Smith, “How the National Height Modernization Program Can Support the NGS Ten Year Plan,” slides for address to NGS National Height Modernization Conference, Miami, FL, September 18 – September 19, 2008. 12 See National Oceanic and Atmospheric Administration, National Geodetic Survey, The GRAV-D Project: Gravity for the Redefinition of the Vertical Datum, November 14, 2007, National Oceanic and Atmospheric Administration, National Geodetic Survey, “GRAV-D: Gravity for the Re-definition of the American Vertical Datum,” slides, January 28, 2008, and National Oceanic and Atmospheric Administration, The National Geodetic Survey Ten-Year Plan: Mission, Vision and Strategy, 2008-2018, n.d.
“Floodplain maps serve as the basis for determining whether homes or buildings require flood insurance under the National Flood Insurance Program run by the Federal Emergency Management Agency (FEMA). Approximately $650 billion in insured assets are now covered under the program. …there is sufficient two-dimensional "base map imagery" available from digital orthophotos (aerial and satellite photographs similar to those viewed on Google Earth) to meet FEMA’s flood map modernization goals. However, the three-dimensional ‘base elevation data’ that are needed to determine whether a building should have flood insurance are not adequate. FEMA needs land surface elevation data that are about ten times more accurate than data currently available for most of the nation.” [emphasis added]
National Research Council, Elevation Data for Floodplain Mapping, Washington, D.C.: 2007, Executive Summary, p.1.

15
height and flow of water in flat areas to efficiently make use of water resources. • Indentifying current and long term expected flood-prone areas to guide new construction. • Monitoring changes over time in crustal motion to predict earthquakes and water flow. • Planning construction of buildings and infrastructure. • Planning evacuation routes and other emergency responses and reconstruction. • Improving ship navigation and air and train safety. • More efficient application of fertilizer and pesticide to lower food costs and reduced
runoff of chemical pollutants. NGS describes the GRAV-D project components as follows:13
“The GRAV-D project consists of three major campaigns:
1. High-resolution “snapshot” of gravity o This is a predominantly airborne campaign, covering approximately 7-10
years and estimated at approximately 38.5 Million dollars. 2. Low-resolution “movie” of gravity
o This will mostly encompass episodic re-visits of absolute gravity sites, attempting to monitor geographically dependent changes to gravity over time. This will allow time dependent geoid modeling and thus time dependent orthometric height monitoring through GNSS technology
3. Regional partnership surveys o Due to the difficulty of monitoring the finest details of the gravity field
over time, NGS seeks to collaborate with local partners willing to work with NGS to monitor local variations in the gravity field and incorporate that information into NGS time dependent geoid models.”
The actual timetable for implementation and the capability and costs of the GRAV-D program will depend on funding and partnership arrangements. The NGS National Height Modernization Program which includes a diverse set of initiatives is described in Appendix C. The economic footprint of NSRS applications is indicated in measures of actual and potential market size for using sectors and in program usage data which are discussed next.
13 “What is GRAV-D” http://www.ngs.noaa.gov/GRAV-D/whatisgrav-d.shtml

16
Trade Space (Footprint) Analysis
Surveying and Mapping Employment and Revenue
Private Surveying and Mapping Industry Data The 2002 Economic Census reports receipts and number of employees of surveying and mapping establishments. Receipts of all types of products of these establishments are included. Each location of a firm is considered a separate establishment. Separate data are reported for establishments that have paid employees and those that do not. All receipts of establishments that are primarily engaged in surveying and mapping are included, including activities other than surveying and mapping. Employees of all kinds are included. The data include work done by private firms for governments and not-for-profit organizations as well as for commercial firms. Total receipts of all products of these establishments, including those that do not consist of surveying and mapping, were $5.8 billion in 2002. 14 The combined number of establishments is 21,543. Employment is 79,038, of which 11,681 is self-employed, which is taken to be the number of establishments with no payroll. The data do not include self-employed in establishments with payroll.
The Private Surveying and Mapping Industry, 2002 NAICS Industry Code
Description
Establish- ments
Receipts (millions)
Receipts per Establish- ment
Annual Payroll (millions)
Paid Employees
Payroll per Employee
Establishments with Payroll
54136 Geophysical surveying & mapping services
742
$1,048.8
$1,413,477
$394.8
8,183
$48,246
54137 Surveying & mapping (except geophysical) services
9,120
$4,277.7
$469,046
$2,046.3
59,174
$34,581
Total 9,862 $5,326.5 $540,103 $2,441.1 67,357 $36,241
Establishments without Payroll
54136 Geophysical surveying & mapping services
3,030
$139.8
$46,139
─
─
─
54137 Surveying & mapping (except geophysical) services
8,651
$291.6
$33,707
─
─
─
Total 11,681 $431.4 $36,932 ─ ─ ─
COMBINED TOTAL 21,543 $5,757.9 $267,275 ─ ─ ─
Source: U.S. Census Bureau, 2002 Economic Census.
There undoubtedly was rapid growth in surveying and mapping between the recession year of 2002 and the height of the construction boom that followed. However, the industry also has been impacted by the subsequent decline, so it is not certain whether numbers of establishments or
14 The classification of surveying and mapping industries being used in the 2007 Economic Census is shown in Appendix E.

17
employees in 2008 are very different than in 2002. Inflation will have made receipts and salaries higher but purchasing power may not be greater than in 2002. 15 Private Surveying and Mapping Product Revenue In addition to the industry data, the 2002 Economic Census reports business receipts for surveying and mapping product lines. The numbers do not include activities of governments or
Receipts for Surveying and Mapping Product Lines, 2002
Product line code
Product line
Receipts of establish-ments with this product line (millions of dollars)
Receipts in this product line (millions of dollars)
Surveying and mapping, excluding geophysical surveying 34350 Geospatial photo and image acquisition from aircraft and satellites 448 173 34360 Geospatial photo & image processing, incl. orthophoto, elevation
& terrain modeling 322
133
34370 Geospatial data interpretation 130 26 34380 Integrated surveying and mapping services 3,892 3,295 34390 Thematic mapping, orthophoto mapping, and charting 244 59 34400 Geographic information systems development and customization
322 53
34410 Geospatial Consulting services, including expert witness (testimony) services
153
9
34420 Geospatial data conversion and digitizing services 248 35 34430 Training services related to surveying and mapping 101 6 34440 Sale of geospatial products 320 90 TOTAL of surveying and mapping, excluding geophysical
surveying $6,180 $3,879
Geophysical surveying and mapping 34450 Geophysical data acquisition 774 494 34460 Geophysical data processing 176 58 34470 Geophysical data interpretation services 69 23 34480 Integrated geophysical services 417 234 34490 Sale of geophysical products 285 219 34500 Geophysical consulting services, including survey design and
expert witness services 84
12
34510 Geophysical data management services 206 20 34520 Training services related to geophysical surveying 15 * 34530 Rental of geophysical surveying equipment 47 3 34540 Sale of geophysical surveying equipment 85 4 TOTAL of geophysical surveying and mapping $2,158 $1,067 TOTAL of all surveying and mapping $8,338 $4,948 *Less than 0.5. Source: U.S. Census Bureau, Product Lines: 2002, 2002 Economic Census, Professional, Scientific and Technical Services, Subject Series, ECO2-54SL-LS, November 2005, Table 1.
15 2007 data from the Economic Census will not be available for a couple of years.

18
Not-for-profit organizations. The data are according to the product codes of the North American Industrial Classification System for 2002. The more current 2007 classification is in Appendix E. It is used in the 2007 Economic Census data being released from 2009 through 2011. The first column includes all receipts of private establishments with any surveying and mapping revenue, regardless of product or whether those establishments are primarily engaged in surveying and mapping. These amounted to $8.3 billion. The numbers differ from those in the industry table shown previously which includes non-surveying and mapping products for establishments that are primarily engaged in surveying and mapping, not for establishments with any surveying and mapping revenue. The second column shows receipts only for surveying and mapping products regardless of the nature of the establishment. Surveying and mapping services amounted to $4.9 billion of direct economic activity in 2002. In addition to the services shown, there were $1 billion in sales of maps and atlases in print and electronic form. Allowing for inflation and economic growth, 2008 business receipts are estimated to be 35% higher, or $8.0 billion, including both for profit professional services and maps. This number is relied upon for the estimate of the benefits of NSRS.
Employees in Surveying and Mapping Occupations There are 37,000 registered surveyors according to the National Council of Examiners for Engineering and Surveying which licenses them. The American Surveyor, Professional Surveyor and POB, publications run by the same company, report circulation of 40,000. About one quarter of GPS World’s circulation of 40,000 is in the categories “surveying and mapping” and “mapping, natural resources, location services.” The semiweekly GPS World Engineering and Construction Newsletter has a circulation of 17,000. The U.S. Bureau of Labor Statistics (BLS) provides estimates for survey-related employment in 2006:16
Surveyors 60,000 Cartographers and photogrammetrists 12,000 Surveying and mapping technicians 76,000
Total 148,000 Some unlicensed surveyors are apparently counted in the surveyor category since the numbers exceed the license data. A substantial number of surveying and mapping technicians are likely to do surveying. These numbers include employees of commercial firms both in and outside of the surveying and mapping industry, including all self-employed, and employees in government and not-for-profit organizations as well. However, they do not include other technical and office personnel in surveying and mapping functions. If these represented about half of the employees in the Economic Census data, the combined number of persons would be 170,000-200,000.
16 Appendix to Dohm, Arlene and Lynn Shniper, "Occupational Employment Projections to 2016," Monthly Labor Review, November 2007, pp. 86-105.

19
Numbers of Precision GNSS Users and Spending Gakstatter and Lorimer have estimated the number of precision GPS users worldwide at 300,000 in 2008. This is consistent with Leveson’s projection of 75,000 in the U.S. in 2008 made in the 2006 L2C study.17 Leveson projected the number of U.S. precision users at 146,000 in 2012 and 333,000 in 2017. Gakstatter and Lorimer estimate purchases of GNSS equipment, software and services that can provide horizontal positioning of 10 cm or less using GNSS technology as $3 billion in 2008 under their “realistic” scenario and project $6-$8 billion globally by 2012. Their numbers imply initial spending of $10,000 per precision user per year. Spending on precision GNSS data services is forecast to grow most rapidly, at 33%-38% per year. Economic conditions may temper these values.
Potential Market Size Data A number of data sets provide insights into the potential users of NSRS. Actual numbers and expenditures of users will be a percentage of that potential and depend on many economic, technological, cultural and institutional factors.
Government Activities Federal government civilian employment, shown by function, includes many activities that may benefit from spatial information.18 Some functions of interest are in bold.
17 Eric Gakstatter, “Precision Market to Reach $8B by 2012,” GPS World (November 2008), pp.27-30 and Irving Leveson, “Benefits of the New GPS Civil Signal: The L2C Study, Inside GNSS (July/August 2006), pp.42-56. 18 An official of the U.S. Department of Agriculture advises that on any given day there are 10,000-20,000 GPS users in the agency, only a handful of whom are surveyors. Some are seasonal. The Forest Service, has about 30,000 GPS users, some of whom are doing general surveying and some doing cadastral work. Federal agencies with significant numbers of GPS users also include the U.S. Geological Survey, the Fish and Wildlife Service, the Bureau of Land Management, and the Bureau of Indian Affairs.

20
Federal Civilian Employment by Function, 2006
Function Employees TOTAL – ALL FUNCTIONS 2,720,688 Financial Administration 111,715 Other Government Administration 23,719 Judicial and Legal 58,903 Police 161,013 Correction 35,896 Highways 2,831 Air Transportation 44,792 Water Transport & Terminals 4,574 Public Welfare 8,307 Health 136,200 Hospitals 161,695 Social Insurance Administration 65,218 Parks and Recreation 25,872 Housing and Community Development 15,984 Natural Resources 184,213 Nat Defense/International Relations 698,040 Postal Service 772,125 Space Research & Technology 18,457 Other Education* 10,418 Libraries 4,002 Other and unallocable 176,714 Source: U.S. Census http://www.census.gov/govs/www/apesfed06.html
In 2007 there were more than 76,000 non-school state and local governments and special districts.19
County 3,033 Municipal 19,492 Town or township 16,519 Special districts 37,381 Total 76,425
Special districts provide a wide range of services, including water, sewer, fire, drainage, conservation, health, housing and transportation. Many of these benefit from spatial information.
Occupation Data for Some Potential Users Other than Surveying and Mapping The U.S. Bureau of Labor Statistics estimates of 2006 employment in occupations provide additional insights into possible numbers of spatial information users. Categories of interest (in the order they appear in the occupational classification) are shown below. Some important users may not be included because they are part of broader occupational categories. The importance of construction is evident. 19 U.S. Census http://www.census.gov/govs/www/cog2007.html

21
Occupations of Some Potential Users Other than Those In
Surveying and Mapping Occupations, 2006 Occupation
Employment (thousands)
Environmental engineers 54 Mining and geological engineers, including mining safety engineers
7
Conservation scientists 20 Foresters 13 Environmental scientists and specialists, incl. health 83 Geoscientists, except hydrologists and geographers 31 Hydrologists 8 Urban and regional planners 34 Geographers 1 Geological and petroleum technicians 12 Environmental science and protection technicians, incl. health
37
Forest and conservation technicians 34 Agricultural equipment operators 59 Forest and conservation workers 20 Logging equipment operators 40 Construction equipment operators 494 Rail-track laying and maintenance equipment operators
16
CORS Partners, Customers, Usage and Prospects
Participating Organizations The CORS network contains more than 1,320 stations providing data. The operators are listed in Appendix D Notable participants include universities, largely for surveying and geodesy education, and state transportation departments, for a variety of functions including road construction and repair and vehicle safety, and county and municipal governments. Some private firms are included. The pie chart indicates the percentage of stations operated by each type of participating organization. 30% of the stations are operated by organizations of the U.S. federal government and 42% of the stations are operated non-federal governments. Academic organizations operate about 15% and commercial organizations 11%.

22
Customers Data on types of customers and where they work comes from CORS online survey which collects responses to questions on a pop up questionnaire that opens to a random selection of visitors to the CORS Web site. Unfortunately, response rates run around 5½% and it is not known how representative respondents are of the user population. 61% of those reporting occupation are land surveyors or engineers, 9% are geodesists or cartographers, 6% are GIS or mapping users and 14% are researchers, educators or students. 58% work in the private sector, 32% are in some level of government and only 5% are in academia.

23
Usage and Prospects CORS Usage There were 10.6 million CORS downloads during Fiscal Year 2008, with the vast majority using the Internet’s anonymous File Transfer Protocol (FTP).
Service
CORS Data Downloads (thousands)
OPUS-RS 72.2 OPUS-S 182.1 UFCORS 1,043.0 CORS FTP 9,391.0
45,000 unique hosts (unique email addresses) have used the OPUS-S utility since it was introduced in 2001. Currently, about 300 new unique hosts are added to this number each month. The CORS Newsletter reported that 2,945 unique hosts (unique IP addresses) downloaded 803,194 RINEX files via CORS FTP in November 2008. A single host made 63% of the requests, accounting for 16% of the data volume. Three quarters of data downloads came from the 1% of hosts making 1,000 or more requests. The number of individuals or teams that are end users is not known. Since there are some very heavy users and many very light users, average use is meaningful only for aggregate calculations. By way of illustration, per the above table, if the average user drew 200 downloads per year, the number if end users would be about 50,000. The number of CORS data downloads, weighted by the estimated values per download of each type, has been growing by 22% per year since 2003. The average number of OPUS-S submissions per user has been relatively steady over recent years at about 5. Such a low average, if applied to all categories of CORS users, would produce a total number of users that is far too large to be plausible, so a much larger number of submissions per user must apply, at least to CORS-FTP. OPUS-RS submissions have been rising rapidly, in large part because of switching from OPUS-S. OPUS-S submissions have stabilized or declined somewhat since 2006.

24
The number of OPUS-S users has stabilized or continued to increase at a slower rate than before the introduction of OPUS-RS.
CORS Prospects OPUS will continue to grow over the next several years because of the cost savings and convenience it offers. New services: OPUS-DB, OPUS-Projects, OPUS-Mapper, and CORS offerings of real time information without corrections will increase use and value.20 Usage could
20 These programs are described in William Stone, “The Evolution of the National Geodetic Survey’s Continuously Operating Reference Station Network and Online Positioning User Service,” Proc. 2006 ION-IEEE Position, Location, and Navigation Symposium, Institute of Navigation (ION), Fairfax, VA, and Institute of Electrical and Electronic Engineers (IEEE), Piscataway, NJ, pp.653-663.

25
be stimulated by initiatives of large vendors. As many as 90% of UFCORS downloads are made by Trimble Navigation in support of a processing service for their Pathfinder equipment. TOPCON has experimented with CORS FTP to see if they could handle large data volumes, possibly a precursor to a service that requires downloading CORS data. Other GNSS vendors could provide services that use OPUS as a computational tool. NGS is planning to offer OPUS-S and OPUS-RS results in XML format in addition to the current ASCII file format, which also could lead to vendors offering value-added services that generate OPUS growth. Use of CORS will continue to expand beyond survey and mapping to include more of the GIS community and growing environmental and resource management applications. The expanded uses will account for a rising share of CORS value to society. Demand for real time information will increase as surveyors, engineers and environmental and resource scientists shift from post-processing to be able to verify observations on site and avoid rework. Real time networks (RTNs) will become more widespread as a result of efforts of both state transportation departments and private providers, and will be able to take advantage of CORS real time information. Public RTNs will be better able to make use of each other’s information to deal with boundary areas and jurisdictions that cut across state lines and will find other ways to cooperate. NGS standards and reference frames as well as use of NTRIP which allows sharing of data among networks will further cooperation. Private RTNs will cover a larger area of the nation and some systems will cover increasingly large regions. However, they will continue to use diverse reference frames for some time. Positioning, navigation and timing will continue to improve from new signals and from additional constellations and satellites with the evolution of the Global Navigation Satellite System (GNSS),
GPS system accuracy has improved dramatically over time. The development of improved receivers, RTK techniques and networks has enabled further advances, and prices or user equipment have fallen dramatically. Improvements in the signal are indicated below.
Source of graph: Tom Powell, “Global Positioning Systems Wing GPS Program Update to 48th CGSIC

26
the system of systems. These improvements will reduce the need for CORS among some users, but they also could spawn the rise in high precision applications, some of which benefit from CORS. It is uncertain whether the U.S. will support more than 24 operational GPS satellites for civilian use and whether a full constellation of 30 satellites can be expected from Galileo. The slow pace of GPS and Galileo satellite deployment and the advancing schedule of GLONASS will make support for GLONASS increasingly important. While much GLONASS use will await the eventual availability CDMA signals which involve lower cost of equipment, some receivers for the FDMA signal are being sold and use is increasing. However, GLONASS may not achieve its recently announced ambitious schedule of a full constellation of modernized satellites and ground stations since that appears to have been predicated on oil revenues which were at a peak when the decision was made. Slow European deployment of Galileo will lead initially to increased reliance on multiple GPS signals in the U.S. while awaiting a larger number of satellites from other nations. This will make CORS support of L2C data more important. CORS support for L5 will be essential for use with the Galileo E5 signal. However, L5 is not expected to be have full operational capability until several years after Galileo. The new solar cycle, if it materializes as originally expected with a high peak around 2011-201221 could:
• Increase interest in real time data among surveyors because of the importance of verifying information while still in the field.
21 There has been some suggestion that the solar cycle is rapidly weakening. See Eric Gakstatter, “Back to the Subject of Solar Activity,” GPS World Engineering and Construction Newsletter, October 14, 2008.

27
• Increase reliance on multiple signals both from GPS and GLONASS to reduce vulnerability to distortions.
Both developments would support CORS plans to add services to some extent even if the solar cycle turns out to be delayed or weakening.
GRAV-D Customers, Uses and Scenarios
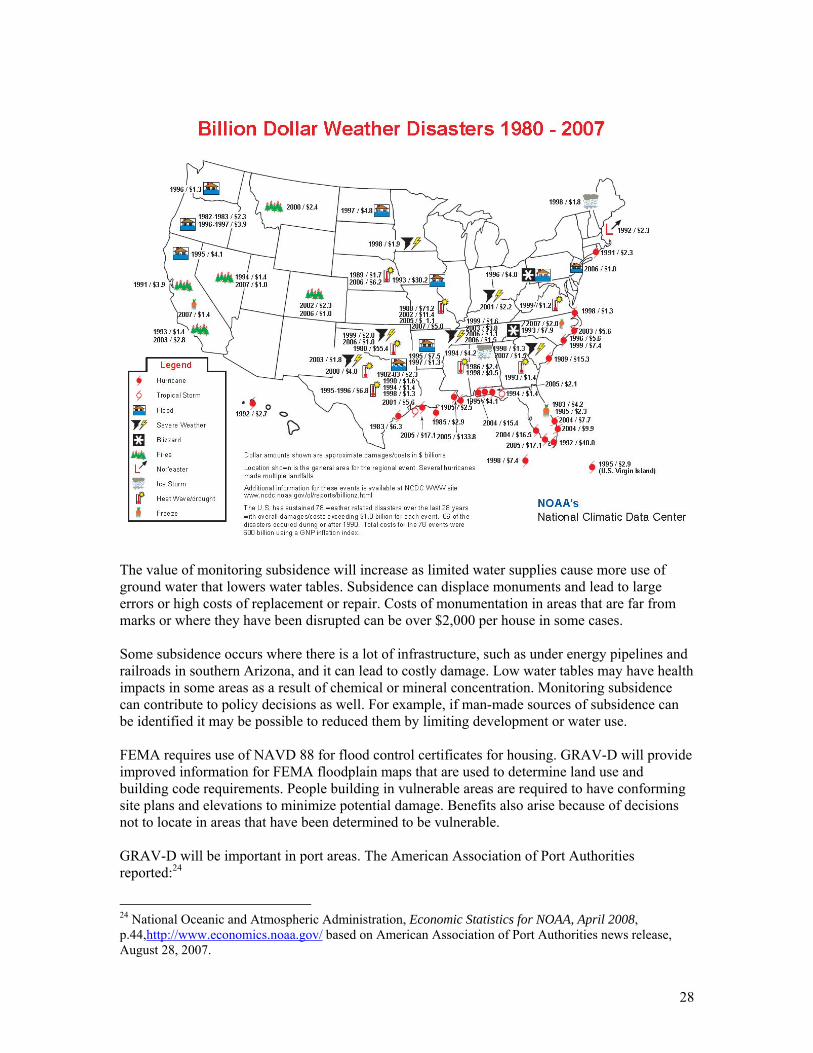
Customers and Uses The magnitude of the issues to which GRAV-D can contribute is huge. Floods produce damage of several billion dollars per year as well as injury, loss of life and economic disruption. Natural disasters of all kinds are concentrated on the coasts and on flood plains and inland waterways where improvements can be facilitated with GRAV-D. The Gross Domestic Product (GDP) of all coastal states was $11.4 trillion in 2007. Watershed counties accounted for $7.9 trillion and inland counties for $3.5 trillion.22 Colgan and Atkins reported that: “The combined coastal zone and watershed counties on the Gulf of Mexico comprised 14% of employment in Alabama, 4% in Mississippi, 6% of Florida, but 33% of Texas employment and more than 80% of Louisiana.”23 The concentration of billion dollar weather disasters of several kinds along coastal areas is evident in the map below.
22 National Ocean Economics Program http://noep.mbari.org/ 23 C. Colgan, C. and J. Adkins, “2005 Hurricane Damage to the Gulf of Mexico Ocean Economy,” Monthly Labor Review, February, 2006, p.76.
The GDP of all coastal states was $11.4 trillion in 2007. Watershed counties accounted for $7.9 trillion and inland counties for $3.5 trillion.
28
The value of monitoring subsidence will increase as limited water supplies cause more use of ground water that lowers water tables. Subsidence can displace monuments and lead to large errors or high costs of replacement or repair. Costs of monumentation in areas that are far from marks or where they have been disrupted can be over $2,000 per house in some cases. Some subsidence occurs where there is a lot of infrastructure, such as under energy pipelines and railroads in southern Arizona, and it can lead to costly damage. Low water tables may have health impacts in some areas as a result of chemical or mineral concentration. Monitoring subsidence can contribute to policy decisions as well. For example, if man-made sources of subsidence can be identified it may be possible to reduced them by limiting development or water use. FEMA requires use of NAVD 88 for flood control certificates for housing. GRAV-D will provide improved information for FEMA floodplain maps that are used to determine land use and building code requirements. People building in vulnerable areas are required to have conforming site plans and elevations to minimize potential damage. Benefits also arise because of decisions not to locate in areas that have been determined to be vulnerable. GRAV-D will be important in port areas. The American Association of Port Authorities reported:24
24 National Oceanic and Atmospheric Administration, Economic Statistics for NOAA, April 2008, p.44,http://www.economics.noaa.gov/ based on American Association of Port Authorities news release, August 28, 2007.

29
“Last year [2007], United States deep-draft seaports and seaport-related businesses generated approximately 8.4 million American jobs and added nearly $2 trillion to the economy, according to a just-completed study by a Lancaster, PA-based business consulting service that specializes in port-sector economic impact studies.
Of the 8,397,301 Americans working for ports and port-related industries in 2006, nearly 7 million were employed by firms involved in handling imports and exports, such as retailers, wholesalers, manufacturers, distributors and logistics companies….
Businesses providing goods and services to U.S. seaports directly and indirectly paid $314.5 billion in total wages and salaries. Of this total, $207.4 billion came directly from businesses involved in handling international waterborne commerce.”
New and expanded applications can arise with greater measurement accuracy and other technological improvements. Declining costs of equipment and growth of networks could extend the use of GPS-based machine control. Road construction presently applies conventional leveling to measure elevations up to 2 cm for graders and scrapers. If the geoid model achieves 1 cm accuracy it could potentially replace much of that activity. State and local governments spend more than $300 billion per year on highway capital expenditures and operations. Better measurement also can lead to replacement of some conventional leveling for water supply, sewage, conservation and commercial and mass transit activities as well. Large savings are possible in agriculture with machine control because it increases accuracy in spreading seed, fertilizer and pesticides. Accuracy provides environmental benefits because reduced use of fertilizer and pesticides results in less runoff pollution. The accuracy and consistency available with GRAV-D can make a difference in emergency response, evacuation, prevention and amelioration. Inconsistent datums and faulty measurements can lead to errors with consequences for life and health for emergency workers and the general public. Height measurement can assure that passable evacuation routes are available and that reconstruction reduces future vulnerabilities. More than a million first responders and those they assist depend on reliable information and systems. The U.S. Bureau of Labor Statistics estimates that in 2006 there were 156,000 emergency medical technicians and paramedics, 253,000 firefighters, 103,000 first-line supervisors/managers of police and detectives and 655,000 police and sheriffs’ patrol officers.25 In addition there are many first aid squad and fire fighting volunteers and Community Emergency Response Team members. The availability of GRAV-D can accelerate improvements in the accuracy of height measurement because it avoids the costs of establishing passive marks and makes it possible to cover more remote and more sparsely populated areas. Despite years of effort, there is no state that has yet fully completed a state-wide height modernization program. North Carolina is closest
25 Arlene Dohm and Lynn Shniper, "Occupational Employment Projections to 2016," Monthly Labor Review, November 2007, pp. 86-105.
State and local governments spend more than $300 billion per year on highway capital expenditures and operations.
More than a million first responders and those they assist depend on reliable information and systems.

30
to completion, followed by California and Wisconsin. The NGS Height Modernization Program is described in Appendix C.
Adoption by State Governments and Others NAVD 88 was completed in 1993 and Florida, the first state government to use it completely for its employees and contractors, will only do so in 2010. States should phase in reliance on the GRAV-D datum more quickly than NAVD 88 as the standard for their use. That is because users have become more sophisticated, NGS has started earlier with its education campaign and GRAV-D offers attractive benefits of relative simplicity and cost efficiency. Moreover, by the time GRAV-D is available more states will have moved away from paper systems that inhibit transition. The full use of GRAV-D by state governments instead of NAVD 88 may not occur until many years after it is available. However, implementation of the program will span a decade so some states will have several years for adoption until the overall program is completed. In some states the need to use NAVD 88 in order to covert to GRAV-D could accelerate NAVD 88 use before the GRAV-D program begins. These factors also should lead to more widespread adoption among federal agencies. If adopted internationally, GRAV-D could further assist in understanding climate change by facilitating comparisons with data from other nations to improve measurement and interpretation.
NGS Vision Dru Smith, NGS Chief Geodesist, offers the following vision for the GRAV-D program:
“The era of using geodetic leveling for continent-scale vertical datum definition comes to an end.
The gravimetric geoid, long used as the foundation for hybrid geoid models, becomes the most
critical model produced by the National Geodetic Survey (NGS). Before 2018, NGS proves that a
1-cm geoid is computable (or shows where it is not and why) and produces (in conjunction with
other North American geodesists) the most accurate continent-sized gravimetric geoid model ever
seen. The model covers, at the very least, the region extending from the North Pole to the Equator
and from Attu Island to Newfoundland. This model then serves as the foundation for a new
vertical datum for at least the conterminous United States, if not the entire North American
continent. Similar smaller scale geoid-based vertical datum initiatives are undertaken for those
United States territories which do not fall within the neighborhood of North America. To fully
support this work, an entirely modernized program of gravity observation, modeling, monitoring,
analysis and dissemination (called “the GRAV-D project”) is established within NGS. The gravity
field becomes a monitored time-dependent part of the National Spatial Reference System. The
time-varying nature of the gravity field is considered in all products and services of NGS. The
culmination of all of these efforts allows fast, accurate determination of heights through GPS, and
thus truly represents “Height Modernization” as originally envisioned. By 2018, a new
geopotential datum (for orthometric and dynamic heights) is defined and realized through the
combination of GNSS technology and gravity field modeling. In order to support users of NAVD
88, NGS will provide transformation tools between the new datum and NAVD 88 based

31
predominantly on the few thousand measurements of GPS derived ellipsoid heights on NAVD 88
benchmarks.” 26
Scenarios Since GRAV-D will become available in later years it is necessary to analyze its evolution and prospects under scenarios for possible future environments. Scenarios can increase understanding by organizing a collection of prospects into an overall theme. Contrasting the scenarios is useful to indicate implications of a range of conditions and allow selection based on one’s expectations of conditions that will evolve. Three scenarios are presented, the “standard” scenario in which GRAV-D is completed by 2019, a “stretched” scenario with GRAV-D beginning two years later and taking a year longer to complete, and a “climate change driven” scenario which has profound effects on the demand for GRAV-D. These can be compared with a baseline scenario in which there is no GRAV-D. The scenarios are shown in the next table. The common features also apply in the baseline scenario without GRAV-D. Climate change could have an especially great influence on the value of GRAV-D by altering the frequency and intensity of major changes in water flow. Initiatives in response to concerns about climate change would have consequences for the value of GRAV-D, regardless of how fully the concerns materialized. That is because of the heightened value placed by the public on climate concerns and also because of the use of GRAV-D information in major program decisions and operations. Climate change will drive efforts at prediction and initiatives for prevention, adaptation, response and amelioration. And it will influence the pace at which GRAV-D is developed and used.
26 Dru A. Smith, “GRAV-D,” Spatially Speaking, FGDC Monthly Update, April 2008 http://www.fgdc.gov/library/spatially-speaking/spatially-speaking-apr08/?searchterm=GRAV-D
Climate change could have an especially great influence on the value of GRAV-D by altering the frequency and intensity of major changes in water flow. Initiatives in response to concerns about climate change would have consequences for the value of GRAV-D, regardless of how fully the concerns materialized.
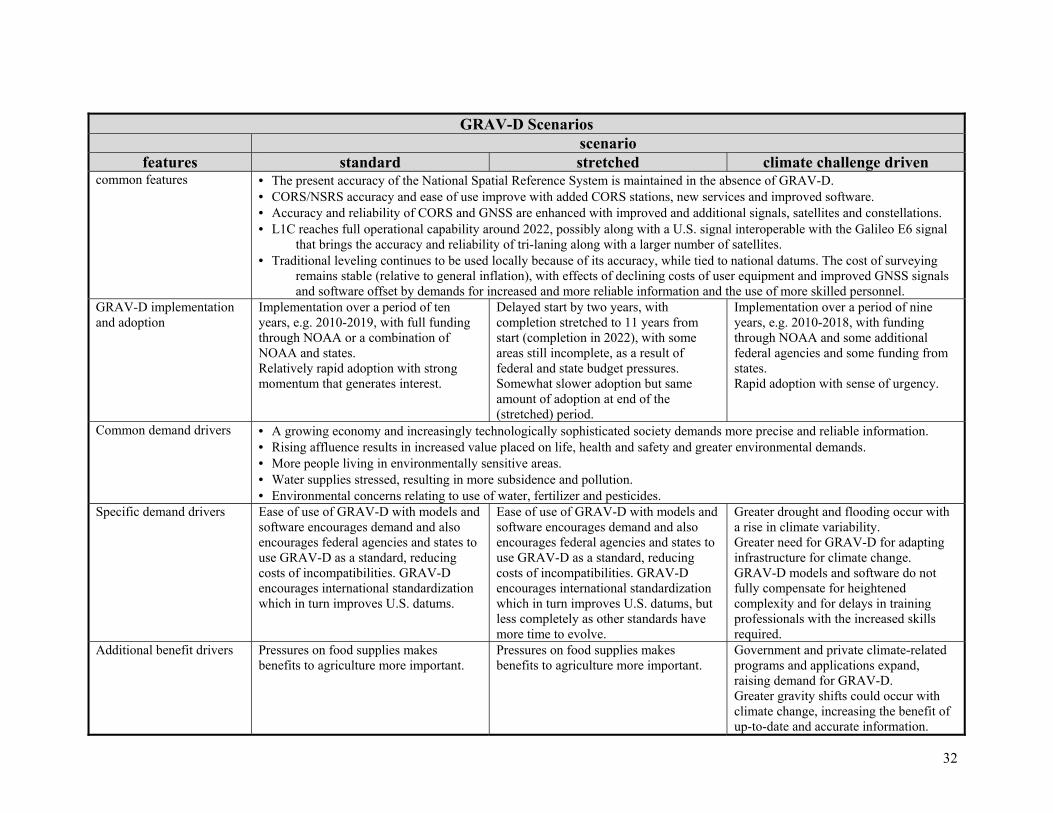
32
GRAV-D Scenarios
scenario features standard stretched climate challenge driven
common features • The present accuracy of the National Spatial Reference System is maintained in the absence of GRAV-D. • CORS/NSRS accuracy and ease of use improve with added CORS stations, new services and improved software. • Accuracy and reliability of CORS and GNSS are enhanced with improved and additional signals, satellites and constellations. • L1C reaches full operational capability around 2022, possibly along with a U.S. signal interoperable with the Galileo E6 signal
that brings the accuracy and reliability of tri-laning along with a larger number of satellites. • Traditional leveling continues to be used locally because of its accuracy, while tied to national datums. The cost of surveying
remains stable (relative to general inflation), with effects of declining costs of user equipment and improved GNSS signals and software offset by demands for increased and more reliable information and the use of more skilled personnel.
GRAV-D implementation and adoption
Implementation over a period of ten years, e.g. 2010-2019, with full funding through NOAA or a combination of NOAA and states. Relatively rapid adoption with strong momentum that generates interest.
Delayed start by two years, with completion stretched to 11 years from start (completion in 2022), with some areas still incomplete, as a result of federal and state budget pressures. Somewhat slower adoption but same amount of adoption at end of the (stretched) period.
Implementation over a period of nine years, e.g. 2010-2018, with funding through NOAA and some additional federal agencies and some funding from states. Rapid adoption with sense of urgency.
Common demand drivers • A growing economy and increasingly technologically sophisticated society demands more precise and reliable information. • Rising affluence results in increased value placed on life, health and safety and greater environmental demands. • More people living in environmentally sensitive areas. • Water supplies stressed, resulting in more subsidence and pollution. • Environmental concerns relating to use of water, fertilizer and pesticides.
Specific demand drivers Ease of use of GRAV-D with models and software encourages demand and also encourages federal agencies and states to use GRAV-D as a standard, reducing costs of incompatibilities. GRAV-D encourages international standardization which in turn improves U.S. datums.
Ease of use of GRAV-D with models and software encourages demand and also encourages federal agencies and states to use GRAV-D as a standard, reducing costs of incompatibilities. GRAV-D encourages international standardization which in turn improves U.S. datums, but less completely as other standards have more time to evolve.
Greater drought and flooding occur with a rise in climate variability. Greater need for GRAV-D for adapting infrastructure for climate change. GRAV-D models and software do not fully compensate for heightened complexity and for delays in training professionals with the increased skills required.
Additional benefit drivers Pressures on food supplies makes benefits to agriculture more important.
Pressures on food supplies makes benefits to agriculture more important.
Government and private climate-related programs and applications expand, raising demand for GRAV-D. Greater gravity shifts could occur with climate change, increasing the benefit of up-to-date and accurate information.

33
Methodologies for Estimating the Value of CORS and GRAV-D
Benefit Measurement Approaches
The Economic Productivity Approach A preferred approach to benefit measurement is the economic productivity approach which emphasizes cost savings and productivity gains to users. (Cost savings and productivity increases each allow the user to do the same with fewer resources or do more with the same resources.) Interest is in the incremental benefits of CORS and GRAV-D, that is, the benefits above those that would have existed in their absence. The approach takes into account the technological alternatives that would be manifest if CORS and GRAV-D were not available and the differences in the extent of use relative to alternatives. Use patterns are affected by improved capabilities that result in additional uses and greater activity. Responses to technology and market opportunities will differ among applications. The economic productivity approach includes consumer surplus (value to users above their cost ─ see text box). It also includes societal benefits such as those to health, safety and the environment and property damage avoided, to the extent that they can be measured. Appendix B indicates values that have been used to value loss of life and limb. The economic productivity approach differs from the expenditure/economic impact approach which measures benefits as spending on the program and additional spending which is “induced” by the initial expenditure. The expenditure/economic impact approach does not subtract the lost benefits from other spending being displaced by spending on the program. Also, as generally applied it does not include productivity gains, consumer surplus or broader societal benefits.
Consumer Surplus Organizations or individuals will purchase a good or service if they perceive the benefits to be as at least as great as the cost, where cost includes both what they have to pay for the service and the incremental cost of using it (such as downloading and processing data). They will differ in the values they attach, that is, what they are willing to pay. A demand curve is a schedule of what customers are willing to pay, with those with the highest benefit acting when costs are higher. The area under the demand curve and above the user cost or purchase price (triangle ABC) is the consumer surplus.
The use of avoided costs is a valid conceptual way of determining the efficiency gains that are at the heart of the economic productivity approach.

34
The 1998 Height Modernization Study The 1998 Height Modernization Study27 examined the benefits of using GPS technology for height surveys instead of conventional methods, based on avoided costs. The use of avoided costs is a valid conceptual way of determining the efficiency gains that are at the heart of the economic productivity approach. The study compared the new GPS technologies with traditional leveling that would be used in their absence. Sixteen case studies were conducted: 1) using post-analysis of existing height survey projects, and 2) controlled test surveys using each of the methods in the same location. The widely-cited result is that the benefits of a National Height Modernization system would be $12+ billion.28 The findings represent the potential of the new techniques and not the benefits currently or expected to be derived. As the study notes, at the time, accurate height measurement “techniques are not yet commonly known or practiced in the private-sector surveying community, and require a major technology transfer effort to introduce them on a widespread basis.”29 To determine expected instead of the upper limit of benefits it would be necessary to project the actual amount of usage in each sector rather than to apply the cost savings to all of it. Benefits are appropriately in dollars of constant purchasing power and consider gains over a 15 year period. However, they are not discounted to the present by a rate that reflects the cost of funds. For example, discounting a 15 year stream of equal values with a 7% discount rate would reduce the value of benefits by 39%.
80% of the $12+ billion in total benefits calculates for National Height Modernization comes from saving $9.6 billion in maritime navigation and safety over 15 years. This is calculated as $640 million per year in additional tax receipts from an annual increase of $16 billion in cargo value in domestic waters as a result of positioning of dredges and cargo ships and other benefits from NDGPS reference stations near ports and harbors.30,31 The increase in cargo value is based on the unofficial judgment of unnamed representatives of the maritime industry. The tax benefits are gross. There is no allowance for use of the tax revenue to make investments in infrastructure to handle the increase in cargo. However, benefits other than tax revenues are not included. The direction of effects on the value of benefits, if alternative methods had been used in the Height Modernization Study, are indicated in the next table. 27 Dewberry & Davis and Psomas & Associates, National Height Modernization Study: Report to Congress, Washington, DC: National Oceanic and Atmospheric Administration, National Geodetic Survey, June 1998. 28 Ibid, p.xviii. 29 Ibid, p.xiii. 30 The $16 billion increase in cargo value is from NDGPS. Inexplicably, other NDGPS benefits aren’t included in the summary. 31 Note that the estimates of the benefits of height modernization refer to benefits of all GPS used in place of conventional leveling. This includes, for example, maritime GPS that would continue to exist in the absence of CORS.

35
Methods that If Used In the 1988 Height Modernization Study Would Have:
Raised Benefit Estimates Reduced Benefit Estimates Including market growth to estimate future benefits
Allowing for only the portion of each sector using the new technologies at present or in the future to count actual rather than potential benefits
Including consumer surplus Discounting benefits to the present year Including indirect economic benefits to other sectors
Counting tax benefits where used, as net of government expenditures required to support the added services
Including values for non-economic benefits such as improvements in health, safety and the environment
Other U.S. benefit studies are discussed in Appendix A.
Use of Avoided Cost to Measure Benefits of CORS and GRAV-D The most direct benefits of CORS and GRAV-D can be measured by the costs avoided by users in not having to conduct their own on site measurements. This requires knowing how many users would conduct geodetic surveys in the absence of CORS or GRAV-D, the alternative technologies they would use, how extensively those technologies would be used and the costs of using those technologies. Avoided costs can overestimate value because some users would not be willing to pay the costs of the obtaining data from a station if they had to. Measuring avoided costs by the cost of going to an existing station and taking measurements, however, does not take into account the cases in which it would be necessary to pay for or set up a network or build a new benchmark.
CORS Technological Alternatives The current CORS program serves precision users for whom post-processing provides sufficient accuracy and timeliness at lower cost than alternatives. CORS replaces most horizontal positioning. Both real time and post-processing methods are alternatives to CORS. Alternatives for obtaining similar or better accuracy include the International GNSS Service (IGS) which uses post-processing to obtain high accuracy, network RTK services, a High Accuracy Reference Network where available and developing one’s own network. Some may obtain access to the NSRS through vendors that use CORS as a processing tool for a GPS service. For users who are state governments, alternatives also include repairing, replacing or setting up additional passive marks. For those who need less accuracy than available through CORS such as most GIS users, options include using unrefined satellite data, NDGPS, or satellite based augmentation services such as the public WAAS or the private StarFire and OmniSTAR systems. Compared to CORS cm accuracy, pseudorange GPS provides typical horizontal accuracy of ~10 m, RTK 1-10 cm and

36
DGPS 1-3 m. The importance of the particular alternatives to different types of users can be assessed in forums, interviews and/or surveys. Taking Into Account the Mix of Alternatives Calculation of avoided costs for CORS must take account not only the savings over use of surveying but also that 1) the extent to which more recent alternatives such as real time networks (RTNs) have become available and that 2) some users would not have done positioning in the absence of CORS because the information was worth less than the costs. The discussion that follows illustrates the way benefit estimates depend on the mix of alternatives. NGS encourages RTNs to include some of their stations in CORS so data from all of their stations can be aligned with CORS. Consequently, some view RTNs as an extension of the CORS system. However, not all RTNs participate in CORS and users of RTNs may have different costs than those that use CORS directly. The procedure for taking into account a mix of alternatives that is illustrated below applies for any combination of alternatives. According to Bill Henning of NGS there are approximately 75 RTNs in the U.S. including those run by State Departments of Transportation and by private firms, and their number is growing rapidly. RTNs offer lower costs than traditional positioning. Consequently, CORS provides less saving for those whose alternative is use of an RTN than for those whose alternative is traditional positioning. Benefit calculations must take into account the mix of CORS users with the different alternatives. Consider a hypothetical example. Suppose:
1. 2/3 of CORS users would have used traditional surveying if CORS were not available. 2. CORS allowed a survey user to save 90% over the cost of positioning or setting up their
own reference network. 3. Private RTNs cost 20% of the costs of traditional positioning or setting up one’s own
network. Since CORS costs 10%, it provides a saving of 10% (20%-10%). 4. Private RTNs were available to one-third of CORS users who would take advantage of
them.
The avoided costs would then be 2/3 x 90% + 1/3 x 10% or 67%. If half of users had and used a private RTN alternative, the average saving over CORS would be ½ of 90% + ½ of 10% or 50%. If some had an alternative of using a public RTN at no charge, the overall avoided cost would be lower.
GRAV-D Avoided Costs of Long Line Leveling Substantial parts of the country do not have adequate or any geodetic leveling (coasts, southern Alaska, flat flood plains, etc.) and could benefit from the use of GRAV-D. The primary alternative for height measurement is geodetic leveling.

37
Avoided costs of GRAV-D depend on:
1. The number of public and private users in each type of geographic area that would undertake geodetic leveling without GRAV-D.
2. How much leveling they would do. 3. The costs that would be avoided if GRAV-D were used. 4. The avoided cost of not having to check on or rely on old, out of date benchmarks. 5. The value of GRAV-D to those that would not have done geodetic leveling because the
value to them was less than the cost of leveling.
This depends on the number of such users and estimates of the proportion of the cost of leveling that the information is worth to them.
Repairing or replacing monuments is part of the cost of geodetic leveling. For states that would add monumentation, those costs must be included in their savings from GRAV-D. For the system, avoided costs also should take into account the saved cost of building, repairing or replacing monuments after GRAV-D is available, to the extent they are above those costs that are counted in the avoided costs of long line leveling. This could include, for example, states’ efforts to expand networks of monuments for both public and private use. The Economic Basis of GRAV-D Benefits through Floodplain Mapping Benefits of GRAV-D result from more accurate heights in floodplain maps. They include reduced property damage when fewer structures are built in vulnerable areas and those that are built are constructed to higher standards. There also can be benefits from reduced injuries and loss of life if fewer people are in areas with danger or in improperly constructed buildings. FEMA produces maps that are used in floodplain management in tens of thousands of communities for site planning and elevation requirements. The maps are based on information on physical benchmarks that sometimes are several decades old, resulting in errors in height of up to several feet in areas where rapid subsidence has occurred. FEMA is conducting aerial mapping with lidar to improve the maps, but the measurements are tied to the often outdated benchmarks. GRAV-D will make it possible to use the GPS aerial information that yields ellipsoid heights to generate orthometric heights at any point that are independent of physical benchmarks. FEMA is saving the aerial mapping information so it can use it to make the transition when GRAV-D is available and is expected to convert its maps to heights based on GRAV-D over time. In areas where rapid changes occur, FEMA will be able to do periodic spot checks to provide updates. Benefits of GRAV-D based height measurement for floodplain management depend on:
• The number of houses that would no longer be built in vulnerable areas when GRAV-D enables more accurate maps.
o This excludes effects of improvements in structures that come independently of GRAV-D, for example as a result of state height modernization programs that involve aerial surveying together with establishment of additional and restored benchmarks and networks.
• Average property damage avoided per house by not locating in a vulnerable area.
• The additional number of houses in vulnerable areas that would be built to floodplain

38
management standards rather than lesser standards as a result of GRAV-D information.
o This excludes effects of improvements in structures that come independently of GRAV-D, for example as a result of state height modernization programs that involve aerial surveying together with establishment of additional and restored benchmarks and networks.
• The reduction in property damage per house for houses built in floodplains according to
floodplain management standards as a result of GRAV-D information.
• The additional cost per house built in a floodplain for complying with floodplain management ordinances.
• Lives saved per house because of building outside of instead of inside vulnerable areas.
• Lives saved per house because of building to standards inside vulnerable areas.
• The value per life saved.
• Reduced number of injuries per house because of building outside of instead of inside
vulnerable areas.
• Reduced number of injuries per house because of building to standards inside vulnerable areas.
• Value per reduced injury.
There also are benefits associated with commercial and industrial structures. Consequences of GRAV-D for the National Flood Insurance Program (NFIP) are less important than for the overall values of structures. A very small portion of losses are insured, especially in years of high losses (see graph). The flood insurance program covers about six million homes with a total property value of about $1 trillion. Nevertheless, participation is only about 17% and coverage is limited.

39
Insurance premiums and claims payments largely represent transfers from one set of individuals to another and not net gains.32 Federal disaster assistance and subsidies to NFIP from the Federal government and states are transfer payments among taxpayers and benefitting individuals and not net economic losses. The losses would already be included in the total value of insured and uninsured losses. Benefits of GRAV-D will be estimated by:
• Examining cost savings from long line leveling under alternative scenarios for the future environment, including getting firmer estimates of the proportion of survey work that consists of long line leveling and for its societal benefits.
• Examining benefits of GRAV-D for floodplain management under alternative scenarios for future conditions, investigating in greater detail how GRAV-D will be applied, and assessing the numbers of structures that may be strengthened or built in other locations, prospects for reduction in flood damage, and data indicating possible loss of life and injury.
32 While better information may lead some to discover they are not in a floodplain, others will discover that they are, so the net change may not be large.

40
Information Needed for Estimating the Values and How It Can Be Obtained
A study is envisioned in which quantitative and qualitative information will be obtained from public and private providers and users. User Forum discussions, surveys and interviews will be employed to provide contexts and building blocks for benefit estimates. The information will be used along with databases and information reported in the literature to further understand customers and how NGS programs are used, identify opportunities for case studies and provide a foundation for estimates. The product of the full study will be estimates of the value of CORS and GRAV-D and supporting information. Year-by-year estimates will be displayed for the full programs and present values calculated. In this section, information needed is indicated, components of the study are described and a possible strategy for getting started is noted.
Information Needed for a Full Study Information needed includes:
• Technological alternatives for each user group if CORS and GRAV-D were not available.
– Including for CORS, the availability of public and private RTN’s.
• Costs of each technological
alternative.
– Cost of traditional positioning. – For CORS, the cost of public and private RTNs and other alternatives. – Costs of added monumentation for state government users.
• The magnitude of the trade space (footprint) that directly benefits from the cost savings.
– For CORS, the amount of use of different technologies. – For GRAV-D, the amount of geodetic leveling longer than 2 km and the numbers
of buildings affected by improved floodplain management.
• The benefit to those that would not use traditional positioning because the value to them is less than its cost.
• The reduction in damages to buildings from improved floodplain management.
“By assessing user needs of county surveyors, state DOTs, regional surveying and geospatial associations, etc., NGS will validate that local users have the NOAA-enabled infrastructure, tools and local capacity needed for accurate positioning.”
NGS Ten-Year Plan: Mission, Vision and Strategy, 2008-2018, p.9.

41
• Consumer surplus estimates.
• Estimates of broader societal benefits.
Components of a Full Study User Forums will provide opportunities for group and individual discussion and for some surveys and interviews. Several surveys and extensive interviews will be required. Surveys will be selected based on the need for information beyond what can be obtained from User Forums and interviews, and on the availability and cost of lists of names and email addresses and survey processes. Surveys will be conducted by email or on-line. Potential respondents will be contacted by email to inform them about the survey and request participation. Pretests will be performed where possible to refine formats and questions and evaluate responses.
Interviews may be preferred over surveys where greater depth is required than is possible with the amount of time numerous participants are willing to devote to a survey. Interviews can include unstructured portions that allow lines of inquiry to be followed up selectively where a respondent has particular knowledge or to determine the basis of their judgments of magnitudes for the benefit estimation model. It may be possible to obtain some information on usage, costs and future plans from interviews with a few large vendors with current or potential prospects for large usage such as Trimble Navigation and TOPCON. Such cases will be explored early on to ascertain whether such interviews can provide information more economically than surveys of customers. The help of professional associations and trade publishers will be elicited in reaching their members or subscribers. This may be an effective way to reach professional groups that work in diverse locations and types of organizations. It may be necessary to contract with those professional associations that prefer to conduct surveys themselves to maintain the member relationship, assure confidentiality, improve participation or incorporate other information. There also may be opportunities to jointly conduct meetings or participate in and conduct interviews at conferences of these organizations. NOAA has experience with a number of firms that provide contact lists and firms that conduct on-line and telephone surveys. Some have questions that have been pre-approved by OMB. There may be opportunities to build on the NGS GPRA County Scorecard Survey to obtain information from groups such as county engineers and surveyors. This survey has received fast track approval from OMB in meeting the Paperwork Reduction Act (PWA) requirements. Some surveys and interviews can be designed as components of the Performance Assessment Rating Tool (PART) required by OMB to contribute to meeting assessment requirements and facilitate PWA approval. Two types of case studies will be developed:
• Those that rely largely on information where important changes in measurement have

42
occurred. Where possible, the case studies will compare areas with different geodetic capabilities and make before and after comparisons where CORS stations or monuments have been added and/or other improvements in measurement have been made.
• Those that obtain information from survey firms on the impacts of their efforts and information on cost savings and productivity improvements.
Several approaches to obtaining data will be selected from the following:
• Conduct CORS and Height Measurement User Forums.
o Conduct interviews and surveys with partners and users.
o Conduct breakout sessions to discuss applications and benefits with a number of categories of users.
• Interview large vendors of services that rely on the NSRS.
• Interview and/or survey state geodetic advisors.
• Interview and/or survey state Height Modernization Program Managers.
• Interview and/or survey private surveying firms.
• Interview and/or survey federal agencies regarding their use of CORS and elevation information and their alternatives.
• Interview and/or survey state and private RTNs.
• Interview and/or survey customers of selected state RTNs.
• Survey members of the Association of State Floodplain Managers or state floodplain management associations.
• Survey members of the National Emergency Managers Association.
• Survey members of other professional associations.
o There are many organizations that could be considered, for example the American Water Resources Association, the Geological Society of America, and the American Society of Civil Engineers.
• Survey subscribers to trade publications.
• Collect information on the extent of long line leveling, damages in floodplain areas and other components for estimation of benefits of GRAV-D through contacts with public officials, interviews and searches of data and reports.
• Conduct case studies of areas where improved measurement has occurred and information can be obtained for analysis of the improvements.
• Contract with survey firms to write up their information on costs of alternatives and savings from technological improvements or increased coverage.
o Include situations where firms have information on uses before and after improvements in geodetic control, CORS coverage and/or height modernization.
• Conduct a separate analysis of the value of the CORS program to NOAA’s Space Weather Program.

43
Benefit Estimation Model and Information Process Diagrams The underlying benefit estimation model and study processes are depicted in the charts below. (The blue boxes on the bottom of the Benefit Estimation Process chart reflect the situation in CORS where some users would not have done positioning in the absence of CORS because the information was worth less than the costs so there is no alternative technology to compare with.)

44
+
+ +X
Benefit Estimation Model
number of users of each type
number of each type of user that would use each technology
cost of each technology
savings in avoided cost for each type of user
number that would not use an alternative technology
technological alternatives
value per user that would not use an alternative technology
value to users that would not use an alternative technology
total direct value to users consumer
surplus
total value to users
societal benefits
total value of benefits to society
=
=
= =
X
=

45
Information Generation
Type of Information
Possible Source of Information User Forums
inter-views
surveys
case studies – external
case studies – survey firm
analysis
benefit estimation
Categories and numbers of users of each type
X X X X
Nature and amounts of actual (or potential) use
X X X X
Technological alternatives
X X X X
Cost of each technology X X X X X Numbers that would not use an alternative tech
X X X X
Value per user for those who would not use an alternative technology
X X X X
Possibilities for case studies
X X
Direct value to users estimation
X X X X X X X
Consumer surplus factor estimation
X
Total value to users estimation
X
Societal benefits factors or estimates
X X
Total value to society estimation
X
Some Questions for Forums, Interviews and Surveys The following are among the questions that may be asked to elicit information on use and benefits and to identify cases where further analysis may be revealing. These will require finalization and in some cases pre-testing.
Questions for Organizations
• What are the main activities of your organization?
• In which of your activities are CORS products/services used? Please answer for each service.
• Briefly describe how you use CORS products and services?
• How many people in your organization use CORS products and services?
• What are the main advantages of CORS products/services for each of the activities listed?
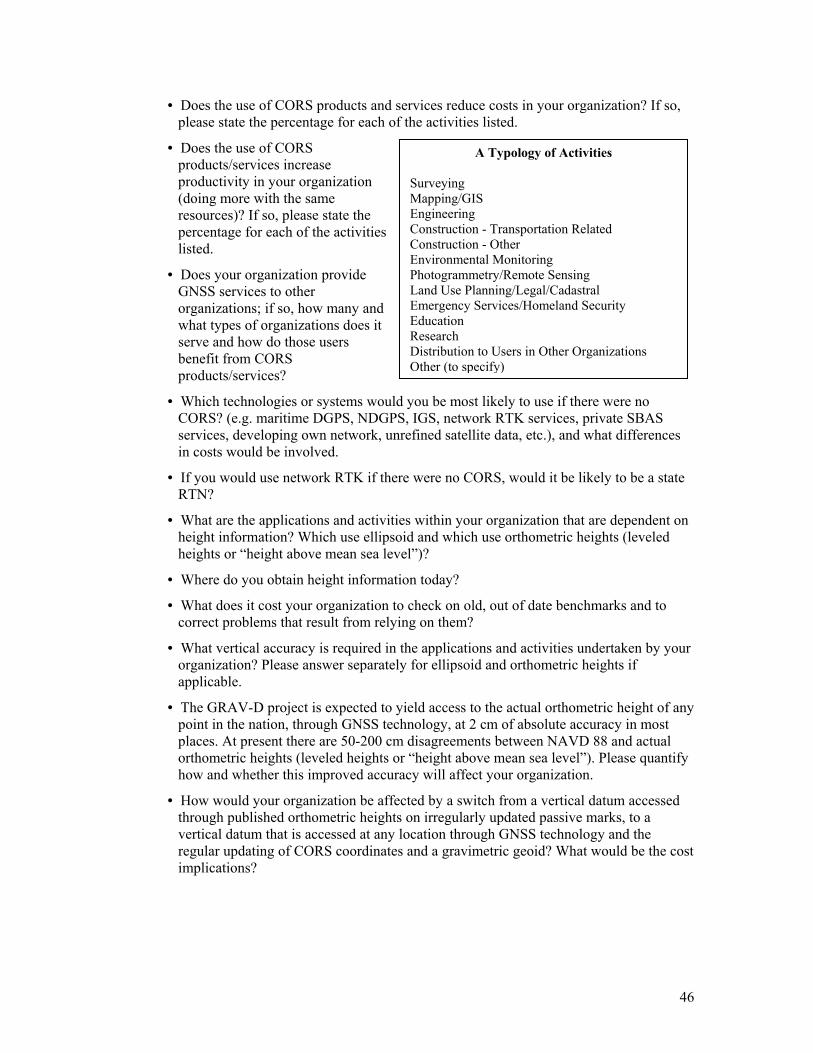
46
• Does the use of CORS products and services reduce costs in your organization? If so, please state the percentage for each of the activities listed.
• Does the use of CORS products/services increase productivity in your organization (doing more with the same resources)? If so, please state the percentage for each of the activities listed.
• Does your organization provide GNSS services to other organizations; if so, how many and what types of organizations does it serve and how do those users benefit from CORS products/services?
• Which technologies or systems would you be most likely to use if there were no CORS? (e.g. maritime DGPS, NDGPS, IGS, network RTK services, private SBAS services, developing own network, unrefined satellite data, etc.), and what differences in costs would be involved.
• If you would use network RTK if there were no CORS, would it be likely to be a state RTN?
• What are the applications and activities within your organization that are dependent on height information? Which use ellipsoid and which use orthometric heights (leveled heights or “height above mean sea level”)?
• Where do you obtain height information today?
• What does it cost your organization to check on old, out of date benchmarks and to correct problems that result from relying on them?
• What vertical accuracy is required in the applications and activities undertaken by your organization? Please answer separately for ellipsoid and orthometric heights if applicable.
• The GRAV-D project is expected to yield access to the actual orthometric height of any point in the nation, through GNSS technology, at 2 cm of absolute accuracy in most places. At present there are 50-200 cm disagreements between NAVD 88 and actual orthometric heights (leveled heights or “height above mean sea level”). Please quantify how and whether this improved accuracy will affect your organization.
• How would your organization be affected by a switch from a vertical datum accessed through published orthometric heights on irregularly updated passive marks, to a vertical datum that is accessed at any location through GNSS technology and the regular updating of CORS coordinates and a gravimetric geoid? What would be the cost implications?
A Typology of Activities Surveying Mapping/GIS Engineering Construction - Transportation Related Construction - Other Environmental Monitoring Photogrammetry/Remote Sensing Land Use Planning/Legal/Cadastral Emergency Services/Homeland Security Education Research Distribution to Users in Other Organizations Other (to specify)

47
Some Questions for Interviews and Surveys of State Height Managers and State Geodetic Advisors
• How do applications and usage of horizontal and vertical positioning vary among parts
of the state that differ in CORS coverage?
• What changes have there been in the number of CORS stations in the state, and what has been the effect of the addition of CORS stations on applications and use?
• What are the plans for adding monumentation and CORS stations in the state and what are the expected benefits?
• How extensively and in what applications is NAVD 88 being used in the state vs. other datums?
• What proportion of leveling in the state is long line leveling of 2 km or more?
• Who needs more accurate and consistent height information in the state? For which applications? Please specify whether for ellipsoid heights or orthometric heights (leveled heights or height above mean sea level).
• How much of the state and which parts of the state do not have good gravimetric height measurement?
• How would the state be affected by a switch from a vertical datum accessed through published orthometric heights on irregularly updated passive marks, to a vertical datum accessed at any location through GNSS technology and the regular updating of CORS coordinates and a gravimetric geoid?
• How rapidly is the state government likely to require the use of GRAV-D for its employees and contractors after the datum is available?
• How extensively is the state expected to rely on monumentation after GRAV-D is available?
• If the state participates in the NGS National Height Modernization Program, what has the program done and how do applications and usage of horizontal and vertical positioning differ after the changes?
• What are the state’s plans for its height modernization program and what are its expected benefits?
Some Overall Questions for Forums, Interviews and Surveys
• What are the amount of use, users and applications of each existing CORS capability
and expected use of each new one?
• What are your suggestions for cases to examine where the addition of or upgrade of CORS stations may have had effects that can demonstrate their use or benefits?
• What are the quantities of use of state RTNs, numbers of users and of extent of each application?
• What are the quantities of use of private RTNs, their numbers of users and the extent of each application?

48
• What would be the effects of the addition of public RTNs on CORS applications and use?
• What would be the effects of the addition of private RTNs on CORS applications and use?
• For what purposes would GRAV-D be used most extensively or most importantly and with what benefits?
In addition, several major vendors of services or products that do or may make use of the NSRS in a processing service such as Trimble Navigation and TOPCON will be interviewed to determine if they will provide information on usage, costs to users and future plans.
Estimating Societal Benefits and Consumer Surplus Estimating societal benefits generally involves determining quantitative changes and attributing values to them. Some data on quantitative changes such as lives saved, reduced injury and disability, and reduced loss of property may be obtained from pubic reports, interviews or case studies. Where information is insufficient, reliance can be placed on informed judgments of professionals and values found in other studies. Environmental impacts attributable to the programs are difficult to determine and it may be necessary to rely on qualitative indications or judgments. Findings on quantitative changes can be combined with economically accepted measures of valuation of improvements. Appendix B provides such values for saving of life and limb. Consumer surplus can be estimated based on simplifying assumptions about the shape of the demand curve for the information that is provided or enhanced by the programs. This depends on the importance of the information to the applications in which it is used and either the cost of substitute means for obtaining the information or the cost of alternative information. Results can be presented with and without estimates of broad societal benefits or consumer surplus for readers who prefer to focus on more direct benefits.
A Strategy for Getting Started The study can begin with a first stage that moves forward with as much as can be done immediately, while setting in motion the processes that set up and enable activities that require substantial preparation and lead time. The first stage can include the following:
• Determine specific meetings, surveys and cases for analysis. • Develop email and contact lists for surveys, interviews and forums. • Finalize questionnaires, interview protocols, and survey methods and explore
arrangements with other organizations and potential contractors. • Submit questionnaires and interview protocols to OMB and respond to their questions. • Estimate costs of subsequent portions of the full study, develop contract requirements and
evaluate potential contractors. • Collect data and conduct analyses that do not require OMB approval.

49
– e.g. User Forums, interviewing and/or surveying NGS state geodetic advisors, estimates of components of benefit analysis that are possible initially such as several components for GRAV-D benefits for floodplain management.

50
Estimated Orders of Magnitude Values of Socio-Economic Benefits of NSRS, CORS and GRAV-D
Value of the NSRS: Illustrative Order of Magnitude The value of the National Spatial Reference System includes the benefits of CORS and current height measurement datums. An order of magnitude estimate is built up starting with data on private activities and adding illustrative assumptions. The resulting figure is not net of the direct public and private costs of providing or acquiring the information. The willingness of end users to purchase surveying and mapping services and data from the private sector in the amount of about $8 billion provides a minimum estimate of the gross annual contribution of the private business sector to benefits of activities related to the NSRS. Many users derive value greater that the price they pay in the market (consumer surplus). Taking consumer surplus into account, the value of benefits related to private sector surveying and mapping services, including government and not-for-profit users of the private services, could be $10.4 billion.33, 34 These values do not include government efforts ─ services produced by government rather than obtained through purchase. (Government purchases from the private sector are already included in business receipts.) They also do not include surveying and mapping done by private and not-for-profit organizations for themselves. Assuming all of these are equal to the private survey firm efforts of $8 billion, and adding that to the private survey firm portion of $10.4 billion, the illustrative benefit is $18.4 billion per year. The $18.4 billion includes the contributions of the national GPS infrastructure and systems in organizations using National Spatial Reference System information. Systems and resources in using organizations include, for example, computer, information and communication systems, construction, farming and transportation systems, other labor and equipment, scientific research, etc. If these were assumed to contribute 90% of value added and the benefit of NSRS the remaining 10%, the value of the NSRS would be $1.84 billion per year. The $1.84 billion does not include the value of societal benefits such as those to life, health, safety, property damage and the environment. Adding in an assumed 30% factor for societal
33 The market price or user cost, together with changes in capabilities for a given cost represents the “effective price” of the service. Users that obtain an “effective price” that is lower than they would have been willing to pay for the benefits of the service derive additional value which economists call consumer surplus. For example, if the demand curve were linear with a price elasticity of -1.0 (percentage change in quantity for a 1% change in price) with respect to an effective price (composite of market price and expected difference in capabilities), consumer surplus would be equal to half of the direct benefit. 34 Consumer surplus is conservatively estimated at 30% of direct for profit sector benefits in the illustrative calculations for NSRS, CORS and GRAV-D.
…an order of magnitude for the present value of the benefit of NSRS of $22 billion.

51
benefits results in an order of magnitude of benefits of NSRS of $2.4 billion. Discounting a stream of benefits of $2.4 billion per year that continued for 15 years without growth at a discount rate of 7% would yield an order of magnitude for the present value of the benefits of NSRS of $22 billion. If an allowance were made for growth in the annual value of NSRS, the benefit would be greater. For example, with a growth rate of real (inflation adjusted) benefits of 7%, the illustrative present value of the benefits of NSRS would be $36 billion.
CORS
NGS’ Benefit Estimates for CORS NGS’ estimates of the value of CORS and the assumptions behind them are shown in the accompanying table. The estimates are based on assigned values per download of each type which are in the first column. Richard Snay, former CORS Program Manager, prepared the estimates. In an email distributed October 3, 2008, he states that the $200 value for each User Friendly CORS (UFCORS) download is conservatively based on information from the U.S. Army Corps of Engineers on the cost of driving to an existing geodetic reference station, setting up equipment, observing two hours of data and returning to the office. The $600 for each OPUS-S solution is based on its requirement of two hours of data from three different CORS. The OPUS-RS value per download is taken to be the same as OPUS-S because OPUS-RS will use at least an hour of GPS data from as many as nine CORS stations. The $30 for each CORS RINEX file downloads using anonymous file transfer protocol (FTP) is “an educated guess.” NGS would like to see improvements on these estimates if possible.
NGS Estimates of CORS Benefits, Fiscal Year 2008 Service
Value per Download
CORS Data Downloads (thousands)
Total Value (millions of dollars)
OPUS-RS $600 71.7 43 OPUS-S $600 181.7 109 UFCORS $200 1,045.0 209 CORS FTP $30 9,400.0 282 TOTAL 10,688.4 $643
Dr. Snay proposes for discussion that OPUS-DB, which will shortly be released, be valued at $1,000 per successful entry into the NGS database. This includes $600 for the OPUS solution and $400 for putting metadata into the database. The NGS values of CORS benefits in each of the fiscal years 2003-2008 and the contributions of each of the services are shown in the NGS graph below. The benefits are effectively in inflation-adjusted terms because the dollar values used for the benefits of a service are the same in each year. The total value has more than doubled in the last three years. OPUS-RS became operational on January 30, 2007 and was available only for eight months of the fiscal year.

52
NGS notes that its estimates do not include the value of data that goes through different paths:
• CORS data that NGS provides to NOAA’s Space Weather Prediction Center for the U.S.-TEC Project.
• CORS data that NGS provides to NOAA’s Earth Systems Research Laboratory for the GPS-Met Project.
• Thousands of requests NGS services each year by phone or email. • CORS data distributed by NOAA’s National Geophysical Data Center at CORS-West
located in Boulder, CO. The NGS estimates contain sources of both underestimation and overestimation.
• The NGS values underestimate avoided cost to the extent that they do not take into account the occasions where the alternative includes establishing, repairing or replacing one or more benchmarks.
• NGS may overestimate benefits for OPUS and UFCORS because not all users would be
willing to pay the cost of obtaining data from a station if they had to, since to them the data is worth something less than that cost.
The NGS estimates do not include:
• Consumer surplus ─ value to users above the alternative cost of use.
• Broader societal benefits beyond those reflected in the values attributed to government and not-for-profit CORS users. These could add significantly to the benefits.
CORS ANNUAL BENEFITS
0
100
200
300
400
500
600
700
$ M
illion
OPUS‐RS 0 0 0 0 19 43
OPUS‐S 33 59 76 100 121 109
UFCORS 92 92 114 158 190 209
CORS FTP 128 165 101 146 158 282
TOTAL 253 316 291 404 488 643
2003 2004 2005 2006 2007 2008
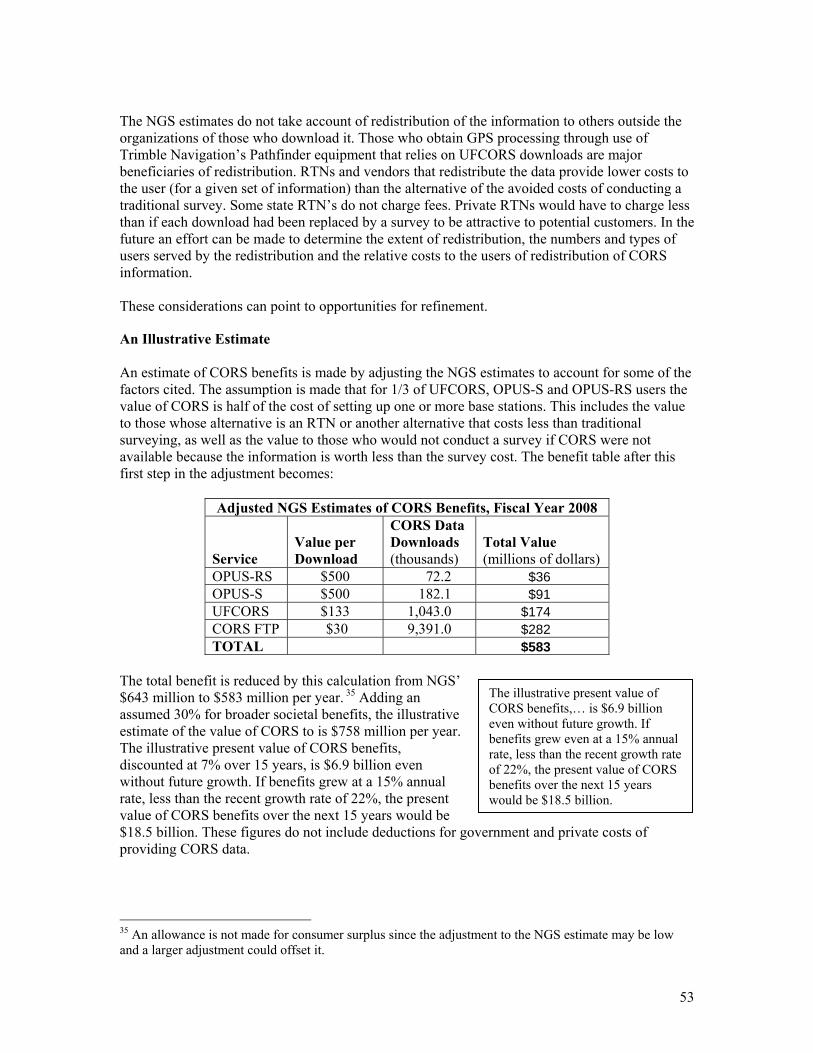
53
The NGS estimates do not take account of redistribution of the information to others outside the organizations of those who download it. Those who obtain GPS processing through use of Trimble Navigation’s Pathfinder equipment that relies on UFCORS downloads are major beneficiaries of redistribution. RTNs and vendors that redistribute the data provide lower costs to the user (for a given set of information) than the alternative of the avoided costs of conducting a traditional survey. Some state RTN’s do not charge fees. Private RTNs would have to charge less than if each download had been replaced by a survey to be attractive to potential customers. In the future an effort can be made to determine the extent of redistribution, the numbers and types of users served by the redistribution and the relative costs to the users of redistribution of CORS information. These considerations can point to opportunities for refinement.
An Illustrative Estimate An estimate of CORS benefits is made by adjusting the NGS estimates to account for some of the factors cited. The assumption is made that for 1/3 of UFCORS, OPUS-S and OPUS-RS users the value of CORS is half of the cost of setting up one or more base stations. This includes the value to those whose alternative is an RTN or another alternative that costs less than traditional surveying, as well as the value to those who would not conduct a survey if CORS were not available because the information is worth less than the survey cost. The benefit table after this first step in the adjustment becomes:
Adjusted NGS Estimates of CORS Benefits, Fiscal Year 2008 Service
Value per Download
CORS Data Downloads (thousands)
Total Value (millions of dollars)
OPUS-RS $500 72.2 $36 OPUS-S $500 182.1 $91 UFCORS $133 1,043.0 $174 CORS FTP $30 9,391.0 $282 TOTAL $583
The total benefit is reduced by this calculation from NGS’ $643 million to $583 million per year. 35 Adding an assumed 30% for broader societal benefits, the illustrative estimate of the value of CORS to is $758 million per year. The illustrative present value of CORS benefits, discounted at 7% over 15 years, is $6.9 billion even without future growth. If benefits grew at a 15% annual rate, less than the recent growth rate of 22%, the present value of CORS benefits over the next 15 years would be $18.5 billion. These figures do not include deductions for government and private costs of providing CORS data.
35 An allowance is not made for consumer surplus since the adjustment to the NGS estimate may be low and a larger adjustment could offset it.
The illustrative present value of CORS benefits,… is $6.9 billion even without future growth. If benefits grew even at a 15% annual rate, less than the recent growth rate of 22%, the present value of CORS benefits over the next 15 years would be $18.5 billion.

54
GRAV-D An informative step at this stage is determining what the value of GRAV-D would be in the present environment if it replaced all vertical datums in the U.S. The implications of scenarios for conditions during the period of its expected use are for consideration in a full analysis.
Value GRAV-D Might Have under Current Conditions Avoidance of Costs of Long Line Leveling The benefit of not having to do long line geodetic leveling beyond 2 km is the avoided cost of about $3,000/km. This includes the cost of replacement of monuments where necessary to do the leveling. Illustrative assumptions are made about the proportion of survey work that consists of long line leveling and the relative amount of surveying by non-survey organizations. Business receipts of firms marketing the product lines “geophysical data acquisition, processing and interpretation” were $575 million in 2002, according to the Economic Census. This value is increased by 35% to allow for inflation and economic growth between 2002 and 2008 to yield $776 million. The illustrative assumption is made that 10% or $78 million is for long line leveling. At a cost of $3,000/km this would correspond to about 26,000 km of long line leveling by private survey firms. The $78 million value is raised to $101 million to crudely allow for value received by users above their costs (consumer surplus). The $101 million does not include long line leveling done by governments and private organizations that is not contracted to private survey firms. It is assumed that 15% of their leveling is long line leveling. If the total amount of leveling done by government and private non-survey organizations for themselves is equal to the amount done by survey firms and the percentage of long line leveling is 15%, the value of long line leveling is 15% of $776 million or $116 million. 36 At $3,000/km this corresponds to 39,000 km per year of long line leveling for non-survey organizations. The value of benefits to the public and private sectors combined is $101 million and $116 million or $217 million. Adding an assumed 30% per year for societal benefits results in total benefits of $282 million per year. The total amount of long line leveling per year for all organizations is 65,000 km based on the assumptions used here. The result is assumed to apply for 15 years. The 15 years is taken to represent an approximation to the combination of 1) the partial availability of GRAV-D during the first ten years when it is being implemented, and 2) its continuation beyond 15 years. Discounting $282 million at a 7% rate, the present value of GRAV-D benefits from avoiding costs of long line leveling is of the order of magnitude of $2.6 billion.
36 Consumer surplus does not apply to surveying that organizations do for themselves. Value to the organizations in excess of their cost of production will appear in profits of private corporations which are not counted here because of complexity. In the case of governments and not-for-profit organizations consumer surplus is counted as part of societal benefits.
…the present value of GRAV-D benefits is of the order of magnitude of $2.6 billion.

55
Benefits through Floodplain Management Between 1975 and 1995 over two million buildings were built in special flood hazard areas of communities that participated in the National Flood Insurance Program. FEMA found that buildings built after flood insurance rate maps (FIRM) required minimum standards sustained 77% less damage than those built earlier.37 Based on the two million buildings, FEMA estimated that as of 1995, each year community floodplain management ordinances prevent over $770 million of flood damages to buildings and their contents.38 At today’s construction costs this would represent about $1.2 billion per year.39 This amounts to $600 savings per affected building per year.40 The reduction in damage inside the floodplain must be reduced by the cost of meeting the more stringent construction requirements. Costs are assumed here to be 1/3 of the savings or $400 million, with resulting a net benefit of $800 million. Additional reductions in losses come from locating some buildings outside of vulnerable areas in response to the map information and/or associated requirements. This was not taken into account by the FEMA study. Assuming these savings are equal to half of the benefits to houses inside the flood plan before subtracting costs or $600 million, the combined benefits in the earlier period would be of the order of magnitude of $1.4 billion. Since the reduction in damage was 77% of the total, the damage that was not yet reduced was 23% of the total. The 23% is 30% of the 77%, so damage that was not yet reduced is estimated at 30% of $800 million or $240 million per year. Some of the $240 million per year in damage may be saved by gains since 1995. Moreover, additional costs will be incurred to avoid the damages and not all of the losses will be avoided. However, there can be substantial additional benefits from buildings locating outside of vulnerable areas to avoid the danger or the additional cost. There also can be some saving of lives and reduced injuries from compliant structures or decisions to located outside of vulnerable areas. A crude assumption is made that the above factors offset one another, leading to a conjectural estimate that the net benefit of GRAV-D is $240 million per year. The present discounted value of benefits of $240 million per year over 15 years is $2.2 billion. Combined Benefits Combining the $2.6 billion estimate of the benefits of GRAV-D in avoided costs of long line leveling with the $2.2 billion from improved floodplain management yields a combined conjectural estimate of the present value of benefits of GRAV-D over 15 years of $4.8 billion.
37 This appears to include non-residential buildings. 38 FEMA, Cost and Benefits of Natural Hazard Mitigation, n.d. http://nzdl.sadl.uleth.ca/cgi-bin/library?e=d-00000-00---off-0aedl--00-0--0-10-0---0---0prompt-10---4-------0-1l--11-en-50---20-about---00-0-1-00-0-0-11-1-0utfZz-8-00&a=d&cl=CL1.1&d=HASH01f8ee122c19bd5ca95a436b.8.15 39 Based on the Turner Construction Cost Index. 40 The rate of construction in these areas was likely higher between 1976 and 2008 but may not be in the next couple of decades.

56
The Value of GRAV-D Will Depend On Future Conditions Valuing GRAV-D requires quantifying its benefits over time under alternative scenarios for its evolution and characteristics and comparing benefits with a scenario without GRAV-D. This involves consideration of how benefits will change with demands for applications and technological alternatives and the phase-in of GRAV-D’s availability, adoption as a standard and use.

57
References ACIL Tasman, The Value of Spatial Information, prepared for the Cooperative Research Centre for Spatial Information and ANZLIC – The Spatial Information Council, March 2008. American Meteorological Society, “Space Weather,” Policy Statement, adopted May 5, 2008, Bulletin of the American Meteorological Society (June 2008), pp.16-18. ARINC, NDGPS Assessment Final Report, report to the U.S. Federal Highway Administration, March 2008. Associated Press, “How to Value a Life? EPA Devalues Its Estimate,” msnbc.com, July 10, 2008 http://www.msnbc.com/id/25626294/ Baltimore County, MD, Baltimore County “GPS Leveling” Projects for the Geographic Information System, April 1998. Cheves, Marc, Á Visit to the South Carolina Geodetic Survey,” The American Surveyor (August 2008). Cobb, James C., “The Value of Geologic Maps and the Need for Digitally Vectorized Data,” Digital Mapping Techniques ’02 ─ Workshop Proceedings, U.S. Geological Survey Open-File Report 02-370 http://pubs.usgs.gov/of/2002/of02-370/cobb.html Colgan, C. and J. Adkins, “2005 Hurricane Damage to the Gulf of Mexico Ocean Economy,” Monthly Labor Review, February, 2006, pp.76-78. Conrad Blucher Institute for Surveying and Science at Texas A&M University, “National Height Modernization,” November 14, 2005 http://www.cbi.tamucc.edu/THM/NATIONALHEIGHTMODERNIZATIONPROGRAM Cross Land Surveying, Inc., GPS Height Modernization Study on the City of San Jose Geodetic Control Network, Dewberry & Davis: Fairfax, VA, 1996. deSelding, Peter, and Sophia-Antipolis, “Pixel Factory Provides Increasingly Popular Cheap and Easy Imaging,” Space News International (November 24, 2008), p.17. Dewberry & Davis and Psomas & Associates, National Height Modernization Study: Report to Congress, Washington, DC: National Oceanic and Atmospheric Administration, National Geodetic Survey, June 1998. Dohm, Arlene and Lynn Shniper, “Occupational Employment Projections to 2016,” Monthly Labor Review, November 2007, pp. 86-105. Duffy, Michael A, Julio Castillo, and Cecilia Whitaker, Height Modernization Study: GPS Derived Ellipsoid Heights Program, Metropolitan Water District of Southern California, n.d.

58
Dunnigan, John, “Toward National Height Modernization,” slides for keynote address to NGS National Height Modernization Conference, Miami, FL, September 18 – September 19, 2008. Epstein, Earl F., and Thomas D. Duchesneau, The Use and Value of a Geodetic Reference System, University of Maine at Orono, April 2004. Eurocontrol, Standard Inputs for Eurocontrol Cost Benefit Analyses, 2007 edition http://www.eurocontrol.be/ecsoc/gallery/content/public/documents/CBA%20examples/artascba1.pdf FEMA, Cost and Benefits of Natural Hazard Mitigation, n.d. http://nzdl.sadl.uleth.ca/cgi-bin/library?e=d-00000-00---off-0aedl--00-0--0-10-0---0---0prompt-10---4-------0-1l--11-en-50---20-about---00-0-1-00-0-0-11-1-0utfZz-8-00&a=d&cl=CL1.1&d=HASH01f8ee122c19bd5ca95a436b.8.15 Gakstatter, Eric, “Back to the Subject of Solar Activity,” GPS World Engineering and Construction Newsletter, October 14, 2008. Gakstatter, Eric, “Precision Market to Reach $8B by 2012,” GPS World (November 2008), pp.27-30. GRA, Incorporated, Economic Values for FAA Investment and Regulatory Decisions, A Guide, Draft Final Report, prepared for FAA, Washington DC: December 31, 2004. Halsing, David, Kevin Theissen, and Richard Bernknopf, A Cost-Benefit Analysis of the National Map, Circular 2171, U.S. Geological Survey, 2004 http://pubs.usgs.gov/circ/2004/1271 Henning, William, “NGS Expands Its Role in Real-Time Network Positioning,” Professional Surveyor Magazine (November 2008). Henning, William E., Edward E. Carlson, and David B. Zilkoski, “Baltimore County, Maryland, NAVD 88 GPS-derived Orthometric Height Project,” Survey and Land Information Systems, Vol.58, No.2, 1998, pp.97-113. Hilla, Steve, “Reference Frames for GPS Applications and Research,” slides, NOAA GNSS Workshop, Boulder, CO, October 24-25, 2007. Hydrographic Services Review Panel, HSRP Most Wanted Hydrographic Services Improvements, Federal Advisory Committee Special Report, 2007 http://nauticalcharts.noaa.gov/ocs/hsrp/hsrp.htm Jones, Lucile M., et. al., The ShakeOut Scenario, U.S. Geological Survey Open File Report 2008-1150, CGS Preliminary Report 25, Version1, 2008. Kashani, Israel, et. al., “A New Network-Based Rapid-Static Module for the NGS Online Positioning User Service ─ OPUS-RS,” Navigation (Fall 2008), pp.225-234. Lapine, Lewis A., and Matthew J. Wellslager, “GPS + GLONASS for Precision: South Carolina’s GNSS Virtual Reference Network,” Inside GNSS (July/August 2007), pp.50-57. Irving Leveson, “Benefits of the New GPS Civil Signal: The L2C Study,” Inside GNSS

59
(July/August 2006), pp.42-56. Leveson, Irving, A Strategic Cost-Benefit Analysis of GPS Civil Signal Modernization, report to the U.S. Departments of Commerce and Transportation, March 4, 2006. Martin, Daniel J., “CORS ─ What It is, What It Was, What It Shall Be,” slides, Maine Society of Land Surveyors, January 24, 2008. McGowan, Steve, “Ohio DOT’s VRS Network,” Professional Surveyor Magazine (December 2004). Meyer, Thomas H., Daniel R. Roman, and David B. Zilkoski, “What Does Height Really Mean? Part I: Introduction,” Digital Commons@Uconn, 2004 http://digitalcommons.uconn.edu/thmeyer_articles/2 Meyer, Thomas H., Daniel R. Roman, and David B. Zilkoski, “What Does Height Really Mean? Part II: Physics and Gravity,” Digital Commons@Uconn, 2005 http://digitalcommons.uconn.edu/thmeyer_articles/3 Meyer, Thomas H., Daniel R. Roman, and David B. Zilkoski, “What Does Height Really Mean? Part III: Height Systems,” Digital Commons@Uconn, 2006 http://digitalcommons.uconn.edu/nrme_articles/2 Meyer, Thomas H., Daniel R. Roman, and David B. Zilkoski, What Does Height Really Mean? Part IV: GPS Heighting,” Surveying and Land Information Science, Vol. 66, No.3 (2006), pp.165-183. Montana Department of Transportation, Height Modernization ─ Pilot Project,” January 9, 2007. National Oceanic and Atmospheric Administration, Coastal Services Center, Coastal Resource Management Customer Survey, Final Report, 2006, http://www.csc.noaa.gov/survey/ National Oceanic and Atmospheric Administration, Economic Statistics for NOAA, April 2008 http://www.economics.noaa.gov/ National Oceanic and Atmospheric Administration, National Geodetic Survey, Geodesy Program Operating Plan, FY2011-2015. National Oceanic and Atmospheric Administration, National Geodetic Survey, “Geodesy Socio-economic Benefits,” working note, January 2008. National Oceanic and Atmospheric Administration, National Geodetic Survey, “GRAV-D FAQS,” working note, n.d. National Oceanic and Atmospheric Administration, National Geodetic Survey, “GRAV-D: Gravity for the Re-definition of the American Vertical Datum,” slides, January 28, 2008. National Oceanic and Atmospheric Administration, National Geodetic Survey, “Report on the 8th Annual CORS Users Forum, Savannah, GA, September 16, 2008,” 2008 http://www.ngs.noaa.gov/CORS/CorsPP/PPT.html

60
National Oceanic and Atmospheric Administration, National Geodetic Survey, The GRAV-D Project: Gravity for the Redefinition of the Vertical Datum, November 14, 2007. National Oceanic and Atmospheric Administration, The National Geodetic Survey Ten-Year Plan: Mission, Vision and Strategy, 2008-2018, n.d. National Ocean Economics Program http://noep.mbari.org/ National Research Council, Elevation Data for Floodplain Mapping, Washington, D.C.: 2007. Powell, Tom, “Global Positioning Systems Wing GPS Program Update to 48th CGSIC Meeting,” Savannah, GA, September 15, 2008. Province of British Columbia, “The Canadian Height Modernization Initiative: Information for British Columbia Stakeholders/Clients,” n.d. Rizos, Chris, “Alternatives to Current GPS-RTK Services & Some Implications for CORS Infrastructure and Operations,” School of Surveying and Spatial Information, University of New South Wales, Sydney, Australia, 2006. Rizos, C., “Multi-Constellation GNSS/RNSS from the Perspective of High Accuracy Users in Australia,” Spatial Science (June 2008), pp.29-64. Robinson, Lisa A., Current Agency Practices for Valuing the Impacts of Regulations on Human Health and Safety, report to the Institute of Medicine, National Academy of Sciences, December 15, 2004. Roman, Dan, and Gregory A. Helmer, “Advanced Geoid Modeling for the National Height Modernization Program,” n.d. Schrock, Gavin M., “On-Grid Goal: Seeking Support for High Precision Networks,” GPS World (October 1, 2006) http://www.gpsworld.com/gpsworld/content/printContentPopup.jsp?id=374825 Schrock, Gavin, “RTN-101: Mapping (Part 14),” The American Surveyor (September 2008), pp30-46. Shinkle, Kurt D., and Roy K. Dokka, Rates of Vertical Displacement at Benchmarks in the Lower Mississippi Valley and the Northern Gulf Coast, NOAA National Ocean Service, July 2004. Smith, Dru A., “GRAV-D,” Spatially Speaking, FGDC Monthly Update, April 2008 http://www.fgdc.gov/library/spatially-speaking/spatially-speaking-apr08/?searchterm=GRAV-D Smith, Dru A., “How the National Height Modernization Program Can Support the NGS Ten Year Plan,” slides for address to NGS National Height Modernization Conference, Miami, FL, September 18 – September 19, 2008. Snay, Richard, et. al., “The Synergistic CORS Program Continues to Evolve,” proceedings of ION GPS 2002, Portland, OR, pp.2630-2639. Snay, Richard, and Giovanni Sella, “Applications of the U.S. Continuously Operated Reference Station (CORS) System,” International CGSIC Meeting, Toulouse, France, April 2008.

61
Snay, Richard A., and Thomas Soler, ”Continuously Operating Reference Station (CORS): History, Applications, and Future Enhancements,” Journal of Surveying Engineering (November 2008), pp.95-104. Steinberg, Gershon, and Gilad Even-Tzur, “Permanent GNSS Networks and Official Geoid Undulations Model as a Substitute for Orthometric Control,” Shaping the Change XXIII FIG Congress, Munich, Germany, October 6-13, 2006. Stone, William, “The Evolution of the National Geodetic Survey’s Continuously Operating Reference Station Network and Online Positioning User Service,” Proc. 2006 ION-IEEE Position, Location, and Navigation Symposium, Institute of Navigation (ION), Fairfax, VA, and Institute of Electrical and Electronic Engineers (IEEE), Piscataway, NJ, pp.653-663. Thomas, William A., Meeting the Challenges with Geologic Maps, American Geological Institute, 2004. Tuchin, Yakov, “Development of a Geoid-Ellipsoid Separation Model in Israel,” Shaping the Change, XXIII FIG Congress, Munich, Germany, October 6-13, 2006. U.S. Census Bureau, Product Lines: 2002, 2002 Economic Census, Professional, Scientific and Technical Services, Subject Series, ECO2-54SL-LS, November 2005. U.S. Environmental Protection Agency. National Conference on Environmental Problem-Solving with Geographic Information Systems, EPA Seminar Publication, EPA/625/R-95/004, September 1994. Vorhauer, Maralyn L., “National Readjustment of 2007,” The American Surveyor (May 2007), pp.48-54. Webb A. Morgan & Associates, Davidson County GIS Project, Ashville, NC, n.d. Wisconsin Department of Transportation, “Wisconsin Height Modernization Program,” November 2004 http://ngs.woc.noaa.gov/heightmod/publications.shtml Zilkoski, David B., “Baltimore County, Maryland, NAVD 88 GPS-derived Orthometric Height Project,” Surveying and Land Information Systems, Vol. 58, No.2, 1998, pp.97-113. Zilkoski, David, Douglas Brown, and Galen Scott, “Geospatial Tools for Addressing Disaster Management, Coastal Settlements, and Climate Change Issues,” Strategic Integration of Surveying Services, FIG Working Week 2007, Hong Kong SAR, China, May 13-13, 2007. Zilkoski, David B., John H. Richards, and Gary M. Young, “Results of the General Adjustment of the North American Vertical Datum of 1988,” Surveying and Land Information Systems, Vol. 52, No.3 (1992), pp.139-149.

62
Appendices
Appendix A: U.S. Studies of Socio-economic Benefits A limited number of quantitative socio-economic benefit studies done in the last decade are available. The1998 National Height Modernization Study is discussed in the body of the report.
Wisconsin Height Modernization Program The Wisconsin program started with a pilot study that began in 1988 and continued with monumentation, leveling, GPS surveys and processing of adjustment data for submission to the NSRS. The program was reported on in 2004.41 Findings include:
• “An 83% reduction in costs to counties in conducting quality control of photogrammetry products they receive” that translated into a projected savings of $1.5 million once there would be statewide coverage.
• “An 89% reduction in costs of WisDOT in determining the location of photogrammetric targets placed in the field for control of planning and design of highway construction and reconstruction projects” that when projected statewide would result in annual savings of $1.25 million for 100 projects.
Montana Height Modernization Pilot Project Height measurements were taken at a unit of the Milltown Reservoir Sediments/Clark Fork River Superfund site alternatively using static GPS methods and using height modernization enhanced methods. The modernized methods utilized RTK GPS together with a Virtual Reference System (VRS). A first-order vertical HARN system was used since a VRS was not available. Total survey costs were lower by 83% with the enhanced methods, $800 vs. $4,700, and time was lower by 81%. A traditional non-GPS survey cost $8,600. 38 new control points were established to provide detailed aerial photography and provide control for cleanup activities.42
Value of Kentucky Geologic Maps Cobb reports on the results of a study of Kentucky’s geologic mapping program in 2000 by S.B. Bhagwat and V.C Ipe. Questionnaires sent to professional geologists led to 440 responses, a 20% reply. The responses are claimed to be representative. The average cost of preparing a 1:24,000-scale geologic quadrangle map, if they had to prepare it themselves rather than obtain it from the state program, was a maximum of $43,527 and a minimum of $27,776. Bases on 81,000 maps provided, this resulted in a saving of $2.25 billion to $3.53 billion, vs. a cost of the program of $90 million.43 41 Wisconsin Department of Transportation, “Wisconsin Height Modernization Program,” November 2004 http://ngs.woc.noaa.gov/heightmod/publications.shtml 42 Montana Department of Transportation, Height Modernization ─ Pilot Project,” January 9, 2007. 43 James C. Cobb, “The Value of Geologic Maps and the Need for Digitally Vectorized Data,” Digital Mapping Techniques ’02 ─ Workshop Proceedings, U.S. Geological Survey Open-File Report 02-370 http://pubs.usgs.gov/of/2002/of02-370/cobb.html

63
The study did not consider what private alternatives might develop in the absence of the state program such as one or more firms selling the maps ─ that might enable some users to obtain the maps at lower costs that preparing them themselves, or consider what the economic loss would be from not having the maps.
University of Maine Study of the Use and Value of a Geodetic Reference System The seminal 1984 study by Earl Epstein and Thomas Duchesneau developed and applied an avoided costs framework for assessing economic value arising from a geodetic reference system based on avoided costs of field measurement. Benefits determined for watershed and related activities included avoided costs for planning, watershed activities and construction. Alternative values were calculated for several functions depending on whether the original control was no longer available or the control was available but not tied to the geodetic reference system. Costs that could not be avoided included reference system maintenance costs and unavoided use costs. Taking into account the expected frequency of each activity, the study found the ratio of benefits to costs between an upper limit of 4.5 and a still substantial lower limit of 1.7.44
Cost-Benefit Analysis of the National Map The National Map (http://nationalmap.gov/ ) provides data in a current, integrated, more accessible form in order to decrease the cost of implementing spatial data applications or improve their outcomes. This 2004 study, by a team from the U.S. Geological Survey, compared the costs and benefits of using a hypothetical fully implemented National Map vs. not using the National Map for processing spatial information. It did not consider benefits and costs of performing geo-spatial data applications. Data were based on telephone surveys and literature review, with extensive assumptions where data was not available. The study developed a simulation model that incorporated the level of complexity of use of mapping information in each county and projected use for the assumed 30 year lifespan of the National Map. The result was a net present value of benefits (benefits net of costs, discounted to the present) of $2.05 billion in dollars of year 2001 purchasing power. The estimate had a 95% confidence interval of $1.07 billion to $3.03 billion.45 The study used a low discount rate of 3.2% which leads to a high present value of benefits. Use of a higher discount rate would especially lower benefits because the National Map takes about 10 years to fully build and its net benefits are not positive until the fourteenth year.
44 Earl F. Epstein and Thomas D. Duchesneau, The Use and Value of a Geodetic Reference System, University of Maine at Orono, April 2004. 45 David Halsing, Kevin Theissen, and Richard Bernknopf, A Cost-Benefit Analysis of the National Map, Circular 2171, U.S. Geological Survey, 2004 http://pubs.usgs.gov/circ/2004/1271

64
Appendix B: The Importance of Saving Life and Limb The importance of societal benefits is indicated by results of studies and factors used by agencies to estimate the value of reduced injury and disability and the value of risk to life.
Value of Reduced Injury and Disability GRA uses the following values for value of an avoided injury for 2001:46
GRA Value of an Avoided Injury, 2001 Injury
Injury Value (per injury)
Other Costs (per victim)
Minor $6,000 $2,500 Moderate $46,500 $7,100 Serious $172,500 $21,200 Severe $562,500 $111,600 Critical $2,287,500 $300,000
These numbers would have to be raised by about 30% to obtain 2008 values. Robinson reports other values for the National Highway Transportation Safety Administration in dollars of year 2000 purchasing power.47 The table also includes values for quality of life impacts.
NHTSA Value of an Avoided Injury, 2000 Injury
Injury Value
Other Costs
Quality of Life Impacts
Total Costs
Minor $5,941 $4,621 $4,455 $15,017 Moderate $62,020 $4,800 $91,137 $157,958 Serious $178,358 $7,739 $128,107 $314,204 Severe $377,301 $10,832 $383,446 $731,580 Critical $1,077,567 $18,594 $1,306,836 $2,402,997
A more sophisticated approach measures impacts by quality-adjusted life years.48
Value of Risk to Life The value of a statistical life is generally used to compare risks associated with small changes in probabilities of death for large groups under different conditions. It is not intended to be used to assign values to the worth of individuals. 46 GRA, Incorporated, Economic Values for FAA Investment and Regulatory Decisions, A Guide, Draft Final Report, prepared for FAA, Washington DC: December 31, 2004. 47 Lisa A. Robinson, Current Agency Practices for Valuing the Impacts of Regulations on Human Health and Safety, report to the Institute of Medicine, National Academy of Sciences, December 15, 2004, Exhibit 15. 48 Wilhelmine Miller, Lisa A. Robinson and Robert S Lawrence (eds.), Valuing Health for Regulatory Cost-Effectiveness Analysis, National Academy of Sciences, 2006.

65
GRA values a life saved at $3 million in 1991. At today’s incomes it would be about $4 million. Robinson reports the National Highway Transportation Safety Administration value of a life saved as $3,366,388 in year 2000 dollars. This would have to be raised by about 1/3 to about $4.5 million to reflect 2008 incomes.49 Miller et. al. report a 2001 FDA study that uses $5 million for the value of a life.50 Eurocontrol51 cites the Norwegian aviation study updated from 1999 to 2006 of €2.3 million. It also summarizes results of a “Proposed UNITE” or “Unification of accounts and Marginal Costs for Transport Efficiency,” updated from 1998 to 2006 prices. Official European country values are given where available and calculated values of a statistical life (UNITE VOSL) are shown for a larger list. The official and calculated values for the UK are €$1.81 million and €1.80 million. For Germany they are €1.04 and €1.92. For France the values are €0.73 and €1.76 and for Netherlands they are €0.15 and€2.01. The UNITE VOSL value for Switzerland is €2.16. The average of values used by agencies is higher in the U.S. (in the range of $2 million to the $7 million used by the EPA52, in part reflecting differences in incomes. However, note that the official values in Europe are lower than the values calculated based on economic data, except in the UK. The opposite may be the case more often in the United States.
49 Lisa A. Robinson, Current Agency Practices for Valuing the Impacts of Regulations on Human Health and Safety, report to the Institute of Medicine, National Academy of Sciences, December 15, 2004. 50 Wilhelmina Miller, Lisa A. Robinson and Robert S Lawrence (eds.), Valuing Health for Regulatory Cost-Effectiveness Analysis, National Academy of Sciences, 2006, Table A-3. 51 Eurocontrol, Standard Inputs for Eurocontrol Cost Benefit Analyses, 2007 edition http://www.eurocontrol.be/ecsoc/gallery/content/public/documents/CBA%20examples/artascba1.pdf 52 The EPA generally has used $6.9 million as the value of a statistical life since July 2008. This was a reduction from an earlier level of 7.8 million. However, its water division has been using a value of $8.7 million since 2006. See Associated Press, “How to Value a Life? EPA devalues its estimate,” msnbc.com, July 10, 2008 http://www.msnbc.com/id/25626294/

66
Appendix C: The National Height Modernization Program The objective of the National Height Modernization Program is “the establishment of accurate, reliable heights using GPS technology in conjunction with traditional leveling, gravity, and modern remote sensing information.”53 Participating states improve height measurement through a variety of techniques including physical monumentation, adding CORS stations and surveying. National Height Modernization Program funds are intended to:54
• Maintain the NAVD 88 height datum until it is replaced by GRAV-D • Build new CORS • Survey the gravity field • Create a transformation tool for the new datum • Perform gravity monitoring surveys • Perform geoid slope monitoring surveys • Educate users • Build online tools
The program seeks to develop height information on a systematic basis instead of through sporadic opportunities and earmarks. NOAA has provided Height Modernization grants to 17 states through FY 2008 as shown below.55 The number of height modernization partners has increased from 5 in 2002. A competitive grant process began in 2007. However, funding is erratic.
53 John Dunnigan, “Toward National Height Modernization,” slides for keynote address to NGS National Height Modernization Conference, Miami, FL, September 18 – September 19, 2008. 54 Dru A. Smith, “How the National Height Modernization Program Can Support the NGS Ten Year Plan,” slides for address to NGS National Height Modernization Conference, Miami, FL, September 18 – September 19, 2008. 55 The graph is from John Dunnigan, “Toward National Height Modernization,” slides for keynote address to NGS National Height Modernization Conference, Miami, FL, September 18 – September 19, 2008.

67

68
Appendix D: National CORS Station Operators, December 1, 2008 The following organizations provided data from their stations for distribution. Organization # Sites U.S. Coast Guard (DGPS) 308 University Navstar Consortium 110 Michigan Department of Transportation 86 NOAA (FSL/NGS/CIGNET) 81 Texas Department of Transportation 68 North Carolina Geodetic Survey 54 Ohio Department of Transportation 49 Federal Aviation Administration (FAA) 38 New York State Department of Transportation 36 Florida Department of Transportation 33 Tennessee Dept. of Transportation Design Div. 22 Louisiana State University 21 U.S. Department of Transportation (NDGPS) 20 Oklahoma Department of Transportation 18 Jet Propulsion Laboratory (JPL/NASA) 17 Pacific Northwest Geodetic Array (PANGA) 17 Minnesota Department of Transportation 16 University of Southern Mississippi, GCGC 15 EGPS Solutions, GA 14 Pennsylvania Department of Transportation 14 Instituto Nacional de Estadistica, Mexico 12 U.S. Army Corps of Engineers (DGPS) 11 Basin and Range Geodetic Network (BARGN) 10 Kentucky Depart of Transportation 10 Las Vegas Valley Water District 10 New Jersey Institute of Technology 10 Connecticut Department of Transportation 9 Vermont Agency of Transportation 9 Bay Area Regional Deformation Array, CA (BARD) 8 Alabama Department of Transportation 7 Bayonet Network 7 Arkansas Highway and Transportation Department 7 Southern California Integrated GPS Array (SCIGN) 7 175th Engineer Co., Iraq 6 BP Exploration 5 Natural Resources Canada, Geodetic Survey Div. 5 PBO-Nucleus 5 Sedgwick County, Kansas 5 University of Utah / UNAVCO 5 Arizona GPS 4 Harris Galveston Coastal Subsidence District, TX 4 Idaho Department of Transportation 4 Institute for Regional Analysis & Public Policy 4 New Mexico Department of Transportation 4 Virginia Department of Transportation 4 City of Scottsdale, AZ 3

69
Ethiopia Mapping Agency 3 Geographical Registration & Land Info Systems 3 Kara Company 3 Pacific GPS 3 Scripps Orbit & Permanent Array Center (SOPAC) 3 South Carolina Geodetic Survey 3 University of New Hampshire, FIT 3 Cayman Islands 2 Columbia County, GA 2 Commonwealth of the Northern Mariana Islands, TQ 2 Hwy./Floodplain Dept. Cochise Co., AZ 2 Instituto Geografico Nacional, Guatemala 2 University of Virgin Islands 2 U.S. Geological Survey, Pasadena 2 Agrimennsores 4N Inc. 1 Alaska Department of Transportation 1 American Samoa Department of Commerce, AS 1 Baltimore County Survey Division 1 Berkeley Seismological Laboratory 1 Bonneville Blueprint Supply, Inc. 1 Brigham Young University, ID 1 Bureau of Land Management 1 Carbon County, UT 1 Central Washington University, WA 1 City of Cincinnati, OH 1 City of Grand Island Utility Department, NE 1 City of High Point, NC 1 City of Kingman, AZ 1 City of Mountain Home, AR 1 City of Tucson, AZ 1 Colleton County Mgmt. Info. Systems 1 Condor Earth Technologies Inc, CA 1 Cogno Carta GIS Costa Rica 1 Delaware Department of Parks and Recreation 1 Delaware Department of Transportation 1 Engineering Inc., MT 1 Flathead Valley Community College, MT 1 Gila County, AZ 1 Greenville Technical Institute, SC 1 Greer Commission of Public Works, SC 1 GTS Technologies, PA 1 Hagerstown Community College, MD 1 Idaho State University 1 Indiana University 1 Int’l. Union of Operating Engineers 825, NJ 1 Iraq Ministry of Wtr Res General Direct for Surveys 1 Kara Company 1 Lake County Division of Transportation, IL 1 Lamont Earth Observatory, NY 1 Lawrence Livermore National Laboratory, CA 1 Marel Bayamon Inc., PR 1 Maricopa County, AZ Dept. of Transportation 1 Missoula County, MT 1 Monroe County, NY 1 Monsanto – Soda Springs 1 Montana State University Northern 1 Moore Bass Consulting, GA 1

70
NCAD Corporation, KY 1 Nebraska Department of Roads 1 Northampton Department of Public Works 1 North Carolina Department of Transportation 1 North Dakota Department of Transportation 1 Ogden County, UT 1 Ohio University 1 Paul Smith College, NY 1 Pellissippi State Tech Comm Coll, TN 1 Philadelphia Water Department 1 Pierce County, WA 1 Riverside County Flood District, CA 1 RODS Surveying Inc. 1 Salt Lake County, UT 1 Salt River Project, AZ 1 Sangamon County, IL 1 Scotts Bluff County 1 Southeastern Polytechnic University 1 Southern Illinois Univ Carbondale 1 State University of New York 1 Taylor Wiseman & Taylor, NJ 1 The Surveyors Exchange, AK 1 TWP Morris – Dept. of Plan and Tech, NJ 1 U.S. Forest Service, Black Hills Natl. Forest 1 U.S. Forest Service, Nez Perce Natl. Forest 1 U.S. Geological Survey, Sioux Falls 1 United States Air Force 1 University of Illinois 1 University of Puerto Rico 1 University of Virginia-Fan Mountain, VA 1 University of Vermont, 1 VA Dept. Mines, Mineral and Energy 1 Wallops Flight Facility-NASA GSFC 1 York County, SC 1 Total 1324 Source: CORS Newsletter, December 1, 2008 http://www.ngs.noaa.gov/CORS/newsletter1/

71
Appendix E: North American Industrial Classification System 2007 Categories for Surveying and Mapping
The North American Industrial Classification System (NAICS) 2007 categories will be used in Economic Census data for 2007 that will become available in 2009 and 2010. The Census Bureau descriptions are shown followed by the codes and category names. (The data in this report are based on the 2002 classification which is less related to current practice.) 541360 Geophysical Surveying and Mapping Services This industry comprises establishments primarily engaged in gathering, interpreting, and mapping geophysical data. Establishments in this industry often specialize in locating and measuring the extent of subsurface resources, such as oil, gas, and minerals, but they may also conduct surveys for engineering purposes. Establishments in this industry use a variety of surveying techniques depending on the purpose of the survey, including magnetic surveys, gravity surveys, seismic surveys, or electrical and electromagnetic surveys. Category 541360 includes: Aerial geophysical surveying services Electrical geophysical surveying services Electromagnetic geophysical surveying services Geological surveying services Geophysical mapping services Geophysical surveying services Gravity geophysical surveying services Magnetic geophysical surveying services Mapping services, geophysical Radioactive geophysical surveying services Remote sensing geophysical surveying services Seismic geophysical surveying services Surveying services, geophysical 541370 Surveying and Mapping (except Geophysical) Services This industry comprises establishments primarily engaged in performing surveying and mapping services of the surface of the earth, including the sea floor. These services may include surveying and mapping of areas above or below the surface of the earth, such as the creation of view easements or segregating rights in parcels of land by creating underground utility easements. Category 541370 includes: Aerial surveying (except geophysical) services Cadastral surveying services Cartographic surveying services Geodetic surveying services Geographic information system (GIS) base mapping services Geospatial mapping services Hydrographic mapping services Hydrographic surveying services

72
Land surveying services Mapping (except geophysical) services Photogrammetric mapping services Surveying and mapping services (except geophysical) Topographic mapping services Topographic surveying services

73
Acronyms CGSIC Civil GPS Service Interface Committee CGVD28 Canadian Geodetic Vertical Datum of 1928 CIGNET Cooperative International GNSS Network, the forerunner of the CORS network CONUS Continental United States CORS Continuously Operating Reference Station CSRS Canadian Spatial Reference System CRTN California Real Time Network DEM Digital Elevation Model DGPS Differential GNSS DOC U.S. Department of Commerce DOT Department of Transportation Galileo the GNSS being developed by the European Union GDA94 Geocentric Datum of Australia of 1994 GDP Gross Domestic Product GEOSS Global Earth Observation System of Systems GLONASS the Russian GLObal Navigation Satellite System GNSS Global Navigation Satellite System GNSS Global Positioning System GSD Geodetic Survey Division of Resources Canada HARN High Accuracy Reference Network, also called a high precision geodetic network HTDP horizontal time-dependent positioning software IGS International GNSS Service ION Institute of Navigation ITRF International Terrestrial Reference Frame LIDAR Light Detection and Ranging NAD 83 North American Datum of 1983 NAVD 88 North American Vertical Datum of 1988 NDGPS Nationwide Differential GPS System NGS National Geodetic Survey NOAA National Oceanic and Atmospheric Administration NOS National Ocean Service NSDI National Spatial Data Infrastructure NSRS National Spatial Reference System NTRIP Networked Transport of RTCM via Internet Protocol OPUS On-line Positioning User Service OPUS-DB OPUS-Database OPUS-RS OPUS-Rapid Static OPUS-S the standard OPUS service PBO Plate Boundary Observatory PW precipitable water vapor RTK Real Time Kinematic RTN Real Time Network SCGS South Carolina Geodetic Survey SLR satellite laser ranging UFCORS user-friendly CORS VLBI very long baseline interferometry WAAS Wide Area Augmentation System WSRN Washington State Reference Network XML Extensible Markup Language

74
Irving Leveson ─ Biography Irving Leveson is an expert in economic and strategic analysis and public policy. He combines an unusual understanding of critical issues and trends with extensive experience dealing with practical problems. Dr. Leveson has assisted business and government in addressing complex social and technological as well as economic issues. He has been providing research and consulting through Leveson Consulting since 1990. He also serves as a consultant with the Aerospace Corporation and an Adjunct Fellow of the Hudson Institute.
From 1984 to 1990 Dr. Leveson was Senior Vice President and Director of Research of Hudson Strategy Group, a consulting firm that was part of Marsh & McLennan. He served as Director of Economic Studies of Hudson Institute from 1977-84 and Senior Professional Staff at Hudson from 1974-77. He has held senior positions with the New York City Health Services Administration and the New York City Planning Commission and worked at the RAND Corp. and the National Bureau of Economic Research.
Dr. Leveson received a Ph.D. in economics from Columbia University in 1968. His publications include American Challenges: Business and Government in the World of the 1990s, Praeger Publishers, 1991, The Future of the Financial Services Industry (main author), Hudson Institute, 1982 and Western Economies in Transition (co-editor), Westview Press, 1980. Dr. Leveson is a member of the Institute of Navigation, the American Meteorological Society, the American Economic Association and the National Association for Business Economics.
His recent work includes:
A strategic cost-benefit analysis of modernization of the Global Positioning Satellite System focusing on applications, markets and benefits of the new L2C signal, conducted for the U.S. Departments of Transportation and Commerce and the Interagency GPS Executive Board.
A study of alternative financing for positioning, navigation and timing for the U.S. National Space-Based PNT Coordination Office.
Participating in the U.S. National Security Space Office’s National Positioning, Navigation and Timing Architecture Study for the U.S. Office of Space Commercialization
Examining opportunities for utilizing modernized GPS systems in the U.S. National Oceanic and Atmospheric Administration.
Analyzing the potential impact of loss of dual frequency (L1/L2) access (P(Y) code) for non-PPS dual frequency user applications for the National Space-Based PNT Engineering Forum.
Analyzing scientific and technical workforce trends and composition for U.S. intelligence agencies.
Estimating benefits of the National Polar Orbiting Environmental Satellite System for the National Environmental Satellite Data and Information Service.
Assessing societal impacts of high impact weather for the U.S. National Weather Service.
Analysis of pubic-private partnership issues for the U.S. National Oceanic and Atmospheric Administration.
Providing assistance to NOAA over several years in applying social science to issues and programs through workshops, educational materials, research plans, participation in the NOAA Research Council Social Science Committee and guiding Web site development.

75


![CORS Program FY0945]09... · 2009-10-01 · CORS Program FY09 Giovanni Sella CORS Program Manager NOAA- National Geodetic Survey giovanni.sella @ noaa.gov CGSIC Savannah, GA CORS](https://static.fdocuments.net/doc/165x107/5f09f82f7e708231d4296126/cors-program-4509-2009-10-01-cors-program-fy09-giovanni-sella-cors-program.jpg)


