
Socio-economic Baseline Reviews for Offshore Renewables in … · 2018-09-10 · Socio-economic...
329
Marine Scotland Socio-economic Baseline Reviews for Offshore Renewables in Scottish Waters Volume 1: Main Text Report R.1905 September 2012 RPA.
Transcript of Socio-economic Baseline Reviews for Offshore Renewables in … · 2018-09-10 · Socio-economic...

Marine Scotland
Socio-economic Baseline Reviews for Offshore Renewables in Scottish Waters Volume 1: Main Text Report R.1905 September 2012
RPA.
Marine Scotland
Socio-economic Baseline Reviews for Offshore Renewables in Scottish Waters Volume 2: Figures Report R.1905 September 2012
RPA.
All images copyright ABPmer apart from front cover (wave, anemone, bird) and policy & management (rockpool) Andy Pearson www.oceansedgephotography.co.uk
Marine Scotland
Socio-economic Baseline Reviews for Offshore Renewables in Scottish Waters Date: September 2012
Project Ref: R4032/3
Report No: R.1905
© ABP Marine Environmental Research Ltd
Version Details of Change Authorised By Date
1 Working Copy C E Brown 02.12.11
2 Final C E Brown 07.02.12
3 Final C E Brown 26.04.12
4 Final C E Brown 28.06.12
5 Final C E Brown 24.09.12
Document Authorisation Signature Date
Project Manager: C E Brown
Quality Manager: H Roberts
Project Director: S C Hull
ABP Marine Environmental Research Ltd Quayside Suite, Medina Chambers Town Quay Tel: +44(0)23 8071 1840 SOUTHAMPTON Fax: +44(0)23 8071 1841 Hampshire Web: www.abpmer.co.uk SO14 2AQ Email: [email protected]
ABPmer is certified by:
Socio-economic Baseline Reviews for Offshore Renewables in Scottish Waters
R4032/3 i R.1905
Summary ABP Marine Environmental Research Ltd (ABPmer) and RPA were commissioned by Marine Scotland to prepare a baseline socio-economic review to inform impact assessments of future sectoral plans for offshore wind and wave and tidal energy in Scottish Territorial Waters and waters offshore of Scotland (hereafter „Scottish Waters‟). This report provides a national overview of socio-economic activities together with regional baseline reviews covering the six Scottish Offshore Renewable Energy Regions (SORERs). The document is divided into two parts, the second providing the Figures referred to within this report.

Socio-economic Baseline Reviews for Offshore Renewables in Scottish Waters
R4032/3 ii R.1905
Abbreviations ABI Annual Business Inquiry ABP Associated British Ports ABPmer ABP Marine Environmental Research Ltd AIS Automatic Identification System ASP Association of Surfing Professionals ATM Air traffic Movements BAA British Aviation Authority BBC British Broadcasting Corporation BMF British Marine Federation BMI Body Mass Index BP BP Global BPA British Port Authority BSAC British Sub-Aqua Club BUTEC British Underwater Test and Evaluation Centre CAA Civil Aviation Authority CCS Carbon Capture and Storage Cefas Centre for Environment, Fisheries and Aquaculture Science CFP Common Fisheries Policy C-in-C Commander-in-Chief CNS Central North Sea CO2 Carbon dioxide COSLA Convention of Scottish Local Authorities CRC Control and Reporting Centre DAS Days at Sea DASA Defence Analytical Services and Advice DE&S Defence Equipment and Support DECC Department of Energy and Climate Change Defra Department for Environment, Food and Rural Affairs DEL Department Expenditure Limits DfT Department for Transport DMC Defence Munitions Centre DMK Denmark DNC Declared Net Capacity DUKES Digest of UK Energy Statistics DWT Deadweight ton E East EC European Community EEZ Exclusive Economic Zone EKOS EKOS Limited EMEC European Marine Energy Centre ERM Environmental Resources Management Ltd EU European Union FAA Fleet Air Arm FAO Food and Agriculture Organization FEE Foundation for Environmental Education
Socio-economic Baseline Reviews for Offshore Renewables in Scottish Waters
R4032/3 iii R.1905
FTE Full-time Equivalent GB Great Britain GC Gas Condenstate Field GDP Gross Domestic Product GHG Greenhouse Gas GLA General Lighthouse Authorities GP General Practitioners GVA Gross Value Added HDVC High Voltage Direct Current HIAL Highlands and Islands Airports Ltd. HIE Highlands and Islands Enterprise HIH Highest Income Householder HMNB Her Majesty‟s Naval Base HMS Her Majesty's Ship HPHT High Pressure High Temperature HVDC High-voltage Direct Current ICES International Council for the Exploration of the Sea ICIT International Centre of Island Technology ID Identity IFAW International Fund for Animal Welfare IMO International Maritime Organization IOM Isle of Man IPA IPA Energy + Water Economics IRM Inspection, repair and maintenance ITV ITV plc KIS-CA Kingfisher Information Service - Cable Awareness LA Local Authority LIMPET Land Installed Marine Powered Energy Transformer MCA Maritime and Coastguard Agency MCCIP Marine Climate Change Impacts MEDIN Marine Environmental Data and Information Network MMO Marine Management Organisation MOD Ministry of Defence MORI Market & Opinion Research International Ltd. MSc Master of Science MSC Marine Stewardship Council MSP Marine Spatial Plan MSY Maximum Sustainable Yield MW DNC Megawatts Declared Net Capacity N North NATO North Atlantic Treaty Organization NATS National Air Traffic Services NE North East NERL NATS En Route Plc NGL Natural Gas Liquids NI Northern Ireland NLB Northern Lighthouse Board

Socio-economic Baseline Reviews for Offshore Renewables in Scottish Waters
R4032/3 iv R.1905
NOMIS Service provided by the Office for National Statistics, ONS, to give you free access to the most detailed and up-to-date UK labour market statistics from official sources
NOx Nitrogen Oxide NRIP National Renewables Infrastructure Plan NVQ National Vocational Qualification NW North West OER Offshore Energy Region Ofgem Office of the Gas and Electricity Markets ONS Office for National Statistics OSGB Ordnance Survey Great Britain OSPAR International cooperation on the protection of the marine environment of the North-East
Atlantic. Commission is made up of representatives of the Governments of 15 Contracting Parties and the European Commission, representing the European Union.
OWF Offshore Wind Farm OWIG Offshore Wind Industry Group PAR Precision Approach Radar PEXA Practise and Exercise Training Area PFFPA Peterhead and Fraserburgh Fish Processors Association PFOW Pentland Firth and Orkney Waters PGI Protected Geographical Indication PSR Primary Surveillance Radar R&D Research and Development RAF Royal Air Force RoRo Roll-on/Roll-off RPA Risk and Policy Analysts RSW Refrigerated Seawater RYA Royal Yachting Association SAC Special Areas of Conservation SAS Surfers Against Sewage SCCS Scottish Centre for Carbon Storage ScotSAC Scottish Sub-Aqua Club SCSS Scottish Centre for Carbon Storage SCUBA Self Contained Underwater Breathing Apparatus SE Scottish Enterprise SEA Strategic Environmental Assessment SEB Scottish Enterprise Borders SECA SOx Emission Control Area SEPA Scottish Environment Protection Agency SFSAG Scottish Fisheries Sustainable Accreditation Group SHA Statutory Harbour Authorities SHEFA Shetland-Faroes SHQS Scottish Housing Quality Standard SIC Standard Industrial Classification SIMA Surf Industry Manufacturers Association SNH Scottish Natural Heritage SOAS School of Oriental and African Studies, University of London SORER Scottish Offshore Renewable Energy Regions

Socio-economic Baseline Reviews for Offshore Renewables in Scottish Waters
R4032/3 v R.1905
SOx Sulphur Oxide SPSG Scottish Pelagic Sustainability Group SQW SQW Consulting SREZ Scottish Renewable Energy Zone SRO Scottish Renewable Order SSACN Scottish Sea Angling Conservation Network SSE South South East SW South West SXA Scottish Exercise Area TAC Total Allowable Catch TNS The Naturist Society TSO The Stationery Office UK United Kingdom UKCPC UK Cable Protection Committee (to become Subsea Cables UK in 2012) UKCS UK Continental Shelf UKDEAL Oil & Gas UK DEAL Common Data Access Limited UKMMAS UK Marine Monitoring and Assessment Strategy USA United States of America VLCC Very-large Crude Carriers VMS Vessel Monitoring System W West WQS World Qualifying Series WWF World Wide Fund for Nature Units boe Barrel of Oil Equivalent m metre(s) km kilometre(s) km² kilometre(s) squared NM nautical mile(s) h hour lb pound(s) Kg kilogram(s) kV kilovolt(s) Mt million tonnes kW kilowatt(s) MW megawatt(s) MWe megawatt energy MWh megawatt hour GW gigawatt(s) GWh gigawatt hour GT gross tonnage p.a. per annum p.p. per person % per cent mppa million passengers per annum
Socio-economic Baseline Reviews for Offshore Renewables in Scottish Waters
R4032/3 vi R.1905
Socio-economic Baseline Reviews for Offshore Renewables in Scottish Waters
Contents Page
Summary .................................................................................................................................................. i
Abbreviations ........................................................................................................................................... ii
1. Introduction ................................................................................................................................. 1
2. National Overview ...................................................................................................................... 2 2.1 Introduction ................................................................................................................................. 2 2.2 Aquaculture ................................................................................................................................ 2
2.2.1 Definition of Sector/Activity........................................................................................... 2 2.2.2 Description of Information Sources .............................................................................. 2 2.2.3 National Overview of Current Activity ........................................................................... 3
2.3 Aviation ....................................................................................................................................... 6 2.3.1 Definition of Sector/Activity........................................................................................... 6 2.3.2 Description of Information Sources .............................................................................. 7 2.3.3 National Overview of Current Activity ........................................................................... 7
2.4 Carbon Capture and Storage ..................................................................................................... 9 2.4.1 Definition of Sector/Activity........................................................................................... 9 2.4.2 Description of Information Sources .............................................................................. 9 2.4.3 National Overview of Current Activity ......................................................................... 10
2.5 Coast Protection and Flood Defence ........................................................................................ 11 2.5.1 Definition of Sector/Activity......................................................................................... 11 2.5.2 Description of Information Sources ............................................................................ 12 2.5.3 National Overview of Current Activity ......................................................................... 12
2.6 Commercial Fisheries ............................................................................................................... 13 2.6.1 Definition of Sector/Activity......................................................................................... 13 2.6.2 Description of Information Sources ............................................................................ 13 2.6.3 National Overview of Current Activity ......................................................................... 14 2.6.4 Wild Salmon and Sea Trout ....................................................................................... 22
2.7 Energy Generation ................................................................................................................... 24 2.7.1 Definition of Sector/Activity......................................................................................... 24 2.7.2 Description of Information Sources ............................................................................ 25 2.7.3 National Overview of Current Activity ......................................................................... 26
2.8 Military Interests ....................................................................................................................... 34 2.8.1 Definition of Sector/Activity......................................................................................... 34 2.8.2 Description of Information Sources ............................................................................ 35 2.8.3 National Overview of Current Activity ......................................................................... 35
2.9 Oil and Gas .............................................................................................................................. 37 2.9.1 Definition of Sector/Activity......................................................................................... 37 2.9.2 Description of Information Sources ............................................................................ 37 2.9.3 National Overview of Current Activity ......................................................................... 37
Socio-economic Baseline Reviews for Offshore Renewables in Scottish Waters
R4032/3 vii R.1905
2.10 Ports and Harbours .................................................................................................................. 40
2.10.1 Definition of Sector/Activity......................................................................................... 40 2.10.2 Description of Information Sources ............................................................................ 40 2.10.3 National Overview of Current Activity ......................................................................... 41
2.11 Power Interconnectors .............................................................................................................. 46 2.11.1 Definition of Sector/Activity......................................................................................... 46 2.11.2 Description of Information Sources ............................................................................ 46 2.11.3 National Overview of Current Activity ......................................................................... 46
2.12 Recreational Boating ................................................................................................................ 48 2.12.1 Definition of Sector/Activity......................................................................................... 48 2.12.2 Description of Information Sources ............................................................................ 48 2.12.3 National Overview of Current Activity ......................................................................... 49
2.13 Shipping ................................................................................................................................... 52 2.13.1 Definition of Sector/Activity......................................................................................... 52 2.13.2 Description of Information Sources ............................................................................ 52 2.13.3 National Overview of Current Activity ......................................................................... 53
2.14 Social and Community .............................................................................................................. 56 2.14.1 Definition of Sector/Activity......................................................................................... 56 2.14.2 Description of Information Sources ............................................................................ 56 2.14.3 National Overview of Current Activity ......................................................................... 58
2.15 Telecom Cables........................................................................................................................ 84 2.15.1 Definition of Sector/Activity......................................................................................... 84 2.15.2 Description of Information Sources ............................................................................ 84 2.15.3 National Overview of Current Activity ......................................................................... 84
2.16 Tourism .................................................................................................................................... 86 2.16.1 Definition of Sector/Activity......................................................................................... 86 2.16.2 Description of Information Sources ............................................................................ 87 2.16.3 National Overview of Current Activity ......................................................................... 88
2.17 Waste Disposal......................................................................................................................... 95 2.17.1 Definition of Sector/Activity......................................................................................... 95 2.17.2 Description of Information Sources ............................................................................ 95 2.17.3 National Overview of Current Activity ......................................................................... 96 2.17.4 Economic value and employment .............................................................................. 96
2.18 Water Sports ............................................................................................................................ 98 2.18.1 Definition of Sector/Activity......................................................................................... 98 2.18.2 Description of Information Sources ............................................................................ 98 2.18.3 National Overview of Current Activity ......................................................................... 99
3. South West Region ................................................................................................................. 103 3.1 Introduction ............................................................................................................................. 103 3.2 Aquaculture ............................................................................................................................ 103
3.2.1 Regional Activity ....................................................................................................... 103 3.2.2 Regional Economic Value and Employment ............................................................ 103 3.2.3 Future Trends ........................................................................................................... 104
3.3 Commercial Fisheries ............................................................................................................. 104 3.3.1 Regional Activity ....................................................................................................... 104 3.3.2 Regional Economic Value and Employment ............................................................ 105 3.3.3 Future Trends ........................................................................................................... 106

Socio-economic Baseline Reviews for Offshore Renewables in Scottish Waters
R4032/3 viii R.1905
3.4 Energy Generation ................................................................................................................. 106
3.4.1 Regional Activity ....................................................................................................... 106 3.4.2 Regional Economic Value and Employment ............................................................ 106 3.4.3 Future Trends ........................................................................................................... 107
3.5 Military Interests ..................................................................................................................... 107 3.5.1 Regional Activity ....................................................................................................... 107 3.5.2 Regional Economic Value and Employment ............................................................ 107 3.5.3 Future Trends ........................................................................................................... 108
3.6 Oil and Gas ............................................................................................................................ 108 3.6.1 Regional Activity ....................................................................................................... 108 3.6.2 Regional Economic Value and Employment ............................................................ 108 3.6.3 Future Trends ........................................................................................................... 108
3.7 Ports and Harbours ................................................................................................................ 108 3.7.1 Regional Activity ....................................................................................................... 108 3.7.2 Regional Economic Value and Employment ............................................................ 109 3.7.3 Future Trends ........................................................................................................... 109
3.8 Power Interconnectors ............................................................................................................ 110 3.8.1 Regional Activity ....................................................................................................... 110 3.8.2 Regional Economic Value and Employment ............................................................ 110 3.8.3 Future Trends ........................................................................................................... 110
3.9 Recreational Boating .............................................................................................................. 110 3.9.1 Regional Activity ....................................................................................................... 110 3.9.2 Regional Economic Value and Employment ............................................................ 111 3.9.3 Future Trends ........................................................................................................... 111
3.10 Shipping ................................................................................................................................. 111 3.10.1 Regional Activity ....................................................................................................... 111 3.10.2 Regional Economic Value and Employment ............................................................ 112 3.10.3 Future Trends ........................................................................................................... 113
3.11 Social and Community ............................................................................................................ 113 3.11.1 Regional Activity ....................................................................................................... 113 3.11.2 Regional Economic Value and Employment ............................................................ 114 3.11.3 Future Trends ........................................................................................................... 118
3.12 Telecom Cables...................................................................................................................... 119 3.12.1 Regional Activity ....................................................................................................... 119 3.12.2 Regional Economic Value and Employment ............................................................ 119 3.12.3 Future Trends ........................................................................................................... 119
3.13 Tourism .................................................................................................................................. 120 3.13.1 Regional Activity ....................................................................................................... 120 3.13.2 Regional Economic Value and Employment ............................................................ 120 3.13.3 Future Trends ........................................................................................................... 120
3.14 Waste Disposal....................................................................................................................... 120 3.14.1 Regional Activity ....................................................................................................... 120 3.14.2 Regional Economic Value and Employment ............................................................ 121 3.14.3 Future Trends ........................................................................................................... 121
3.15 Water Sports .......................................................................................................................... 122 3.15.1 Regional activity ....................................................................................................... 122 3.15.2 Regional Economic Value and Employment ............................................................ 122 3.15.3 Future Trends ........................................................................................................... 123
Socio-economic Baseline Reviews for Offshore Renewables in Scottish Waters
R4032/3 ix R.1905
4. West Region ........................................................................................................................... 124 4.1 Introduction ............................................................................................................................. 124 4.2 Aquaculture ............................................................................................................................ 124
4.2.1 Regional Activity ....................................................................................................... 124 4.2.2 Regional Economic Value and Employment ............................................................ 124 4.2.3 Future Trends ........................................................................................................... 125
4.3 Aviation ................................................................................................................................... 125 4.3.1 Regional Activity ....................................................................................................... 125 4.3.2 Regional Economic Value and Employment ............................................................ 126 4.3.3 Future Trends ........................................................................................................... 126
4.4 Coast Protection and Flood Defence ...................................................................................... 127 4.4.1 Regional Activity ....................................................................................................... 127 4.4.2 Regional Economic Value and Employment ............................................................ 127 4.4.3 Future Trends ........................................................................................................... 127
4.5 Commercial Fishing ................................................................................................................ 127 4.5.1 Regional Activity ....................................................................................................... 127 4.5.2 Regional Economic Value and Employment ............................................................ 128 4.5.3 Future Trends ........................................................................................................... 129
4.6 Energy Generation ................................................................................................................. 129 4.6.1 Regional Activity ....................................................................................................... 129 4.6.2 Regional Economic Value and Employment ............................................................ 129 4.6.3 Future Trends ........................................................................................................... 130
4.7 Military Interests ..................................................................................................................... 130 4.7.1 Regional Activity ....................................................................................................... 130 4.7.2 Regional Economic Value and Employment ............................................................ 131 4.7.3 Future Trends ........................................................................................................... 131
4.8 Port and Harbours .................................................................................................................. 132 4.8.1 Regional Activity ....................................................................................................... 132 4.8.2 Regional Economic Value and Employment ............................................................ 134 4.8.3 Future Trends ........................................................................................................... 135
4.9 Power Interconnectors ............................................................................................................ 135 4.9.1 Regional Activity ....................................................................................................... 135 4.9.2 Regional Economic Value and Employment ............................................................ 135 4.9.3 Future Trends ........................................................................................................... 136
4.10 Recreational Boating .............................................................................................................. 136 4.10.1 Regional Activity ....................................................................................................... 136 4.10.2 Regional Economic Value and Employment ............................................................ 137 4.10.3 Future Trends ........................................................................................................... 137
4.11 Shipping ................................................................................................................................. 137 4.11.1 Regional Activity ....................................................................................................... 137 4.11.2 Regional Economic Value and Employment ............................................................ 139 4.11.3 Future Trends ........................................................................................................... 140
4.12 Social and Community ............................................................................................................ 140 4.12.1 Regional Activity ....................................................................................................... 140 4.12.2 Regional Economic Value and Employment ............................................................ 141 4.12.3 Future Trends ........................................................................................................... 146
4.13 Telecomm Cables................................................................................................................... 147 4.13.1 Regional Activity ....................................................................................................... 147 4.13.2 Regional Economic Value and Employment ............................................................ 148 4.13.3 Future Trends ........................................................................................................... 148
Socio-economic Baseline Reviews for Offshore Renewables in Scottish Waters
R4032/3 x R.1905
4.14 Tourism .................................................................................................................................. 148 4.14.1 Regional Activity ....................................................................................................... 148 4.14.2 Regional Economic Value and Employment ............................................................ 149 4.14.3 Future Trends ........................................................................................................... 149
4.15 Waste Disposal....................................................................................................................... 150 4.15.1 Regional Activity ....................................................................................................... 150 4.15.2 Regional Economic Value and Employment ............................................................ 151 4.15.3 Future Trends ........................................................................................................... 151
4.16 Water Sports .......................................................................................................................... 151 4.16.1 Regional Activity ....................................................................................................... 151 4.16.2 Regional Economic Value and Employment ............................................................ 153 4.16.3 Future Trends ........................................................................................................... 154
5. North West Region ................................................................................................................. 155 5.1 Introduction ............................................................................................................................. 155 5.2 Aquaculture ............................................................................................................................ 155
5.2.1 Regional Activity ....................................................................................................... 155 5.2.2 Regional Economic Value and Employment ............................................................ 155 5.2.3 Future Trends ........................................................................................................... 156
5.3 Aviation ................................................................................................................................... 156 5.3.1 Regional Activity ....................................................................................................... 156 5.3.2 Regional Economic Value and Employment ............................................................ 156 5.3.3 Future Trends ........................................................................................................... 156
5.4 Coast Protection and Flood Defence ...................................................................................... 156 5.4.1 Regional Activity ....................................................................................................... 156 5.4.2 Regional Economic Value and Employment ............................................................ 157 5.4.3 Future Trends ........................................................................................................... 157
5.5 Commercial Fisheries ............................................................................................................. 157 5.5.1 Regional Activity ....................................................................................................... 157 5.5.2 Regional Economic Value and Employment ............................................................ 159 5.5.3 Future Trends ........................................................................................................... 160
5.6 Energy Generation ................................................................................................................. 160 5.6.1 Regional Activity ....................................................................................................... 160 5.6.2 Regional Economic Value and Employment ............................................................ 160 5.6.3 Future Trends ........................................................................................................... 161
5.7 Military Interests ..................................................................................................................... 161 5.7.1 Regional Activity ....................................................................................................... 161 5.7.2 Regional Economic Value and Employment ............................................................ 161 5.7.3 Future Trends ........................................................................................................... 162
5.8 Oil and Gas ............................................................................................................................ 162 5.8.1 Regional Activity ....................................................................................................... 162 5.8.2 Regional Economic Value and Employment ............................................................ 162 5.8.3 Future Trends ........................................................................................................... 162
5.9 Port and Harbours .................................................................................................................. 162 5.9.1 Regional Activity ....................................................................................................... 162 5.9.2 Regional Economic Value and Employment ............................................................ 164 5.9.3 Future Trends ........................................................................................................... 164
5.10 Power Interconnectors ............................................................................................................ 164 5.10.1 Regional Activity ....................................................................................................... 164 5.10.2 Regional Economic Value and Employment ............................................................ 164 5.10.3 Future Trends ........................................................................................................... 164
Socio-economic Baseline Reviews for Offshore Renewables in Scottish Waters
R4032/3 xi R.1905
5.11 Recreational Boating .............................................................................................................. 165 5.11.1 Regional Activity ....................................................................................................... 165 5.11.2 Regional Economic Value and Employment ............................................................ 165 5.11.3 Future Trends ........................................................................................................... 165
5.12 Shipping ................................................................................................................................. 166 5.12.1 Regional Activity ....................................................................................................... 166 5.12.2 Regional Economic Value and Employment ............................................................ 167 5.12.3 Future Trends ........................................................................................................... 167
5.13 Social and Community ............................................................................................................ 168 5.13.1 Regional Activity ....................................................................................................... 168 5.13.2 Regional Economic Value and Employment ............................................................ 169 5.13.3 Future Trends ........................................................................................................... 175
5.14 Telecomm Cables................................................................................................................... 175 5.14.1 Regional Activity ....................................................................................................... 175 5.14.2 Regional Economic Value and Employment ............................................................ 176 5.14.3 Future Trends ........................................................................................................... 176
5.15 Tourism .................................................................................................................................. 176 5.15.1 Regional Activity ....................................................................................................... 176 5.15.2 Regional Economic Value and Employment ............................................................ 177 5.15.3 Future Trends ........................................................................................................... 177
5.16 Waste Disposal....................................................................................................................... 177 5.16.1 Regional Activity ....................................................................................................... 177 5.16.2 Regional Economic Value and Employment ............................................................ 178 5.16.3 Future Trends ........................................................................................................... 178
5.17 Water Sports .......................................................................................................................... 178 5.17.1 Regional Activity ....................................................................................................... 178 5.17.2 Regional Economic Value and Employment ............................................................ 179 5.17.3 Future Trends ........................................................................................................... 180
6. North Region .......................................................................................................................... 181 6.1 Introduction ............................................................................................................................. 181 6.2 Aquaculture ............................................................................................................................ 181
6.2.1 Regional Activity ....................................................................................................... 181 6.2.2 Regional Economic Value and Employment ............................................................ 181 6.2.3 Future Trends ........................................................................................................... 182
6.3 Aviation ................................................................................................................................... 182 6.3.1 Regional Activity ....................................................................................................... 182 6.3.2 Regional Economic Value and Employment ............................................................ 182 6.3.3 Future Trends ........................................................................................................... 182
6.4 Carbon Capture and Storage ................................................................................................. 182 6.4.1 Regional Activity ....................................................................................................... 182 6.4.2 Regional Economic Value and Employment ............................................................ 183 6.4.3 Future Trends ........................................................................................................... 183
6.5 Commercial Fisheries ............................................................................................................. 184 6.5.1 Regional Activity ....................................................................................................... 184 6.5.2 Regional Economic Value and Employment ............................................................ 185 6.5.3 Future Trends ........................................................................................................... 186
6.6 Energy Generation ................................................................................................................. 186 6.6.1 Regional Activity ....................................................................................................... 186 6.6.2 Regional Economic Value and Employment ............................................................ 186 6.6.3 Future Trends ........................................................................................................... 187
Socio-economic Baseline Reviews for Offshore Renewables in Scottish Waters
R4032/3 xii R.1905
6.7 Military Interests ..................................................................................................................... 187 6.7.1 Regional Activity ....................................................................................................... 187 6.7.2 Regional Economic Value and Employment ............................................................ 188 6.7.3 Future Trends ........................................................................................................... 188
6.8 Oil and Gas ............................................................................................................................ 188 6.8.1 Regional Activity ....................................................................................................... 188 6.8.2 Regional Economic Value and Employment ............................................................ 190 6.8.3 Future Trends ........................................................................................................... 190
6.9 Ports and Harbours ................................................................................................................ 190 6.9.1 Regional Activity ....................................................................................................... 190 6.9.2 Regional Economic Value and Employment ............................................................ 192 6.9.3 Future Trends ........................................................................................................... 193
6.10 Power Interconnectors ............................................................................................................ 194 6.10.1 Regional Activity ....................................................................................................... 194 6.10.2 Regional Economic Value and Employment ............................................................ 195 6.10.3 Future Trends ........................................................................................................... 195
6.11 Recreational Boating .............................................................................................................. 195 6.11.1 Regional Activity ....................................................................................................... 195 6.11.2 Regional Economic Value and Employment ............................................................ 196 6.11.3 Future Trends ........................................................................................................... 197
6.12 Shipping ................................................................................................................................. 197 6.12.1 Regional Activity ....................................................................................................... 197 6.12.2 Regional Economic Value and Employment ............................................................ 199 6.12.3 Future Trends ........................................................................................................... 199
6.13 Social and Community ............................................................................................................ 199 6.13.1 Regional Activity ....................................................................................................... 199 6.13.2 Regional Economic Value and Employment ............................................................ 201 6.13.3 Future Trends ........................................................................................................... 207
6.14 Telecomm Cables................................................................................................................... 208 6.14.1 Regional Activity ....................................................................................................... 208 6.14.2 Regional Economic Value and Employment ............................................................ 208 6.14.3 Future Trends ........................................................................................................... 208
6.15 Tourism .................................................................................................................................. 209 6.15.1 Regional Activity ....................................................................................................... 209 6.15.2 Regional Economic Value and Employment ............................................................ 209 6.15.3 Future Trends ........................................................................................................... 209
6.16 Waste Disposal....................................................................................................................... 209 6.16.1 Regional Activity ....................................................................................................... 209 6.16.2 Regional Economic Value and Employment ............................................................ 210 6.16.3 Future Trends ........................................................................................................... 210
6.17 Water Sports .......................................................................................................................... 210 6.17.1 Regional Activity ....................................................................................................... 210 6.17.2 Regional Economic Value and Employment ............................................................ 212 6.17.3 Future Trends ........................................................................................................... 213
7. North East Region .................................................................................................................. 214 7.1 Introduction ............................................................................................................................. 214 7.2 Aquaculture ............................................................................................................................ 214
7.2.1 Regional Activity ....................................................................................................... 214 7.2.2 Regional Economic Value and Employment ............................................................ 215 7.2.3 Future Trends ........................................................................................................... 215
Socio-economic Baseline Reviews for Offshore Renewables in Scottish Waters
R4032/3 xiii R.1905
7.3 Aviation ................................................................................................................................... 215 7.3.1 Regional Activity ....................................................................................................... 215 7.3.2 Regional Economic Value and Employment ............................................................ 216 7.3.3 Future Trends ........................................................................................................... 216
7.4 Carbon Capture and Storage ................................................................................................. 216 7.4.1 Regional Activity ....................................................................................................... 216 7.4.2 Regional Economic Value and Employment ............................................................ 217 7.4.3 Future Trends ........................................................................................................... 217
7.5 Coast Protection and Flood Defence ...................................................................................... 218 7.5.1 Regional Activity ....................................................................................................... 218 7.5.2 Regional Economic Value and Employment ............................................................ 218 7.5.3 Future Trends ........................................................................................................... 218
7.6 Commercial Fisheries ............................................................................................................. 219 7.6.1 Regional Activity ....................................................................................................... 219 7.6.2 Regional Economic Value and Employment ............................................................ 220 7.6.3 Future Trends ........................................................................................................... 221
7.7 Energy Generation ................................................................................................................. 221 7.7.1 Regional Activity ....................................................................................................... 221 7.7.2 Regional Economic Value and Employment ............................................................ 221 7.7.3 Future Trends ........................................................................................................... 222
7.8 Military Interests ..................................................................................................................... 222 7.8.1 Regional Activity ....................................................................................................... 222 7.8.2 Regional Economic Value and Employment ............................................................ 223 7.8.3 Future Trends ........................................................................................................... 223
7.9 Oil and Gas ............................................................................................................................ 224 7.9.1 Regional Activity ....................................................................................................... 224 7.9.2 Regional Economic Value and Employment ............................................................ 226 7.9.3 Future Trends ........................................................................................................... 227
7.10 Ports and Harbours ................................................................................................................ 228 7.10.1 Regional Activity ....................................................................................................... 228 7.10.2 Regional Economic Value and Employment ............................................................ 230 7.10.3 Future Trends ........................................................................................................... 230
7.11 Power Interconnectors ............................................................................................................ 231 7.11.1 Regional Activity ....................................................................................................... 231 7.11.2 Regional Economic Value and Employment ............................................................ 231 7.11.3 Future Trends ........................................................................................................... 231
7.12 Recreational Boating .............................................................................................................. 232 7.12.1 Regional Activity ....................................................................................................... 232 7.12.2 Regional Economic Value and Employment ............................................................ 232 7.12.3 Future Trends ........................................................................................................... 232
7.13 Shipping ................................................................................................................................. 233 7.13.1 Regional Activity ....................................................................................................... 233 7.13.2 Regional Economic Value and Employment ............................................................ 234 7.13.3 Future Trends ........................................................................................................... 234
7.14 Social and Community ............................................................................................................ 234 7.14.1 Regional Activity ....................................................................................................... 234 7.14.2 Regional Economic Value and Employment ............................................................ 236 7.14.3 Future Trends ........................................................................................................... 241
7.15 Telecomm Cables................................................................................................................... 242 7.15.1 Regional Activity ....................................................................................................... 242 7.15.2 Regional Economic Value and Employment ............................................................ 243 7.15.3 Future Trends ........................................................................................................... 243
Socio-economic Baseline Reviews for Offshore Renewables in Scottish Waters
R4032/3 xiv R.1905
7.16 Tourism .................................................................................................................................. 243 7.16.1 Regional Activity ....................................................................................................... 243 7.16.2 Regional Economic Value and Employment ............................................................ 244 7.16.3 Future Trends ........................................................................................................... 244
7.17 Waste Disposal....................................................................................................................... 244 7.17.1 Regional Activity ....................................................................................................... 244 7.17.2 Regional Economic Value and Employment ............................................................ 245 7.17.3 Future Trends ........................................................................................................... 245
7.18 Water Sports .......................................................................................................................... 246 7.18.1 Regional Activity ....................................................................................................... 246 7.18.2 Regional Economic Value and Employment ............................................................ 247 7.18.3 Future Trends ........................................................................................................... 248
8. East Region ............................................................................................................................ 249 8.1 Introduction ............................................................................................................................. 249 8.2 Aviation ................................................................................................................................... 249
8.2.1 Regional Activity ....................................................................................................... 249 8.2.2 Regional Economic Value and Employment ............................................................ 250 8.2.3 Future Trends ........................................................................................................... 250
8.3 Coast Protection and Flood Defence ...................................................................................... 251 8.3.1 Regional Activity ....................................................................................................... 251 8.3.2 Regional Economic Value and Employment ............................................................ 251 8.3.3 Future Trends ........................................................................................................... 252
8.4 Commercial Fisheries ............................................................................................................. 252 8.4.1 Regional Activity ....................................................................................................... 252 8.4.2 Regional Economic Value and Employment ............................................................ 254 8.4.3 Future Trends ........................................................................................................... 254
8.5 Energy Generation ................................................................................................................. 254 8.5.1 Regional Activity ....................................................................................................... 254 8.5.2 Regional Economic Value and Employment ............................................................ 255 8.5.3 Future Trends ........................................................................................................... 255
8.6 Military Interests ..................................................................................................................... 255 8.6.1 Regional Activity ....................................................................................................... 255 8.6.2 Regional Economic Value and Employment ............................................................ 256 8.6.3 Future Trends ........................................................................................................... 257
8.7 Oil and Gas ............................................................................................................................ 257 8.7.1 Regional Activity ....................................................................................................... 257 8.7.2 Regional Economic Value and Employment ............................................................ 258 8.7.3 Future Trends ........................................................................................................... 258
8.8 Ports and Harbours ................................................................................................................ 258 8.8.1 Regional Activity ....................................................................................................... 258 8.8.2 Regional Economic Value and Employment ............................................................ 260 8.8.3 Future Trends ........................................................................................................... 261
8.9 Power Interconnectors ............................................................................................................ 261 8.9.1 Regional Activity ....................................................................................................... 261 8.9.2 Regional Economic Value and Employment ............................................................ 261 8.9.3 Future Trends ........................................................................................................... 262
8.10 Recreational Boating .............................................................................................................. 262 8.10.1 Regional Activity ....................................................................................................... 262 8.10.2 Regional Economic Value and Employment ............................................................ 262 8.10.3 Future Trends ........................................................................................................... 262
Socio-economic Baseline Reviews for Offshore Renewables in Scottish Waters
R4032/3 xv R.1905
8.11 Shipping ................................................................................................................................. 263 8.11.1 Regional Activity ....................................................................................................... 263 8.11.2 Regional Economic Value and Employment ............................................................ 263 8.11.3 Future Trends ........................................................................................................... 264
8.12 Social and Community ............................................................................................................ 264 8.12.1 Regional Activity ....................................................................................................... 264 8.12.2 Regional Economic Value and Employment ............................................................ 265 8.12.3 Future Trends ........................................................................................................... 271
8.13 Telecomm Cables................................................................................................................... 271 8.13.1 Regional Activity ....................................................................................................... 271 8.13.2 Regional Economic Value and Employment ............................................................ 272 8.13.3 Future Trends ........................................................................................................... 272
8.14 Tourism .................................................................................................................................. 272 8.14.1 Regional Activity ....................................................................................................... 272 8.14.2 Regional Economic Value and Employment ............................................................ 274 8.14.3 Future Trends ........................................................................................................... 274
8.15 Waste Disposal....................................................................................................................... 274 8.15.1 Regional Activity ....................................................................................................... 274 8.15.2 Regional Economic Value and Employment ............................................................ 275 8.15.3 Future Trends ........................................................................................................... 275
8.16 Water Sports .......................................................................................................................... 276 8.16.1 Regional Activity ....................................................................................................... 276 8.16.2 Regional Economic Value and Employment ............................................................ 277 8.16.3 Future Trends ........................................................................................................... 278
9. References ............................................................................................................................. 279
Socio-economic Baseline Reviews for Offshore Renewables in Scottish Waters
R4032/3 xvi R.1905
Tables 1. Data sources used in the aquaculture baseline .......................................................................... 2 2. ABI statistics relating to employment in Scotland within the aquaculture sector ........................ 4 3. Information sources for aviation baseline ................................................................................... 7 4. Summary of air transport statistics from 1999 to 2009 ................................................................ 8 5. Constrained terminal passenger and ATM „central‟ forecasts for major Scottish airports ........... 9 6. Information sources for CCS baseline ...................................................................................... 10 7. Information sources for coast protection and flood defence baseline ....................................... 12 8. Information sources for commercial fisheries baseline ............................................................. 13 9. Information sources for salmon and sea trout baseline ............................................................ 13 10. Quantity and value of landings by Scottish based vessels by species type and vessel
length (2010) ............................................................................................................................ 16 11. Landings into the top three Scottish ports (2010) ..................................................................... 17 12. Number of fishermen employed on Scottish based vessels, by district (2010) ......................... 18 13. Employment in fish and shellfish processing and retail in Scotland .......................................... 19 14. Reported annual catches, number of salmon (2006 - 2010) ..................................................... 23 15. Reported annual catches, number of sea trout (2006 - 2010) .................................................. 23 16. Data sources used in the energy generation chapter ............................................................... 25 17. Installed capacity for renewables in Scotland (MWe) ............................................................... 28 18. Direct employment in the electricity sector in Scotland by SIC Code ........................................ 31 19. Information sources for military interests baseline .................................................................... 35 20. Information sources for oil and gas baseline ............................................................................ 37 21. Production and revenues from oil and gas from Scottish sea areas between 2005-2008 ........ 38 22. ABI employment figures for oil and gas related activities in Scotland ....................................... 39 23. Information sources for ports and harbours baseline ................................................................ 41 24. Total Scottish port tonnages 1990 to 2008 ............................................................................... 44 25. Information sources for power interconnectors baseline ........................................................... 46 26. Proposed marine power cable developments in the UK relevant to Scotland ........................... 48 27. Data sources used in the recreational boating baseline ........................................................... 49 28. Economic impact of sailing in Scotland..................................................................................... 50 29. Estimate of annual compound growth in 'core' marina operations ............................................ 51 30. Data sources used in the shipping baseline ............................................................................. 52 31. Ship type arrivals at 16 major ports .......................................................................................... 53 32. Employees in the shipping sector ............................................................................................. 54 33. Data sources used in the social and community chapter .......................................................... 56 34. Total population within each region (2001 census) ................................................................... 58 35. Total population within each region, broken down by age (2001 census) ................................. 60 36. Rank of deprivation for income ................................................................................................. 63 37. Rank of deprivation for employment ......................................................................................... 64 38. Employment data by industry sector ......................................................................................... 64 39. Number of crofts and crafting income by region ....................................................................... 66 40. Turnover of social economy in Scotland (2004 to 2009) ........................................................... 66 41. Rank of deprivation for health ................................................................................................... 68 42. Overall rank of deprivation ........................................................................................................ 69 43. Overall rank of deprivation (coastal datazones only) ................................................................ 70
Socio-economic Baseline Reviews for Offshore Renewables in Scottish Waters
R4032/3 xvii R.1905
44. Rank of deprivation for education, skills and training ................................................................ 72 45. Percentage of the population with a degree (2004 - 2010) ...................................................... 72 46. Percentage of the population with no qualifications (2004 - 2010)........................................... 73 47. Percentage receiving job-related training (2004 - 2010) .......................................................... 73 48. Pupil teacher ratios by school sector in 2010 and 2011............................................................ 74 49. Household spaces .................................................................................................................... 75 50. Proportion of dwellings failing the SHQS level .......................................................................... 76 51. Rank of deprivation for housing ................................................................................................ 76 52. Mean (median) drive time to services ....................................................................................... 78 53. Range (minimum to maximum) of drive time to services .......................................................... 78 54. Summary of future trends in Scotland....................................................................................... 83 55. Information sources for telecomm cables baseline ................................................................... 84 56. Submarine cables passing through the SREZs and date cables in-service .............................. 85 57. Data sources used in the tourism chapter ................................................................................ 87 58. Places visited ............................................................................................................................ 88 59. Main tourism activities .............................................................................................................. 90 60. Economic contribution by type of wildlife tourism ..................................................................... 91 61. Mean tourism expenditure ........................................................................................................ 92 62. Employment generated from wildlife tourism ............................................................................ 95 63. Information sources for waste disposal baseline ...................................................................... 95 64. First phase and medium term NRIP sites identified for potential development ......................... 97 65. Data sources used in the water sports chapter ......................................................................... 98 66. Total and average annual spending, by water sport activity ................................................... 101 67. Activities present within the South West SORER ................................................................... 103 68. South West employment figures for activities relating to marine aquaculture ......................... 104 69. Employment in fish and shellfish processing and retail in the South West SORER ................ 106 70. Employment in the electricity sector in the South West by SIC Code ..................................... 107 71. MOD personnel by local authority areas which lie within the South West Region .................. 108 72. South West Region major port tonnages ................................................................................ 109 73. South West Regional ports ..................................................................................................... 109 74. Details of interconnector power cables in the South West Region .......................................... 110 75. Sailing area values and berth numbers for the Clyde sailing tourism region .......................... 111 76. South West Regional vessel arrival counts at major ports ...................................................... 112 77. South West Regional ferry routes ........................................................................................... 112 78. Employment data by industry sector in the South West .......................................................... 115 79. Index of deprivation for South West ........................................................................................ 116 80. Summary of education and skills in the South West ............................................................... 116 81. Drive time to services in South West Region .......................................................................... 117 82. Population considered to be in fuel poverty in South West Region......................................... 118 83. Summary of future trends in South West Region .................................................................... 118 84. Subsea telecommunication cables in the South West Region ................................................ 119 85. Area of seabed covered by open disposal sites in the South West Region ............................ 121 86. Licensed and actual dredge disposal tonnage at sites in the South West Region .................. 121 87. The number of dive centres, charter boats and diving clubs found in the South West
Region .................................................................................................................................... 122 88. Activities present within the West SORER .............................................................................. 124 89. West employment figures for activities relating to marine aquaculture ................................... 125
Socio-economic Baseline Reviews for Offshore Renewables in Scottish Waters
R4032/3 xviii R.1905
90. Summary of activity at Scottish airports in the West Region ................................................... 125 91. Constrained terminal passenger and ATM „central‟ forecasts for major Scottish airports in
the West Region ..................................................................................................................... 126 92. Costs of flood defence schemes in the West Region since 2000 ........................................... 127 93. Employment in fish and shellfish processing and retail in the West SORER .......................... 129 94. Employment in the electricity sector in West by SIC Code ..................................................... 130 95. MOD personnel by local authority areas which lie within the West Region ............................. 131 96. West Region major port tonnages .......................................................................................... 133 97. West Regional ports ............................................................................................................... 133 98. West Regional ports and harbour employment ....................................................................... 135 99. Sailing area values and berth numbers for Clyde and the West ............................................. 137 100. West Regional vessel arrival counts at major ports ................................................................ 138 101. West Regional ferry routes ..................................................................................................... 138 102. West Regional shipping employment...................................................................................... 139 103. Employment data by industry sector in the West .................................................................... 141 104. Index of deprivation for West .................................................................................................. 143 105. Summary of education and skills in the West ......................................................................... 143 106. Drive time to services in West Region .................................................................................... 145 107. Electricity consumption in West Region .................................................................................. 146 108. Population considered to be in fuel poverty in West Region ................................................... 146 109. Summary of future trends in West Region .............................................................................. 147 110. Subsea telecommunication cables in the West Region .......................................................... 147 111. Percentage of visitor respondents taking part in different marine and coastal activities ......... 148 112. Area of seabed covered by open disposal sites in the West Region ...................................... 150 113. Licensed and actual dredge disposal tonnage at sites in the West Region ............................ 150 114. Surfing and windsurfing locations in the West Region ............................................................ 151 115. The number of dive centres, charter boats and diving clubs found in the West Region .......... 152 116. Estimated regional sea angling activity and expenditure in West Region ............................... 153 117. Activities present within the North West SORER .................................................................... 155 118. North West employment figures for activities relating to marine aquaculture ......................... 156 119. Summary of activity at Scottish airports in the North West Region ......................................... 156 120. Location and length of coast protection schemes in the North West Region since 2000 ........ 157 121. Cost of coast protection schemes in the North West Region .................................................. 157 122. Employment in fish and shellfish processing and retail in the North West SORER ................ 159 123. Employment in the electricity sector in North West by SIC Code............................................ 161 124. MOD personnel by local authority areas which lie within the North West Region ................... 162 125. North West Regional ports ...................................................................................................... 163 126. North West Regional ports and harbour employment ............................................................. 164 127. Sailing area values for the North West ................................................................................... 165 128. Monthly vessel traffic through the Minches in 2009 ................................................................ 166 129. North West Regional ferry routes ........................................................................................... 167 130. Employment data by industry sector in the North West .......................................................... 170 131. Household income and proportion of crafting income by area ................................................ 171 132. Index of deprivation for North West ........................................................................................ 171 133. Summary of education and skills in the North West................................................................ 172 134. Drive time to services in North West Region .......................................................................... 173 135. Electricity consumption in North West Region ........................................................................ 174
Socio-economic Baseline Reviews for Offshore Renewables in Scottish Waters
R4032/3 xix R.1905
136. Population considered to be in fuel poverty in North West Region ......................................... 174 137. Summary of future trends in North West Region .................................................................... 175 138. Subsea telecommunication cables in the North West Region ................................................ 176 139. Area of seabed covered by open disposal sites in the North West Region ............................. 177 140. Surfing and windsurfing locations in the North West Region .................................................. 178 141. The number of dive centres, charter boats and diving clubs found in the in North West
Region .................................................................................................................................... 179 142. Estimated regional sea angling activity and expenditure in North West Region ..................... 180 143. Activities present within the North SORER ............................................................................. 181 144. North employment figures for activities relating to marine aquaculture ................................... 182 145. Summary of activity at Scottish airports in the North Region .................................................. 182 146. Hydrocarbon fields assessed as having potential for CO2 storage alone in the North
Region .................................................................................................................................... 183 147. Saline aquifers that meet both geotechnical and storage capacity requirements in the
North Region .......................................................................................................................... 183 148. Employment in fish and shellfish processing and retail in the North SORER ......................... 186 149. Employment in the electricity sector in North by SIC Code ..................................................... 187 150. MOD personnel by local authority areas which lie within the North Region ............................ 188 151. Crude oil production from hydrocarbon fields located within the North Region ....................... 189 152. North Region major port tonnages .......................................................................................... 191 153. North Regional ports ............................................................................................................... 191 154. North Regional ports and harbour employment ...................................................................... 193 155. Proposed marine power cable developments in the UK relevant to Scotland ......................... 195 156. Sailing area value and berth numbers 2009 ........................................................................... 196 157. Pentland Firth (2009) marine traffic ........................................................................................ 197 158. North Regional vessel arrival counts at major ports ............................................................... 198 159. North Regional ferry routes ..................................................................................................... 198 160. North Regional shipping employment ..................................................................................... 199 161. Employment data by industry sector in the North ................................................................... 201 162. Index of deprivation for North ................................................................................................. 203 163. Summary of education and skills in the North ......................................................................... 204 164. Drive time to services in North Region .................................................................................... 205 165. Electricity consumption in North Region ................................................................................. 206 166. Population considered to be in fuel poverty in North Region .................................................. 206 167. Summary of future trends in North Region ............................................................................. 207 168. Subsea telecommunication cables in the North Region .......................................................... 208 169. Area of seabed covered by open disposal sites in the North Region ...................................... 210 170. Surfing and windsurfing locations in the North Region ........................................................... 211 171. The number of dive centres, charter boats and diving clubs found in the region in North
Region .................................................................................................................................... 212 172. Estimated regional sea angling activity and expenditure in North Region .............................. 213 173. Activities present within the North East SORER ..................................................................... 214 174. North East employment figures for activities relating to marine aquaculture .......................... 215 175. Summary of activity at Scottish airports in the North East Region .......................................... 215 176. Constrained terminal passenger and ATM „central‟ forecasts for major Scottish airports in
the North East Region ............................................................................................................ 216
Socio-economic Baseline Reviews for Offshore Renewables in Scottish Waters
R4032/3 xx R.1905
177. Hydrocarbon fields assessed as having potential for CO2 storage alone in the North East Region .................................................................................................................................... 217
178. Saline aquifers that meet both geotechnical and storage capacity requirements in the North East Region .................................................................................................................. 217
179. Location and details of flood and coastal defence schemes in the North East Region ........... 218 180. Cost of coast protection schemes in the North East Region since 2000 ................................. 218 181. Employment in fish and shellfish processing and retail in the North East SORER ................. 221 182. Employment in the electricity sector in North East by SIC Code ............................................ 222 183. RAF stations in the North East Region ................................................................................... 223 184. MOD personnel by local authority areas which lie within the North East Region .................... 223 185. Crude oil production from hydrocarbon fields located within the North East Region ............... 224 186. Employment by parliamentary constituency in the North East Region.................................... 227 187. ABI employment figures for oil and gas related activities in the North East Region ................ 227 188. North East Region major port tonnages .................................................................................. 228 189. North East Regional ports ....................................................................................................... 229 190. Proposed marine power cable developments in the UK relevant to Scotland ......................... 232 191. Sailing area values and berth numbers .................................................................................. 232 192. North East Regional vessel arrival counts at major ports ....................................................... 233 193. North East Regional shipping employment ............................................................................. 234 194. Employment data by industry sector in the North East ........................................................... 236 195. Index of deprivation for North East ......................................................................................... 238 196. Summary of education and skills in the North East................................................................. 238 197. Drive time to services in North East Region ........................................................................... 240 198. Electricity consumption in North East Region ......................................................................... 241 199. Population considered to be in fuel poverty in North East Region .......................................... 241 200. Summary of future trends in North East Region ..................................................................... 242 201. Subsea telecommunication cables in the North East Region ................................................. 243 202. Area of seabed covered by open disposal sites in the North East Region .............................. 244 203. Licensed and actual dredge disposal tonnage at sites in the North East Region ................... 245 204. Surfing and windsurfing locations in the North East Region ................................................... 246 205. The number of dive centres, charter boats and diving clubs found in North East Region ....... 247 206. Estimated regional sea angling activity and expenditure in North East Region ...................... 248 207. Activities present within the East SORER ............................................................................... 249 208. Summary of activity at Scottish airports in the East Region .................................................... 250 209. Location of NERL radar in the East Region ............................................................................ 250 210. Constrained terminal passenger and ATM „central‟ forecasts for major Scottish airports in
the East Region ...................................................................................................................... 251 211. Location and details of flood and coastal defence schemes in the East Region ..................... 251 212. Cost of coast protection schemes in the East Region since 2000 .......................................... 252 213. Employment in fish and shellfish processing and retail in the East SORER ........................... 254 214. Employment in the electricity sector in East by SIC Code ...................................................... 255 215. MOD personnel by local authority areas which lie within the East Region .............................. 256 216. Crude oil production from hydrocarbon fields located within the East Region ........................ 257 217. ABI employment figures for oil and gas related activities in the East Region ......................... 258 218. East Region major port tonnages ........................................................................................... 259 219. East Regional ports ................................................................................................................ 260 220. East Regional ports and harbour employment ........................................................................ 261
Socio-economic Baseline Reviews for Offshore Renewables in Scottish Waters
R4032/3 xxi R.1905
221. Proposed marine power cable developments in the UK relevant to Scotland ......................... 262 222. East Regional vessel arrival counts at major ports ................................................................. 263 223. Employment data by industry sector in the East ..................................................................... 266 224. Index of deprivation for East ................................................................................................... 267 225. Summary of education and skills in the East .......................................................................... 268 226. Drive time to services in East Region ..................................................................................... 269 227. Electricity consumption in East Region ................................................................................... 270 228. Population considered to be in fuel poverty in East Region .................................................... 270 229. Summary of future trends in East Region ............................................................................... 271 230. Subsea telecommunication cables in the East Region ........................................................... 272 231. Area of seabed covered by open disposal sites in the East Region ....................................... 274 232. Licensed and actual dredge disposal tonnage at sites in the East Region ............................. 275 233. Surfing and windsurfing locations in the East Region ............................................................. 276 234. The number of dive centres, charter boats and diving clubs found in East Region ................. 276 235. Estimated regional sea angling activity and expenditure in East Region ................................ 277
Images 1. Annual Production (Tonnes) of Atlantic Salmon in Scotland from 2000-2009 ............................ 5 2. Annual Production of Shellfish in Scotland from 1998-2007 ....................................................... 5 3. Quantity and Value of Landings by Scottish Vessels: Percentage of Each Species Type
(2010) ....................................................................................................................................... 14 4. Number of Active Scottish Based Vessels by Length Group as at 31 December 2010 ............ 16 5. Installed Capacity for Wind (Including Wave) in Scotland ......................................................... 28 6. Energy Generated from Wind (Including Wave) in Scotland ..................................................... 32 7. National Age Range ................................................................................................................. 58 8. Change in Proportion of Working Age Population .................................................................... 59 9. Change in Proportion of Working Age Population Across the SORERs ................................... 59 10. Change in Proportion of Total Population, Children and People of Pensionable Age ............... 60 11. Median Gross Weekly Earnings (Scotland) .............................................................................. 61 12. Change in Median Gross Weekly Earnings 2001-2010 ............................................................ 61 13. Median Gross Weekly Earnings (by Region) ............................................................................ 62 14. Difference in Median Gross Weekly Earnings for Male and Female Full-Time Workers
(by Region) ............................................................................................................................... 63 15. Percentage of Businesses Surviving for Longer Than Three Years ......................................... 67 16. Self-Assessed Health Rating (Minimum %) .............................................................................. 67 17. Chart Showing Change in Population in Poverty ...................................................................... 71 18. Chart Showing Change in Proportion of the Population in Poverty ........................................... 71 19. Chart Showing Proportion of the Population Within 30 Minutes Drive Time of a Higher or
Further Education College ........................................................................................................ 74 20. Mean House Price .................................................................................................................... 77 21. Perceptions of Neighbourhood (Minimum Response) .............................................................. 79 22. Energy Consumption (MWh) Per Person by Region (All Consumers) ...................................... 79 23. Energy Consumption (MWh) Per Person by Region (Domestic Consumers Only) ................... 80 24. Percentage of the Population in Fuel Poverty in Scotland ........................................................ 81 25. Variation in Fuel Poverty Across All Regions ............................................................................ 82
Socio-economic Baseline Reviews for Offshore Renewables in Scottish Waters
R4032/3 xxii R.1905
26. Percentage of Households with HIH 60+ in Fuel Poverty ......................................................... 82 27. Proportion of People Undertaking Different Types of Marine and Coastal Activity ................... 90 28. Proportion of the Population Who Have Attended a Cultural Event in the Past 12 Months
(2007-2008) .............................................................................................................................. 93 29. Proportion of the Population Who Have Taken Part in a Cultural Event in the Past 12
Months (2007-2008) ................................................................................................................. 93 30 Comparison of the Population of South West Region with National Average ......................... 113 31 Change in Population 1996-2010 in South West Region ........................................................ 114 32. Comparison of the Population of West Region with National Average ................................... 140 33. Change in Population 1996-2010 in West Region .................................................................. 141 34. Comparison of the Population of North West Region with National Average .......................... 168 35. Change in Population 1996-2010 in the North West Region .................................................. 169 36. Comparison of the Population of North Region with National Average ................................... 200 37. Change in Population 1996-2010 in the North Region............................................................ 200 38. Comparison of the Population of North East Region with National Average ........................... 235 39. Change in Population 1996-2010 in the North East Region ................................................... 236 40. Comparison of the Population of East Region with National Average .................................... 264 41. Change in Population 1996-2010 in the East Region ............................................................. 265
Figures (Separate Volume 2)
1. Scottish Offshore Renewable Energy Regions 2. Aquaculture Sites within SORERs 3. Airports within SORERs 4. Carbon Dioxide Storage Potential within SORERs 5. Coastal Flood Defence since 1961 within SORERs 6. Annual Average Value (2001 to 2010) of Inshore and Offshore Landings within SORERs 7. Annual Average Fishing Value for All VMS Gear Types 8. Total Landings Value in all SORERs into the UK or by UK Vessels Landing Abroad by Selected
Species (2001 - 2010) 9. Total Landings Value in all SORERs into the UK or by UK Vessels Landing Abroad by Vessel
Length (2001 - 2010) 10. Total Landings into the UK or by UK Vessels Landing Abroad for Each SORER (2001 - 2010) 11. Surveillance Sightings by Nationality within SORERs 12. Surveillance Sightings by Gear Type within SORERs 13. Coastal Salmon & Sea Trout Fishing and Fishing Ports within SORERs 14. Renewable Energy within SORERs 15. Coastal Military Locations and Military Practice Areas within SORERs 16. Oil and Gas within SORERs 17. Port Locations within SORERs 18a. Interconnector Cables within SORERs 18b. Potential Future Interconnector Cables within SORERs 19. RYA Marinas, Sailing Clubs, Training Centres and Cruising Routes within SORERs 20. Shipping within SORERs 21. Ferry Routes within SORERs
Socio-economic Baseline Reviews for Offshore Renewables in Scottish Waters
R4032/3 xxiii R.1905
22. Distribution of Businesses by Industry within SORERs 23. Average House Prices Across SORERs 24. Telecommunication Cables within SORERs 25. Key Tourist Sites within SORERs 26. Coastal Awards within SORERs 27. Coastal and Maritime Cultural Heritage Assets within SORERs 28. Distribution of Employment for Tourism Sectors within SORERs 29. Waste Disposal Grounds within SORERs 30. Surfing and Wind Surfing Locations within SORERs 31. Popularity of Canoeing and Kayaking for each SNH Seascape Unit within SORERs 32. Popular Dive Sites within SORERs 33. Dinghy Sailing Clubs within SORERs 34. Aquaculture Sites within SORER South West 35. Annual Average Value (2010 to 2010) of Landings by Fish Group within SORER South West 36. Annual Average Value (2001 to 2010) of Landings by Vessel Length within SORER South
West 37. Annual Average Value (2001 to 2010) of Landings by Fish Species within SORER South West 38. Annual Average Value (2001 to (2010) of Landings by Gear Type within SORER South West 39. Landings Value by Gear Type from 2001 to 2010 within SORER South West 40. Landings Value by Vessel Length from 2001 to 2010 within SORER South West 41. Landings Value by Fish Species from 2001 to 2010 within SORER South West 42. Surveillance Sightings by Nationality within SORER South West 43. Surveillance Sightings by Gear Type within SORER South West 44. Coastal Salmon & Sea Trout Fishing Locations and Fishing Ports within SORER South West 45. Renewable Energy within SORER South West 46. Coastal Military Locations and Military Practice Areas within SORER South West 47. Oil and Gas within SORER South West 48. Port Locations within SORER South West 49. Interconnector Cables within SORER South West 50. RYA Marinas, Sailing Clubs, Training Centres and Cruising Routes within SORER South West 51. Ferry Routes within SORER South West 52. Average House Prices Across SORERs South West and East 53. Telecommunication Cables within SORER South West 54. Key Tourist Sites within SORER South West 55. Coastal and Maritime Cultural Heritage Assets within SORER South West 56. Coastal Awards within SORER South West 57. Waste Disposal Grounds within SORER South West 58. Dive Sites within SORER South West 59. Dinghy Sailing Clubs within SORER South West 60. Canoe and Kayaking Trips within SORER South West 61. Aquaculture Sites within SORER West 62. Coastal Flood Defence since 1961 within SORER West 63. Annual Average Value (2001 to 2010) of Landings by Fish Group within SORER West 64. Annual Average Value (2001 to 2010) of Landings by Vessel Length within SORER West 65. Annual Average Value (2001 to 2010) of Landings by Fish Species within SORER West 66. Annual Average Value (2001 to 2010) of Landings by Gear Type within SORER West 67. Landings Value by Gear Type from 2001 to 2010 within SORER West

Socio-economic Baseline Reviews for Offshore Renewables in Scottish Waters
R4032/3 xxiv R.1905
68. Landings Value by Vessel Length from 2001 to 2010 within SORER West 69. Landings Value by Fish Species from 2001 to 2010 within SORER West 70. Surveillance Sightings by Nationality within SORER West 71. Surveillance Sightings by Gear Type within SORER West 72. Coastal Salmon & Sea Trout Fishing Locations and Port Locations within SORER West 73. Renewable Energy within SORER West 74. Coastal Military Locations and Military Practice Areas within SORER West 75. Oil and Gas within SORER West 76. Port Locations within SORER West 77. Interconnector Cables within SORER West 78. RYA Marinas, Sailing Clubs, Training Centres and Cruising Routes within SORER West 79. Ferry Routes within SORER West 80. Average House Prices Across SORERs North East and West 81. Telecommunication Cables within SORER West 82. Key Tourist Sites within SORER West 83. Coastal and Maritime Cultural Heritage Assets within SORER West 84. Coastal Awards within SORER West 85. Waste Disposal Grounds within SORER West 86. Surfing and Wind Surfing Locations within SORER West 87. Dive Sites within SORER West 88. Dinghy Sailing within SORER West 89. Popularity of Canoeing and Kayaking for each Seascape Unit within SORER West 90. Aquaculture Sites within SORER North West 91. Coastal Flood Defence since 1961 within SORER North West 92. Annual Average Value (2001 to 2010) of Landings by Fish Group within SORER North West 93. Annual Average Value (2001 to 2010) of Landings by Gear Type within SORER North West 94. Annual Average Value (2001 to 2010) of Landings by Fish Species within SORER North West 95. Annual Average Value (2001 to 2010) of Landings by Gear Type within SORER North West 96. Landings Value by Gear Type from 2001 to 2010 within SORER North West 97. Landings Value by Vessel Length from 2001 to 2010 within SORER North West 98. Landings Value by Species from 2001 to 2010 within SORER North West 99. Surveillance Sightings by Nationality within SORER North West 100. Surveillance Sightings by Gear Type within SORER North West 101. Coastal Salmon & Sea Trout Fishing Locations and Fishing Ports within SORER North West 102. Renewable Energy within SORER North West 103. Coastal Military Locations and Military Practice Areas within SORER North West 104. Oil and Gas within SORER North West 105. Port Locations within SORER North West 106. Interconnector Cables within SORER North West 107. RYA Marinas, Sailing Clubs, Training Centres and Cruising Routes within SORER North West 108. Ferry Routes within SORER North West 109. Average House Prices Across SORERs North and North West 110. Telecommunication Cables within SORER North West 111. Key Tourist Sites within SORER North West 112. Coastal and Maritime Cultural Heritage Assets within SORER North West 113. Coastal Awards within SORER North West 114. Waste Disposal grounds within SORER North West

Socio-economic Baseline Reviews for Offshore Renewables in Scottish Waters
R4032/3 xxv R.1905
115. Surfing and Wind Surfing Locations within SORER North West 116. Dive Sites within SORER North West 117. Dinghy Sailing Clubs within SORER North West 118. Popularity of Canoeing and Kayaking for each SNH Seascape Unit within SORER North West 119. Aquaculture Sites within SORER North 120. Carbon Dioxide Storage Potential within SORER North 121. Annual Average Value (2001 to 2010) of Landings by Fish Group within SORER North 122. Annual Average Value (2001 to 2010) of Landings by Vessels Length within SORER North 123. Annual Average Value (2001 to 2010) of Landings by Fish Species within SORER North 124. Annual Average Value (2001 to 2010) of Landings by Gear Type within SORER North 125. Landings Value by Gear Type from 2001 to 2010 within SORER North 126. Landings Value by Vessel Length from 2001 to 2010 within SORER North 127. Landings Value by Species from 2001 to 2010 within SORER North 128. Surveillance Sightings by Nationality within SORER North 129. Surveillance Sightings by Gear Type within SORER North 130. Coastal Salmon & Sea Trout Fishing Locations and Fishing Ports within SORER North 131. Renewable Energy within SORER North 132. Coastal Military Locations and Military Practice Areas within SORER North 133. Oil and Gas within SORER North 134. Port Locations within SORER North 135. Interconnector Cables within SORER North 136. RYA Marinas, Sailing Clubs, Training Centres and Cruising Routes within SORER North 137. Ferry Routes within SORER North 138. Telecommunication Cables within SORER North 139. Key Tourist Sites within SORER North 140. Coastal and Maritime Cultural Heritage Assets within SORER North 141. Coastal Awards within SORER North 142. Waste Disposal Grounds within SORER North 143. Surfing and Wind Surfing Locations within SORER North 144. Dive Sites within SORER North 145. Dinghy Sailing Clubs within SORER North 146. Popularity of Canoeing and Kayaking for each SNH Seascape Unit within SORER North 147. Aquaculture Sites within SORER North East 148. Carbon Dioxide Storage Potential within SORER North East 149. Coastal Flood Defence Schemes since 1961 within SORER North East 150. Annual Average Value (2001 to 2010) of Landings by Fish Group within SORER North East 151. Annual Average Value (2001 to 2010) of Landings by Fish Species within SORER North East 152. Annual Average Value (2001 to 2010) of Landings by Vessel Length within SORER North East 153. Annual Average Value (2001 to 2010) of Landings by Gear Type within SORER North East 154. Landings Value by Gear Type from 2001 to 2010 within SORER North East 155. Landings Value by Vessel Length from 2001 to 2010 within SORER North East 156. Landings Value by Species from 2001 to 2010 within SORER North East 157. Surveillance Sightings by Nationality within SORER North East 158. Surveillance Sightings by Gear Type within SORER North East 159. Coastal Salmon & Sea Trout Fishing Locations and Fishing Ports within SORER North East 160. Renewable Energy within SORER North East 161. Coastal Military Locations and Military Practice Areas within SORER North East

Socio-economic Baseline Reviews for Offshore Renewables in Scottish Waters
R4032/3 xxvi R.1905
162. Oil and Gas within SORER North East 163. Port Locations within SORER North East 164. Interconnector Cables within SORER North East 165. RYA Marinas, Sailing Clubs, Training Centres and Cruising Routes within SORER North East 166. Ferry Routes within SORER North East 167. Telecommunication Cables within SORER North East 168. Key Tourist Sites within SORER North East 169. Coastal and Maritime Cultural Heritage Assets within SORER North East 170. Coastal Awards within SORER North East 171. Waste Disposal Grounds within SORER North East 172. Surfing and Wind Surfing Locations within SORER North East 173. Dive Sites within SORER North East 174. Dinghy Sailing Clubs within SORER North East 175. Popularity of Canoeing and Kayaking for each SNH Seascape Unit within SORER North East 176. Coastal Flood Defence Schemes since 1961 within SORER East 177. Annual Average Value (2001 to 2010) of Landings by Fish Group within SORER North 178. Annual Average Value (2001 to 2010) of Landings by Vessel Length within SORER East 179. Annual Average Value (2001 to 2010) of Landings by Fish Species within SORER East 180. Annual Average Value (2001 to 2010) of Landings by Gear Type within SORER East 181. Landings Value by Gear Type from 2001 to 2010 within SORER East 182. Landings Value by Vessel Length from 2001 to 2010 within SORER East 183. Landings Value by Species from 2001 to 2010 within SORER East 184. Surveillance Sightings by Nationality within SORER East 185. Surveillance Sightings by Gear Type within SORER East 186. Coastal Salmon & Sea Trout Fishing Locations and Fishing Ports within SORER East 187. Renewable Energy within SORER East 188. Coastal Military Locations and Military Practice Areas within SORER East 189. Oil and Gas within SORER East 190. Port Locations within SORER East 191. Interconnector Cables within SORER East 192. RYA Marinas, Sailing Clubs, Training Centres and Cruising Routes within SORER East 193. Ferry Routes within SORER East 194. Telecommunication Cables within SORER East 195. Key Tourist Sites within SORER East 196. Coastal and Maritime Cultural Heritage Assets within SORER East 197. Coastal Awards within SORER East 198. Waste Disposal Grounds within SORER East 199. Surfing and Wind Surfing Locations within SORER East 200. Dive Sites within SORER East 201. Dinghy Sailing Clubs within SORER East 202. Popularity of Canoeing and Kayaking for each SNH Seascape Unit within SORER East
Socio-economic Baseline Reviews for Offshore Renewables in Scottish Waters
R4032/3 1 R.1905
1. Introduction ABP Marine Environmental Research Ltd (ABPmer) and RPA were commissioned by Marine Scotland to prepare a baseline socio-economic review to inform impact assessments of future sectoral plans for offshore wind and wave and tidal energy in Scottish Territorial Waters and waters offshore of Scotland (hereafter „Scottish Waters‟). This report provides a national overview of socio-economic activities together with regional baseline reviews covering the six Scottish Offshore Renewable Energy Regions (SORERs) (Figure 1). The baseline reviews encompass the following marine uses and other interests: Aquaculture (finfish and shellfish); Aviation; Carbon Capture and Storage; Coast Protection and Flood Defence; Commercial Fisheries (including salmon and sea trout); Energy Generation (and associated supply chains) Military Interests; Oil and Gas (including exploration, production, interconnectors, gas storage); Ports and Harbours; Power Interconnectors; Recreational Boating; Shipping; Social and Community; Telecom Cables; Tourism (including heritage assets); Waste Disposal (dredge material); and Water Sports. Details of the methodology used to scope and develop the baseline review are provided in ABPmer (2011). The baseline review is structured into the following sections: Section 2 - National Overview Section 3 - South West Region Section 4 - West Region Section 5 - North West Region Section 6 - North Region Section 7 - North East Region Section 8 - West Region
Socio-economic Baseline Reviews for Offshore Renewables in Scottish Waters
R4032/3 2 R.1905
2. National Overview
2.1 Introduction The national overview for each marine use identified above is detailed within this section. These sub-sections, which are arranged in alphabetical order of activity, provide information in a uniformed manner under the following headings: Definition of sector/activity; Description of information sources; and National overview of current activity.
2.2 Aquaculture
2.2.1 Definition of Sector/Activity Aquaculture relates to the production of marine species such as finfish and shellfish within aquaculture installations including cultivated shellfish beds. Biofuel production is likely to become another component of the UK industry in the future although it is currently only being undertaken on a research scale.
2.2.2 Description of Information Sources A variety of different information sources has been reviewed to inform this baseline, including published reports and papers, spatial layers and information provided through stakeholder engagement (Table 1). Table 1. Data sources used in the aquaculture baseline
Scale Information Available Date Source
Scotland Production and turnover 2005-2009 2005-2009 Baxter et al , 2011
Scotland Scottish shellfish production survey 2010 Marine Scotland , 2010a
Scotland Scottish fish farm production survey 2009 Marine Scotland , 2009
UK Future trends 2006+ Wilding et al , 2006
2.2.2.1 Data limitations Marine Scotland was only able to provide aquaculture data in point form locations, data on value of the industry and on production numbers are available however due to their sensitive nature these can not be reproduced within this document. However at the time of producing the Impact Assessment the Scottish Salmon Producers‟ Organisation will ensure these data are accessible to Marine Scotland.
Socio-economic Baseline Reviews for Offshore Renewables in Scottish Waters
R4032/3 3 R.1905
2.2.3 National Overview of Current Activity
2.2.3.1 Location and intensity of activity Marine aquaculture (Mariculture) is the largest and most valuable component of aquaculture in the UK with the industry broadly split into two main categories - finfish farming and shellfish cultivation and biofuels. Marine aquaculture sites in Scotland are currently situated in coastal areas within a few miles of the shore with no sites found further offshore. Most sites are also situated in sheltered, semi-enclosed sea lochs and voes (sea-inlets) and thus most are found on the West coast. Finfish production sites are distributed all along the West coast including the Hebrides and Northern Isles. A similar distribution is also found for shellfish production sites although one site is also found on the East coast, see Figure 2. Rising concern over global warming has encouraged the movement to alternate fuels (Kraan et al. 2011). Growth rates of marine macroalgae far exceed those of terrestrial biomass and provide a potential alternative as a biofuel to land-based crops such as corn and sugar cane. Among marine macroalgae, species of the temperate brown algal order Laminariales (so-called kelp species) are among the fastest growing plants in the world (Kraan et al. 2011; Kelly and Dworjanyn, 2008). While wild harvest of these species is expected to be unsustainable or only produce insignificant amounts, cultivation is a viable option. Macroalgae are already farmed on a massive scale in the Far East and to a much lesser extent in Europe, primarily in France. Within Scotland only research scale developments installations are currently being designed. 2.2.3.2 Economic value and employment Finfish and shellfish aquaculture is a growing industry and has a turnover worth around £427m per year to the Scottish economy at farm gate prices in 2009. Contributions to this turnover included Atlantic salmon (£412m), rainbow and brown trout (£6m), halibut (£0.5m), mussels (£7m) and other shellfish (£1.4m). Farmed salmon exports are valued at £285m annually. Exports from aquaculture are Scotland‟s largest food export (Baxter et al, 2011). Trout species are primarily farmed in freshwater habitats and therefore not discussed further in this report, however Sea Trout are discussed within the commercial fisheries sections. The total number of staff employed in salmon production in 2009 was 963 (874 full-time and 89 part-time jobs), an increase of 1% compared with 2008. The staffing figures collected refer specifically to the production of salmon, and do not include figures for staff involved with processing or marketing activities (Marine Scotland, 2009). Employment in the Scottish shellfish sector in 2010 showed a 16% increase from the previous year with 399 full, part-time and casual staff being employed during 2010 (Marine Scotland, 2010a).
Socio-economic Baseline Reviews for Offshore Renewables in Scottish Waters
R4032/3 4 R.1905
National employment figures for activities relating to marine aquaculture have been derived from the Business Register and Employment Survey (ONS, 2011) using UK Standard Industrial Classification (SIC) codes and are listed below in Table 2. It should be noted that only the activity of marine aquaculture (SIC 03210) is directly related to the marine aquaculture sector where employment figures have grown by approximately 20% between 2009 and 2010, the majority of which has been in part-time employment (Table 2). The remaining activities within the manufacture of prepared feeds for farm animals (SIC 10901) are not directly related to marine aquaculture but are considered secondary activities. Thus in reality the total number of employees relating to marine aquaculture may be much less (ONS, 2011). Table 2. ABI statistics relating to employment in Scotland within the aquaculture
sector
Standard Industrial Classification 2007 (SIC, 2007)
Full-time Employees Part-time Employees
2009 2010 2009 2010
Marine aquaculture (SIC 03210) 977 1000 77 290
(Source: Office for National Statistics: ONS, 2011)
Within Scotland there were 254 Salmon, two cod and five halibut sites registered as active in 2009 (Marine Scotland, 2009). A total of 328 shellfish sites were registered active in 2010 (Marine Scotland, 2010a). The location of these sites can be seen in Figure 2. 2.2.3.3 Historical trends In Scotland, Aquaculture production growth in value terms has averaged 4.6% per annum over the period 2000-2009 (Baxter et al. 2011). Trends in Scottish salmon production from 2000-2009 can be seen in Image 1 (Marine Scotland, 2009). The largest variation in salmon production occurred between 2002-2005 and was due mainly to a large smolt placement in years 2000, 2001 and 2002 and also affected by an increased average weight giving a higher yield per smolt put to sea between 2002-2003 and a reduction in the number of smolts being put to sea from 2003-2005.Trends in Scottish shellfish cultivation from 1998-2007 can be seen in Image 2 (Marine Scotland, 2010a). Production has been dominated by mussel and Pacific oyster, although small quantities of scallop, queen scallop (queen) and native oyster were also produced. Mussel production has shown a large year on year increase with the trend continuing from 2009-2010 (showing a 14% rise). Pacific oyster production has increased by 4% since 2009, following a small reduction in 2008-2009.
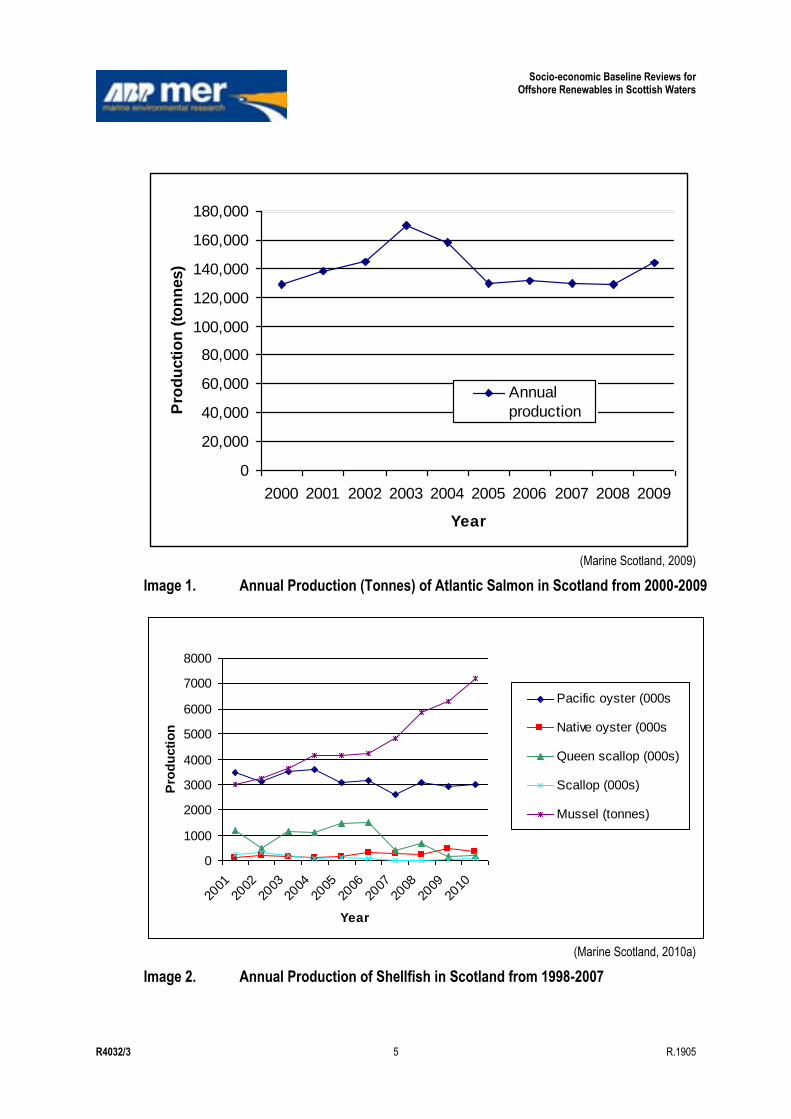
Socio-economic Baseline Reviews for Offshore Renewables in Scottish Waters
R4032/3 5 R.1905
0
20,000
40,000
60,000
80,000
100,000
120,000
140,000
160,000
180,000
2000 2001 2002 2003 2004 2005 2006 2007 2008 2009
Year
Pro
du
cti
on
(to
nn
es)
Annual
production
(tonnes)
(Marine Scotland, 2009)
Image 1. Annual Production (Tonnes) of Atlantic Salmon in Scotland from 2000-2009
0
1000
2000
3000
4000
5000
6000
7000
8000
2001
2002
2003
2004
2005
2006
2007
2008
2009
2010
Year
Pro
du
cti
on
Pacific oyster (000s
Native oyster (000s
Queen scallop (000s)
Scallop (000s)
Mussel (tonnes)
(Marine Scotland, 2010a)
Image 2. Annual Production of Shellfish in Scotland from 1998-2007
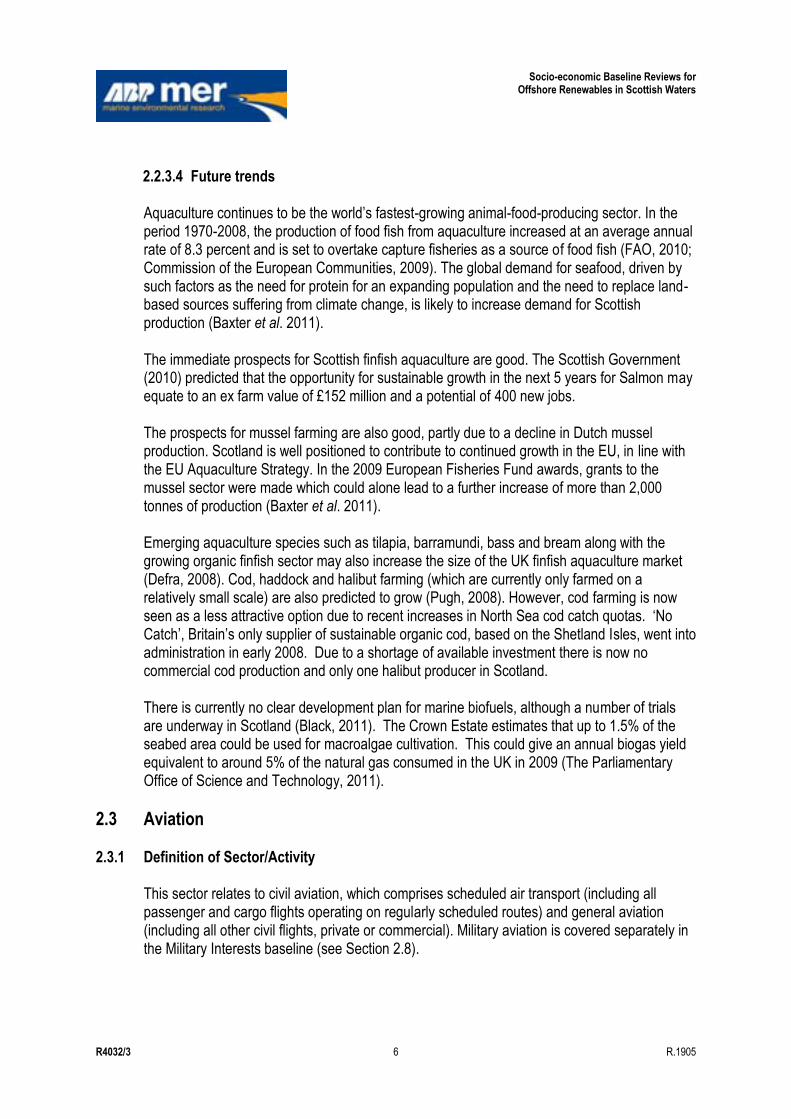
Socio-economic Baseline Reviews for Offshore Renewables in Scottish Waters
R4032/3 6 R.1905
2.2.3.4 Future trends Aquaculture continues to be the world‟s fastest-growing animal-food-producing sector. In the period 1970-2008, the production of food fish from aquaculture increased at an average annual rate of 8.3 percent and is set to overtake capture fisheries as a source of food fish (FAO, 2010; Commission of the European Communities, 2009). The global demand for seafood, driven by such factors as the need for protein for an expanding population and the need to replace land-based sources suffering from climate change, is likely to increase demand for Scottish production (Baxter et al. 2011). The immediate prospects for Scottish finfish aquaculture are good. The Scottish Government (2010) predicted that the opportunity for sustainable growth in the next 5 years for Salmon may equate to an ex farm value of £152 million and a potential of 400 new jobs. The prospects for mussel farming are also good, partly due to a decline in Dutch mussel production. Scotland is well positioned to contribute to continued growth in the EU, in line with the EU Aquaculture Strategy. In the 2009 European Fisheries Fund awards, grants to the mussel sector were made which could alone lead to a further increase of more than 2,000 tonnes of production (Baxter et al. 2011). Emerging aquaculture species such as tilapia, barramundi, bass and bream along with the growing organic finfish sector may also increase the size of the UK finfish aquaculture market (Defra, 2008). Cod, haddock and halibut farming (which are currently only farmed on a relatively small scale) are also predicted to grow (Pugh, 2008). However, cod farming is now seen as a less attractive option due to recent increases in North Sea cod catch quotas. „No Catch‟, Britain‟s only supplier of sustainable organic cod, based on the Shetland Isles, went into administration in early 2008. Due to a shortage of available investment there is now no commercial cod production and only one halibut producer in Scotland. There is currently no clear development plan for marine biofuels, although a number of trials are underway in Scotland (Black, 2011). The Crown Estate estimates that up to 1.5% of the seabed area could be used for macroalgae cultivation. This could give an annual biogas yield equivalent to around 5% of the natural gas consumed in the UK in 2009 (The Parliamentary Office of Science and Technology, 2011).
2.3 Aviation
2.3.1 Definition of Sector/Activity This sector relates to civil aviation, which comprises scheduled air transport (including all passenger and cargo flights operating on regularly scheduled routes) and general aviation (including all other civil flights, private or commercial). Military aviation is covered separately in the Military Interests baseline (see Section 2.8).
Socio-economic Baseline Reviews for Offshore Renewables in Scottish Waters
R4032/3 7 R.1905
2.3.2 Description of Information Sources A range of information has been accessed to inform this baseline, including published reports, spatial data layers and other specific information provided through stakeholder engagement (Table 3). Table 3. Information sources for aviation baseline
Scale Information Available Date Source
Scotland UK Air Passenger Demand Forecasts 2009+ Department for Transport, DfT; 2011
Scotland Scottish Transport Statistics 2010 Scottish Government
UK and Scotland Airport and airline statistics 2010 Civil Aviation Authority website: www.caa.co.uk
2.3.2.1 Data limitations Information on helicopter and aircraft routes is sensitive and hence not publicly available. At the time of writing no central source of employment figures for the „minor‟ airports in Scotland had been identified.
2.3.3 National Overview of Current Activity The importance of air travel to Scotland can be illustrated by what is termed the „propensity to fly‟ which measures the number of return air trips in an area per head of population (but also includes trips made by out-of-area tourists and business people). Apart from London, Scotland records the highest „propensity to fly‟ value in the UK (DfT, 2002, cited in ABPmer, RPA and SQW, 2011), this is likely to be due to the mountainous and island terrain and ease of transportation. The airport locations in Scotland are shown in Figure 3, where the five „major‟ airports are located in the West (Glasgow and Glasgow Prestwick airports), North East (Inverness and Aberdeen airports) and East (Edinburgh airport) SORERs. Minor airports are located on the mainland in the East (Dundee airport), North East (Wick airport) and West (Campbeltown airport) SORERs and on islands in the North (Scrabster, Lerwick and Sumburgh airports in the Shetlands; Kirkwall airport in the Orkneys), North West (Stornoway, Benbecula and Barra airports in the Outer Hebrides) and West (Coll, Colonsay, Tiree and Islay airports) SORERs. In 2009, there were 22.5 million air terminal passengers (passengers who join or leave an aircraft at the reporting airport, excluding passengers carried on air taxi charter services) (Scottish Government, 2010b). Passengers passing through Edinburgh, Glasgow, Aberdeen and Glasgow Prestwick comprised 94% of this total. In 2009, the total air freight (the weight of property carried out on an aircraft, excluding mail and passenger‟s and crew‟s permitted luggage) carried through Scottish airports was 45,659 tonnes. Passenger numbers and freight quantities through all Scottish airports are addressed in more detail in the Regional overviews. The total number of aircraft movements in 2009 was 490,000; Edinburgh had the highest number of aircraft movements (116,000; 98% commercial movements), followed by Aberdeen (110,000) and Glasgow (85,000) (Scottish Government, 2010b).
Socio-economic Baseline Reviews for Offshore Renewables in Scottish Waters
R4032/3 8 R.1905
National Air Traffic Services (NATS) provides air traffic control services to aircraft flying in UK airspace, and over the Eastern part of the North Atlantic. The locations of radar installations, where known, are provided in the Regional Overviews. 2.3.3.1 Economic value and employment Aviation forms a critical component of Scotland‟s economy by providing direct access to markets as well as providing lifeline services to otherwise inaccessible settlements throughout the mountainous and island terrain (ABPmer, RPA and SQW, 2011). In 2009, BAA‟s operating profit for the three main airports (Edinburgh, Glasgow and Aberdeen) was £34.4 million. Highlands and Islands Airports (Barra, Benbecula, Campbeltown, Inverness, Islay, Kirkwall, Stornoway, Sumburgh, Tiree and Wick) recorded a loss of £1million for 2008/09 (Scottish Government, 2010b). 2.3.3.2 Historic trends Between 1999 and 2009, the total number of air terminal passengers travelling through Scottish airports has increased by 41% (Scottish Government, 2010b; see Table 5). During this period, the increases at the major airports were: 23% at Edinburgh, 7% at Glasgow, 23% at Aberdeen and 156% at Glasgow Prestwick (Scottish Government, 2010b). Air freight carried decreased by 38% (Table 4). Total aircraft movements gradually increased between 2003 and 2007 but decreased again between 2008 and 2009. Table 4. Summary of air transport statistics from 1999 to 2009
Year Terminal
Passengers Transit
Passengers Total No.
Passengers* Freight
(Tonnes) Total Aircraft Movements*
1999 15,941 155 16,096 73,849 479,090
2000 16,787 117 16,904 74,582 474,051
2001 18,081 131 18,212 72,400 492,351
2002 19,783 107 19,890 72,602 473,295
2003 21,084 71 21,155 76,451 502,733
2004 22,555 102 22,657 77,572 514,453
2005 23,795 91 23,886 74,515 543,605
2006 24,437 86 24,523 77,884 553,868
2007 25,132 109 25,242 61,197 559,655
2008 24,348 85 24,433 45,554 542,667
2009 22,496 43 22,539 45,659 489,520 * Statistics are not collected for some of the smaller airports on Orkney and Shetland and hence are not included in the aircraft movement
totals
(Source: Scottish Government, 2010b)
2.3.3.3 Future trends The number of air passengers using UK airports is forecast to recover from the recent downturn. In a „constrained‟ forecast, in which it is assumed that there will be no new runways and only incremental developments to airport terminals to make maximum use of existing
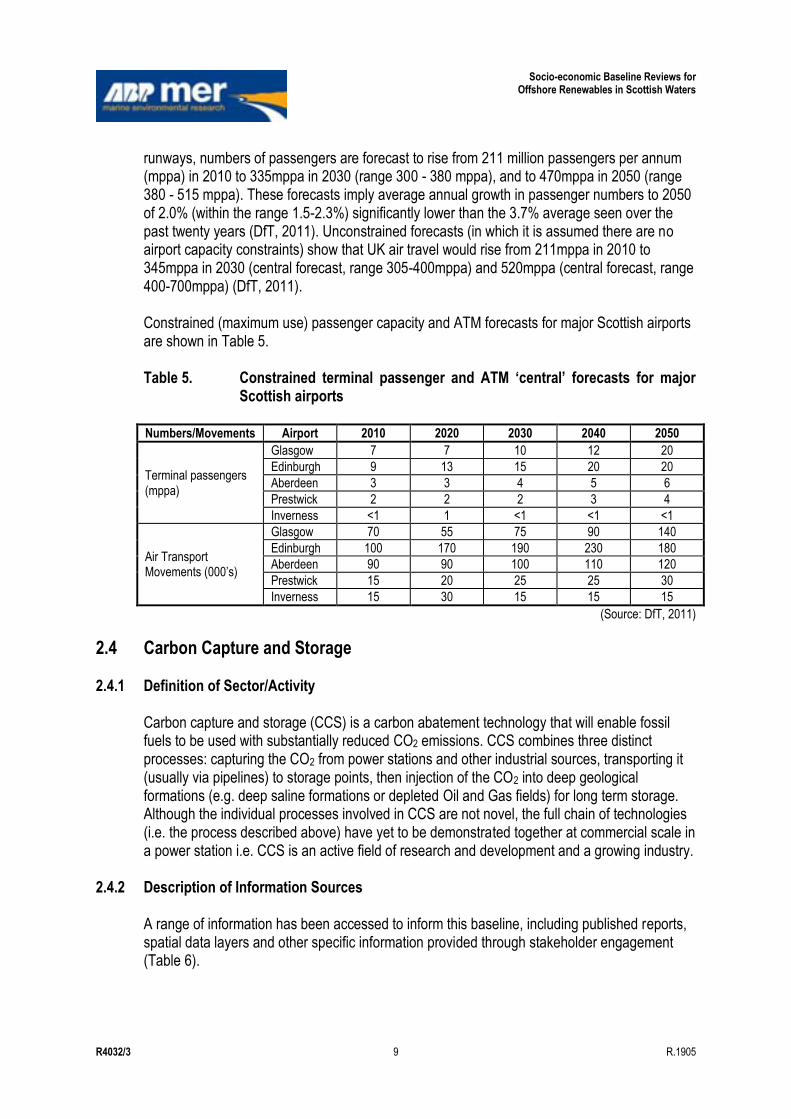
Socio-economic Baseline Reviews for Offshore Renewables in Scottish Waters
R4032/3 9 R.1905
runways, numbers of passengers are forecast to rise from 211 million passengers per annum (mppa) in 2010 to 335mppa in 2030 (range 300 - 380 mppa), and to 470mppa in 2050 (range 380 - 515 mppa). These forecasts imply average annual growth in passenger numbers to 2050 of 2.0% (within the range 1.5-2.3%) significantly lower than the 3.7% average seen over the past twenty years (DfT, 2011). Unconstrained forecasts (in which it is assumed there are no airport capacity constraints) show that UK air travel would rise from 211mppa in 2010 to 345mppa in 2030 (central forecast, range 305-400mppa) and 520mppa (central forecast, range 400-700mppa) (DfT, 2011). Constrained (maximum use) passenger capacity and ATM forecasts for major Scottish airports are shown in Table 5. Table 5. Constrained terminal passenger and ATM ‘central’ forecasts for major
Scottish airports Numbers/Movements Airport 2010 2020 2030 2040 2050
Terminal passengers (mppa)
Glasgow 7 7 10 12 20
Edinburgh 9 13 15 20 20
Aberdeen 3 3 4 5 6
Prestwick 2 2 2 3 4
Inverness <1 1 <1 <1 <1
Air Transport Movements (000‟s)
Glasgow 70 55 75 90 140
Edinburgh 100 170 190 230 180
Aberdeen 90 90 100 110 120
Prestwick 15 20 25 25 30
Inverness 15 30 15 15 15
(Source: DfT, 2011)
2.4 Carbon Capture and Storage
2.4.1 Definition of Sector/Activity Carbon capture and storage (CCS) is a carbon abatement technology that will enable fossil fuels to be used with substantially reduced CO2 emissions. CCS combines three distinct processes: capturing the CO2 from power stations and other industrial sources, transporting it (usually via pipelines) to storage points, then injection of the CO2 into deep geological formations (e.g. deep saline formations or depleted Oil and Gas fields) for long term storage. Although the individual processes involved in CCS are not novel, the full chain of technologies (i.e. the process described above) have yet to be demonstrated together at commercial scale in a power station i.e. CCS is an active field of research and development and a growing industry.
2.4.2 Description of Information Sources A range of information has been accessed to inform this baseline, including published reports, spatial data layers and other specific information provided through stakeholder engagement (Table 6).
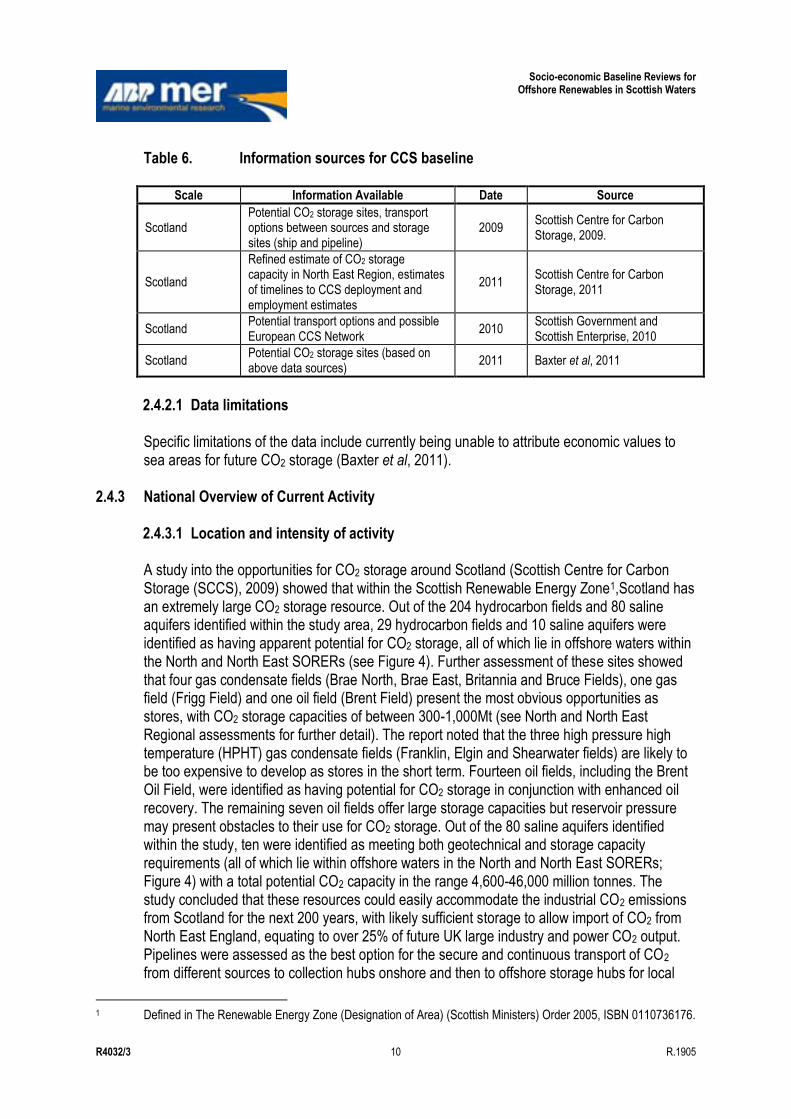
Socio-economic Baseline Reviews for Offshore Renewables in Scottish Waters
R4032/3 10 R.1905
Table 6. Information sources for CCS baseline
Scale Information Available Date Source
Scotland Potential CO2 storage sites, transport options between sources and storage sites (ship and pipeline)
2009 Scottish Centre for Carbon Storage, 2009.
Scotland
Refined estimate of CO2 storage capacity in North East Region, estimates of timelines to CCS deployment and employment estimates
2011 Scottish Centre for Carbon Storage, 2011
Scotland Potential transport options and possible European CCS Network
2010 Scottish Government and Scottish Enterprise, 2010
Scotland Potential CO2 storage sites (based on above data sources)
2011 Baxter et al, 2011
2.4.2.1 Data limitations Specific limitations of the data include currently being unable to attribute economic values to sea areas for future CO2 storage (Baxter et al, 2011).
2.4.3 National Overview of Current Activity 2.4.3.1 Location and intensity of activity A study into the opportunities for CO2 storage around Scotland (Scottish Centre for Carbon Storage (SCCS), 2009) showed that within the Scottish Renewable Energy Zone1,Scotland has an extremely large CO2 storage resource. Out of the 204 hydrocarbon fields and 80 saline aquifers identified within the study area, 29 hydrocarbon fields and 10 saline aquifers were identified as having apparent potential for CO2 storage, all of which lie in offshore waters within the North and North East SORERs (see Figure 4). Further assessment of these sites showed that four gas condensate fields (Brae North, Brae East, Britannia and Bruce Fields), one gas field (Frigg Field) and one oil field (Brent Field) present the most obvious opportunities as stores, with CO2 storage capacities of between 300-1,000Mt (see North and North East Regional assessments for further detail). The report noted that the three high pressure high temperature (HPHT) gas condensate fields (Franklin, Elgin and Shearwater fields) are likely to be too expensive to develop as stores in the short term. Fourteen oil fields, including the Brent Oil Field, were identified as having potential for CO2 storage in conjunction with enhanced oil recovery. The remaining seven oil fields offer large storage capacities but reservoir pressure may present obstacles to their use for CO2 storage. Out of the 80 saline aquifers identified within the study, ten were identified as meeting both geotechnical and storage capacity requirements (all of which lie within offshore waters in the North and North East SORERs; Figure 4) with a total potential CO2 capacity in the range 4,600-46,000 million tonnes. The study concluded that these resources could easily accommodate the industrial CO2 emissions from Scotland for the next 200 years, with likely sufficient storage to allow import of CO2 from North East England, equating to over 25% of future UK large industry and power CO2 output. Pipelines were assessed as the best option for the secure and continuous transport of CO2 from different sources to collection hubs onshore and then to offshore storage hubs for local
1 Defined in The Renewable Energy Zone (Designation of Area) (Scottish Ministers) Order 2005, ISBN 0110736176.
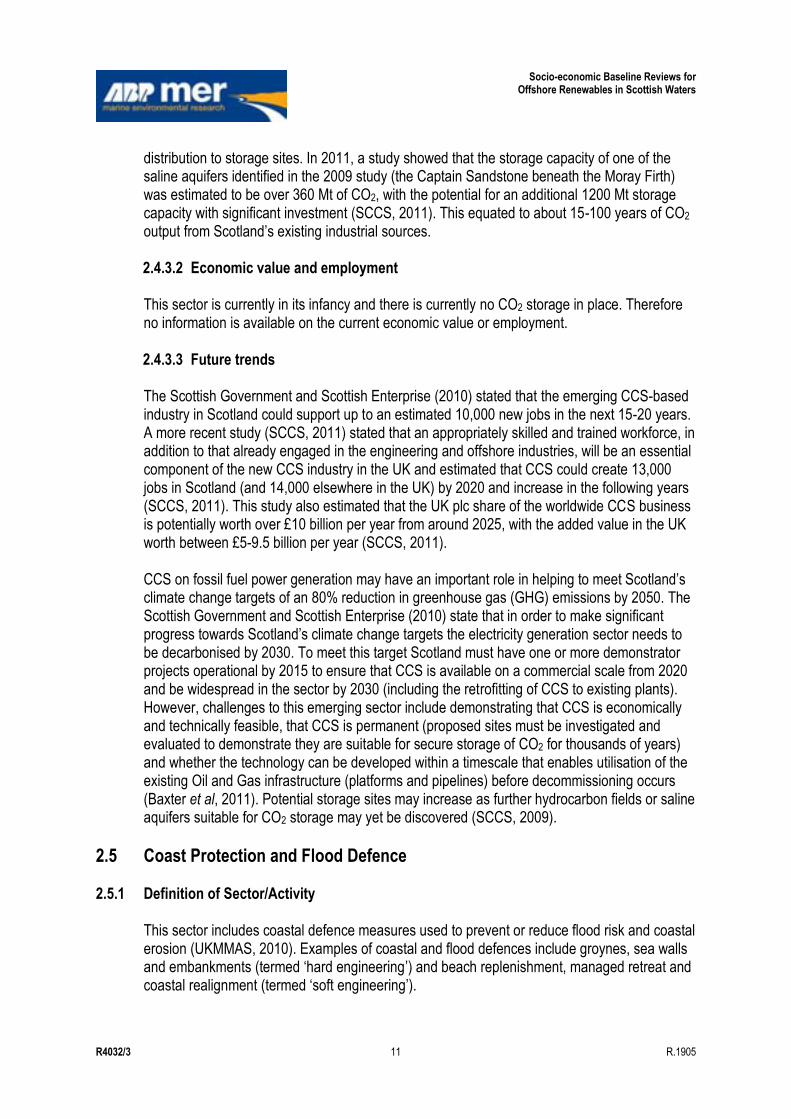
Socio-economic Baseline Reviews for Offshore Renewables in Scottish Waters
R4032/3 11 R.1905
distribution to storage sites. In 2011, a study showed that the storage capacity of one of the saline aquifers identified in the 2009 study (the Captain Sandstone beneath the Moray Firth) was estimated to be over 360 Mt of CO2, with the potential for an additional 1200 Mt storage capacity with significant investment (SCCS, 2011). This equated to about 15-100 years of CO2 output from Scotland‟s existing industrial sources. 2.4.3.2 Economic value and employment This sector is currently in its infancy and there is currently no CO2 storage in place. Therefore no information is available on the current economic value or employment. 2.4.3.3 Future trends The Scottish Government and Scottish Enterprise (2010) stated that the emerging CCS-based industry in Scotland could support up to an estimated 10,000 new jobs in the next 15-20 years. A more recent study (SCCS, 2011) stated that an appropriately skilled and trained workforce, in addition to that already engaged in the engineering and offshore industries, will be an essential component of the new CCS industry in the UK and estimated that CCS could create 13,000 jobs in Scotland (and 14,000 elsewhere in the UK) by 2020 and increase in the following years (SCCS, 2011). This study also estimated that the UK plc share of the worldwide CCS business is potentially worth over £10 billion per year from around 2025, with the added value in the UK worth between £5-9.5 billion per year (SCCS, 2011). CCS on fossil fuel power generation may have an important role in helping to meet Scotland‟s climate change targets of an 80% reduction in greenhouse gas (GHG) emissions by 2050. The Scottish Government and Scottish Enterprise (2010) state that in order to make significant progress towards Scotland‟s climate change targets the electricity generation sector needs to be decarbonised by 2030. To meet this target Scotland must have one or more demonstrator projects operational by 2015 to ensure that CCS is available on a commercial scale from 2020 and be widespread in the sector by 2030 (including the retrofitting of CCS to existing plants). However, challenges to this emerging sector include demonstrating that CCS is economically and technically feasible, that CCS is permanent (proposed sites must be investigated and evaluated to demonstrate they are suitable for secure storage of CO2 for thousands of years) and whether the technology can be developed within a timescale that enables utilisation of the existing Oil and Gas infrastructure (platforms and pipelines) before decommissioning occurs (Baxter et al, 2011). Potential storage sites may increase as further hydrocarbon fields or saline aquifers suitable for CO2 storage may yet be discovered (SCCS, 2009).
2.5 Coast Protection and Flood Defence
2.5.1 Definition of Sector/Activity This sector includes coastal defence measures used to prevent or reduce flood risk and coastal erosion (UKMMAS, 2010). Examples of coastal and flood defences include groynes, sea walls and embankments (termed „hard engineering‟) and beach replenishment, managed retreat and coastal realignment (termed „soft engineering‟).

Socio-economic Baseline Reviews for Offshore Renewables in Scottish Waters
R4032/3 12 R.1905
2.5.2 Description of Information Sources A range of information has been accessed to inform this baseline, including published reports, spatial data layers and other specific information provided through stakeholder engagement (Table 7). Table 7. Information sources for coast protection and flood defence baseline
Scale Information Available Date Source
Scotland
Location, size and cost of flood defences.
1961 to present
Baxter et al, 2011 and data sources therein
Location, size and cost of coastal protection and managed realignment schemes
2000 to present
2.5.2.1 Data limitations Specific limitations of the data include currently being unable to attribute economic values to coastal protection and flood defence and difficulty in accurately assessing employment within this sector (Baxter et al, 2011).
2.5.3 National Overview of Current Activity 2.5.3.1 Location and intensity of activity Scottish Natural Heritage (SNH) estimated that 307km of mainland Scotland‟s coast is comprised of coastal defences (reported in Baxter et al, 2011). The distribution of coastal protection schemes and hard and soft engineered flood prevention schemes in Scotland are shown in Figure 5. Coastal defences are generally located in or adjacent to intertidal areas and Figure 5 shows that all of the coastal and flood defences in Scotland occur within inshore waters in all SORERs except the South West and North SORERs where currently there are no flood or coastal defences. 2.5.3.2 Economic value and employment Coast protection and flood defences protect property, land and infrastructure, for example, the Scottish Environment Protection Agency (SEPA) currently estimate that around 26,000 houses and businesses are at risk from coastal flooding in Scotland2. However, coastal protection and flood prevention schemes do not contribute directly to the economy and hence it is not possible to assign an economic value to this sector. It has been predicted that Scotland will face an increased flood risk in the future, especially in the West although no cost estimates for coastal flooding are available. The number of jobs associated with this sector is also difficult to assess accurately (Baxter et al, 2011).
2 SEPA Coastal Flooding: www.sepa.org.uk/flooding/be_flood_aware/types_of_flooding/coastal_flooding.aspx
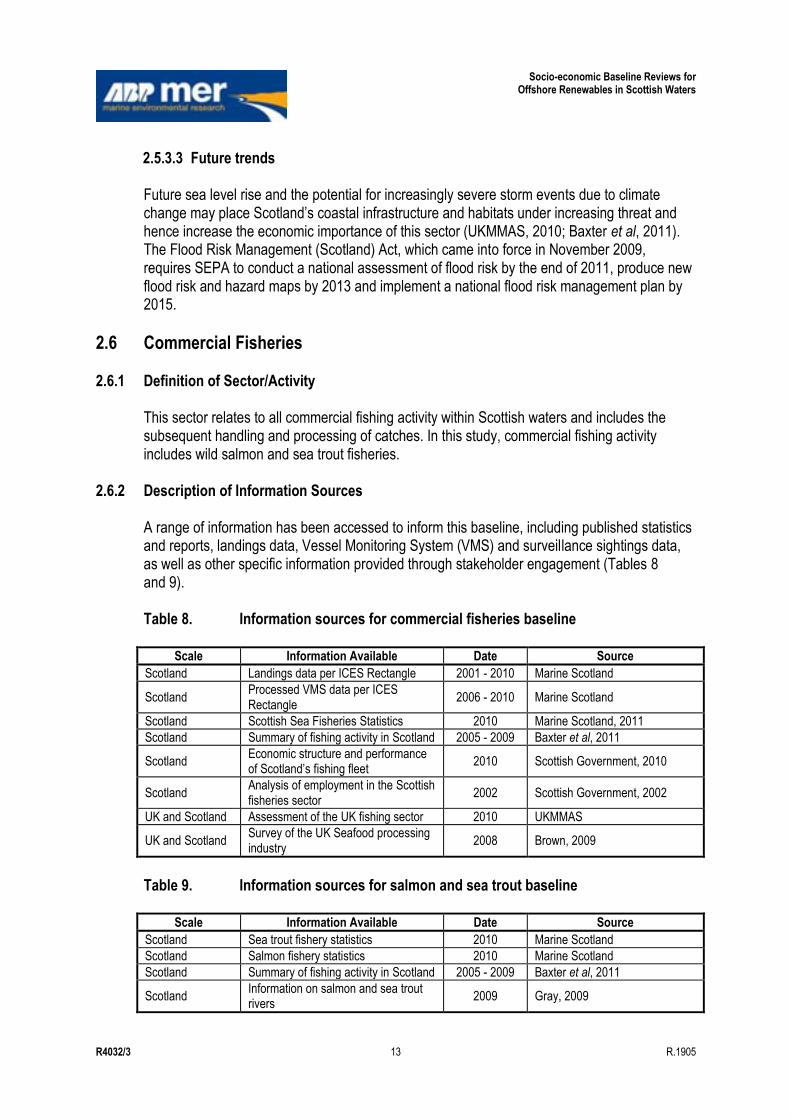
Socio-economic Baseline Reviews for Offshore Renewables in Scottish Waters
R4032/3 13 R.1905
2.5.3.3 Future trends Future sea level rise and the potential for increasingly severe storm events due to climate change may place Scotland‟s coastal infrastructure and habitats under increasing threat and hence increase the economic importance of this sector (UKMMAS, 2010; Baxter et al, 2011). The Flood Risk Management (Scotland) Act, which came into force in November 2009, requires SEPA to conduct a national assessment of flood risk by the end of 2011, produce new flood risk and hazard maps by 2013 and implement a national flood risk management plan by 2015.
2.6 Commercial Fisheries
2.6.1 Definition of Sector/Activity This sector relates to all commercial fishing activity within Scottish waters and includes the subsequent handling and processing of catches. In this study, commercial fishing activity includes wild salmon and sea trout fisheries.
2.6.2 Description of Information Sources A range of information has been accessed to inform this baseline, including published statistics and reports, landings data, Vessel Monitoring System (VMS) and surveillance sightings data, as well as other specific information provided through stakeholder engagement (Tables 8 and 9). Table 8. Information sources for commercial fisheries baseline
Scale Information Available Date Source
Scotland Landings data per ICES Rectangle 2001 - 2010 Marine Scotland
Scotland Processed VMS data per ICES Rectangle
2006 - 2010 Marine Scotland
Scotland Scottish Sea Fisheries Statistics 2010 Marine Scotland, 2011
Scotland Summary of fishing activity in Scotland 2005 - 2009 Baxter et al, 2011
Scotland Economic structure and performance of Scotland‟s fishing fleet
2010 Scottish Government, 2010
Scotland Analysis of employment in the Scottish fisheries sector
2002 Scottish Government, 2002
UK and Scotland Assessment of the UK fishing sector 2010 UKMMAS
UK and Scotland Survey of the UK Seafood processing industry
2008 Brown, 2009
Table 9. Information sources for salmon and sea trout baseline
Scale Information Available Date Source
Scotland Sea trout fishery statistics 2010 Marine Scotland
Scotland Salmon fishery statistics 2010 Marine Scotland
Scotland Summary of fishing activity in Scotland 2005 - 2009 Baxter et al, 2011
Scotland Information on salmon and sea trout rivers
2009 Gray, 2009
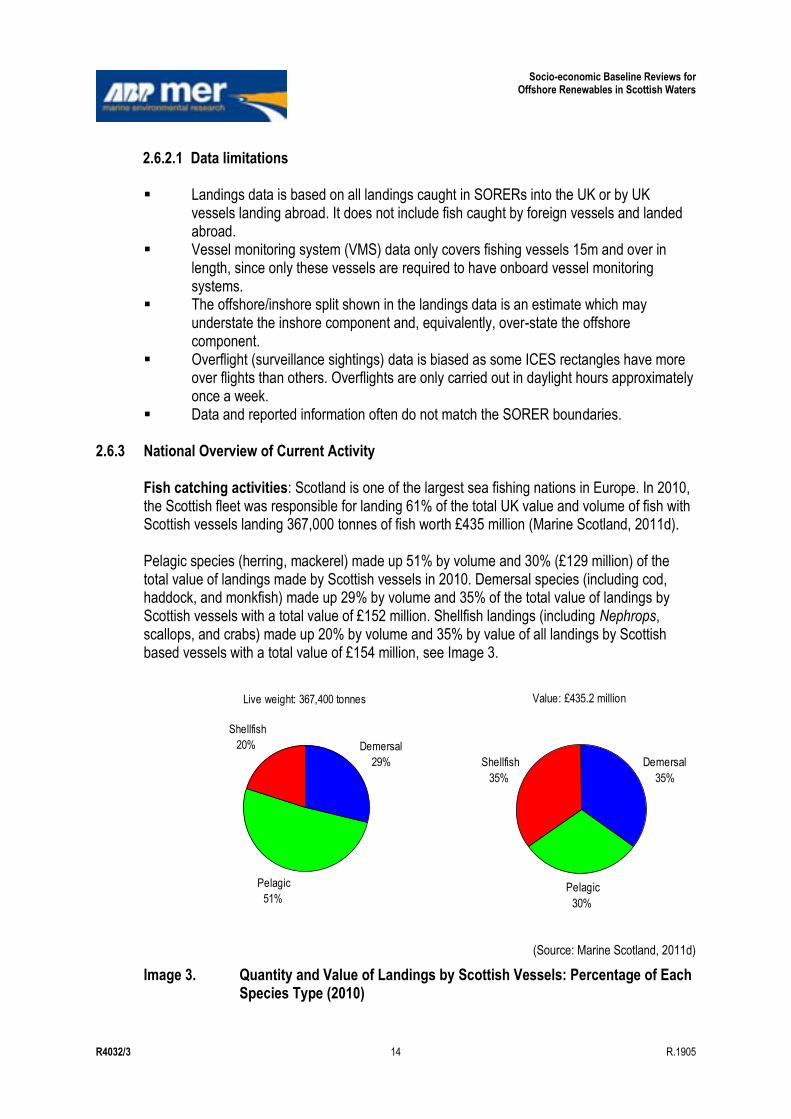
Socio-economic Baseline Reviews for Offshore Renewables in Scottish Waters
R4032/3 14 R.1905
2.6.2.1 Data limitations Landings data is based on all landings caught in SORERs into the UK or by UK
vessels landing abroad. It does not include fish caught by foreign vessels and landed abroad.
Vessel monitoring system (VMS) data only covers fishing vessels 15m and over in length, since only these vessels are required to have onboard vessel monitoring systems.
The offshore/inshore split shown in the landings data is an estimate which may understate the inshore component and, equivalently, over-state the offshore component.
Overflight (surveillance sightings) data is biased as some ICES rectangles have more over flights than others. Overflights are only carried out in daylight hours approximately once a week.
Data and reported information often do not match the SORER boundaries.
2.6.3 National Overview of Current Activity Fish catching activities: Scotland is one of the largest sea fishing nations in Europe. In 2010, the Scottish fleet was responsible for landing 61% of the total UK value and volume of fish with Scottish vessels landing 367,000 tonnes of fish worth £435 million (Marine Scotland, 2011d). Pelagic species (herring, mackerel) made up 51% by volume and 30% (£129 million) of the total value of landings made by Scottish vessels in 2010. Demersal species (including cod, haddock, and monkfish) made up 29% by volume and 35% of the total value of landings by Scottish vessels with a total value of £152 million. Shellfish landings (including Nephrops, scallops, and crabs) made up 20% by volume and 35% by value of all landings by Scottish based vessels with a total value of £154 million, see Image 3.
(Source: Marine Scotland, 2011d)
Image 3. Quantity and Value of Landings by Scottish Vessels: Percentage of Each Species Type (2010)
Value: £435.2 million
Demersal
35%
Pelagic
30%
Shellfish
35%
Live weight: 367,400 tonnes
Demersal
29%
Pelagic
51%
Shellfish
20%
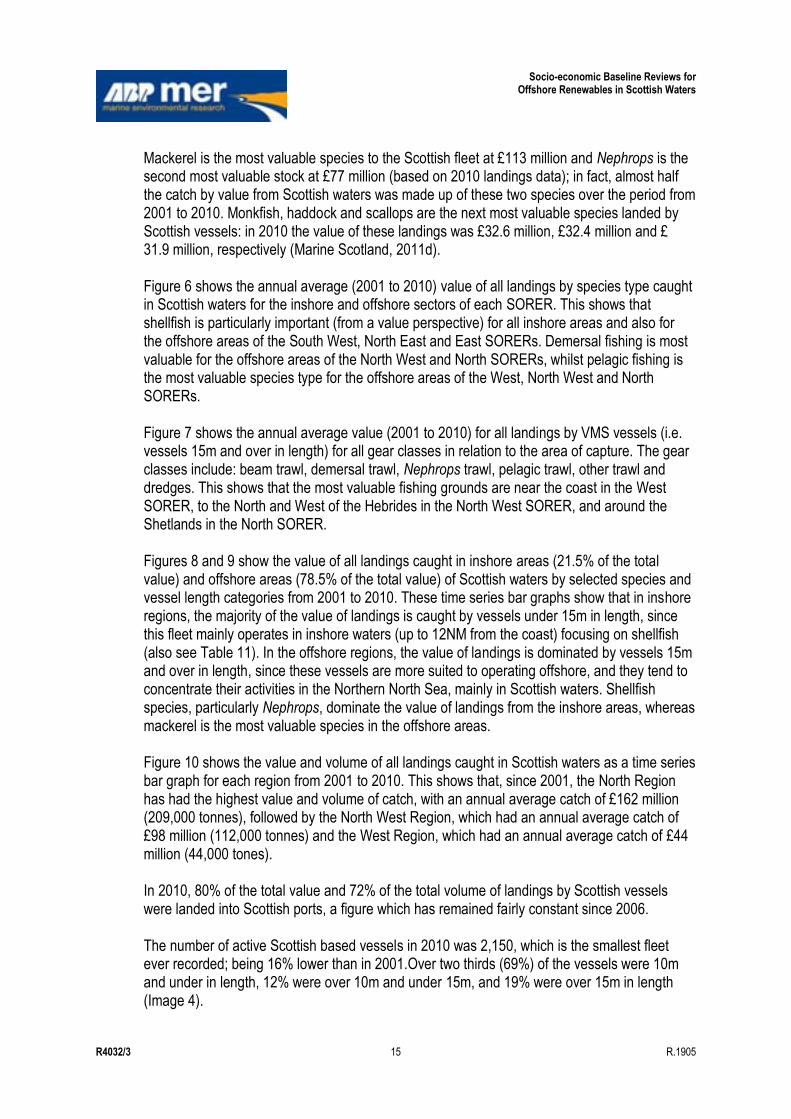
Socio-economic Baseline Reviews for Offshore Renewables in Scottish Waters
R4032/3 15 R.1905
Mackerel is the most valuable species to the Scottish fleet at £113 million and Nephrops is the second most valuable stock at £77 million (based on 2010 landings data); in fact, almost half the catch by value from Scottish waters was made up of these two species over the period from 2001 to 2010. Monkfish, haddock and scallops are the next most valuable species landed by Scottish vessels: in 2010 the value of these landings was £32.6 million, £32.4 million and £ 31.9 million, respectively (Marine Scotland, 2011d). Figure 6 shows the annual average (2001 to 2010) value of all landings by species type caught in Scottish waters for the inshore and offshore sectors of each SORER. This shows that shellfish is particularly important (from a value perspective) for all inshore areas and also for the offshore areas of the South West, North East and East SORERs. Demersal fishing is most valuable for the offshore areas of the North West and North SORERs, whilst pelagic fishing is the most valuable species type for the offshore areas of the West, North West and North SORERs. Figure 7 shows the annual average value (2001 to 2010) for all landings by VMS vessels (i.e. vessels 15m and over in length) for all gear classes in relation to the area of capture. The gear classes include: beam trawl, demersal trawl, Nephrops trawl, pelagic trawl, other trawl and dredges. This shows that the most valuable fishing grounds are near the coast in the West SORER, to the North and West of the Hebrides in the North West SORER, and around the Shetlands in the North SORER. Figures 8 and 9 show the value of all landings caught in inshore areas (21.5% of the total value) and offshore areas (78.5% of the total value) of Scottish waters by selected species and vessel length categories from 2001 to 2010. These time series bar graphs show that in inshore regions, the majority of the value of landings is caught by vessels under 15m in length, since this fleet mainly operates in inshore waters (up to 12NM from the coast) focusing on shellfish (also see Table 11). In the offshore regions, the value of landings is dominated by vessels 15m and over in length, since these vessels are more suited to operating offshore, and they tend to concentrate their activities in the Northern North Sea, mainly in Scottish waters. Shellfish species, particularly Nephrops, dominate the value of landings from the inshore areas, whereas mackerel is the most valuable species in the offshore areas. Figure 10 shows the value and volume of all landings caught in Scottish waters as a time series bar graph for each region from 2001 to 2010. This shows that, since 2001, the North Region has had the highest value and volume of catch, with an annual average catch of £162 million (209,000 tonnes), followed by the North West Region, which had an annual average catch of £98 million (112,000 tonnes) and the West Region, which had an annual average catch of £44 million (44,000 tones). In 2010, 80% of the total value and 72% of the total volume of landings by Scottish vessels were landed into Scottish ports, a figure which has remained fairly constant since 2006. The number of active Scottish based vessels in 2010 was 2,150, which is the smallest fleet ever recorded; being 16% lower than in 2001.Over two thirds (69%) of the vessels were 10m and under in length, 12% were over 10m and under 15m, and 19% were over 15m in length (Image 4).
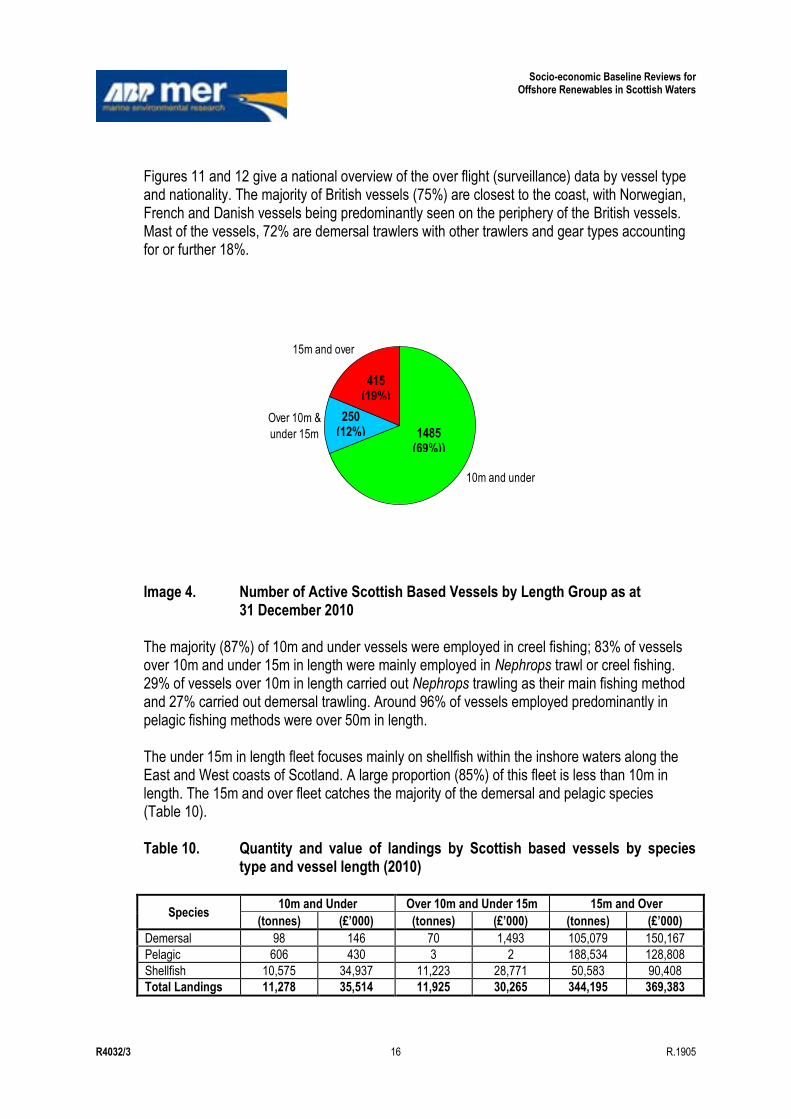
Socio-economic Baseline Reviews for Offshore Renewables in Scottish Waters
R4032/3 16 R.1905
Figures 11 and 12 give a national overview of the over flight (surveillance) data by vessel type and nationality. The majority of British vessels (75%) are closest to the coast, with Norwegian, French and Danish vessels being predominantly seen on the periphery of the British vessels. Mast of the vessels, 72% are demersal trawlers with other trawlers and gear types accounting for or further 18%.
Image 4. Number of Active Scottish Based Vessels by Length Group as at 31 December 2010
The majority (87%) of 10m and under vessels were employed in creel fishing; 83% of vessels over 10m and under 15m in length were mainly employed in Nephrops trawl or creel fishing. 29% of vessels over 10m in length carried out Nephrops trawling as their main fishing method and 27% carried out demersal trawling. Around 96% of vessels employed predominantly in pelagic fishing methods were over 50m in length. The under 15m in length fleet focuses mainly on shellfish within the inshore waters along the East and West coasts of Scotland. A large proportion (85%) of this fleet is less than 10m in length. The 15m and over fleet catches the majority of the demersal and pelagic species (Table 10). Table 10. Quantity and value of landings by Scottish based vessels by species
type and vessel length (2010)
Species 10m and Under Over 10m and Under 15m 15m and Over
(tonnes) (£’000) (tonnes) (£’000) (tonnes) (£’000)
Demersal 98 146 70 1,493 105,079 150,167
Pelagic 606 430 3 2 188,534 128,808
Shellfish 10,575 34,937 11,223 28,771 50,583 90,408
Total Landings 11,278 35,514 11,925 30,265 344,195 369,383
10m and under
Over 10m &
under 15m
15m and over
1485 (69%))
250 (12%)
415 (19%)
Socio-economic Baseline Reviews for Offshore Renewables in Scottish Waters
R4032/3 17 R.1905
The total of all landings into Scottish ports by Scottish, other UK and foreign fleets was 385,000 tonnes with a total value of £455 million. The top three districts in terms of both volume and value of landings were Peterhead, Shetland and Fraserburgh (Marine Scotland, 2011d). Table 11 shows the volume and value of landings into the top three ports in Scotland by Scottish based vessels in 2010, which collectively constituted 72% of all landings by UK vessels into Scotland by volume. Table 11. Landings into the top three Scottish ports (2010)
Landings Data Peterhead Shetland Fraserburgh
Tonnes 168, 000 91,000 28,000
Value (£) 140 million 82 million 46 million
Pelagic species accounted for 50% of the value of landings into Peterhead whilst 41% were demersal species and 9% were shellfish. Pelagic species were also the majority of landings into Shetland at just under two-thirds of the total value; demersal species represented 28% and shellfish 7%. In contrast, the landings in Fraserburgh were dominated by shellfish at nearly two-thirds of the total value; demersal species accounted for nearly a quarter and 14% were pelagic species (Marine Scotland, 2011d).
Fish processing activities: Two distinct sub-sectors make up the processing industry: the primary processors involved in the filleting and freezing of fresh fish for onward distribution to fresh fish retail and catering outlets, and the secondary processors involved in brining, smoking, cooking, freezing, canning, breading, battering and the production of ready-to-eat meals for the retail and catering trades. There are also units carrying out a mixture of these two, known as mixed processors.
The North East SORER is the most important supply region of fish to the primary and mixed processing sectors. Mixed processing units form the majority of the processing industry in this region, followed by primary processing units. Those processors based in the Grampian region (which falls within the North East SORER) purchase 65% of their supplies from within Grampian (Brown, 2009).
2.6.3.1 Economic value and employment
In 2009 366,569 tonnes of fish with a first sale value of £416m were landed in Scottish waters. This figure includes all fish caught by UK vessels in Scottish waters and fish caught by non-UK vessels in Scottish waters and landed in the UK (Baxter et al, 2011). Estimates which consider the direct employment in the fisheries sector and indirect economic activity produced as a result of the demand for goods and services by the fisheries sector (for example, supplies such as ice, nets, boxes, fuel and maintenance and chandlery supplies to fishing vessels, packaging and electricity for the processing industry) provide an indication of the overall importance of the fishing sector to the economy as a whole. Fisheries related employment is highly concentrated into relatively few areas, and for these areas the fisheries sector is considerably more important than for Scotland as a whole.
Socio-economic Baseline Reviews for Offshore Renewables in Scottish Waters
R4032/3 18 R.1905
2.6.3.2 Fish catching activities Scotland has 8.6% of the UK population, but landed 61% by value of the total fish catch in 2010 with Scottish vessels landing 367,000 tonnes of fish worth £435 million (Marine Scotland, 2011d). Scottish vessels make up 33% of the number of vessels in the UK fishing fleet, 59% of the capacity (GT) of the fleet and 48% of the power (kW) of the UK fleet (MMO, 2011). In 2007 it was estimated that the total effect on employment (taking account of „knock-on‟ or indirect expenditure effects through the economy) of the fish catching industry alone in Scotland was 10,472 full-time equivalent (FTE) jobs. This activity represented £303m (or 0.4%) GDP i.e. the value of the country‟s income generated mostly in terms of profits and wages (BPA, 2008).
The number of fishermen employed on Scottish based vessels was 5,218 in 2010, which is 0.2% of the labour force in Scotland, and represents a decrease of 22% since 2001. 4,257 of these were regular, 909 were part-time and 52 were crofters. Fraserburgh has the highest number of fishermen in employment at 789 fishermen, followed by Ayr with 559 and Shetland with 448. The largest number of part-time fishermen is found on vessels administered by Shetland (217), see Table 12. Table 12. Number of fishermen employed on Scottish based vessels, by district
(2010)
District Regular Part-time Crofters Total
Eyemouth 148 45 - 193
Pittenweem 120 43 - 163
Aberdeen 94 58 - 152
Peterhead 400 24 - 424
Fraserburgh 671 118 - 789
Buckie 192 51 - 243
Scrabster 168 0 - 168
Total East Coast 1,793 339 0 2,132
Orkney 277 132 - 409
Shetland 231 217 - 448
Stornoway 350 73 17 440
Total Islands 858 422 17 1,297
Kinlochbervie 44 0 - 44
Lochinver 21 1 1 23
Ullapool 274 11 - 285
Portree 167 34 34 235
Mallaig 110 9 - 119
Oban 242 23 - 265
Campbeltown 231 28 - 259
Ayr 517 42 - 559
Total West Coast 1,606 148 35 1,789
All districts 4,257 909 52 5,218
(Source: Scottish Sea Fisheries Stats, 2010)
Socio-economic Baseline Reviews for Offshore Renewables in Scottish Waters
R4032/3 19 R.1905
Although commercial fishing makes a relatively low contribution to Scotland‟s overall GDP and the production and processing of fish directly accounts for about 1% of employment (3% in rural Scotland), it is a particularly important socio-economic activity in remote coastal regions in Scotland (UKMMAS, 2010). For Eilean Siar, Orkney and Shetland district the employment in fishing as a percentage of the labour force was the highest at 3.81%. Argyll and Bute district was next at 1.27%, followed by Aberdeenshire at 0.96% (Marine Scotland, 2011d). Seven of the top ten most profitable fleet „segments‟ operate in the North Sea and off the West coast of Scotland (UKMMAS, 2010). Key factors affecting the level of profits are fuel costs and the cost of access to fishing opportunities (for example, the cost of leasing additional quota). Vessels using more fuel-intensive fishing methods, such as otter trawl and beam trawl segments, experienced the biggest increases in fuel expenditure, while less fuel-intensive methods, such as seining and passive gear segments, experienced relatively modest increases. In 2007, the proportion of earnings spent on fuel ranged from 26% for large trawlers to 7% for smaller vessels (UKMMAS, 2010). Quota trading has emerged as an economic activity, which allows vessels to carry on fishing beyond their existing quota allowance. Since 2001, many vessel owners have increasingly purchased or leased additional quota in order to remain in business. The increased expenditure on quota leasing has been particularly acute in the North Sea and West of Scotland demersal trawl fisheries for fin-fish (UKMMAS, 2010). Following the introduction of Days at Sea (DAS) regulations in 2003, a market for the purchase of DAS has also developed. It is estimated that some owners of vessels in the North Sea and West of Scotland demersal segments spent up to £20,000 on purchasing days at sea in 2006 (UKMMAS, 2010). 2.6.3.3 Fish processing activities The processing and preserving of fish and fish products in Scotland provided a value of £255 million and a turnover of £898 million in 2007 (Baxter et al., 2011). Table 13 shows the number of employees employed in fish processing and retail activities in Scotland in 2009 and 2010. Table 13. Employment in fish and shellfish processing and retail in Scotland
SIC, 2007
Full-time Employment
Part-time Employment
Total Employment
2009 2010 2009 2010 2009 2010
Processing and preserving of fish, crustaceans and molluscs (SIC 10200)
6,439 6,365 762 846 7,198 7,217
(Source: ONS, 2011)
In Annan and Fraserburgh the fish processing sector was by far the main contributor to fisheries related employment. This industry accounts for more jobs than the catching sector and provides employment for women in an otherwise male-dominated labour market. In the Grampian region (which falls within the North East SORER), 86% of fish processing employees were female in 2008, a rise of 11% since 2004 and the highest proportion in the UK (Brown, 2009). In 2007 employment in fishing, processing and aquaculture activities by travel to work areas varied from 2% of the total employment in the East and North East to 5-10% in the West (Baxter, et al 2011).
Socio-economic Baseline Reviews for Offshore Renewables in Scottish Waters
R4032/3 20 R.1905
2.6.3.4 Historic trends
Fish Catching Activities The decline in the fishing industry (catching and processing) has been significant over the past two decades. The 2007 workforce in Scotland was approximately half that employed in the early 1970s (UKMMAS, 2010). However, total fishery landings and employment in the fishing industry have been fairly stable since the mid 2000s.
Fishing activity changes in response to a number of factors: scientific advice; the location of fish; policy measures such as catch limits (quotas), limits on fishing effort (days spent fishing multiplied by the power of the vessel), the need for possible closures and decommissioning schemes; and profitability.
Fishing effort has decreased significantly since the 1990s due to continuing restrictions on fishing activity in order to promote stock recovery (Baxter et al. 2011). EU controls on Total Allowable Catches (TACs) and fishing effort and decommissioning of vessels in the UK are likely to have contributed to reductions in total fishing effort in the international demersal fisheries of around 30% or more over the past eight years in the North Sea, West of Scotland and Irish Sea (UKMMAS, 2010). The UK whitefish demersal trawl fleet was reduced by around 15% in size by the two decommissioning schemes in 2001 and 2003, with a particularly large impact on the Scottish fleet (UKMMAS, 2010).
Fish Processing Activities The reduction in landings has had a major impact on the fish processing industry. The number of fish processing units in the UK decreased by 25% between 1995 and 2000 alone, although total employment in the industry increased by 15% over the same period. Since 1995 Grampian has experienced a 10% decline in the number of units, principally in companies with 25 or fewer employees.
The decline in landings has had a particular impact on primary processors where there has been a shift away from primary processing towards secondary or mixed processing units. Since 2004, the number of demersal-only processing units has decreased by over 30% and employment has more than halved. Mixed species processing accounted for about 45% of the industry‟s processing units and provided around 58% of total employment in the UK in 2008 (Brown, 2009). The proportion of units processing only shellfish increased in recent years which may be a result of the increased volumes of shellfish landed by UK fishing vessels in recent years.
2.6.3.5 Future trends
Fish Catching Activities The fisheries sector is currently, and is likely to remain, important to many rural areas in Scotland. Fisheries are potentially impacted by both environmental and anthropogenic factors, including:
Socio-economic Baseline Reviews for Offshore Renewables in Scottish Waters
R4032/3 21 R.1905
Climate change effects (warming seas), which may result in the decline of stocks of cold-water species, such as cod, in waters around the UK as the stocks move Northwards. However, new opportunities for warmer-water species may emerge as these species extend Northwards into UK seas. Existing more Southerly stocks such as red mullet, John Dory and bass may also experience improved productivity in years with higher average sea temperatures (UKMMAS, 2010);.
Anthropogenic effects such as permanent structures, dumping at sea, oil and chemical spills, and the effects of the fisheries themselves, which may impact on the habitats where the fish live; and
Profitability and political effects, as detailed below. There are a wide range of factors influencing the financial performance of individual businesses: some are internal to the business (such as strategic decision making, assets and skills), while others are external (and include sectoral competitiveness, the management framework, market conditions and fuel prices). These interact to determine the actual business performance, (Future of Fisheries Management in Scotland: Scottish Government, 2010). Landings of fish subject to UK quotas set under the EU Common Fisheries Policy (CFP) generally reflect changes in the quota set, therefore, in the future as species-specific quotas are raised or lowered, this will have an impact on the amount of that species landed. This is difficult to predict and will depend on the recovery and sustainability of individual species as well as the how the CFP is reformed in 2012 (Scottish Sea Fisheries, 2010). Fisheries management will continue to focus on bringing down rates of exploitation to Maximum Sustainable Yield (MSY) targets. The majority of scientifically assessed stocks continue to be fished at rates well above the levels expected to provide the highest long-term yield (UKMMAS, 2010), therefore, there is increasing downward pressure on the levels of exploitation allowed. It is likely that pressure to reduce discarding will increase, though without allowing overall catch to rise. Management measures will need to reduce bycatch and discards, and be more responsive to changing patterns of fish migration and movement (Baxter et al. 2011). Reform of the CFP in 2012 may result in significant changes to the aims and objectives of the policy with a consequent effect on management. The outcome of this reform process cannot be predicted with any certainty but one possibility is that EU fisheries may be managed on a regional basis and fishermen may be more directly involved in the management of the fish stocks. (Baxter et al. 2011) The certification of sustainable fisheries by the Marine Stewardship Council (MSC) may bring marketing advantages in a climate of increasing public and commercial awareness of sustainability issues, and where there is a desire to source fish and shellfish from environmentally responsible businesses. Currently, there are eight UK fisheries in UK waters with MSC accreditation, including five pelagic fisheries for herring or mackerel, a bass fishery, a Nephrops creel fishery, and a cockle fishery. Several fisheries are also undergoing evaluation in the scheme including the North Sea haddock and Nephrops fisheries (UKMMAS, 2010).
Socio-economic Baseline Reviews for Offshore Renewables in Scottish Waters
R4032/3 22 R.1905
Scottish fisheries with accreditation (MSC website): Scottish Fisheries Sustainable Accreditation Group (SFSAG) North Sea haddock - this
fishery was certified as sustainable in October 2010. It is located in the North Sea (ICES Sub-Area IVa, b) and contains 192 vessels using seine and trawl methods;
Scottish Pelagic Sustainability Group Ltd Atlanto Scandian herring - this fishery was certified as sustainable in March 2010. It is located in the ICES Sub-Area I, IIa, IIb, V and XIV and contains 25 vessels from the Scottish RSW pelagic trawl fleet; and
Scottish Pelagic Sustainability Group Ltd (SPSG) North Sea herring - this fishery was certified as sustainable in July 2008. The Scottish fleet mainly exploits the Buchan sub-stock of herring located in the central and Northern North Sea within the EEZ of the EU and Norway.
Fish Processing Activities The availability, quality and conservation of fish stocks are major concerns for the processing industry. Landings of pelagic and demersal species have continued to decrease over the last decade, therefore, there is a lower volume of these species available to the processing industry (Brown, 2009). By contrast there is a larger volume of shellfish available to processors. No industry can continue unchanged while its major raw materials become less readily available. Firms engaged in some secondary processes or other diversification, are best placed to achieve financial stability in the near future. The process of rationalisation, which has been witnessed in recent years, will result in fewer bigger firms which are more likely to be geared up for obtaining supplies via direct routes and from overseas.
2.6.4 Wild Salmon and Sea Trout Scotland is famous for its wild salmon Salmo salar and sea trout Salmo trutta. These fish spend several years in rivers, migrate to sea then return as adults to spawn. Marine migrations in salmon are generally more extensive than those of sea trout (Baxter et al. 2011). All salmon fishing and sea trout fishing rights in Scotland, including in the sea, are private, heritable titles, which may be held separately from any land. They fall into one of three broad categories: Fixed engine fisheries - are restricted to the coast and must be set outside estuary
limits; Net and coble fisheries - generally operate in estuaries and the lower reaches of rivers;
and Rod and line fisheries - generally operate within rivers and above tidal limits. There are 45 fishing stations in mainland Scotland: East coast - 22; North coast - 5; and West coast and islands - 18. The locations of fixed engine and net and coble fisheries in Scotland are shown in Figure 13. Total rod catch for salmon was the highest on record in 2010, an increase of 31% from the previous 5-year average. However, despite increases in the catch and effort for fixed engine

Socio-economic Baseline Reviews for Offshore Renewables in Scottish Waters
R4032/3 23 R.1905
and net and coble fisheries in 2010, catch and effort remain at historically low levels, being less than 7% of the maximum recorded for each fishery since records began in 1952. Trends in rod and line catch are distinctly different from those in the net fisheries; the total rod catch in 2010 was 160% of the average over the period from 1952 when records began. Rod and line catch comprised 80% of the total Scottish catch in 2010 compared with 11% in 1952 (Scottish Government, 2011b), see Table 14. Table 14. Reported annual catches, number of salmon (2006 - 2010)
Year Fixed Engine Net and Coble Rod and Line
(Retained) Rod and Line
(Released)
2006 18,821 6,188 38,476 47,556
2007 13,618 6,279 35,583 55,515
2008 11,703 3,957 32,821 53,038
2009 8,206 4,649 24,228 48,367
2010 15,577 11,738 32,712 77,784
(Source: Scottish Government, 2011b)
Marine survival of salmon has declined substantially over the period covered by the catch statistics and similar declines have been detected in a number of sites on both sides of the North Atlantic. However, reductions in the netting fisheries have allowed a greater proportion of fish to enter rivers, resulting in an increase in the numbers of fish available to the rod fisheries (Scottish Government, 2011b). Total rod catch for sea trout has declined over much of the period since 1952, however, catches increased by 34% in 2010 compared with the previous 5-year average. Total rod catch continued the recent increase seen in East coast fisheries, but fell back in the West. Overall, West coast sea trout fisheries remain at historically low levels. Sea trout catches in the fixed engine and net and coble fisheries were 4 and 5% of the maximum recorded catches, respectively, and effort was just 3 and 6% of the maximum reported (Marine Scotland, 2011c), see Table 15. Table 15. Reported annual catches, number of sea trout (2006 - 2010)
Year Fixed Engine Net and Coble Rod and Line
(Retained) Rod and Line
(Released)
2006 3,239 4,931 10,058 10,617
2007 2,671 2,903 10,383 11,164
2008 2,810 2,732 7,612 9,631
2009 3,742 5,636 8,195 15,530
2010 2,360 8,663 7,843 19,861
(Source: Marine Scotland, 2011c)
An important factor in the decline of the sea trout netting fisheries, as indicated by a decline in reported effort, has been a decline in the salmon netting industry, since in the vast majority of cases salmon is the primary target species for these fisheries (Marine Scotland, 2011c). Reported sea trout catches remain at historically low levels, which may indicate low numbers of fish both entering fresh water and escaping to spawn.
Socio-economic Baseline Reviews for Offshore Renewables in Scottish Waters
R4032/3 24 R.1905
The overall value of these fisheries to the economy is difficult to calculate. Figures for GVA and numbers employed cannot be obtained from the Annual Business Inquiry (ABI), as it does not separately assess this activity. Rod fishermen cannot sell their catch, but they pay for their fishing experience and contribute to the general tourist economy by spending on accommodation and associated expenditure (Baxter et al. 2011). Net and coble and fixed engine fisheries can sell their catch so it can be a very valuable activity at an individual fisherman level. Employment tends to be seasonal particularly in the net fisheries. The numbers fluctuate, but July provides the greatest employment in the net fisheries (Baxter et al. 2011), as follows:
Net and coble 117 (2005) and 75 (2009); and Fixed engine 180 (2005) and 150 (2009).
The netting industry in Scotland has declined to historically low levels. In 2010, wild salmon catch and effort was 7% of the maximum recorded level and sea trout catch and effort was around 4.5% of the maximum recorded level. Netting effort in the fixed engine fisheries (median number of traps operated within Scotland between February and September) was reported as 888 median number of traps across all regions of Scotland in 2010, with the highest number (710) operating in the Solway region. Effort in the net and coble fisheries was reported as 65.5 median number of crews across all regions of Scotland in 2010 with the highest number operating in the Forth region (Marine Scotland, 2011e) in rod and line catch are distinctly different from those in the net fisheries; the total rod catch for salmon in 2010 (reported as 110,500 catches) was 160% of the average over the period from 1952 when records began. Total rod catch for sea trout has declined over much of this period, however, catches increased by 34% in 2010 (to 27,700 catches) compared with the previous 5-year average. Total rod catch continued the recent increase seen in East coast fisheries, but fell back in the West. Overall, West coast sea trout fisheries remain at historically low levels. The sector's future very much depends on the status of stocks together with the general economic situation. New coastal salmon nets are rarely opened and the main trend has been for declining catch and fishing effort in the net fisheries (Baxter et al. 2011). In the future, if the marine survival of salmon continues to decrease then rod catches may decline and ultimately spawning populations may be at risk (Scottish Government, 2011b).
2.7 Energy Generation
2.7.1 Definition of Sector/Activity
The energy generation sector includes conventional energy generation (coal, gas, nuclear, etc.) as well as renewables. In addition to the power generation assets themselves, it also incorporates supply chains for renewables along with transmission capacity. The main supply chain activities considered therefore include:
Manufacturing and installation of wind, wave and tidal devices and associated infrastructure; and
Operation and maintenance of devices including grid connections.
Socio-economic Baseline Reviews for Offshore Renewables in Scottish Waters
R4032/3 25 R.1905
Although other activities such as applying for development consents are part of the energy generation sector, they are not considered in detail here since it would be difficult to obtain data to allow their accurate valuation.
2.7.2 Description of Information Sources 2.7.2.1 Identified sources A variety of different information sources has been reviewed to inform this baseline, including published reports and papers, spatial layers and information provided through stakeholder engagement (Table 16).
Table 16. Data sources used in the energy generation chapter
Scale Information Available Date Source
Scotland Amount of electricity generated by energy source in Scotland (Scottish Environmental Statistics Online)
2009 Scottish Government Statistics
Scotland National Renewables Infrastructure Plan Reports on Stages 1 and 2
2010 SE & HIE, 2010
Scotland Blue Seas - Green Energy - A Sectoral Marine Plan for Offshore Wind Energy in Scottish Territorial Waters
2010 Marine Scotland, 2010b
UK Digest of UK Energy Statistics 2011 2011 DECC
Scotland Scotland‟s Offshore Wind Route Map - Developing Scotland‟s Offshore Wind Industry to 2020
2010 Offshore Wind Industry Group
Scotland The Offshore Valuation - A valuation of the UK‟s offshore renewable energy resource
2010 Public Interest Research Centre on behalf of The Offshore Valuation Group, 2010
Scotland Scottish Offshore Wind: Creating an Industry to Scottish Renewables
2010 IPA Energy + Water Economics, 2010
Scotland Information and analysis of wave & tidal market in Scotland
2011 Pure Marine Gen Ltd, 2011
Scotland Draft Electricity Generation Policy Statement 2010
2010 Scottish Government
Scotland A Low Carbon Economic Strategy for Scotland
2010
Scottish Government, SEPA, Highlands and Islands Enterprise, and Scottish Enterprise
UK
Tidal Technology Development and Deployment in the UK: Tidal Technologies: Key issues across planning and development for environmental regulators
2011 Bullen, Johnson, Kerr and Side, 2011
West Coast Scottish Offshore Renewables Development Sites
2011
Scottish Development International, Highlands and Islands Enterprise, and Scottish Enterprise, 2011
Scotland Scotland‟s Renewable Energy Potential: realising the 2020 target
2005 Scottish Executive, 2005, Future Generation Group Report

Socio-economic Baseline Reviews for Offshore Renewables in Scottish Waters
R4032/3 26 R.1905
Scale Information Available Date Source
Scotland 2020 Routemap for Renewable Energy in Scotland
2011 Scottish Government
Scotland Interim Great Britain Seven Year Statement
2004 National Grid, 2004
Scotland
Impact of alternative electricity generation technologies on the Scottish economy: an illustrative input-output analysis
2006 Allan, McGregor, Swales and Turner, 2006
Scotland The Economic Impact of Renewable Energy Policy in Scotland and the UK
2011 Verso Economics, 2011
Scotland Energy in Scotland: A Compendium of Scottish Energy Statistics and Information
2010 Scottish Government
Scotland The Future of Electricity Generation in Scotland
2008 Scottish Council for Development & Industry
2.7.2.2 Data limitations
This energy generation section aims both to describe current energy generation in Scotland and to identify the likely future trends that would occur in the absence of further policy intervention. This means that future trends need to be based on existing approved actions rather than on projections that might arise from future plans. For this reason, many recent data and figures which indicate future trends cannot be included within this baseline, since they make assumptions about the content of possible future plans. Given that offshore wind, wave and tidal development are in their infancy in Scottish waters and most schemes that have been approved are yet to be built, the scale, location and nature of supply chain development has yet to be established.
2.7.3 National Overview of Current Activity
2.7.3.1 Conventional electricity generation
At the end of May 2008 Scotland had five major conventional power stations in operation. These included3: Hunterston B in West Scotland: a nuclear power station commissioned in 1976 with an
installed capacity of 820 MW; Torness in East Scotland: a nuclear power station commissioned in 1988 with an
installed capacity of 1,230; Peterhead in North East Scotland: a gas/oil power station originally commissioned in
1980 with an installed capacity of 2,370 MW but limited to 1,540 MW due to transmission constraints. (It should be noted that since commissioning, various upgrading and conversion works have taken place. Also, two 250 MW gas turbines were decommissioned in 20094);
3 See Scottish Government Internet site:
(http://www.scotland.gov.uk/Topics/Business-Industry/Energy/Infrastructure/Major-Power-Stations) 4 See Engineering Timelines Internet site:
(http://www.engineering-timelines.com/scripts/engineeringItem.asp?id=988).

Socio-economic Baseline Reviews for Offshore Renewables in Scottish Waters
R4032/3 27 R.1905
Cockenzie in East Scotland: a coal fired power station which was commissioned in
1967 with an installed capacity of 1,152 MW; and Longannet in East Scotland: a coal fired power station which was commissioned in
1970 with an installed capacity of 2,304 MW. Cockenzie and Longannet combined provide around 33% of Scotland‟s electricity needs5. 2.7.3.2 Renewable electricity generation In addition to the five major conventional power stations listed above, Scotland also has a large pumped storage power station. Cruachan, located in West Scotland, has an installed capacity of 440 MW3. It was officially opened in 1965 with two machines, with a further two machines being completed in 1966 and 1967 respectively6. Other renewable sources which are currently exploited include wind, wave and biomass. Table 17 shows the total installed capacity for renewable energy sources in Scotland for the last decade. This indicates that wind (including wave) represented 55% of the total renewables capacity in 2009, up from 3% in 2000. This increase in wind capacity is illustrated by Image 5 (based on the data in Table 18). The majority of wind generation currently occurs onshore. As of 2010, Scotland had two operational offshore wind sites: the Beatrice demonstrator project (two 5 MW turbines) and Robin Rigg (180 MW capacity) (IPA Energy + Water Economics and Scottish Renewables, 2010). Figure 14 provides an overview of current and earmarked renewable energy generation sites in Scotland. Note that for the purposes of this baseline, only wind, wave or tidal schemes which have been built or consented, or for which a plan or lease has been granted are included. Therefore, consideration is limited to: The five short-term option sites approved by Blue Seas - Green Energy - A Sectoral
Marine Plan for Offshore Wind Energy in Scottish Territorial Waters (The Crown Estate, 2011);
The two Round 3 OWF sites – Moray Firth and Firth of Forth (since these are the result of a separate policy process);
Aberdeen and Beatrice demonstrator sites; Western Isles wave and tidal agreements to lease; Billa Croo wave power test facility; Fall of Warness tidal power test facility; Pentland Firth and Orkney Strategic Area; and Licensed wave and tidal sites, for example the Sound of Islay tidal stream site, the
Limpet project and the two EMEC nursery sites.
5 See Scottish Government Internet site:
(http://www.scotland.gov.uk/Topics/Business-Industry/Energy/Infrastructure). 6 See Visit Cruachan Internet site:
(http://www.visitcruachan.co.uk/about/history.asp).
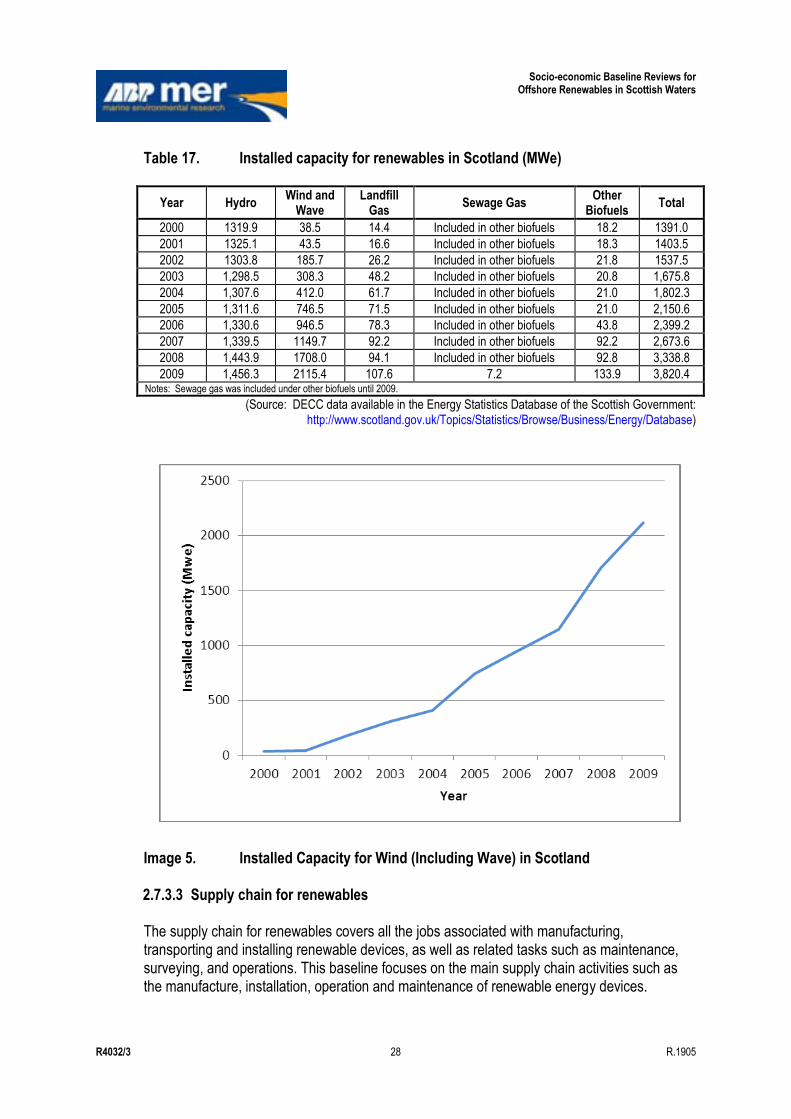
Socio-economic Baseline Reviews for Offshore Renewables in Scottish Waters
R4032/3 28 R.1905
Table 17. Installed capacity for renewables in Scotland (MWe)
Year Hydro Wind and
Wave Landfill
Gas Sewage Gas
Other Biofuels
Total
2000 1319.9 38.5 14.4 Included in other biofuels 18.2 1391.0
2001 1325.1 43.5 16.6 Included in other biofuels 18.3 1403.5
2002 1303.8 185.7 26.2 Included in other biofuels 21.8 1537.5
2003 1,298.5 308.3 48.2 Included in other biofuels 20.8 1,675.8
2004 1,307.6 412.0 61.7 Included in other biofuels 21.0 1,802.3
2005 1,311.6 746.5 71.5 Included in other biofuels 21.0 2,150.6
2006 1,330.6 946.5 78.3 Included in other biofuels 43.8 2,399.2
2007 1,339.5 1149.7 92.2 Included in other biofuels 92.2 2,673.6
2008 1,443.9 1708.0 94.1 Included in other biofuels 92.8 3,338.8
2009 1,456.3 2115.4 107.6 7.2 133.9 3,820.4 Notes: Sewage gas was included under other biofuels until 2009.
(Source: DECC data available in the Energy Statistics Database of the Scottish Government: http://www.scotland.gov.uk/Topics/Statistics/Browse/Business/Energy/Database)
Image 5. Installed Capacity for Wind (Including Wave) in Scotland 2.7.3.3 Supply chain for renewables The supply chain for renewables covers all the jobs associated with manufacturing, transporting and installing renewable devices, as well as related tasks such as maintenance, surveying, and operations. This baseline focuses on the main supply chain activities such as the manufacture, installation, operation and maintenance of renewable energy devices.

Socio-economic Baseline Reviews for Offshore Renewables in Scottish Waters
R4032/3 29 R.1905
Although the supply chain for onshore wind is providing jobs across Scotland (Scottish Executive, 2005), development of the fixed offshore wind supply chain has been slow both in the UK and Europe as a whole (Public Interest Research Centre, 2010). However, IPA Energy + Water Economics and Scottish Renewables (2010) note that there is existing capacity in the Scottish supply chain for offshore wind. The main strengths of this supply chain are listed as (ibid): Offshore engineering with expertise in construction, operations and maintenance,
project management and training (due to the offshore Oil and Gas sector); Design and development services including consultancy, engineering and project
development services; Research and development expertise in the private sector, academia and public sector
funded programmes; Existing port facilities with North Sea access and surrounding offshore service
networks; and Fabrication and manufacturing of components. IPA Energy + Water Economics and Scottish Renewables (2010) also note that there is much untapped potential for companies which are not currently involved in the sector. Indeed, stage 1 of the National Renewables Infrastructure Plan (NRIP) identified a list of sites which could be developed to support offshore wind. These included (Scottish Enterprise and Highlands and Islands Enterprise, 2010): Leith – integrated manufacturing; Dundee – distributed manufacturing and operation/maintenance; Nigg (note that this site has already been used to support the Beatrice Demonstration
Project) – integrated manufacturing; Energy Park Fife at Methil (some supply chain investment has already occurred here)
– further manufacturing; Aberdeen – distributed manufacturing and operation/maintenance; Hunterston – integrated manufacturing; Arnish – distributed manufacturing; Campbeltown/Machrihanish (some supply chain investment has already occurred
here) – further manufacturing and operation/maintenance; Ardersier – integrated manufacturing; Peterhead – distributed manufacturing and operation/maintenance; and Kishorn – distributed manufacturing.
These sites are marked on Figure 17. For the wave and tidal supply chain, site owners at Scrabster and Lyness in Scapa Flow are developing investment proposals so that there is support at these sites for companies awarded leases by the Crown Estate (Scottish Enterprise and Highlands and Islands Enterprise, 2010).
Socio-economic Baseline Reviews for Offshore Renewables in Scottish Waters
R4032/3 30 R.1905
2.7.3.4 Transmission capacity Scotland‟s transmission grid is mainly made up of 400 kV and 275 kV lines which join the major nuclear and coal fired power stations in the central belt with the Peterhead plant in North East Scotland (Scottish Council for Development & Industry, 2008). The Scottish grid is connected to the English grid with four transmission lines which form two double circuits; on the East, the circuit operates at 400 kV, whilst on the West part of the circuit operates at 400 kV and the remainder runs at 275 kV (ibid). Connection between Scotland and Northern Ireland is via the 500 MW Moyle Interconnector which joins Ballantrae with Ballylumford (Scottish Council for Development & Industry, 2008). Figure 18a provides a pictorial representation of transmission capacity. 2.7.3.5 Current economic value and employment The total amount of electricity generated in Scotland in 2009 was 51,325 GWh, up from 49,843 GWh in 20087. Note however that over the past decade, the total generated has remained reasonably stable, with a high of 52,250 GWh in 2006 and a low of 48,073 GWh in 2007. Looking at the 2009 figure of 51,325 GWh, gross electricity consumption was 39,179 GWh whilst 12,145 GWh were exported from Scotland Renewable energy generation was 10,744 GWh in 2009, representing 21% of total electricity generated7. Although the Renewables Action Plan8 notes that there is a lack of robust employment data on the renewable energy sector in Scotland, estimates do exist. Direct employment in the generation of renewable energy in Scotland was estimated at around 1,100 for 2009/10 (Verso Economics, 2011). This compares with a total for the energy sector as a whole (including water supply) of 42,000 people in 2008 (Scottish Government, 2010c). Although this latter figure represents 1.7% of total employee jobs in Scotland, it does not include those people who work in the supply chain, thus the actual figure9 could be larger (Scottish Government, 2010c). Given the share of electricity generated by renewables, it is likely that employment related to renewable energy is also larger than the figure quoted, since this only relates to direct employment, and therefore does not consider indirect or knock-on jobs10. To gain a better understanding of employment in the sector, statistics from the Business Register and Employment Survey can be used to estimate the total size of the workforce directly involved in electricity through looking at the SIC codes. Figures for 2009 and 2010 for full and part-time work under several relevant codes are given in Table 18. Note that codes for extraction of oil and gas, and support activities related to extraction are not considered here to avoid any double counting with the oil and gas sector figures. Summing the values in Table 19 provides overall totals of 32,758 and 31,381 for direct employment in electricity in 2009 and
7 All data on electricity generation sourced from DECC via the Scottish Government Energy Statistics Database:
(http://www.scotland.gov.uk/Topics/Statistics/Browse/Business/Energy/Database). 8 See the Scottish Government Internet site (http://www.scotland.gov.uk/Publications/2009/07/06095830/13). 9 Energy in Scotland: A Compendium of Scottish Energy Statistics and Information, Report produced Dec. 2010 10 Note that the Verso Economics figure is taken from a summary report; the full report does not appear to be publicly
available. It is therefore not possible to identify the data from which the figure is extrapolated.
Socio-economic Baseline Reviews for Offshore Renewables in Scottish Waters
R4032/3 31 R.1905
2010 respectively. However, these values should be treated as underestimates since there will be workers in other sectors, for example, technical testing and analysis, who will be employed in the wider energy sector. Therefore, the actual figure for employment supported by the energy sector is likely to be somewhat higher than both the SIC code counts given here and the Scottish Government estimate of around 42,000 for 2008. At this point it should be noted that the Scottish workforce as a whole is highly qualified with 33.9% of residents aged 16-64 educated to NVQ4 level and above (Scottish Development International et al, 2011). Table 18. Direct employment in the electricity sector in Scotland by SIC Code
SIC Code, 2007 Full-time Part-time Total
2009 2010 2009 2010 2009 2010
Production of electricity (3511) 4,880 6,937 407 560 5,283 7,459
Transmission of electricity (3512) 1,005 1046 180 192 1,185 1,238
Distribution of electricity (3513) 3,560 3686 398 461 3,957 4,143
Trade of electricity (3514) 205 225 1 7 206 229
Construction of utility projects for electricity and telecommunications (4222)
53 127 1 6 54 132
Electrical installation (4321) 20,914 17,303 1,117 741 22,073 18,180
Totals (note these may not sum exactly due to rounding)
30,617 29.324 2,104 1,967 32,758 31,381
(Source: ONS, 2011)
2.7.3.6 Historical trends Renewables as a percentage of gross electricity consumption has increased; in 2000 12.2% of electricity consumed in Scotland came from renewables, yet by 2009 the figure was 27.4%. This increase is likely to be have been partly driven by the Scottish Renewable Orders (SROs) of which there have been three11: 1994 order - this required around 76 MW DNC of new capacity comprising 30
schemes. By the end of December 2010, 18 schemes had been commissioned with a capacity of 39 MW DNC;
1997 order - this required 114 MW DNC of new capacity comprising 26 schemes. By the end of 2010, 11 schemes had been commissioned with a capacity of 38 MW DNC; and
1999 order - this required 145 MW DNC of new capacity consisting of 53 schemes. By the end of 2010, 15 schemes had been commissioned with a capacity of 26 MW DNC.
The amount of electricity generated by wind (including a small amount of tidal) in the past decade in Scotland is shown in Image 6 below7. Technology in the marine energy sector (i.e. wave and tidal) has developed at a slower rate than wind, with few devices proven to operate at a commercial scale (Pure Marine Gen Ltd, 2011). However, one example of a successful deployment is Wavegen‟s LIMPET project on Islay. This was one of the first wave energy projects to be connected to the grid, and has been operational since 2001 (Scottish Development International et al, 2011).
11 See Digest of UK Energy Statistics (DUKES), Long term trends, available from the DECC Internet site:
(http://www.decc.gov.uk/en/content/cms/statistics/publications/dukes/dukes.aspx).
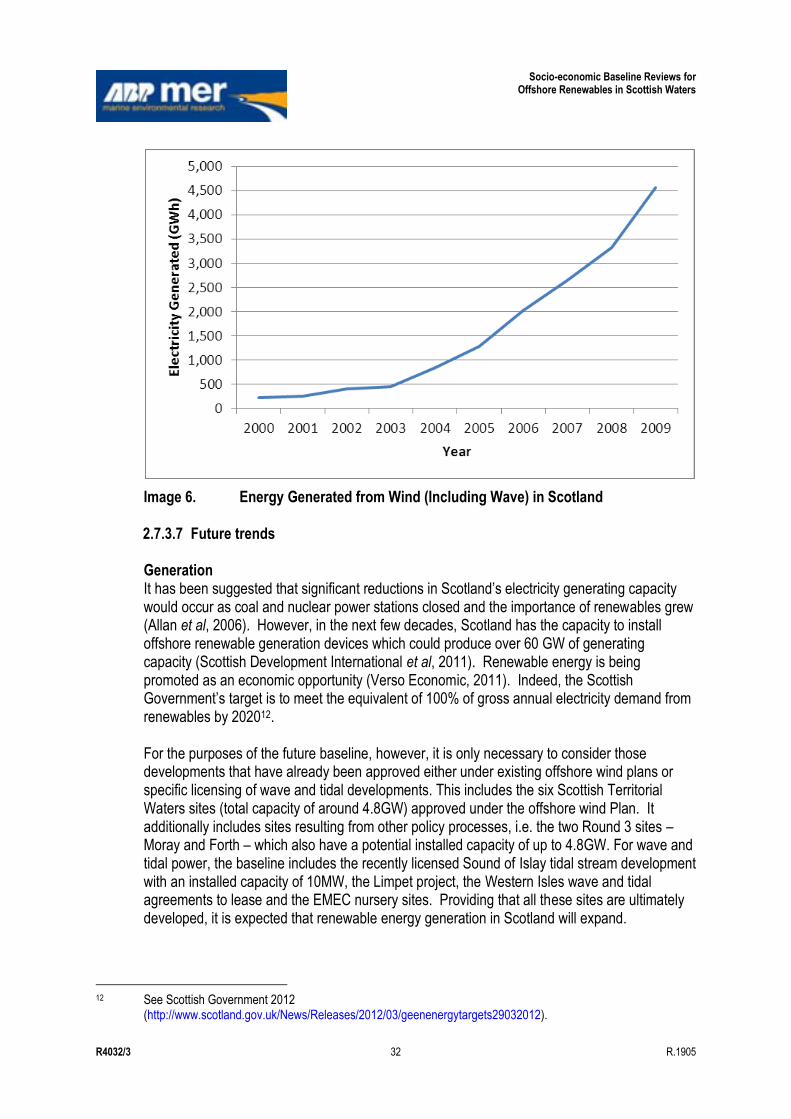
Socio-economic Baseline Reviews for Offshore Renewables in Scottish Waters
R4032/3 32 R.1905
Image 6. Energy Generated from Wind (Including Wave) in Scotland 2.7.3.7 Future trends Generation It has been suggested that significant reductions in Scotland‟s electricity generating capacity would occur as coal and nuclear power stations closed and the importance of renewables grew (Allan et al, 2006). However, in the next few decades, Scotland has the capacity to install offshore renewable generation devices which could produce over 60 GW of generating capacity (Scottish Development International et al, 2011). Renewable energy is being promoted as an economic opportunity (Verso Economic, 2011). Indeed, the Scottish Government‟s target is to meet the equivalent of 100% of gross annual electricity demand from renewables by 202012. For the purposes of the future baseline, however, it is only necessary to consider those developments that have already been approved either under existing offshore wind plans or specific licensing of wave and tidal developments. This includes the six Scottish Territorial Waters sites (total capacity of around 4.8GW) approved under the offshore wind Plan. It additionally includes sites resulting from other policy processes, i.e. the two Round 3 sites – Moray and Forth – which also have a potential installed capacity of up to 4.8GW. For wave and tidal power, the baseline includes the recently licensed Sound of Islay tidal stream development with an installed capacity of 10MW, the Limpet project, the Western Isles wave and tidal agreements to lease and the EMEC nursery sites. Providing that all these sites are ultimately developed, it is expected that renewable energy generation in Scotland will expand.
12 See Scottish Government 2012 (http://www.scotland.gov.uk/News/Releases/2012/03/geenenergytargets29032012).
Socio-economic Baseline Reviews for Offshore Renewables in Scottish Waters
R4032/3 33 R.1905
Transmission Capacity The Interim Great Britain Seven Year Statement indicates that there is likely to be a need for new infrastructure/reinforcement in many areas of Scotland to ensure that generated power can be transmitted to where it is required, for example, new infrastructure will be necessary to connect power generation around the Western Isles, Orkney and Shetland to the mainland transmission network (National Grid, 2004). Indeed, problems have already occurred in some areas. Within Scotland, wind connection is restricted due to insufficient transmission capacity across the Scottish border, with 16 GW of wind awaiting connection in 2007 (Public Interest Research Centre, 2010). There are also issues with congestion in the power transmission network between the North and the South of the UK (Public Interest Research Centre, 2010). However, plans do exist to increase the capacity of power interconnections from Scotland to both England and Northern Ireland, as well as for a new major interconnector to Norway (Scottish Development International et al, 2011). In addition, there are plans for around 1,800MW of subsea interconnectors along the West and East coasts of Scotland (Scottish Development International et al, 2011), whilst plans for a strategic set of grid upgrades across Scotland are already progressing (Scottish Government, 2010d). It is therefore likely that the future trend in transmission capacity will be upwards. It should however be noted that transmission capacity is complicated by the variability in generation which renewables provide (Public Interest Research Centre, 2010). Despite this, it is stressed by the Scottish Executive (2005) that transmission capacity has to be built on the basis of firm development proposals, rather than on the expectation that new or developing technologies will eventually be put in place. Stakeholder responses to this study indicate that there is the hope that energy generation companies can collaborate rather than compete on grid connection to ensure economies of scale are achieved. This is likely to be critical given that the best sources of renewable energy are typically located at the edges of the current grid network, rather than the centre (Scottish Government, 2011a). Supply Chain for Renewables It is believed that there is already a strong supply chain due to the well-established and experienced Oil and Gas industry (Scottish Development International et al, 2011). However, although several locations can deal with operations and maintenance, the future requirements of the renewables supply chain cannot yet be fully met at any one of Scotland‟s ports13 (Scottish Enterprise and Highlands and Islands Enterprise, 2010a; 2010b). The ability of the supply chain to increase capacity could affect the level of resource development, in particular for fixed and floating offshore wind (Public Interest Research Centre, 2010). Indeed, the Offshore Wind Industry Group (2010) comments that Scotland‟s indigenous supply chain may not be prepared in time to take advantage of developments in renewables. Thus, there exists uncertainity over the capability of the renewables supply chain to meet potential demand if more renewable devices are to be installed.
13 Note that the National Renewables Infrastructure Plan (NRIP) is intended to deal with this issue through focusing
on several supply chain ports.
Socio-economic Baseline Reviews for Offshore Renewables in Scottish Waters
R4032/3 34 R.1905
However, despite the uncertainty, some wind and wave devices are already operational, so it is anticipated that supply chain activities such as servicing and maintenance of existing devices will continue. Indeed, as noted earlier, investment in the supply chain for offshore wind has already taken place at Nigg, Campbeltown/Machrihanish and Energy Park Fifie at Methil (Scottish Enterprise and Highlands and Islands Enterprise, 2010). For example, one company at Machrihanish now has new buildings, which will help modernise production and allow the plant to manufacture larger turbine tower sections for onshore and offshore renewables (ibid). There has additionally been some investment at Arnish by the HIE (ibid). This has helped to create a multi-user site with a focus on renewables ((Scottish Enterprise and Highlands and Islands Enterprise, 2011). Implementation of the earmarked offshore wind developments (and tidal developments) is likely to lead to strong growth and further investment in supply chain activities within Scotland including: Work on development and consents (including monitoring and surveys); Manufacturing of new renewable devices. Indeed, it should be noted that most jobs
related to renewable energy occur in the construction phase of development (Scottish Executive, 2005); and
Installation of new renewable devices. Given the number of sites which have already been earmarked for offshore wind development, it is anticipated that there will initially be a considerable increase in jobs relating to surveying, development and monitoring. This will probably be followed by an increase in supply chain activity such as manufacturing and installation of wind devices. The magnitude of this increase will be dependent on the number of sites which actually progress through the development process from initial suggestions to dealing with any issues, implementing any mitigation policies and ultimately building and installing turbines. Provided that some of the earmarked sites are developed, there will be an increased requirement for servicing and maintenance related jobs and employment. These may be focused on the supply chain sites identified in Stage 1 of the National Renewables Infrastructure Plan. Considering the tidal and wave supply chain, maintenance work is expected to continue where devices are being tested or are already installed and construction work will be associated with the approved development in the Sound of Islay and further installation of prototypes at EMEC. However the volume of work related to new developments will be much more limited than for offshore wind. Therefore, although some expansion of the tidal and wave supply chain is likely, this will be minimal, and will probably be centred on sites where investment proposals are already being developed, for example, Scrabster and Lyness in Scapa Flow (identified by the National Renewables Infrastructure Plan Stage 1).
2.8 Military Interests
2.8.1 Definition of Sector/Activity The military defence sector makes use of the Scottish coastline for the location of bases and training and use of the sea for training, test and evaluation activities and the surveillance and
Socio-economic Baseline Reviews for Offshore Renewables in Scottish Waters
R4032/3 35 R.1905
monitoring of waters to detect and respond to potential threats. In this assessment military interests comprise the use of the coast and seas by the Royal Navy (submarine bases, jetties and exercise areas), Army (training camps and firing ranges), Royal Air Force (bases, coastal Air Weapon Ranges and Danger Areas) and MOD (Defence Test and Evaluation Ranges to trial weapon systems) (Baxter et al, 2011).
2.8.2 Description of Information Sources A range of information has been accessed to inform this baseline, including published reports, spatial data layers and other specific information provided through stakeholder engagement (Table 19). Table 19. Information sources for military interests baseline
Scale Information Available Date Source
Scotland Scottish Naval Exercise Areas Information
2010 http://rnopsscotland.netfirms.com/index.htm
Scotland Exercise areas, firing ranges and military coastal locations
2010 Baxter et al, 2011; Marine Scotland
Scotland Military and civilian personnel numbers
2011 DASA (www.dasa.mod.uk) and UK National Statistic (www.statistics.gov.uk) websites
UK Estimate of economic value of naval defence
2008
UK Defence Statistics; www.dasa.mod.uk/modintranet/UKDS/UKDS2011/pdf/ukds.pdf, UKMMAS, 2010.
2.8.2.1 Data limitations Owing to the confidential nature of military defence activities it is difficult to assess the extent and frequency of activity in the marine environment and future trends (UKMMAS, 2010).
2.8.3 National Overview of Current Activity 2.8.3.1 Location and intensity of activity Military activities occur in both inshore and offshore waters in all SORERs. All coastal military locations and the full area available for military training and other defence activities are shown in Figure 15. Principal marine-related defence activities include sea transport by naval vessels and sea training. Activities relating to maritime transport are mainly associated with naval bases and the only naval base in Scotland is Her Majesty‟s Naval Base (HMNB) Clyde at Faslane in the West SORER. Sea training is carried out within defined military practise and exercise (PEXA) training areas. The Navy‟s Scottish Exercise Areas (SXAs) occur in all SORERs except the North and North East, while firing danger areas and „other‟ exercise areas occur in all SORERs. Although the PEXA cover large areas of sea, military exercises cover only a proportion of these areas at any one time and are restricted temporally to a number of weeks per year. The major training exercise each year is the Joint Maritime Course in which Navy, Army and RAF exercises are conducted off the Scottish North West coast and which lasts for two weeks (UKMMAS, 2010).

Socio-economic Baseline Reviews for Offshore Renewables in Scottish Waters
R4032/3 36 R.1905
2.8.3.2 Economic value and employment Defence activities do not generate a tangible output and therefore can not be valued. However, one can examine the expenditure within relevant departments, e.g. the Commander-in-Chief (C-in-C) Navy Command which is responsible for the operation, resourcing and personnel training of ships, submarines and aircraft (UKMMAS, 2010). UKMMAS (2010) estimated that in 2007/08, the UK military defence expenditure for the operation of marine activities was £1,796million with a GVA of £468 million. Using the same methodology, the 2009/10 value has been recalculated using the Department Expenditure Limits (DEL) for the C-in-C Navy Command based on the UK Defence Statistics 2011 provided on the Defence Analytical Services and Advice website14. In 2009/10 the resource DEL allocated to the C-in-C Navy Command was £2,294million. Based on the assumption that the majority of this budget was for the operation of marine activity, and that 17.7% of this total budget (i.e. £406million) would be allocated to the C-in-C Naval Home Command for shore based operations, it can be estimated that expenditure for the operation of marine activities was £1,888million with a GVA of £491million. It is not possible to estimate what proportion of this value can be attributed to military defence activities in Scotland. In terms of employment, at July 2011, there were 11,910 military (armed forces) personnel and 5,430 civilian personnel based in Scotland. The armed forces comprised 4,680 Navy, 3,200 Army and 4,030 RAF personnel (MOD, 2011a). 2.8.3.3 Historical trends Owing to the confidential nature of military defence activities it is difficult to assess historical trends. With respect to employment, since 2003, the number of military and civilian personnel based in Scotland has fallen from 15,080 to 12,080 and from 9,600 to 5,540 respectively (MOD, 2011b). 2.8.3.4 Future trends Specific defence projects may provide significant employment opportunities. For example, with respect to future aircraft carriers, building the hull sections and outfitting the vessels will provide work for about 10,000 people, including 3,500 at the two Clyde yards and 1,600 at Rosyth, Fife at the project‟s peak (UKMMAS, 2010). Owing to the confidential nature of military defence activities it is difficult to assess likely future trends, however future employment will be governed by the forth coming spending cuts within the Ministry of Defence. In addition there are plans to build the next generation of submarines, which may be constructed in Scotland as in the past.
14 Defence Analytical Services and Advice website:
http://www.dasa.mod.uk/modintranet/UKDS/UKDS2011/c1/table105.php
Socio-economic Baseline Reviews for Offshore Renewables in Scottish Waters
R4032/3 37 R.1905
2.9 Oil and Gas
2.9.1 Definition of Sector/Activity This sector relates to the extraction of Oil and Gas in the sub-sea environment largely from offshore reserves. Oil reserves include both oil and the liquids and liquefied products obtained from gas fields, gas-condensate fields and from the associated gas in oil fields. Gas reserves are the quantity of gas expected to be available for sale from dry gas fields, gas-condensate fields and oil fields with associated gas. For this assessment, activity within this sector includes exploration, production, interconnectors and gas storage (i.e. the „upstream‟ Oil and Gas sector).
2.9.2 Description of Information Sources A range of information has been accessed to inform this baseline, including published reports, spatial data layers and other specific information provided through stakeholder engagement (Table 20). Table 20. Information sources for oil and gas baseline
Scale Information Available Date Source
Scotland All pipelines and cables Current SeaZone Solutions Ltd
UK Oil Pipelines - Subsea pipelines and umbilical‟s related to the petroleum industry.
Current UKDEAL
UK Oil and Gas employment 2009 Oil and Gas UK 2010 and 2011 Economic reports.
UK Production values of crude oil and average oil price per tonne
2008-2010 DECC
Scotland
Revenues and production from Scottish Sea areas (2005-2008). Oil, gas and NGL production and revenue (2005-2008) for all Scottish waters and regional breakdown.
2005-2008 Baxter et al, 2011
2.9.2.1 Data limitations Specific limitations of the data include currently being unable to determine the economic value of pipelines associated with Oil and Gas from the overall economic value of the sector as a whole (ABPmer and RPA, 2011). Complete data sets relating to the income and expenditure for Oil and Gas were unavailable at the time of writing.
2.9.3 National Overview of Current Activity 2.9.3.1 Location and intensity of activity There is extensive infrastructure associated with Oil and Gas developments in Scotland, including seabed and platform mounted production facilities and networks of pipelines bringing Oil and Gas ashore for processing (Baxter et al, 2011; Figure 16). Pipelines associated with Oil and Gas in Scotland are estimated to be 12,800km in length although the majority of pipelines
Socio-economic Baseline Reviews for Offshore Renewables in Scottish Waters
R4032/3 38 R.1905
exist outwith the 12NM limit (i.e. offshore) around the coast. Virtually all hydrocarbon fields, platforms, pipelines and infrastructure occur within the North, North East and East SORERs in the North Sea, with the exception of some licensed blocks in the North West and South West SORERs, and three interconnector pipelines within the South West SORER which take gas across the Irish Sea (Figure 16). The West SORER only has two Oil and Gas pipelines, as shown in Figure 75 and this therefore is not considered further for this industry within the document. There is currently no gas storage activity in Scottish Waters (Baxter et al, 2011). Information on the production of oil, natural gas liquids (NGL) and gas from Scottish Sea areas between 2005 and 2008 are provided by Baxter et al (2011) and are shown in Table 21. The values show that production levels of Oil and Gas have remained roughly constant between 2005 and 2008, although there was a reduction in the tonnage of NGL in 2008 compared to previous years. Table 21. Production and revenues from oil and gas from Scottish sea areas
between 2005-2008
Production 2005 2006 2007 2008
Oil (tonnage) 56,751,985 51,734,343 54,900,487 53,081,406
NGL (tonnage) 5,439,147 5,458,028 5,551,411 4,435,130
Gas (therms) millions 18,218 16,311 17,200 19,606
Revenue 2005 2006 2007 2008
Oil (£M) 12,165 13,389 14,805 20,137
NGL (£M) 1,238 1,528 1,596 1,672
Gas (£M) 4,406 5,581 5,052 6,934
Total (£M) 17,809 20,498 21,454 28,744
(Source: Baxter et al. 2011)
Indicative figures for crude oil production from hydrocarbon fields which lie within the SORER in 2009 (61,341,301 tonnes) and 2010 (57,895,697 tonnes) were calculated using offshore crude oil production data from the DECC website15. Estimates of the tonnage of crude oil and produced in each SORER is provided in the Regional overviews. It was not possible to estimate dry gas or NGL production for 2009 and 2010 as production is not allocated to individual hydrocarbon fields (Clive Evans, DECC, pers. comm.). 2.9.3.2 Economic value and employment The Oil and Gas industry is the principal source of fuel and power for Scotland, meeting more than 58% of the primary energy need in Scotland in 2008 (Baxter et al, 2011). The sector is the largest industrial contributor to the UK‟s GVA; the GVA of the upstream Oil and Gas sector (i.e. not including the value added by the supply chain) in the UK in 2010 was estimated at £32 billion. In 2010, supply chain exports were in the range of £5-6 billion (Oil and Gas UK, 2011). Information on the disaggregation of this economic value in 2010 to the Oil and Gas produced from the SORER was not available. However, information on the total revenue from oil, natural
15 DECC Oil and Gas website:
https://www.og.decc.gov.uk/information/index.htm
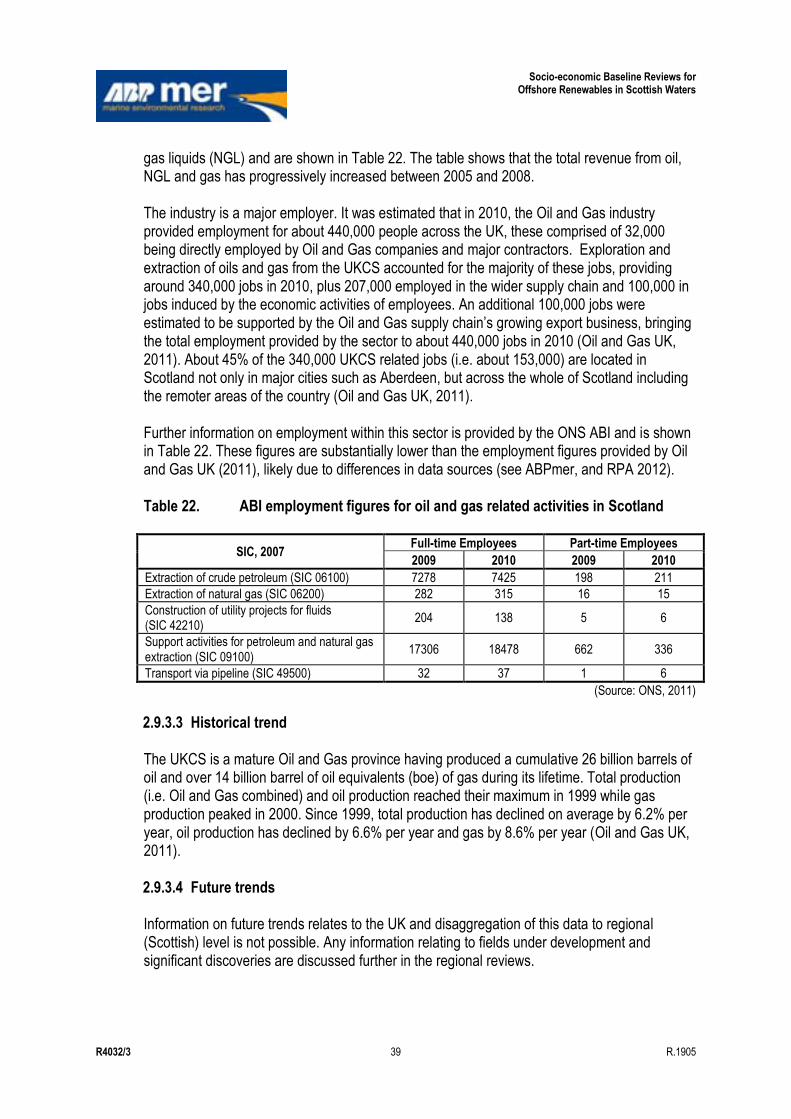
Socio-economic Baseline Reviews for Offshore Renewables in Scottish Waters
R4032/3 39 R.1905
gas liquids (NGL) and are shown in Table 22. The table shows that the total revenue from oil, NGL and gas has progressively increased between 2005 and 2008. The industry is a major employer. It was estimated that in 2010, the Oil and Gas industry provided employment for about 440,000 people across the UK, these comprised of 32,000 being directly employed by Oil and Gas companies and major contractors. Exploration and extraction of oils and gas from the UKCS accounted for the majority of these jobs, providing around 340,000 jobs in 2010, plus 207,000 employed in the wider supply chain and 100,000 in jobs induced by the economic activities of employees. An additional 100,000 jobs were estimated to be supported by the Oil and Gas supply chain‟s growing export business, bringing the total employment provided by the sector to about 440,000 jobs in 2010 (Oil and Gas UK, 2011). About 45% of the 340,000 UKCS related jobs (i.e. about 153,000) are located in Scotland not only in major cities such as Aberdeen, but across the whole of Scotland including the remoter areas of the country (Oil and Gas UK, 2011). Further information on employment within this sector is provided by the ONS ABI and is shown in Table 22. These figures are substantially lower than the employment figures provided by Oil and Gas UK (2011), likely due to differences in data sources (see ABPmer, and RPA 2012). Table 22. ABI employment figures for oil and gas related activities in Scotland
SIC, 2007 Full-time Employees Part-time Employees
2009 2010 2009 2010
Extraction of crude petroleum (SIC 06100) 7278 7425 198 211
Extraction of natural gas (SIC 06200) 282 315 16 15
Construction of utility projects for fluids (SIC 42210)
204 138 5 6
Support activities for petroleum and natural gas extraction (SIC 09100)
17306 18478 662 336
Transport via pipeline (SIC 49500) 32 37 1 6
(Source: ONS, 2011)
2.9.3.3 Historical trend The UKCS is a mature Oil and Gas province having produced a cumulative 26 billion barrels of oil and over 14 billion barrel of oil equivalents (boe) of gas during its lifetime. Total production (i.e. Oil and Gas combined) and oil production reached their maximum in 1999 while gas production peaked in 2000. Since 1999, total production has declined on average by 6.2% per year, oil production has declined by 6.6% per year and gas by 8.6% per year (Oil and Gas UK, 2011). 2.9.3.4 Future trends Information on future trends relates to the UK and disaggregation of this data to regional (Scottish) level is not possible. Any information relating to fields under development and significant discoveries are discussed further in the regional reviews.
Socio-economic Baseline Reviews for Offshore Renewables in Scottish Waters
R4032/3 40 R.1905
It has been estimated that in 2020, 70% of primary energy in the UK is still expected to come from Oil and Gas, even if the target of meeting 15% of UK total energy use from renewable sources is met (this target is 20% in Scotland). The UKCS has the potential to satisfy about 60% of the UK‟s Oil and Gas demand in 2020, if the current rate of investment is sustained (Oil and Gas UK, 2011). However, the amount of Oil and Gas imported into the UK is also likely to increase. By 2015, around 25% of the UK‟s annual gas demand is likely to be met by imports (increasing from 20% in 2008). Given the prediction for increasing dependence on imported gas, subsea gas storage facilities and associated pipeline are also likely to increase (Saunders et al, 2011). Over 40 billion boe have been recovered so far from the UKCS, and a further overall recovery of 14 to 24 billion boe is forecast (Oil and Gas UK, 2011). These are mainly in discoveries awaiting development, areas under current licence or regions where oil can be expected to be found but has not yet been explored (Baxter et al, 2011). Based on the average price of Oil and Gas forecast by the Energy Information Administration between 2009 and 2030, the wholesale gross value of these remaining reserves may be between £650 billion to £1.1 trillion (Baxter et al, 2011). A significant area of unexploited gas reserves lies to the West of Shetland and a new gas export pipeline from this area is currently being built to support output from the Laggan (about 125km West of Shetland) and Tormore (about 15km further South West) fields, scheduled to start production in 2014 (Baxter et al, 2011). Around 500 individual structures (including platforms and tie backs) will be decommissioned over the next three decades (Saunders et al, 2011). However, depleted Oil and Gas fields, and Oil and Gas infrastructure, may potentially be used in the emerging CCS sector (see Section 2.4).
2.10 Ports and Harbours
2.10.1 Definition of Sector/Activity Ports provide the modal interchange points by which goods and people are transported from land to sea. Harbours are by definition, safe havens for vessels to reside and are often commensurate with ports areas. Within Scottish waters, the ports and harbours sector supports the largest fishing industry in the UK, provides facilities for a significant offshore Oil and Gas industry, as well as maintaining ferry links to island communities and providing the recreational sector with support services. Section 2.10 addresses Ports and Harbours specifically; however the interconnection to other sectors should be noted.
2.10.2 Description of Information Sources A range of information has been accessed to inform this baseline, including published reports, spatial data layers and other specific information provided through stakeholder engagement (Table 23).
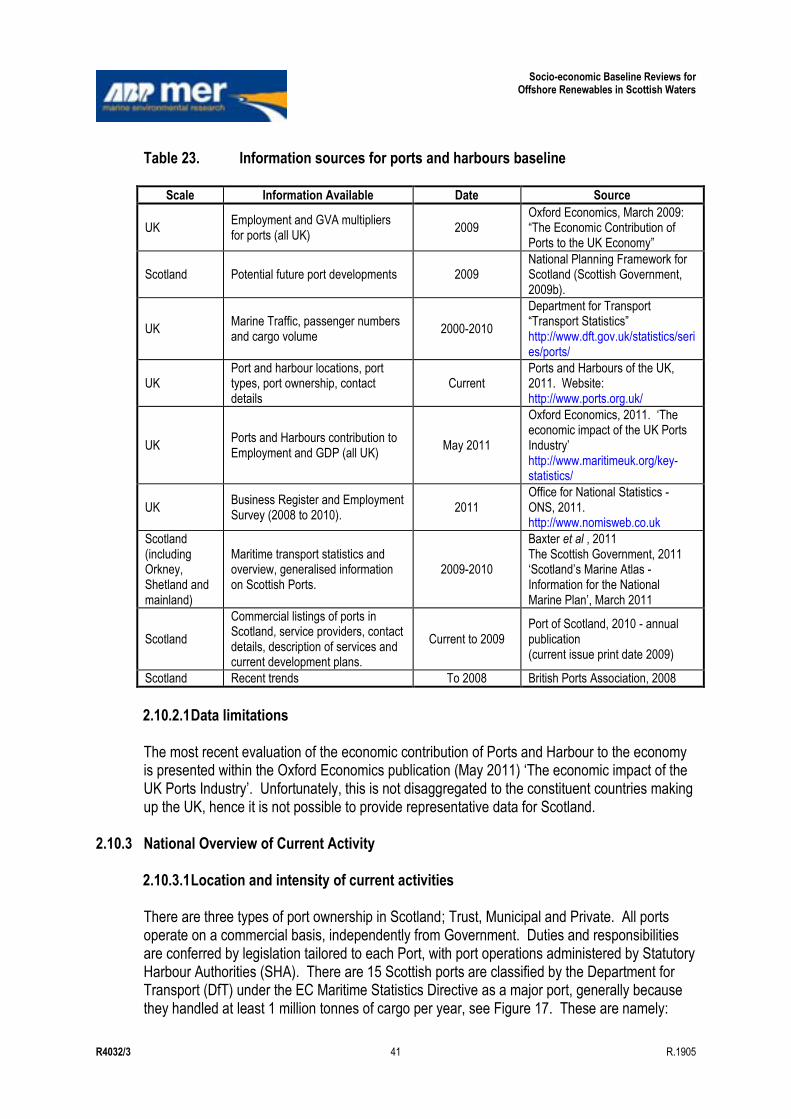
Socio-economic Baseline Reviews for Offshore Renewables in Scottish Waters
R4032/3 41 R.1905
Table 23. Information sources for ports and harbours baseline
Scale Information Available Date Source
UK Employment and GVA multipliers for ports (all UK)
2009 Oxford Economics, March 2009: “The Economic Contribution of Ports to the UK Economy”
Scotland Potential future port developments 2009 National Planning Framework for Scotland (Scottish Government, 2009b).
UK Marine Traffic, passenger numbers and cargo volume
2000-2010
Department for Transport “Transport Statistics” http://www.dft.gov.uk/statistics/series/ports/
UK Port and harbour locations, port types, port ownership, contact details
Current Ports and Harbours of the UK, 2011. Website: http://www.ports.org.uk/
UK Ports and Harbours contribution to Employment and GDP (all UK)
May 2011
Oxford Economics, 2011. „The economic impact of the UK Ports Industry‟ http://www.maritimeuk.org/key-statistics/
UK Business Register and Employment Survey (2008 to 2010).
2011 Office for National Statistics - ONS, 2011. http://www.nomisweb.co.uk
Scotland (including Orkney, Shetland and mainland)
Maritime transport statistics and overview, generalised information on Scottish Ports.
2009-2010
Baxter et al , 2011 The Scottish Government, 2011 „Scotland‟s Marine Atlas - Information for the National Marine Plan‟, March 2011
Scotland
Commercial listings of ports in Scotland, service providers, contact details, description of services and current development plans.
Current to 2009 Port of Scotland, 2010 - annual publication (current issue print date 2009)
Scotland Recent trends To 2008 British Ports Association, 2008
2.10.2.1 Data limitations The most recent evaluation of the economic contribution of Ports and Harbour to the economy is presented within the Oxford Economics publication (May 2011) „The economic impact of the UK Ports Industry‟. Unfortunately, this is not disaggregated to the constituent countries making up the UK, hence it is not possible to provide representative data for Scotland.
2.10.3 National Overview of Current Activity 2.10.3.1 Location and intensity of current activities There are three types of port ownership in Scotland; Trust, Municipal and Private. All ports operate on a commercial basis, independently from Government. Duties and responsibilities are conferred by legislation tailored to each Port, with port operations administered by Statutory Harbour Authorities (SHA). There are 15 Scottish ports are classified by the Department for Transport (DfT) under the EC Maritime Statistics Directive as a major port, generally because they handled at least 1 million tonnes of cargo per year, see Figure 17. These are namely:

Socio-economic Baseline Reviews for Offshore Renewables in Scottish Waters
R4032/3 42 R.1905
Aberdeen; Ayr; Cairnryan; Clyde (Ports Group); Cromarty Firth; Forth (Ports Group); Glensanda; Inverness; Lerwick; Montrose; Orkney; Perth; Peterhead; Stranraer; and Sullom Voe. There are around 270 ports and harbours in Scottish waters, ranging from very small piers and landing stages, to those with major facilities. They include: Large Oil and Gas terminals, e.g. Hound Point (Firth of Forth), Sullom Voe (Shetland),
Flotta (Scapa Flow, Orkney); Large quarry product port - Glensanda; Large fishing ports, e.g. Peterhead, Fraserburgh; Smaller fishing ports, e.g. Buckie, Mallaig; Oil supply ports, e.g. Aberdeen, Cromarty Firth; Multi-purpose ports, e.g. Leith, Clyde; Large container ports - Grangemouth; Major ferry ports serving Ireland and Europe - Cairnryan, Stranraer and Rosyth - as
well as lifeline ferry services within Scotland; Marine Works serving as pier heads for ferry services to Scotland's islands and for
working boats associated with fish farm installations; and Marina facilities, e.g. Fairlie, Craobh Haven, Port Edgar. 2.10.3.2 Economic value and employment The ABI figures for GVA and numbers of jobs at 2009 prices, for sea and coastal water transport and supporting activities was £423M and 4,700 respectively (Baxter et al, 2011). Cargo and passenger figures are published each year in the Scottish Transport Statistics and the Department for Transport Maritime Statistics. In 2009, 85.5 million tonnes of cargo was handled by all Scottish Ports and 10.5 million passengers were carried by ferries, with 15,222 vessels arriving at Scottish Ports during the same period. Over 67% of Scotland‟s total exports go out via Scottish ports, equating to 74 million tonnes each year (BPA, 2008). Information presented in the ONS report identifies that in 2009 circa 11,000 jobs, and in 2010 circa 10,000 jobs were directly related to the ports and harbours sector (ONS, 2011). The
Socio-economic Baseline Reviews for Offshore Renewables in Scottish Waters
R4032/3 43 R.1905
potential additional knock-on employment of up to 21,000 is a result of indirect and induced expenditure effects through the supply chain. These figures exclude employment generated by the fishing and offshore Oil and Gas sectors which represent a very significant contribution to the Scottish economy (BPA, 2008). Strongly related to the ports and harbours of Scotland is the shipbuilding industry which, in 2007, was worth £475m GVA with an estimated 5,800 jobs associated with building and repairing of vessels (Baxter et al, 2011). Scotland‟s shipbuilding sector is concentrated primarily on the manufacture and support of naval ships and specialist, more complex vessels for niche markets. Overall there are some 100 Scottish companies engaged in ship and boat building, with over 1,500 companies in the supply chain. It should be noted that almost 90 per cent of these 100 businesses were small firms with less than 25 employees (BPA, 2008). The Oil and Gas industry is a significant economic contributor to Scottish Ports. It is estimated that Oil and Gas production in the UK currently supports about 207,000 jobs in the supply chain, 40 per cent of which are in Scotland. Using turnover figures relating to exports, it is estimated that direct export activity from the supply chain could be supporting a further 100,000 UK jobs. Scotland is also an important UK and European cruise destination and conservative estimates suggest that the cruise industry supports more than 800 employees, generating £23m GVA to the Scottish economy each year (BPA, 2008). Of all the activities which take place at ports and harbours in Scotland, fishing is the most common and has therefore been considered under its own heading namely the commercial fishing sections of this report. Ferry traffic has historically been an important aspect of Scottish port activity, this includes International, National and local services (BPA, 2008). Smaller scale local ferry services, mainly between the Scottish mainland and outlying islands provide an important lifeline for residents. This service also opens a gateway for tourists to visit areas that might be otherwise inaccessible by car or train. Examples of this type of link include services provided by Caledonian MacBrayne, Orkney Ferries Ltd, Northlink Ferries and Shetland Islands Council. As an example, Northlink Ferries services between Aberdeen and Lerwick and Kirkwall carry circa 140,000 passengers each year. This gives considerable economic and social benefits to both the port and harbour operators as well as the surrounding area, allowing for the movement of commercial traffic, local passenger traffic and growing numbers of tourists and visitors (BPA, 2008). Leisure moorings remain an important business income for many Scottish ports and help to support many businesses situated around harbours and marinas. In 2006/07 the Scottish recreational boating industry had an estimated turnover of £99m. This represented a contribution to the economy of £35.3m. Studies have illustrated that each job in the core coastal marina sector supports a further 12 jobs in the local economy as a result of visitor and employee expenditures in the wider economy (Source: „Trends, developments and environment‟, British Marine Federation, at Coastal Futures, 2008 conference 23rd January 2008, SOAS London). Many ports are examining the possibility of expanding so investment is generally concentrated on enhancing and refurbishing existing facilities (BPA, 2008).
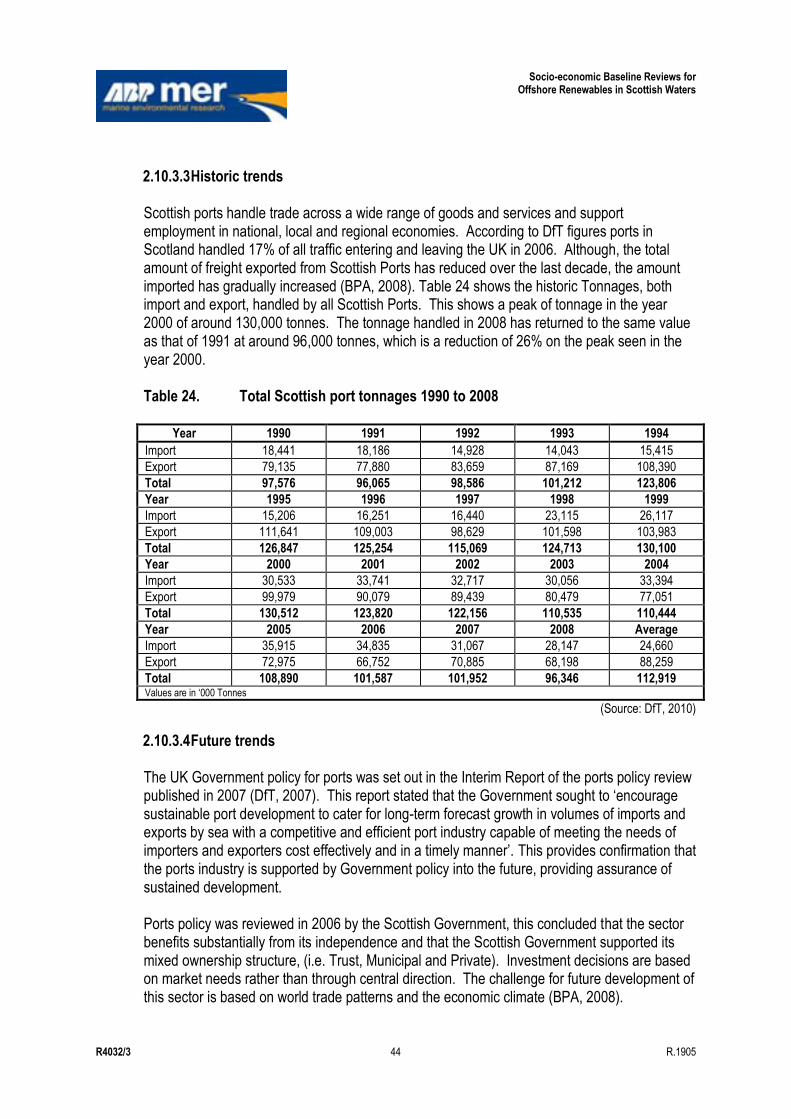
Socio-economic Baseline Reviews for Offshore Renewables in Scottish Waters
R4032/3 44 R.1905
2.10.3.3 Historic trends Scottish ports handle trade across a wide range of goods and services and support employment in national, local and regional economies. According to DfT figures ports in Scotland handled 17% of all traffic entering and leaving the UK in 2006. Although, the total amount of freight exported from Scottish Ports has reduced over the last decade, the amount imported has gradually increased (BPA, 2008). Table 24 shows the historic Tonnages, both import and export, handled by all Scottish Ports. This shows a peak of tonnage in the year 2000 of around 130,000 tonnes. The tonnage handled in 2008 has returned to the same value as that of 1991 at around 96,000 tonnes, which is a reduction of 26% on the peak seen in the year 2000. Table 24. Total Scottish port tonnages 1990 to 2008
Year 1990 1991 1992 1993 1994
Import 18,441 18,186 14,928 14,043 15,415
Export 79,135 77,880 83,659 87,169 108,390
Total 97,576 96,065 98,586 101,212 123,806
Year 1995 1996 1997 1998 1999
Import 15,206 16,251 16,440 23,115 26,117
Export 111,641 109,003 98,629 101,598 103,983
Total 126,847 125,254 115,069 124,713 130,100
Year 2000 2001 2002 2003 2004
Import 30,533 33,741 32,717 30,056 33,394
Export 99,979 90,079 89,439 80,479 77,051
Total 130,512 123,820 122,156 110,535 110,444
Year 2005 2006 2007 2008 Average
Import 35,915 34,835 31,067 28,147 24,660
Export 72,975 66,752 70,885 68,198 88,259
Total 108,890 101,587 101,952 96,346 112,919 Values are in „000 Tonnes
(Source: DfT, 2010)
2.10.3.4 Future trends The UK Government policy for ports was set out in the Interim Report of the ports policy review published in 2007 (DfT, 2007). This report stated that the Government sought to „encourage sustainable port development to cater for long-term forecast growth in volumes of imports and exports by sea with a competitive and efficient port industry capable of meeting the needs of importers and exporters cost effectively and in a timely manner‟. This provides confirmation that the ports industry is supported by Government policy into the future, providing assurance of sustained development. Ports policy was reviewed in 2006 by the Scottish Government, this concluded that the sector benefits substantially from its independence and that the Scottish Government supported its mixed ownership structure, (i.e. Trust, Municipal and Private). Investment decisions are based on market needs rather than through central direction. The challenge for future development of this sector is based on world trade patterns and the economic climate (BPA, 2008).
Socio-economic Baseline Reviews for Offshore Renewables in Scottish Waters
R4032/3 45 R.1905
The Scottish Government is formulating a National Planning Framework. This for the first time identifies important Scottish „National Development‟ infrastructure projects that will be rolled out up to 2030. The Scottish Government has said that its economic strategy requires a planning framework that supports sustainable economic growth across Scotland. Of the nine proposed National Developments three are large projects specifically related to the ports industry (BPA, 2008). Scotland‟s National Transport Policy states that “An effective road and rail infrastructure to support national and international connections by sea is essential to ensure that the critical role of ports in supporting and contributing to Scotland‟s business and economic health is fully realised “Future areas of possible development are international transhipment, feeder services and short sea shipping”. Also, “We will continue to support UK and international ferry routes including routes to Northern Ireland, Ireland, mainland Europe and beyond” (Scottish Executive, 2006b). The importance of the Oil and Gas industry to the Ports industry within Scotland, specifically ports on the East Coast, Shetland and Orkney Isles, provide a close tie between these two sectors. Although the North Sea fields are considered to be „mature‟ having produced 36 billion boe, estimates suggest that there may be another 25 million boe available. Operators who specialise in extracting Oil and Gas from the more mature fields have purchased several of these assets from the oil majors. This has seen higher investment levels for some older fields with increased production being achieved (BPA, 2008). The long term stability of extraction levels past 2020 is uncertain. However, the centre of excellence and expertise established in North East Ports has generated global trade in Oil and Gas equipment manufactured or services. Aberdeen Harbour (for example) already has three scheduled services to West African Oil and Gas producing countries and regularly handles other energy related cargoes to and from many other worldwide destinations (BPA, 2008). The increase in offshore renewable activities provides a potential source of income for ports. This is both as a base for industrial processes including manufacture of offshore renewable devices, and as a service provider for the craft needed to install and maintain offshore renewable sites during the construction and operation. Market potential is driven by the location of offshore renewable developments, and the accessibility of ports for the types of craft involved in installation and maintenance activities. The future use, growth and development of Ports are intrinsically linked to world trade patterns and the economic climate, and are reactive to changing economic circumstances. Government policy continues to support the mixed ownership structure already established, with Government backing for National Infrastructure projects, all of which provides incentives to develop Port facilities. Many Ports in Scotland have identified opportunities around the developing marine renewables industry, which has the potential to change the landscape of Port services, size and increase marine traffic volumes in response to renewable energy site locations
Socio-economic Baseline Reviews for Offshore Renewables in Scottish Waters
R4032/3 46 R.1905
2.11 Power Interconnectors
2.11.1 Definition of Sector/Activity This sector is concerned with the transmission of power through submarine cables, including international, national and inter-island links. This assessment excludes power cables to/from individual developments (e.g. power supplies to Oil and Gas installations, export cables from OWFs).
2.11.2 Description of Information Sources The data available on submarine cables, and in-particular power cables, is limited. Information which has been accessed to inform this baseline includes published reports, spatial data layers and other specific information provided through stakeholder engagement (Table 25). Table 25. Information sources for power interconnectors baseline
Scale Information Available Date Source
Scotland All pipelines and cables Current SeaZone Solutions Ltd
Scotland Power cables (submarine electricity cables) Current Baxter et al, 2011
Scotland Potential future subsea cable developments / reinforcements
2009 National Planning Framework for Scotland Annex National development 11 (Scottish Government, 2009b)
UK and Scotland
Interconnector projects in the public domain 2011 Saunders et al, 2011; Refabrica website: www.refabrica.com/einter/?page_id=157
2.11.2.1 Data limitations Although the location of power cables is known, information on installation and use is hard to come by. In addition, it is difficult to calculate an economic value for a cable as there is no agreed methodology available. The approaches used at present will either result in a under or over estimation of the actual value of the cables (ABPmer and RPA, 2011).
2.11.3 National Overview of Current Activity 2.11.3.1 Location and intensity of activity There are 900km of submarine power cables in Scottish waters (Baxter et al, 2011) predominately created to connect island communities to the mainland national grid infrastructure (UKMMAS, 2010). This is reflected in Figure 18 which shows subsea grid infrastructure connections in inshore waters between areas of mainland Scotland and between the mainland and islands in all SORERs except the North East SORER. Note, subsea power cables to/from developments (e.g. Oil and Gas platforms) are not shown in Figure 18a.

Socio-economic Baseline Reviews for Offshore Renewables in Scottish Waters
R4032/3 47 R.1905
2.11.3.2 Economic value and employment There is no agreed methodology for calculating the economic value of subsea power cables. In the absence of information on economic value, the capacity of interconnector cables may be used as an indicator of both value and activity (UKMMAS, 2010). The Moyle (Scotland-Northern Ireland) interconnector, linking Auchencrosh in Ayrshire to Islanmagee, County Antrim is the only international marine power interconnector originating in the West SORER. There is little information on the number of people directly employed within this sector. 2.11.3.3 Historic trends The only international interconnector in the study area is the Moyle Interconnector between Scotland and Northern Ireland with a capacity of 400Mw which went into commercial operation in early 2002. 2.11.3.4 Future trends Future increases in offshore marine renewables and the need to bring power onshore will likely drive the development of offshore grid network / interconnectors. UKMMAS (2010) reported that over the period 2007-12 the Office of the Gas and Electricity Markets (Ofgem) provided for capital investment of up to £4.3 billion in the electricity transmission network, an increase of 160% over the previous 5-year price control period, with much of this investment planned for Scotland. The Scottish National Planning Framework 2 (Scottish Government, 2009b) identifies „electricity grid reinforcements‟ as one of the fourteen national developments essential to the delivery of the spatial strategy set out in the second National Planning Framework. The strategic grid reinforcements are essential to provide the transmission capacity necessary to realise the potential of Scotland‟s renewable energy sources, maintain long-term security of electricity supply and support sustainable economic development. This development would occur throughout Scotland, from the English border to the Shetland Islands and, in relation to marine power interconnectors, would include: Reinforcement of the sub-sea cable link between Orkney and the Scottish mainland;
and New sub-sea cable links for the Outer Hebrides and the Shetland Islands. In addition, there are a number of proposed marine power interconnector developments in the UK at various stages of maturity in the planning process. Those that are relevant to Scotland are shown in Table 26 and Figure 18b. If these developments proceed, they would significantly increase the length and capacity of interconnector and offshore grid cables compared to the current baseline. However, the nature and form of the overall development of the offshore grid remains uncertain particularly in the long-term (Saunders et al, 2011).
Socio-economic Baseline Reviews for Offshore Renewables in Scottish Waters
R4032/3 48 R.1905
Table 26. Proposed marine power cable developments in the UK relevant to Scotland
Connection Indicative
Length (km) Capacity
(MW) Comment
UK- Norway „North Connect‟ Information not found
1200-2000
Co-operation agreement signed in February 2011. Expected to be operational before 2020 (Saunders et al, 2011).
Scotland - England „Western HVDC Link‟
370 2000
Preferred Option (Connah‟s Quay to Hunterston) consultation 2011. Expected to be operational in 2015. Estimated cost £1385 million (Electricity Networks Strategy Group, 2009).
Shetland Orkney and East Coast of England „East Coast Transmission Network‟
>2000 1000 MW network
Feasibility study undertaken in 2008; vision for 2020 (Saunders et al, 2011).
East coast of England-Scotland Eastern HDVC Link
Information not found
1800
Peterhead to Hawthorne Pit. Target completion date 2018. Estimated cost £700million (Electricity Networks Strategy Group, 2009).
(Source: Saunders et al, 2011; Refabrica website: www.refabrica.com/einter/?page_id=157)
2.12 Recreational Boating
2.12.1 Definition of Sector/Activity For the purpose of this study, recreational boating is considered to include recreational activities undertaken in medium and large sailing vessels, yachts, powerboats and motorboats. Information on small sailing boat activity such as dinghies (usually taken out of water at end of use) and other types of water sports can be seen in Section 18. It is possible that general tourism values may overlap with values specifically associated with recreational activities. General tourism is described in other sections of this report as the interactions and issues in relation to marine renewable developments are often distinctly different. There is some possibility of a degree of double counting using this approach but not to the extent that it materially affects the results of the study, i.e. a variety of studies focusing specifically on recreation provide a good understanding on current value, distribution and intensity of the sector in the SORERs.
2.12.2 Description of Information Sources A variety of different information sources has been reviewed to inform this baseline, including published reports and papers, spatial layers and information provided through stakeholder engagement (Table 27).
Socio-economic Baseline Reviews for Offshore Renewables in Scottish Waters
R4032/3 49 R.1905
Table 27. Data sources used in the recreational boating baseline
Scale Information Available Date Source
Scotland Statistics on sailing tourism No date Tourism Resources Company et al (2010)
All Regions
Number of resident home berths Number of visiting berths Proportion of total Scotland berths Demand for home berths (occupancy) Visiting craft demand for berths Average annual spend per boat (high, medium and low) Direct expenditure Multipliers (from Scottish Tourism Multiplier Study) Visiting boat nights Visiting boat expenditure Employment Gross Value Added
No date Tourism Resources Company et al (2010)
Scotland Sailing area value and berth numbers No date Baxter et al (2011)
Scotland RYA cruising routes and sailing areas No date Baxter et al (2011)
2.12.2.1 Data limitations The published information on cruising and sailing routes is indicative and there is a lack of reliable data on the actual routes taken by recreational vessels. There is also a lack of information on vessel numbers passing along particular routes. Information on the economic value of recreational boating is only available at a regional scale. There is limited information on historical trends in activity and the level of future activity is uncertain, as it is largely dependent on the overall performance of the national economy.
2.12.3 National Overview of Current Activity 2.12.3.1 Location and intensity of activity The UK Atlas of Recreational Boating (RYA, 2005) and data from the Royal Yachting Association (RYA) indicates that recreational boating within Scotland is concentrated in the Clyde and along the West Coast, the Moray Firth, Solway Firth and the Firths of Tay and Forth which are the traditional cruising grounds for recreational sailors and power boaters. However, recent developments along the East Coast, and within the Orkney and Shetland Isles have increased the potential for cruising routes between the Caledonian Canal and the Shetlands with well placed facilities and stopping points en route. The main cruising routes and areas of greatest sailing and racing use are described in further detail for each region below16. The RYA‟s Position Statement on offshore energy developments (RYA, 2009), which encompasses the whole of the UK, notes that most of the general day sailing and racing areas are close to the shore, see Figure 19.
16 The cruising routes shown in the RYA Atlas give the typical routes followed by recreational sailors at the present
time. Routes may change in future due to new developments (e.g. marinas), changes in wind patterns or increased shipping traffic (Graham Russell, RYA Scotland, pers. comm. 18 Jan 2011).
Socio-economic Baseline Reviews for Offshore Renewables in Scottish Waters
R4032/3 50 R.1905
Indicative estimates of the number of people participating in sailing and power/motor boating activities in Scotland can be taken from the British Marine Federation (BMF) Water sports and Leisure Participation Survey 2009 (BMF et al., 2009). This report estimated that in 2009, 57,047 people participated in sailboat activities and/or yacht cruising, 12,486 participated in sailboat and/or yacht racing and that 49,015 engaged in motor boating/ cruising or canal boating in the Border and Scotland ITV regions17. 2.12.3.2 Economic value and employment The Scottish Coast, and particularly the West coast, is identified as being one of the World's premier destinations for sailing. Recreational boating and marine and sailing tourism contribute about £300 million to the Scottish economy18. Overall, the sector is expected to grow in the long term (UKMMAS, 2010). An assessment of the current economic impact of sailing in Scotland was undertaken by Scottish Enterprise (2010) and a summary is shown below in Table 28. The study indicated that there is a total berthing/mooring capacity available across Scotland for 12,500 vessels. The study stated that the value of the market could increase from its current value of £101 million to £145 million after 10 years. The same report also provided a breakdown of the economic value of sailing and the number of berths in different regions of Scotland and these results are described in each of the relevant regional sections below. Table 28. Economic impact of sailing in Scotland
Activity Total Activity (by Scottish and
Non-Scottish Boat Owners) Tourist Activity
(by Non-Scottish Boat Owners Only)
Expenditure £101.3million £27.0 million
Employment (FTEs) 2,732 724
GVA £53.0million £14.0million
(Source: Scottish Enterprise, 2010)
In Scotland, the BMF estimates that in 2009/10 the total turnover of the leisure, super yacht and small commercial marine industry was £92.7million (BMF, 2010). Of this, the 'value added contribution' which is the principal measure of national economic benefit was £29.2million. This study focuses more on business values (such as boat building, specialised equipment manufacture, sales, training, consumer services, insurance services and finance) then the Scottish Enterprise (2010) study which is focused much more on expenditure related values of boat owners and visiting tourists. The industry in Scotland supported around 1,579 FTE jobs. It should be noted that a proportion of this revenue comes from inland activities. UKMMAS
17 The Border and Scotland ITV Regions comprise the Grampian, Scottish and Border ITV Regions. Grampian
Television covers the North and North East of Scotland, Scottish Television covers Central Scotland and Border Television covers the Dumfries and Galloway region, part of the south west area of Ayrshire, the Scottish Borders but also parts of Northumbria and most of Cumbria in England.
18 Cited in the RYA Scotland‟s and the SBA‟s Offshore Wind SEA consultation responses. This value was based on a report by Scottish Enterprise (2006) (Mike Balmforth, SBA, pers. comm. 18 Jan 2011). This report estimated that the annual economic impact of the marine leisure industry in Scotland was £250 million, supporting around 7,000 jobs.
Socio-economic Baseline Reviews for Offshore Renewables in Scottish Waters
R4032/3 51 R.1905
(2010) estimated that 62% of the total value in 2006/07 related to the marine environment. Using the same proportion, the indicative total value related to the marine environment in 2009/10 was £57.5million. No national employment figures derived from the Business Register and Employment Survey (using UK SIC codes) have been included for activities relating to recreational boating. This is because the codes are for the entire sports sector and don't permit disaggregation to a useful level. 2.12.3.3 Historical trends Over the past 15 years, prior to the recent recession, the Scottish sailing tourism sector has grown rapidly. New marinas and expansions of existing facilities have been developed and absorbed by the market with marinas and other berthing sources filled up and boat ownership in the UK and overseas growing, generating increasing economic activity (Scottish Enterprise, 2010). In the UK there is no official, definitive, boat ownership data collated by any organisation. Table 29 presents an estimate of the annual growth in marina operations, as compiled and reported by the British Marine Federation (BMF) from a number of anonymous sources. Table 29. Estimate of annual compound growth in 'core' marina operations
Area Growth over 10 Year
Timeframe(2000 - 2009) Growth over 5 Year
Timeframe(2004 - 2009)
Clyde 6.1% 7.6%
West 7.0% 5.6%
North & East (including PFOW area) 4.7% 7.0%
(Source: Scottish Enterprise, 2010)
2.12.3.4 Future trends UKMMAS (2010) reports that whilst marine recreation has experienced recent growth, future growth and stability of the sector is dependant upon the general health of the UK economy. A strong economy results in consumers having more disposable income to spend on leisure and recreation activities. As a result of the recent global economic downturn, it is likely there will be some short-term decreases in participation in recreational activities. However, with infrastructure and technology in place to support the sector, it is expected to continue to grow over the long term. Scotland‟s Marine Atlas (Baxter et al., 2011) comments that despite the recent downturn in the global economy, and subsequent reduction in disposable incomes, the recreational sector could have the potential to play an increasingly significant role in Scotland‟s rural economy. This is evidenced by the recent development of marina facilities at Wick, and the Orkney Islands. Combined with active marketing by marina owners, and support from local authorities (such as Orkney Island‟s Council as seen in recent developments) the potential for future growth is apparent.
Socio-economic Baseline Reviews for Offshore Renewables in Scottish Waters
R4032/3 52 R.1905
Climate change may also play a small part in increasing overall participation numbers. As the frequency of months when conditions are more comfortable for tourism in North-West Europe (MCCIP, 2008) improve, the warmer weather is more likely to attract visitors to coastal locations in Scotland. The net result will be an extension of the tourist season beyond its traditional limits and opening up new destinations. Climate change as a positive influencing factor must be balanced against predictions of increased storminess, and the severity of storms. Provided increased storminess is predominantly in the winter months, this may not be a factor in future recreational boating trends. The Scottish Enterprise (2010) report concludes that as long as infrastructure (marinas and shore side facilities) continue to attract investment, resident berthing could increase by 3-5% per annum. The growth potential in visitor berthing is projected at up to 5% per annum. Both of these projects bring an associated increase in expenditure into the local economy.
2.13 Shipping
2.13.1 Definition of Sector/Activity Shipping provides for the transport of freight and passengers both within Scottish waters and internationally. Commercial shipping routes can be split into two distinct types; transiting vessels passing through Scottish Waters and vessels with either their origin or destination port within Scotland. The movement of vessels is monitored and recorded by the Maritime and Coastguard Agency (MCA) and individual port authorities. Table 30 provides a list of the data sources used.
2.13.2 Description of Information Sources Table 30. Data sources used in the shipping baseline
Scale Information Available Date Source
Scotland
Number of passengers, cars and commercial vehicles on ferries (graph), Shipping traffic: number of vessels in a given area during 1st week of January 2010 (map), AIS regional maps,
2005-2010
Baxter et al ,2011 The Scottish Government 2011 „Scotland‟s Marine Atlas - Information for the National Marine Plan‟, March 2011
Scotland Scottish Transport Statistics 2009 Scottish Government, 2009a
Scotland Scottish Transport Statistics 2010 Scottish Government, 2010b
Scotland DfT Maritime Transport Statistics Compendium
2010 DfT, 2010
Regional Regional scale AIS density maps 2005-
present
Maritime and Coastguard Agency (MCA) - Direct contact with MCA Office: http://www.dft.gov.uk/mca/mcga07-home/aboutus/contact07/mcga-atoz.htm
2.13.2.1 Data limitations
There are no readily available data sets providing a quantifiable measure of vessels transiting through Scottish waters. The movement of vessels is monitored and recorded by the Maritime and Coastguard Agency (MCA), Lloyds List Intelligence and other local organisations.
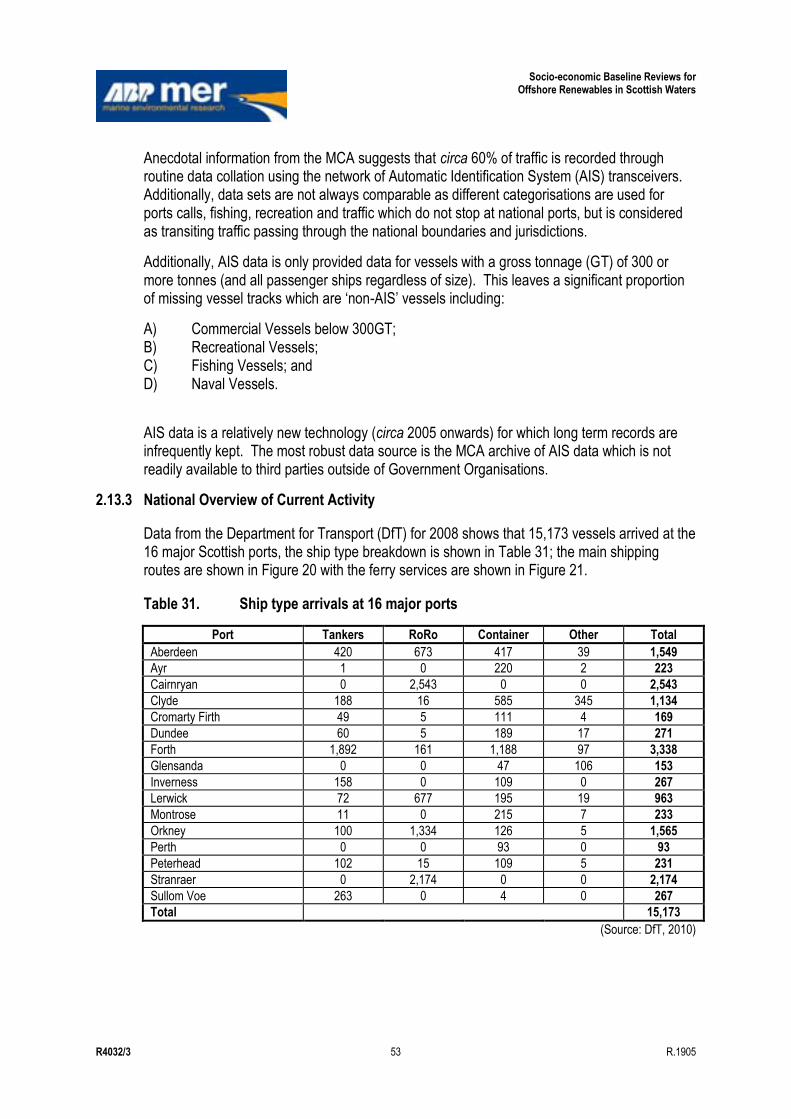
Socio-economic Baseline Reviews for Offshore Renewables in Scottish Waters
R4032/3 53 R.1905
Anecdotal information from the MCA suggests that circa 60% of traffic is recorded through routine data collation using the network of Automatic Identification System (AIS) transceivers. Additionally, data sets are not always comparable as different categorisations are used for ports calls, fishing, recreation and traffic which do not stop at national ports, but is considered as transiting traffic passing through the national boundaries and jurisdictions.
Additionally, AIS data is only provided data for vessels with a gross tonnage (GT) of 300 or more tonnes (and all passenger ships regardless of size). This leaves a significant proportion of missing vessel tracks which are „non-AIS‟ vessels including:
A) Commercial Vessels below 300GT; B) Recreational Vessels; C) Fishing Vessels; and D) Naval Vessels.
AIS data is a relatively new technology (circa 2005 onwards) for which long term records are infrequently kept. The most robust data source is the MCA archive of AIS data which is not readily available to third parties outside of Government Organisations.
2.13.3 National Overview of Current Activity
Data from the Department for Transport (DfT) for 2008 shows that 15,173 vessels arrived at the 16 major Scottish ports, the ship type breakdown is shown in Table 31; the main shipping routes are shown in Figure 20 with the ferry services are shown in Figure 21.
Table 31. Ship type arrivals at 16 major ports
Port Tankers RoRo Container Other Total
Aberdeen 420 673 417 39 1,549
Ayr 1 0 220 2 223
Cairnryan 0 2,543 0 0 2,543
Clyde 188 16 585 345 1,134
Cromarty Firth 49 5 111 4 169
Dundee 60 5 189 17 271
Forth 1,892 161 1,188 97 3,338
Glensanda 0 0 47 106 153
Inverness 158 0 109 0 267
Lerwick 72 677 195 19 963
Montrose 11 0 215 7 233
Orkney 100 1,334 126 5 1,565
Perth 0 0 93 0 93
Peterhead 102 15 109 5 231
Stranraer 0 2,174 0 0 2,174
Sullom Voe 263 0 4 0 267
Total 15,173
(Source: DfT, 2010)
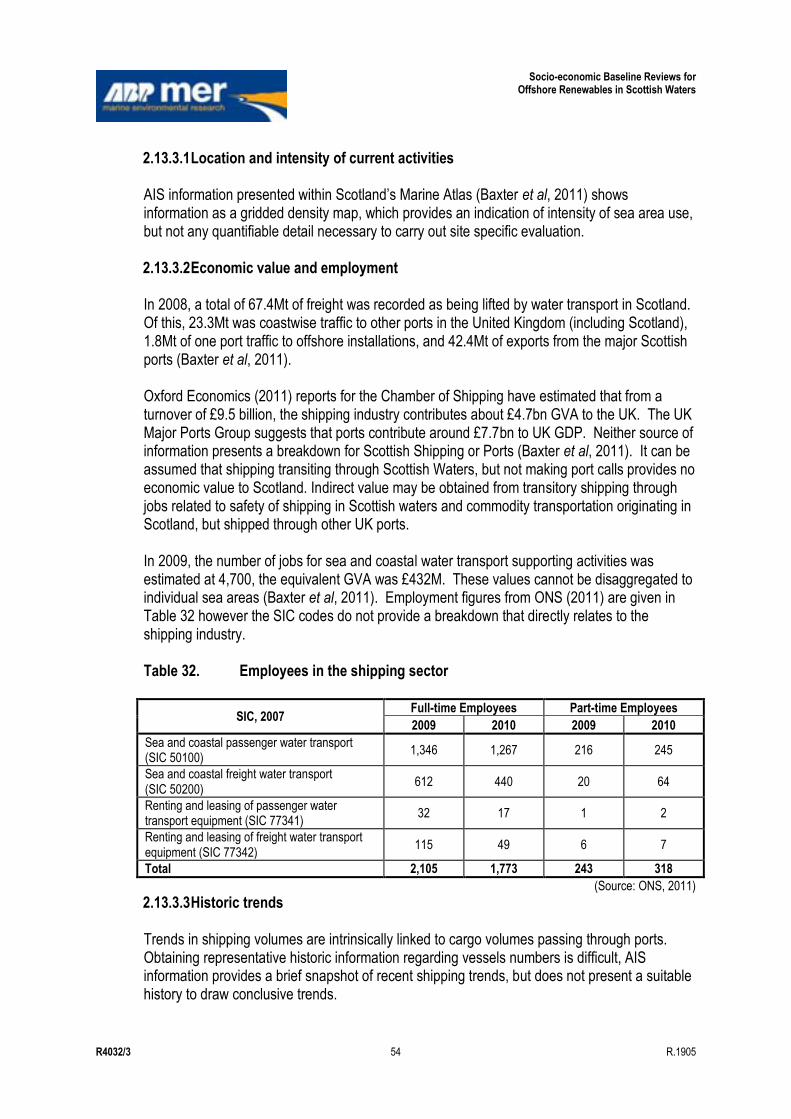
Socio-economic Baseline Reviews for Offshore Renewables in Scottish Waters
R4032/3 54 R.1905
2.13.3.1 Location and intensity of current activities AIS information presented within Scotland‟s Marine Atlas (Baxter et al, 2011) shows information as a gridded density map, which provides an indication of intensity of sea area use, but not any quantifiable detail necessary to carry out site specific evaluation. 2.13.3.2 Economic value and employment In 2008, a total of 67.4Mt of freight was recorded as being lifted by water transport in Scotland. Of this, 23.3Mt was coastwise traffic to other ports in the United Kingdom (including Scotland), 1.8Mt of one port traffic to offshore installations, and 42.4Mt of exports from the major Scottish ports (Baxter et al, 2011). Oxford Economics (2011) reports for the Chamber of Shipping have estimated that from a turnover of £9.5 billion, the shipping industry contributes about £4.7bn GVA to the UK. The UK Major Ports Group suggests that ports contribute around £7.7bn to UK GDP. Neither source of information presents a breakdown for Scottish Shipping or Ports (Baxter et al, 2011). It can be assumed that shipping transiting through Scottish Waters, but not making port calls provides no economic value to Scotland. Indirect value may be obtained from transitory shipping through jobs related to safety of shipping in Scottish waters and commodity transportation originating in Scotland, but shipped through other UK ports. In 2009, the number of jobs for sea and coastal water transport supporting activities was estimated at 4,700, the equivalent GVA was £432M. These values cannot be disaggregated to individual sea areas (Baxter et al, 2011). Employment figures from ONS (2011) are given in Table 32 however the SIC codes do not provide a breakdown that directly relates to the shipping industry. Table 32. Employees in the shipping sector
SIC, 2007 Full-time Employees Part-time Employees
2009 2010 2009 2010
Sea and coastal passenger water transport (SIC 50100)
1,346 1,267 216 245
Sea and coastal freight water transport (SIC 50200)
612 440 20 64
Renting and leasing of passenger water transport equipment (SIC 77341)
32 17 1 2
Renting and leasing of freight water transport equipment (SIC 77342)
115 49 6 7
Total 2,105 1,773 243 318
(Source: ONS, 2011)
2.13.3.3 Historic trends Trends in shipping volumes are intrinsically linked to cargo volumes passing through ports. Obtaining representative historic information regarding vessels numbers is difficult, AIS information provides a brief snapshot of recent shipping trends, but does not present a suitable history to draw conclusive trends.
Socio-economic Baseline Reviews for Offshore Renewables in Scottish Waters
R4032/3 55 R.1905
If cargo handling volumes for ship borne (waterborne) freight are used as a proxy for shipping numbers, the volume of freight for all categories (coastwise, one port and foreign traffic; both incoming and outgoing) passing through the ports fell by 5.5% in 2008 to 67.4Mt, this was 23% less than in 1998. In 2008, exports accounted for 44% of the total freight through Scottish ports and domestic traffic (either coastwise or one port) accounted for a quarter. Imports and incoming domestic freight were much lower, together accounting for 27% of the total freight through Scottish ports. However it must be noted that cargo volumes do not directly relate to shipping numbers as changes in ship size and technology have allowed greater volumes of cargo to be carried by fewer, faster ships. This is most notable in the containerisation market, where upsizing has lead to a reduction of port calls, and a move towards „hub and spoke‟ services. The introduction of ever-larger container ships has reduced the number of ports at which these ships can call, providing a notable growth in transhipment to medium and smaller ports. Historically, container port throughput has increased up to three times as fast as GDP. This trend has been affected by the global down-turn, however this correlation between GDP and container port throughput continues, albeit at a reducing level. 2.13.3.4 Future trends Shipping volumes bear a direct relationship to the global economic market. As markets react to the changing financial situation, shipping lines respond with services to move goods and people. The most notable variable to affect the volume and intensity of shipping into the future will be the technology and innovations used to design future shipping. Ship design seeks for bigger, faster and more economic transhipment of goods and people. The introduction of bigger ships places expectations that existing ports will increase the depth of water in entrance channels and alongside berths to accommodate changing ship requirements. This implies that investment is necessary in port infrastructure, both in terms of shore side facilities and access to the ports. Channel widths may need to increase to take account of the wider ship beam, which in addition may lead to the requirement for turning circles to be enlarged to take account of greater vessel length. Although all of these pressures have to be taken into account, probably the most significant factor to challenge traditional ports in the context of their ability to accommodate bigger ships is sea access, and in particular vessel draught. New future shipping routes may also lead to shipping increases, especially in respect to the potential for a viable North West passage The established North Sea and English Channel SOx Emission Control Area (SECA) provides an ongoing cause for future concern (and possible reduction) in shipping operations. The applicable SOx limit in SECAs has reduced to 1.00% and will further reduce to 0.10 %, effective from 1 January 2015. Further progressive reductions are planned including nitrogen oxide (NOx) emissions with the most stringent controls installed on ships constructed after January 2016 operating in Emission Control Areas. This affects the viability of ships currently operating if their engine type cannot be modified, or the costs of modification cannot be absorbed into operating costs.
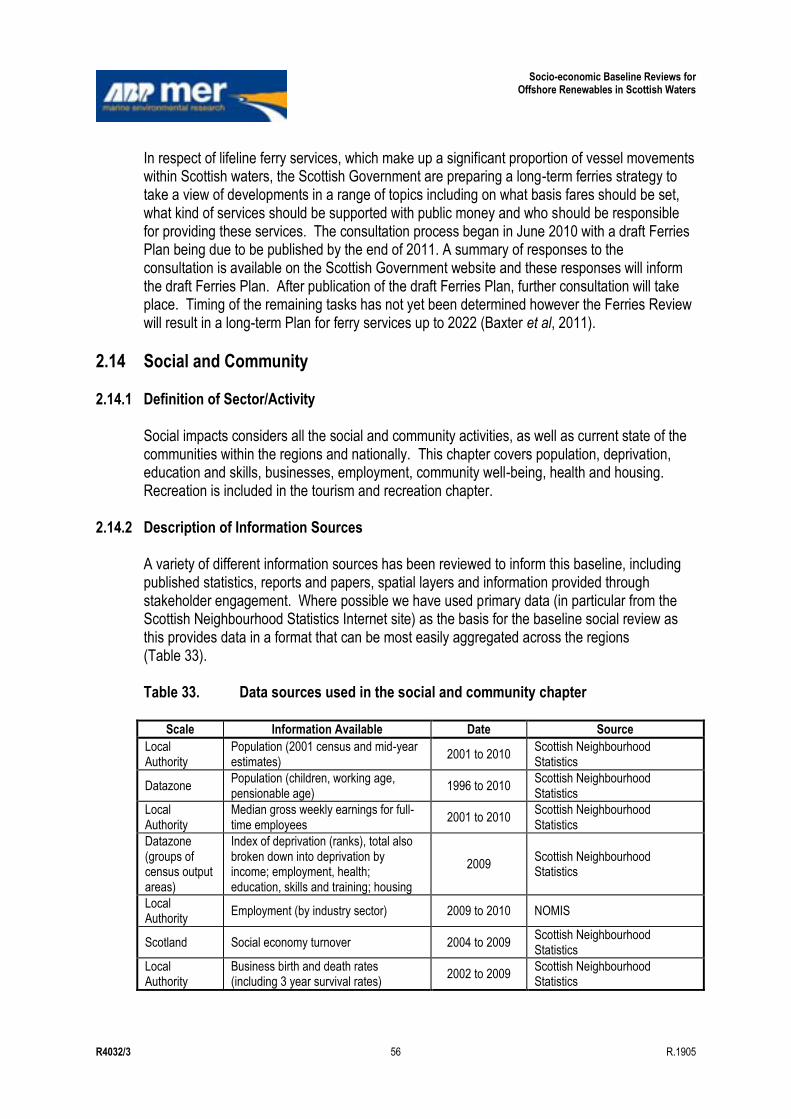
Socio-economic Baseline Reviews for Offshore Renewables in Scottish Waters
R4032/3 56 R.1905
In respect of lifeline ferry services, which make up a significant proportion of vessel movements within Scottish waters, the Scottish Government are preparing a long-term ferries strategy to take a view of developments in a range of topics including on what basis fares should be set, what kind of services should be supported with public money and who should be responsible for providing these services. The consultation process began in June 2010 with a draft Ferries Plan being due to be published by the end of 2011. A summary of responses to the consultation is available on the Scottish Government website and these responses will inform the draft Ferries Plan. After publication of the draft Ferries Plan, further consultation will take place. Timing of the remaining tasks has not yet been determined however the Ferries Review will result in a long-term Plan for ferry services up to 2022 (Baxter et al, 2011).
2.14 Social and Community
2.14.1 Definition of Sector/Activity Social impacts considers all the social and community activities, as well as current state of the communities within the regions and nationally. This chapter covers population, deprivation, education and skills, businesses, employment, community well-being, health and housing. Recreation is included in the tourism and recreation chapter.
2.14.2 Description of Information Sources A variety of different information sources has been reviewed to inform this baseline, including published statistics, reports and papers, spatial layers and information provided through stakeholder engagement. Where possible we have used primary data (in particular from the Scottish Neighbourhood Statistics Internet site) as the basis for the baseline social review as this provides data in a format that can be most easily aggregated across the regions (Table 33). Table 33. Data sources used in the social and community chapter
Scale Information Available Date Source
Local Authority
Population (2001 census and mid-year estimates)
2001 to 2010 Scottish Neighbourhood Statistics
Datazone Population (children, working age, pensionable age)
1996 to 2010 Scottish Neighbourhood Statistics
Local Authority
Median gross weekly earnings for full-time employees
2001 to 2010 Scottish Neighbourhood Statistics
Datazone (groups of census output areas)
Index of deprivation (ranks), total also broken down into deprivation by income; employment, health; education, skills and training; housing
2009 Scottish Neighbourhood Statistics
Local Authority
Employment (by industry sector) 2009 to 2010 NOMIS
Scotland Social economy turnover 2004 to 2009 Scottish Neighbourhood Statistics
Local Authority
Business birth and death rates (including 3 year survival rates)
2002 to 2009 Scottish Neighbourhood Statistics
Socio-economic Baseline Reviews for Offshore Renewables in Scottish Waters
R4032/3 57 R.1905
Scale Information Available Date Source
Local Authority
Self-assessed health rating 1999/00 to
2007/08 Scottish Neighbourhood Statistics
Local Authority
Average level of participation in sport 2007 to 2008 Scottish Neighbourhood Statistics
Scotland Community well-being (poverty) 1998/99 to
2007/08 Scottish Neighbourhood Statistics
Local Authority
Education level (education to degree level, percentage receiving job-related training, with low of no qualifications)
2004 to 2010 Scottish Neighbourhood Statistics
Local Authority
Percentage of population within 30 minutes drive time of a college of further of higher education
2001
Scottish Neighbourhood Statistics (although these are older data, they are the most reliable data found)
Local Authority
Stock of household spaces 2001
Scottish Neighbourhood Statistics (although these are older data, they are the most reliable data found)
Local Authority
House sale prices 1993 to 2010 Scottish Neighbourhood Statistics
Scotland House price to average earnings ratio 1990 to 2009 House of Commons (2010)
Local Authority
Drive time for access to services 2003 Scottish Neighbourhood Statistics
Local Authority
Percentage of adults who rate their neighbourhood as a very good place to live
1999/00 to 2007/08
Scottish Neighbourhood Statistics
Local Authority
Energy consumption 2005 to 2009 Scottish Neighbourhood Statistics
Scotland The Scottish Health Survey 1995-2010 Scottish National Statistics
Scotland Scottish House Condition Survey, Key Findings 2010
2002-2010 (varies by type
of statistic) Scottish National Statistics
Local Authority
Housing Statistics for Scotland 1997-2011 Scottish National Statistics
Scotland Summary Statistics for Schools in Scotland
2008-2011 Scottish National Statistics
Scotland Scottish Community Empowerment Action Plan
2009 Scottish Government & COSLA
Scotland Crofting income 2007 Hilliam (2007)
Scotland Crofting employment 2007-2010 Scottish Government (2010)
Scotland Sustainable Rural Communities in Crofting Areas
2007 Bryden (2007)
Scotland Community of Inquiry on Crofting 2008 RR Donnelly (2008)
Scotland The Contribution of Crofting 2007 Fiona & Mackenzie (2007)
2.14.2.1 Data limitations Key data limitations are described alongside the analysis of the data, below. There is a wealth of data available through the Scottish Neighbourhood Statistics site and associated reports that could be used to supplement the baseline descriptions included here. In addition, much of the data can be broken down into very detailed datazone level (where there are 6,505 data areas covering Scotland). As a result, this assessment is bottom-up and the key data limitations lie
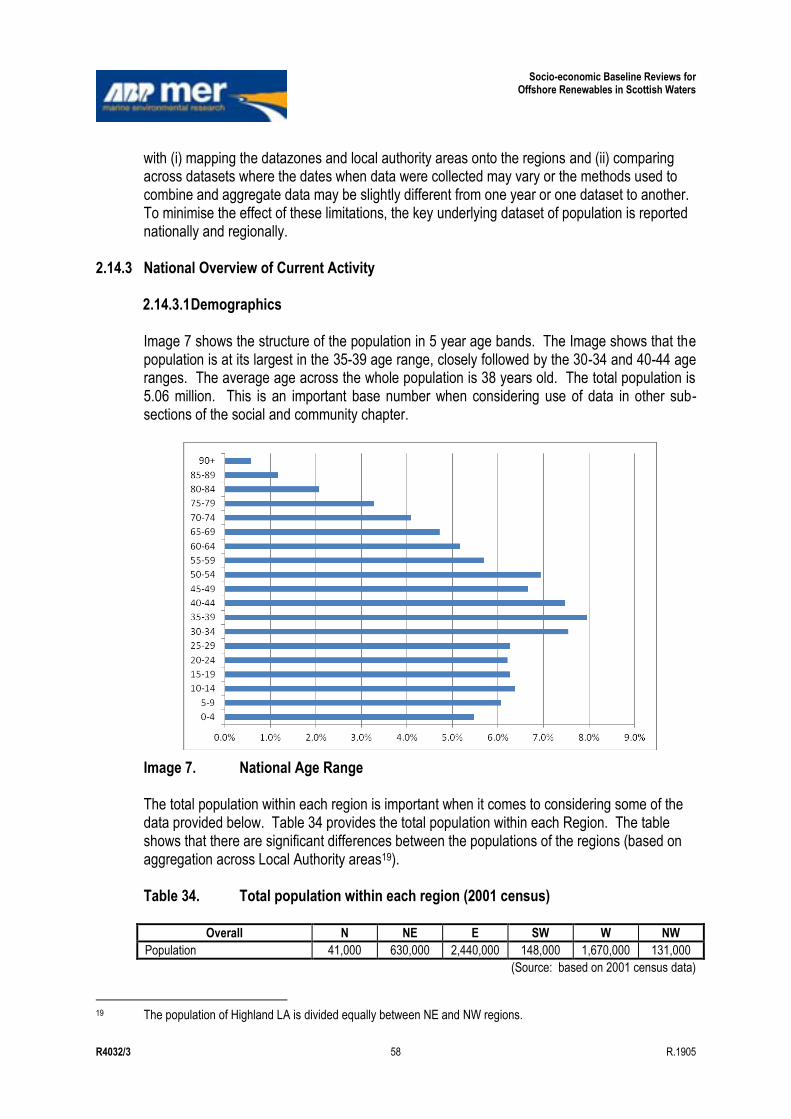
Socio-economic Baseline Reviews for Offshore Renewables in Scottish Waters
R4032/3 58 R.1905
with (i) mapping the datazones and local authority areas onto the regions and (ii) comparing across datasets where the dates when data were collected may vary or the methods used to combine and aggregate data may be slightly different from one year or one dataset to another. To minimise the effect of these limitations, the key underlying dataset of population is reported nationally and regionally.
2.14.3 National Overview of Current Activity 2.14.3.1 Demographics Image 7 shows the structure of the population in 5 year age bands. The Image shows that the population is at its largest in the 35-39 age range, closely followed by the 30-34 and 40-44 age ranges. The average age across the whole population is 38 years old. The total population is 5.06 million. This is an important base number when considering use of data in other sub-sections of the social and community chapter.
Image 7. National Age Range The total population within each region is important when it comes to considering some of the data provided below. Table 34 provides the total population within each Region. The table shows that there are significant differences between the populations of the regions (based on aggregation across Local Authority areas19). Table 34. Total population within each region (2001 census)
Overall N NE E SW W NW
Population 41,000 630,000 2,440,000 148,000 1,670,000 131,000
(Source: based on 2001 census data)
19 The population of Highland LA is divided equally between NE and NW regions.
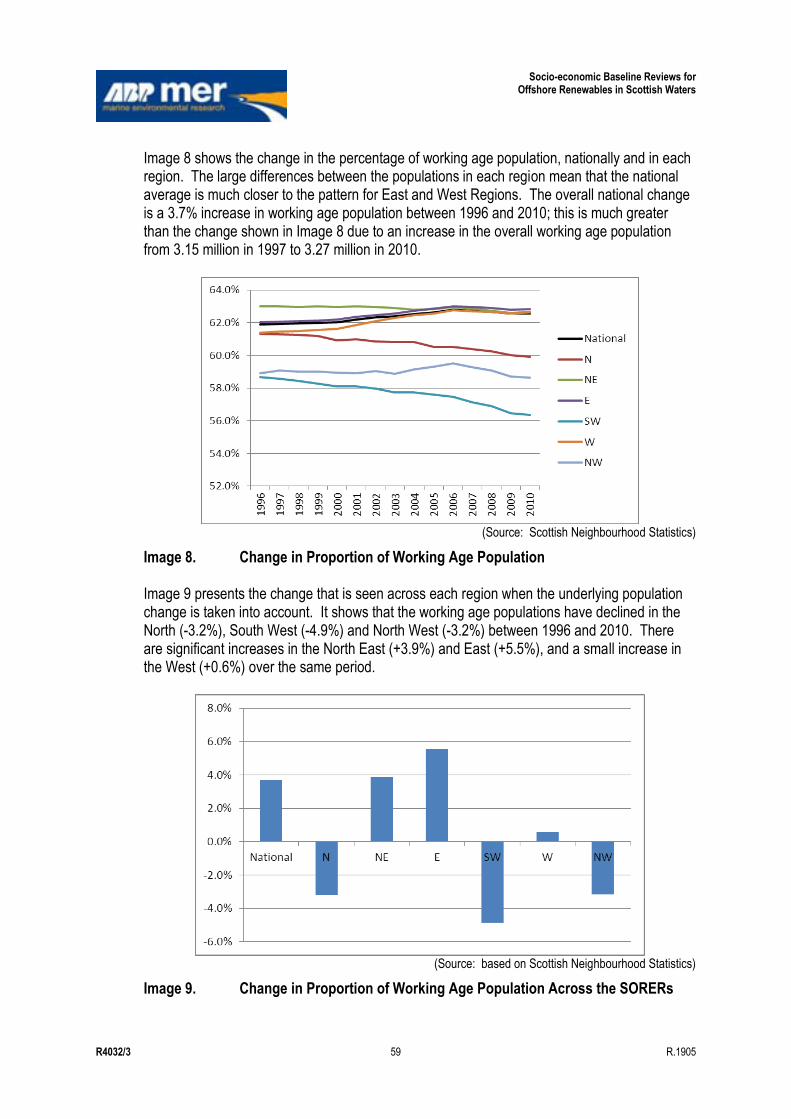
Socio-economic Baseline Reviews for Offshore Renewables in Scottish Waters
R4032/3 59 R.1905
Image 8 shows the change in the percentage of working age population, nationally and in each region. The large differences between the populations in each region mean that the national average is much closer to the pattern for East and West Regions. The overall national change is a 3.7% increase in working age population between 1996 and 2010; this is much greater than the change shown in Image 8 due to an increase in the overall working age population from 3.15 million in 1997 to 3.27 million in 2010.
(Source: Scottish Neighbourhood Statistics)
Image 8. Change in Proportion of Working Age Population Image 9 presents the change that is seen across each region when the underlying population change is taken into account. It shows that the working age populations have declined in the North (-3.2%), South West (-4.9%) and North West (-3.2%) between 1996 and 2010. There are significant increases in the North East (+3.9%) and East (+5.5%), and a small increase in the West (+0.6%) over the same period.
(Source: based on Scottish Neighbourhood Statistics)
Image 9. Change in Proportion of Working Age Population Across the SORERs
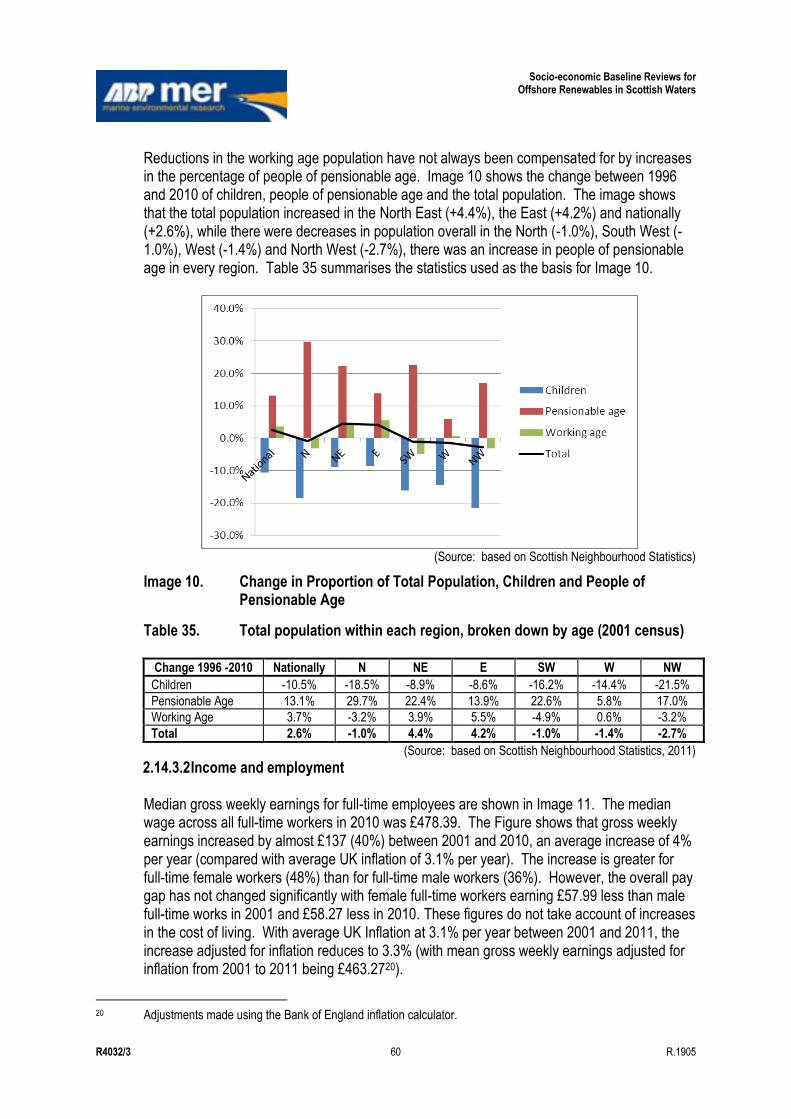
Socio-economic Baseline Reviews for Offshore Renewables in Scottish Waters
R4032/3 60 R.1905
Reductions in the working age population have not always been compensated for by increases in the percentage of people of pensionable age. Image 10 shows the change between 1996 and 2010 of children, people of pensionable age and the total population. The image shows that the total population increased in the North East (+4.4%), the East (+4.2%) and nationally (+2.6%), while there were decreases in population overall in the North (-1.0%), South West (-1.0%), West (-1.4%) and North West (-2.7%), there was an increase in people of pensionable age in every region. Table 35 summarises the statistics used as the basis for Image 10.
(Source: based on Scottish Neighbourhood Statistics)
Image 10. Change in Proportion of Total Population, Children and People of Pensionable Age
Table 35. Total population within each region, broken down by age (2001 census)
Change 1996 -2010 Nationally N NE E SW W NW
Children -10.5% -18.5% -8.9% -8.6% -16.2% -14.4% -21.5%
Pensionable Age 13.1% 29.7% 22.4% 13.9% 22.6% 5.8% 17.0%
Working Age 3.7% -3.2% 3.9% 5.5% -4.9% 0.6% -3.2%
Total 2.6% -1.0% 4.4% 4.2% -1.0% -1.4% -2.7%
(Source: based on Scottish Neighbourhood Statistics, 2011)
2.14.3.2 Income and employment Median gross weekly earnings for full-time employees are shown in Image 11. The median wage across all full-time workers in 2010 was £478.39. The Figure shows that gross weekly earnings increased by almost £137 (40%) between 2001 and 2010, an average increase of 4% per year (compared with average UK inflation of 3.1% per year). The increase is greater for full-time female workers (48%) than for full-time male workers (36%). However, the overall pay gap has not changed significantly with female full-time workers earning £57.99 less than male full-time works in 2001 and £58.27 less in 2010. These figures do not take account of increases in the cost of living. With average UK Inflation at 3.1% per year between 2001 and 2011, the increase adjusted for inflation reduces to 3.3% (with mean gross weekly earnings adjusted for inflation from 2001 to 2011 being £463.2720).
20 Adjustments made using the Bank of England inflation calculator.
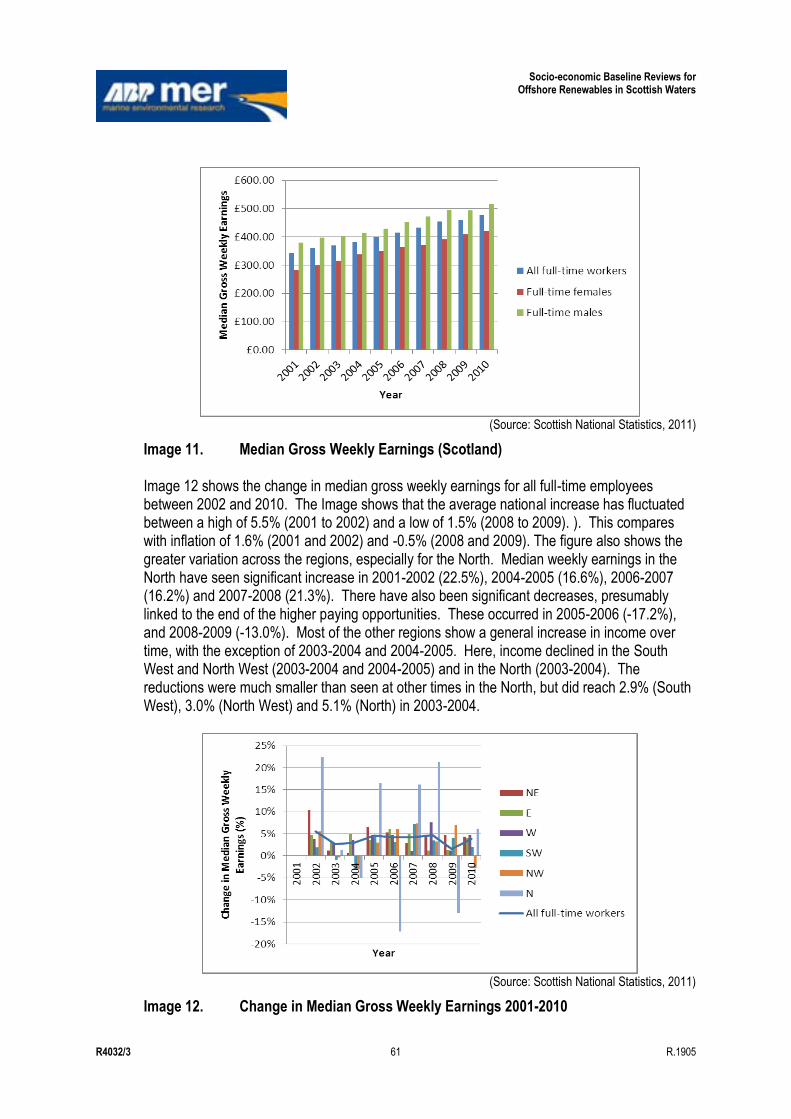
Socio-economic Baseline Reviews for Offshore Renewables in Scottish Waters
R4032/3 61 R.1905
(Source: Scottish National Statistics, 2011)
Image 11. Median Gross Weekly Earnings (Scotland) Image 12 shows the change in median gross weekly earnings for all full-time employees between 2002 and 2010. The Image shows that the average national increase has fluctuated between a high of 5.5% (2001 to 2002) and a low of 1.5% (2008 to 2009). ). This compares with inflation of 1.6% (2001 and 2002) and -0.5% (2008 and 2009). The figure also shows the greater variation across the regions, especially for the North. Median weekly earnings in the North have seen significant increase in 2001-2002 (22.5%), 2004-2005 (16.6%), 2006-2007 (16.2%) and 2007-2008 (21.3%). There have also been significant decreases, presumably linked to the end of the higher paying opportunities. These occurred in 2005-2006 (-17.2%), and 2008-2009 (-13.0%). Most of the other regions show a general increase in income over time, with the exception of 2003-2004 and 2004-2005. Here, income declined in the South West and North West (2003-2004 and 2004-2005) and in the North (2003-2004). The reductions were much smaller than seen at other times in the North, but did reach 2.9% (South West), 3.0% (North West) and 5.1% (North) in 2003-2004.
(Source: Scottish National Statistics, 2011)
Image 12. Change in Median Gross Weekly Earnings 2001-2010
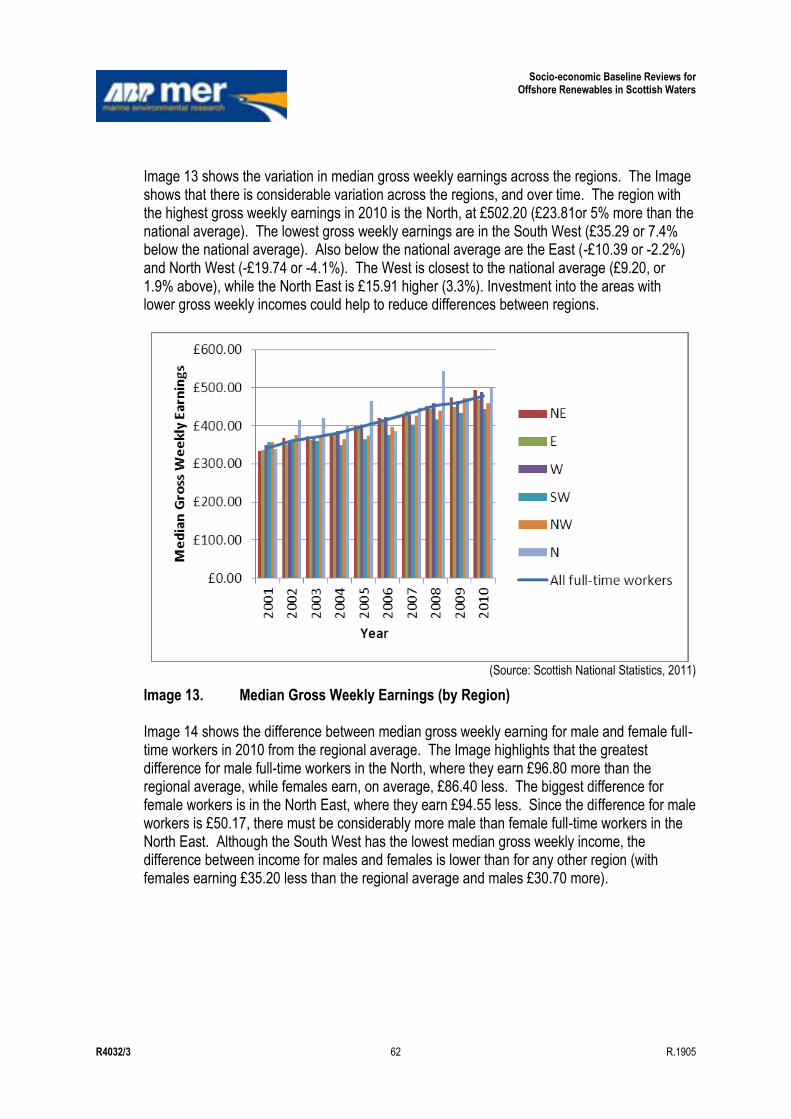
Socio-economic Baseline Reviews for Offshore Renewables in Scottish Waters
R4032/3 62 R.1905
Image 13 shows the variation in median gross weekly earnings across the regions. The Image shows that there is considerable variation across the regions, and over time. The region with the highest gross weekly earnings in 2010 is the North, at £502.20 (£23.81or 5% more than the national average). The lowest gross weekly earnings are in the South West (£35.29 or 7.4% below the national average). Also below the national average are the East (-£10.39 or -2.2%) and North West (-£19.74 or -4.1%). The West is closest to the national average (£9.20, or 1.9% above), while the North East is £15.91 higher (3.3%). Investment into the areas with lower gross weekly incomes could help to reduce differences between regions.
(Source: Scottish National Statistics, 2011)
Image 13. Median Gross Weekly Earnings (by Region) Image 14 shows the difference between median gross weekly earning for male and female full-time workers in 2010 from the regional average. The Image highlights that the greatest difference for male full-time workers in the North, where they earn £96.80 more than the regional average, while females earn, on average, £86.40 less. The biggest difference for female workers is in the North East, where they earn £94.55 less. Since the difference for male workers is £50.17, there must be considerably more male than female full-time workers in the North East. Although the South West has the lowest median gross weekly income, the difference between income for males and females is lower than for any other region (with females earning £35.20 less than the regional average and males £30.70 more).
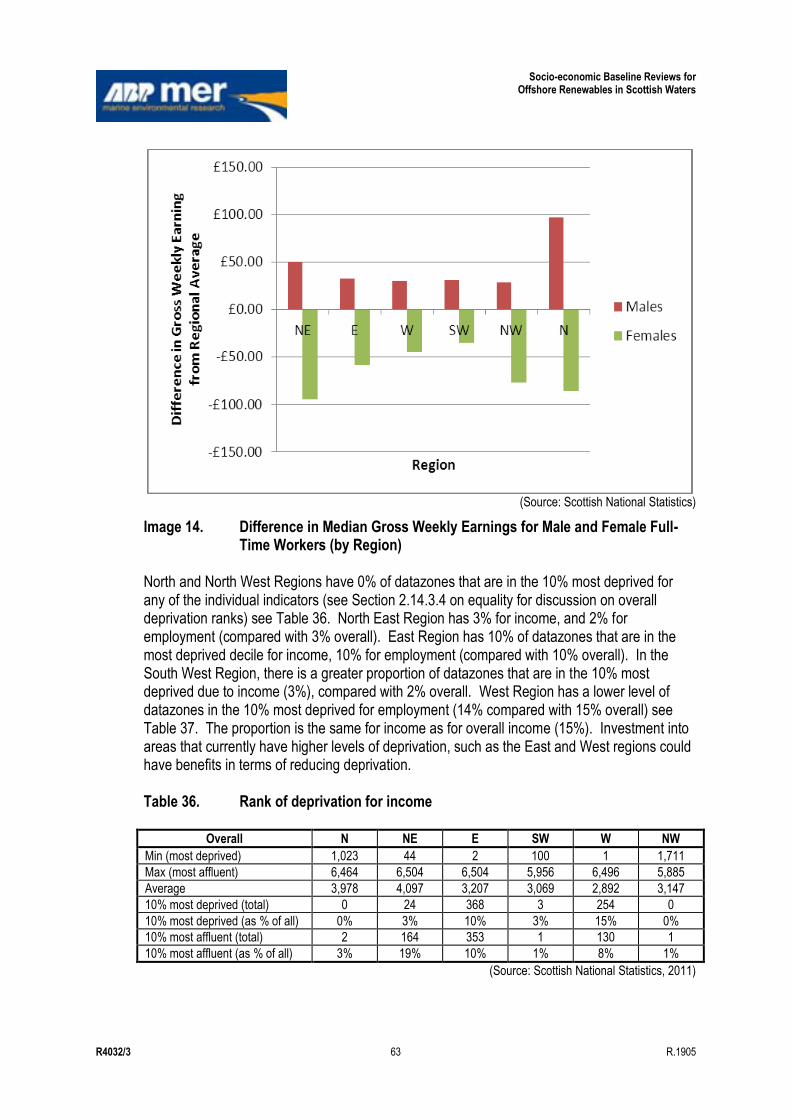
Socio-economic Baseline Reviews for Offshore Renewables in Scottish Waters
R4032/3 63 R.1905
(Source: Scottish National Statistics)
Image 14. Difference in Median Gross Weekly Earnings for Male and Female Full-Time Workers (by Region)
North and North West Regions have 0% of datazones that are in the 10% most deprived for any of the individual indicators (see Section 2.14.3.4 on equality for discussion on overall deprivation ranks) see Table 36. North East Region has 3% for income, and 2% for employment (compared with 3% overall). East Region has 10% of datazones that are in the most deprived decile for income, 10% for employment (compared with 10% overall). In the South West Region, there is a greater proportion of datazones that are in the 10% most deprived due to income (3%), compared with 2% overall. West Region has a lower level of datazones in the 10% most deprived for employment (14% compared with 15% overall) see Table 37. The proportion is the same for income as for overall income (15%). Investment into areas that currently have higher levels of deprivation, such as the East and West regions could have benefits in terms of reducing deprivation. Table 36. Rank of deprivation for income
Overall N NE E SW W NW
Min (most deprived) 1,023 44 2 100 1 1,711
Max (most affluent) 6,464 6,504 6,504 5,956 6,496 5,885
Average 3,978 4,097 3,207 3,069 2,892 3,147
10% most deprived (total) 0 24 368 3 254 0
10% most deprived (as % of all) 0% 3% 10% 3% 15% 0%
10% most affluent (total) 2 164 353 1 130 1
10% most affluent (as % of all) 3% 19% 10% 1% 8% 1%
(Source: Scottish National Statistics, 2011)
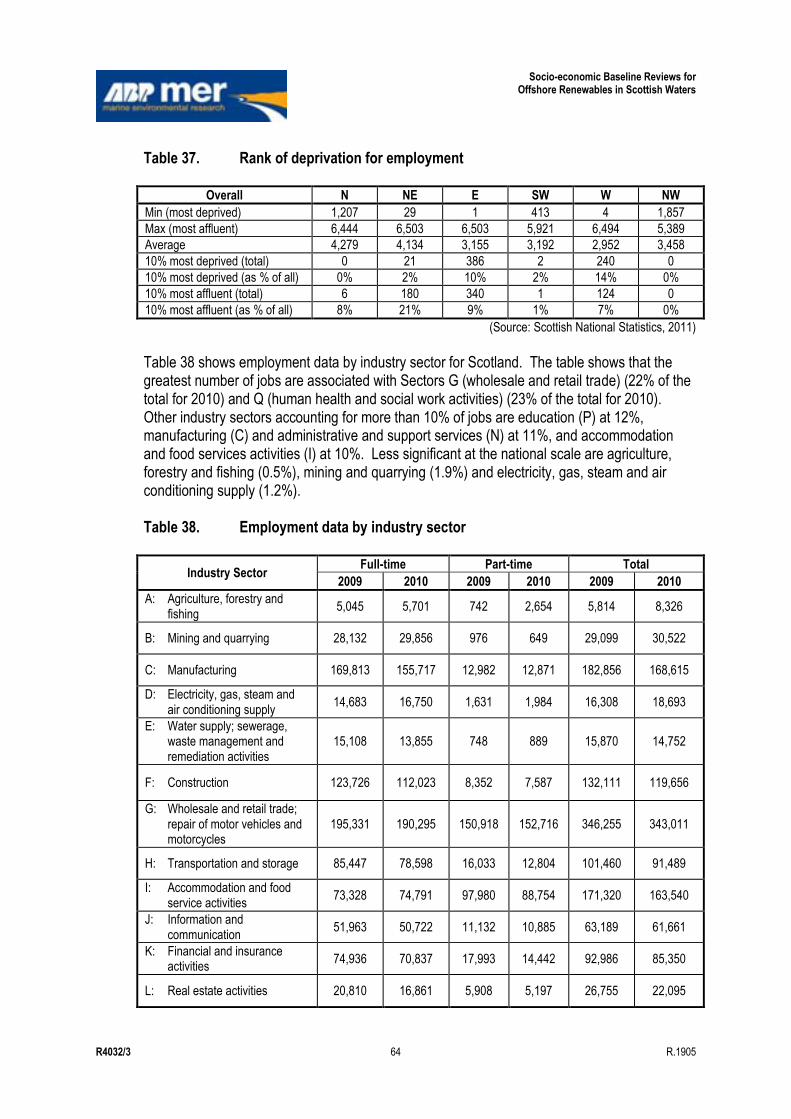
Socio-economic Baseline Reviews for Offshore Renewables in Scottish Waters
R4032/3 64 R.1905
Table 37. Rank of deprivation for employment
Overall N NE E SW W NW
Min (most deprived) 1,207 29 1 413 4 1,857
Max (most affluent) 6,444 6,503 6,503 5,921 6,494 5,389
Average 4,279 4,134 3,155 3,192 2,952 3,458
10% most deprived (total) 0 21 386 2 240 0
10% most deprived (as % of all) 0% 2% 10% 2% 14% 0%
10% most affluent (total) 6 180 340 1 124 0
10% most affluent (as % of all) 8% 21% 9% 1% 7% 0%
(Source: Scottish National Statistics, 2011)
Table 38 shows employment data by industry sector for Scotland. The table shows that the greatest number of jobs are associated with Sectors G (wholesale and retail trade) (22% of the total for 2010) and Q (human health and social work activities) (23% of the total for 2010). Other industry sectors accounting for more than 10% of jobs are education (P) at 12%, manufacturing (C) and administrative and support services (N) at 11%, and accommodation and food services activities (I) at 10%. Less significant at the national scale are agriculture, forestry and fishing (0.5%), mining and quarrying (1.9%) and electricity, gas, steam and air conditioning supply (1.2%). Table 38. Employment data by industry sector
Industry Sector Full-time Part-time Total
2009 2010 2009 2010 2009 2010
A: Agriculture, forestry and fishing
5,045 5,701 742 2,654 5,814 8,326
B: Mining and quarrying 28,132 29,856 976 649 29,099 30,522
C: Manufacturing 169,813 155,717 12,982 12,871 182,856 168,615
D: Electricity, gas, steam and air conditioning supply
14,683 16,750 1,631 1,984 16,308 18,693
E: Water supply; sewerage, waste management and remediation activities
15,108 13,855 748 889 15,870 14,752
F: Construction 123,726 112,023 8,352 7,587 132,111 119,656
G: Wholesale and retail trade; repair of motor vehicles and motorcycles
195,331 190,295 150,918 152,716 346,255 343,011
H: Transportation and storage 85,447 78,598 16,033 12,804 101,460 91,489
I: Accommodation and food service activities
73,328 74,791 97,980 88,754 171,320 163,540
J: Information and communication
51,963 50,722 11,132 10,885 63,189 61,661
K: Financial and insurance activities
74,936 70,837 17,993 14,442 92,986 85,350
L: Real estate activities 20,810 16,861 5,908 5,197 26,755 22,095
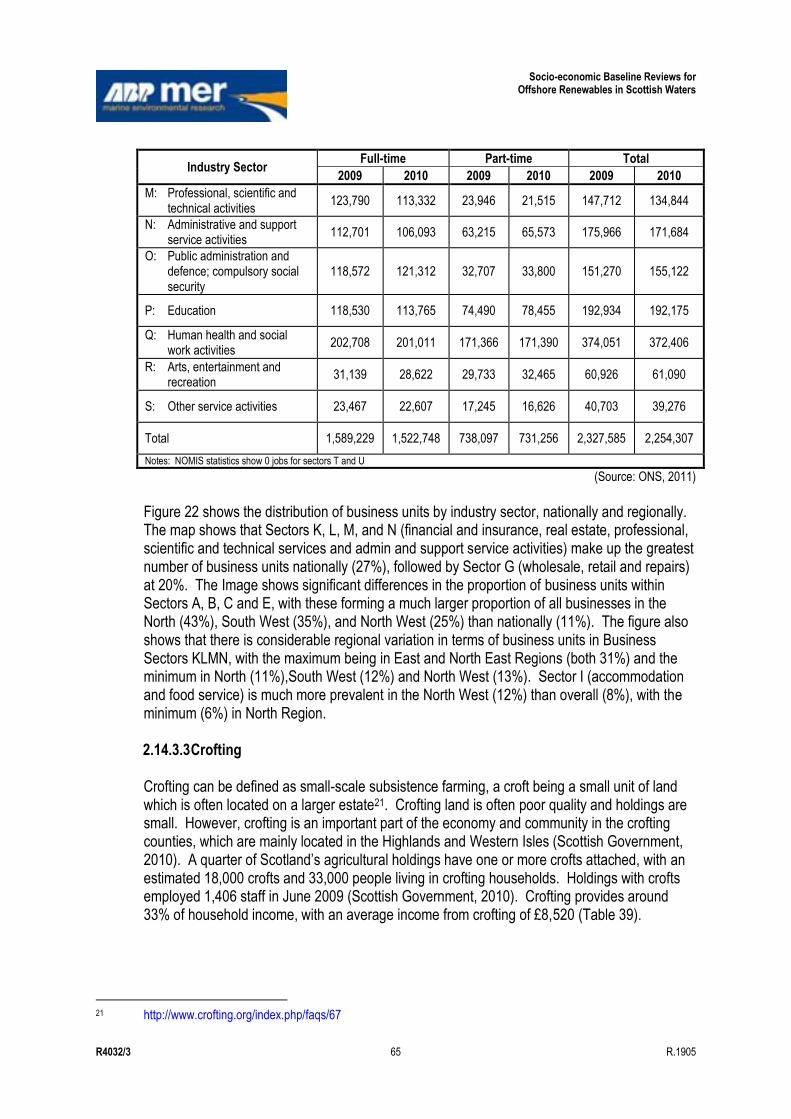
Socio-economic Baseline Reviews for Offshore Renewables in Scottish Waters
R4032/3 65 R.1905
Industry Sector Full-time Part-time Total
2009 2010 2009 2010 2009 2010
M: Professional, scientific and technical activities
123,790 113,332 23,946 21,515 147,712 134,844
N: Administrative and support service activities
112,701 106,093 63,215 65,573 175,966 171,684
O: Public administration and defence; compulsory social security
118,572 121,312 32,707 33,800 151,270 155,122
P: Education 118,530 113,765 74,490 78,455 192,934 192,175
Q: Human health and social work activities
202,708 201,011 171,366 171,390 374,051 372,406
R: Arts, entertainment and recreation
31,139 28,622 29,733 32,465 60,926 61,090
S: Other service activities 23,467 22,607 17,245 16,626 40,703 39,276
Total 1,589,229 1,522,748 738,097 731,256 2,327,585 2,254,307
Notes: NOMIS statistics show 0 jobs for sectors T and U
(Source: ONS, 2011)
Figure 22 shows the distribution of business units by industry sector, nationally and regionally. The map shows that Sectors K, L, M, and N (financial and insurance, real estate, professional, scientific and technical services and admin and support service activities) make up the greatest number of business units nationally (27%), followed by Sector G (wholesale, retail and repairs) at 20%. The Image shows significant differences in the proportion of business units within Sectors A, B, C and E, with these forming a much larger proportion of all businesses in the North (43%), South West (35%), and North West (25%) than nationally (11%). The figure also shows that there is considerable regional variation in terms of business units in Business Sectors KLMN, with the maximum being in East and North East Regions (both 31%) and the minimum in North (11%),South West (12%) and North West (13%). Sector I (accommodation and food service) is much more prevalent in the North West (12%) than overall (8%), with the minimum (6%) in North Region. 2.14.3.3 Crofting Crofting can be defined as small-scale subsistence farming, a croft being a small unit of land which is often located on a larger estate21. Crofting land is often poor quality and holdings are small. However, crofting is an important part of the economy and community in the crofting counties, which are mainly located in the Highlands and Western Isles (Scottish Government, 2010). A quarter of Scotland‟s agricultural holdings have one or more crofts attached, with an estimated 18,000 crofts and 33,000 people living in crofting households. Holdings with crofts employed 1,406 staff in June 2009 (Scottish Government, 2010). Crofting provides around 33% of household income, with an average income from crofting of £8,520 (Table 39).
21 http://www.crofting.org/index.php/faqs/67
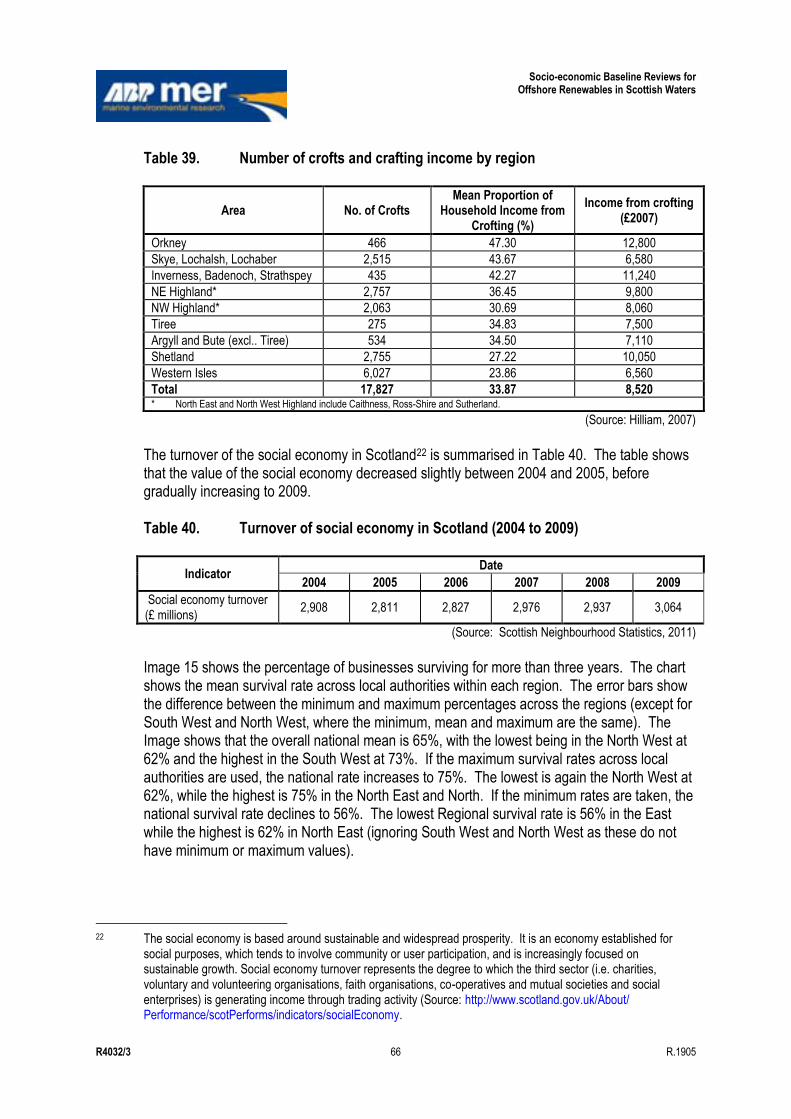
Socio-economic Baseline Reviews for Offshore Renewables in Scottish Waters
R4032/3 66 R.1905
Table 39. Number of crofts and crafting income by region
Area No. of Crofts Mean Proportion of
Household Income from Crofting (%)
Income from crofting (£2007)
Orkney 466 47.30 12,800
Skye, Lochalsh, Lochaber 2,515 43.67 6,580
Inverness, Badenoch, Strathspey 435 42.27 11,240
NE Highland* 2,757 36.45 9,800
NW Highland* 2,063 30.69 8,060
Tiree 275 34.83 7,500
Argyll and Bute (excl.. Tiree) 534 34.50 7,110
Shetland 2,755 27.22 10,050
Western Isles 6,027 23.86 6,560
Total 17,827 33.87 8,520 * North East and North West Highland include Caithness, Ross-Shire and Sutherland.
(Source: Hilliam, 2007)
The turnover of the social economy in Scotland22 is summarised in Table 40. The table shows that the value of the social economy decreased slightly between 2004 and 2005, before gradually increasing to 2009. Table 40. Turnover of social economy in Scotland (2004 to 2009)
Indicator Date
2004 2005 2006 2007 2008 2009
Social economy turnover (£ millions)
2,908 2,811 2,827 2,976 2,937 3,064
(Source: Scottish Neighbourhood Statistics, 2011)
Image 15 shows the percentage of businesses surviving for more than three years. The chart shows the mean survival rate across local authorities within each region. The error bars show the difference between the minimum and maximum percentages across the regions (except for South West and North West, where the minimum, mean and maximum are the same). The Image shows that the overall national mean is 65%, with the lowest being in the North West at 62% and the highest in the South West at 73%. If the maximum survival rates across local authorities are used, the national rate increases to 75%. The lowest is again the North West at 62%, while the highest is 75% in the North East and North. If the minimum rates are taken, the national survival rate declines to 56%. The lowest Regional survival rate is 56% in the East while the highest is 62% in North East (ignoring South West and North West as these do not have minimum or maximum values).
22 The social economy is based around sustainable and widespread prosperity. It is an economy established for
social purposes, which tends to involve community or user participation, and is increasingly focused on sustainable growth. Social economy turnover represents the degree to which the third sector (i.e. charities, voluntary and volunteering organisations, faith organisations, co-operatives and mutual societies and social enterprises) is generating income through trading activity (Source: http://www.scotland.gov.uk/About/ Performance/scotPerforms/indicators/socialEconomy.
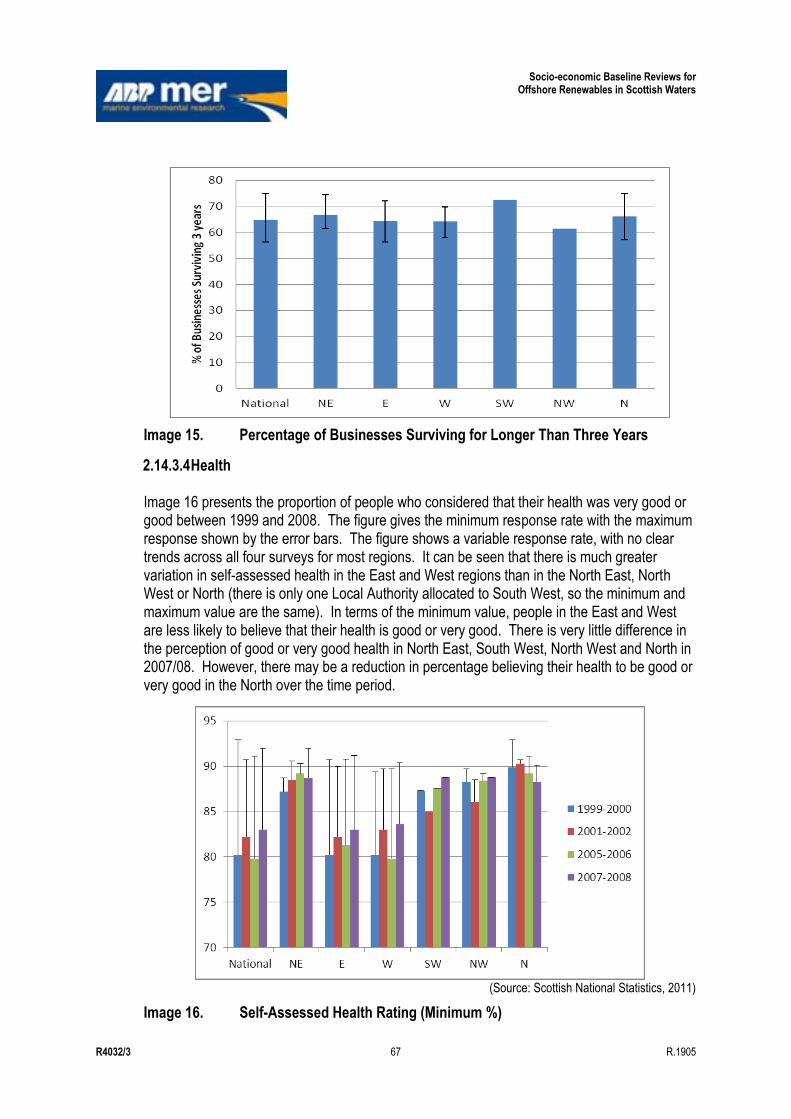
Socio-economic Baseline Reviews for Offshore Renewables in Scottish Waters
R4032/3 67 R.1905
Image 15. Percentage of Businesses Surviving for Longer Than Three Years
2.14.3.4 Health Image 16 presents the proportion of people who considered that their health was very good or good between 1999 and 2008. The figure gives the minimum response rate with the maximum response shown by the error bars. The figure shows a variable response rate, with no clear trends across all four surveys for most regions. It can be seen that there is much greater variation in self-assessed health in the East and West regions than in the North East, North West or North (there is only one Local Authority allocated to South West, so the minimum and maximum value are the same). In terms of the minimum value, people in the East and West are less likely to believe that their health is good or very good. There is very little difference in the perception of good or very good health in North East, South West, North West and North in 2007/08. However, there may be a reduction in percentage believing their health to be good or very good in the North over the time period.
(Source: Scottish National Statistics, 2011)
Image 16. Self-Assessed Health Rating (Minimum %)
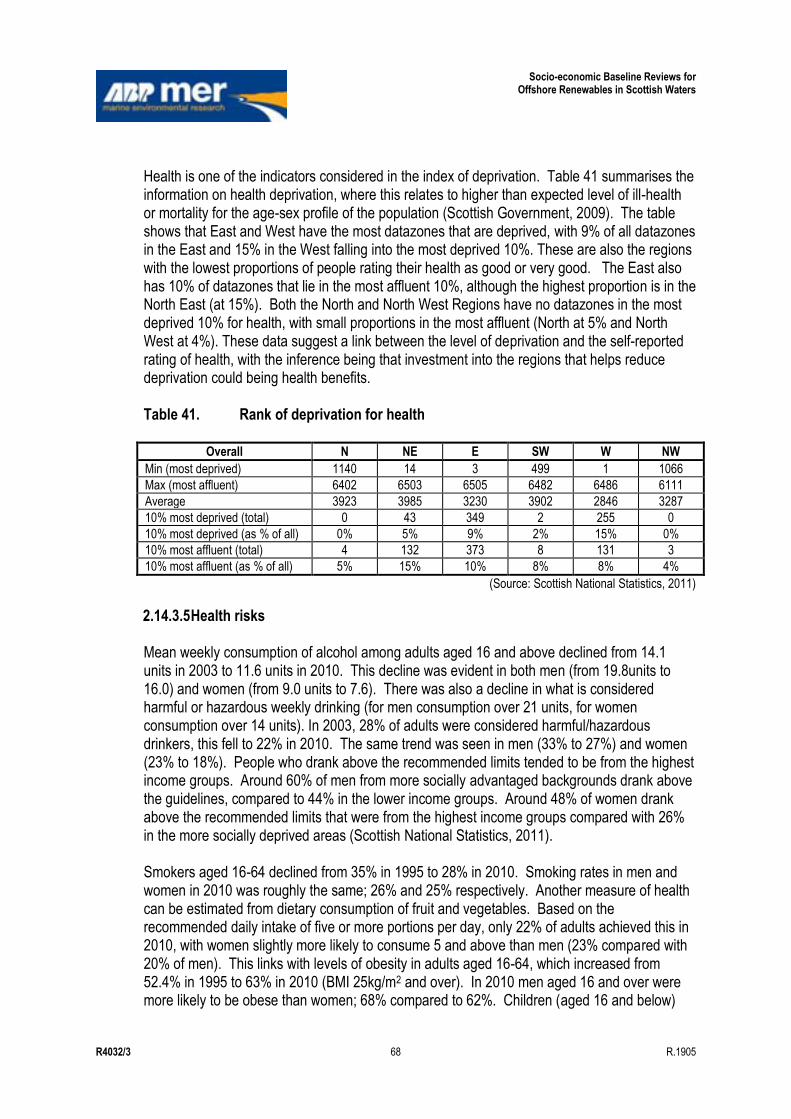
Socio-economic Baseline Reviews for Offshore Renewables in Scottish Waters
R4032/3 68 R.1905
Health is one of the indicators considered in the index of deprivation. Table 41 summarises the information on health deprivation, where this relates to higher than expected level of ill-health or mortality for the age-sex profile of the population (Scottish Government, 2009). The table shows that East and West have the most datazones that are deprived, with 9% of all datazones in the East and 15% in the West falling into the most deprived 10%. These are also the regions with the lowest proportions of people rating their health as good or very good. The East also has 10% of datazones that lie in the most affluent 10%, although the highest proportion is in the North East (at 15%). Both the North and North West Regions have no datazones in the most deprived 10% for health, with small proportions in the most affluent (North at 5% and North West at 4%). These data suggest a link between the level of deprivation and the self-reported rating of health, with the inference being that investment into the regions that helps reduce deprivation could being health benefits. Table 41. Rank of deprivation for health
Overall N NE E SW W NW
Min (most deprived) 1140 14 3 499 1 1066
Max (most affluent) 6402 6503 6505 6482 6486 6111
Average 3923 3985 3230 3902 2846 3287
10% most deprived (total) 0 43 349 2 255 0
10% most deprived (as % of all) 0% 5% 9% 2% 15% 0%
10% most affluent (total) 4 132 373 8 131 3
10% most affluent (as % of all) 5% 15% 10% 8% 8% 4%
(Source: Scottish National Statistics, 2011)
2.14.3.5 Health risks Mean weekly consumption of alcohol among adults aged 16 and above declined from 14.1 units in 2003 to 11.6 units in 2010. This decline was evident in both men (from 19.8units to 16.0) and women (from 9.0 units to 7.6). There was also a decline in what is considered harmful or hazardous weekly drinking (for men consumption over 21 units, for women consumption over 14 units). In 2003, 28% of adults were considered harmful/hazardous drinkers, this fell to 22% in 2010. The same trend was seen in men (33% to 27%) and women (23% to 18%). People who drank above the recommended limits tended to be from the highest income groups. Around 60% of men from more socially advantaged backgrounds drank above the guidelines, compared to 44% in the lower income groups. Around 48% of women drank above the recommended limits that were from the highest income groups compared with 26% in the more socially deprived areas (Scottish National Statistics, 2011). Smokers aged 16-64 declined from 35% in 1995 to 28% in 2010. Smoking rates in men and women in 2010 was roughly the same; 26% and 25% respectively. Another measure of health can be estimated from dietary consumption of fruit and vegetables. Based on the recommended daily intake of five or more portions per day, only 22% of adults achieved this in 2010, with women slightly more likely to consume 5 and above than men (23% compared with 20% of men). This links with levels of obesity in adults aged 16-64, which increased from 52.4% in 1995 to 63% in 2010 (BMI 25kg/m2 and over). In 2010 men aged 16 and over were more likely to be obese than women; 68% compared to 62%. Children (aged 16 and below)
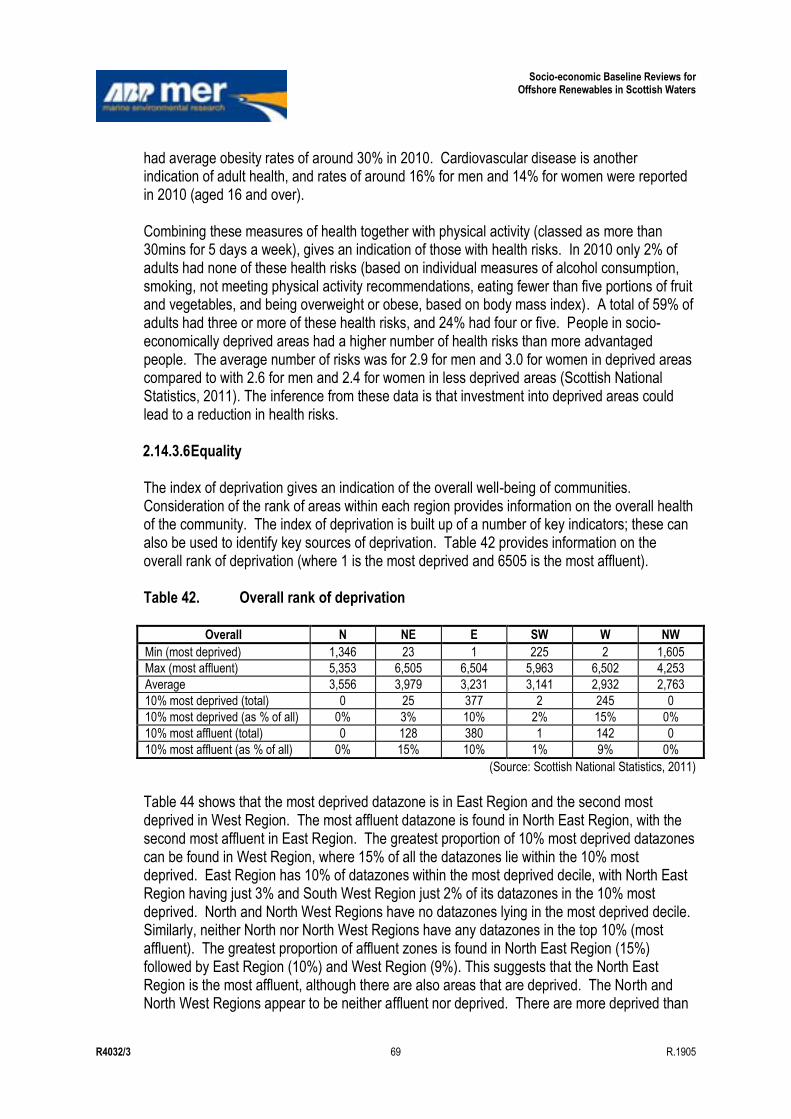
Socio-economic Baseline Reviews for Offshore Renewables in Scottish Waters
R4032/3 69 R.1905
had average obesity rates of around 30% in 2010. Cardiovascular disease is another indication of adult health, and rates of around 16% for men and 14% for women were reported in 2010 (aged 16 and over). Combining these measures of health together with physical activity (classed as more than 30mins for 5 days a week), gives an indication of those with health risks. In 2010 only 2% of adults had none of these health risks (based on individual measures of alcohol consumption, smoking, not meeting physical activity recommendations, eating fewer than five portions of fruit and vegetables, and being overweight or obese, based on body mass index). A total of 59% of adults had three or more of these health risks, and 24% had four or five. People in socio-economically deprived areas had a higher number of health risks than more advantaged people. The average number of risks was for 2.9 for men and 3.0 for women in deprived areas compared to with 2.6 for men and 2.4 for women in less deprived areas (Scottish National Statistics, 2011). The inference from these data is that investment into deprived areas could lead to a reduction in health risks. 2.14.3.6 Equality The index of deprivation gives an indication of the overall well-being of communities. Consideration of the rank of areas within each region provides information on the overall health of the community. The index of deprivation is built up of a number of key indicators; these can also be used to identify key sources of deprivation. Table 42 provides information on the overall rank of deprivation (where 1 is the most deprived and 6505 is the most affluent). Table 42. Overall rank of deprivation
Overall N NE E SW W NW
Min (most deprived) 1,346 23 1 225 2 1,605
Max (most affluent) 5,353 6,505 6,504 5,963 6,502 4,253
Average 3,556 3,979 3,231 3,141 2,932 2,763
10% most deprived (total) 0 25 377 2 245 0
10% most deprived (as % of all) 0% 3% 10% 2% 15% 0%
10% most affluent (total) 0 128 380 1 142 0
10% most affluent (as % of all) 0% 15% 10% 1% 9% 0%
(Source: Scottish National Statistics, 2011)
Table 44 shows that the most deprived datazone is in East Region and the second most deprived in West Region. The most affluent datazone is found in North East Region, with the second most affluent in East Region. The greatest proportion of 10% most deprived datazones can be found in West Region, where 15% of all the datazones lie within the 10% most deprived. East Region has 10% of datazones within the most deprived decile, with North East Region having just 3% and South West Region just 2% of its datazones in the 10% most deprived. North and North West Regions have no datazones lying in the most deprived decile. Similarly, neither North nor North West Regions have any datazones in the top 10% (most affluent). The greatest proportion of affluent zones is found in North East Region (15%) followed by East Region (10%) and West Region (9%). This suggests that the North East Region is the most affluent, although there are also areas that are deprived. The North and North West Regions appear to be neither affluent nor deprived. There are more deprived than
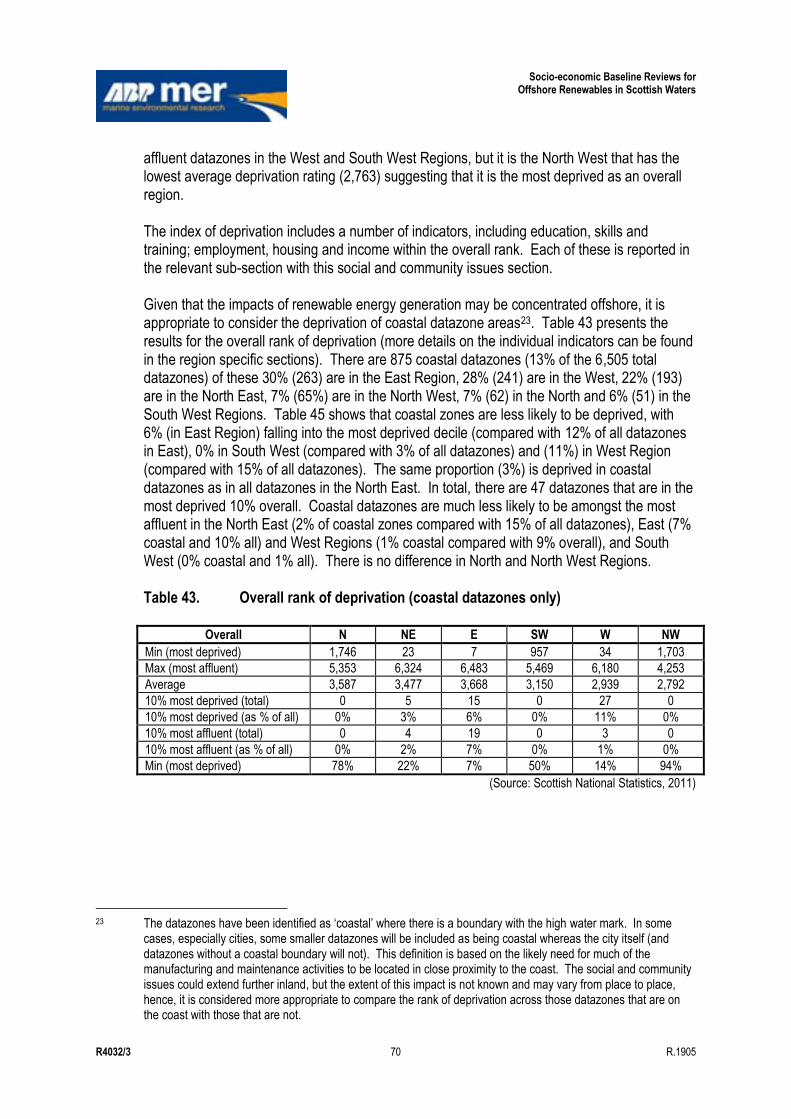
Socio-economic Baseline Reviews for Offshore Renewables in Scottish Waters
R4032/3 70 R.1905
affluent datazones in the West and South West Regions, but it is the North West that has the lowest average deprivation rating (2,763) suggesting that it is the most deprived as an overall region. The index of deprivation includes a number of indicators, including education, skills and training; employment, housing and income within the overall rank. Each of these is reported in the relevant sub-section with this social and community issues section. Given that the impacts of renewable energy generation may be concentrated offshore, it is appropriate to consider the deprivation of coastal datazone areas23. Table 43 presents the results for the overall rank of deprivation (more details on the individual indicators can be found in the region specific sections). There are 875 coastal datazones (13% of the 6,505 total datazones) of these 30% (263) are in the East Region, 28% (241) are in the West, 22% (193) are in the North East, 7% (65%) are in the North West, 7% (62) in the North and 6% (51) in the South West Regions. Table 45 shows that coastal zones are less likely to be deprived, with 6% (in East Region) falling into the most deprived decile (compared with 12% of all datazones in East), 0% in South West (compared with 3% of all datazones) and (11%) in West Region (compared with 15% of all datazones). The same proportion (3%) is deprived in coastal datazones as in all datazones in the North East. In total, there are 47 datazones that are in the most deprived 10% overall. Coastal datazones are much less likely to be amongst the most affluent in the North East (2% of coastal zones compared with 15% of all datazones), East (7% coastal and 10% all) and West Regions (1% coastal compared with 9% overall), and South West (0% coastal and 1% all). There is no difference in North and North West Regions. Table 43. Overall rank of deprivation (coastal datazones only)
Overall N NE E SW W NW
Min (most deprived) 1,746 23 7 957 34 1,703
Max (most affluent) 5,353 6,324 6,483 5,469 6,180 4,253
Average 3,587 3,477 3,668 3,150 2,939 2,792
10% most deprived (total) 0 5 15 0 27 0
10% most deprived (as % of all) 0% 3% 6% 0% 11% 0%
10% most affluent (total) 0 4 19 0 3 0
10% most affluent (as % of all) 0% 2% 7% 0% 1% 0%
Min (most deprived) 78% 22% 7% 50% 14% 94%
(Source: Scottish National Statistics, 2011)
23 The datazones have been identified as „coastal‟ where there is a boundary with the high water mark. In some
cases, especially cities, some smaller datazones will be included as being coastal whereas the city itself (and datazones without a coastal boundary will not). This definition is based on the likely need for much of the manufacturing and maintenance activities to be located in close proximity to the coast. The social and community issues could extend further inland, but the extent of this impact is not known and may vary from place to place, hence, it is considered more appropriate to compare the rank of deprivation across those datazones that are on the coast with those that are not.
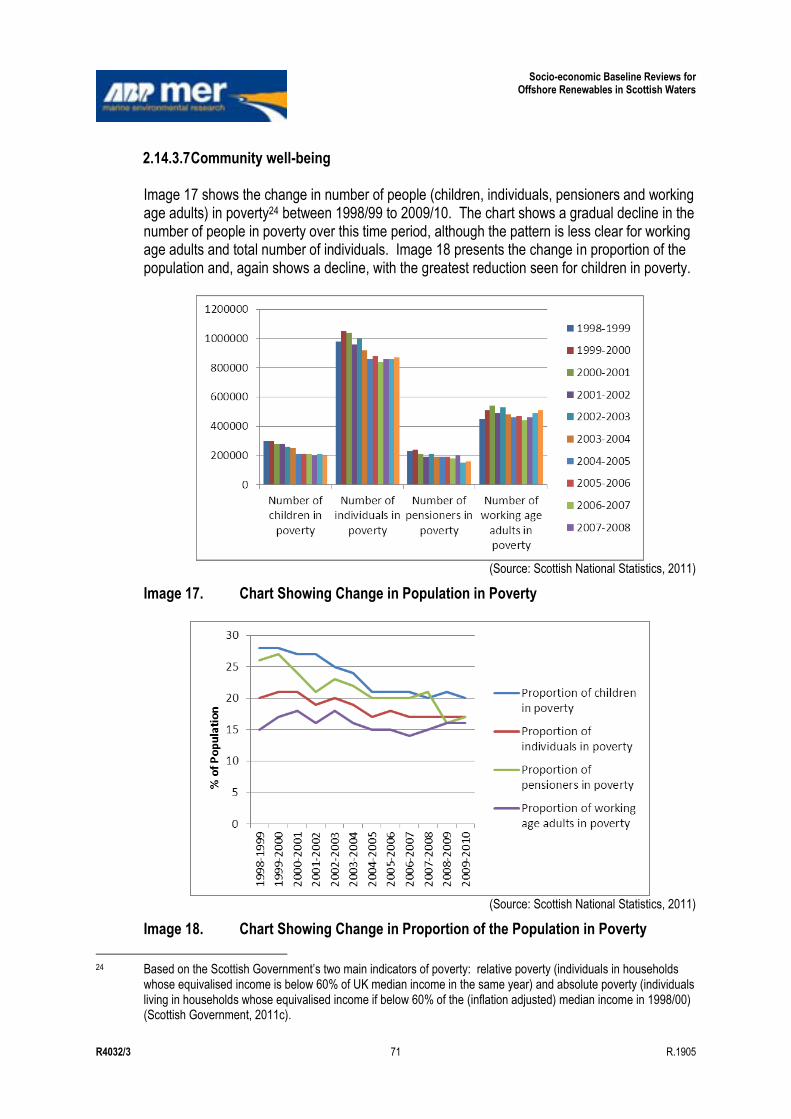
Socio-economic Baseline Reviews for Offshore Renewables in Scottish Waters
R4032/3 71 R.1905
2.14.3.7 Community well-being Image 17 shows the change in number of people (children, individuals, pensioners and working age adults) in poverty24 between 1998/99 to 2009/10. The chart shows a gradual decline in the number of people in poverty over this time period, although the pattern is less clear for working age adults and total number of individuals. Image 18 presents the change in proportion of the population and, again shows a decline, with the greatest reduction seen for children in poverty.
(Source: Scottish National Statistics, 2011)
Image 17. Chart Showing Change in Population in Poverty
(Source: Scottish National Statistics, 2011)
Image 18. Chart Showing Change in Proportion of the Population in Poverty
24 Based on the Scottish Government‟s two main indicators of poverty: relative poverty (individuals in households
whose equivalised income is below 60% of UK median income in the same year) and absolute poverty (individuals living in households whose equivalised income if below 60% of the (inflation adjusted) median income in 1998/00) (Scottish Government, 2011c).
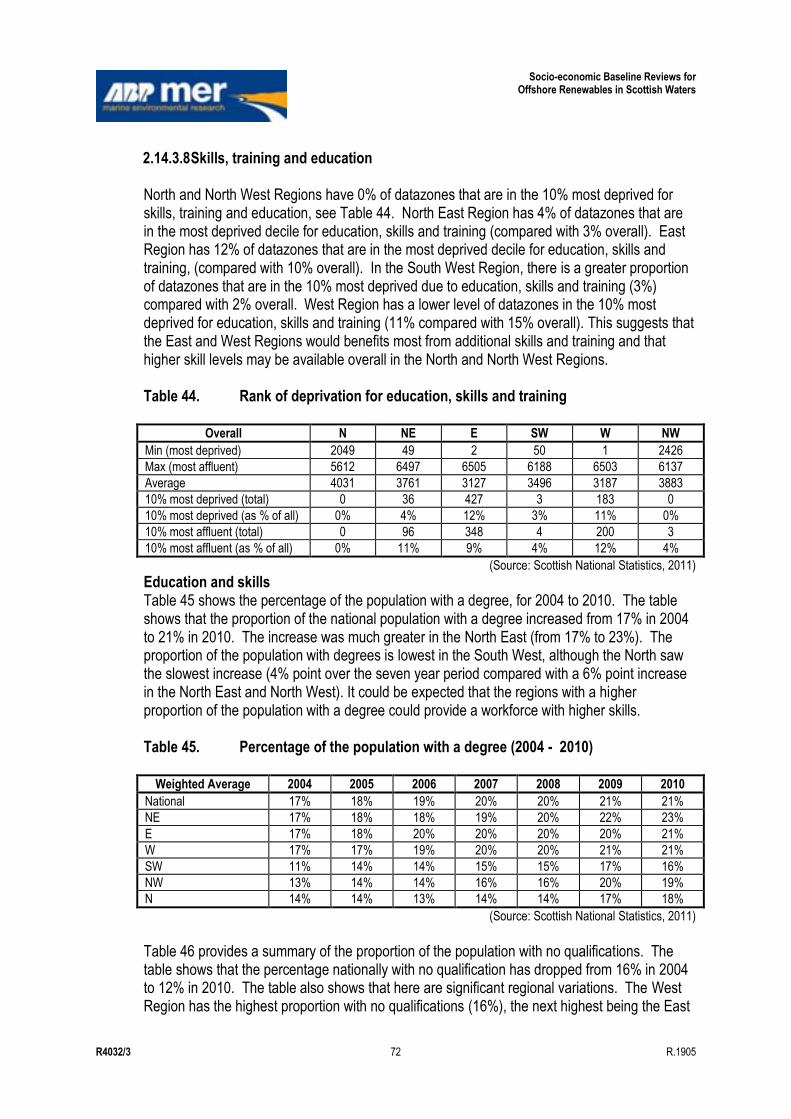
Socio-economic Baseline Reviews for Offshore Renewables in Scottish Waters
R4032/3 72 R.1905
2.14.3.8 Skills, training and education North and North West Regions have 0% of datazones that are in the 10% most deprived for skills, training and education, see Table 44. North East Region has 4% of datazones that are in the most deprived decile for education, skills and training (compared with 3% overall). East Region has 12% of datazones that are in the most deprived decile for education, skills and training, (compared with 10% overall). In the South West Region, there is a greater proportion of datazones that are in the 10% most deprived due to education, skills and training (3%) compared with 2% overall. West Region has a lower level of datazones in the 10% most deprived for education, skills and training (11% compared with 15% overall). This suggests that the East and West Regions would benefits most from additional skills and training and that higher skill levels may be available overall in the North and North West Regions. Table 44. Rank of deprivation for education, skills and training
Overall N NE E SW W NW
Min (most deprived) 2049 49 2 50 1 2426
Max (most affluent) 5612 6497 6505 6188 6503 6137
Average 4031 3761 3127 3496 3187 3883
10% most deprived (total) 0 36 427 3 183 0
10% most deprived (as % of all) 0% 4% 12% 3% 11% 0%
10% most affluent (total) 0 96 348 4 200 3
10% most affluent (as % of all) 0% 11% 9% 4% 12% 4%
(Source: Scottish National Statistics, 2011)
Education and skills Table 45 shows the percentage of the population with a degree, for 2004 to 2010. The table shows that the proportion of the national population with a degree increased from 17% in 2004 to 21% in 2010. The increase was much greater in the North East (from 17% to 23%). The proportion of the population with degrees is lowest in the South West, although the North saw the slowest increase (4% point over the seven year period compared with a 6% point increase in the North East and North West). It could be expected that the regions with a higher proportion of the population with a degree could provide a workforce with higher skills.
Table 45. Percentage of the population with a degree (2004 - 2010)
Weighted Average 2004 2005 2006 2007 2008 2009 2010
National 17% 18% 19% 20% 20% 21% 21%
NE 17% 18% 18% 19% 20% 22% 23%
E 17% 18% 20% 20% 20% 20% 21%
W 17% 17% 19% 20% 20% 21% 21%
SW 11% 14% 14% 15% 15% 17% 16%
NW 13% 14% 14% 16% 16% 20% 19%
N 14% 14% 13% 14% 14% 17% 18%
(Source: Scottish National Statistics, 2011)
Table 46 provides a summary of the proportion of the population with no qualifications. The table shows that the percentage nationally with no qualification has dropped from 16% in 2004 to 12% in 2010. The table also shows that here are significant regional variations. The West Region has the highest proportion with no qualifications (16%), the next highest being the East
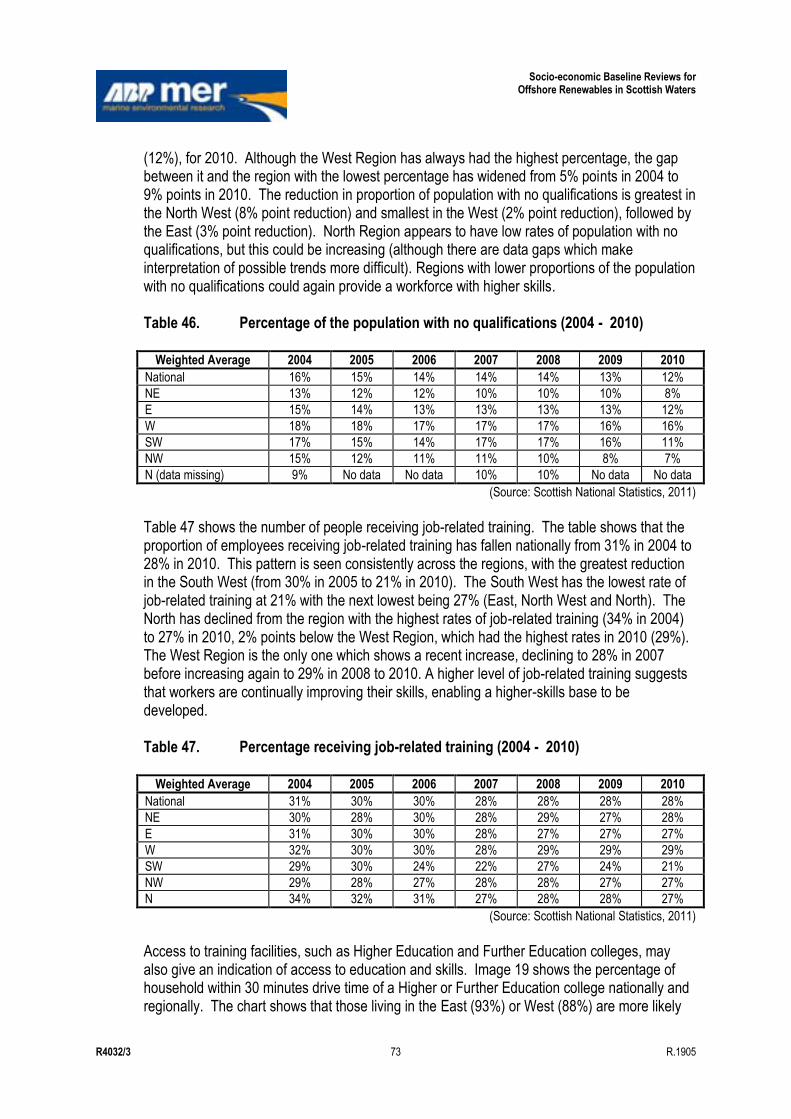
Socio-economic Baseline Reviews for Offshore Renewables in Scottish Waters
R4032/3 73 R.1905
(12%), for 2010. Although the West Region has always had the highest percentage, the gap between it and the region with the lowest percentage has widened from 5% points in 2004 to 9% points in 2010. The reduction in proportion of population with no qualifications is greatest in the North West (8% point reduction) and smallest in the West (2% point reduction), followed by the East (3% point reduction). North Region appears to have low rates of population with no qualifications, but this could be increasing (although there are data gaps which make interpretation of possible trends more difficult). Regions with lower proportions of the population with no qualifications could again provide a workforce with higher skills.
Table 46. Percentage of the population with no qualifications (2004 - 2010)
Weighted Average 2004 2005 2006 2007 2008 2009 2010
National 16% 15% 14% 14% 14% 13% 12%
NE 13% 12% 12% 10% 10% 10% 8%
E 15% 14% 13% 13% 13% 13% 12%
W 18% 18% 17% 17% 17% 16% 16%
SW 17% 15% 14% 17% 17% 16% 11%
NW 15% 12% 11% 11% 10% 8% 7%
N (data missing) 9% No data No data 10% 10% No data No data
(Source: Scottish National Statistics, 2011)
Table 47 shows the number of people receiving job-related training. The table shows that the proportion of employees receiving job-related training has fallen nationally from 31% in 2004 to 28% in 2010. This pattern is seen consistently across the regions, with the greatest reduction in the South West (from 30% in 2005 to 21% in 2010). The South West has the lowest rate of job-related training at 21% with the next lowest being 27% (East, North West and North). The North has declined from the region with the highest rates of job-related training (34% in 2004) to 27% in 2010, 2% points below the West Region, which had the highest rates in 2010 (29%). The West Region is the only one which shows a recent increase, declining to 28% in 2007 before increasing again to 29% in 2008 to 2010. A higher level of job-related training suggests that workers are continually improving their skills, enabling a higher-skills base to be developed. Table 47. Percentage receiving job-related training (2004 - 2010)
Weighted Average 2004 2005 2006 2007 2008 2009 2010
National 31% 30% 30% 28% 28% 28% 28%
NE 30% 28% 30% 28% 29% 27% 28%
E 31% 30% 30% 28% 27% 27% 27%
W 32% 30% 30% 28% 29% 29% 29%
SW 29% 30% 24% 22% 27% 24% 21%
NW 29% 28% 27% 28% 28% 27% 27%
N 34% 32% 31% 27% 28% 28% 27%
(Source: Scottish National Statistics, 2011)
Access to training facilities, such as Higher Education and Further Education colleges, may also give an indication of access to education and skills. Image 19 shows the percentage of household within 30 minutes drive time of a Higher or Further Education college nationally and regionally. The chart shows that those living in the East (93%) or West (88%) are more likely
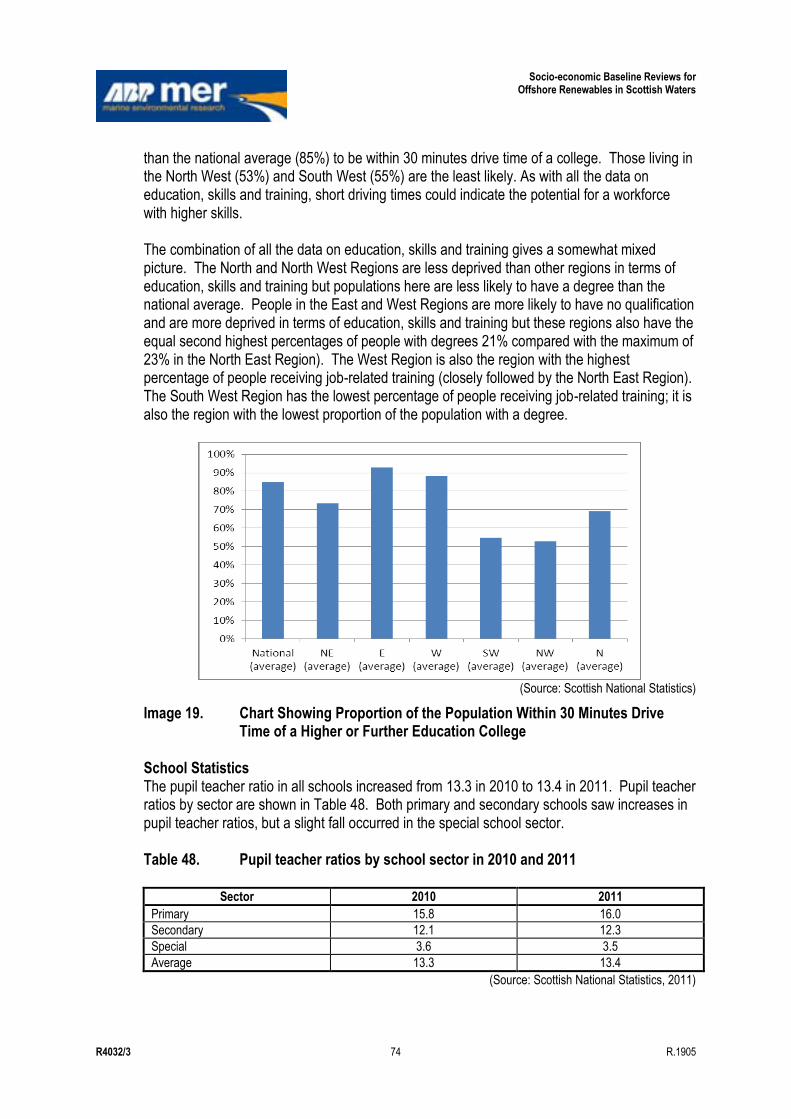
Socio-economic Baseline Reviews for Offshore Renewables in Scottish Waters
R4032/3 74 R.1905
than the national average (85%) to be within 30 minutes drive time of a college. Those living in the North West (53%) and South West (55%) are the least likely. As with all the data on education, skills and training, short driving times could indicate the potential for a workforce with higher skills. The combination of all the data on education, skills and training gives a somewhat mixed picture. The North and North West Regions are less deprived than other regions in terms of education, skills and training but populations here are less likely to have a degree than the national average. People in the East and West Regions are more likely to have no qualification and are more deprived in terms of education, skills and training but these regions also have the equal second highest percentages of people with degrees 21% compared with the maximum of 23% in the North East Region). The West Region is also the region with the highest percentage of people receiving job-related training (closely followed by the North East Region). The South West Region has the lowest percentage of people receiving job-related training; it is also the region with the lowest proportion of the population with a degree.
(Source: Scottish National Statistics)
Image 19. Chart Showing Proportion of the Population Within 30 Minutes Drive Time of a Higher or Further Education College
School Statistics The pupil teacher ratio in all schools increased from 13.3 in 2010 to 13.4 in 2011. Pupil teacher ratios by sector are shown in Table 48. Both primary and secondary schools saw increases in pupil teacher ratios, but a slight fall occurred in the special school sector. Table 48. Pupil teacher ratios by school sector in 2010 and 2011
Sector 2010 2011
Primary 15.8 16.0
Secondary 12.1 12.3
Special 3.6 3.5
Average 13.3 13.4
(Source: Scottish National Statistics, 2011)
Socio-economic Baseline Reviews for Offshore Renewables in Scottish Waters
R4032/3 75 R.1905
Between 2007 and 2011 over 350 schools have been substantially rebuilt or refurbished, and the percentage of school in satisfactory or good condition rose from 61% in 2007 to 80% in 2011. The proportion of initial leavers who were in positive destinations (higher education further education, training, voluntary work, employment and activity agreements) was almost 90% in 2011. This figure had increased from 86% in 2009. The proportion of young people entering higher education was 63% in 2011. At the end of Stage 5 the proportion of Stage 4 students attaining three or more Highers or better was 26% in 2010/11. At the end of Stage 6, the proportion of Stage 4 students attaining one or more Advanced Highers increased from 14% in 2008/09 to 15% in 2010/11 (Scottish National Statics, 2011). 2.14.3.9 Access to services Table 49 identifies the total stock of household spaces, the percentage occupied and percentage vacant (in 2001). The table shows that the greatest housing pressure may be in the East and West Regions with occupancy ratings of 96% and 95%, respectively. The North West Region has the lowest proportion that is occupied (89%) but has only 4% that are vacant; the remaining 6% being holiday spaces. West (4%) and North East (3%) Regions also have a significant proportion of spaces for holiday occupation. Table 49. Household spaces
Area Total Spaces Occupied Spaces
% Occupied Vacant Spaces
% Vacant
National 2,308,939 2,192,246 95% 87,394 4%
NE 339,517 313,085 92% 17,001 5%
E 1,096,263 1,052,750 96% 35,861 3%
W 772,631 733,876 95% 29,908 4%
SW 67,865 63,807 94% 2,507 4%
NW 112,945 100,808 89% 4,969 4%
W 19,466 17,453 90% 1,148 6%
(Source: Scottish National Statistics, 2011)
The average percentage of private and social sector dwellings that fail the Scottish Housing Quality Standard (SHQS) level for 2004-2006 and 2005-2008 is presented in Table 50. By 2010, the percentage of dwellings failing the SHQS standard across Scotland as a whole was 61% (Scottish National Statistics, 2011). These statistics can be used alongside the household spaces data to give an indication of the level of access to housing considered to be of sufficient standard. Most of the failures are attributed to the energy efficiency criterion. The proportion of housing that was below the tolerable standard was 3.9% in 2010 (a slight increase of 0.7% from 2009, largely attributable to a change in the definition of tolerable to include thermal performance and electrical safety) (Scottish National Statistics, 2011). The statistics are variable across the regions, with the South West Region having the lowest percentage of social sector dwellings failing the SHQS (59%) in 2005-2008 but the second highest percentage of private dwellings that fail the SHQS (78%) (the highest being the West Region at 79%). The North East Region is the only region where the percentage of private and social sector dwellings is below the national average, suggesting housing quality is of a higher standard here. Private dwellings in the East Region are less likely to fail the SHQS than nationally (65% compared with 69%), with private dwelling failures matching the national average (66%). It is
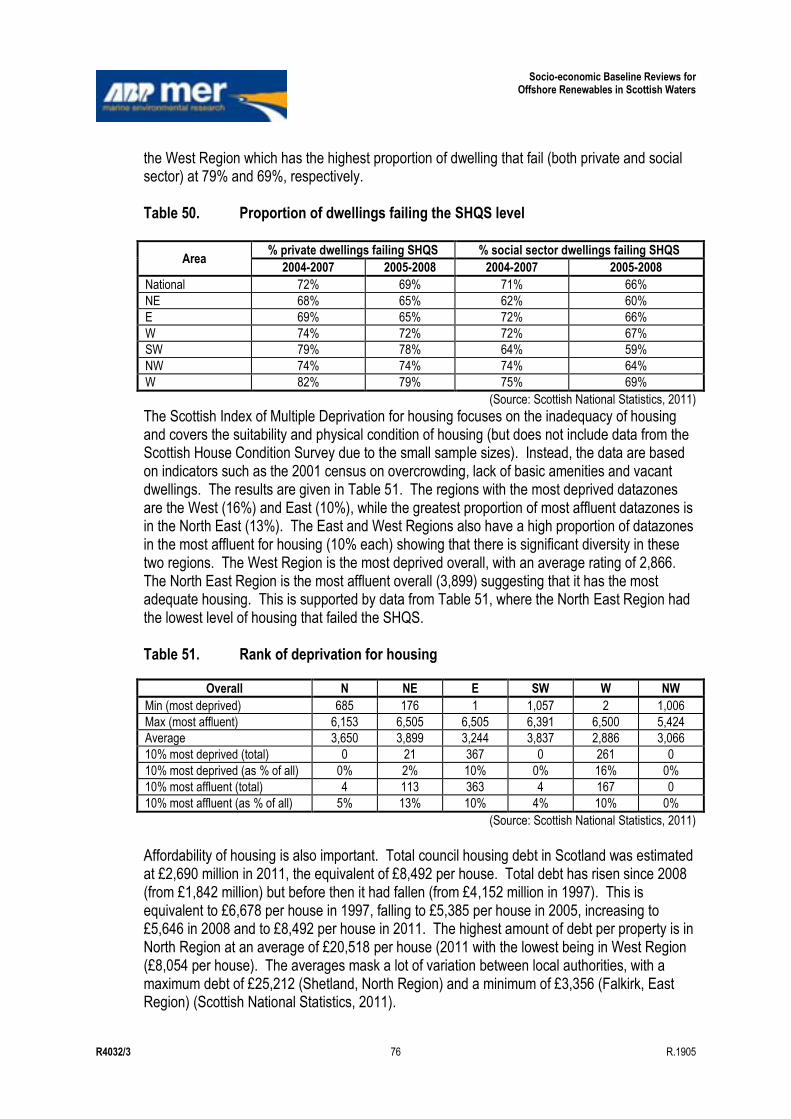
Socio-economic Baseline Reviews for Offshore Renewables in Scottish Waters
R4032/3 76 R.1905
the West Region which has the highest proportion of dwelling that fail (both private and social sector) at 79% and 69%, respectively. Table 50. Proportion of dwellings failing the SHQS level
Area % private dwellings failing SHQS % social sector dwellings failing SHQS
2004-2007 2005-2008 2004-2007 2005-2008
National 72% 69% 71% 66%
NE 68% 65% 62% 60%
E 69% 65% 72% 66%
W 74% 72% 72% 67%
SW 79% 78% 64% 59%
NW 74% 74% 74% 64%
W 82% 79% 75% 69%
(Source: Scottish National Statistics, 2011)
The Scottish Index of Multiple Deprivation for housing focuses on the inadequacy of housing and covers the suitability and physical condition of housing (but does not include data from the Scottish House Condition Survey due to the small sample sizes). Instead, the data are based on indicators such as the 2001 census on overcrowding, lack of basic amenities and vacant dwellings. The results are given in Table 51. The regions with the most deprived datazones are the West (16%) and East (10%), while the greatest proportion of most affluent datazones is in the North East (13%). The East and West Regions also have a high proportion of datazones in the most affluent for housing (10% each) showing that there is significant diversity in these two regions. The West Region is the most deprived overall, with an average rating of 2,866. The North East Region is the most affluent overall (3,899) suggesting that it has the most adequate housing. This is supported by data from Table 51, where the North East Region had the lowest level of housing that failed the SHQS.
Table 51. Rank of deprivation for housing
Overall N NE E SW W NW
Min (most deprived) 685 176 1 1,057 2 1,006
Max (most affluent) 6,153 6,505 6,505 6,391 6,500 5,424
Average 3,650 3,899 3,244 3,837 2,886 3,066
10% most deprived (total) 0 21 367 0 261 0
10% most deprived (as % of all) 0% 2% 10% 0% 16% 0%
10% most affluent (total) 4 113 363 4 167 0
10% most affluent (as % of all) 5% 13% 10% 4% 10% 0%
(Source: Scottish National Statistics, 2011)
Affordability of housing is also important. Total council housing debt in Scotland was estimated at £2,690 million in 2011, the equivalent of £8,492 per house. Total debt has risen since 2008 (from £1,842 million) but before then it had fallen (from £4,152 million in 1997). This is equivalent to £6,678 per house in 1997, falling to £5,385 per house in 2005, increasing to £5,646 in 2008 and to £8,492 per house in 2011. The highest amount of debt per property is in North Region at an average of £20,518 per house (2011 with the lowest being in West Region (£8,054 per house). The averages mask a lot of variation between local authorities, with a maximum debt of £25,212 (Shetland, North Region) and a minimum of £3,356 (Falkirk, East Region) (Scottish National Statistics, 2011).
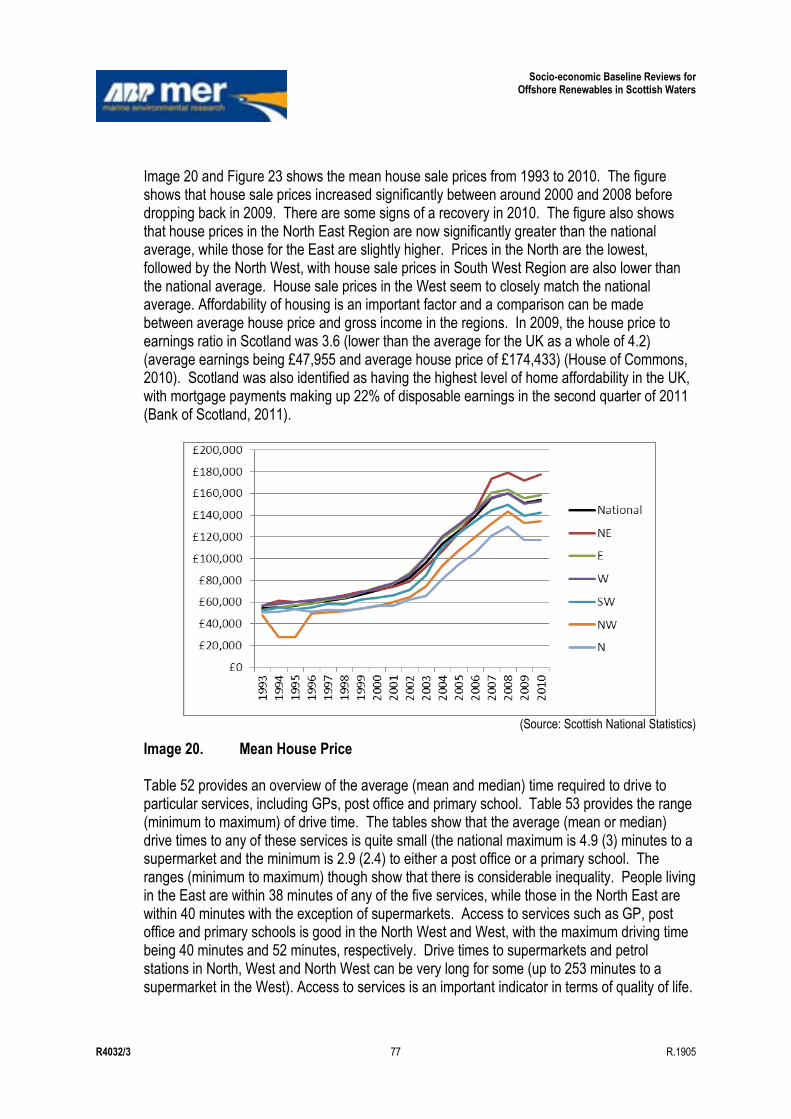
Socio-economic Baseline Reviews for Offshore Renewables in Scottish Waters
R4032/3 77 R.1905
Image 20 and Figure 23 shows the mean house sale prices from 1993 to 2010. The figure shows that house sale prices increased significantly between around 2000 and 2008 before dropping back in 2009. There are some signs of a recovery in 2010. The figure also shows that house prices in the North East Region are now significantly greater than the national average, while those for the East are slightly higher. Prices in the North are the lowest, followed by the North West, with house sale prices in South West Region are also lower than the national average. House sale prices in the West seem to closely match the national average. Affordability of housing is an important factor and a comparison can be made between average house price and gross income in the regions. In 2009, the house price to earnings ratio in Scotland was 3.6 (lower than the average for the UK as a whole of 4.2) (average earnings being £47,955 and average house price of £174,433) (House of Commons, 2010). Scotland was also identified as having the highest level of home affordability in the UK, with mortgage payments making up 22% of disposable earnings in the second quarter of 2011 (Bank of Scotland, 2011).
(Source: Scottish National Statistics)
Image 20. Mean House Price Table 52 provides an overview of the average (mean and median) time required to drive to particular services, including GPs, post office and primary school. Table 53 provides the range (minimum to maximum) of drive time. The tables show that the average (mean or median) drive times to any of these services is quite small (the national maximum is 4.9 (3) minutes to a supermarket and the minimum is 2.9 (2.4) to either a post office or a primary school. The ranges (minimum to maximum) though show that there is considerable inequality. People living in the East are within 38 minutes of any of the five services, while those in the North East are within 40 minutes with the exception of supermarkets. Access to services such as GP, post office and primary schools is good in the North West and West, with the maximum driving time being 40 minutes and 52 minutes, respectively. Drive times to supermarkets and petrol stations in North, West and North West can be very long for some (up to 253 minutes to a supermarket in the West). Access to services is an important indicator in terms of quality of life.
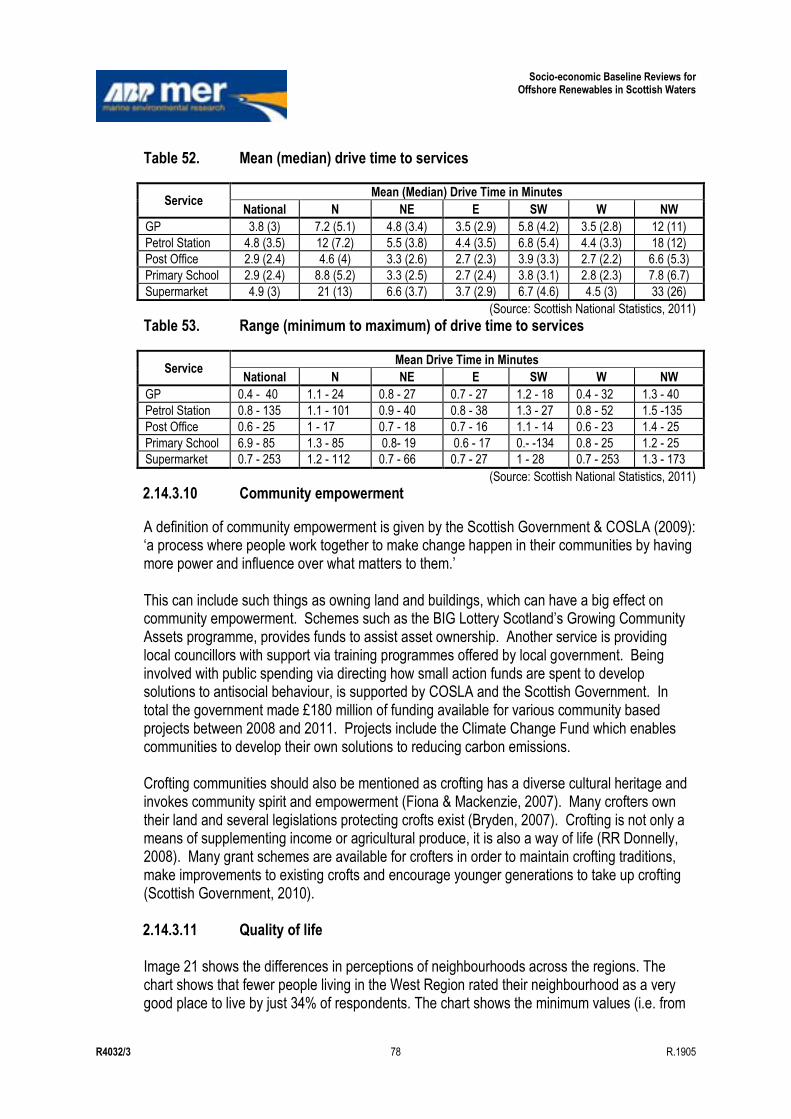
Socio-economic Baseline Reviews for Offshore Renewables in Scottish Waters
R4032/3 78 R.1905
Table 52. Mean (median) drive time to services
Service Mean (Median) Drive Time in Minutes
National N NE E SW W NW
GP 3.8 (3) 7.2 (5.1) 4.8 (3.4) 3.5 (2.9) 5.8 (4.2) 3.5 (2.8) 12 (11)
Petrol Station 4.8 (3.5) 12 (7.2) 5.5 (3.8) 4.4 (3.5) 6.8 (5.4) 4.4 (3.3) 18 (12)
Post Office 2.9 (2.4) 4.6 (4) 3.3 (2.6) 2.7 (2.3) 3.9 (3.3) 2.7 (2.2) 6.6 (5.3)
Primary School 2.9 (2.4) 8.8 (5.2) 3.3 (2.5) 2.7 (2.4) 3.8 (3.1) 2.8 (2.3) 7.8 (6.7)
Supermarket 4.9 (3) 21 (13) 6.6 (3.7) 3.7 (2.9) 6.7 (4.6) 4.5 (3) 33 (26)
(Source: Scottish National Statistics, 2011)
Table 53. Range (minimum to maximum) of drive time to services
Service Mean Drive Time in Minutes
National N NE E SW W NW
GP 0.4 - 40 1.1 - 24 0.8 - 27 0.7 - 27 1.2 - 18 0.4 - 32 1.3 - 40
Petrol Station 0.8 - 135 1.1 - 101 0.9 - 40 0.8 - 38 1.3 - 27 0.8 - 52 1.5 -135
Post Office 0.6 - 25 1 - 17 0.7 - 18 0.7 - 16 1.1 - 14 0.6 - 23 1.4 - 25
Primary School 6.9 - 85 1.3 - 85 0.8- 19 0.6 - 17 0.- -134 0.8 - 25 1.2 - 25
Supermarket 0.7 - 253 1.2 - 112 0.7 - 66 0.7 - 27 1 - 28 0.7 - 253 1.3 - 173
(Source: Scottish National Statistics, 2011)
2.14.3.10 Community empowerment
A definition of community empowerment is given by the Scottish Government & COSLA (2009): „a process where people work together to make change happen in their communities by having more power and influence over what matters to them.‟ This can include such things as owning land and buildings, which can have a big effect on community empowerment. Schemes such as the BIG Lottery Scotland‟s Growing Community Assets programme, provides funds to assist asset ownership. Another service is providing local councillors with support via training programmes offered by local government. Being involved with public spending via directing how small action funds are spent to develop solutions to antisocial behaviour, is supported by COSLA and the Scottish Government. In total the government made £180 million of funding available for various community based projects between 2008 and 2011. Projects include the Climate Change Fund which enables communities to develop their own solutions to reducing carbon emissions. Crofting communities should also be mentioned as crofting has a diverse cultural heritage and invokes community spirit and empowerment (Fiona & Mackenzie, 2007). Many crofters own their land and several legislations protecting crofts exist (Bryden, 2007). Crofting is not only a means of supplementing income or agricultural produce, it is also a way of life (RR Donnelly, 2008). Many grant schemes are available for crofters in order to maintain crofting traditions, make improvements to existing crofts and encourage younger generations to take up crofting (Scottish Government, 2010). 2.14.3.11 Quality of life Image 21 shows the differences in perceptions of neighbourhoods across the regions. The chart shows that fewer people living in the West Region rated their neighbourhood as a very good place to live by just 34% of respondents. The chart shows the minimum values (i.e. from
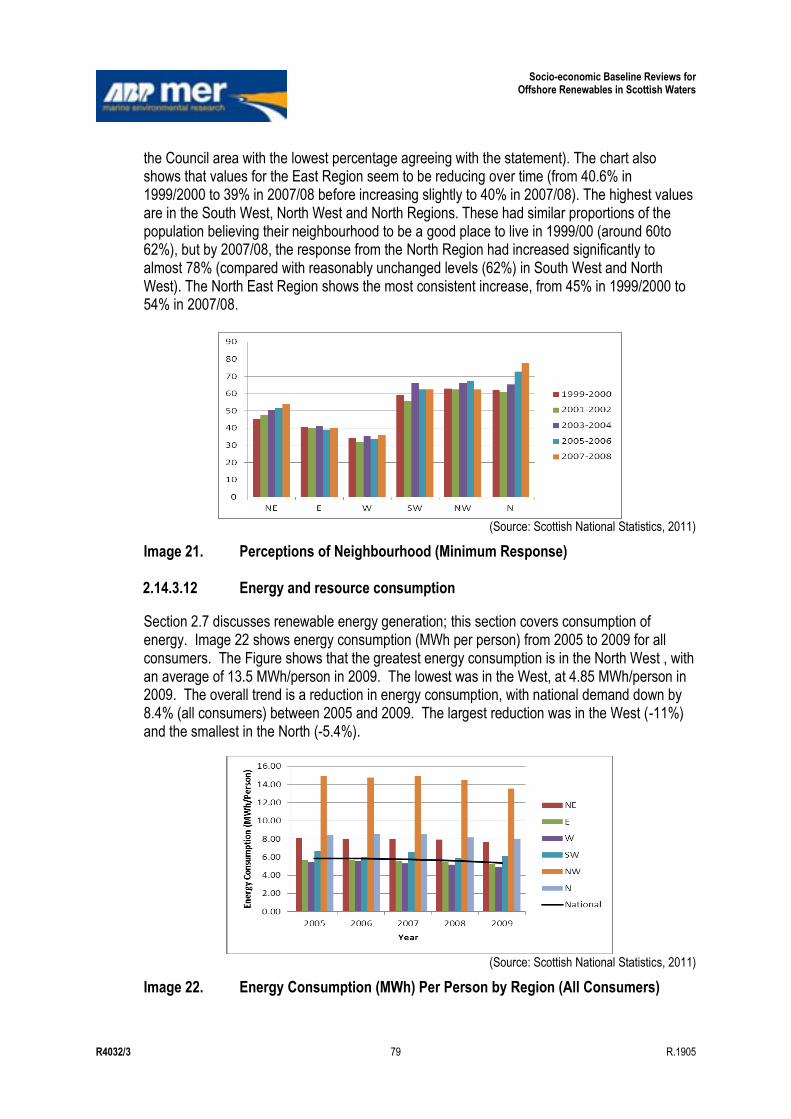
Socio-economic Baseline Reviews for Offshore Renewables in Scottish Waters
R4032/3 79 R.1905
the Council area with the lowest percentage agreeing with the statement). The chart also shows that values for the East Region seem to be reducing over time (from 40.6% in 1999/2000 to 39% in 2007/08 before increasing slightly to 40% in 2007/08). The highest values are in the South West, North West and North Regions. These had similar proportions of the population believing their neighbourhood to be a good place to live in 1999/00 (around 60to 62%), but by 2007/08, the response from the North Region had increased significantly to almost 78% (compared with reasonably unchanged levels (62%) in South West and North West). The North East Region shows the most consistent increase, from 45% in 1999/2000 to 54% in 2007/08.
(Source: Scottish National Statistics, 2011)
Image 21. Perceptions of Neighbourhood (Minimum Response) 2.14.3.12 Energy and resource consumption
Section 2.7 discusses renewable energy generation; this section covers consumption of energy. Image 22 shows energy consumption (MWh per person) from 2005 to 2009 for all consumers. The Figure shows that the greatest energy consumption is in the North West , with an average of 13.5 MWh/person in 2009. The lowest was in the West, at 4.85 MWh/person in 2009. The overall trend is a reduction in energy consumption, with national demand down by 8.4% (all consumers) between 2005 and 2009. The largest reduction was in the West (-11%) and the smallest in the North (-5.4%).
(Source: Scottish National Statistics, 2011)
Image 22. Energy Consumption (MWh) Per Person by Region (All Consumers)
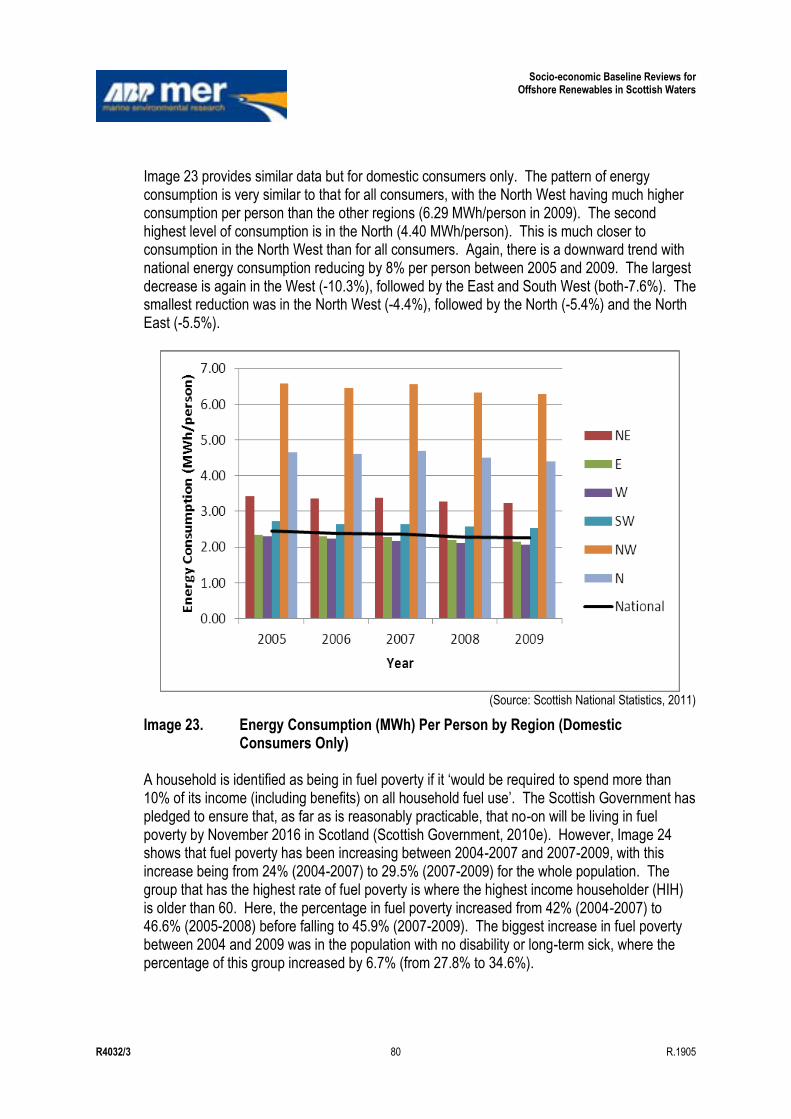
Socio-economic Baseline Reviews for Offshore Renewables in Scottish Waters
R4032/3 80 R.1905
Image 23 provides similar data but for domestic consumers only. The pattern of energy consumption is very similar to that for all consumers, with the North West having much higher consumption per person than the other regions (6.29 MWh/person in 2009). The second highest level of consumption is in the North (4.40 MWh/person). This is much closer to consumption in the North West than for all consumers. Again, there is a downward trend with national energy consumption reducing by 8% per person between 2005 and 2009. The largest decrease is again in the West (-10.3%), followed by the East and South West (both-7.6%). The smallest reduction was in the North West (-4.4%), followed by the North (-5.4%) and the North East (-5.5%).
(Source: Scottish National Statistics, 2011)
Image 23. Energy Consumption (MWh) Per Person by Region (Domestic Consumers Only)
A household is identified as being in fuel poverty if it „would be required to spend more than 10% of its income (including benefits) on all household fuel use‟. The Scottish Government has pledged to ensure that, as far as is reasonably practicable, that no-on will be living in fuel poverty by November 2016 in Scotland (Scottish Government, 2010e). However, Image 24 shows that fuel poverty has been increasing between 2004-2007 and 2007-2009, with this increase being from 24% (2004-2007) to 29.5% (2007-2009) for the whole population. The group that has the highest rate of fuel poverty is where the highest income householder (HIH) is older than 60. Here, the percentage in fuel poverty increased from 42% (2004-2007) to 46.6% (2005-2008) before falling to 45.9% (2007-2009). The biggest increase in fuel poverty between 2004 and 2009 was in the population with no disability or long-term sick, where the percentage of this group increased by 6.7% (from 27.8% to 34.6%).
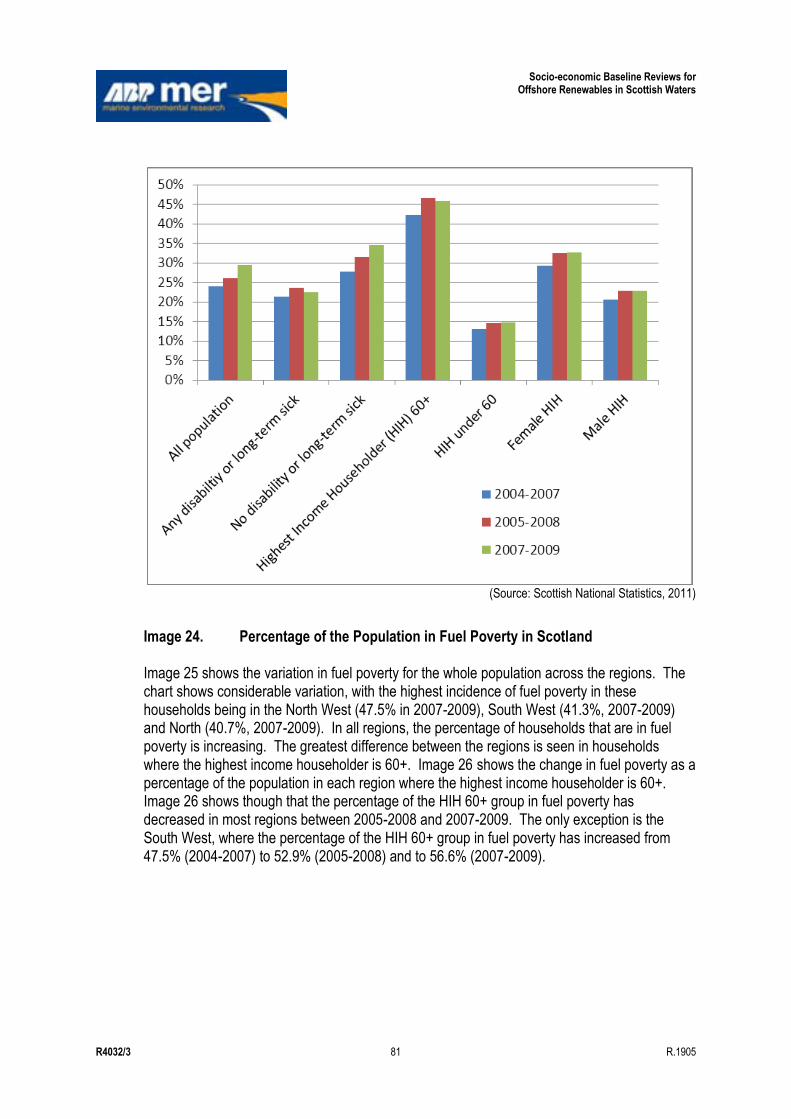
Socio-economic Baseline Reviews for Offshore Renewables in Scottish Waters
R4032/3 81 R.1905
(Source: Scottish National Statistics, 2011)
Image 24. Percentage of the Population in Fuel Poverty in Scotland
Image 25 shows the variation in fuel poverty for the whole population across the regions. The chart shows considerable variation, with the highest incidence of fuel poverty in these households being in the North West (47.5% in 2007-2009), South West (41.3%, 2007-2009) and North (40.7%, 2007-2009). In all regions, the percentage of households that are in fuel poverty is increasing. The greatest difference between the regions is seen in households where the highest income householder is 60+. Image 26 shows the change in fuel poverty as a percentage of the population in each region where the highest income householder is 60+. Image 26 shows though that the percentage of the HIH 60+ group in fuel poverty has decreased in most regions between 2005-2008 and 2007-2009. The only exception is the South West, where the percentage of the HIH 60+ group in fuel poverty has increased from 47.5% (2004-2007) to 52.9% (2005-2008) and to 56.6% (2007-2009).
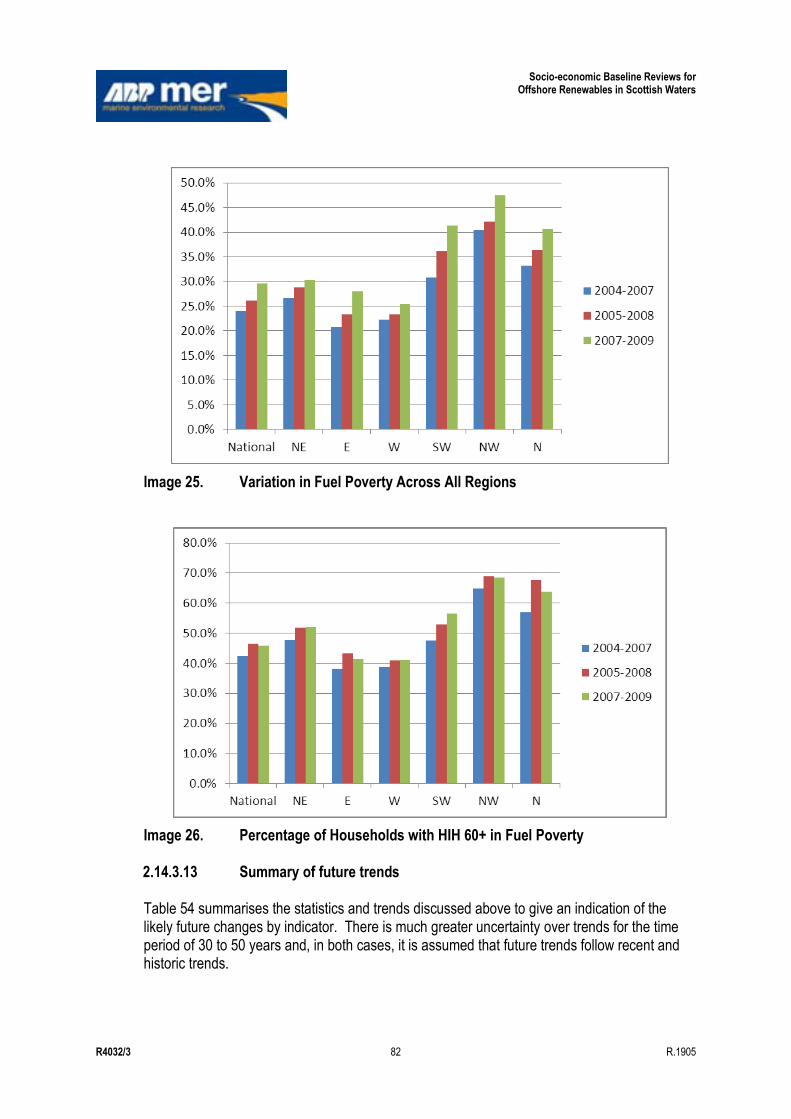
Socio-economic Baseline Reviews for Offshore Renewables in Scottish Waters
R4032/3 82 R.1905
Image 25. Variation in Fuel Poverty Across All Regions
Image 26. Percentage of Households with HIH 60+ in Fuel Poverty 2.14.3.13 Summary of future trends Table 54 summarises the statistics and trends discussed above to give an indication of the likely future changes by indicator. There is much greater uncertainty over trends for the time period of 30 to 50 years and, in both cases, it is assumed that future trends follow recent and historic trends.
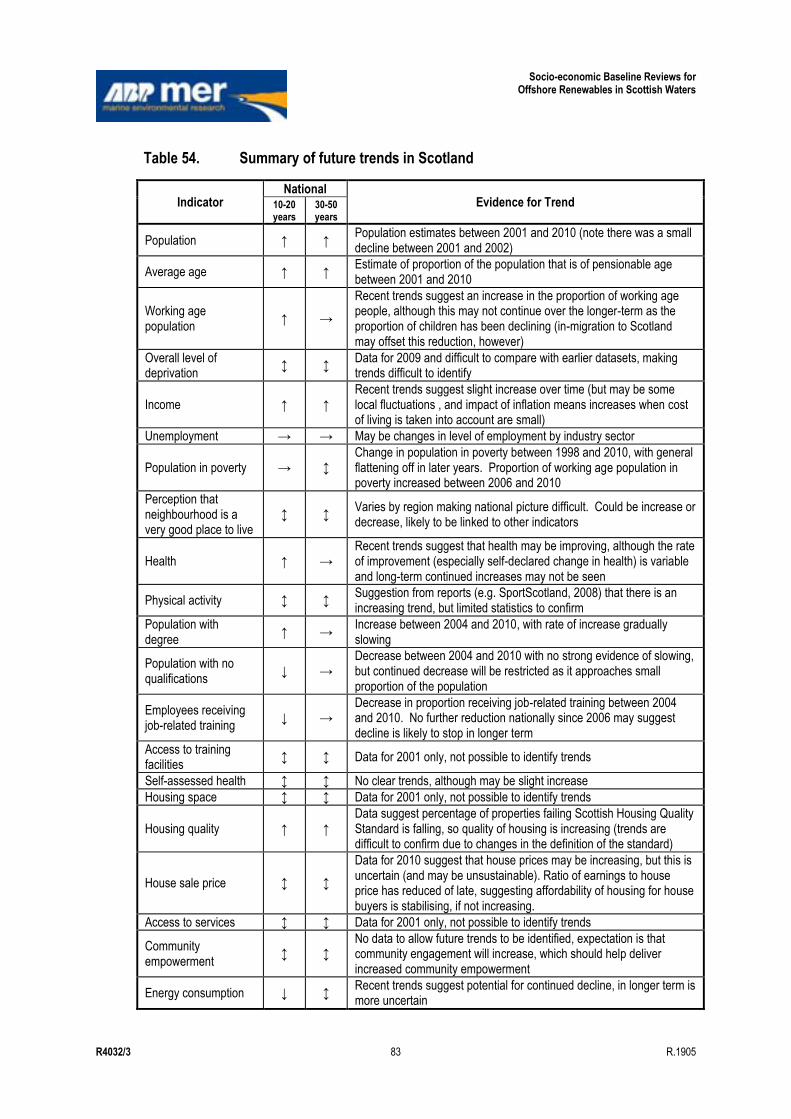
Socio-economic Baseline Reviews for Offshore Renewables in Scottish Waters
R4032/3 83 R.1905
Table 54. Summary of future trends in Scotland
Indicator National
Evidence for Trend 10-20 years
30-50 years
Population ↑ ↑ Population estimates between 2001 and 2010 (note there was a small decline between 2001 and 2002)
Average age ↑ ↑ Estimate of proportion of the population that is of pensionable age between 2001 and 2010
Working age population
↑ →
Recent trends suggest an increase in the proportion of working age people, although this may not continue over the longer-term as the proportion of children has been declining (in-migration to Scotland may offset this reduction, however)
Overall level of deprivation
↕ ↕ Data for 2009 and difficult to compare with earlier datasets, making trends difficult to identify
Income ↑ ↑ Recent trends suggest slight increase over time (but may be some local fluctuations , and impact of inflation means increases when cost of living is taken into account are small)
Unemployment → → May be changes in level of employment by industry sector
Population in poverty → ↕ Change in population in poverty between 1998 and 2010, with general flattening off in later years. Proportion of working age population in poverty increased between 2006 and 2010
Perception that neighbourhood is a very good place to live
↕ ↕ Varies by region making national picture difficult. Could be increase or decrease, likely to be linked to other indicators
Health ↑ → Recent trends suggest that health may be improving, although the rate of improvement (especially self-declared change in health) is variable and long-term continued increases may not be seen
Physical activity ↕ ↕ Suggestion from reports (e.g. SportScotland, 2008) that there is an increasing trend, but limited statistics to confirm
Population with degree
↑ → Increase between 2004 and 2010, with rate of increase gradually slowing
Population with no qualifications
↓ → Decrease between 2004 and 2010 with no strong evidence of slowing, but continued decrease will be restricted as it approaches small proportion of the population
Employees receiving job-related training
↓ → Decrease in proportion receiving job-related training between 2004 and 2010. No further reduction nationally since 2006 may suggest decline is likely to stop in longer term
Access to training facilities
↕ ↕ Data for 2001 only, not possible to identify trends
Self-assessed health ↕ ↕ No clear trends, although may be slight increase
Housing space ↕ ↕ Data for 2001 only, not possible to identify trends
Housing quality ↑ ↑ Data suggest percentage of properties failing Scottish Housing Quality Standard is falling, so quality of housing is increasing (trends are difficult to confirm due to changes in the definition of the standard)
House sale price ↕ ↕
Data for 2010 suggest that house prices may be increasing, but this is uncertain (and may be unsustainable). Ratio of earnings to house price has reduced of late, suggesting affordability of housing for house buyers is stabilising, if not increasing.
Access to services ↕ ↕ Data for 2001 only, not possible to identify trends
Community empowerment
↕ ↕ No data to allow future trends to be identified, expectation is that community engagement will increase, which should help deliver increased community empowerment
Energy consumption ↓ ↕ Recent trends suggest potential for continued decline, in longer term is more uncertain
Socio-economic Baseline Reviews for Offshore Renewables in Scottish Waters
R4032/3 84 R.1905
Indicator National
Evidence for Trend 10-20 years
30-50 years
Fuel poverty ↑ →
Recent trends show an overall increase even though the Scottish Government policy is that there should be no fuel poverty in the medium to long-term (some groups such as HIH 60+ do show a recent decrease)
Key: ↑: indication of upward trend →: no significant change up or down expected ↓: indication of downward trend ↕: uncertain trend could be up or down
2.15 Telecom Cables
2.15.1 Definition of Sector/Activity This sector relates to fibre optic submarine telecommunication cables, which carry telephone calls, internet connections and data as part of national and international data transfer networks utilised for the majority of international communication transmissions.
2.15.2 Description of Information Sources A range of information has been accessed to inform this baseline, including published reports, spatial data layers and other specific information provided through stakeholder engagement (Table 55). Table 55. Information sources for telecomm cables baseline
Scale Information Available Date Source
Regional Telecom Cable Routes including both in and out of service cables.
Issue 13/ January 2011
KIS-CA http://www.kisca.org.uk/charts.htm
Scotland All pipelines and cables Current SeaZone Solutions Ltd
Scotland Overview of Telecommunication cables, with lengths of active cables per region.
No date Baxter et al (2011)
2.15.2.1 Data limitations In general, the data available on subsea cables is limited and there is currently no agreed method for valuing the services provided by cables as they form part of a wider infrastructure. The approaches used at present will either result in a under or over estimation of the actual value of the cables (ABPmer and RPA, 2011). In addition to the lack of baseline value there is no information on employment in this sector and little information on how this service may change in the future to inform future trends (Saunders et al, 2011).
2.15.3 National Overview of Current Activity 2.15.3.1 Distribution level and intensity of activity Telecommunication cables within the Scottish Continental shelf include fibre optic international cable links and domestic inter-island cables which are mainly copper wire. Over 4000km of
Socio-economic Baseline Reviews for Offshore Renewables in Scottish Waters
R4032/3 85 R.1905
international cables (comprising approximately 40% of all the UK‟s active international cables) and 600km of inshore cables exist in Scottish seas (Baxter et al, 2011) (see Figure 24). An international network passes North and South of Shetland (present in the North and North West SORERs) connecting Europe to North America, Faroe Islands, Iceland and Greenland, while networks connecting Scotland and Northern Ireland occur in the West and South West SORERs. Cables connecting the Scottish mainland and island communities (in Orkney and Shetland) occur in the North East and North SORERs. The location of the cables passing through the SORERs and the designed data capacity are reviewed in more detail in the Regional overviews. 2.15.3.2 Economic value and employment Baxter et al (2011) reported that the estimated value of the whole telecommunications industry in Scottish waters is £1.02 billion, meaning that it is not possible to value the underwater cables as a separate entity and thus vastly overestimating the value of this element of the industry. Therefore as the economic value of underwater cables and any associated employment contribution can not be fully determined they have not been considered further in the context of this study. 2.15.3.3 Historical trends This sector has seen substantial growth over the last decade (UKMMAS, 2010), as illustrated by the date on which the subsea telecommunications cables passing through the SORERs came into service (Table 56). Table 56. Submarine cables passing through the SREZs and date cables in-service
Cable Date In Service
UK-DENMARK 4 - Seg 2 BT 1988 (in service) 2004 (out of service)
SCOTLAND-N.IRELAND 1 1989
UK/CH.ISLANDS 7 1989
BT-Mt 1 1990
LANIS 2 1992
LANIS 3 1992
LANIS 3 1992
TAT 10B WEST SECTION 1992
SCOTLAND-N.IRELAND 2 1993
SCOTLAND-N.IRELAND 2 1993
UK-CH.ISLANDS 8 1994
CANTAT 3 FC3 1994 (in service) 2010 (out of service)
CANTAT 3 F4 1994 (in service) 2010 (out of service)
ATLANTIC CROSSING 1 (AC1) Seg.A 1998
ATLANTIC CROSSING 1 (AC1) Seg.A 1998
NORSEA COMS a 1999
NORSEA COMS b 1999
BT-Manx NI 2000
SIRIUS NORTH 2000
SIRIUS NORTH 2000
HIBERNIA 'A' 2001
HIBERNIA 'A' 2001
Socio-economic Baseline Reviews for Offshore Renewables in Scottish Waters
R4032/3 86 R.1905
Cable Date In Service
HIBERNIA 'A' N.I.Branch 2001
TAT 14(K) 2001
TAT 14(K) 2001
Central North Sea (CNS) FIBRE OPTIC* 2001
PANGEA NORTH UK/DMK 2001
FARICE (2) 2004
NORTHERN LIGHTS 2008
SHEFA-2 Seg 7-1 2008
SHEFA-2 Seg 7-3 2008
SHEFA-2 Seg 8 2008
SHEFA-2 Seg 9 2008
SHEFA-2 Seg5 2008
SHEFA-2 Seg6 2008
SHEFA-2 Seg 9 2008
DANICE Seg.1 2009
TAT 10B EAST SECTION 1992 (in service) 2003 (out of service)
TAT 10B WEST SECTION 1992 (in service) 2003 (out of service)
IOM/NORTHERN IRELAND Information not found
(Sources: www.kisca.org.uk; http://www.cablemap.info/default.aspx; and http://www.submarinecablemap.com/)
2.15.3.4 Future trends According to the UK Cable Protection Committee (UKCPC) data shows that 95% of international trans-ocean traffic is carried by cable, hence, submarine cables will be vital for the foreseeable future (Baxter et al, 2011). However, there is little information available on how this sector may change in the future (Saunders et al, 2011). According to UKMMAS (2010), changes in bandwidth and the development of high speed internet as well as continued growth in the sector are using up the spare capacity in the current telecommunication networks. The further development of more resilient networks requires a greater reliance on a number of submarine cable routes rather than a few, and major domestic and international systems are now being installed. Future developments in telecom cables are likely to focus on upgrading and increasing the capacity of existing cables along the same routes that are currently present (ABPmer, RPA & SQW, 2011). The extent to which new cables will be laid in Scottish waters is not known (Baxter et al, 2011).
2.16 Tourism
2.16.1 Definition of Sector/Activity This section covers baseline tourism and recreation data. Tourism can be defined as „a stay of one or more nights away from home for holidays, visits to friends or relatives, business/conference trips or any other purposes excluding activities such as boarding education or semi-permanent employment‟ (VisitScotland25). In this baseline, day trips are also included. Marine and coastal tourism can be defined as any recreational activity that makes
25 See VisitScotland Internet site (http://www.visitscotland.com/). The definition of sport includes casual participation
in physical recreations such as walking (2+ miles), dance, darts and snooker/billiards/pool as well as more organised sports.

Socio-economic Baseline Reviews for Offshore Renewables in Scottish Waters
R4032/3 87 R.1905
use of the marine environment and intertidal coastal zones (Benfield and McConnell, 2007). This can include a range of activities such as walking along the sea-front to sea-side based horse riding. Both non-motorised (walking/picnicking) and motorised (boat-based tourism e.g. wildlife viewing) activities are also considered here. Benefits derived from the wild landscape may also be considered under tourism, indeed McMorran et al (2006) state that the most appropriate valuations of the natural landscape come from tourist expenditure. Tourist activities are also considered to influence other industries, such as accommodation, travel, food and beverage, etc.
2.16.2 Description of Information Sources Table 57. Data sources used in the tourism chapter
Scale Information Available Date Source
Local authority Percentage of adults who have attended a cultural event in past 12 months
2007/08 Scottish Neighbourhood Statistics
Local authority Percentage of adults making one or more visits to the outdoors per week
2006/08 Scottish Neighbourhood Statistics
Case studies Value of local path network to individuals and the local economy
2008
Sport Industry Research Centre (2008): What Paths do for Scottish Society: An Economic and Social Impact Study, Scottish Natural Heritage Commissioned Report No. 280 (ROAME No. RO6AA607).
Scotland Scottish Recreation Survey 2006 to
2008 Scottish Natural Heritage (cited as TNS, 2011)
Scotland Assessing Future Recreation Demand, Commissioned Report No. 404
2010 Brown, Curry, Dilley, Taylor and Clark (2010)
Scotland Economic Impact of Scotland‟s Natural Environment
2008 RPA and Cambridge Econometrics
Scotland Scotland‟s Marine Atlas 2011 Scottish Government (Baxter et al, 2011)
Scotland
Basking Shark Hotspots on the West Coast of Scotland: Key sites, threats and implications for conservation of the species, Commissioned Report No. 339.
2009 Speedie, Johnson and Witt (2009)
Scotland
VisitScotland: Domestic Tourism – Review of Domestic Overnight Tourism to Scotland in 2010 and International Tourism – Review of International Overnight Tourism to Scotland in 2010
2011 VisitScotland
Scotland Scottish Tourism: the next decade 2006 Scottish Executive
Scotland Nature Based Tourism in the Outer Hebrides, Commissioned Report No. 353
2010 Taylor, Bryden, Westbrook and Anderson (2010)
Scotland Marine and Coastal Visitor Management and Interpretation in Argyll and the Islands: the way forward.
2007 Benfield and McConnell (2007)
Scotland A review of the benefits and opportunities attributed to Scotland‟s landscapes of wild character
2006 McMorran, Price and McVittie (2006) No. 194 (ROAME No. F04NC18)
Scotland The Economic Impact of Wildlife Tourism in Scotland
2010 Scottish Government (2010)

Socio-economic Baseline Reviews for Offshore Renewables in Scottish Waters
R4032/3 88 R.1905
Scale Information Available Date Source
Scotland and Worldwide
Whale Watching Worldwide 2008 IFAW (2009)
Scotland Tourism Attitudes Survey 2001 NFO System Three Social Research and MORI (2002)
Scotland The tangle of the Clyde, why we must reform the management of Scotland‟s marine environment
2004 Joint Marine Programme (2004)
Scotland The Future of Cetacean Watching in Scotland under Different Climate Change Scenarios
2011 Lambert, MacLeod, Hunter and Pierce (2011)
2.16.2.1 Data limitations Though a comprehensive review of the tourist industry exists in the data, much of this information does not relate specifically to coastal areas (for example, data on overall tourism turnover are available, but it is not clear what proportion relates to marine and coastal tourism). Therefore, where data are not available, countrywide studies and figures have been included in this baseline to provide an indication of the overall value of tourism. Some of this value can be attributed to marine and coastal tourism.
2.16.3 National Overview of Current Activity 2.16.3.1 Location of current activity Figures 25, 26, 27 and 28 show the locations of the various tourist related sites within Scotland. Although there is a high concentration of sites within the central belt, coastal areas are also well represented with a range of site types present in all regions including the North East, North West and North. Indeed, in these three regions the majority of tourist sites are located on the coast rather than inland. Table 58 provides summary statistics on the type of places visited for recreation. The table shows that the seaside accounted for around 12% to 13% of visits by respondents to the Scottish Recreation Survey, 2011. These visits represent those most likely to be affected by offshore renewables. Table 58. Places visited
Activity 2006 2007 2008
% (Number of Visits) % (Number of Visits) % (Number of Visits)
A town or city 30% (22,149) 35% (27,530) 40% (35,449)
The countryside (including inland villages) 58% (43,296) 52% (40,998) 46% (40,585)
The seaside (a resort or the coast) 13% (9,592) 12% (9,692) 13% (11,529)
(Source: Scottish Recreation Survey, 2011)
Considering coastal activities in particular, Baxter et al (2011) highlight some of the areas within Scotland which provide for marine related recreation:
Socio-economic Baseline Reviews for Offshore Renewables in Scottish Waters
R4032/3 89 R.1905
The Firth of Clyde and the West Coast are renowned for sailing, with opportunities for day sailing, racing and cruising. The presence of facilities including marinas, boatyards and moorings helps increase the attractiveness of the area for this type of activity;
Recreational sea angling occurs all around the Scottish coast, although Dumfries and Galloway, the West coast in Argyll and the North East coast are hotspots;
Diving occurs in many areas including the Orkneys, sea lochs off the West coast and the Sound of Mull, Argyll, the Moray Firth and Northwest Scotland. Investment has recently tried to enhance diver numbers in the South East (e.g. around St Abbs Head);
Surfing often occurs on the South East coast, although more extreme conditions are found on the Western and Northern coasts, with Thurso hosting the O‟Neill Highland Open. Tiree on the West holds the Tiree Wave Classic and also provides a venue for events by the Professional Windsurfing Association;
Canoeing and kayaking occur in coastal areas where access is available; and Wildlife watching is popular, with significant increases in cetacean watching in the
Moray Firth documented in the past two decades. Coastal bird watching is also popular, e.g. at the Scottish Sea Bird Centre at North Berwick.
All of the marine and coastal related activities given above will have some level of interest in marine planning (Baxter et al, 2011) and hence the development of renewable energy generation. However, it should be noted that a planning decision will often be made on the basis of whether the hinterland can support the development, rather than if the marine environment can support the required use (Baxter et al, 2011). This issue will likely be critical for many offshore renewables projects.
2.16.3.2 Types of activity
People undertake a range of activities relating to the marine and coastal environment in Scotland. However, Scotland‟s Marine Atlas (Baxter et al, 2011) notes that there is not much standardised information on participation in marine related leisure activities. Individual groups or sectors may gather their own data, for example, the British Marine Federation (BMF) has used estimates of participation for 2007-2009 to indicate that the five most popular marine leisure related activities in Scotland are (ibid) 26::
Spending general leisure time at the beach: 309,250; Coastal walking: 230,500; Outdoor swimming: 224,500; Boating activity: 213,750; and Sea angling from shore or boat 139,000.
Scottish Natural Heritage (SNH) has also worked on marine and coastal recreation in Scotland, and has determined that walking/hiking is one of the more popular activities (see Image 27) (Baxter et al, 2011). Note that all of the above activities have the potential to be impacted by offshore renewables; for example, those walking along the beach may be able to see turbines, whilst those boating may be affected by greater levels of boat traffic (due to crafts serving the generation devices).
26 Note that the figures are aggregated estimates for 2007-2009, thus they indicate the likely number of people
participating in each activity over a three year time period.
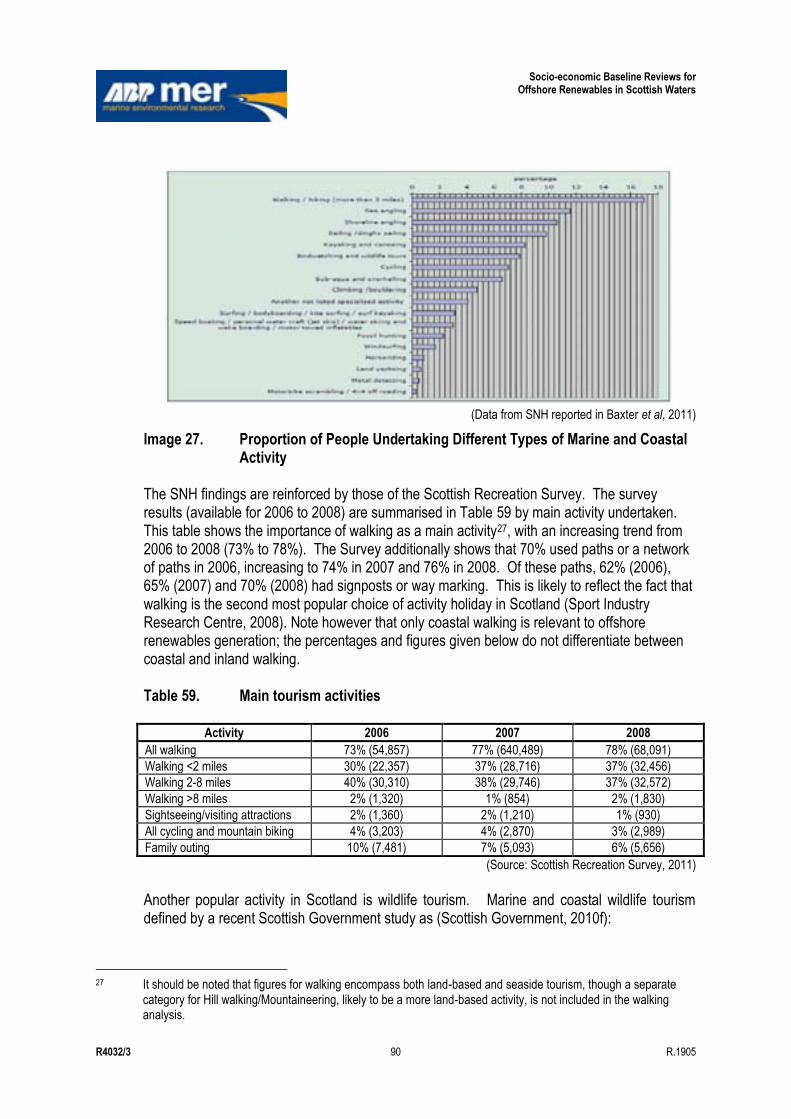
Socio-economic Baseline Reviews for Offshore Renewables in Scottish Waters
R4032/3 90 R.1905
(Data from SNH reported in Baxter et al, 2011)
Image 27. Proportion of People Undertaking Different Types of Marine and Coastal Activity
The SNH findings are reinforced by those of the Scottish Recreation Survey. The survey results (available for 2006 to 2008) are summarised in Table 59 by main activity undertaken. This table shows the importance of walking as a main activity27, with an increasing trend from 2006 to 2008 (73% to 78%). The Survey additionally shows that 70% used paths or a network of paths in 2006, increasing to 74% in 2007 and 76% in 2008. Of these paths, 62% (2006), 65% (2007) and 70% (2008) had signposts or way marking. This is likely to reflect the fact that walking is the second most popular choice of activity holiday in Scotland (Sport Industry Research Centre, 2008). Note however that only coastal walking is relevant to offshore renewables generation; the percentages and figures given below do not differentiate between coastal and inland walking. Table 59. Main tourism activities
Activity 2006 2007 2008
All walking 73% (54,857) 77% (640,489) 78% (68,091)
Walking <2 miles 30% (22,357) 37% (28,716) 37% (32,456)
Walking 2-8 miles 40% (30,310) 38% (29,746) 37% (32,572)
Walking >8 miles 2% (1,320) 1% (854) 2% (1,830)
Sightseeing/visiting attractions 2% (1,360) 2% (1,210) 1% (930)
All cycling and mountain biking 4% (3,203) 4% (2,870) 3% (2,989)
Family outing 10% (7,481) 7% (5,093) 6% (5,656)
(Source: Scottish Recreation Survey, 2011)
Another popular activity in Scotland is wildlife tourism. Marine and coastal wildlife tourism defined by a recent Scottish Government study as (Scottish Government, 2010f):
27 It should be noted that figures for walking encompass both land-based and seaside tourism, though a separate
category for Hill walking/Mountaineering, likely to be a more land-based activity, is not included in the walking analysis.

Socio-economic Baseline Reviews for Offshore Renewables in Scottish Waters
R4032/3 91 R.1905
Marine – studying or viewing marine mammals from a boat; and Coastal – studying/viewing/enjoying wildlife on the coast, which includes viewing birds
from a boat and watching marine mammals from land. Both of these types of tourism may be affected by offshore renewable energy generation, for example, increasing numbers of boats for service activities for energy generation structures may impact the space available for tourist related craft. The popularity of wildlife tourism in Scotland is probably partially influenced by the number of designated Marine Special Areas of Conservation28; there are 36 sites in total covering intertidal waters, reefs, coastline and seal breeding areas. Indeed in a survey carried out by IFAW (2009), Scotland had the largest proportion of Europe‟s cetacean watchers with 27%. This equated to 3% of the global number of cetacean watchers, with 223,941 tourists taking part. Marine and coastal wildlife tourism in Scotland (including cetacean related tourism) has a combined total expenditure of £160 million and total income of £92 million (Table 60), with peak activity occurring in May and June (Scottish Government, 2010). Table 60. Economic contribution by type of wildlife tourism
Area Expenditure £ million Income £ million
Terrestrial 114 64
Marine 63 36
Coastal 100 56
Total 277 156
(Source: Scottish Wildlife Tourism, 2011)
2.16.3.3 Expenditure and income Tourism puts £4.5 billion turnover into the Scottish economy each year and employs around 200,000 people (Sport Industry Research Centre, 2008)29. Certain areas of the country do particularly well from tourism; the Cairngorms National Park economy receives substantial income from tourists (RPA and Cambridge Econometrics, 2008). The popularity of walking has also brought in considerable income in the past. UK residents who visited Scotland specifically to go walking spent £125 million per year, made 400,000 trips and generated 2.7 million bed-nights in the period 2001-2003, (this excludes spending by overseas visitors) (Sport Industry Research Centre, 2008). Although these figures are rather dated, and cover all walking as opposed to just coastal walking, they indicate that the activity is likely to be making an important contribution to Scotland‟s tourism economy. The tourism figures above may also provide an indication of the value of some of the benefits from wild land, wilderness and tranquillity. Although McMorran et al (2008) note that few studies enable the benefits from wild land to be identified, they comment that recreation and
28 http://jncc.defra.gov.uk/page-1445 29 Note that it is not clear how much of this figure can be allocated to marine and coastal tourism; this lack of
information represents a data gap.
Socio-economic Baseline Reviews for Offshore Renewables in Scottish Waters
R4032/3 92 R.1905
tourism data do provide some information. For example, in the Highlands and Islands Enterprise area, wild landscapes accounted for up to 19.9 million day visits in 2003 (ibid). These were associated with an expenditure of £411-£751 million (McMorran et al, 2008). It is likely that some of this total can be allocated to coastal tourism and thus the value of seascapes30. Other studies considering tourist expenditure include the Scottish Recreation Survey. This provides an indication of the mean expenditure during trips (across all those who spent money) and is shown in Table 61. Table 61. Mean tourism expenditure
Type of Expenditure 2006 2007 2008
A town or city £19.47 £21.55 £18.24
The countryside (including inland villages) £33.82 £35.49 £24.31
The seaside (a resort or the coast) £38.25 £45.45 £40.64
(Source: Scottish Recreation Survey, 2011)
2.16.3.4 Current and past trends
Ecotourism The Scottish Government study on wildlife tourism (2010) found the industry to be growing, even in times of recession. There was a 57% increase in visitor numbers in 2009 compared with the previous year. Of the business owners surveyed, 85% expected trade to increase. The decline in more traditional practices such as fisheries is also likely to have caused a shift to the marine leisure and tourism industry (Joint Marine Programme, 2004). Cetacean related tourism in particular saw huge growth in the last decade, and a 2008 survey found that the number of whale watchers had almost doubled since 1998, with an average growth rate of 8.5% in the last 10 years (IFAW, 2009). Popularity for wildlife tourism can be related to the increasing number of wildlife programmes, such as „Springwatch‟, „Coast‟ and Monty Hall‟s „Great Escape‟ on the West Scottish coast (Scottish Government, 2010). Participation in wildlife watching has become less of a specialist interest and other activities such as photography have also become more widely available, possibly due to advances in cameras and their mass availability. Another important development is the availability of online booking, making it easy for last minute trips to be organised. The increasing awareness of the natural environment is also a factor promoting growth of this sector and developments such as Wild Scotland31 have successfully increased the profile of Scotland‟s natural resources. Respondents regard Scotland‟s wildlife resources as the single most important strength for tourists‟ reasons to VisitScotland (Scottish Government, 2010). This is likely to have knock-on impacts for the economy since wild landscapes may provide greater economic and employment benefits than agriculture and forestry combined (McMorran et al, 2008).
30 Natural landscapes and seascapes may also have value in terms of providing health and wellbeing benefits.
However, these benefits are not considered here since they are very difficult to quantify and relate to the wider population rather than just to tourists.
31 http://www.wild-scotland.org.uk/

Socio-economic Baseline Reviews for Offshore Renewables in Scottish Waters
R4032/3 93 R.1905
Cultural Events Cultural events can also attract tourists. Image 28 shows the proportion of the population who attended a cultural event in Scotland in the previous 12 months (2007-2008), while Image 29 shows the percentage who took part in a cultural event. The Image shows high attendance and participation rates across the regions (with the columns giving the minimum response across local authorities and the error bars, the maximum response).
Image 28. Proportion of the Population Who Have Attended a Cultural Event in the Past 12 Months (2007-2008)
Image 29. Proportion of the Population Who Have Taken Part in a Cultural Event in the Past 12 Months (2007-2008)
Socio-economic Baseline Reviews for Offshore Renewables in Scottish Waters
R4032/3 94 R.1905
Future Trends in Tourism Tourism within Scotland is supported by VisitScotland, whose aim is to “maximise the economic benefits of tourism to Scotland32”. VisitScotland‟s strategy has five objectives including:
Maximise the sustainable economic benefit of tourism in Scotland; Inspire through information provision; Deliver quality assurance; Work in partnership; and Establish Scotland as perfect stage for events.
The organisation is currently running a new corporate campaign entitled “The Winning Years”. This builds on a series of eight events over the years 2012-2014, with each year having a particular theme as follows:
2012 – Year of Creative Scotland; 2013 - Year of Natural Scotland; and 2014 – Year of Homecoming Scotland.
The aims of the campaign are to encourage enthusiasm, support and investment in tourism in Scotland, and to ensure that tourism businesses benefit from the opportunities available. Earlier estimates have indicated that visitor numbers to Scotland are forecast to grow at an average of 2.3% per annum from 2005 to 2015 (RPA and Cambridge Econometrics, 2008), with a 50% increase in gross tourism revenue by 2015 (from 2005) (Scottish Executive, 2006a). However, it is likely that any major developments in tourism in the short term will be affected by this campaign, and also current economic conditions. Indeed, in 2010, overnight visitors to Scotland from the United Kingdom made 12.4 million trips and spent a total of over £2.6 billion (VisitScotland, 2011). These figures represented a decline of 1% in the number of trips and a 4% decrease in expenditure when compared with 2009 data (VisitScotland, 2011). Interestingly, for the same year, international tourism showed a decline in trips of 8% but a growth in expenditure of 6% (VisitScotland, 2011). Therefore, short term tourism trends are uncertain. Considering trends in particular areas of tourism, the Scottish Recreation Survey has shown that since 2004, there has been an increase in the number of shorter duration visits made closer to home (TNS, 2011). In addition, the percentage of visits taken on foot grew from 50% to 64% in 2008 (TNS, 2010). If these trends are to continue, then it is likely that in the future more tourism will occur close to centres of population and at sites which are easily accessible. Indeed, Brown et al (2010) note that the most likely trend in future outdoor recreation is that there will be a greater range of activities available, but these will be concentrated in a smaller number of locations, dependent amongst other factors on their accessibility. This suggests that areas which are hotspots for particular activities (e.g. surfing) will be the ones which flourish. However, it should be noted that external factors, such as global climate change may also impact tourism. For example, climate change may affect the distribution and range of cetacean species and thus wildlife watching tourism in Scotland (Lambert et al, 2011). However as such tourism develops, it is important that proper guidelines and management are enforced, so that
32 See VisitScotland Internet site: (http://www.visitscotland.org/).
Socio-economic Baseline Reviews for Offshore Renewables in Scottish Waters
R4032/3 95 R.1905
the growing trend in recreational activities involving the marine and coastal environment does not compromise or destroy the assets which attract so many visitors (Joint Marine Programme, 2004).
2.16.3.5 Employment
Marine and coastal tourism generated 4,386 full-time positions in 2009 (Table 62). It should be noted that wildlife tourism supports mainly small enterprises, which employ large numbers of seasonal volunteers; 10% use more than 16 volunteers (Scottish Government, 2010).
Table 62. Employment generated from wildlife tourism
Area Employment
FTE Employees
Terrestrial 3,061
Marine 1705
Coastal 2681
Total 7446
(Source: Scottish Government, 2010)
2.17 Waste Disposal
2.17.1 Definition of Sector/Activity
This sector includes the disposal of material, dredged from ports, harbours and marinas, into the marine environment. This type of waste disposal is only allowed where the material cannot be used beneficially, for example to replenish beaches or in construction projects.
2.17.2 Description of Information Sources
A range of information has been accessed to inform this baseline, including published reports, spatial data layers and other specific information provided through stakeholder engagement (Table 63).
Table 63. Information sources for waste disposal baseline
Scale Information Available Date Source
UK Dredge disposal sites and volumes disposed of in the OSPAR Maritime Area
2009
OSPAR, 2009: http://www.ospar.org/documents/dbase/publications/p00433_JAMP%20Dumping%20Assessment.pdf
Scotland Potential future port developments 2009 National Planning Framework for Scotland (Scottish Government, 2009b).
Scotland Locations and tonnage at open disposal sites
2010 Marine Scotland
2.17.2.1 Data limitations
There is no central source of information on turnover, GVA or employment associated with dredge spoil disposal (Baxter et al, 2011).

Socio-economic Baseline Reviews for Offshore Renewables in Scottish Waters
R4032/3 96 R.1905
2.17.3 National Overview of Current Activity
Location and intensity of activity In Scotland there are 66 „open‟ dredge disposal sites routinely used for disposal of material arising from the dredging of ports, harbours and marinas (see Figure 29). Open disposal sites are present in every SORER, with the highest number of open disposal sites currently in the East SORER and the lowest number in the South West SORER. A further 50 sites are closed (not used for at least ten years) or disused (not used for at least five years) (Baxter et al, 2011). During 2009, a total of 2,901,499 tonnes was dredged and deposited at sea, out of a total of 5,743,882 that was allowed under licence. Most disposal occurs in the sea areas adjacent to the highest densities of human populations and industry (Baxter et al, 2011).
2.17.4 Economic value and employment
It is not possible to calculate the GVA or the number of jobs associated with dredge spoil disposal (Baxter et al, 2011). However, the maritime transport sector, is reliant on shipping access to the coastline and without dredging of navigational channels (supported by disposal) this sector would either be limited or face costly alternative means of disposal (UKMMAS, 2010). The activity is therefore an important enabler for the much larger shipping and ports sectors.
In order for ports (and marinas, quays etc.) to be able to dispose of their dredged material they are required to apply for a disposal licence which grants them such permission. The ports are charged for their application and in the period between 2005 and 2009, 112 one year licences were issued in Scotland and their issue generated revenue of £276,035 to Marine Scotland (Baxter et al, 2011).
2.17.4.1 Historical trends
In Scotland, the number of dredged material disposal licences between 2005 and 2009 ranged from about 20 to 30, with the highest number of licences being issued in 2006 (values estimated from Baxter et al, 2011). The amount of dredged material disposed off (as wet weight tonnage) over this time period remained relatively constant (range approximately 2 to 3 million tonnes wet) with the lowest tonnage disposed of in 2006 (values estimated from Baxter et al, 2011).
2.17.4.2 Future trends
Dredging and disposal will continue to be undertaken and it is unlikely that the demand for disposal will decrease (UKMMAS, 2010; Baxter et al, 2011). The Scottish National Planning Framework 2 (Scottish Government, 2009b) identifies future port developments, which may require dredging, at the following ports:
Grangemouth - to accommodate substantial increases in freight movements; Rosyth - additional container freight capacity through deep water berthing; Scapa Flow - deep water transhipment facilities; Hunterston – deepwater container transhipment hub and maritime construction and
decommissioning yard; Loch Ryan - additional port capacity, introduction of larger vessels;
Socio-economic Baseline Reviews for Offshore Renewables in Scottish Waters
R4032/3 97 R.1905
Cromarty Firth - development of existing service base facilities and sheltered moorings for offshore Oil and Gas industry; and
Nigg - potential as a facility for decommissioning Oil and Gas installations and the manufacture and support services required by the renewable energy industry.
Such development of existing ports, or dredging to re-open old ports could result in an increased amount of dredge material for disposal and hence a potential need to develop new sea disposal sites if existing sites reach capacity (Baxter et al, 2011). However, there is an aim to minimise disposal into the marine environment, including the re-use of dredge material in land reclamation or beach re-nourishment if the dredge material is uncontaminated and physically suitable (Baxter et al, 2011). In addition, the National Renewables Infrastructure Plan (NRIP) has identified sites which, with investment in site infrastructure, would be well placed to support the offshore wind supply chain. Such infrastructure development may include dredging to increase the water depth at quayside to accommodate installation or delivery vessels. The first phase „best fit locations‟ to be focussed on in the immediate future and the more „medium term‟ locations, which may support the wind and/or wave and tidal sectors identified in the NRIP are shown in Table 64. Table 64. First phase and medium term NRIP sites identified for potential
development
Site SORER Type Site Industry Supporting
Leith E First Phase & Medium Offshore Wind
Dundee E First Phase & Medium Offshore Wind
Nigg NE First Phase & Medium Offshore Wind
Energy Park Fife at Methill E First Phase & Medium Offshore Wind & Wave and Tidal
Aberdeen NE First Phase & Medium Offshore Wind
Hunterston W First Phase & Medium Offshore Wind
Arnish NW First Phase & Medium Offshore Wind & Wave and Tidal
Campbeltown/Machrihansih W First Phase & Medium Offshore Wind & Wave and Tidal
Ardersier NE First Phase & Medium Offshore Wind
Peterhead NE First Phase & Medium Offshore Wind
Kishorn NW First Phase & Medium Offshore Wind
Inverclyde W Medium Offshore Wind & Wave and Tidal
Burntisland E Medium Offshore Wind
Rosyth E Medium Offshore Wind
Montrose E Medium Offshore Wind
Grangemouth E Medium Offshore Wind
Highland Deephaven NE Medium Offshore Wind
Ayr W Medium Offshore Wind
Troon W Medium Offshore Wind
Stranraer/Cairnryan SW Medium Offshore Wind & Wave and Tidal
Sella Ness N Medium Wave and Tidal
Lerwick N Medium Wave and Tidal
Lyness N Medium Wave and Tidal
Hatston (Kirkwall) N Medium Wave and Tidal
Scrabster N Medium Wave and Tidal
Wick NE Medium Wave and Tidal
(Source: Scottish Enterprise & Highlands & Islands Enterprise, 2010a, 2010b)
Socio-economic Baseline Reviews for Offshore Renewables in Scottish Waters
R4032/3 98 R.1905
2.18 Water Sports
2.18.1 Definition of Sector/Activity Water sports are recreational activities undertaken on or immersed in a body of water. The main marine water sports undertaken in Scotland are recreational angling, surfing, windsurfing, sea kayaking, small sail boat activities (such as dinghy sailing) and scuba diving (BMF et al., 2009; Marine Scotland, 2011a). Recreational boating activity in larger vessels such as yachts is covered in Section 2.12. General tourism is described in other sections of this report as the interactions and issues in relation to marine renewable developments are often distinctly different. There is some possibility of a degree of double counting using this approach but not to the extent that it materially affects the results of the study, i.e. a variety of studies focusing specifically on recreation provide a good understanding on current value, distribution and intensity of the sector in the SORERs.
2.18.2 Description of Information Sources A variety of different information sources has been reviewed to inform this baseline, including published reports and papers, spatial layers and information provided through stakeholder engagement (Table 65). Table 65. Data sources used in the water sports chapter
Scale Information Available Date Source
Scotland Number of sea anglers 2006-2007 Radford et al (2009)
Scotland
Economic impact of sea angling (by region) No date
Radford et al (2009)
Angler days by resident, by origin, by type (short, boat, charter)
No date
Expenditure No date
Trends (days fished, competitiveness of region) No date
Output of DREAM® model gives multipliers (associated with angling)
No date
Scotland
Estimated regional sea angling activity and expenditure (also for Scotland)
No date Baxter et al (2011)
Origin and destination of overnight fishing trips to Scotland
2006-2007 Radford et al (2009)
Scotland Statistics on water sports participation levels 2009 BMF (2009)
Scotland Surfing locations Date not stated
SAS (2009) and the „Stormrider Guides‟ (http://www.lowpressure.co.uk)
Scotland Diving locations Date not stated
Baxter et al 2011
Scotland Spatial distribution of various water sports 2006 Land Use Consultants, 2007.
Socio-economic Baseline Reviews for Offshore Renewables in Scottish Waters
R4032/3 99 R.1905
2.18.2.1 Data limitations Limited information on water sports related expenditure currently exists at a regional level within Scotland. While some data on intensity and spatial distribution exists for certain activities in Scotland information for other activities is not as available or just consists of broad descriptions. More detailed information based on collecting quantified data is recommended. Further guidance on suitable techniques for collecting this type of data is provided in the „MEDIN Data Guideline for the Leisure and Recreation Sector‟ (MEDIN, 2011). Information on historical and future trends in this report has mainly been based on worldwide and UK trends as specific data for Scotland is limited.
2.18.3 National Overview of Current Activity 2.18.3.1 Location and intensity of activity Indicative estimates of the number of people participating in water sports activities in Scotland have been taken from the BMF Water sports and Leisure Participation Survey 2009 (BMF et al., 2009). This report estimated that 52,869 adults (> 16 years) participated in surfing, 23,952 adults participated in windsurfing, 12,443 in scuba diving, 37,416 participated in canoeing33 and 23,937 in small sail boat activities in the Border and Scotland ITV regions34. Radford et al (2009) estimated that 125,188 adults and 23,445 children went sea angling in Scotland in 2008. Separately, Surfers Against Sewage (SAS, 2010) conducted an initial study into the number of recreational water users in Scotland in 2010 and estimated that there were approximately 300,000 recreational water users (this number included surfers, windsurfers, and kayakers amongst a range of other activities) using the coastal waters of Scotland. A summary of the distribution of different water sports, highlighting key areas activities in Scotland is described below. A survey looking into marine and coastal recreation in Scotland commissioned by SNH found that overall, around 87% of all recorded visits to the coast were day trips. Above average proportions of short-breaks or weekend visits were made by sea and shoreline anglers, and divers and snorkelers (Land Use Consultants, 2007). Recreational Angling Sea angling is carried out along most of the Scottish coastline mostly within 6nm (The Scottish Sea Angling Conservation Network (SSACN) The Scottish Sea Angling Conservation Network‟s (SSACN) Offshore Wind SEA consultation response, available on the Scottish Government website: http://www.scotland.gov.uk/Publications/2010/11/03131226/035. The
33 Canoeing is a general term for a range of „paddle sports‟ which includes sea kayaking, surf kayaking, sit-on-top
kayaking and Canadian canoeing. 34 Some of these activities are carried out inland as well as at the coast. Table 44 in the BMF (2009) study indicates
what proportion of each activity is actually carried out at the coast and this information was used to adjust overall totals.
35 The Scottish Sea Angling Conservation Network‟s (SSACN) Offshore Wind SEA consultation response, available on the Scottish Government website: http://www.scotland.gov.uk/Publications/2010/11/03131226/0.
Socio-economic Baseline Reviews for Offshore Renewables in Scottish Waters
R4032/3 100 R.1905
highest densities of anglers are found in the more heavily populated areas of coast around Glasgow, Clyde, Edinburgh and Fife (Baxter et al. 2011). Sea angling launch points are also heavily concentrated along the Argyll Coast and Islands, Solway Firth, Firth of Clyde, Firth of Tay, North Coast, and East Grampian Coast (Land Use Consultants, 2007). Surfing and Windsurfing A variety of different types of water craft are used to surf waves including surfboards, bodyboards, windsurfing boards and kayaks (SAS, 2009). Many surfers are willing to travel large distances to undertake surfing at good quality spots (Lazorow, 2009). Therefore, high quality waves located in remote areas could bring economic benefits to a rural area through travel, accommodation and subsidence expenditure of visiting surfers. Surfing is focused around the far North coast of Scotland (particularly around Thurso), the North coast from Buckie to Fraserburgh and locations down the East coast including Fife, and from North Berwick to the border. Other locations include the Kintyre peninsula, Islay, Tiree, the Western Isles (particularly the West coast of Lewis) and the North coast of Orkney (Baxter et al., 2011; Land Use Consultants, 2007), see Figure 30. Sea Kayaking The majority of sea kayaking is undertaken close inshore, exploring interesting aspects of the coast such as sea caves, inlets and wildlife. Safety issues and a lack of interesting features in general prevent kayaking further offshore. However, open crossings (between two points such as a headland and an offshore island), often through strong tidal currents are regularly undertaken by more experienced sea kayakers. Unlike other water sports activities which are often undertaken in relatively discrete areas (such as a surf spot or diving site), sea kayaking has the potential to be undertaken along much of the Scottish coast and is only constrained by the availability of suitable launching spots such as beaches or slipways. Popular kayaking areas include the Inner Hebrides, East Grampian Coast, Firth of Clyde and Firth of Forth (Land Use Consultants, 2007), see Figure 31. The Scottish Canoeing Association undertook an online survey of sea kayakers in 2011. The survey had a total of 392 respondents. The survey found that the most popular areas for sea kayaking in Scotland was Arisaig, Knoydart, Sound of Sleat, Argyll Islands, Oban to Fort William and the Clyde. Scuba Diving The most popular locations for scuba diving around Scotland are Scapa Flow, Orkney (considered to be one of the best wreck diving areas in the world) and the Voluntary Marine Reserve of St Abbs and Eyemouth off the Berwickshire coastline. The islands of the inner Hebrides, the Firth of Forth and coast to the Scottish border, all of the East coast from North of Dundee to the Dornoch Firth are also popular diving destinations (Land Use Consultants, 2007; Baxter et al, 2011; Scottish Executive, 2007; UKMMAS, 2010), see Figure 32. Small Sail Boat Activity Small sail boat activity is defined as dinghies, day boat or other small keelboats, usually taken out of water at the end of use. Small sail boat activity is widespread along the Scottish coast but the Firth of Clyde and Firth of Forth are noted as a particularly good place to learn to sail in dinghies (Land Use Consultants, 2007), see Figure 33.
Socio-economic Baseline Reviews for Offshore Renewables in Scottish Waters
R4032/3 101 R.1905
2.18.3.2 Economic value and employment Radford et al (2009) estimated a total expenditure of £141 million on sea angling in 2008. Sea angling in Scotland also supported 3148 FTE jobs in 2008, representing an income of £69.67million36 (Radford et al., 2009). There is limited data concerning the expenditure and employment levels of surfing-related tourism (SAS, 2009). At a UK level the economic value of the surf industry was estimated at £200 million in 2007 (UKMMAS 2010). The total number of people participating in surfing in the UK in 2009 was estimated to be 645,827 (BMF et al., 2009). If it is assumed that the Scottish value is pro rata to the estimated number of individuals engaging in surfing activity in Scotland, this would give a Scottish value of around £16.4m p.a. „Informed opinion suggests that sea kayaking, particularly on the West coast, and surf kayaking could be worth an estimated £0.5 million per annum‟. This statement was based on a study carried out by British Waterways and reported in Bryden et al. (2010), in which average paddlers in the Great Glen (2,500 per annum) spent approx £97 per day locally on overnight visits, or approximately £730K per annum. A survey commissioned by SNH reviewing marine and coastal recreation in Scotland identified the amount typically spent per year on equipment for water sports activities (Table 66). The highest average amounts spent were for sea angling (£1375) and shoreline angling (£860). Kayaking and canoeing, sub-aqua and snorkelling, and windsurfing each had an average spend of between £635 and £645, whilst surfing had a lower average spend of £290 per year. In total, sea angling and shoreline angling accounted for around half of the total spending recorded by the survey. However due to the small sample sizes these results are subject to high levels of standard error and it should be noted that these figures are generally overestimates (Land Use Consultants, 2007). Table 66. Total and average annual spending, by water sport activity
Activity Total Spending (£) Average Spending (£)
Sea angling 131960 1375
Shoreline angling 70575 861
Kayaking 36100 645
Sub aqua/ snorkelling 33935 640
Windsurfing 6345 635
Surfing 5800 290
(Source: Land Use Consultants, 2007)
No national employment figures derived from the Business Register and Employment Survey (using UK SIC codes) have been included for activities relating to water sports. This is because the codes are for the entire sports sector and don't permit disaggregation to a useful level. However in general the largest numbers of employees for these activities are concentrated in
36 The authors highlighted that the jobs and incomes supported by sea angling in Scotland were estimated using a
model of the Scottish economy and not by summing the totals for each region. Hence there was a slight difference between the Scottish totals and the sum of the regional values even though conceptually they should have been identical.
Socio-economic Baseline Reviews for Offshore Renewables in Scottish Waters
R4032/3 102 R.1905
the East and West Regions, which reflect the higher population concentrations in these regions.
2.18.3.3 Historical trends In a global context, the popularity of water sports and related industries have grown dramatically and have been seen as an increasingly important aspect of the marine leisure and tourism market in recent years (Lazarow, 2008). For example, the surf industry grew by an estimated 10% globally from 2004-2008 (SIMA, 2009). Factors such as increasingly active lifestyles, greater leisure time and affluence have combined to enhance the attractiveness of sports and physical recreation for the tourist (Cornwall Enterprise, 2001). Furthermore, ongoing technological improvements in, for example, wetsuit technologies mean that people are now able to utilise marine waters for recreational activities further into the winter months. In a UK context, the participation in most marine leisure and recreation activities has stayed relatively stable or showed an increase in recent years (BMF et al., 2009). For example participation in canoeing increased by 0.6%, small sail boat activities by 0.26%, windsurfing 0.19% and surfing 0.29% from 2007-2008 (BMF et al., 2009). Sea angling activity appears to have stabilised over the past decade. In 1970, sea anglers fished on average 36 times a year falling to about 12 times in 1992 and 11 in 2002. Most anglers have also observed a decrease in fish catches and declines in the size of fish caught over the past 15 years (Defra, 2004). To some extent anglers have adapted to changing conditions by switching locations, travelling further and using more powerful boats to extend their search. 2.18.3.4 Future trends The leisure and recreation sector has experienced large growth in a number of diverse areas over the past decade. The growth and stability of the water sports sector in Scotland is heavily dependant of the general health of the UK economy. A strong economy means that consumers have more disposable income and are more inclined to spend money on this sector than when the economy is weaker. The recent UK economic downturn may lead to a reduction in such activities but in the long-term the sector is expected to continue to grow. There is little information on future levels of recreational angling activity. Levels of activity are likely to vary in response to trends in the overall economy, changes in fish stocks as a result of improved fisheries management and changes in fish distributions in response to climate change. The nature and direction of these changes remains unclear.
Socio-economic Baseline Reviews for Offshore Renewables in Scottish Waters
R4032/3 103 R.1905
3. South West Region
3.1 Introduction
The regional overview for each marine use present within the South West SORER is detailed within this section. These sub-sections, which are arranged in alphabetical order of activity, provide information in a uniformed manner under the following headings:
Regional Activity; Regional Economic Value and Employment; and Future Trends.
The activities present within the South West Region are given in Table 67 below.
Table 67. Activities present within the South West SORER
Activity
Present in South West SORER
Regional Trends Available
Future Trends Available
Yes No Yes No Yes No
Aquaculture
Aviation
Carbon Capture and Storage
Coast Protection and Flood Defence
Commercial Fisheries
Energy Generation
Military Interests
Oil and Gas
Ports and Harbours
Power Interconnectors
Recreational Boating
Shipping
Social and Community
Telecom Cables
Tourism
Waste Disposal
Water Sports
3.2 Aquaculture
3.2.1 Regional Activity
Marine aquaculture sites within the South West Region are shown in Figure 34. The figure reveals that there is only one shellfish aquaculture site located within this region. No finfish sites occur are present.
3.2.2 Regional Economic Value and Employment
Regional employment figures for activities relating to marine aquaculture in the South West are listed below in Table 68. The table shows that very few people are employed in this sector within this region.
Socio-economic Baseline Reviews for Offshore Renewables in Scottish Waters
R4032/3 104 R.1905
Table 68. South West employment figures for activities relating to marine aquaculture
Activity Full-time Employees Part-time Employees
2009 2010 2009 2010
Marine aquaculture (SIC 03210) 10 9 0 5
(Source: ONS, 2011)
3.2.3 Future Trends No regional detail on future trends were available, please refer to Section 2.2.3 for national projections.
3.3 Commercial Fisheries
3.3.1 Regional Activity 3.3.1.1 Fish catching activities The South West SORER supports a small local fishing industry. Landings caught by UK vessels within the South West SORER had an average annual value of £17.7 million (4.6% of the Scottish total) and an average annual live weight of 18,100 tonnes (4.2% of the Scottish total) for the ten year period from 2001 to 2010. Figures 35 to 38 show the annual average value (2001 to 2010) of the total landings taken from within this region, broken down for each ICES rectangle by species group, selected species, gear type and vessel length. Figures 39 to 41 show the value of all landings caught in the inshore and offshore waters of the South West SORER waters by selected species, gear type and vessel length categories from 2001 to 2010. The majority of the value and volume of landings from within the South West SORER are shellfish, however, there is a difference between the main species caught in inshore waters (within 12 nm from the coast) and offshore waters (greater than 12 nm from the coast). Inshore, landings of scallops accounted for 92% of the total catch value in 2010 whilst „other shellfish‟ (excluding Nephrops) made up 24% of the total catch value. Offshore, landings of Nephrops accounted for 72% of the total catch value in 2010, 9% were scallops and 18% were other shellfish. In 2010, 11% of the value of landings from inshore waters was taken by vessels 10m and under in length, whilst 18% was landed by vessels over 10m and under 15m and 70% was landed by vessels 15m and over. Offshore, 70% of the total value was taken by vessels 15m and over in length. For inshore waters, 72% of the total catch value was caught by dredges and 12% by pots; whereas for offshore waters, 54% was caught by Nephrops trawls and 19% by dredges and pots combined.
Socio-economic Baseline Reviews for Offshore Renewables in Scottish Waters
R4032/3 105 R.1905
Figures 42 and 43 show the overflight (surveillance) sightings by vessel type and nationality in the region from 2006 to 2010. 8% of the national fishing occurs within the South West Region, with the majority (80%) being carried out by British vessels using other trawl types. Most of the fishing effort is carried out outside the 12NM limit. The main fishing ports in this region are Annan, Drummore, Kirkcudbright, Portpatrick and Stranraer and these are shown in Figure 44. 3.3.1.2 Fish processing activities There is a high concentration of fish processing activities in Annan on the Northern shore of the Solway Firth. Young‟s Seafood employ up to 600 people at two sites in the town and these numbers increase in the autumn to cover the seasonal demand for products, especially smoked salmon for the festive season (Liptrott, 2011). 3.3.1.3 Wild salmon and sea trout There are 2 net and coble and 16 fixed engine netting sites in the South West SORER along the Northern coast of the Solway Firth (see Figure 44). The main rod and line fishing rivers in this region are the Border Esk, Annan, Nith, Urr, Cree and Bladnoch. The River Annan is one of the best salmon and sea trout rivers in the South of Scotland and the River Border Esk is renowned as one of the best sea trout rivers in the country (Gray J., 2009).
3.3.2 Regional Economic Value and Employment 3.3.2.1 Fish catching activities The South West SORER is covered by the Ayr administration district, which also covers part of the West SORER and the port of Ayr itself is located in the West SORER. 559 fishermen are employed on 150 Scottish based vessels in this district. Fisheries dependent employment (which includes direct employment in the fish catching, farming and processing sectors and indirect employment and induced impacts as a result of the demand for goods and services required by the fisheries sector) is estimated to account for between 2 and 10% of total employment (Baxter et al., 2011). In the coastal Travel-to-Work areas of Annan and Newton Stewart the percentage of local employment directly provided by the fisheries sector is between 5% and 10% of all local jobs (Baxter et al., 2011). 3.3.2.2 Fish processing activities The Business Register and Employment Survey statistics for processing activities in the South West SORER are shown in Table 69. The largest concentration of employment is found in the Annan area with 16% of processing employment.

Socio-economic Baseline Reviews for Offshore Renewables in Scottish Waters
R4032/3 106 R.1905
Table 69. Employment in fish and shellfish processing and retail in the South West SORER
SIC, 2007
Full-time Employment
Part-time Employment
Total Employment
2009 2010 2009 2010 2009 2010
Processing and preserving of fish, crustaceans and molluscs (SIC 10200)
863 810 44 87 905 898
(Source: ONS, 2011)
3.3.2.3 Wild salmon and sea trout There is no specific information on economic value and employment for this region. For a national overview refer to Section 2.6.3.
3.3.3 Future Trends There is no specific information on future trends for this region. For national projections refer to Section 2.6.3.
3.4 Energy Generation
3.4.1 Regional Activity There is no specific information on activity for this region. It is not possible to identify the locations where electricity generation occurs within the region, or from where the region obtains its main electricity supply. For national projections refer to Section 2.7.3.
3.4.2 Regional Economic Value and Employment Information on regional economic value for energy generation is not available. The connectivity of the electricity grid means that the region cannot be delineated. In addition, data availability on electricity generation and supply is very limited due to security issues. Direct employment in the electricity sector in the South West Region can be estimated through looking at statistics from the Business Register and Employment Survey. Figures for 2009 and 2010 for full and part time work under several relevant codes are given in Table 70 (note that these figures are likely to represent underestimates of the number of jobs in the sector as a whole, since jobs classified under other SIC codes will also fall within the wider energy generation sector). As shown, the most significant category is electrical installation. There are additionally positions in both production and distribution of electricity. However, although the region does currently have an offshore wind farm (Robin Rigg in the Solway Firth), there are no further sites earmarked for development in the short term as indicated by Figure 45.

Socio-economic Baseline Reviews for Offshore Renewables in Scottish Waters
R4032/3 107 R.1905
Table 70. Employment in the electricity sector in the South West by SIC Code
SIC Code, 2007 Full-time Part-time Totals
2009 2010 2009 2010 2009 2010
Production of electricity (3511) 34 47 0 1 34 48
Transmission of electricity (3512)
0 0 0 0 0 0
Distribution of electricity (3513) 98 92 0 0 98 92
Trade of electricity (3514) 0 0 0 0 0 0
Construction of utility projects for electricity and telecommunications (4222)
0 20 0 0 0 20
Electrical installation (4321) 272 210 19 10 291 220
Totals (note that totals may not sum exactly due to rounding)
404 369 19 11 423 380
(Source: ONS, 2011)
3.4.3 Future Trends There is no specific information on future trends for this region. For national projections refer to Section 2.7.3.
3.5 Military Interests
3.5.1 Regional Activity The coastal military locations which occur within this region are shown in Figure 46. Military interests in this region include: An MOD Air Traffic Radar facility at West Freugh former RAF station; Luce Bay Gunnery and Bombing Range used by the RAF and the Fleet Air Arm (FAA)
(currently protected by Bylaw but under review); Kirkcudbright Training Area on the North coast of the Solway Firth providing field fire
and dry training exercise; Dundrennan official weapon test site, a triangular sea area East of Luce Bay, South of
Kirkcudbright at the entrance to the Solway Firth; Portpatrick port; and A Royal Navy SXA, which extends along the Western edge of this SORER.
3.5.2 Regional Economic Value and Employment The MOD Quarterly Manning Report (Defence Personnel by location) issued in August 2011, provides the number of MOD personnel (civilian and military) employed in each of the Scottish Local Authority (LA) areas at 1 July 2011 (MOD, 2011a). Two of these LAs fall within the South West Region. However, as the LA areas do not align with the SORER boundaries, the values should only be taken as indicative for comparison between areas. The number of MOD personnel in LAs which fall within this region is shown in Table 71.
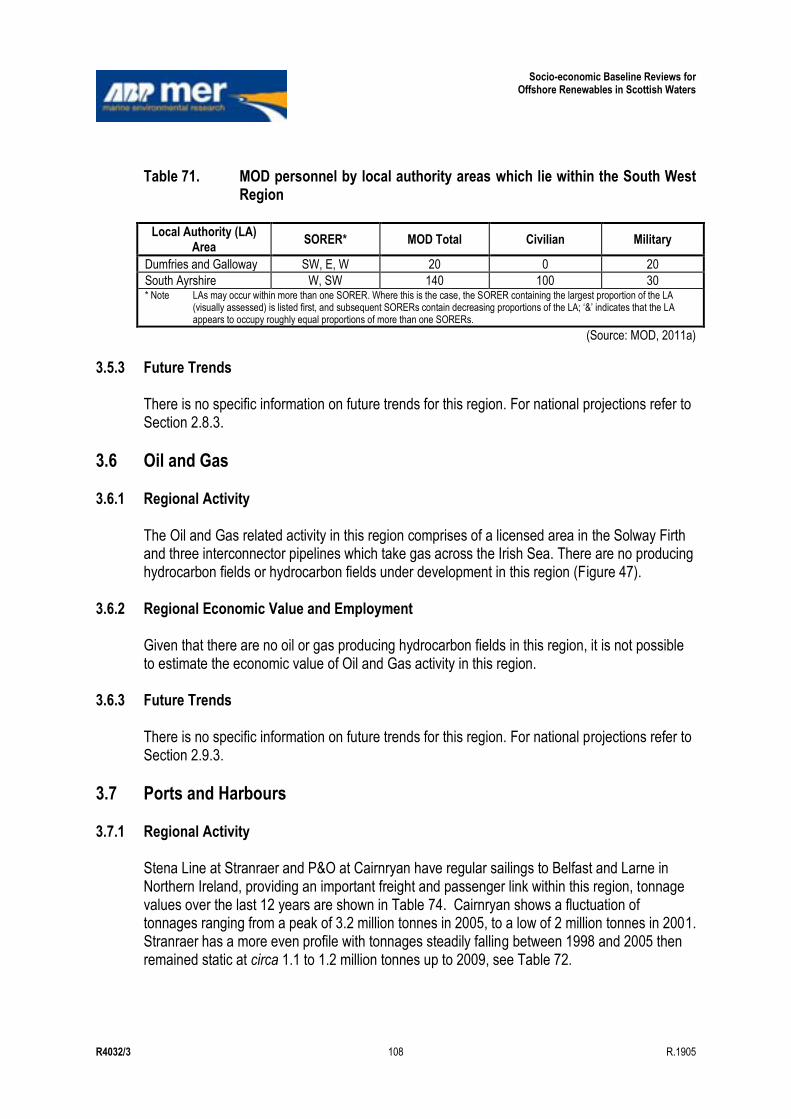
Socio-economic Baseline Reviews for Offshore Renewables in Scottish Waters
R4032/3 108 R.1905
Table 71. MOD personnel by local authority areas which lie within the South West
Region
Local Authority (LA) Area
SORER* MOD Total Civilian Military
Dumfries and Galloway SW, E, W 20 0 20
South Ayrshire W, SW 140 100 30 * Note LAs may occur within more than one SORER. Where this is the case, the SORER containing the largest proportion of the LA
(visually assessed) is listed first, and subsequent SORERs contain decreasing proportions of the LA; „&‟ indicates that the LA appears to occupy roughly equal proportions of more than one SORERs.
(Source: MOD, 2011a)
3.5.3 Future Trends There is no specific information on future trends for this region. For national projections refer to Section 2.8.3.
3.6 Oil and Gas
3.6.1 Regional Activity The Oil and Gas related activity in this region comprises of a licensed area in the Solway Firth and three interconnector pipelines which take gas across the Irish Sea. There are no producing hydrocarbon fields or hydrocarbon fields under development in this region (Figure 47).
3.6.2 Regional Economic Value and Employment Given that there are no oil or gas producing hydrocarbon fields in this region, it is not possible to estimate the economic value of Oil and Gas activity in this region.
3.6.3 Future Trends There is no specific information on future trends for this region. For national projections refer to Section 2.9.3.
3.7 Ports and Harbours
3.7.1 Regional Activity Stena Line at Stranraer and P&O at Cairnryan have regular sailings to Belfast and Larne in Northern Ireland, providing an important freight and passenger link within this region, tonnage values over the last 12 years are shown in Table 74. Cairnryan shows a fluctuation of tonnages ranging from a peak of 3.2 million tonnes in 2005, to a low of 2 million tonnes in 2001. Stranraer has a more even profile with tonnages steadily falling between 1998 and 2005 then remained static at circa 1.1 to 1.2 million tonnes up to 2009, see Table 72.
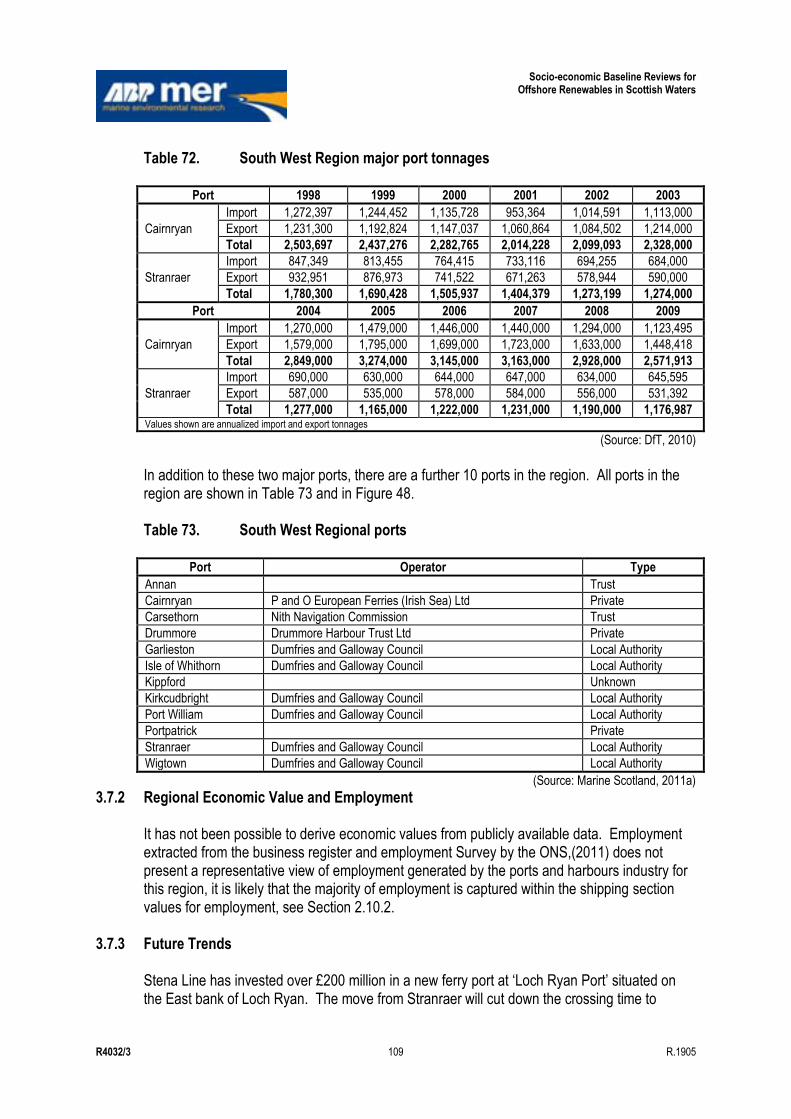
Socio-economic Baseline Reviews for Offshore Renewables in Scottish Waters
R4032/3 109 R.1905
Table 72. South West Region major port tonnages
Port 1998 1999 2000 2001 2002 2003
Cairnryan
Import 1,272,397 1,244,452 1,135,728 953,364 1,014,591 1,113,000
Export 1,231,300 1,192,824 1,147,037 1,060,864 1,084,502 1,214,000
Total 2,503,697 2,437,276 2,282,765 2,014,228 2,099,093 2,328,000
Stranraer
Import 847,349 813,455 764,415 733,116 694,255 684,000
Export 932,951 876,973 741,522 671,263 578,944 590,000
Total 1,780,300 1,690,428 1,505,937 1,404,379 1,273,199 1,274,000
Port 2004 2005 2006 2007 2008 2009
Cairnryan
Import 1,270,000 1,479,000 1,446,000 1,440,000 1,294,000 1,123,495
Export 1,579,000 1,795,000 1,699,000 1,723,000 1,633,000 1,448,418
Total 2,849,000 3,274,000 3,145,000 3,163,000 2,928,000 2,571,913
Stranraer
Import 690,000 630,000 644,000 647,000 634,000 645,595
Export 587,000 535,000 578,000 584,000 556,000 531,392
Total 1,277,000 1,165,000 1,222,000 1,231,000 1,190,000 1,176,987 Values shown are annualized import and export tonnages
(Source: DfT, 2010)
In addition to these two major ports, there are a further 10 ports in the region. All ports in the region are shown in Table 73 and in Figure 48. Table 73. South West Regional ports
Port Operator Type
Annan Trust
Cairnryan P and O European Ferries (Irish Sea) Ltd Private
Carsethorn Nith Navigation Commission Trust
Drummore Drummore Harbour Trust Ltd Private
Garlieston Dumfries and Galloway Council Local Authority
Isle of Whithorn Dumfries and Galloway Council Local Authority
Kippford Unknown
Kirkcudbright Dumfries and Galloway Council Local Authority
Port William Dumfries and Galloway Council Local Authority
Portpatrick Private
Stranraer Dumfries and Galloway Council Local Authority
Wigtown Dumfries and Galloway Council Local Authority
(Source: Marine Scotland, 2011a)
3.7.2 Regional Economic Value and Employment It has not been possible to derive economic values from publicly available data. Employment extracted from the business register and employment Survey by the ONS,(2011) does not present a representative view of employment generated by the ports and harbours industry for this region, it is likely that the majority of employment is captured within the shipping section values for employment, see Section 2.10.2.
3.7.3 Future Trends Stena Line has invested over £200 million in a new ferry port at „Loch Ryan Port‟ situated on the East bank of Loch Ryan. The move from Stranraer will cut down the crossing time to

Socio-economic Baseline Reviews for Offshore Renewables in Scottish Waters
R4032/3 110 R.1905
Ireland and will allow the project to regenerate the Stranraer Waterfront to move forward. Loch Ryan Port is anticipated to hand a mix of travel and freight customers, with the addition of two new larger ferries when the port becomes fully operational at the end of 2011. It is anticipated that the development will safeguard and create 1,400 jobs and increase the potential for further investment in Dumfries and Galloway.
3.8 Power Interconnectors
3.8.1 Regional Activity The only subsea power interconnector in the region is an international interconnector between Scotland and Northern Ireland (the Moyle Interconnector), which originates in Auchencrosh, Ayrshire and connects to Ballycronan More in Islandmagee, County Antrim, Northern Ireland (Figure 49).
3.8.2 Regional Economic Value and Employment There is no agreed methodology for calculating the economic value of subsea power cables. The capacity from interconnector cables may be used as an indicator of both value and activity (UKMMAS, 2010) and the capacity of Moyle Ireland interconnector is shown in Table 74. Table 74. Details of interconnector power cables in the South West Region
Interconnector Link Capacity (MW) Length (km)
Scotland-Northern Ireland Auchencrosh, Ayrshire to Islandmagee, County Antrim
500 63
(Source: UKMMAS, 2010).
Further information on employment within this sector is provided by the ONS ABI however the proportion of these employees associated with subsea power cables is unknown.
3.8.3 Future Trends There are a number of proposed marine power interconnector developments in the UK at various stages of maturity in the planning process. Only one development that may be relevant to this region (e.g. which may pass through this SORER) has been identified, that of the Western HVDC link with a length of 370km and capacity of 2,000MW (Saunders et al, 2011; Refabrica website: www.refabrica.com/einter/?page_id=157).
3.9 Recreational Boating
3.9.1 Regional Activity Sailing activity in the South West Region is shown in Figure 50. The figure highlights that sailing areas occur along virtually the whole of the coastline in this region. There are a large number of medium usage routes within the Solway Firth and the North Channel.
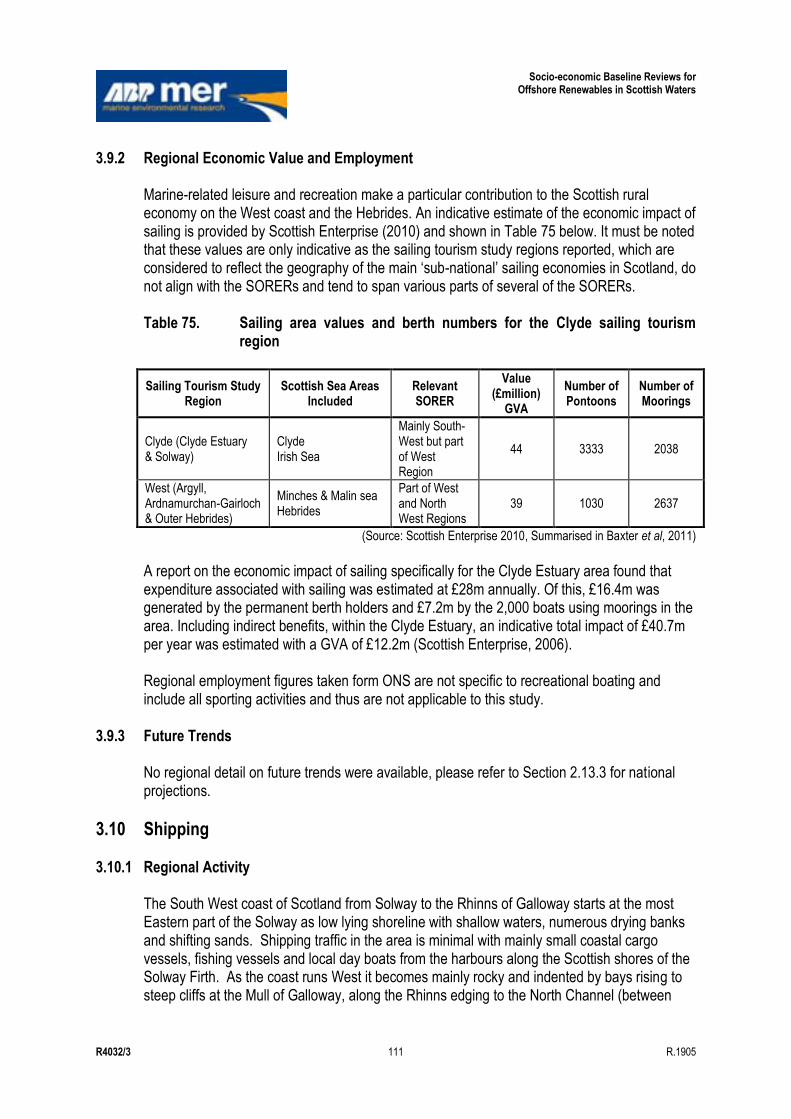
Socio-economic Baseline Reviews for Offshore Renewables in Scottish Waters
R4032/3 111 R.1905
3.9.2 Regional Economic Value and Employment Marine-related leisure and recreation make a particular contribution to the Scottish rural economy on the West coast and the Hebrides. An indicative estimate of the economic impact of sailing is provided by Scottish Enterprise (2010) and shown in Table 75 below. It must be noted that these values are only indicative as the sailing tourism study regions reported, which are considered to reflect the geography of the main „sub-national‟ sailing economies in Scotland, do not align with the SORERs and tend to span various parts of several of the SORERs. Table 75. Sailing area values and berth numbers for the Clyde sailing tourism
region
Sailing Tourism Study Region
Scottish Sea Areas Included
Relevant SORER
Value (£million)
GVA
Number of Pontoons
Number of Moorings
Clyde (Clyde Estuary & Solway)
Clyde Irish Sea
Mainly South-West but part of West Region
44 3333 2038
West (Argyll, Ardnamurchan-Gairloch & Outer Hebrides)
Minches & Malin sea Hebrides
Part of West and North West Regions
39 1030 2637
(Source: Scottish Enterprise 2010, Summarised in Baxter et al, 2011)
A report on the economic impact of sailing specifically for the Clyde Estuary area found that expenditure associated with sailing was estimated at £28m annually. Of this, £16.4m was generated by the permanent berth holders and £7.2m by the 2,000 boats using moorings in the area. Including indirect benefits, within the Clyde Estuary, an indicative total impact of £40.7m per year was estimated with a GVA of £12.2m (Scottish Enterprise, 2006). Regional employment figures taken form ONS are not specific to recreational boating and include all sporting activities and thus are not applicable to this study.
3.9.3 Future Trends No regional detail on future trends were available, please refer to Section 2.13.3 for national projections.
3.10 Shipping
3.10.1 Regional Activity The South West coast of Scotland from Solway to the Rhinns of Galloway starts at the most Eastern part of the Solway as low lying shoreline with shallow waters, numerous drying banks and shifting sands. Shipping traffic in the area is minimal with mainly small coastal cargo vessels, fishing vessels and local day boats from the harbours along the Scottish shores of the Solway Firth. As the coast runs West it becomes mainly rocky and indented by bays rising to steep cliffs at the Mull of Galloway, along the Rhinns edging to the North Channel (between
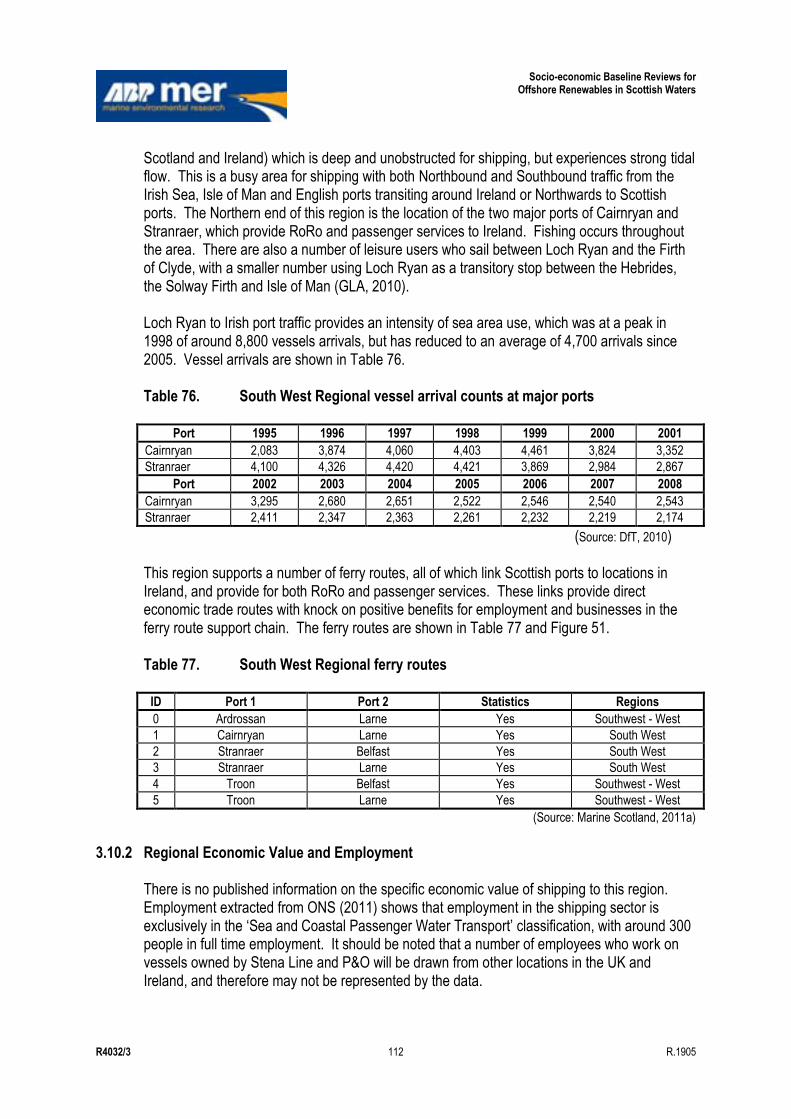
Socio-economic Baseline Reviews for Offshore Renewables in Scottish Waters
R4032/3 112 R.1905
Scotland and Ireland) which is deep and unobstructed for shipping, but experiences strong tidal flow. This is a busy area for shipping with both Northbound and Southbound traffic from the Irish Sea, Isle of Man and English ports transiting around Ireland or Northwards to Scottish ports. The Northern end of this region is the location of the two major ports of Cairnryan and Stranraer, which provide RoRo and passenger services to Ireland. Fishing occurs throughout the area. There are also a number of leisure users who sail between Loch Ryan and the Firth of Clyde, with a smaller number using Loch Ryan as a transitory stop between the Hebrides, the Solway Firth and Isle of Man (GLA, 2010). Loch Ryan to Irish port traffic provides an intensity of sea area use, which was at a peak in 1998 of around 8,800 vessels arrivals, but has reduced to an average of 4,700 arrivals since 2005. Vessel arrivals are shown in Table 76. Table 76. South West Regional vessel arrival counts at major ports
Port 1995 1996 1997 1998 1999 2000 2001
Cairnryan 2,083 3,874 4,060 4,403 4,461 3,824 3,352
Stranraer 4,100 4,326 4,420 4,421 3,869 2,984 2,867
Port 2002 2003 2004 2005 2006 2007 2008
Cairnryan 3,295 2,680 2,651 2,522 2,546 2,540 2,543
Stranraer 2,411 2,347 2,363 2,261 2,232 2,219 2,174
(Source: DfT, 2010) This region supports a number of ferry routes, all of which link Scottish ports to locations in Ireland, and provide for both RoRo and passenger services. These links provide direct economic trade routes with knock on positive benefits for employment and businesses in the ferry route support chain. The ferry routes are shown in Table 77 and Figure 51. Table 77. South West Regional ferry routes
ID Port 1 Port 2 Statistics Regions
0 Ardrossan Larne Yes Southwest - West
1 Cairnryan Larne Yes South West
2 Stranraer Belfast Yes South West
3 Stranraer Larne Yes South West
4 Troon Belfast Yes Southwest - West
5 Troon Larne Yes Southwest - West
(Source: Marine Scotland, 2011a)
3.10.2 Regional Economic Value and Employment
There is no published information on the specific economic value of shipping to this region. Employment extracted from ONS (2011) shows that employment in the shipping sector is exclusively in the „Sea and Coastal Passenger Water Transport‟ classification, with around 300 people in full time employment. It should be noted that a number of employees who work on vessels owned by Stena Line and P&O will be drawn from other locations in the UK and Ireland, and therefore may not be represented by the data.
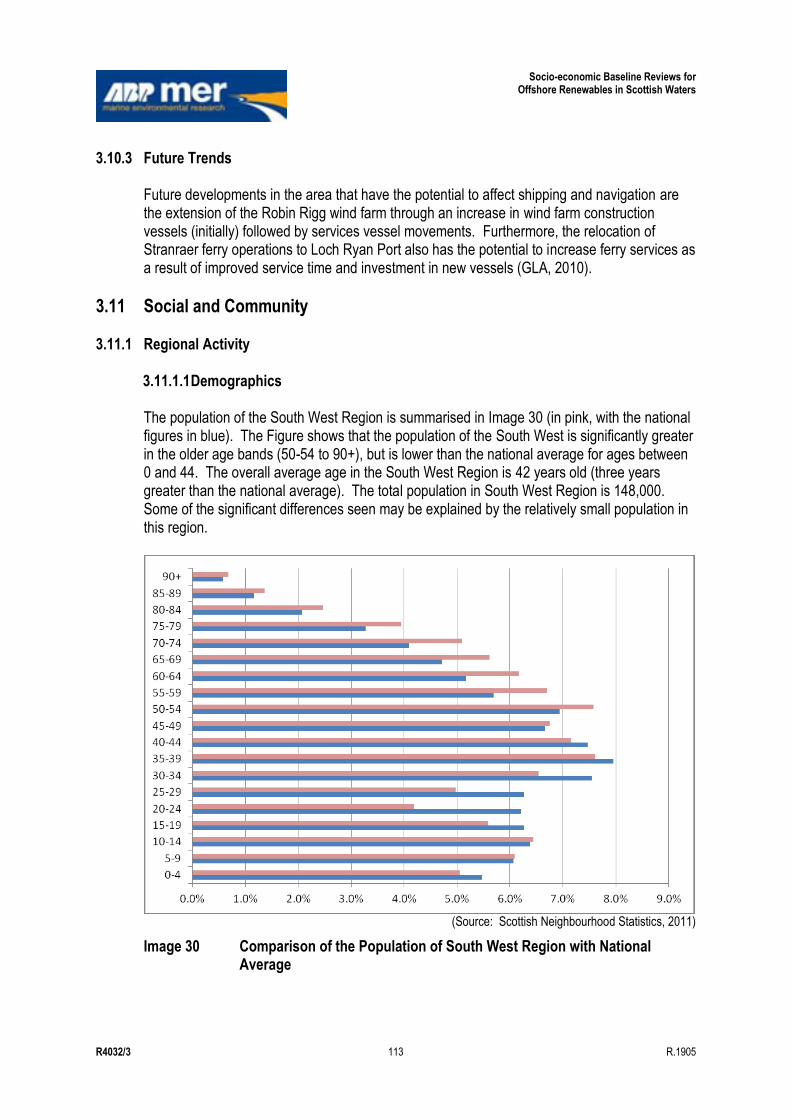
Socio-economic Baseline Reviews for Offshore Renewables in Scottish Waters
R4032/3 113 R.1905
3.10.3 Future Trends Future developments in the area that have the potential to affect shipping and navigation are the extension of the Robin Rigg wind farm through an increase in wind farm construction vessels (initially) followed by services vessel movements. Furthermore, the relocation of Stranraer ferry operations to Loch Ryan Port also has the potential to increase ferry services as a result of improved service time and investment in new vessels (GLA, 2010).
3.11 Social and Community
3.11.1 Regional Activity 3.11.1.1 Demographics The population of the South West Region is summarised in Image 30 (in pink, with the national figures in blue). The Figure shows that the population of the South West is significantly greater in the older age bands (50-54 to 90+), but is lower than the national average for ages between 0 and 44. The overall average age in the South West Region is 42 years old (three years greater than the national average). The total population in South West Region is 148,000. Some of the significant differences seen may be explained by the relatively small population in this region.
(Source: Scottish Neighbourhood Statistics, 2011)
Image 30 Comparison of the Population of South West Region with National Average
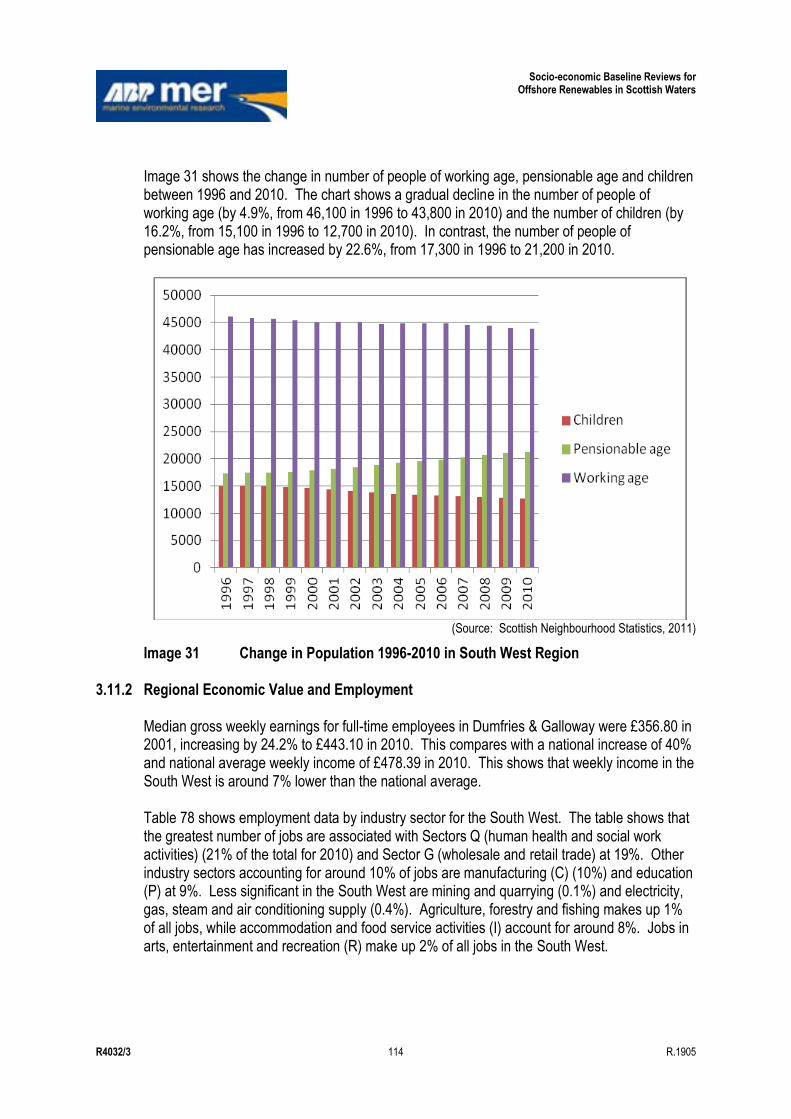
Socio-economic Baseline Reviews for Offshore Renewables in Scottish Waters
R4032/3 114 R.1905
Image 31 shows the change in number of people of working age, pensionable age and children between 1996 and 2010. The chart shows a gradual decline in the number of people of working age (by 4.9%, from 46,100 in 1996 to 43,800 in 2010) and the number of children (by 16.2%, from 15,100 in 1996 to 12,700 in 2010). In contrast, the number of people of pensionable age has increased by 22.6%, from 17,300 in 1996 to 21,200 in 2010.
(Source: Scottish Neighbourhood Statistics, 2011)
Image 31 Change in Population 1996-2010 in South West Region
3.11.2 Regional Economic Value and Employment Median gross weekly earnings for full-time employees in Dumfries & Galloway were £356.80 in 2001, increasing by 24.2% to £443.10 in 2010. This compares with a national increase of 40% and national average weekly income of £478.39 in 2010. This shows that weekly income in the South West is around 7% lower than the national average. Table 78 shows employment data by industry sector for the South West. The table shows that the greatest number of jobs are associated with Sectors Q (human health and social work activities) (21% of the total for 2010) and Sector G (wholesale and retail trade) at 19%. Other industry sectors accounting for around 10% of jobs are manufacturing (C) (10%) and education (P) at 9%. Less significant in the South West are mining and quarrying (0.1%) and electricity, gas, steam and air conditioning supply (0.4%). Agriculture, forestry and fishing makes up 1% of all jobs, while accommodation and food service activities (I) account for around 8%. Jobs in arts, entertainment and recreation (R) make up 2% of all jobs in the South West.
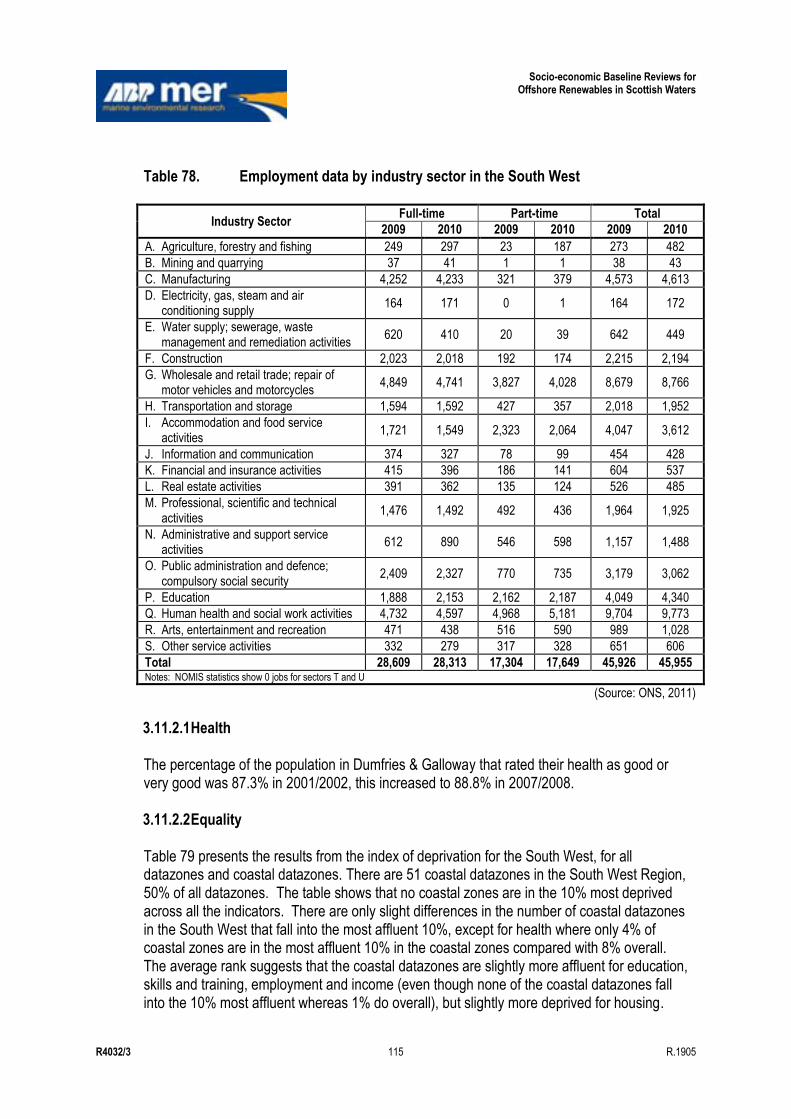
Socio-economic Baseline Reviews for Offshore Renewables in Scottish Waters
R4032/3 115 R.1905
Table 78. Employment data by industry sector in the South West
Industry Sector Full-time Part-time Total
2009 2010 2009 2010 2009 2010
A. Agriculture, forestry and fishing 249 297 23 187 273 482
B. Mining and quarrying 37 41 1 1 38 43
C. Manufacturing 4,252 4,233 321 379 4,573 4,613
D. Electricity, gas, steam and air conditioning supply
164 171 0 1 164 172
E. Water supply; sewerage, waste management and remediation activities
620 410 20 39 642 449
F. Construction 2,023 2,018 192 174 2,215 2,194
G. Wholesale and retail trade; repair of motor vehicles and motorcycles
4,849 4,741 3,827 4,028 8,679 8,766
H. Transportation and storage 1,594 1,592 427 357 2,018 1,952
I. Accommodation and food service activities
1,721 1,549 2,323 2,064 4,047 3,612
J. Information and communication 374 327 78 99 454 428
K. Financial and insurance activities 415 396 186 141 604 537
L. Real estate activities 391 362 135 124 526 485
M. Professional, scientific and technical activities
1,476 1,492 492 436 1,964 1,925
N. Administrative and support service activities
612 890 546 598 1,157 1,488
O. Public administration and defence; compulsory social security
2,409 2,327 770 735 3,179 3,062
P. Education 1,888 2,153 2,162 2,187 4,049 4,340
Q. Human health and social work activities 4,732 4,597 4,968 5,181 9,704 9,773
R. Arts, entertainment and recreation 471 438 516 590 989 1,028
S. Other service activities 332 279 317 328 651 606
Total 28,609 28,313 17,304 17,649 45,926 45,955 Notes: NOMIS statistics show 0 jobs for sectors T and U
(Source: ONS, 2011)
3.11.2.1 Health The percentage of the population in Dumfries & Galloway that rated their health as good or very good was 87.3% in 2001/2002, this increased to 88.8% in 2007/2008. 3.11.2.2 Equality Table 79 presents the results from the index of deprivation for the South West, for all datazones and coastal datazones. There are 51 coastal datazones in the South West Region, 50% of all datazones. The table shows that no coastal zones are in the 10% most deprived across all the indicators. There are only slight differences in the number of coastal datazones in the South West that fall into the most affluent 10%, except for health where only 4% of coastal zones are in the most affluent 10% in the coastal zones compared with 8% overall. The average rank suggests that the coastal datazones are slightly more affluent for education, skills and training, employment and income (even though none of the coastal datazones fall into the 10% most affluent whereas 1% do overall), but slightly more deprived for housing.
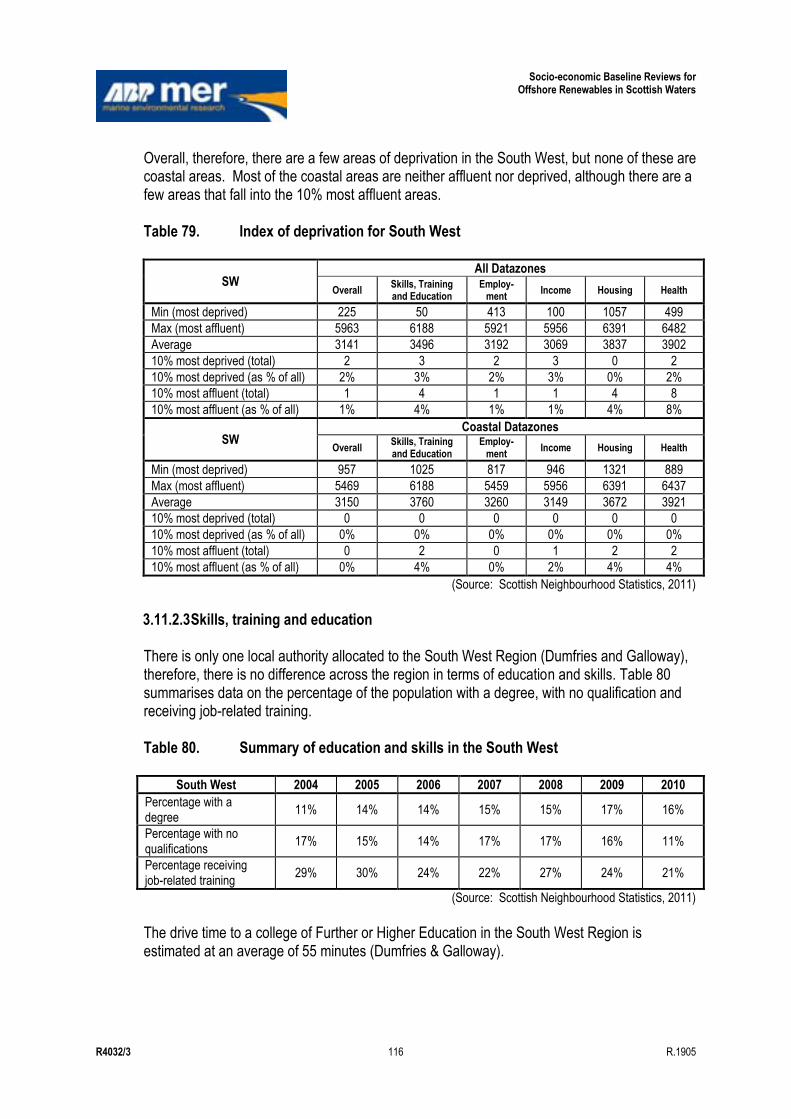
Socio-economic Baseline Reviews for Offshore Renewables in Scottish Waters
R4032/3 116 R.1905
Overall, therefore, there are a few areas of deprivation in the South West, but none of these are coastal areas. Most of the coastal areas are neither affluent nor deprived, although there are a few areas that fall into the 10% most affluent areas. Table 79. Index of deprivation for South West
SW All Datazones
Overall Skills, Training and Education
Employ-ment
Income Housing Health
Min (most deprived) 225 50 413 100 1057 499
Max (most affluent) 5963 6188 5921 5956 6391 6482
Average 3141 3496 3192 3069 3837 3902
10% most deprived (total) 2 3 2 3 0 2
10% most deprived (as % of all) 2% 3% 2% 3% 0% 2%
10% most affluent (total) 1 4 1 1 4 8
10% most affluent (as % of all) 1% 4% 1% 1% 4% 8%
SW Coastal Datazones
Overall Skills, Training and Education
Employ-ment
Income Housing Health
Min (most deprived) 957 1025 817 946 1321 889
Max (most affluent) 5469 6188 5459 5956 6391 6437
Average 3150 3760 3260 3149 3672 3921
10% most deprived (total) 0 0 0 0 0 0
10% most deprived (as % of all) 0% 0% 0% 0% 0% 0%
10% most affluent (total) 0 2 0 1 2 2
10% most affluent (as % of all) 0% 4% 0% 2% 4% 4%
(Source: Scottish Neighbourhood Statistics, 2011)
3.11.2.3 Skills, training and education There is only one local authority allocated to the South West Region (Dumfries and Galloway), therefore, there is no difference across the region in terms of education and skills. Table 80 summarises data on the percentage of the population with a degree, with no qualification and receiving job-related training. Table 80. Summary of education and skills in the South West
South West 2004 2005 2006 2007 2008 2009 2010
Percentage with a degree
11% 14% 14% 15% 15% 17% 16%
Percentage with no qualifications
17% 15% 14% 17% 17% 16% 11%
Percentage receiving job-related training
29% 30% 24% 22% 27% 24% 21%
(Source: Scottish Neighbourhood Statistics, 2011)
The drive time to a college of Further or Higher Education in the South West Region is estimated at an average of 55 minutes (Dumfries & Galloway).
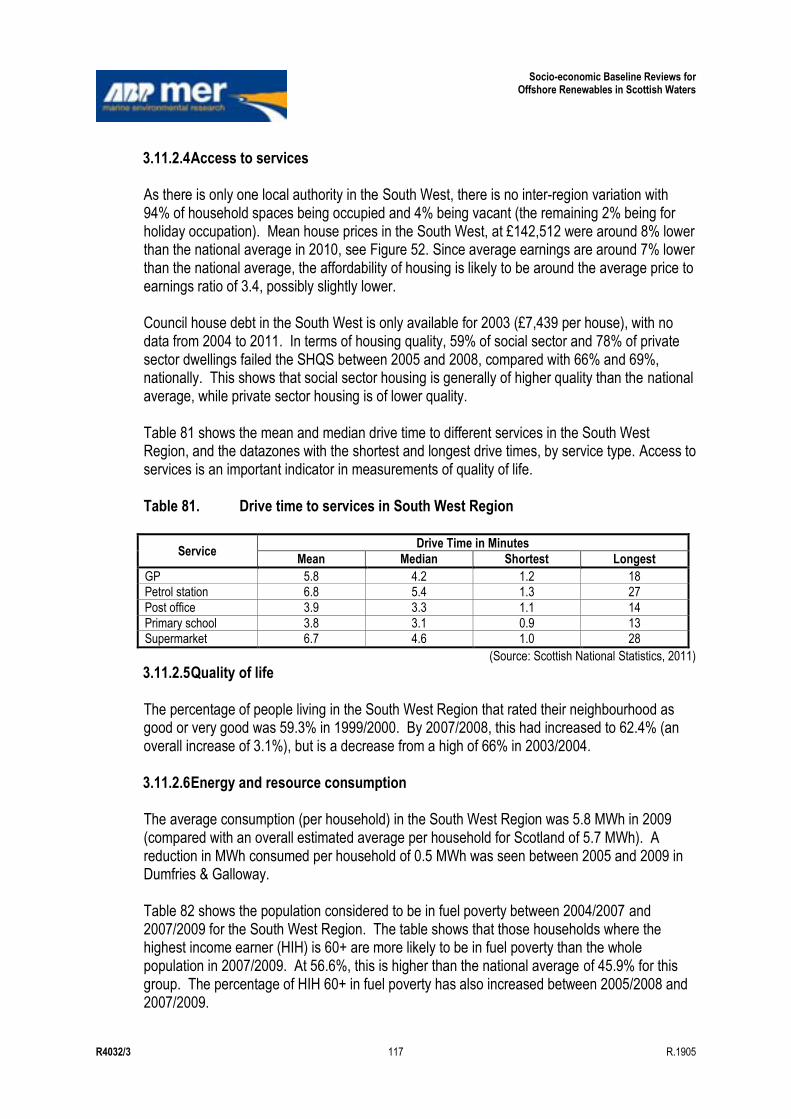
Socio-economic Baseline Reviews for Offshore Renewables in Scottish Waters
R4032/3 117 R.1905
3.11.2.4 Access to services As there is only one local authority in the South West, there is no inter-region variation with 94% of household spaces being occupied and 4% being vacant (the remaining 2% being for holiday occupation). Mean house prices in the South West, at £142,512 were around 8% lower than the national average in 2010, see Figure 52. Since average earnings are around 7% lower than the national average, the affordability of housing is likely to be around the average price to earnings ratio of 3.4, possibly slightly lower. Council house debt in the South West is only available for 2003 (£7,439 per house), with no data from 2004 to 2011. In terms of housing quality, 59% of social sector and 78% of private sector dwellings failed the SHQS between 2005 and 2008, compared with 66% and 69%, nationally. This shows that social sector housing is generally of higher quality than the national average, while private sector housing is of lower quality. Table 81 shows the mean and median drive time to different services in the South West Region, and the datazones with the shortest and longest drive times, by service type. Access to services is an important indicator in measurements of quality of life. Table 81. Drive time to services in South West Region
Service Drive Time in Minutes
Mean Median Shortest Longest
GP 5.8 4.2 1.2 18 Petrol station 6.8 5.4 1.3 27
Post office 3.9 3.3 1.1 14
Primary school 3.8 3.1 0.9 13 Supermarket 6.7 4.6 1.0 28
(Source: Scottish National Statistics, 2011)
3.11.2.5 Quality of life The percentage of people living in the South West Region that rated their neighbourhood as good or very good was 59.3% in 1999/2000. By 2007/2008, this had increased to 62.4% (an overall increase of 3.1%), but is a decrease from a high of 66% in 2003/2004. 3.11.2.6 Energy and resource consumption The average consumption (per household) in the South West Region was 5.8 MWh in 2009 (compared with an overall estimated average per household for Scotland of 5.7 MWh). A reduction in MWh consumed per household of 0.5 MWh was seen between 2005 and 2009 in Dumfries & Galloway. Table 82 shows the population considered to be in fuel poverty between 2004/2007 and 2007/2009 for the South West Region. The table shows that those households where the highest income earner (HIH) is 60+ are more likely to be in fuel poverty than the whole population in 2007/2009. At 56.6%, this is higher than the national average of 45.9% for this group. The percentage of HIH 60+ in fuel poverty has also increased between 2005/2008 and 2007/2009.

Socio-economic Baseline Reviews for Offshore Renewables in Scottish Waters
R4032/3 118 R.1905
Table 82. Population considered to be in fuel poverty in South West Region
Population % of Population in Fuel Poverty
2004/2007 2005/2008 2007/2009
All 30.8% 36.2% 41.3%
Any disability or long term sick 26.3% 33.5% 31.1%
No disability or long term sick 35.0% 40.7% 45.7% HIH 60+ 47.5% 52.9% 56.6%
HIH under 60 18.1% 23.1% 22.0%
Female HIH 37.4% 44.0% 41.8% Male HIH 26.6% 31.9% 33.1%
(Source: Scottish National Statistics, 2011)
3.11.3 Future Trends
Table 83 summarises the statistics and trends discussed above to give an indication of the likely future changes by indicator, comparing national with local trends (where data are available). There is much greater uncertainty over trends for the time period of 30 to 50 years and, in both cases, it is assumed that future trends follow recent and historic trends. The table only includes rows for which there are data at the regional level. For national projections where regional data are not available refer to Section 2.14.3. Table 83. Summary of future trends in South West Region
Indicator National Regional
Evidence for Trend 10-20 years
30-50 years
10-20 years
30-50 years
Average age ↑ ↑ ↑ ↑ Estimate of proportion of the population that is of pensionable age between 2001 and 2010
Working age population ↑ → ↓ ↓
Recent trends suggest a decrease in the proportion of working age people; the proportion of children is also decreasing suggesting this may be a longer-term trend
Income ↑ ↑ ↑ ↑ Recent trends suggest slight increase over time, but income is lower than national average
Health ↑ → ↑ ↑ Recent trends suggest slight increase in perception of health
Perception that neighbourhood is a very good place to live
↕ ↕ → → Regional trends suggest fluctuations (increases followed by decreases)
Housing quality ↑ ↑ ↑ ↑
Housing quality, as measured by percentage of housing failing the SHQS, is improving, although the definition used in the standard has changed over time, making this difficult to confirm
Energy consumption ↓ ↕ ↓ → Recent trends suggest potential for continued slight decline, in longer term is more uncertain
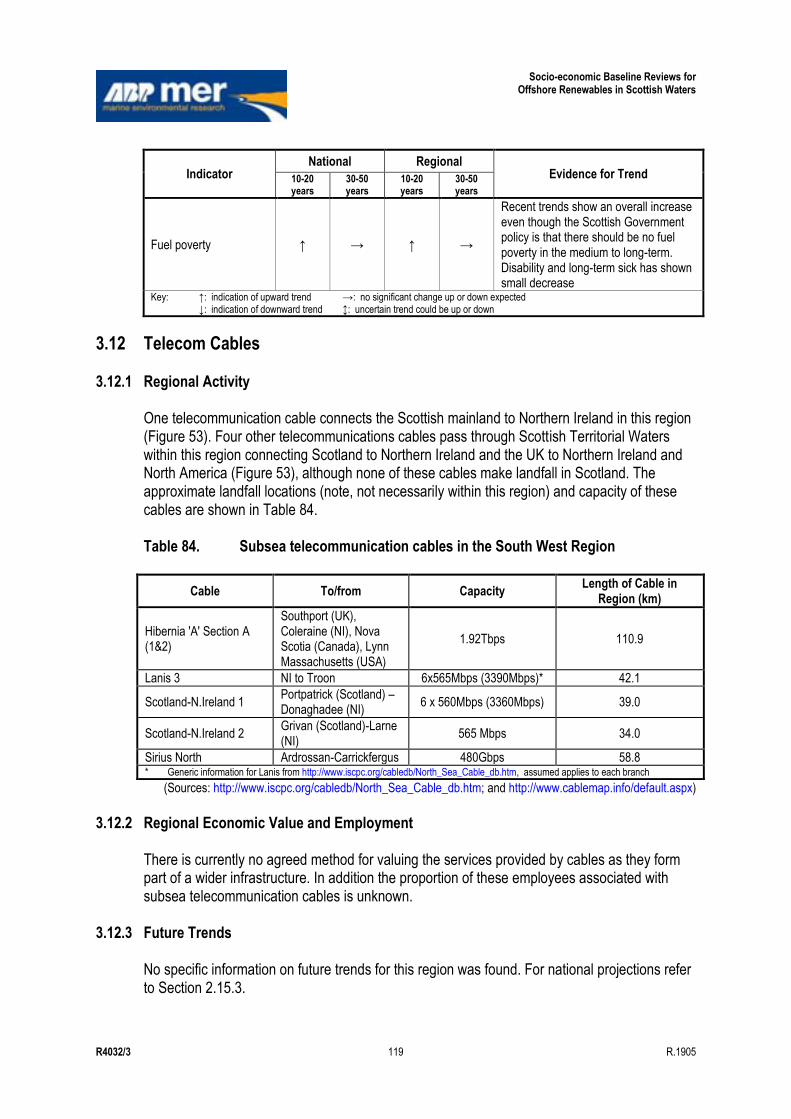
Socio-economic Baseline Reviews for Offshore Renewables in Scottish Waters
R4032/3 119 R.1905
Indicator National Regional
Evidence for Trend 10-20 years
30-50 years
10-20 years
30-50 years
Fuel poverty ↑ → ↑ →
Recent trends show an overall increase even though the Scottish Government policy is that there should be no fuel poverty in the medium to long-term. Disability and long-term sick has shown small decrease
Key: ↑: indication of upward trend →: no significant change up or down expected ↓: indication of downward trend ↕: uncertain trend could be up or down
3.12 Telecom Cables
3.12.1 Regional Activity One telecommunication cable connects the Scottish mainland to Northern Ireland in this region (Figure 53). Four other telecommunications cables pass through Scottish Territorial Waters within this region connecting Scotland to Northern Ireland and the UK to Northern Ireland and North America (Figure 53), although none of these cables make landfall in Scotland. The approximate landfall locations (note, not necessarily within this region) and capacity of these cables are shown in Table 84. Table 84. Subsea telecommunication cables in the South West Region
Cable To/from Capacity Length of Cable in
Region (km)
Hibernia 'A' Section A (1&2)
Southport (UK), Coleraine (NI), Nova Scotia (Canada), Lynn Massachusetts (USA)
1.92Tbps 110.9
Lanis 3 NI to Troon 6x565Mbps (3390Mbps)* 42.1
Scotland-N.Ireland 1 Portpatrick (Scotland) – Donaghadee (NI)
6 x 560Mbps (3360Mbps) 39.0
Scotland-N.Ireland 2 Grivan (Scotland)-Larne (NI)
565 Mbps 34.0
Sirius North Ardrossan-Carrickfergus 480Gbps 58.8 * Generic information for Lanis from http://www.iscpc.org/cabledb/North_Sea_Cable_db.htm, assumed applies to each branch
(Sources: http://www.iscpc.org/cabledb/North_Sea_Cable_db.htm; and http://www.cablemap.info/default.aspx)
3.12.2 Regional Economic Value and Employment
There is currently no agreed method for valuing the services provided by cables as they form part of a wider infrastructure. In addition the proportion of these employees associated with subsea telecommunication cables is unknown.
3.12.3 Future Trends No specific information on future trends for this region was found. For national projections refer to Section 2.15.3.

Socio-economic Baseline Reviews for Offshore Renewables in Scottish Waters
R4032/3 120 R.1905
3.13 Tourism
3.13.1 Regional Activity Tourist sites in South West Scotland appear to be more spread out than in other regions, however there are various types of attraction present as shown in Figure 54. South West Scotland additionally has numerous sites for accommodation and camping, both inland and on the coast. Transport and travel are also provided in the region (e.g. ferry services). With regards to wildlife tourism, there are two designated marine Special Areas of Conservation37, namely; Luce Bay and Sands and Solway Firth. With growing recent interest in ecotourism, it is surmised that these areas may help attract tourism to this region, however no current statistics are available. Although there are fewer coastal and maritime cultural heritage assets in South West Scotland than elsewhere (see Figure 55), thus indicating that there may be fewer opportunities for conflict between tourism and offshore renewable energy generation, the region does have several designated bathing waters. These are concentrated in the Kirkcudbright area, as indicated by Figure 56. In terms of visitor numbers data from VisitScotland indicate that in 2009, UK visitors made 0.75 million trips to Dumfries and Galloway38, stayed for 2.6 million nights and had an estimated expenditure of £119 million. In the same year, visitors from overseas made 0.057 million trips, stayed for 1.2 million nights and spent £24 million.
3.13.2 Regional Economic Value and Employment No information on economic value and employment in tourism which is specific to the South West region has been identified (other than the expenditure figures for Dumfries and Galloway given above).
3.13.3 Future Trends For further discussion on trends in tourism, see Section 2.16.3 for the national overview.
3.14 Waste Disposal
3.14.1 Regional Activity The location of open, disused and closed dredge disposal sites in this region are shown in Figure 57. The total area of seabed used for dredge spoil disposal in this region, calculated from open disposal sites, is about 1.6km² (Table 85).
37 http://jncc.defra.gov.uk/page-1445 38 Note that the boundary for the South West region does not match that of Dumfries and Galloway. The county
actually covers a larger area than the South West region as defined for this study. Thus, when looking at the tourism figures, they should be viewed as overestimates for the region (which are used in the absence of any other data).
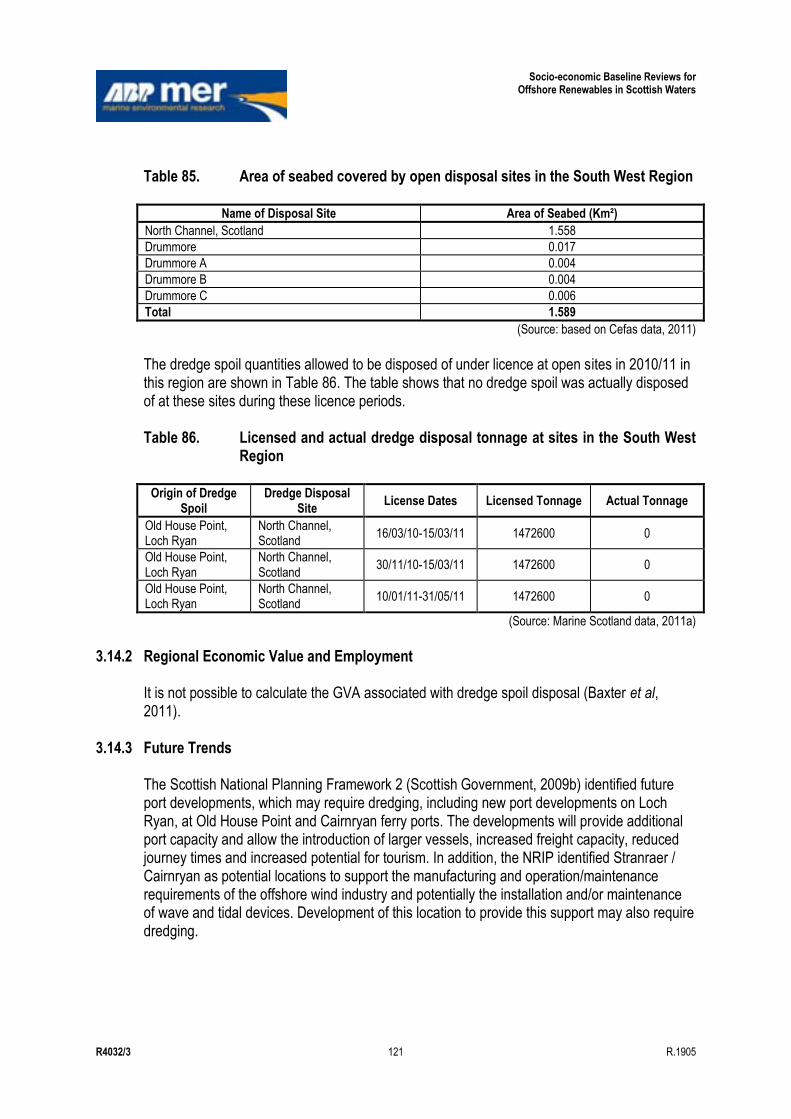
Socio-economic Baseline Reviews for Offshore Renewables in Scottish Waters
R4032/3 121 R.1905
Table 85. Area of seabed covered by open disposal sites in the South West Region
Name of Disposal Site Area of Seabed (Km²)
North Channel, Scotland 1.558
Drummore 0.017
Drummore A 0.004
Drummore B 0.004
Drummore C 0.006
Total 1.589
(Source: based on Cefas data, 2011)
The dredge spoil quantities allowed to be disposed of under licence at open sites in 2010/11 in this region are shown in Table 86. The table shows that no dredge spoil was actually disposed of at these sites during these licence periods. Table 86. Licensed and actual dredge disposal tonnage at sites in the South West
Region
Origin of Dredge Spoil
Dredge Disposal Site
License Dates Licensed Tonnage Actual Tonnage
Old House Point, Loch Ryan
North Channel, Scotland
16/03/10-15/03/11 1472600 0
Old House Point, Loch Ryan
North Channel, Scotland
30/11/10-15/03/11 1472600 0
Old House Point, Loch Ryan
North Channel, Scotland
10/01/11-31/05/11 1472600 0
(Source: Marine Scotland data, 2011a)
3.14.2 Regional Economic Value and Employment
It is not possible to calculate the GVA associated with dredge spoil disposal (Baxter et al, 2011).
3.14.3 Future Trends The Scottish National Planning Framework 2 (Scottish Government, 2009b) identified future port developments, which may require dredging, including new port developments on Loch Ryan, at Old House Point and Cairnryan ferry ports. The developments will provide additional port capacity and allow the introduction of larger vessels, increased freight capacity, reduced journey times and increased potential for tourism. In addition, the NRIP identified Stranraer / Cairnryan as potential locations to support the manufacturing and operation/maintenance requirements of the offshore wind industry and potentially the installation and/or maintenance of wave and tidal devices. Development of this location to provide this support may also require dredging.

Socio-economic Baseline Reviews for Offshore Renewables in Scottish Waters
R4032/3 122 R.1905
3.15 Water Sports
3.15.1 Regional activity 3.15.1.1 Surfing and windsurfing No specific surfing or windsurfing locations within the South West Region were identified from internet searches or from the information provided by stakeholder consultees. 3.15.1.2 Scuba diving Poor visibility generally inhibits scuba diving in the inner part of the Solway Firth although a limited amount of scuba diving is undertaken further West around Luce Bay (Figure 58). No dive centres or dive charter boats and only a few dive clubs operate in this area (Table 87). Table 87. The number of dive centres, charter boats and diving clubs found in the
South West Region
Facilities Numbers
Dive Centres 0
Charter Boats 0
ScotSAC Branches 3
BSAC Branches 1
(Source: BSAC (http://www.bsac.com/); ScotSAC (http://www.scotsac.com/); and http://finstrokes.com)
3.15.1.3 Angling The SSACN‟s Offshore Wind SEA consultation response stated that the Solway Firth in the South-West is used extensively for sea angling, particularly charter fishing. The Dumfries and Galloway region, particularly Luce Bay and the Mull of Galloway, have relatively sheltered waters, good shore access and a variety and reasonable abundance of sea fish. 3.15.1.4 Small sail boat activities and sea kayaking. Several coastal dinghy sailing clubs are present in the South West Region around Kirkcudbright Bay (Figure 59). Sea kayaking in undertaken in the South West Region although the area is not as popular as some other locations in Scotland such as around Mull and the Firth of Lorn (Land Use Consultants, 2007)(Figure 60).
3.15.2 Regional Economic Value and Employment The only economic data available within this region was for recreational angling. 3.15.2.1 Sea angling The majority of the people undertaking sea angling in this region (79%) are visitors from the rest of the UK (Radford et al 2009), who provide an important source of income for the local
Socio-economic Baseline Reviews for Offshore Renewables in Scottish Waters
R4032/3 123 R.1905
economy. Sea angling is estimated to be worth about £25 million per year to the Solway area (Scottish Sea Angling Conservation Network, 2010a). With respect to specialist and competition anglers, Scotland offers the prospect of catching tope in Luce Bay. Tope are worth about £10 million per year to several communities in Dumfries and Galloway (UKMMAS, 2010). An annual shark „tagging‟ event held over one weekend in mid June in this region was attended by about 220 sea anglers in 2010. The event contributed around £41,000 into the local economy via expenditure on bait, food, drink, boat hire etc in 2009 (Scottish Sea Angling Conservation Network, 2010a). The total estimated sea angling activity, expenditure, number of jobs supported and associated income from sea angling in the Dumfries and Galloway regions (geographically defined as the Local Authority area of the same name; which falls within the South West SORER) was as follows: Number of resident sea anglers = 3,224; Annual sea angler days spent in region = 233,080; 49% of the total sea angling activity was shore angling, while boat and charter activity
comprised 32% and 19% of the total respectively; Total annual sea angler expenditure = £25.3million; 47% of the total expenditure was spent on shore angling; and Jobs supported = 534. As noted previously the ONS employment figures are not specific to water sports or associated activities and in fact include a number of sporting activities, therefore the number of employees directly working in this industry are unknown.
3.15.3 Future Trends No regional detail on future trends were available, please refer to Section 2.18.3 for national projections.

Socio-economic Baseline Reviews for Offshore Renewables in Scottish Waters
R4032/3 124 R.1905
4. West Region
4.1 Introduction
The regional overview for each marine use present within the West SORER is detailed within this section. These sub-sections, which are arranged in alphabetical order of activity, provide information in a uniformed manner under the following headings:
Regional Activity; Regional Economic Value and Employment; and Future Trends.
The activities present within the West Region are given in Table 88 below.
Table 88. Activities present within the West SORER
Activity
Present in West SORER
Regional Trends Available
Future Trends Available
Yes No Yes No Yes No
Aquaculture
Aviation
Carbon Capture and Storage
Coast Protection and Flood Defence
Commercial Fisheries
Energy Generation
Military Interests
Oil and Gas
Ports and Harbours
Power Interconnectors
Recreational Boating
Shipping
Social and Community
Telecom Cables
Tourism
Waste Disposal
Water Sports
4.2 Aquaculture
4.2.1 Regional Activity
Marine aquaculture sites within the West Region are shown in Figure 61. There are 67 finfish and 72 shellfish sites. The figure reveals that aquaculture sites are widespread along the coastline within this region, with particular concentrations in Loch Fyne, the Firth of Lorn and around the Isle of Mull.
4.2.2 Regional Economic Value and Employment
Regional employment figures for activities relating to marine aquaculture in the West are listed below in Table 89. Employment figures within this sector have remained relatively stable between 2009 and 2010.
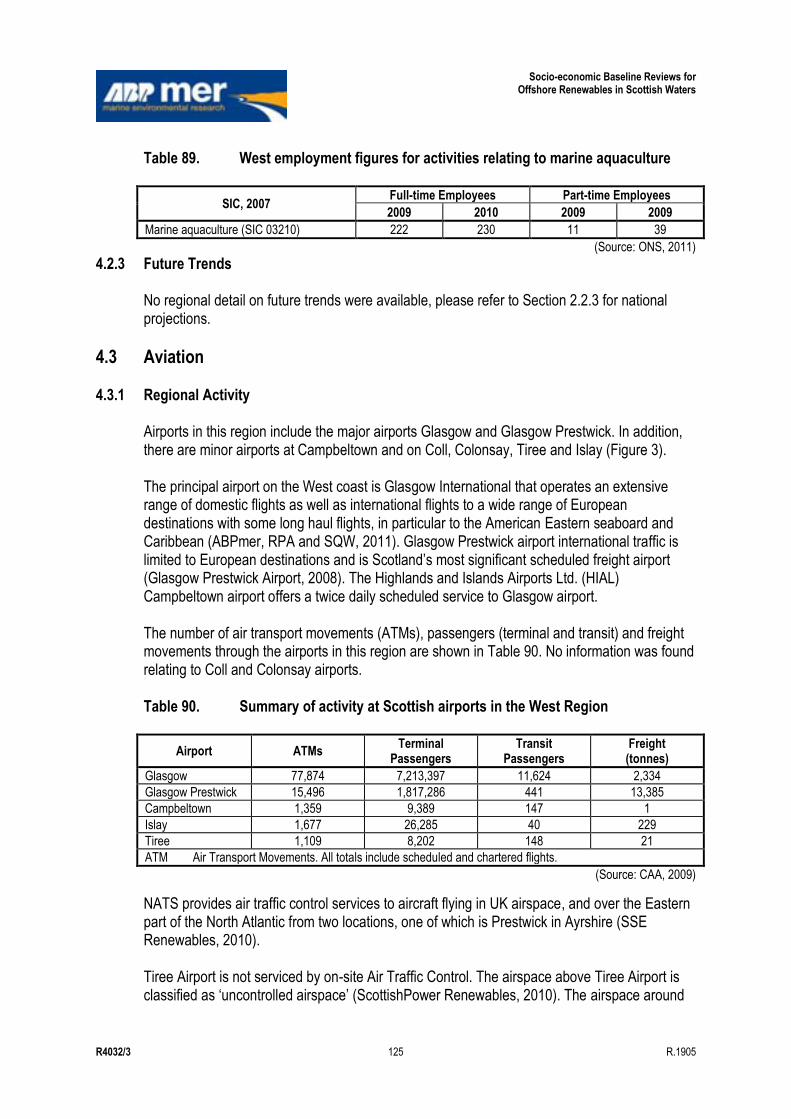
Socio-economic Baseline Reviews for Offshore Renewables in Scottish Waters
R4032/3 125 R.1905
Table 89. West employment figures for activities relating to marine aquaculture
SIC, 2007 Full-time Employees Part-time Employees
2009 2010 2009 2009
Marine aquaculture (SIC 03210) 222 230 11 39
(Source: ONS, 2011)
4.2.3 Future Trends No regional detail on future trends were available, please refer to Section 2.2.3 for national projections.
4.3 Aviation
4.3.1 Regional Activity Airports in this region include the major airports Glasgow and Glasgow Prestwick. In addition, there are minor airports at Campbeltown and on Coll, Colonsay, Tiree and Islay (Figure 3). The principal airport on the West coast is Glasgow International that operates an extensive range of domestic flights as well as international flights to a wide range of European destinations with some long haul flights, in particular to the American Eastern seaboard and Caribbean (ABPmer, RPA and SQW, 2011). Glasgow Prestwick airport international traffic is limited to European destinations and is Scotland‟s most significant scheduled freight airport (Glasgow Prestwick Airport, 2008). The Highlands and Islands Airports Ltd. (HIAL) Campbeltown airport offers a twice daily scheduled service to Glasgow airport. The number of air transport movements (ATMs), passengers (terminal and transit) and freight movements through the airports in this region are shown in Table 90. No information was found relating to Coll and Colonsay airports. Table 90. Summary of activity at Scottish airports in the West Region
Airport ATMs Terminal
Passengers Transit
Passengers Freight
(tonnes)
Glasgow 77,874 7,213,397 11,624 2,334
Glasgow Prestwick 15,496 1,817,286 441 13,385
Campbeltown 1,359 9,389 147 1
Islay 1,677 26,285 40 229
Tiree 1,109 8,202 148 21
ATM Air Transport Movements. All totals include scheduled and chartered flights.
(Source: CAA, 2009)
NATS provides air traffic control services to aircraft flying in UK airspace, and over the Eastern part of the North Atlantic from two locations, one of which is Prestwick in Ayrshire (SSE Renewables, 2010). Tiree Airport is not serviced by on-site Air Traffic Control. The airspace above Tiree Airport is classified as „uncontrolled airspace‟ (ScottishPower Renewables, 2010). The airspace around
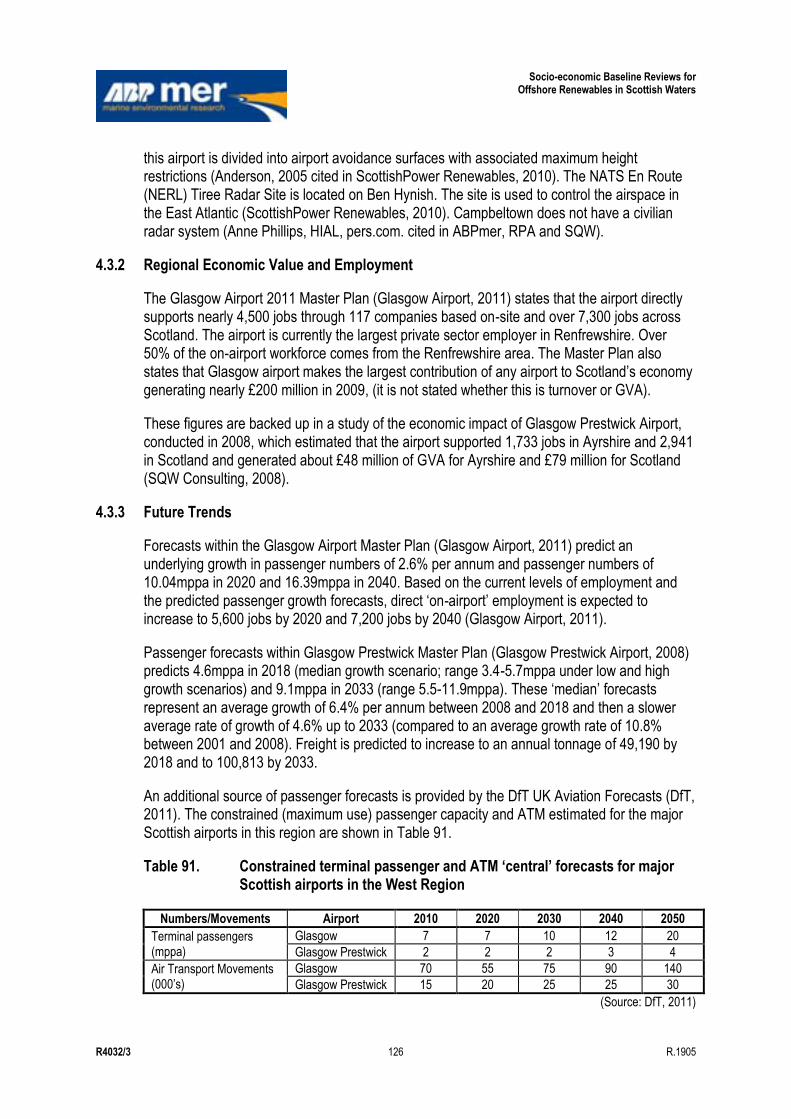
Socio-economic Baseline Reviews for Offshore Renewables in Scottish Waters
R4032/3 126 R.1905
this airport is divided into airport avoidance surfaces with associated maximum height restrictions (Anderson, 2005 cited in ScottishPower Renewables, 2010). The NATS En Route (NERL) Tiree Radar Site is located on Ben Hynish. The site is used to control the airspace in the East Atlantic (ScottishPower Renewables, 2010). Campbeltown does not have a civilian radar system (Anne Phillips, HIAL, pers.com. cited in ABPmer, RPA and SQW).
4.3.2 Regional Economic Value and Employment
The Glasgow Airport 2011 Master Plan (Glasgow Airport, 2011) states that the airport directly supports nearly 4,500 jobs through 117 companies based on-site and over 7,300 jobs across Scotland. The airport is currently the largest private sector employer in Renfrewshire. Over 50% of the on-airport workforce comes from the Renfrewshire area. The Master Plan also states that Glasgow airport makes the largest contribution of any airport to Scotland‟s economy generating nearly £200 million in 2009, (it is not stated whether this is turnover or GVA).
These figures are backed up in a study of the economic impact of Glasgow Prestwick Airport, conducted in 2008, which estimated that the airport supported 1,733 jobs in Ayrshire and 2,941 in Scotland and generated about £48 million of GVA for Ayrshire and £79 million for Scotland (SQW Consulting, 2008).
4.3.3 Future Trends
Forecasts within the Glasgow Airport Master Plan (Glasgow Airport, 2011) predict an underlying growth in passenger numbers of 2.6% per annum and passenger numbers of 10.04mppa in 2020 and 16.39mppa in 2040. Based on the current levels of employment and the predicted passenger growth forecasts, direct „on-airport‟ employment is expected to increase to 5,600 jobs by 2020 and 7,200 jobs by 2040 (Glasgow Airport, 2011).
Passenger forecasts within Glasgow Prestwick Master Plan (Glasgow Prestwick Airport, 2008) predicts 4.6mppa in 2018 (median growth scenario; range 3.4-5.7mppa under low and high growth scenarios) and 9.1mppa in 2033 (range 5.5-11.9mppa). These „median‟ forecasts represent an average growth of 6.4% per annum between 2008 and 2018 and then a slower average rate of growth of 4.6% up to 2033 (compared to an average growth rate of 10.8% between 2001 and 2008). Freight is predicted to increase to an annual tonnage of 49,190 by 2018 and to 100,813 by 2033.
An additional source of passenger forecasts is provided by the DfT UK Aviation Forecasts (DfT, 2011). The constrained (maximum use) passenger capacity and ATM estimated for the major Scottish airports in this region are shown in Table 91.
Table 91. Constrained terminal passenger and ATM ‘central’ forecasts for major Scottish airports in the West Region
Numbers/Movements Airport 2010 2020 2030 2040 2050
Terminal passengers (mppa)
Glasgow 7 7 10 12 20
Glasgow Prestwick 2 2 2 3 4
Air Transport Movements (000‟s)
Glasgow 70 55 75 90 140
Glasgow Prestwick 15 20 25 25 30
(Source: DfT, 2011)

Socio-economic Baseline Reviews for Offshore Renewables in Scottish Waters
R4032/3 127 R.1905
4.4 Coast Protection and Flood Defence
4.4.1 Regional Activity In this region there are seven hard engineered flood prevention schemes, located at Ayr, Saltcoats, Largs, Clydesmill, Dalmarnock, Rothesay and North Renfrew (Figure 62). All of these schemes were undertaken under the Flood Prevention (Scotland) Act 1961.
4.4.2 Regional Economic Value and Employment It is not possible to assign an economic value to flood and coastal defences, however, Table 92 shows the economic costs (where known) of the flood defences in this region. Table 92. Costs of flood defence schemes in the West Region since 2000
Location Cost (£million)
Ayr South Pier -
Saltcoats 1.8
Largs 0.7
Clydesmill Stage 1 & 2 -
Dalmarnock -
Rothesay 1.6
North Renfrew 6.6
(Source: Baxter et al, 2011) 4.4.3 Future Trends
There is no specific information on future trends for this region. For national projections refer to Section 2.5.3.
4.5 Commercial Fishing
4.5.1 Regional Activity
4.5.1.1 Fish catching activities
Landings caught by UK vessels within the West SORER had an average annual value of £44.2 million (11.6% of the Scottish total) and an average annual live weight of 44,100 tonnes (10.3% of the Scottish total) for the ten year period from 2001 to 2010.
Figures 63 to 66 show the annual average value (2001 to 2010) of the total landings taken from within this region, broken down for each ICES rectangle by species group, selected species, gear type and vessel length.
Figures 67 to 69 show the value of all landings caught in the inshore and offshore waters of the West SORER waters by selected species, gear type and vessel length categories from 2001 to 2010.
The majority of the value and volume of landings from within the whole of the West SORER are shellfish, however, this differs markedly between inshore waters (within 12 nm from the coast)
Socio-economic Baseline Reviews for Offshore Renewables in Scottish Waters
R4032/3 128 R.1905
and offshore waters (greater than 12 nm from the coast). Nephrops accounted for 60% of the total catch value from inshore waters in 2010 whilst scallops and „other shellfish‟ each accounted for 18% of the total catch value. Offshore, landings of mackerel accounted for 59% of the total catch value, 22% were whitefish and 13% were shellfish. In 2010, nearly half the value of landings from inshore waters was taken by vessels 15m and over in length, whilst 25% was landed by vessels over 10m and under 15m and 27% was landed by vessels 10m and under. Offshore, 86% of the total value was taken by vessels 15m and over in length. For inshore waters, 46% of the total catch value was caught by Nephrops trawl, 30% was caught by pots and 17% by dredges; whereas for offshore waters, 65% was caught by pelagic trawls and 13% by demersal trawls. Figures 70 and 71 depict the overflight (surveillance) sightings by vessel type and nationality in the region from 2006 to 2010. Within the 12NM limit all fishing is undertaken by British vessels and the area as a whole only accounts for 3% of the total national fishing effort. The gear type varies according to area fished i.e. demersal trawlers are found in the deeper waters while other gear types and dredges are used in the shallower inshore waters. The main administrative fishing ports in this region are Ayr, Campbeltown and Oban and there are also 32 smaller ports throughout the region. All the ports are shown in Figure 72.
4.5.1.2 Fish processing activities
Fish processing facilities in the study region are few and mostly small scale.
4.5.1.3 Wild salmon and sea trout
There are three fixed engine netting sites in the North of the West SORER, but no net and coble sites (see Figure 72). The main rod and line fishing rivers in this region are the Stinchar (one of the most productive salmon rivers in the South West of Scotland), Girvan, Doon (salmon), Ayr (salmon), Irvine, Clyde, Eachaig (sea trout), Add, Fyne, Awe (salmon), Orchy (salmon) and Aline. Reported catches in all of these rivers has seen a decline in recent years; for example, the River Fyne produced in the region of 250 salmon in a season in 1989, but recently there has been a dramatic decline in stocks of migratory fish and in the River Add a similar decline has been reported so that now a good year would see the salmon catch reach double figures (Gray J., 2009).
4.5.2 Regional Economic Value and Employment 4.5.2.1 Fish catching activities Administratively, the West SORER is divided into three districts: Ayr, Campbeltown and Oban. Ayr also covers the South West SORER. There are 524 fishermen employed on Scottish based vessels in the districts of Campbeltown and Oban and a further 559 in Ayr. 990 of these are
Socio-economic Baseline Reviews for Offshore Renewables in Scottish Waters
R4032/3 129 R.1905
employed full-time and 93 are part-time. Approximately 17% of the Scottish total of employment in the catching sector is in the West SORER (Marine Scotland, 2011d). For much of this region, direct employment in the fishing sector accounts for between 2% and 5% of total employment (Baxter et al., 2011). 4.5.2.2 Fish processing activities The Business Register and Employment Survey statistics for processing activities in the West SORER are shown in Table 93. Aquaculture farming is a bigger employer than fish processing in the West SORER. Table 93. Employment in fish and shellfish processing and retail in the West
SORER
SIC, 2007
Full-time Employment
Part-time Employment
Total Employment
2009 2010 2009 2010 2009 2010
Processing and preserving of fish, crustaceans and molluscs (SIC 10200)
329 329 69 68 398 401
(Source: ONS, 2011)
4.5.2.3 Wild salmon and sea trout There is no specific information on economic value and employment for this region. For a national overview refer to Section 2.6.3.
4.5.3 Future Trends There is no specific information on future trends for this region. For national projections refer to Section 2.6.3.
4.6 Energy Generation
4.6.1 Regional Activity Hunterston B nuclear power station is located within this region, south of Largs in Ayrshire. The power station started generating in 1976, and is expected to be decommissioned in 201639. It has a net electrical output of 890MW. Also within the region is Cruachan pumped storage power station.
4.6.2 Regional Economic Value and Employment Information on regional economic value for energy generation is not available. The connectivity of the electricity grid means that the region cannot be delineated. In addition, data availability on electricity generation and supply is very limited due to security issues.
39 See British Energy Internet site (http://www.british-energy.com/pagetemplate.php?pid=90).

Socio-economic Baseline Reviews for Offshore Renewables in Scottish Waters
R4032/3 130 R.1905
Employment in the electricity sector in the West Region can be estimated through looking at statistics from the ONS (2011) Business Register and Employment Survey. Figures for 2009 and 2010 for full and part time work under several relevant codes are given in Table 94. Electrical installation has the greatest number of jobs out of the categories considered, whilst construction of utility projects for electricity and telecommunications has the least. It is likely that there are more jobs in the wider energy generation sector, for example, in relation to surveying, manufacture of components, etc. However, these codes are not included here to avoid overestimation of employment. Since both offshore wind and tidal generation are proposed (see Islay and Argyll Array in Figure 73), it is probable that this region will continue to see people employed in a range of roles in the energy sector. Indeed, employment may even increase. Table 94. Employment in the electricity sector in West by SIC Code
SIC Code, 2007 Full-time Part-time Totals
2009 2010 2009 2010 2009 2010
Production of electricity (3511) 879 1531 27 58 906 1589
Transmission of electricity (3512) 823 881 174 181 997 1062
Distribution of electricity (3513) 1841 1970 226 276 2067 2246
Trade of electricity (3514) 94 117 0 3 94 120
Construction of utility projects for electricity and telecommunications (4222)
2 6 0 0 2 6
Electrical installation (4321) 7395 5293 441 303 7836 5596
Totals (note that totals may not sum exactly due to rounding)
11,034 9,798 868 821 11,902 10,619
(Source: ONS, 2011)
4.6.3 Future Trends There is no specific information on future trends for this region. For national projections refer to Section 2.7.3.
4.7 Military Interests
4.7.1 Regional Activity The coastal military locations which occur within this region are shown in Figure 74. Military interests in this region include: HMNB Clyde located at Faslane; Loch Goil and Loch Fyne Noise Ranges, for measuring the radiated acoustic
signatures of surface and subsurface vessels; Military fuel depots at Loch Striven (near Dunoon) and Campbeltown, which provide
maritime fuelling facilities to visiting UK and NATO vessels; HMS Gannet, located at the North side of Glasgow Prestwick Airport which operates
three Sea King helicopters in a Search and Rescue capacity. This is the only military air bases on the West coast (ABPmer, RPA and SQW, 2011); and
A Royal Navy SXA, which covers most of the inshore and offshore waters within this SORER.
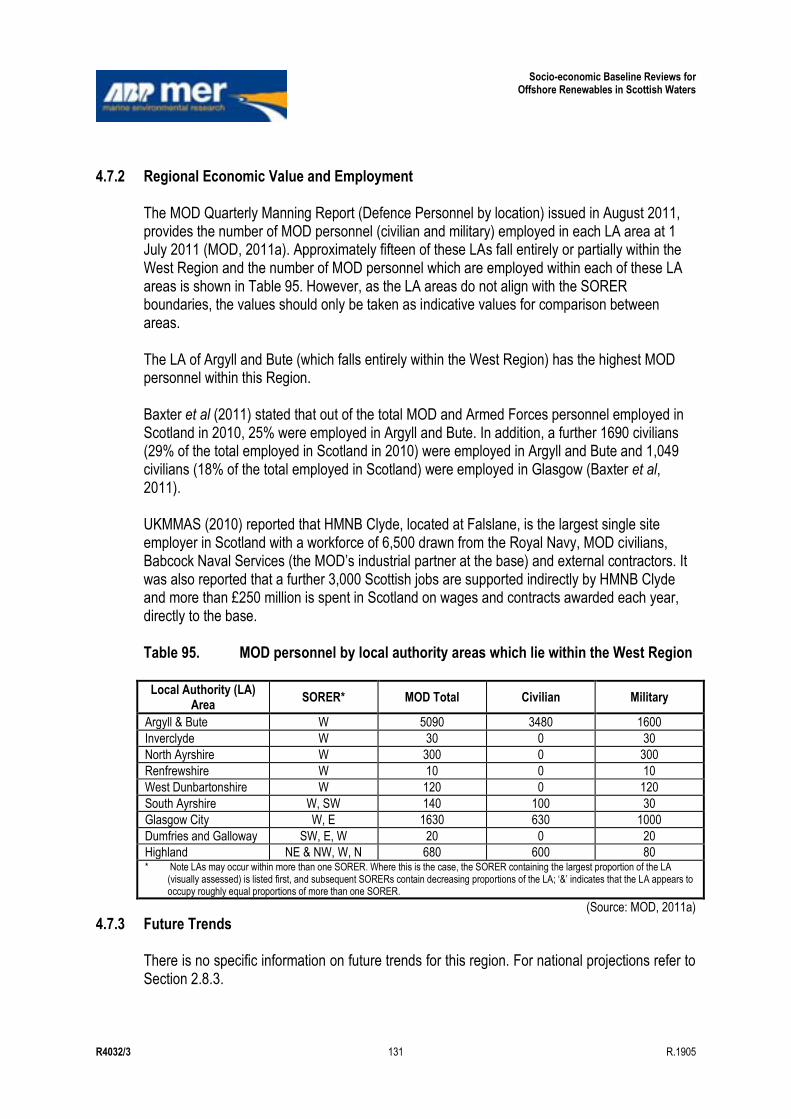
Socio-economic Baseline Reviews for Offshore Renewables in Scottish Waters
R4032/3 131 R.1905
4.7.2 Regional Economic Value and Employment
The MOD Quarterly Manning Report (Defence Personnel by location) issued in August 2011, provides the number of MOD personnel (civilian and military) employed in each LA area at 1 July 2011 (MOD, 2011a). Approximately fifteen of these LAs fall entirely or partially within the West Region and the number of MOD personnel which are employed within each of these LA areas is shown in Table 95. However, as the LA areas do not align with the SORER boundaries, the values should only be taken as indicative values for comparison between areas. The LA of Argyll and Bute (which falls entirely within the West Region) has the highest MOD personnel within this Region. Baxter et al (2011) stated that out of the total MOD and Armed Forces personnel employed in Scotland in 2010, 25% were employed in Argyll and Bute. In addition, a further 1690 civilians (29% of the total employed in Scotland in 2010) were employed in Argyll and Bute and 1,049 civilians (18% of the total employed in Scotland) were employed in Glasgow (Baxter et al, 2011). UKMMAS (2010) reported that HMNB Clyde, located at Falslane, is the largest single site employer in Scotland with a workforce of 6,500 drawn from the Royal Navy, MOD civilians, Babcock Naval Services (the MOD‟s industrial partner at the base) and external contractors. It was also reported that a further 3,000 Scottish jobs are supported indirectly by HMNB Clyde and more than £250 million is spent in Scotland on wages and contracts awarded each year, directly to the base. Table 95. MOD personnel by local authority areas which lie within the West Region
Local Authority (LA) Area
SORER* MOD Total Civilian Military
Argyll & Bute W 5090 3480 1600
Inverclyde W 30 0 30
North Ayrshire W 300 0 300
Renfrewshire W 10 0 10
West Dunbartonshire W 120 0 120
South Ayrshire W, SW 140 100 30
Glasgow City W, E 1630 630 1000
Dumfries and Galloway SW, E, W 20 0 20
Highland NE & NW, W, N 680 600 80 * Note LAs may occur within more than one SORER. Where this is the case, the SORER containing the largest proportion of the LA
(visually assessed) is listed first, and subsequent SORERs contain decreasing proportions of the LA; „&‟ indicates that the LA appears to occupy roughly equal proportions of more than one SORER.
(Source: MOD, 2011a)
4.7.3 Future Trends There is no specific information on future trends for this region. For national projections refer to Section 2.8.3.
Socio-economic Baseline Reviews for Offshore Renewables in Scottish Waters
R4032/3 132 R.1905
4.8 Port and Harbours
4.8.1 Regional Activity There are three major ports within the West Region, as measured by tonnages moved, these are namely Ayr, the Clyde (ports) and Glensanda (Figure 76). Ayr is situated at the entrance to the Firth of Clyde, the Port has access to good road and rail networks and handles a range of cargoes including dry bulks (salt, aggregates, sand, and animal feed), forest products, general cargo, minerals and ores, passengers and cruise ships. The port of Ayr handles between 240,000 and 560,000 tonnes of cargo every year (see Table 96). Clyde Port is the umbrella term for the ports located along the Forth of Clyde, which include four principal locations of Hunterston, Greenock, King George Vth Dock in Glasgow and Ardrossan. Cumulatively, these facilities handle a volume of 7.2 to 15.7 million tonnes of cargo a year (see Table 110). Hunterston is a dry bulk terminal discharging coal which is shipped by train to power stations across Scotland and the wider UK; Greenock Ocean Terminal is a deep water general cargo berth which also handles cruise and passenger vessels. The King George Vth Dock located close to the centre of the City of Glasgow handles general cargo from animal feed to forest products and scrap metal; and Ardrossan which operates a roll-on roll-off ferry port running services to the Scottish isles. The Glensanda estate and port located in Argyll exports between 5 and 7 million tonnes of aggregate each year to various destinations all over the world. This port was established following a 1976 UK Government review of the shortage of aggregate. The resulting report led the established of a „super-quarry‟ situated in a remote location from which stone could be exported by sea. Approximately 160 employees either live on site or commute by boat from Barcaldine near Oban, there is no road, rail or marked footway links to the quarry. The only practical access is by boat from the shores of Loch Linnhe. In addition to these three major ports, there are a further 66 other ports and harbours owned and operated by a range of private and public bodies (see Table 97). Most prominent amongst these is the port of Troon which operates ferry services to both Belfast and Larne in Northern Ireland, providing an important freight and passenger link within this region. In addition the ports of Oban and Tarbert (Loch Fyne) which play an integral part in linking island communities with the mainland and harbours. The wide range and number of ports in this region demonstrates the importance that island communities and local economies rely for lifeline service and economic sustainment, many communities themselves have grown up around such connections (BPA, 2008).
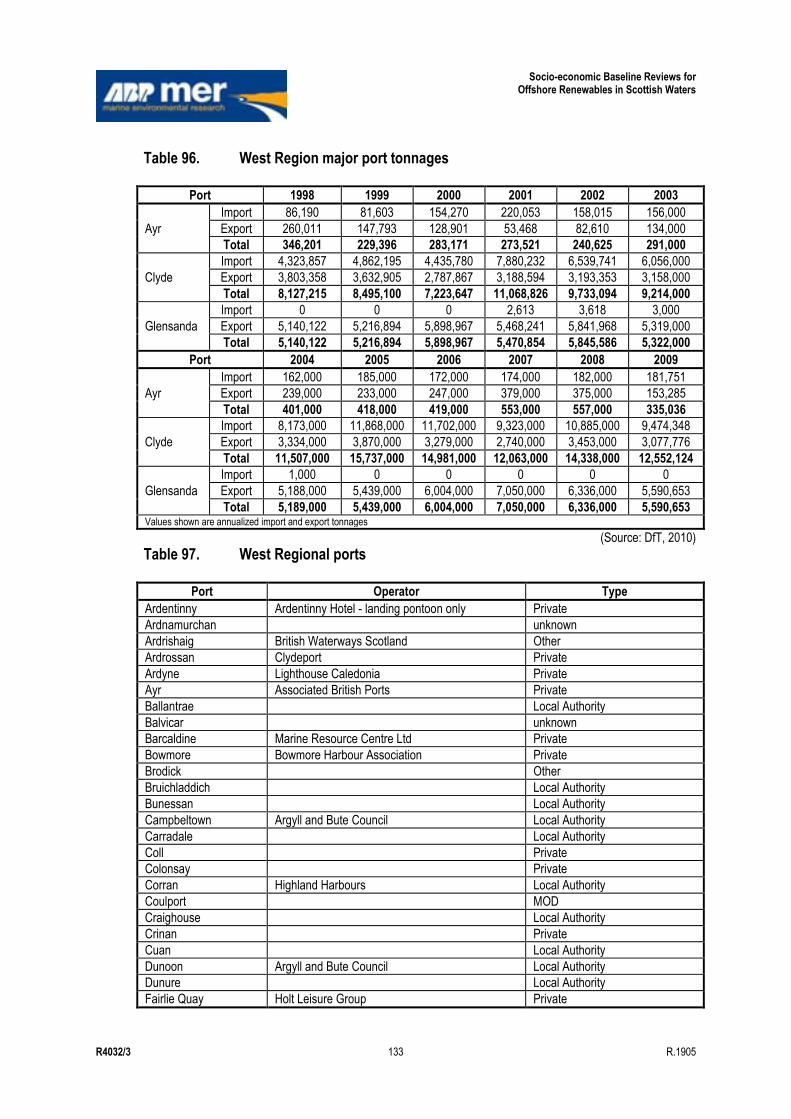
Socio-economic Baseline Reviews for Offshore Renewables in Scottish Waters
R4032/3 133 R.1905
Table 96. West Region major port tonnages
Port 1998 1999 2000 2001 2002 2003
Ayr
Import 86,190 81,603 154,270 220,053 158,015 156,000
Export 260,011 147,793 128,901 53,468 82,610 134,000
Total 346,201 229,396 283,171 273,521 240,625 291,000
Clyde
Import 4,323,857 4,862,195 4,435,780 7,880,232 6,539,741 6,056,000
Export 3,803,358 3,632,905 2,787,867 3,188,594 3,193,353 3,158,000
Total 8,127,215 8,495,100 7,223,647 11,068,826 9,733,094 9,214,000
Glensanda
Import 0 0 0 2,613 3,618 3,000
Export 5,140,122 5,216,894 5,898,967 5,468,241 5,841,968 5,319,000
Total 5,140,122 5,216,894 5,898,967 5,470,854 5,845,586 5,322,000
Port 2004 2005 2006 2007 2008 2009
Ayr
Import 162,000 185,000 172,000 174,000 182,000 181,751
Export 239,000 233,000 247,000 379,000 375,000 153,285
Total 401,000 418,000 419,000 553,000 557,000 335,036
Clyde
Import 8,173,000 11,868,000 11,702,000 9,323,000 10,885,000 9,474,348
Export 3,334,000 3,870,000 3,279,000 2,740,000 3,453,000 3,077,776
Total 11,507,000 15,737,000 14,981,000 12,063,000 14,338,000 12,552,124
Glensanda
Import 1,000 0 0 0 0 0
Export 5,188,000 5,439,000 6,004,000 7,050,000 6,336,000 5,590,653
Total 5,189,000 5,439,000 6,004,000 7,050,000 6,336,000 5,590,653 Values shown are annualized import and export tonnages
(Source: DfT, 2010) Table 97. West Regional ports
Port Operator Type
Ardentinny Ardentinny Hotel - landing pontoon only Private
Ardnamurchan unknown
Ardrishaig British Waterways Scotland Other
Ardrossan Clydeport Private
Ardyne Lighthouse Caledonia Private
Ayr Associated British Ports Private
Ballantrae Local Authority
Balvicar unknown
Barcaldine Marine Resource Centre Ltd Private
Bowmore Bowmore Harbour Association Private
Brodick Other
Bruichladdich Local Authority
Bunessan Local Authority
Campbeltown Argyll and Bute Council Local Authority
Carradale Local Authority
Coll Private
Colonsay Private
Corran Highland Harbours Local Authority
Coulport MOD
Craighouse Local Authority
Crinan Private
Cuan Local Authority
Dunoon Argyll and Bute Council Local Authority
Dunure Local Authority
Fairlie Quay Holt Leisure Group Private
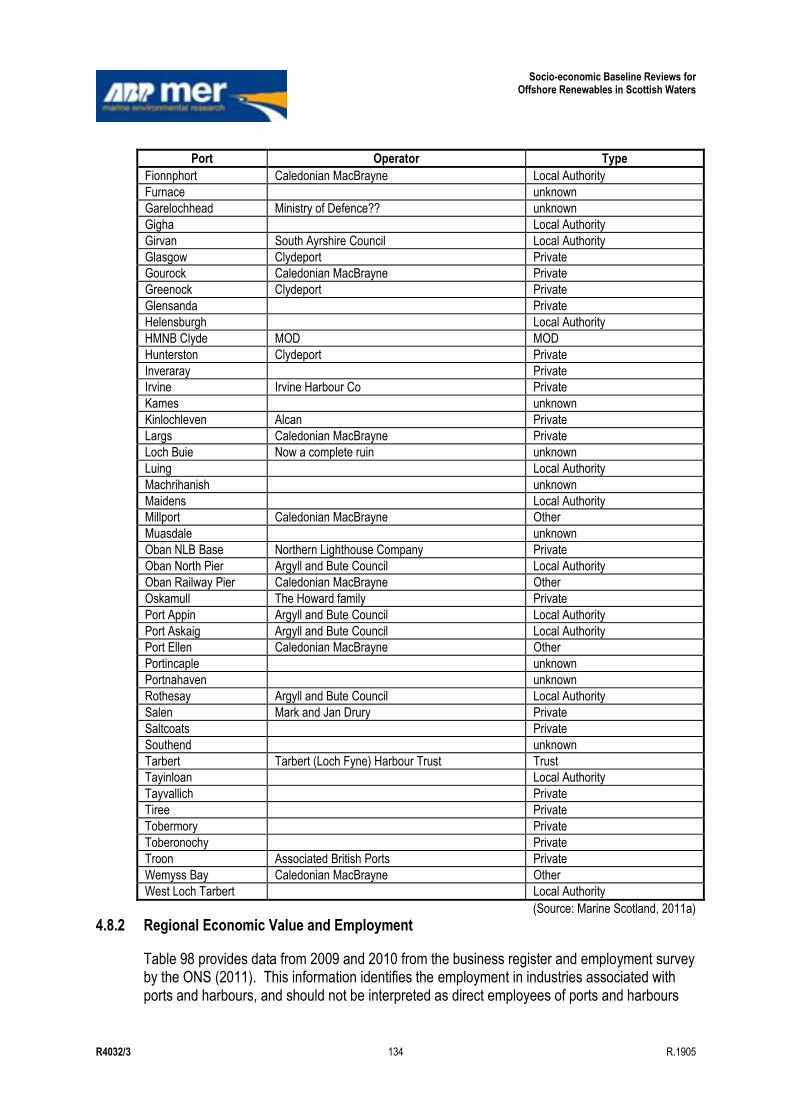
Socio-economic Baseline Reviews for Offshore Renewables in Scottish Waters
R4032/3 134 R.1905
Port Operator Type
Fionnphort Caledonian MacBrayne Local Authority
Furnace unknown
Garelochhead Ministry of Defence?? unknown
Gigha Local Authority
Girvan South Ayrshire Council Local Authority
Glasgow Clydeport Private
Gourock Caledonian MacBrayne Private
Greenock Clydeport Private
Glensanda Private
Helensburgh Local Authority
HMNB Clyde MOD MOD
Hunterston Clydeport Private
Inveraray Private
Irvine Irvine Harbour Co Private
Kames unknown
Kinlochleven Alcan Private
Largs Caledonian MacBrayne Private
Loch Buie Now a complete ruin unknown
Luing Local Authority
Machrihanish unknown
Maidens Local Authority
Millport Caledonian MacBrayne Other
Muasdale unknown
Oban NLB Base Northern Lighthouse Company Private
Oban North Pier Argyll and Bute Council Local Authority
Oban Railway Pier Caledonian MacBrayne Other
Oskamull The Howard family Private
Port Appin Argyll and Bute Council Local Authority
Port Askaig Argyll and Bute Council Local Authority
Port Ellen Caledonian MacBrayne Other
Portincaple unknown
Portnahaven unknown
Rothesay Argyll and Bute Council Local Authority
Salen Mark and Jan Drury Private
Saltcoats Private
Southend unknown
Tarbert Tarbert (Loch Fyne) Harbour Trust Trust
Tayinloan Local Authority
Tayvallich Private
Tiree Private
Tobermory Private
Toberonochy Private
Troon Associated British Ports Private
Wemyss Bay Caledonian MacBrayne Other
West Loch Tarbert Local Authority
(Source: Marine Scotland, 2011a)
4.8.2 Regional Economic Value and Employment
Table 98 provides data from 2009 and 2010 from the business register and employment survey by the ONS (2011). This information identifies the employment in industries associated with ports and harbours, and should not be interpreted as direct employees of ports and harbours
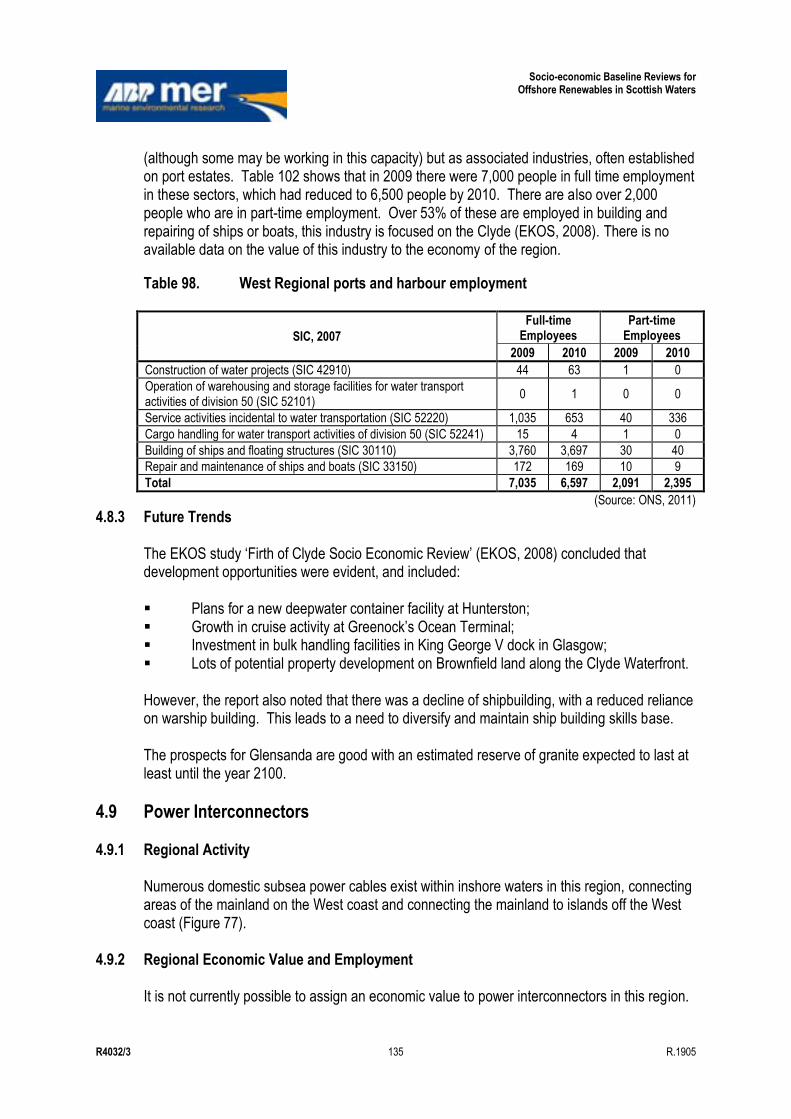
Socio-economic Baseline Reviews for Offshore Renewables in Scottish Waters
R4032/3 135 R.1905
(although some may be working in this capacity) but as associated industries, often established on port estates. Table 102 shows that in 2009 there were 7,000 people in full time employment in these sectors, which had reduced to 6,500 people by 2010. There are also over 2,000 people who are in part-time employment. Over 53% of these are employed in building and repairing of ships or boats, this industry is focused on the Clyde (EKOS, 2008). There is no available data on the value of this industry to the economy of the region.
Table 98. West Regional ports and harbour employment
SIC, 2007
Full-time Employees
Part-time Employees
2009 2010 2009 2010
Construction of water projects (SIC 42910) 44 63 1 0
Operation of warehousing and storage facilities for water transport activities of division 50 (SIC 52101)
0 1 0 0
Service activities incidental to water transportation (SIC 52220) 1,035 653 40 336
Cargo handling for water transport activities of division 50 (SIC 52241) 15 4 1 0
Building of ships and floating structures (SIC 30110) 3,760 3,697 30 40
Repair and maintenance of ships and boats (SIC 33150) 172 169 10 9
Total 7,035 6,597 2,091 2,395
(Source: ONS, 2011)
4.8.3 Future Trends The EKOS study „Firth of Clyde Socio Economic Review‟ (EKOS, 2008) concluded that development opportunities were evident, and included: Plans for a new deepwater container facility at Hunterston; Growth in cruise activity at Greenock‟s Ocean Terminal; Investment in bulk handling facilities in King George V dock in Glasgow; Lots of potential property development on Brownfield land along the Clyde Waterfront. However, the report also noted that there was a decline of shipbuilding, with a reduced reliance on warship building. This leads to a need to diversify and maintain ship building skills base. The prospects for Glensanda are good with an estimated reserve of granite expected to last at least until the year 2100.
4.9 Power Interconnectors
4.9.1 Regional Activity Numerous domestic subsea power cables exist within inshore waters in this region, connecting areas of the mainland on the West coast and connecting the mainland to islands off the West coast (Figure 77).
4.9.2 Regional Economic Value and Employment It is not currently possible to assign an economic value to power interconnectors in this region.
Socio-economic Baseline Reviews for Offshore Renewables in Scottish Waters
R4032/3 136 R.1905
Information on employment within this sector is provided by the ONS however the proportion of these employees associated with subsea power cables is unknown.
4.9.3 Future Trends There are a number of proposed marine power interconnector developments in the UK at various stages of maturity in the planning process. One development that may be relevant to this region (e.g. which may pass through this SORER and/or make landfall in this region) is the Western HVDC Link (Saunders et al, 2011; and Refabrica website: www.refabrica.com/einter/ ?page_id=157). This would have a potential temporary impact on employment numbers and local revenue (through supply chain activities) within the region during the construction stage and on maintenance during the cable lifetime.
4.10 Recreational Boating
4.10.1 Regional Activity The West of Scotland is an internationally important yachting destination (RYA Scotland consultation response). Baxter et al (2011) describes the distribution of sailing as being concentrated along the West coast (comprising parts of the West and North West Region) where the RYA Atlas of recreational boating indicates there are heavy recreational cruising routes40 and several 200+ berth marinas. Sailing activity in the West Region is shown in Figure 78. The figure highlights that recreational use is most concentrated near the West coast within the sounds of the Inner Hebrides. Heavy recreational use is made of the Sound of Mull, the Firth of Lorne, the North of the Sound of Jura and the Crinan Canal. Heavy use is also made of cruising routes in the Sound of Luing, Seil Sound, Shuna Sound and Loch Melfort and of a route from the Crinan Canal, South through Loch Fyne and the Firth of Clyde via the Kyles of Bute and South of the Isle of Bute. Heavy usage cruising routes also exist between Arran and the mainland (Baxter et al., 2011). Light and medium usage cruising routes connect these heavy routes with the Inner and Outer Hebrides (note the latter falls within the North West Region). Light usage cruising routes are present off Tiree and a „light‟ route from the Firth of Lorne to the coast of Tiree North of Hynish (Figure 78). Another „light‟ route exists from near Kintra on Mull through the Gunna Sound (Scottish Power Renewables, 2010). A light usage route passes off Islay and medium usage routes exist off the Kintyre coast and around the Mull of Kintyre. It should be noted that the RYA UK Recreational Boating Atlas highlights the fact that many lightly used routes are the only routes available and therefore have considerable local importance.
40 Heavy use = 6 or more recreational craft may be seen at all times during summer/daylight hours. Includes
entrances to harbours, anchorages and places of rescue; Moderate use = popular – some recreational craft will be seen at most times during summer daylight hours; Light use = routes known to be commonly used. (Source: RYA, 2005).

Socio-economic Baseline Reviews for Offshore Renewables in Scottish Waters
R4032/3 137 R.1905
4.10.2 Regional Economic Value and Employment An indicative estimate of the economic impact of sailing is provided by the Scottish Enterprise (2010) and shown in Table 99 below. It must be noted that these values are only indicative as the sailing tourism study regions reported, which are considered to reflect the geography of the main „sub-national‟ sailing economies in Scotland, do not align with the SORERs and tend to span various parts of several of the SORERs. Table 99. Sailing area values and berth numbers for Clyde and the West
Sailing Tourism Study Region
Scottish Sea Areas
Included
Relevant Offshore Wind Energy Plan Region
Value (£million)
GVA
Number of
Pontoons
Number of
Moorings
Clyde (Clyde Estuary & Solway)
Clyde Irish Sea
Mainly South-West but part of West Region
44 3333 2038
West (Argyll, Ardnamurchan-Gairloch & Outer Hebrides)
Minches & Malin sea Hebrides
Part of West and North West Regions
39 1030 2637
(Source: Scottish Enterprise 2010, Summarised in Baxter et al, 2011)
There are no regional employment figures for activities directly related to recreational boating.
4.10.3 Future Trends No regional detail on future trends were available, please refer to Section 2.12.3 for national projections.
4.11 Shipping
4.11.1 Regional Activity The Firth of Clyde is a deep water route, which is generally unobstructed from a navigation perspective as it is a high and rocky coast with some sandy beaches on its Eastern shore. The Firth has a number of rocky islands rising steeply from deep waters which include: Arran, Sanda and Pladda on its North and West edge and Ailsa Craig in the middle of an otherwise clear channel. Traffic of all size and types (passenger, cargo, leisure and Government) navigate this area in significant quantity, either departing or arriving at local ports or as through traffic transiting to Ireland. Fishing occurs throughout the area. There are a substantial number of leisure users who sail in the Firth of Clyde, and further North into the Western Isles (GLA, 2010). The Western Isles presents an almost uninterrupted succession of deep indentations, fronted by bold rocky cliffs and headlands forming islands, narrows and sea lochs. From a shipping perspective drying rocks and reefs are frequent, often with deep navigable waters immediately adjacent. The Mull of Kintyre to Ardnamurchan coast line is no exception exposed directly to the Atlantic Ocean and the full force of winter gales the coast is frequently obscured by low cloud and driving rain. Strong tidal streams, and eddies can be experienced in narrows and inshore making navigation difficult and unpredictable (GLA, 2010).
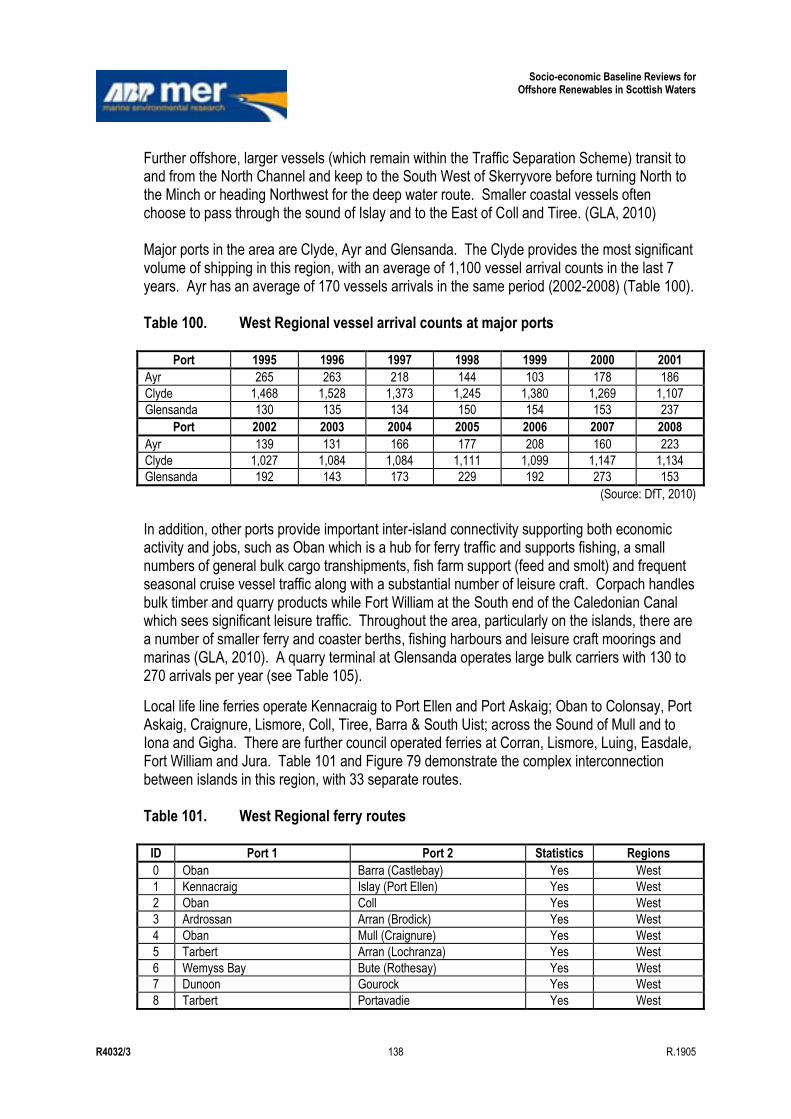
Socio-economic Baseline Reviews for Offshore Renewables in Scottish Waters
R4032/3 138 R.1905
Further offshore, larger vessels (which remain within the Traffic Separation Scheme) transit to and from the North Channel and keep to the South West of Skerryvore before turning North to the Minch or heading Northwest for the deep water route. Smaller coastal vessels often choose to pass through the sound of Islay and to the East of Coll and Tiree. (GLA, 2010) Major ports in the area are Clyde, Ayr and Glensanda. The Clyde provides the most significant volume of shipping in this region, with an average of 1,100 vessel arrival counts in the last 7 years. Ayr has an average of 170 vessels arrivals in the same period (2002-2008) (Table 100). Table 100. West Regional vessel arrival counts at major ports
Port 1995 1996 1997 1998 1999 2000 2001
Ayr 265 263 218 144 103 178 186
Clyde 1,468 1,528 1,373 1,245 1,380 1,269 1,107
Glensanda 130 135 134 150 154 153 237
Port 2002 2003 2004 2005 2006 2007 2008
Ayr 139 131 166 177 208 160 223
Clyde 1,027 1,084 1,084 1,111 1,099 1,147 1,134
Glensanda 192 143 173 229 192 273 153
(Source: DfT, 2010) In addition, other ports provide important inter-island connectivity supporting both economic activity and jobs, such as Oban which is a hub for ferry traffic and supports fishing, a small numbers of general bulk cargo transhipments, fish farm support (feed and smolt) and frequent seasonal cruise vessel traffic along with a substantial number of leisure craft. Corpach handles bulk timber and quarry products while Fort William at the South end of the Caledonian Canal which sees significant leisure traffic. Throughout the area, particularly on the islands, there are a number of smaller ferry and coaster berths, fishing harbours and leisure craft moorings and marinas (GLA, 2010). A quarry terminal at Glensanda operates large bulk carriers with 130 to 270 arrivals per year (see Table 105).
Local life line ferries operate Kennacraig to Port Ellen and Port Askaig; Oban to Colonsay, Port Askaig, Craignure, Lismore, Coll, Tiree, Barra & South Uist; across the Sound of Mull and to Iona and Gigha. There are further council operated ferries at Corran, Lismore, Luing, Easdale, Fort William and Jura. Table 101 and Figure 79 demonstrate the complex interconnection between islands in this region, with 33 separate routes. Table 101. West Regional ferry routes
ID Port 1 Port 2 Statistics Regions
0 Oban Barra (Castlebay) Yes West
1 Kennacraig Islay (Port Ellen) Yes West
2 Oban Coll Yes West
3 Ardrossan Arran (Brodick) Yes West
4 Oban Mull (Craignure) Yes West
5 Tarbert Arran (Lochranza) Yes West
6 Wemyss Bay Bute (Rothesay) Yes West
7 Dunoon Gourock Yes West
8 Tarbert Portavadie Yes West
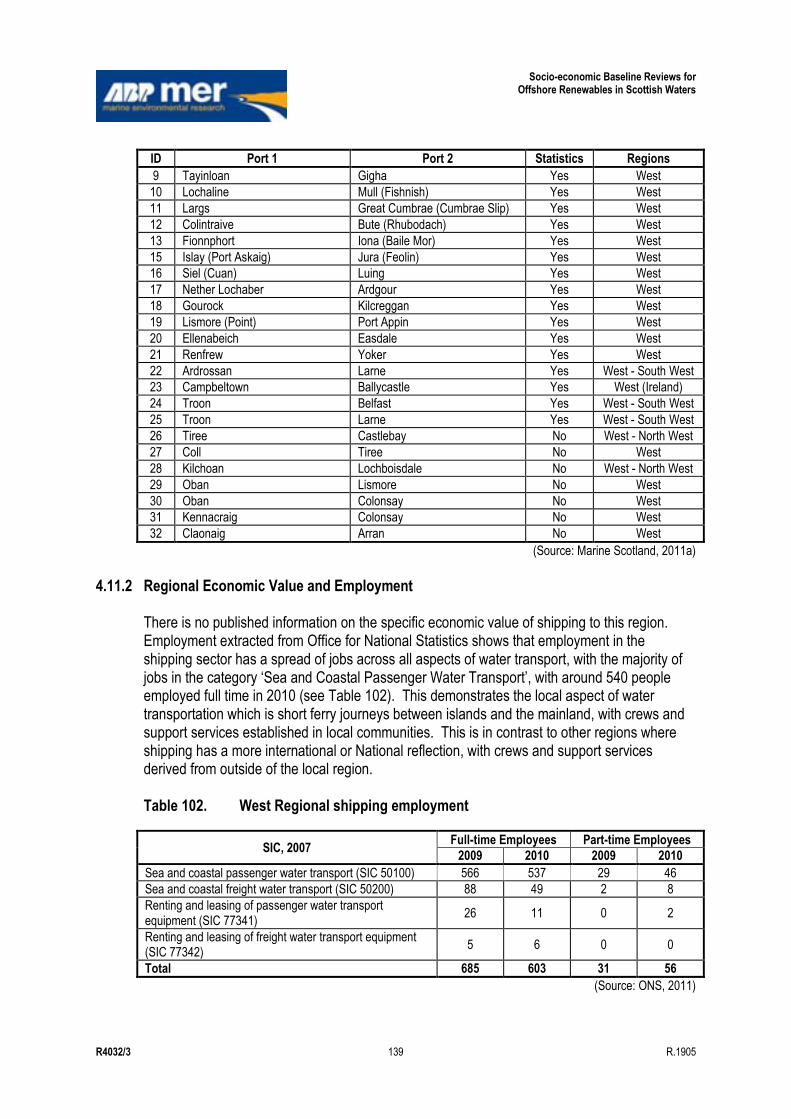
Socio-economic Baseline Reviews for Offshore Renewables in Scottish Waters
R4032/3 139 R.1905
ID Port 1 Port 2 Statistics Regions
9 Tayinloan Gigha Yes West
10 Lochaline Mull (Fishnish) Yes West
11 Largs Great Cumbrae (Cumbrae Slip) Yes West
12 Colintraive Bute (Rhubodach) Yes West
13 Fionnphort Iona (Baile Mor) Yes West
15 Islay (Port Askaig) Jura (Feolin) Yes West
16 Siel (Cuan) Luing Yes West
17 Nether Lochaber Ardgour Yes West
18 Gourock Kilcreggan Yes West
19 Lismore (Point) Port Appin Yes West
20 Ellenabeich Easdale Yes West
21 Renfrew Yoker Yes West
22 Ardrossan Larne Yes West - South West
23 Campbeltown Ballycastle Yes West (Ireland)
24 Troon Belfast Yes West - South West
25 Troon Larne Yes West - South West
26 Tiree Castlebay No West - North West
27 Coll Tiree No West
28 Kilchoan Lochboisdale No West - North West
29 Oban Lismore No West
30 Oban Colonsay No West
31 Kennacraig Colonsay No West
32 Claonaig Arran No West
(Source: Marine Scotland, 2011a)
4.11.2 Regional Economic Value and Employment
There is no published information on the specific economic value of shipping to this region. Employment extracted from Office for National Statistics shows that employment in the shipping sector has a spread of jobs across all aspects of water transport, with the majority of jobs in the category „Sea and Coastal Passenger Water Transport‟, with around 540 people employed full time in 2010 (see Table 102). This demonstrates the local aspect of water transportation which is short ferry journeys between islands and the mainland, with crews and support services established in local communities. This is in contrast to other regions where shipping has a more international or National reflection, with crews and support services derived from outside of the local region. Table 102. West Regional shipping employment
SIC, 2007 Full-time Employees Part-time Employees
2009 2010 2009 2010
Sea and coastal passenger water transport (SIC 50100) 566 537 29 46
Sea and coastal freight water transport (SIC 50200) 88 49 2 8
Renting and leasing of passenger water transport equipment (SIC 77341)
26 11 0 2
Renting and leasing of freight water transport equipment (SIC 77342)
5 6 0 0
Total 685 603 31 56
(Source: ONS, 2011)
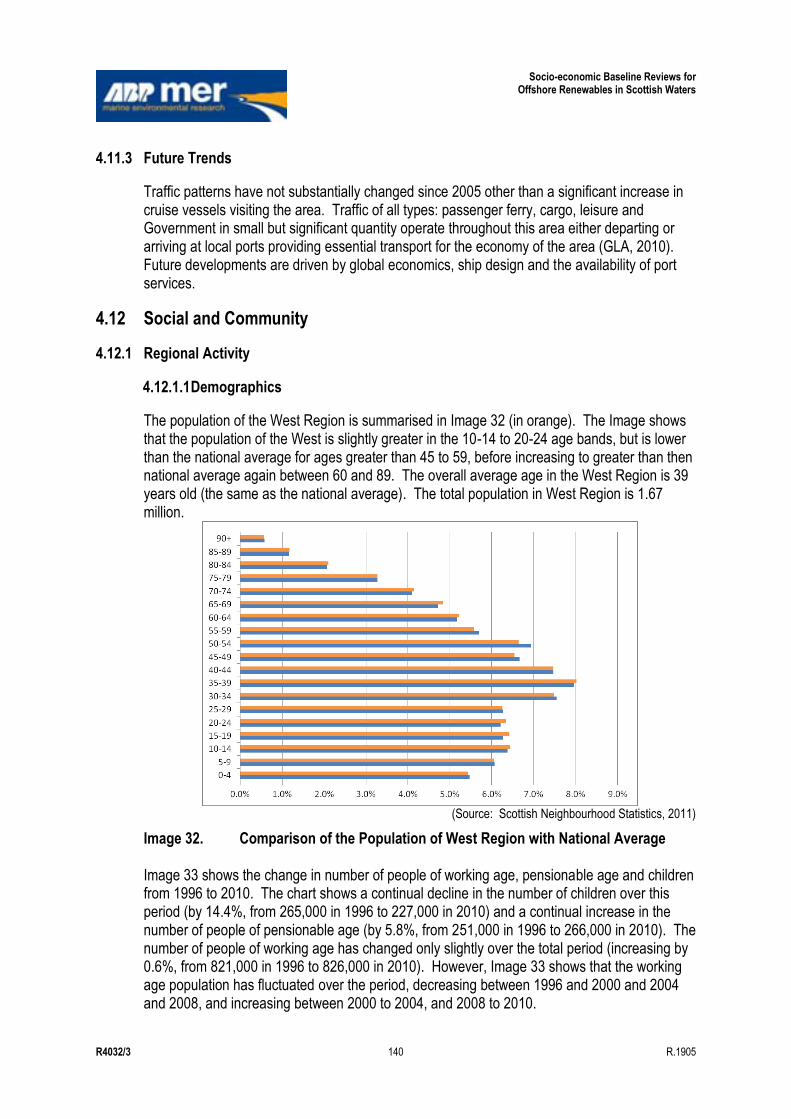
Socio-economic Baseline Reviews for Offshore Renewables in Scottish Waters
R4032/3 140 R.1905
4.11.3 Future Trends
Traffic patterns have not substantially changed since 2005 other than a significant increase in cruise vessels visiting the area. Traffic of all types: passenger ferry, cargo, leisure and Government in small but significant quantity operate throughout this area either departing or arriving at local ports providing essential transport for the economy of the area (GLA, 2010). Future developments are driven by global economics, ship design and the availability of port services.
4.12 Social and Community
4.12.1 Regional Activity
4.12.1.1 Demographics
The population of the West Region is summarised in Image 32 (in orange). The Image shows that the population of the West is slightly greater in the 10-14 to 20-24 age bands, but is lower than the national average for ages greater than 45 to 59, before increasing to greater than then national average again between 60 and 89. The overall average age in the West Region is 39 years old (the same as the national average). The total population in West Region is 1.67 million.
(Source: Scottish Neighbourhood Statistics, 2011)
Image 32. Comparison of the Population of West Region with National Average Image 33 shows the change in number of people of working age, pensionable age and children from 1996 to 2010. The chart shows a continual decline in the number of children over this period (by 14.4%, from 265,000 in 1996 to 227,000 in 2010) and a continual increase in the number of people of pensionable age (by 5.8%, from 251,000 in 1996 to 266,000 in 2010). The number of people of working age has changed only slightly over the total period (increasing by 0.6%, from 821,000 in 1996 to 826,000 in 2010). However, Image 33 shows that the working age population has fluctuated over the period, decreasing between 1996 and 2000 and 2004 and 2008, and increasing between 2000 to 2004, and 2008 to 2010.

Socio-economic Baseline Reviews for Offshore Renewables in Scottish Waters
R4032/3 141 R.1905
(Source: Scottish Neighbourhood Statistics, 2011)
Image 33. Change in Population 1996-2010 in West Region
4.12.2 Regional Economic Value and Employment
Median weekly gross income for full-time employees in the West region was £348.00 in 2001. By 2010, this had risen to £487.59, an increase of £139.59. Taking account of average inflation of 3.1% per year, this is an increase of 3.2% between 2001 and 2010. This is slightly higher than the national average (£478.39).
Table 103 shows employment data by industry sector for the West. The table shows that the greatest number of jobs are associated with Sectors Q (human health and social work activities) (17% of the total for 2010) and Sector G (wholesale and retail trade) at 15%. Other industry sectors accounting for more than 10% of jobs are in administrative and support service activities (N) at 10%. Less significant in the West are mining and quarrying (0.2%), water supply, sewerage, waste management and remediation activities (E) at 0.6%, and electricity, gas, steam and air conditioning supply (0.8%). Agriculture, forestry and fishing makes up 0.2% of all jobs, while accommodation and food service activities (I) account for around 7%. Jobs in arts, entertainment and recreation (R) make up almost 3% of all jobs in the West.
Table 103. Employment data by industry sector in the West
Industry Sector Full-time Part-time Total
2009 2010 2009 2010 2009 2010
A. Agriculture, forestry and fishing 1,005 1,008 94 322 1,102 1,321
B. Mining and quarrying 1,028 1,282 30 34 1,055 1,320
C. Manufacturing 53,075 47,914 3,612 3,398 56,709 51,326
D. Electricity, gas, steam and air conditioning supply
4,418 5,321 472 555 4,891 5,864
E. Water supply; sewerage, waste management and remediation activities
5,356 4,246 175 93 5,533 4,345
F. Construction 39,683 34,778 2,464 1,972 42,151 36,767
G. Wholesale and retail trade; repair of motor vehicles and motorcycles
63,447 61,711 51,034 51,704 114,483 113,418
H. Transportation and storage 30,625 27,526 5,259 4,486 35,879 32,030
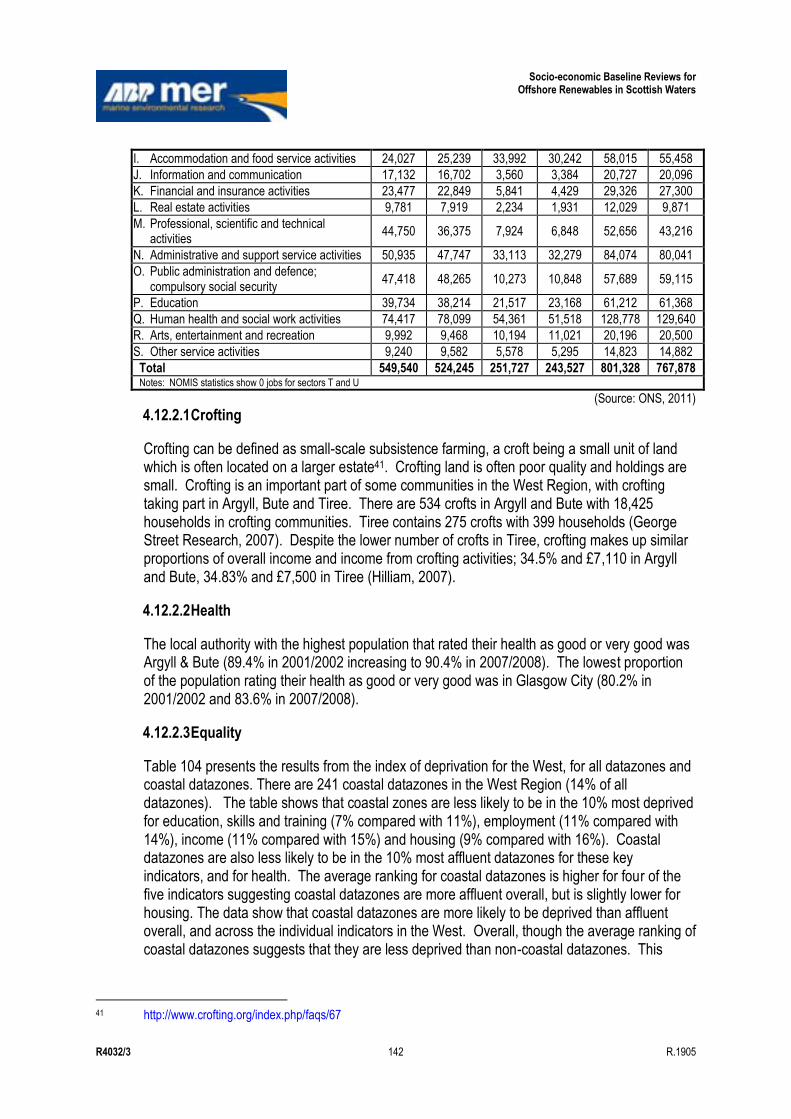
Socio-economic Baseline Reviews for Offshore Renewables in Scottish Waters
R4032/3 142 R.1905
I. Accommodation and food service activities 24,027 25,239 33,992 30,242 58,015 55,458
J. Information and communication 17,132 16,702 3,560 3,384 20,727 20,096
K. Financial and insurance activities 23,477 22,849 5,841 4,429 29,326 27,300
L. Real estate activities 9,781 7,919 2,234 1,931 12,029 9,871
M. Professional, scientific and technical activities
44,750 36,375 7,924 6,848 52,656 43,216
N. Administrative and support service activities 50,935 47,747 33,113 32,279 84,074 80,041
O. Public administration and defence; compulsory social security
47,418 48,265 10,273 10,848 57,689 59,115
P. Education 39,734 38,214 21,517 23,168 61,212 61,368
Q. Human health and social work activities 74,417 78,099 54,361 51,518 128,778 129,640
R. Arts, entertainment and recreation 9,992 9,468 10,194 11,021 20,196 20,500
S. Other service activities 9,240 9,582 5,578 5,295 14,823 14,882
Total 549,540 524,245 251,727 243,527 801,328 767,878 Notes: NOMIS statistics show 0 jobs for sectors T and U
(Source: ONS, 2011)
4.12.2.1 Crofting
Crofting can be defined as small-scale subsistence farming, a croft being a small unit of land which is often located on a larger estate41. Crofting land is often poor quality and holdings are small. Crofting is an important part of some communities in the West Region, with crofting taking part in Argyll, Bute and Tiree. There are 534 crofts in Argyll and Bute with 18,425 households in crofting communities. Tiree contains 275 crofts with 399 households (George Street Research, 2007). Despite the lower number of crofts in Tiree, crofting makes up similar proportions of overall income and income from crofting activities; 34.5% and £7,110 in Argyll and Bute, 34.83% and £7,500 in Tiree (Hilliam, 2007).
4.12.2.2 Health
The local authority with the highest population that rated their health as good or very good was Argyll & Bute (89.4% in 2001/2002 increasing to 90.4% in 2007/2008). The lowest proportion of the population rating their health as good or very good was in Glasgow City (80.2% in 2001/2002 and 83.6% in 2007/2008).
4.12.2.3 Equality
Table 104 presents the results from the index of deprivation for the West, for all datazones and coastal datazones. There are 241 coastal datazones in the West Region (14% of all datazones). The table shows that coastal zones are less likely to be in the 10% most deprived for education, skills and training (7% compared with 11%), employment (11% compared with 14%), income (11% compared with 15%) and housing (9% compared with 16%). Coastal datazones are also less likely to be in the 10% most affluent datazones for these key indicators, and for health. The average ranking for coastal datazones is higher for four of the five indicators suggesting coastal datazones are more affluent overall, but is slightly lower for housing. The data show that coastal datazones are more likely to be deprived than affluent overall, and across the individual indicators in the West. Overall, though the average ranking of coastal datazones suggests that they are less deprived than non-coastal datazones. This
41 http://www.crofting.org/index.php/faqs/67

Socio-economic Baseline Reviews for Offshore Renewables in Scottish Waters
R4032/3 143 R.1905
indicates that there are some coastal datazones that are much more deprived; investment into these datazones could have significant benefits.
Table 104. Index of deprivation for West
W All Datazones
Overall Skills, Training and Education
Employ-ment
Income Housing Health
Min (most deprived) 34 1 4 1 2 1
Max (most affluent) 6180 6503 6494 6496 6500 6486
Average 2939 3187 2952 2892 2886 2846
10% most deprived (total) 27 183 240 254 261 255
10% most deprived (as % of all) 11% 11% 14% 15% 16% 15%
10% most affluent (total) 3 200 124 130 167 131
10% most affluent (as % of all) 1% 12% 7% 8% 10% 8%
W Coastal Datazones
Overall Skills, Training and Education
Employ-ment
Income Housing Health
Min (most deprived) 34 66 8 68 54 59
Max (most affluent) 6180 6338 6480 6348 6489 6476
Average 2939 3552 3158 3200 2853 3059
10% most deprived (total) 27 17 27 26 22 37
10% most deprived (as % of all) 11% 7% 11% 11% 9% 15%
10% most affluent (total) 3 15 10 12 17 8
10% most affluent (as % of all) 1% 6% 4% 5% 7% 3%
(Source: Scottish Neighbourhood Statistics, 2011)
4.12.2.4 Skills, training and education
There are 10 local authorities allocated to the West Region. Table 109 summarises data on the percentage of the population with a degree, with no qualification and receiving job-related training. The table shows the difference between the minimum and maximum result by local authority across the region.
The range of results given in Table 105 is greatest for the percentage with a degree, with minimum of 8% in 2004 (West Dunbartonshire) increasing to 12.5% in 2010 (North Ayrshire, with West Dunbartonshire increasing to 14.1%). The maximum values are held by local authorities who do not have coastal frontages.
Table 105. Summary of education and skills in the West
West 2004 2005 2006 2007 2008 2009 2010
Percentage with a degree (minimum) 8% 9.5% 9.7% 11% 12% 12% 13%
Percentage with a degree (maximum) 28% 29% 29% 33% 32% 32% 32%
Percentage with no qualifications (minimum)
8.1% 7.4% 7.9% 8.4% 8.2% 7.4% 7.6%
Percentage with no qualifications (maximum)
22% 24% 21% 22% 20% 20% 21%
Percentage receiving job-related training (minimum)
28% 27% 27% 25% 26% 25% 23%
Percentage receiving job-related training (maximum)
36% 34% 34% 31% 35% 33% 34%
(Source: Scottish Neighbourhood Statistics, 2011)
Socio-economic Baseline Reviews for Offshore Renewables in Scottish Waters
R4032/3 144 R.1905
In terms of the population with no qualifications, the range is between 8.1% and 22% in 2004, and between 7.6% and 21% in 2010, showing very little overall change. The area with the highest proportion of the population with no qualifications is Glasgow City in both 2004 and 2010. The areas offering the greatest proportion of job-related training in 2004 were inland local authorities such as East Dunbartonshire and East Ayrshire in 2010. The area offering the lowest rates of job-related training in 2010 was Argyll & Bute.
The minimum drive time to a college of Further or Higher Education in the West Region is an average of 13.4 minutes (Argyll and Bute). This is considerably shorter than the average for the West as a whole (88 minutes) and significantly less than the maximum of 100 minutes in Glasgow City, Inverclyde, and Renfrewshire amongst other local authority areas). All of these factors affect quality of life.
4.12.2.5 Access to services
Of the 10 local authorities in the West, the highest occupancy is in an inland authority East Dunbartonshire (at 99%), whilst the lowest occupancy rate is in Argyll & Bute (84%). This local authority also has the highest vacant spaces at 5.3%.
House prices vary considerably between local authorities in the West Region. Two coastal local authorities have mean house sale prices that are greater than the national average (Argyll & Bute and South Ayrshire). Figure 80 shows the difference between the local authorities with the three highest (and lowest) mean prices and the national average. North Ayrshire has some of the lowest mean house sale prices. Prices are also lower than the national average in Renfrewshire, Inverclyde and Glasgow City. The variation in mean house prices makes it difficult to compare house prices and average earnings, although North Ayrshire was recorded as having the second lowest percentage of disposable income spent on mortgage payments in the UK in 2011 at 17.8%. Of the ten most affordable local areas in Scotland, six are in the West Region, including the coastal local authorities of North Ayrshire, Inverclyde and South Ayrshire. Only one local authority in West Region falls into the least affordable areas, and this is not on the coast (East Renfrewshire) (Bank of Scotland, 2011). For first-time buyers, the West Region is one of the areas with the lowest average age and lowest house price to earnings ratio. The lowest house price to earnings ratios in Bank of Scotland (2011a) were in North Ayrshire (2.8) and South Ayrshire and Inverclyde (2.9). Council house debt in the West Region averaged £8,054 per house in 2011, with a range from £5,880 (East Ayrshire) to £9,889 (Renfrewshire). The social sector in the West Region has failure levels of the SHQS around the national average (67% compared with the national average of 66%). Mean failure levels are higher for private sector dwellings (72% compared with the national average of 69%). Table 106 shows the mean and median drive time to different services in the West Region, and the datazones with the shortest and longest drive times, by service type. These factors give an indication of the quality of life in the West Region. The data show considerable variation across the region between the shortest and longest drive times, although both the mean and median
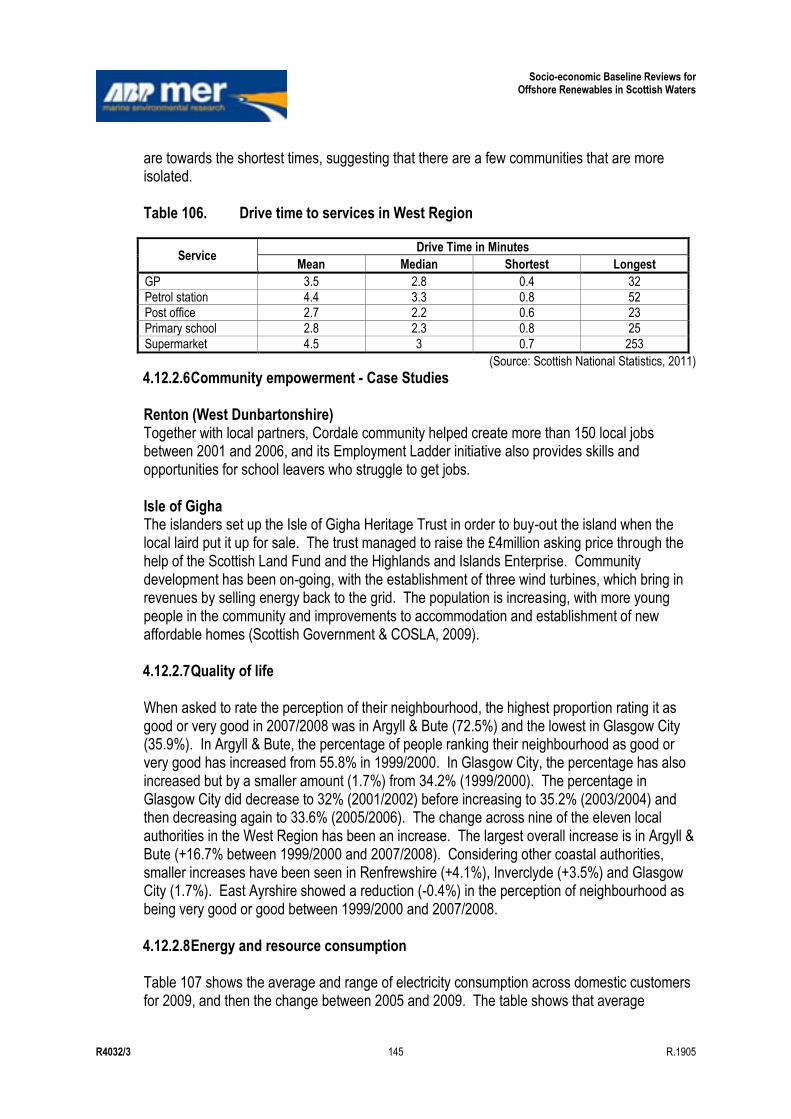
Socio-economic Baseline Reviews for Offshore Renewables in Scottish Waters
R4032/3 145 R.1905
are towards the shortest times, suggesting that there are a few communities that are more isolated. Table 106. Drive time to services in West Region
Service Drive Time in Minutes
Mean Median Shortest Longest
GP 3.5 2.8 0.4 32
Petrol station 4.4 3.3 0.8 52 Post office 2.7 2.2 0.6 23
Primary school 2.8 2.3 0.8 25
Supermarket 4.5 3 0.7 253
(Source: Scottish National Statistics, 2011)
4.12.2.6 Community empowerment - Case Studies Renton (West Dunbartonshire) Together with local partners, Cordale community helped create more than 150 local jobs between 2001 and 2006, and its Employment Ladder initiative also provides skills and opportunities for school leavers who struggle to get jobs. Isle of Gigha The islanders set up the Isle of Gigha Heritage Trust in order to buy-out the island when the local laird put it up for sale. The trust managed to raise the £4million asking price through the help of the Scottish Land Fund and the Highlands and Islands Enterprise. Community development has been on-going, with the establishment of three wind turbines, which bring in revenues by selling energy back to the grid. The population is increasing, with more young people in the community and improvements to accommodation and establishment of new affordable homes (Scottish Government & COSLA, 2009). 4.12.2.7 Quality of life When asked to rate the perception of their neighbourhood, the highest proportion rating it as good or very good in 2007/2008 was in Argyll & Bute (72.5%) and the lowest in Glasgow City (35.9%). In Argyll & Bute, the percentage of people ranking their neighbourhood as good or very good has increased from 55.8% in 1999/2000. In Glasgow City, the percentage has also increased but by a smaller amount (1.7%) from 34.2% (1999/2000). The percentage in Glasgow City did decrease to 32% (2001/2002) before increasing to 35.2% (2003/2004) and then decreasing again to 33.6% (2005/2006). The change across nine of the eleven local authorities in the West Region has been an increase. The largest overall increase is in Argyll & Bute (+16.7% between 1999/2000 and 2007/2008). Considering other coastal authorities, smaller increases have been seen in Renfrewshire (+4.1%), Inverclyde (+3.5%) and Glasgow City (1.7%). East Ayrshire showed a reduction (-0.4%) in the perception of neighbourhood as being very good or good between 1999/2000 and 2007/2008. 4.12.2.8 Energy and resource consumption Table 107 shows the average and range of electricity consumption across domestic customers for 2009, and then the change between 2005 and 2009. The table shows that average
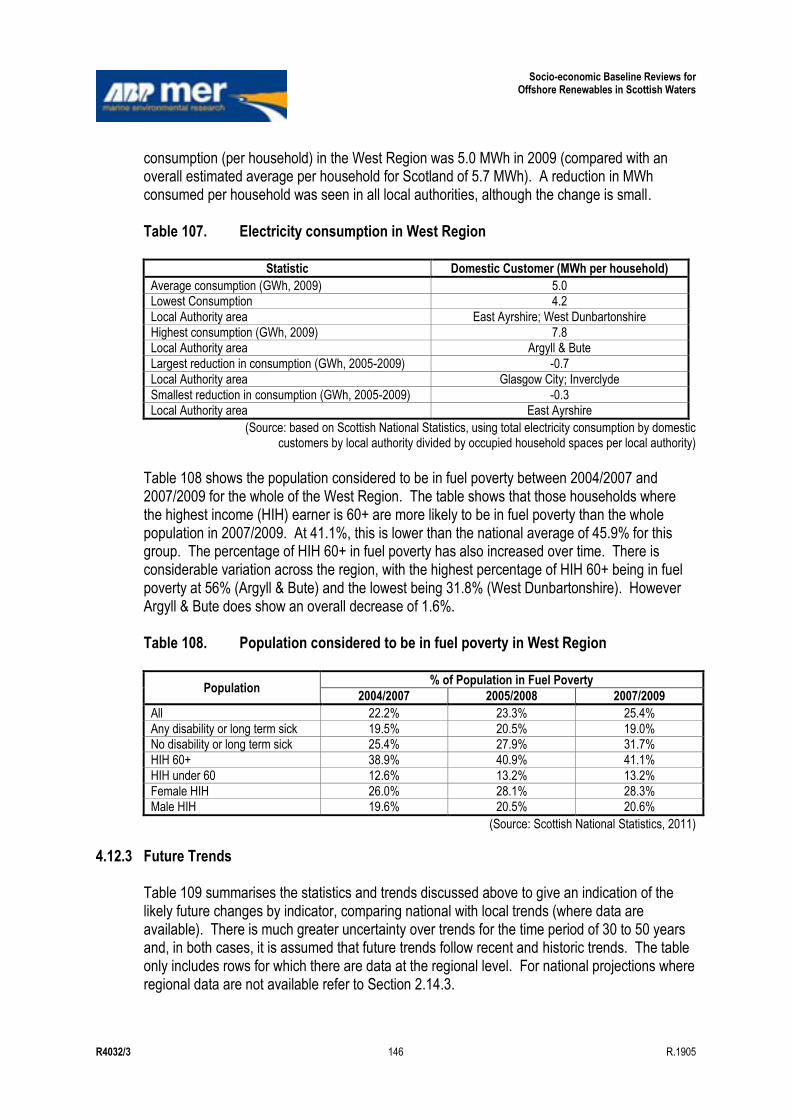
Socio-economic Baseline Reviews for Offshore Renewables in Scottish Waters
R4032/3 146 R.1905
consumption (per household) in the West Region was 5.0 MWh in 2009 (compared with an overall estimated average per household for Scotland of 5.7 MWh). A reduction in MWh consumed per household was seen in all local authorities, although the change is small. Table 107. Electricity consumption in West Region
Statistic Domestic Customer (MWh per household)
Average consumption (GWh, 2009) 5.0 Lowest Consumption 4.2
Local Authority area East Ayrshire; West Dunbartonshire
Highest consumption (GWh, 2009) 7.8 Local Authority area Argyll & Bute
Largest reduction in consumption (GWh, 2005-2009) -0.7
Local Authority area Glasgow City; Inverclyde
Smallest reduction in consumption (GWh, 2005-2009) -0.3 Local Authority area East Ayrshire
(Source: based on Scottish National Statistics, using total electricity consumption by domestic customers by local authority divided by occupied household spaces per local authority)
Table 108 shows the population considered to be in fuel poverty between 2004/2007 and 2007/2009 for the whole of the West Region. The table shows that those households where the highest income (HIH) earner is 60+ are more likely to be in fuel poverty than the whole population in 2007/2009. At 41.1%, this is lower than the national average of 45.9% for this group. The percentage of HIH 60+ in fuel poverty has also increased over time. There is considerable variation across the region, with the highest percentage of HIH 60+ being in fuel poverty at 56% (Argyll & Bute) and the lowest being 31.8% (West Dunbartonshire). However Argyll & Bute does show an overall decrease of 1.6%. Table 108. Population considered to be in fuel poverty in West Region
Population % of Population in Fuel Poverty
2004/2007 2005/2008 2007/2009
All 22.2% 23.3% 25.4%
Any disability or long term sick 19.5% 20.5% 19.0% No disability or long term sick 25.4% 27.9% 31.7%
HIH 60+ 38.9% 40.9% 41.1%
HIH under 60 12.6% 13.2% 13.2%
Female HIH 26.0% 28.1% 28.3% Male HIH 19.6% 20.5% 20.6%
(Source: Scottish National Statistics, 2011)
4.12.3 Future Trends Table 109 summarises the statistics and trends discussed above to give an indication of the likely future changes by indicator, comparing national with local trends (where data are available). There is much greater uncertainty over trends for the time period of 30 to 50 years and, in both cases, it is assumed that future trends follow recent and historic trends. The table only includes rows for which there are data at the regional level. For national projections where regional data are not available refer to Section 2.14.3.
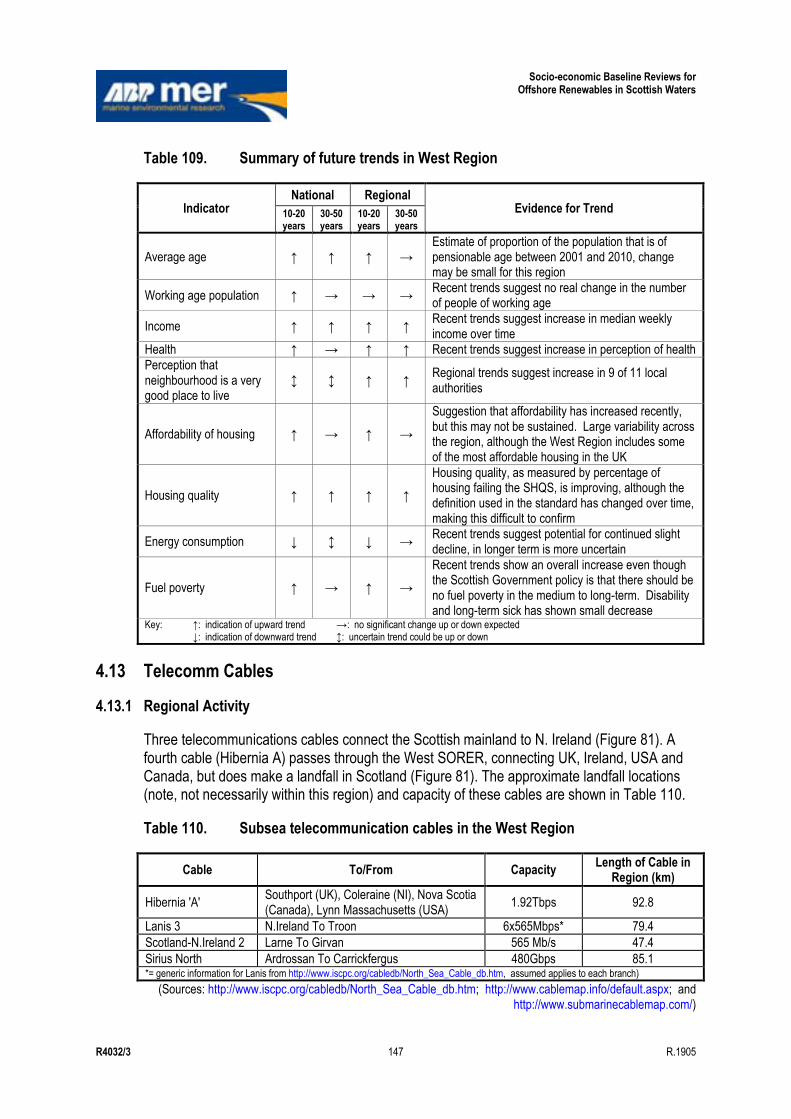
Socio-economic Baseline Reviews for Offshore Renewables in Scottish Waters
R4032/3 147 R.1905
Table 109. Summary of future trends in West Region
Indicator National Regional
Evidence for Trend 10-20 years
30-50 years
10-20 years
30-50 years
Average age ↑ ↑ ↑ → Estimate of proportion of the population that is of pensionable age between 2001 and 2010, change may be small for this region
Working age population ↑ → → → Recent trends suggest no real change in the number of people of working age
Income ↑ ↑ ↑ ↑ Recent trends suggest increase in median weekly income over time
Health ↑ → ↑ ↑ Recent trends suggest increase in perception of health
Perception that neighbourhood is a very good place to live
↕ ↕ ↑ ↑ Regional trends suggest increase in 9 of 11 local authorities
Affordability of housing ↑ → ↑ →
Suggestion that affordability has increased recently, but this may not be sustained. Large variability across the region, although the West Region includes some of the most affordable housing in the UK
Housing quality ↑ ↑ ↑ ↑
Housing quality, as measured by percentage of housing failing the SHQS, is improving, although the definition used in the standard has changed over time, making this difficult to confirm
Energy consumption ↓ ↕ ↓ → Recent trends suggest potential for continued slight decline, in longer term is more uncertain
Fuel poverty ↑ → ↑ →
Recent trends show an overall increase even though the Scottish Government policy is that there should be no fuel poverty in the medium to long-term. Disability and long-term sick has shown small decrease
Key: ↑: indication of upward trend →: no significant change up or down expected ↓: indication of downward trend ↕: uncertain trend could be up or down
4.13 Telecomm Cables
4.13.1 Regional Activity
Three telecommunications cables connect the Scottish mainland to N. Ireland (Figure 81). A fourth cable (Hibernia A) passes through the West SORER, connecting UK, Ireland, USA and Canada, but does make a landfall in Scotland (Figure 81). The approximate landfall locations (note, not necessarily within this region) and capacity of these cables are shown in Table 110.
Table 110. Subsea telecommunication cables in the West Region
Cable To/From Capacity Length of Cable in
Region (km)
Hibernia 'A' Southport (UK), Coleraine (NI), Nova Scotia (Canada), Lynn Massachusetts (USA)
1.92Tbps 92.8
Lanis 3 N.Ireland To Troon 6x565Mbps* 79.4
Scotland-N.Ireland 2 Larne To Girvan 565 Mb/s 47.4
Sirius North Ardrossan To Carrickfergus 480Gbps 85.1 *= generic information for Lanis from http://www.iscpc.org/cabledb/North_Sea_Cable_db.htm, assumed applies to each branch)
(Sources: http://www.iscpc.org/cabledb/North_Sea_Cable_db.htm; http://www.cablemap.info/default.aspx; and http://www.submarinecablemap.com/)
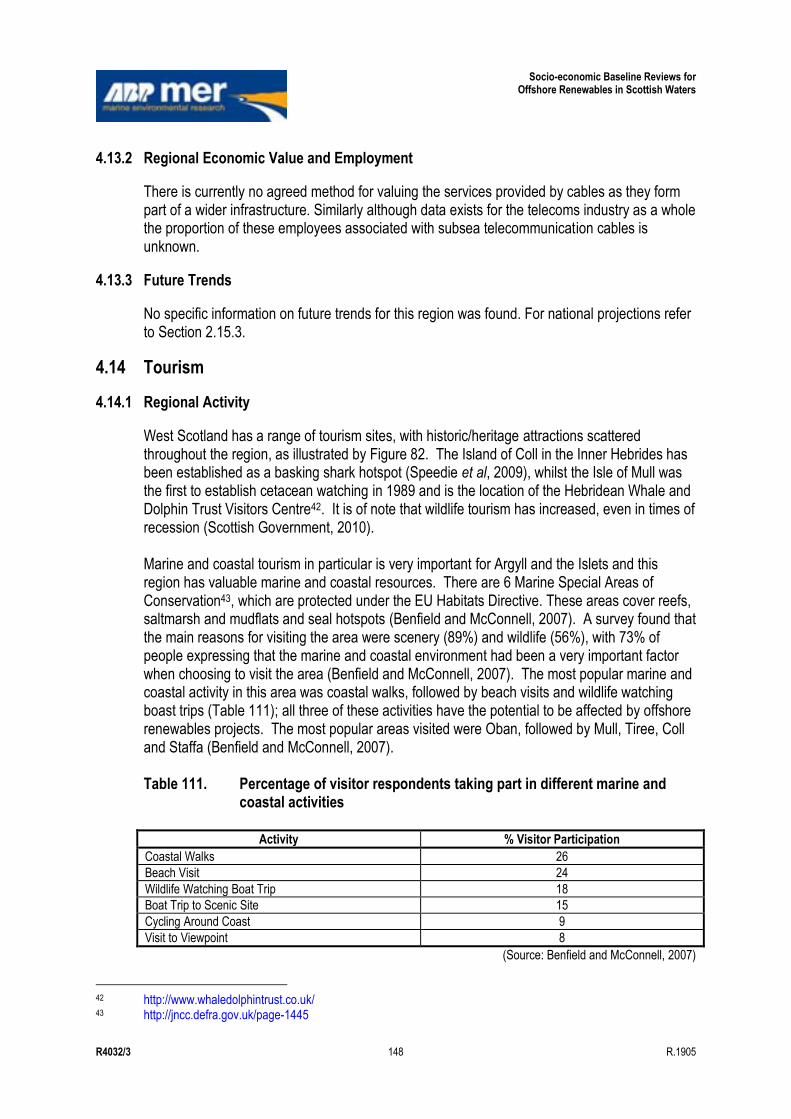
Socio-economic Baseline Reviews for Offshore Renewables in Scottish Waters
R4032/3 148 R.1905
4.13.2 Regional Economic Value and Employment
There is currently no agreed method for valuing the services provided by cables as they form part of a wider infrastructure. Similarly although data exists for the telecoms industry as a whole the proportion of these employees associated with subsea telecommunication cables is unknown.
4.13.3 Future Trends
No specific information on future trends for this region was found. For national projections refer to Section 2.15.3.
4.14 Tourism
4.14.1 Regional Activity
West Scotland has a range of tourism sites, with historic/heritage attractions scattered throughout the region, as illustrated by Figure 82. The Island of Coll in the Inner Hebrides has been established as a basking shark hotspot (Speedie et al, 2009), whilst the Isle of Mull was the first to establish cetacean watching in 1989 and is the location of the Hebridean Whale and Dolphin Trust Visitors Centre42. It is of note that wildlife tourism has increased, even in times of recession (Scottish Government, 2010). Marine and coastal tourism in particular is very important for Argyll and the Islets and this region has valuable marine and coastal resources. There are 6 Marine Special Areas of Conservation43, which are protected under the EU Habitats Directive. These areas cover reefs, saltmarsh and mudflats and seal hotspots (Benfield and McConnell, 2007). A survey found that the main reasons for visiting the area were scenery (89%) and wildlife (56%), with 73% of people expressing that the marine and coastal environment had been a very important factor when choosing to visit the area (Benfield and McConnell, 2007). The most popular marine and coastal activity in this area was coastal walks, followed by beach visits and wildlife watching boast trips (Table 111); all three of these activities have the potential to be affected by offshore renewables projects. The most popular areas visited were Oban, followed by Mull, Tiree, Coll and Staffa (Benfield and McConnell, 2007). Table 111. Percentage of visitor respondents taking part in different marine and
coastal activities
Activity % Visitor Participation
Coastal Walks 26
Beach Visit 24
Wildlife Watching Boat Trip 18
Boat Trip to Scenic Site 15
Cycling Around Coast 9
Visit to Viewpoint 8
(Source: Benfield and McConnell, 2007)
42 http://www.whaledolphintrust.co.uk/ 43 http://jncc.defra.gov.uk/page-1445

Socio-economic Baseline Reviews for Offshore Renewables in Scottish Waters
R4032/3 149 R.1905
Many tourism sites are located in coastal areas, for example, around the coastline of the Isle of Arran. There are also a considerable number of historic/heritage attractions along the coast near Oban. Indeed, Figure 83 indicates that the region has many coastal listed buildings, as well as several historic ships and locations designated under the Protection of Military Remains Act and the Protection of Wrecks Act. West Scotland also has a number of designated bathing waters along the West coast of the Firth of Clyde (see Figure 84). Other locations with this designation include Machrihanish and Ganavan Sands (both Argyll and Bute), which additionally have seaside awards. Estimates of the numbers visiting the region can be based on information from Visit Scotland. Data from VisitScotland for 2009 indicate that: UK residents made 2.13 million trips to Greater Glasgow and Clyde, staying for 6.06
million nights and spending £4689 million. For the same year, overseas visitors made approximately 0.78 million trips, stayed for 5.08 million nights and spent around £222 million;
UK residents made around 0.89 million trips, stayed 3.1 million nights and spent around £155 million in Ayrshire and Arran. In the same year, overseas visitors made approximately 0.13 million trips, stayed for 0.78 million nights and spent £46 million (VisitScotland, 2010); and
UK residents made around 1.57 million trips, stayed for 6.0 million nights and spent around £325 million in Argyll, Loch Lomond, Stirling and Forth Valley. Overseas visitors made 0.29 trips, stayed for 1.26 million nights and spent around £325 million44.
The West Region is therefore important for both UK and international tourism. Given the number of attractions along the coast, much of this tourism is likely to be related to marine and coastal areas.
4.14.2 Regional Economic Value and Employment No information on regional economic value has been identified, with the exception of the tourist expenditure information highlighted above.
For employment, Benfield and McConnell (2007) give figures of 17,902 people employed in tourism related jobs in the Argyll and Islets region, whilst 334 people had jobs specifically related to the marine and coastal sector (figures from 2001, so must be taken as indicative). Given upwards trends, these figures may now be higher.
4.14.3 Future Trends
Wildlife tourism in the Argyll and Islets region, which includes cetaceans, seals, seabirds, sea eagles and basking sharks, is considered to be growing (Benfield and McConnell, 2007). Indeed a more recent study by the Scottish Government (2010) agrees with this trend.
44 It is acknowledged that not all these areas are within the West Region, however data cannot be disaggregated
further.
Socio-economic Baseline Reviews for Offshore Renewables in Scottish Waters
R4032/3 150 R.1905
For further discussion on general trends in tourism, see Section 2.16.3 (National Overview).
4.15 Waste Disposal
4.15.1 Regional Activity
The location of open, disused and closed dredge disposal sites in this region are shown in Figure 85. The total area of seabed used for dredge spoil disposal in this region, calculated from open disposal sites, is about 4.1km² (Table 112). Table 112. Area of seabed covered by open disposal sites in the West Region
Name of Disposal Site Area of Seabed (Km²)
Campbeltown 0.157
Cloch Point 0.243
Port Ellen 0.103
Rothesay Bay 0.119
Brodick 0.382
Birch Point 0.382
Hunterston 0.381
Girvan 0.386
Ayr Bay 0.384
Garroch Head 1.528
Total 4.067
(Source: Based on Cefas data, 2011) The licensed and actual tonnage of dredge spoil disposed of at open sites in this region in 2009/10 and 2010/11 are shown in Table 113. Table 113. Licensed and actual dredge disposal tonnage at sites in the West Region
Origin of Dredge Spoil
Dredge Disposal Site
License Dates Licensed Tonnage Actual Tonnage
Ayr & Troon Ayr Bay 15/04/09-14/04/10 100000 0
Ayr and Troon Ayr Bay 14/04/10-13/04/11 100000 48110
Girvan Girvan 15/09/10-14/09/11 20000 20000
Glasgow, Greenock & Hunterston
Cloch Point 01/06/09-31/05/10 783992 0
Glasgow, Greenock & Hunterston
Cloch Point 25/01/10-31/05/10 783992 0
Glasgow, Greenock & Hunterston
Cloch Point 01/02/10-31/08/10 783992 517040
Glasgow, Greenock & Hunterston
Cloch Point 08/09/10-07/09/13 2383485 0
River Kelvin Cloch Point 06/12/11-05/12/12 18375 25667
Scotstoun, Govan & Inchgreeen
Cloch Point 22/03/10-21/03/11 99000 31628
(Source: Marine Scotland data, 2011a)
Socio-economic Baseline Reviews for Offshore Renewables in Scottish Waters
R4032/3 151 R.1905
4.15.2 Regional Economic Value and Employment
It is not possible to calculate the GVA associated with dredge spoil disposal (Baxter et al, 2011).
4.15.3 Future Trends
The Scottish National Planning Framework 2 (Scottish Government, 2009b) identified future port developments, which may require dredging, including at Hunterston, where there is the capacity to develop a deepwater container transhipment hub and maritime construction and decommissioning yard. In addition, the NRIP identified several locations in this region which could potentially support the offshore wind and wave and tidal industries: Hunterston, Campbeltown, Inverclyde, Ayr and Troon. Of these sites, Hunterston, and Campbeltown/Machrihanish are „first phase‟ sites identified for development in the immediate future to support the offshore wind industry. At Hunterston, the formation of a marine/renewables site would involve the construction of a new deep water quay. Campbeltown Harbour, which could be used for both assembly and operations and maintenance of offshore wind turbines, is undergoing improvements including the construction of a new deep water quay/new open piled pier, requiring increasing the dredge level from 5 to 9m, due for completion in December 2011 (Scottish Enterprise and Highlands and Islands Enterprise, 2010b).
4.16 Water Sports
4.16.1 Regional Activity
4.16.1.1 Surfing and windsurfing
The West coast of Scotland and the Hebrides are exposed to swell waves generated in the Atlantic Ocean and offer a range of West to North facing beach and reef breaks along the coasts of the Mull of Kintyre, Isles of Islay and Tiree (SAS, 2009). Some of these spots are considered to be of very high quality, although the remoteness of the locations means that they are uncrowded most of the time (SAS, 2009). A large number of windsurfing locations are also present in this region. The SAS (2009) report maps 17 surfing locations on Tiree, Islay and Kintyre and the Windsurf magazine „beach guide‟ maps 21 locations along the Ayrshire coast and on Tiree, Islay and Kintyre. These locations are listed in Table 114 and Figure 86. Table 114. Surfing and windsurfing locations in the West Region
West Coast Location Surf Location Windsurf Locations
Ayrshire coast
Girvan
Turnberry
Maidens
Prestwick
Troon beach (North and South)
Ardrossan
Helensburgh
Largs
Sailcoats
Socio-economic Baseline Reviews for Offshore Renewables in Scottish Waters
R4032/3 152 R.1905
West Coast Location Surf Location Windsurf Locations
Tiree
Balephetrish Crossapol
Balevullin Bay Gott Bay
The Hough Balevullin Bay
The Maze The Maze
Port Bharrapol The Green
Balephuil The loch
Islay
Ardnave Bay Loch Indaal
Saligo Bay Tragh baile aonghais
Machir Bay Machir Bay
Laggan Bay Laggan Bay
Lossit Bay
Kintyre
Caravans Southend
Macrihanish Macrihanish
Middle Beach
Westport
Graveyards
Dunaverty
(Source: Based on SAS, 2009 and the Windsurf Magazine „beach guide‟ 2011) 4.16.1.2 Angling The SSACN‟s Offshore Wind SEA consultation response stated that Loch Etive and Sunart and Clyde are regions that are used extensively for sea angling. Although the Firth of Clyde has relatively poor fish stocks and is not capable of supporting regular sea angling charter activity, the local population size means there are reasonable numbers of local shore anglers who rely heavily on seasonal fish stocks such as mackerel. Own boat and charter boat angling is popular at other locations on the West coast of Scotland where there are a number of excellent sheltered lochs enabling safe comfortable fishing (Radford et al, 2009). 4.16.1.3 Scuba diving The West Region is a popular scuba diving area. Dive spots are widespread through this region with a particularly high numbers of sites through the Firth of Clyde, Sound of Mull and Loch Linnhe (Table 115), see Figure 87. Table 115. The number of dive centres, charter boats and diving clubs found in the
West Region
Facilities Number
Dive Centres 12
Charter Boats 9
ScotSAC Branches 21
BSAC Branches 9
(Source: BSAC: http://www.bsac.com/; ScotSAC: http://www.scotsac.com; and http://finstrokes.com)
Socio-economic Baseline Reviews for Offshore Renewables in Scottish Waters
R4032/3 153 R.1905
4.16.1.4 Small sail boat activities and sea kayaking. Dinghy sailing is a popular activity in the sheltered lochs and bays of the West Region with a high density of coastal dinghy sailing clubs found in the Firth of Clyde and Clyde River (Figure 88). Sea kayaking in undertaken throughout the West Region with popular locations including the Firth of Lorn, Gulf of Corryvreckan, Sound of Jura and upper Firth of Clyde (Land Use Consultants, 2007) (Figure 89).
4.16.2 Regional Economic Value and Employment Economic data was only available for windsurfing and recreational angling within this region. 4.16.2.1 Windsurfing Tiree has a niche in outdoor activities. The Scottish Government‟s analysis of the responses to its Offshore Wind Draft Plan and SEA stated that 60 to 70% of the islands tourism is based on water sports such as surfing and kite surfing. In particular the island is a very important area for windsurfing. The UK‟s national windsurfing championship, the Tiree International Wave Classic, which is held annually in October, is of significance both for the sport and the local economy (UKMMAS, 2010). 4.16.2.2 Angling Radford et al (2009) estimated the sea angling activity and economic value in eight regions of Scotland. Two of these regions, Argyll and Lochaber and Glasgow and West, fall roughly within the West Region, but also incorporates the Southern part of the North West Region, hence the values may result in a slight overestimate of economic contribution. The total estimated regional sea angling activity and expenditure within these two regions is shown in Table 116. Compared to other regions in the Radford et al (2009) study, Glasgow and the West had the greatest number of adult resident sea anglers (23,548) and the greatest number of angler days (269,783). Table 116. Estimated regional sea angling activity and expenditure in West Region
Region No.
Resident Sea Anglers
Annual Sea Angler Days
Spent in Region
% of total Activity
Undertaken on the Shore
Total Annual Sea Angler
Expenditure (£M)
% of total Expenditure
Spent on Shore Angling
Number of Jobs
Supported
Argyll and Lochaber 5825 252615 47% 22.6 40% 524
Glasgow and West 23548 269783 38% 24.1 36% 523
(Source: Radford et al, 2009) The Firth of Lorne and the Sound of Mull has become the centre for common skate angling contributing over £15 million per year to the local economy. Lochs Sunart and Etive attract vast numbers of shore and boat anglers seeking spurdog, and this fishery is estimated to be worth £15 million per year (Scottish Sea Angling Conservation Network, 2008). The SSACN hold a spurdog tagging event in this area and estimate that the event held in November 2010 was worth £28,000 to the local economy (Scottish Sea Angling Conservation Network, 2010b).

Socio-economic Baseline Reviews for Offshore Renewables in Scottish Waters
R4032/3 154 R.1905
As previously mentioned it is not possible to obtain employment figures for numbers directly involved in water sports or associated activities.
4.16.3 Future Trends No regional detail on future trends were available, please refer to Section 2.18.3 for national projections.
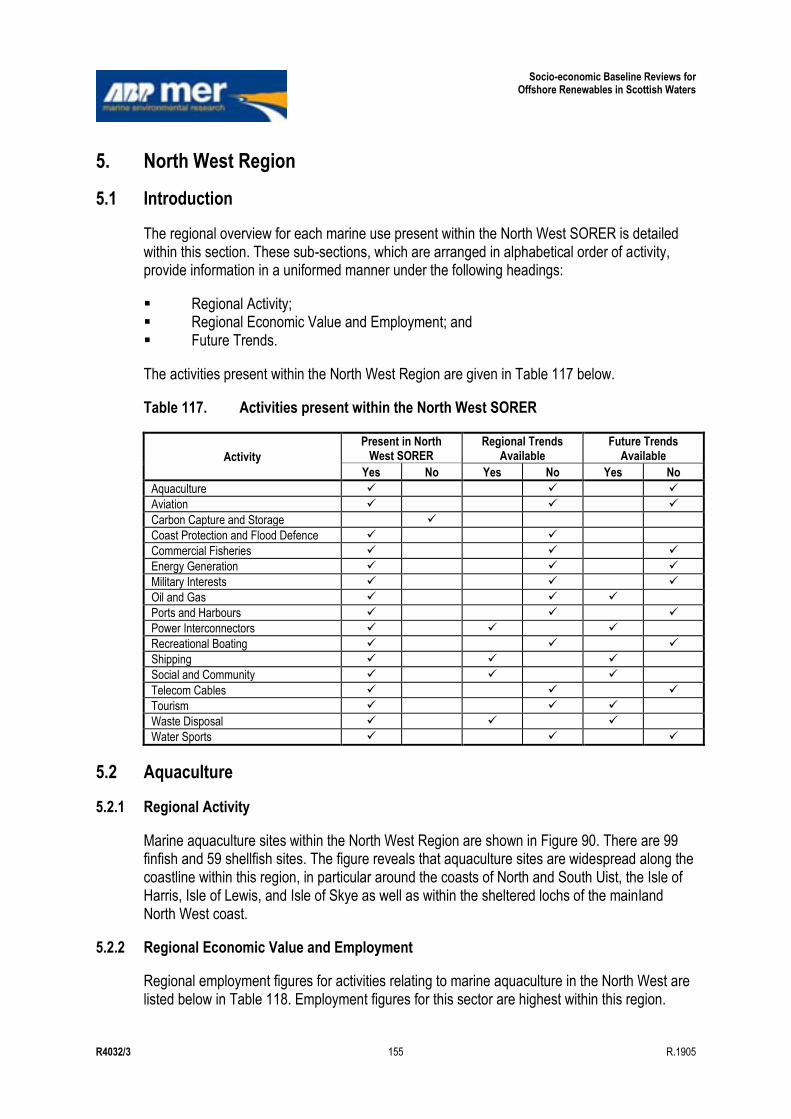
Socio-economic Baseline Reviews for Offshore Renewables in Scottish Waters
R4032/3 155 R.1905
5. North West Region
5.1 Introduction
The regional overview for each marine use present within the North West SORER is detailed within this section. These sub-sections, which are arranged in alphabetical order of activity, provide information in a uniformed manner under the following headings:
Regional Activity; Regional Economic Value and Employment; and Future Trends.
The activities present within the North West Region are given in Table 117 below.
Table 117. Activities present within the North West SORER
Activity
Present in North West SORER
Regional Trends Available
Future Trends Available
Yes No Yes No Yes No
Aquaculture
Aviation
Carbon Capture and Storage
Coast Protection and Flood Defence
Commercial Fisheries
Energy Generation
Military Interests
Oil and Gas
Ports and Harbours
Power Interconnectors
Recreational Boating
Shipping
Social and Community
Telecom Cables
Tourism
Waste Disposal
Water Sports
5.2 Aquaculture
5.2.1 Regional Activity
Marine aquaculture sites within the North West Region are shown in Figure 90. There are 99 finfish and 59 shellfish sites. The figure reveals that aquaculture sites are widespread along the coastline within this region, in particular around the coasts of North and South Uist, the Isle of Harris, Isle of Lewis, and Isle of Skye as well as within the sheltered lochs of the mainland North West coast.
5.2.2 Regional Economic Value and Employment
Regional employment figures for activities relating to marine aquaculture in the North West are listed below in Table 118. Employment figures for this sector are highest within this region.
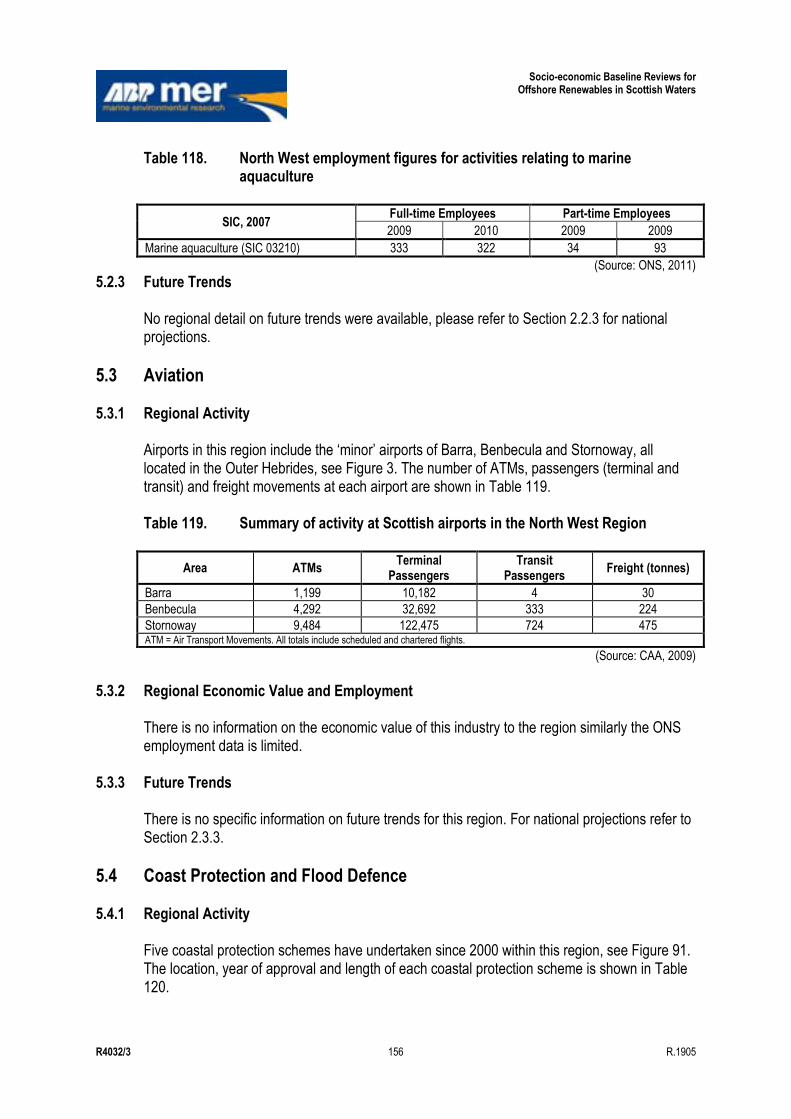
Socio-economic Baseline Reviews for Offshore Renewables in Scottish Waters
R4032/3 156 R.1905
Table 118. North West employment figures for activities relating to marine aquaculture
SIC, 2007 Full-time Employees Part-time Employees
2009 2010 2009 2009
Marine aquaculture (SIC 03210) 333 322 34 93
(Source: ONS, 2011)
5.2.3 Future Trends No regional detail on future trends were available, please refer to Section 2.2.3 for national projections.
5.3 Aviation
5.3.1 Regional Activity Airports in this region include the „minor‟ airports of Barra, Benbecula and Stornoway, all located in the Outer Hebrides, see Figure 3. The number of ATMs, passengers (terminal and transit) and freight movements at each airport are shown in Table 119. Table 119. Summary of activity at Scottish airports in the North West Region
Area ATMs Terminal
Passengers Transit
Passengers Freight (tonnes)
Barra 1,199 10,182 4 30
Benbecula 4,292 32,692 333 224
Stornoway 9,484 122,475 724 475 ATM = Air Transport Movements. All totals include scheduled and chartered flights.
(Source: CAA, 2009)
5.3.2 Regional Economic Value and Employment
There is no information on the economic value of this industry to the region similarly the ONS employment data is limited.
5.3.3 Future Trends There is no specific information on future trends for this region. For national projections refer to Section 2.3.3.
5.4 Coast Protection and Flood Defence
5.4.1 Regional Activity Five coastal protection schemes have undertaken since 2000 within this region, see Figure 91. The location, year of approval and length of each coastal protection scheme is shown in Table 120.
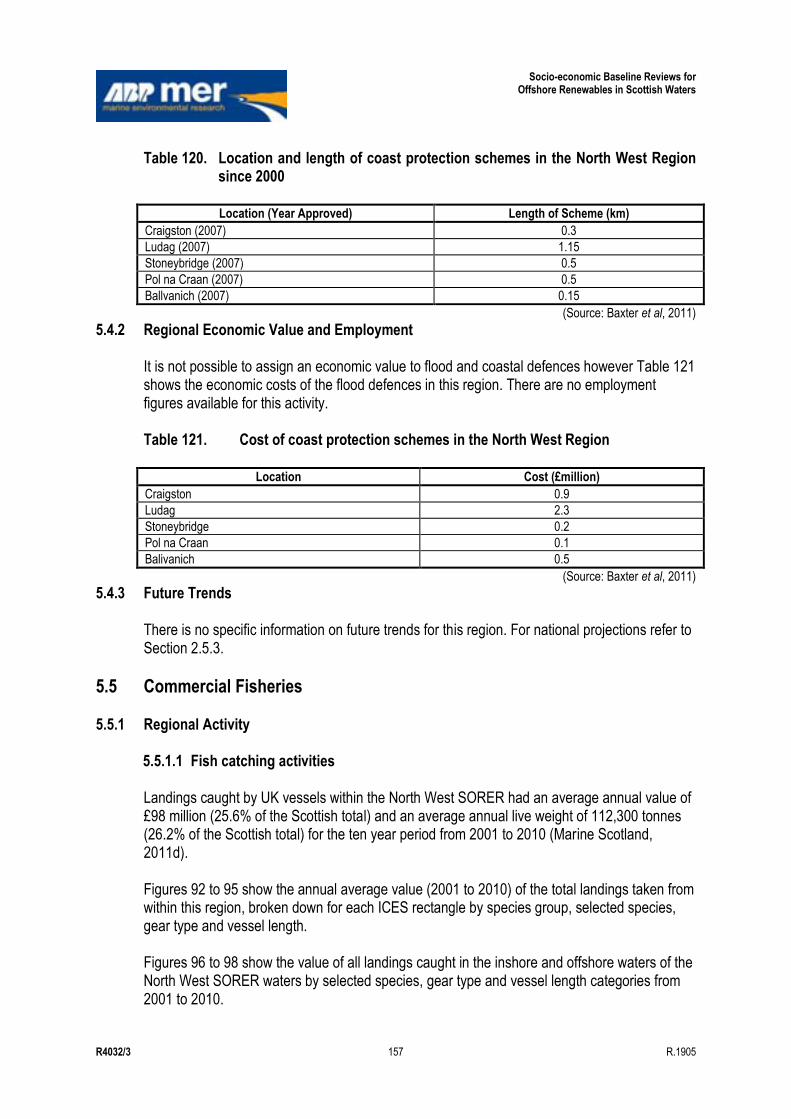
Socio-economic Baseline Reviews for Offshore Renewables in Scottish Waters
R4032/3 157 R.1905
Table 120. Location and length of coast protection schemes in the North West Region since 2000
Location (Year Approved) Length of Scheme (km)
Craigston (2007) 0.3
Ludag (2007) 1.15
Stoneybridge (2007) 0.5
Pol na Craan (2007) 0.5
Ballvanich (2007) 0.15
(Source: Baxter et al, 2011) 5.4.2 Regional Economic Value and Employment
It is not possible to assign an economic value to flood and coastal defences however Table 121 shows the economic costs of the flood defences in this region. There are no employment figures available for this activity. Table 121. Cost of coast protection schemes in the North West Region
Location Cost (£million)
Craigston 0.9
Ludag 2.3
Stoneybridge 0.2
Pol na Craan 0.1
Balivanich 0.5
(Source: Baxter et al, 2011) 5.4.3 Future Trends
There is no specific information on future trends for this region. For national projections refer to Section 2.5.3.
5.5 Commercial Fisheries
5.5.1 Regional Activity 5.5.1.1 Fish catching activities Landings caught by UK vessels within the North West SORER had an average annual value of £98 million (25.6% of the Scottish total) and an average annual live weight of 112,300 tonnes (26.2% of the Scottish total) for the ten year period from 2001 to 2010 (Marine Scotland, 2011d). Figures 92 to 95 show the annual average value (2001 to 2010) of the total landings taken from within this region, broken down for each ICES rectangle by species group, selected species, gear type and vessel length. Figures 96 to 98 show the value of all landings caught in the inshore and offshore waters of the North West SORER waters by selected species, gear type and vessel length categories from 2001 to 2010.
Socio-economic Baseline Reviews for Offshore Renewables in Scottish Waters
R4032/3 158 R.1905
The majority of the value and volume of landings from within the South and West of the North West SORER are shellfish, whereas in the North of this SORER the majority are demersal species. There is a marked difference between the main species caught in inshore waters (within 12 nm from the coast) and offshore waters (greater than 12 nm from the coast). In 2010, Nephrops accounted for 69% of the total catch value from inshore waters, while scallops and „other shellfish‟ accounted for 11% and 15% of the total catch value, respectively. Offshore, landings of mackerel accounted for 36% of the total catch value and 54% were whitefish. In 2010, 33% of the value of landings from inshore waters was taken by vessels 10m and under in length, 27% of the value was landed by vessels over 10m and less than 15m and 40% of the value was landed by vessels 15m and over. Offshore, 82% of the value of landings was taken by vessels 15m and over in length. For inshore waters, 45% of the total catch value was caught by pots and 36% by Nephrops trawls; whereas for offshore waters, 43% was caught by demersal trawls and 41% by pelagic trawls. Figures 99 and 100 show the overflight (surveillance) sightings by vessel type and nationality in the region from 2006 to 2010. There is a clear pattern of both nationality and distribution shown within the North West Region, which has 20% of national fishing effort. The French and Spanish vessels account for 32% of all vessels sighted. The majority of vessels fishing within the 12NM limit are British however a cluster of British, Spanish, Irish, Dutch and German vessels are found around the waters of Rockall. 94% of fishing is conducted by demersal, pelagic and other trawlers. The main administrative fishing ports in this region are Mallaig, Portree, Ullapool, Lochinver and Stornoway (Kinlochbervie is included within the boundary of North East SORER, although it is actually located on the North West coast of Scotland) and there are also 30 smaller ports throughout the region. All the ports are shown in Figure 101. 5.5.1.2 Fish processing activities Fish processing facilities in the North West SORER are few and mostly on a small scale. Prawn and shellfish factories are operated in the Western Isles, and in Mallaig. White fish primary processing takes place in Stornoway, Kinlochbervie, Lochinver and Mallaig. There are no fish processing facilities at Ullapool. Young‟s Seafood in Stornoway is one of the larger fish processing units in this region, producing breaded scampi from Nephrops sourced off the West coast of Scotland. 5.5.1.3 Wild salmon and sea trout There are two fixed engines netting sites on the Isle of Skye and one net and coble netting site on the Isle of Lewis in the North West SORER (see Figure 101).
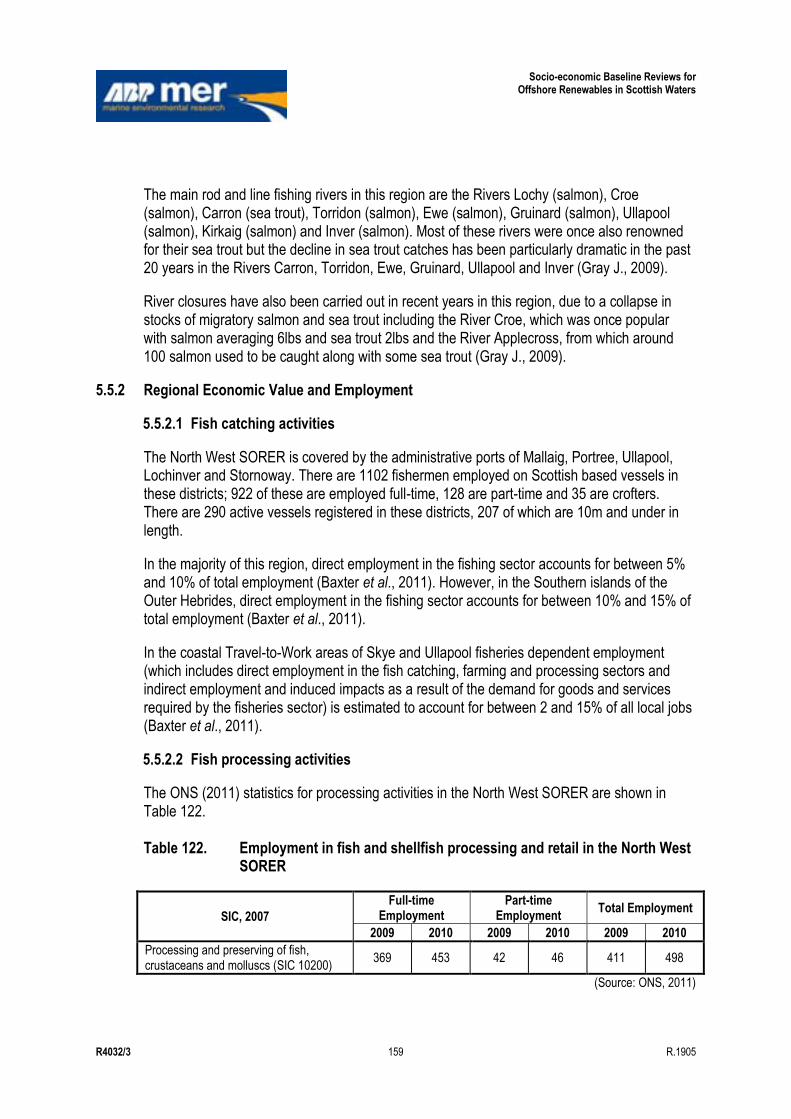
Socio-economic Baseline Reviews for Offshore Renewables in Scottish Waters
R4032/3 159 R.1905
The main rod and line fishing rivers in this region are the Rivers Lochy (salmon), Croe (salmon), Carron (sea trout), Torridon (salmon), Ewe (salmon), Gruinard (salmon), Ullapool (salmon), Kirkaig (salmon) and Inver (salmon). Most of these rivers were once also renowned for their sea trout but the decline in sea trout catches has been particularly dramatic in the past 20 years in the Rivers Carron, Torridon, Ewe, Gruinard, Ullapool and Inver (Gray J., 2009).
River closures have also been carried out in recent years in this region, due to a collapse in stocks of migratory salmon and sea trout including the River Croe, which was once popular with salmon averaging 6lbs and sea trout 2lbs and the River Applecross, from which around 100 salmon used to be caught along with some sea trout (Gray J., 2009).
5.5.2 Regional Economic Value and Employment
5.5.2.1 Fish catching activities
The North West SORER is covered by the administrative ports of Mallaig, Portree, Ullapool, Lochinver and Stornoway. There are 1102 fishermen employed on Scottish based vessels in these districts; 922 of these are employed full-time, 128 are part-time and 35 are crofters. There are 290 active vessels registered in these districts, 207 of which are 10m and under in length.
In the majority of this region, direct employment in the fishing sector accounts for between 5% and 10% of total employment (Baxter et al., 2011). However, in the Southern islands of the Outer Hebrides, direct employment in the fishing sector accounts for between 10% and 15% of total employment (Baxter et al., 2011).
In the coastal Travel-to-Work areas of Skye and Ullapool fisheries dependent employment (which includes direct employment in the fish catching, farming and processing sectors and indirect employment and induced impacts as a result of the demand for goods and services required by the fisheries sector) is estimated to account for between 2 and 15% of all local jobs (Baxter et al., 2011).
5.5.2.2 Fish processing activities
The ONS (2011) statistics for processing activities in the North West SORER are shown in Table 122. Table 122. Employment in fish and shellfish processing and retail in the North West
SORER
SIC, 2007
Full-time Employment
Part-time Employment
Total Employment
2009 2010 2009 2010 2009 2010
Processing and preserving of fish, crustaceans and molluscs (SIC 10200)
369 453 42 46 411 498
(Source: ONS, 2011)

Socio-economic Baseline Reviews for Offshore Renewables in Scottish Waters
R4032/3 160 R.1905
5.5.2.3 Wild salmon and sea trout There is no specific information on economic value and employment for this region. For a national overview refer to Section 2.6.3.
5.5.3 Future Trends There is no specific information on future trends for this region. For national projections refer to Section 2.6.3.
5.6 Energy Generation
5.6.1 Regional Activity There is no specific information on the activity for this region. The North West does not host any major power stations, and it is not possible to identify the power stations from which the region obtains its electricity45. However, this does not mean that there is no local generation; it is probable that small scale generation occurs in more isolated areas. Indeed, this is likely given that parts of the Western Isles suffer electricity cuts due to their location at the end of a weak electrical grid (Robertson, 2009). Note that investigations have been carried out in relation to improving grid connections for the Scottish Islands (see Highland and Islands Enterprise, 2007).
5.6.2 Regional Economic Value and Employment Information on regional economic value for energy generation is not available. Data availability on electricity generation and supply is very limited due to security issues. Direct employment in the electricity sector in the North West Region can be estimated through looking at statistics from the ONS (2011) and Employment Survey. Figures for 2009 and 2010 for full and part time work under several relevant codes are given in Table 123. Although there are no jobs in transmission or trade of electricity, or construction of utility projects for electricity and communications, both production and distribution of electricity are represented. Although as noted above, there are no major power stations in the region, such electricity generation jobs are probably being provided by small scale schemes. It is also likely that there will be some jobs supported by the wider energy sector. For example, there may be work related to engineering activities and related technical consultancy. In the future, it is probable that the number of jobs directly supported by the electricity sector, as well as those in the wider energy generation sector may increase, since there is the potential for wave and tidal generation in the region (see Figure 102).
45 Note that such information is generally not given out by power companies for security reasons.

Socio-economic Baseline Reviews for Offshore Renewables in Scottish Waters
R4032/3 161 R.1905
Table 123. Employment in the electricity sector in North West by SIC Code
SIC Code, 2007 Full-time Part-time Totals
2009 2010 2009 2010 2009 2010
Production of electricity (3511) 14 32 0 2 14 34
Transmission of electricity (3512) 0 0 0 0 0 0
Distribution of electricity (3513) 35 45 8 7 43 52
Trade of electricity (3514) 0 0 0 0 0 0
Construction of utility projects for electricity and telecommunications (4222)
0 0 0 0 0 0
Electrical installation (4321) 112 82 6 4 118 86
Totals (note that totals may not sum exactly due to rounding)
161 159 14 13 175 172
(Source: ONS, 2011)
5.6.3 Future Trends
There is no specific information on future trends for this region. For national projections refer to Section 2.7.3
5.7 Military Interests
5.7.1 Regional Activity The coastal military locations which occur within this region are shown in Figure 103. Military interests in this region include: Loch Carron Port; Inner Sound of Raasay official weapon test site including the British Underwater Test
and Evaluation Centre (BUTEC) range, the official range for the testing and certification of the Royal Navy‟s underwater weapons;
Benbecula Firing Range; Loch Ewe Fuel Jetty; A Royal Navy SXA, which occurs within inshore waters and extends offshore in the
South West of the Region; and The Hebrides Official weapon test site, a large sea area West-North-West of North
Uist, Benbecula and South Uist, which is the current official test site for missiles and artillery systems.
5.7.2 Regional Economic Value and Employment
The MOD Quarterly Manning Report (Defence Personnel by location) issued in August 2011, provides the number of MOD personnel (civilian and military) employed in each LA area at 1 July 2011 (MOD, 2011a). Two of these LAs fall entirely or partially within the North West Region and the number of MOD personnel which are employed within each of these LA areas is shown in Table 124. However, as the LA areas do not align with the SORER boundaries, the values should only be taken as indicative values for comparison between areas.

Socio-economic Baseline Reviews for Offshore Renewables in Scottish Waters
R4032/3 162 R.1905
Table 124. MOD personnel by local authority areas which lie within the North West
Region
Local Authority (LA) Area
SORER* MOD Total Civilian Military
Highland NE & NW, N 680 600 80
Eilean Siar NW 10 10 0 * Note LAs may occur within more than one SORER. Where this is the case, the SORER containing the largest proportion of the LA
(visually assessed) is listed first, and subsequent SORERs contain decreasing proportions of the LA; „&‟ indicates that the LA appears to occupy roughly equal proportions of more than one SORERs.
(Source: MOD, 2011a) 5.7.3 Future Trends
There is no specific information on future trends for this region. For national projections refer to Section 2.8.3.
5.8 Oil and Gas
5.8.1 Regional Activity The Oil and Gas related infrastructure in this region comprises of a significant discovery not yet developed and a licensed area, both to the North West of the Outer Hebrides. There are no producing hydrocarbon fields or hydrocarbon fields under development in this region (Figure 104).
5.8.2 Regional Economic Value and Employment Given that there are no oil or gas producing hydrocarbon fields in this region, it is not possible to estimate the economic value of Oil and Gas activity in this region, nor is it possible to provide figures for employment.
5.8.3 Future Trends Although there has been a significant discovery with this SORER there are no current plans to develop the field and therefore no trends can be predicted, beyond the fact that in time there will be opportunities for revenue, employment and supply chain activities. For national projections refer to Section 2.9.3.
5.9 Port and Harbours
5.9.1 Regional Activity There are no major ports located within this region. There are 45 ports and harbours (see Figure 105 and Table 125) which are predominantly smaller jetties, piers and hard standing areas used by local communities as a base for fishing vessels, inter-island transport and recreational facilities. A number of larger ports are located within this region, these include
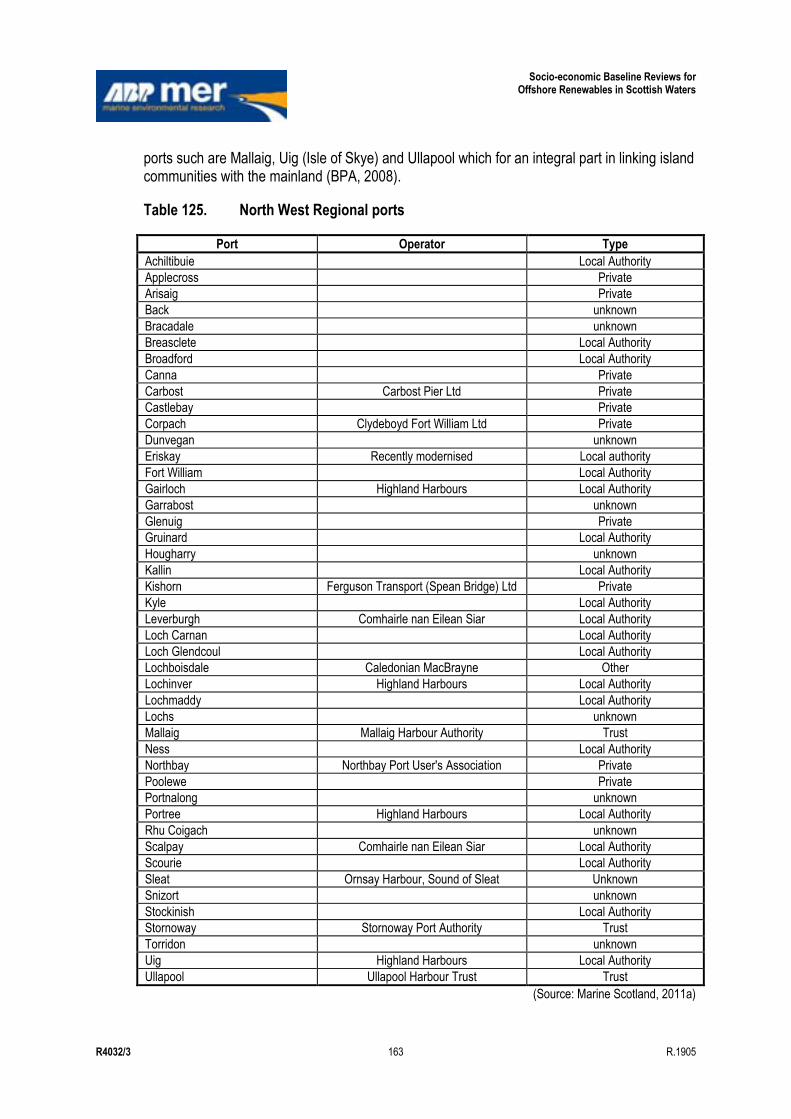
Socio-economic Baseline Reviews for Offshore Renewables in Scottish Waters
R4032/3 163 R.1905
ports such are Mallaig, Uig (Isle of Skye) and Ullapool which for an integral part in linking island communities with the mainland (BPA, 2008).
Table 125. North West Regional ports
Port Operator Type
Achiltibuie Local Authority
Applecross Private
Arisaig Private
Back unknown
Bracadale unknown
Breasclete Local Authority
Broadford Local Authority
Canna Private
Carbost Carbost Pier Ltd Private
Castlebay Private
Corpach Clydeboyd Fort William Ltd Private
Dunvegan unknown
Eriskay Recently modernised Local authority
Fort William Local Authority
Gairloch Highland Harbours Local Authority
Garrabost unknown
Glenuig Private
Gruinard Local Authority
Hougharry unknown
Kallin Local Authority
Kishorn Ferguson Transport (Spean Bridge) Ltd Private
Kyle Local Authority
Leverburgh Comhairle nan Eilean Siar Local Authority
Loch Carnan Local Authority
Loch Glendcoul Local Authority
Lochboisdale Caledonian MacBrayne Other
Lochinver Highland Harbours Local Authority
Lochmaddy Local Authority
Lochs unknown
Mallaig Mallaig Harbour Authority Trust
Ness Local Authority
Northbay Northbay Port User's Association Private
Poolewe Private
Portnalong unknown
Portree Highland Harbours Local Authority
Rhu Coigach unknown
Scalpay Comhairle nan Eilean Siar Local Authority
Scourie Local Authority
Sleat Ornsay Harbour, Sound of Sleat Unknown
Snizort unknown
Stockinish Local Authority
Stornoway Stornoway Port Authority Trust
Torridon unknown
Uig Highland Harbours Local Authority
Ullapool Ullapool Harbour Trust Trust
(Source: Marine Scotland, 2011a)
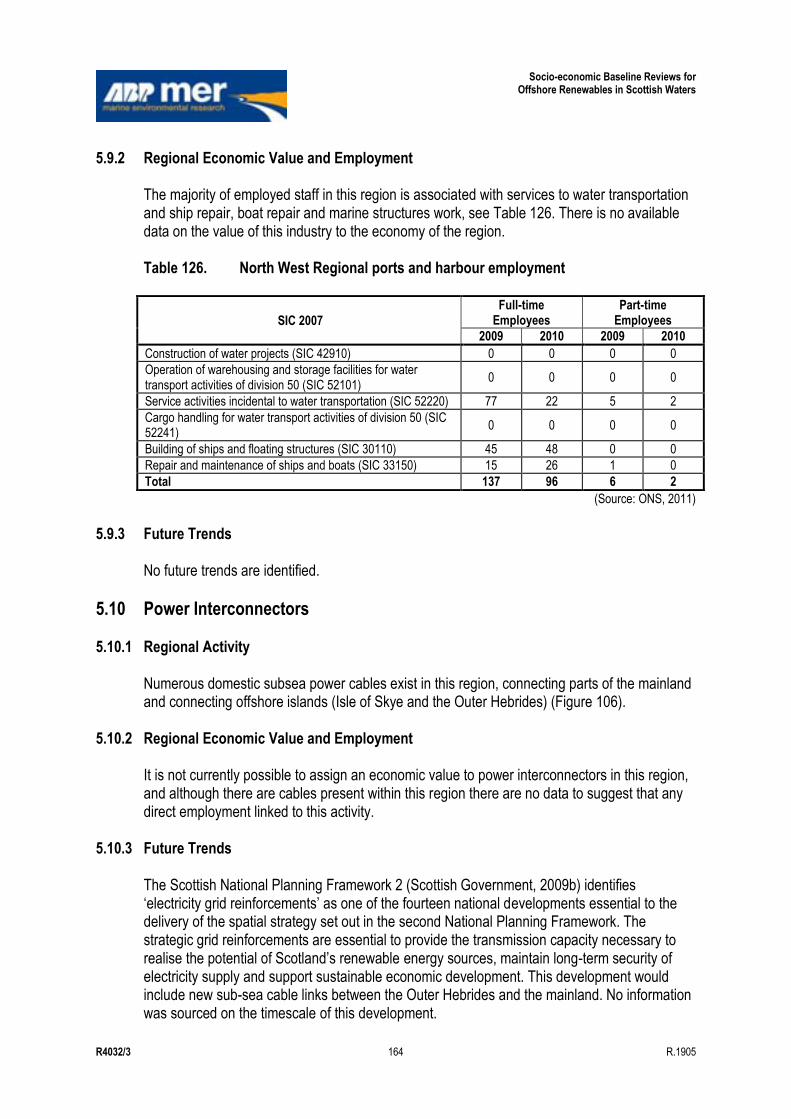
Socio-economic Baseline Reviews for Offshore Renewables in Scottish Waters
R4032/3 164 R.1905
5.9.2 Regional Economic Value and Employment The majority of employed staff in this region is associated with services to water transportation and ship repair, boat repair and marine structures work, see Table 126. There is no available data on the value of this industry to the economy of the region. Table 126. North West Regional ports and harbour employment
SIC 2007
Full-time Employees
Part-time Employees
2009 2010 2009 2010
Construction of water projects (SIC 42910) 0 0 0 0
Operation of warehousing and storage facilities for water transport activities of division 50 (SIC 52101)
0 0 0 0
Service activities incidental to water transportation (SIC 52220) 77 22 5 2
Cargo handling for water transport activities of division 50 (SIC 52241)
0 0 0 0
Building of ships and floating structures (SIC 30110) 45 48 0 0
Repair and maintenance of ships and boats (SIC 33150) 15 26 1 0
Total 137 96 6 2
(Source: ONS, 2011)
5.9.3 Future Trends
No future trends are identified.
5.10 Power Interconnectors
5.10.1 Regional Activity Numerous domestic subsea power cables exist in this region, connecting parts of the mainland and connecting offshore islands (Isle of Skye and the Outer Hebrides) (Figure 106).
5.10.2 Regional Economic Value and Employment It is not currently possible to assign an economic value to power interconnectors in this region, and although there are cables present within this region there are no data to suggest that any direct employment linked to this activity.
5.10.3 Future Trends The Scottish National Planning Framework 2 (Scottish Government, 2009b) identifies „electricity grid reinforcements‟ as one of the fourteen national developments essential to the delivery of the spatial strategy set out in the second National Planning Framework. The strategic grid reinforcements are essential to provide the transmission capacity necessary to realise the potential of Scotland‟s renewable energy sources, maintain long-term security of electricity supply and support sustainable economic development. This development would include new sub-sea cable links between the Outer Hebrides and the mainland. No information was sourced on the timescale of this development.
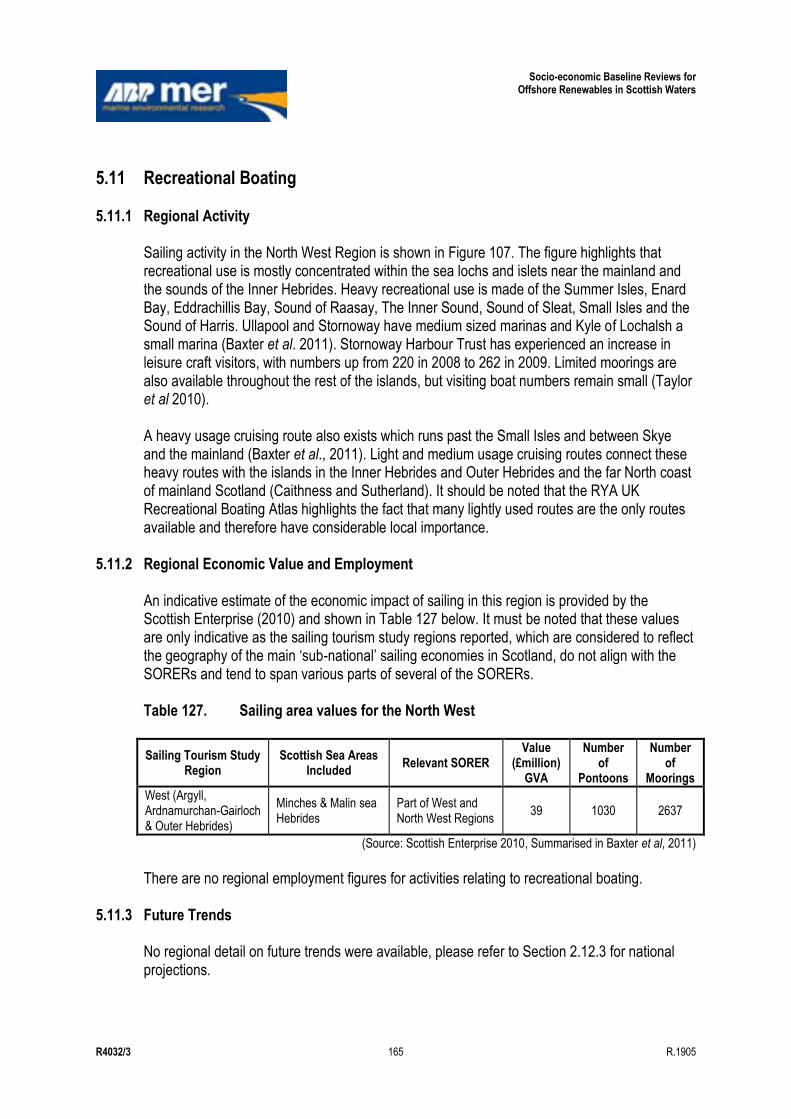
Socio-economic Baseline Reviews for Offshore Renewables in Scottish Waters
R4032/3 165 R.1905
5.11 Recreational Boating
5.11.1 Regional Activity Sailing activity in the North West Region is shown in Figure 107. The figure highlights that recreational use is mostly concentrated within the sea lochs and islets near the mainland and the sounds of the Inner Hebrides. Heavy recreational use is made of the Summer Isles, Enard Bay, Eddrachillis Bay, Sound of Raasay, The Inner Sound, Sound of Sleat, Small Isles and the Sound of Harris. Ullapool and Stornoway have medium sized marinas and Kyle of Lochalsh a small marina (Baxter et al. 2011). Stornoway Harbour Trust has experienced an increase in leisure craft visitors, with numbers up from 220 in 2008 to 262 in 2009. Limited moorings are also available throughout the rest of the islands, but visiting boat numbers remain small (Taylor et al 2010). A heavy usage cruising route also exists which runs past the Small Isles and between Skye and the mainland (Baxter et al., 2011). Light and medium usage cruising routes connect these heavy routes with the islands in the Inner Hebrides and Outer Hebrides and the far North coast of mainland Scotland (Caithness and Sutherland). It should be noted that the RYA UK Recreational Boating Atlas highlights the fact that many lightly used routes are the only routes available and therefore have considerable local importance.
5.11.2 Regional Economic Value and Employment An indicative estimate of the economic impact of sailing in this region is provided by the Scottish Enterprise (2010) and shown in Table 127 below. It must be noted that these values are only indicative as the sailing tourism study regions reported, which are considered to reflect the geography of the main „sub-national‟ sailing economies in Scotland, do not align with the SORERs and tend to span various parts of several of the SORERs. Table 127. Sailing area values for the North West
Sailing Tourism Study Region
Scottish Sea Areas Included
Relevant SORER Value
(£million) GVA
Number of
Pontoons
Number of
Moorings
West (Argyll, Ardnamurchan-Gairloch & Outer Hebrides)
Minches & Malin sea Hebrides
Part of West and North West Regions
39 1030 2637
(Source: Scottish Enterprise 2010, Summarised in Baxter et al, 2011)
There are no regional employment figures for activities relating to recreational boating.
5.11.3 Future Trends No regional detail on future trends were available, please refer to Section 2.12.3 for national projections.
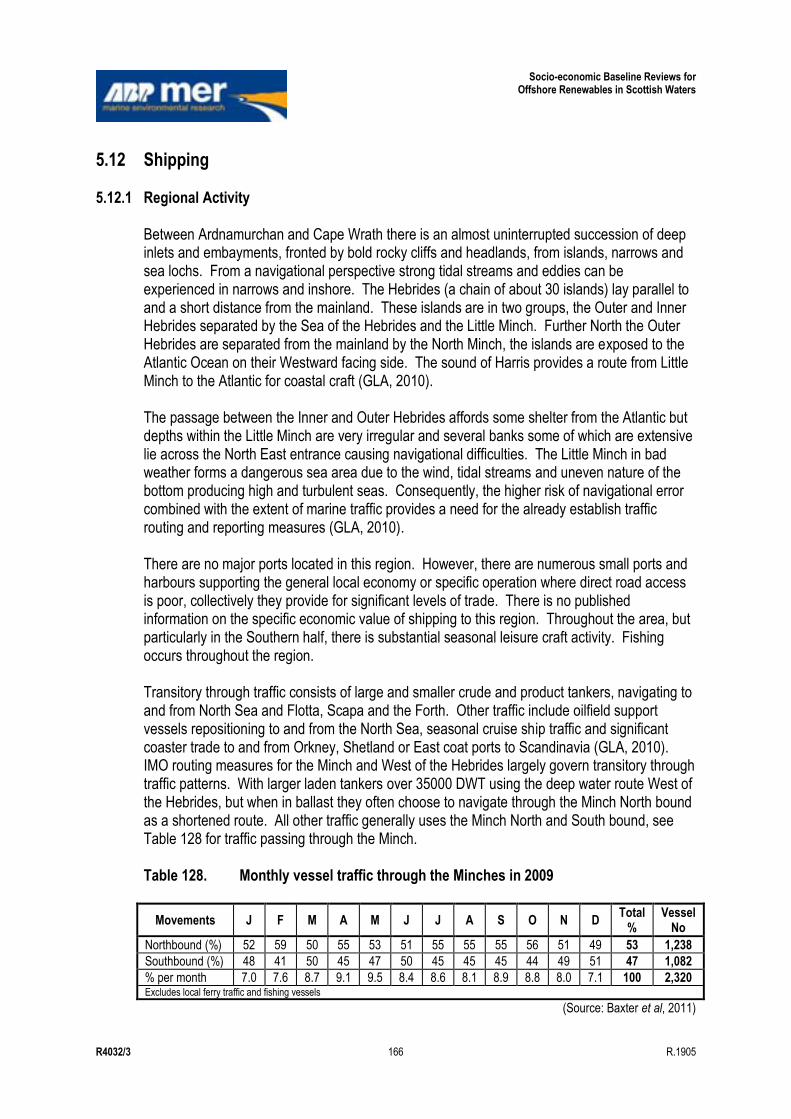
Socio-economic Baseline Reviews for Offshore Renewables in Scottish Waters
R4032/3 166 R.1905
5.12 Shipping
5.12.1 Regional Activity Between Ardnamurchan and Cape Wrath there is an almost uninterrupted succession of deep inlets and embayments, fronted by bold rocky cliffs and headlands, from islands, narrows and sea lochs. From a navigational perspective strong tidal streams and eddies can be experienced in narrows and inshore. The Hebrides (a chain of about 30 islands) lay parallel to and a short distance from the mainland. These islands are in two groups, the Outer and Inner Hebrides separated by the Sea of the Hebrides and the Little Minch. Further North the Outer Hebrides are separated from the mainland by the North Minch, the islands are exposed to the Atlantic Ocean on their Westward facing side. The sound of Harris provides a route from Little Minch to the Atlantic for coastal craft (GLA, 2010). The passage between the Inner and Outer Hebrides affords some shelter from the Atlantic but depths within the Little Minch are very irregular and several banks some of which are extensive lie across the North East entrance causing navigational difficulties. The Little Minch in bad weather forms a dangerous sea area due to the wind, tidal streams and uneven nature of the bottom producing high and turbulent seas. Consequently, the higher risk of navigational error combined with the extent of marine traffic provides a need for the already establish traffic routing and reporting measures (GLA, 2010). There are no major ports located in this region. However, there are numerous small ports and harbours supporting the general local economy or specific operation where direct road access is poor, collectively they provide for significant levels of trade. There is no published information on the specific economic value of shipping to this region. Throughout the area, but particularly in the Southern half, there is substantial seasonal leisure craft activity. Fishing occurs throughout the region. Transitory through traffic consists of large and smaller crude and product tankers, navigating to and from North Sea and Flotta, Scapa and the Forth. Other traffic include oilfield support vessels repositioning to and from the North Sea, seasonal cruise ship traffic and significant coaster trade to and from Orkney, Shetland or East coat ports to Scandinavia (GLA, 2010). IMO routing measures for the Minch and West of the Hebrides largely govern transitory through traffic patterns. With larger laden tankers over 35000 DWT using the deep water route West of the Hebrides, but when in ballast they often choose to navigate through the Minch North bound as a shortened route. All other traffic generally uses the Minch North and South bound, see Table 128 for traffic passing through the Minch. Table 128. Monthly vessel traffic through the Minches in 2009
Movements J F M A M J J A S O N D Total
% Vessel
No
Northbound (%) 52 59 50 55 53 51 55 55 55 56 51 49 53 1,238
Southbound (%) 48 41 50 45 47 50 45 45 45 44 49 51 47 1,082
% per month 7.0 7.6 8.7 9.1 9.5 8.4 8.6 8.1 8.9 8.8 8.0 7.1 100 2,320 Excludes local ferry traffic and fishing vessels
(Source: Baxter et al, 2011)

Socio-economic Baseline Reviews for Offshore Renewables in Scottish Waters
R4032/3 167 R.1905
Within this region, ports such as Mallaig, Ullapool and Stornaway provide for ferry terminals for routes to the islands, fishing, coastal general bulk cargo, fish farm support and frequent seasonal cruise vessel traffic. Timber is exported from mainland ports such as Kishorn with substantial quarry traffic also occurring. Local life line ferries operate Mallaig to Eigg, Muck, Canna & Rhum; Mallaig to Armadale; Ullapool to Stornaway; Uig to Tarbert and Lochmaddy; Berneray to Leverburgh; Oban to Lochboisdale and Castlebay and Barra to Eriskay (GLA, 2010). There are 16 ferry routes in the area detailed in Table 129 and in Figure 108. Table 129. North West Regional ferry routes
ID Port 1 Port 2 Statistics Regions
0 Oban Barra (Castlebay) Yes Northwest - West
1 Ullapool Lewis (Stornoway) Yes Northwest
2 Skye (Uig) North Uist (Lochmaddy) Yes Northwest
3 Mallaig Skye (Armadale) Yes Northwest
4 North Uist (Berneray) Harris (Leverburgh) Yes Northwest
5 Skye (Sconser) Raasay (Suisnish) Yes Northwest
6 Mallaig Inverie Yes Northwest
7 Fort William Camusnagaul Yes Northwest
8 Skye Harris No Northwest
9 Eriskay Barra No Northwest
10 Barra South Uist No Northwest
11 Tiree Barra No Northwest - West
12 Rum Muck No Northwest
13 Rum Canna No Northwest
14 Mallaig Rum No Northwest
15 Mull South Uist No Northwest - West
(Source: Marine Scotland, 2011a)
5.12.2 Regional Economic Value and Employment There is no published information on the specific economic value of shipping to this region. Employment extracted from ONS shows that the main employment in this sector is categorised as „Sea and Coastal Passenger Water Transport‟, with 93 people in employed full time employment in 2010. There are no other figures of direct port employment fro this region.
5.12.3 Future Trends Traffic patterns have not substantially changed since 2005 other than a significant increase in cruise vessels visiting the area. Traffic of all types (passenger ferry, cargo, leisure and Government) operate in small but significant quantity throughout this region either departing or arriving at local ports providing essential transport for the economy of the area, these trends are unlikely to change into the future.
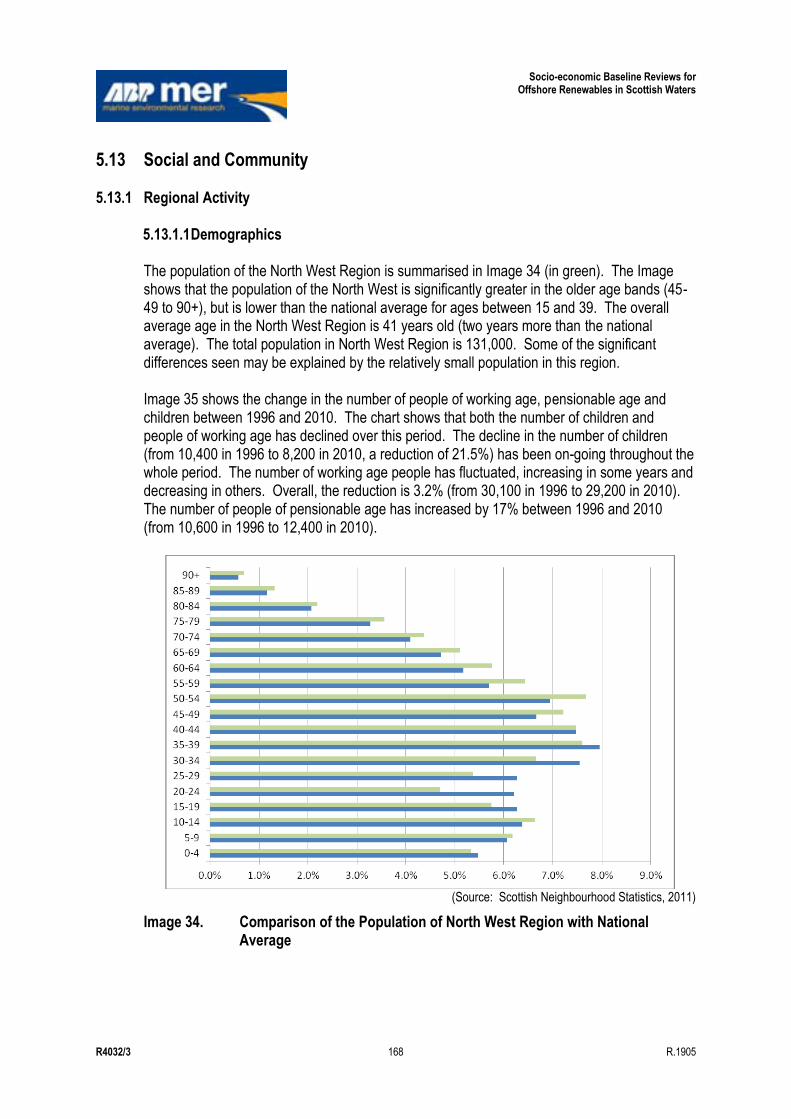
Socio-economic Baseline Reviews for Offshore Renewables in Scottish Waters
R4032/3 168 R.1905
5.13 Social and Community
5.13.1 Regional Activity 5.13.1.1 Demographics The population of the North West Region is summarised in Image 34 (in green). The Image shows that the population of the North West is significantly greater in the older age bands (45-49 to 90+), but is lower than the national average for ages between 15 and 39. The overall average age in the North West Region is 41 years old (two years more than the national average). The total population in North West Region is 131,000. Some of the significant differences seen may be explained by the relatively small population in this region. Image 35 shows the change in the number of people of working age, pensionable age and children between 1996 and 2010. The chart shows that both the number of children and people of working age has declined over this period. The decline in the number of children (from 10,400 in 1996 to 8,200 in 2010, a reduction of 21.5%) has been on-going throughout the whole period. The number of working age people has fluctuated, increasing in some years and decreasing in others. Overall, the reduction is 3.2% (from 30,100 in 1996 to 29,200 in 2010). The number of people of pensionable age has increased by 17% between 1996 and 2010 (from 10,600 in 1996 to 12,400 in 2010).
(Source: Scottish Neighbourhood Statistics, 2011)
Image 34. Comparison of the Population of North West Region with National Average
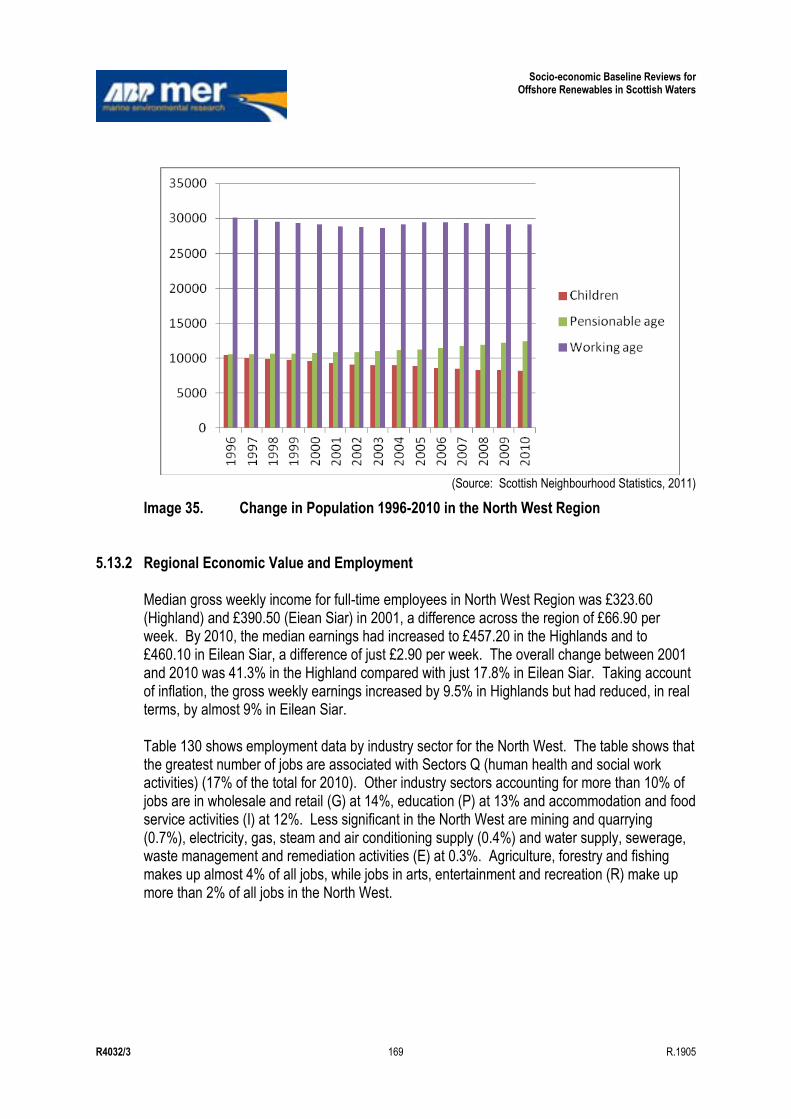
Socio-economic Baseline Reviews for Offshore Renewables in Scottish Waters
R4032/3 169 R.1905
(Source: Scottish Neighbourhood Statistics, 2011)
Image 35. Change in Population 1996-2010 in the North West Region
5.13.2 Regional Economic Value and Employment Median gross weekly income for full-time employees in North West Region was £323.60 (Highland) and £390.50 (Eiean Siar) in 2001, a difference across the region of £66.90 per week. By 2010, the median earnings had increased to £457.20 in the Highlands and to £460.10 in Eilean Siar, a difference of just £2.90 per week. The overall change between 2001 and 2010 was 41.3% in the Highland compared with just 17.8% in Eilean Siar. Taking account of inflation, the gross weekly earnings increased by 9.5% in Highlands but had reduced, in real terms, by almost 9% in Eilean Siar. Table 130 shows employment data by industry sector for the North West. The table shows that the greatest number of jobs are associated with Sectors Q (human health and social work activities) (17% of the total for 2010). Other industry sectors accounting for more than 10% of jobs are in wholesale and retail (G) at 14%, education (P) at 13% and accommodation and food service activities (I) at 12%. Less significant in the North West are mining and quarrying (0.7%), electricity, gas, steam and air conditioning supply (0.4%) and water supply, sewerage, waste management and remediation activities (E) at 0.3%. Agriculture, forestry and fishing makes up almost 4% of all jobs, while jobs in arts, entertainment and recreation (R) make up more than 2% of all jobs in the North West.
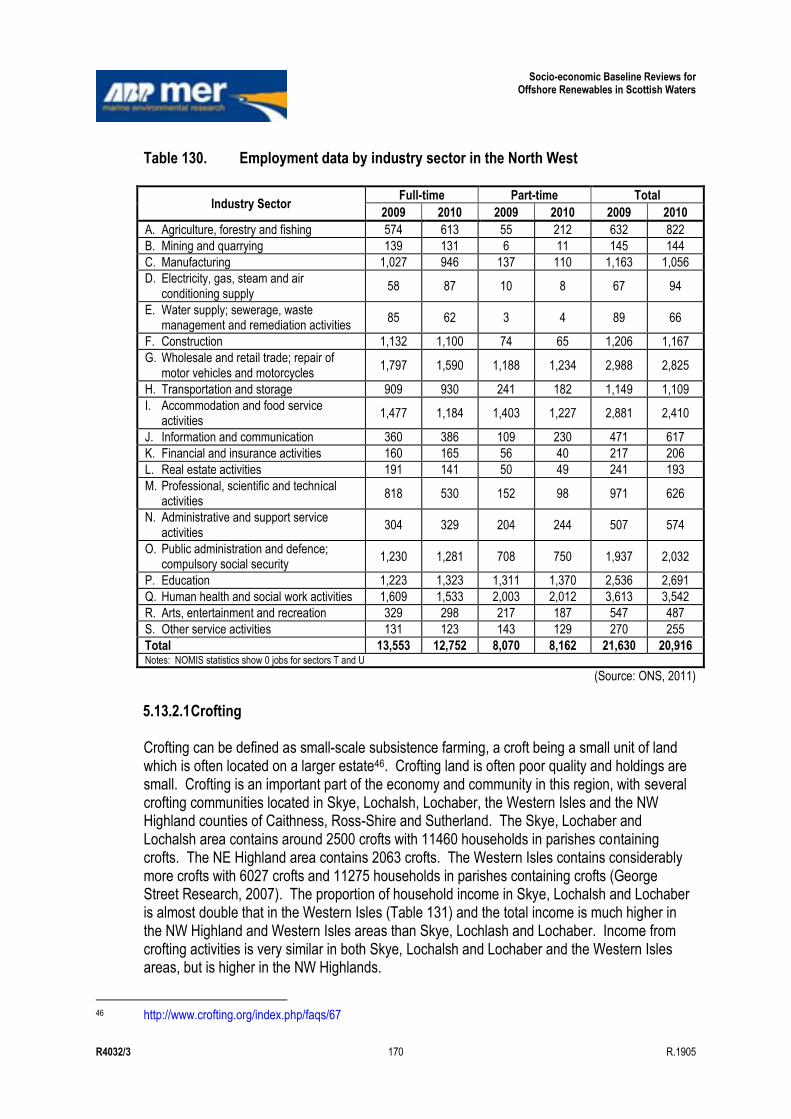
Socio-economic Baseline Reviews for Offshore Renewables in Scottish Waters
R4032/3 170 R.1905
Table 130. Employment data by industry sector in the North West
Industry Sector Full-time Part-time Total
2009 2010 2009 2010 2009 2010
A. Agriculture, forestry and fishing 574 613 55 212 632 822
B. Mining and quarrying 139 131 6 11 145 144
C. Manufacturing 1,027 946 137 110 1,163 1,056
D. Electricity, gas, steam and air conditioning supply
58 87 10 8 67 94
E. Water supply; sewerage, waste management and remediation activities
85 62 3 4 89 66
F. Construction 1,132 1,100 74 65 1,206 1,167
G. Wholesale and retail trade; repair of motor vehicles and motorcycles
1,797 1,590 1,188 1,234 2,988 2,825
H. Transportation and storage 909 930 241 182 1,149 1,109
I. Accommodation and food service activities
1,477 1,184 1,403 1,227 2,881 2,410
J. Information and communication 360 386 109 230 471 617
K. Financial and insurance activities 160 165 56 40 217 206
L. Real estate activities 191 141 50 49 241 193
M. Professional, scientific and technical activities
818 530 152 98 971 626
N. Administrative and support service activities
304 329 204 244 507 574
O. Public administration and defence; compulsory social security
1,230 1,281 708 750 1,937 2,032
P. Education 1,223 1,323 1,311 1,370 2,536 2,691
Q. Human health and social work activities 1,609 1,533 2,003 2,012 3,613 3,542
R. Arts, entertainment and recreation 329 298 217 187 547 487
S. Other service activities 131 123 143 129 270 255
Total 13,553 12,752 8,070 8,162 21,630 20,916 Notes: NOMIS statistics show 0 jobs for sectors T and U
(Source: ONS, 2011)
5.13.2.1 Crofting Crofting can be defined as small-scale subsistence farming, a croft being a small unit of land which is often located on a larger estate46. Crofting land is often poor quality and holdings are small. Crofting is an important part of the economy and community in this region, with several crofting communities located in Skye, Lochalsh, Lochaber, the Western Isles and the NW Highland counties of Caithness, Ross-Shire and Sutherland. The Skye, Lochaber and Lochalsh area contains around 2500 crofts with 11460 households in parishes containing crofts. The NE Highland area contains 2063 crofts. The Western Isles contains considerably more crofts with 6027 crofts and 11275 households in parishes containing crofts (George Street Research, 2007). The proportion of household income in Skye, Lochalsh and Lochaber is almost double that in the Western Isles (Table 131) and the total income is much higher in the NW Highland and Western Isles areas than Skye, Lochlash and Lochaber. Income from crofting activities is very similar in both Skye, Lochalsh and Lochaber and the Western Isles areas, but is higher in the NW Highlands.
46 http://www.crofting.org/index.php/faqs/67
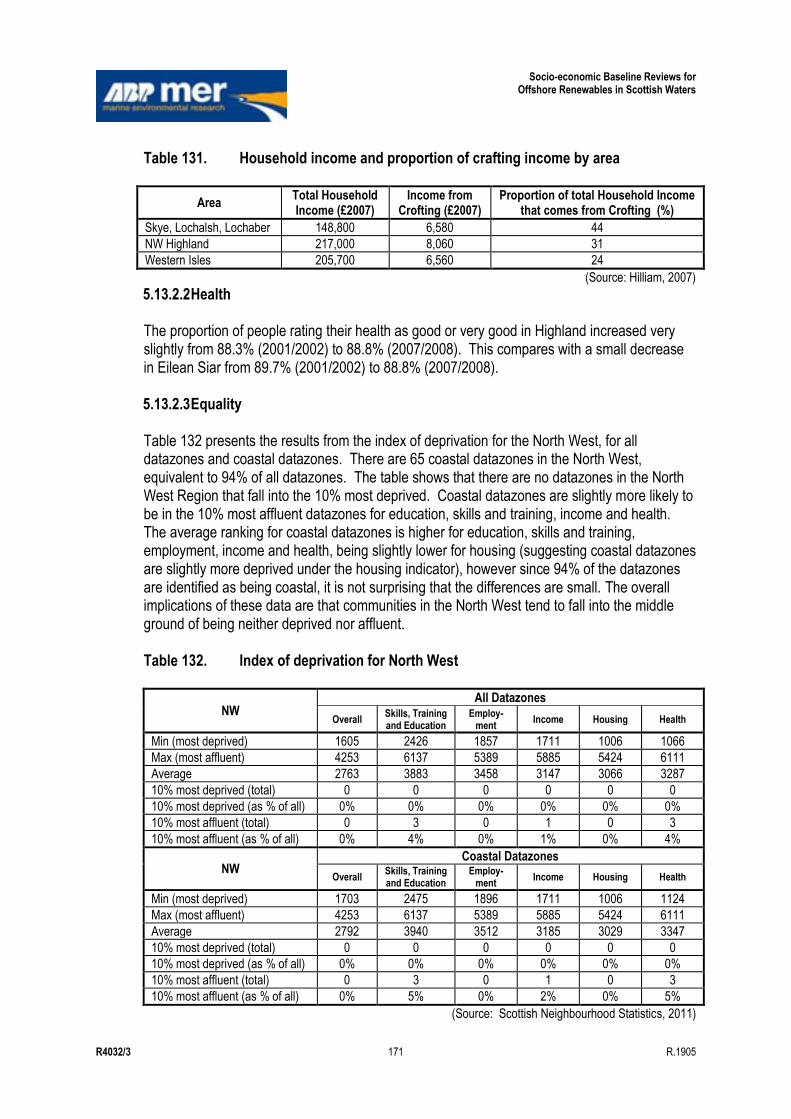
Socio-economic Baseline Reviews for Offshore Renewables in Scottish Waters
R4032/3 171 R.1905
Table 131. Household income and proportion of crafting income by area
Area Total Household Income (£2007)
Income from Crofting (£2007)
Proportion of total Household Income that comes from Crofting (%)
Skye, Lochalsh, Lochaber 148,800 6,580 44
NW Highland 217,000 8,060 31
Western Isles 205,700 6,560 24
(Source: Hilliam, 2007)
5.13.2.2 Health The proportion of people rating their health as good or very good in Highland increased very slightly from 88.3% (2001/2002) to 88.8% (2007/2008). This compares with a small decrease in Eilean Siar from 89.7% (2001/2002) to 88.8% (2007/2008). 5.13.2.3 Equality Table 132 presents the results from the index of deprivation for the North West, for all datazones and coastal datazones. There are 65 coastal datazones in the North West, equivalent to 94% of all datazones. The table shows that there are no datazones in the North West Region that fall into the 10% most deprived. Coastal datazones are slightly more likely to be in the 10% most affluent datazones for education, skills and training, income and health. The average ranking for coastal datazones is higher for education, skills and training, employment, income and health, being slightly lower for housing (suggesting coastal datazones are slightly more deprived under the housing indicator), however since 94% of the datazones are identified as being coastal, it is not surprising that the differences are small. The overall implications of these data are that communities in the North West tend to fall into the middle ground of being neither deprived nor affluent. Table 132. Index of deprivation for North West
NW All Datazones
Overall Skills, Training and Education
Employ-ment
Income Housing Health
Min (most deprived) 1605 2426 1857 1711 1006 1066
Max (most affluent) 4253 6137 5389 5885 5424 6111
Average 2763 3883 3458 3147 3066 3287
10% most deprived (total) 0 0 0 0 0 0
10% most deprived (as % of all) 0% 0% 0% 0% 0% 0%
10% most affluent (total) 0 3 0 1 0 3
10% most affluent (as % of all) 0% 4% 0% 1% 0% 4%
NW Coastal Datazones
Overall Skills, Training and Education
Employ-ment
Income Housing Health
Min (most deprived) 1703 2475 1896 1711 1006 1124
Max (most affluent) 4253 6137 5389 5885 5424 6111
Average 2792 3940 3512 3185 3029 3347
10% most deprived (total) 0 0 0 0 0 0
10% most deprived (as % of all) 0% 0% 0% 0% 0% 0%
10% most affluent (total) 0 3 0 1 0 3
10% most affluent (as % of all) 0% 5% 0% 2% 0% 5%
(Source: Scottish Neighbourhood Statistics, 2011)
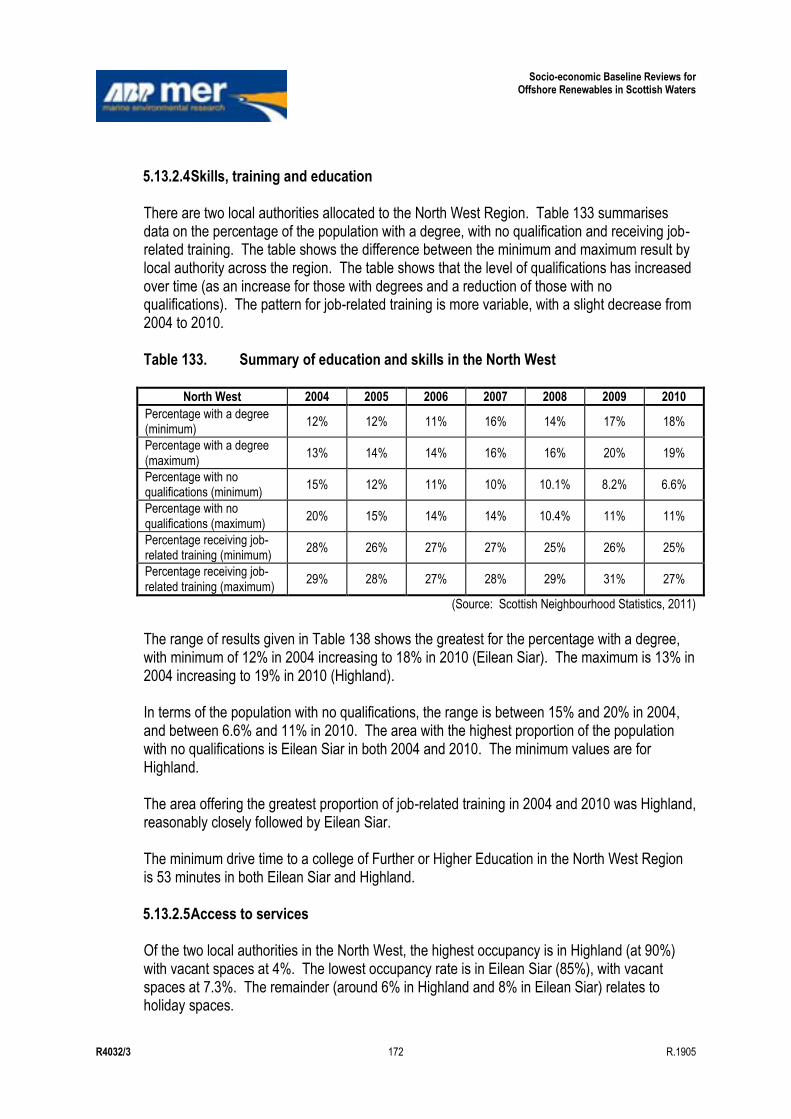
Socio-economic Baseline Reviews for Offshore Renewables in Scottish Waters
R4032/3 172 R.1905
5.13.2.4 Skills, training and education There are two local authorities allocated to the North West Region. Table 133 summarises data on the percentage of the population with a degree, with no qualification and receiving job-related training. The table shows the difference between the minimum and maximum result by local authority across the region. The table shows that the level of qualifications has increased over time (as an increase for those with degrees and a reduction of those with no qualifications). The pattern for job-related training is more variable, with a slight decrease from 2004 to 2010. Table 133. Summary of education and skills in the North West
North West 2004 2005 2006 2007 2008 2009 2010
Percentage with a degree (minimum)
12% 12% 11% 16% 14% 17% 18%
Percentage with a degree (maximum)
13% 14% 14% 16% 16% 20% 19%
Percentage with no qualifications (minimum)
15% 12% 11% 10% 10.1% 8.2% 6.6%
Percentage with no qualifications (maximum)
20% 15% 14% 14% 10.4% 11% 11%
Percentage receiving job-related training (minimum)
28% 26% 27% 27% 25% 26% 25%
Percentage receiving job-related training (maximum)
29% 28% 27% 28% 29% 31% 27%
(Source: Scottish Neighbourhood Statistics, 2011)
The range of results given in Table 138 shows the greatest for the percentage with a degree, with minimum of 12% in 2004 increasing to 18% in 2010 (Eilean Siar). The maximum is 13% in 2004 increasing to 19% in 2010 (Highland). In terms of the population with no qualifications, the range is between 15% and 20% in 2004, and between 6.6% and 11% in 2010. The area with the highest proportion of the population with no qualifications is Eilean Siar in both 2004 and 2010. The minimum values are for Highland. The area offering the greatest proportion of job-related training in 2004 and 2010 was Highland, reasonably closely followed by Eilean Siar. The minimum drive time to a college of Further or Higher Education in the North West Region is 53 minutes in both Eilean Siar and Highland. 5.13.2.5 Access to services Of the two local authorities in the North West, the highest occupancy is in Highland (at 90%) with vacant spaces at 4%. The lowest occupancy rate is in Eilean Siar (85%), with vacant spaces at 7.3%. The remainder (around 6% in Highland and 8% in Eilean Siar) relates to holiday spaces.

Socio-economic Baseline Reviews for Offshore Renewables in Scottish Waters
R4032/3 173 R.1905
House prices do vary between the two local authorities in the North West Region, although the values for Highland are close to the national average. In recent years, (since 2003), values in Highland have increased so they are higher than the national average. Mean house sale prices in Eilean Siar are considerable lower than the national average. In 2010, the national average was £154,078 while the average in Eilean Siar was £103,288, or 33% lower than the national average. Figure 109 presents the results for the North West in comparison with the other regions. Highland is the second least affordable areas to buy a house in Scotland (after Edinburgh) with 27.6% of disposable income spent on mortgage payments (Bank of Scotland, 2011). It is also one of the areas with older average first-time buyers. Bank of Scotland (2011a) shows that the average age of first-time buyers in Highland in 2011 was 30, with a house price to earnings ratio of 4.2. Data on council house debt are only available for Highland, at £11,123 per house in 2011, 20% higher than the national average. The quality of housing in the North West tends to be better than average in the social sector, with 64% of social sector dwellings failing the SHQS compared with the national average of 66%. The reverse is true for private sector dwellings, where 74% failed the SHQS between 2005 and 2008, compared with 69% for the national average. Table 134 shows the mean and median drive time to different services in the North West Region, and the datazones with the shortest and longest drive times, by service type. There is considerable variation between the shortest and longest time. The mean and median are also considerably greater than the shortest times, suggesting that there is greater isolation in the North West than in other regions. The longest drive time also show that some communities are considerably more isolated from services such as petrol stations and supermarkets Table 134. Drive time to services in North West Region
Service Drive Time in Minutes
Mean Median Shortest Longest
GP 12 11 1.3 40 Petrol station 18 12 1.5 135
Post office 6.6 5.3 1.4 25
Primary school 7.8 6.7 1.2 25 Supermarket 33 26 1.3 173
(Source: Scottish National Statistics, 2011)
5.13.2.6 Quality of life The highest perceived quality of life in 2007/2008 was in the Eilean Siar, where 73.5% rated their neighbourhood as good or very good. The value for Highland was significantly lower at 62.3%. The percentage of adults rating their neighbourhood as good or very good has increased by 10.7% between 1999/2000 and 2007/2008 in Eilean Siar, although there has been a decrease since 2003/2004 from a high of 75.6%. In Highland, there has been a slight decline of 0.6% between 1999/2000 and 2007/2008. There has, though, been a much larger decline since 2005/2006, from 67.5%.
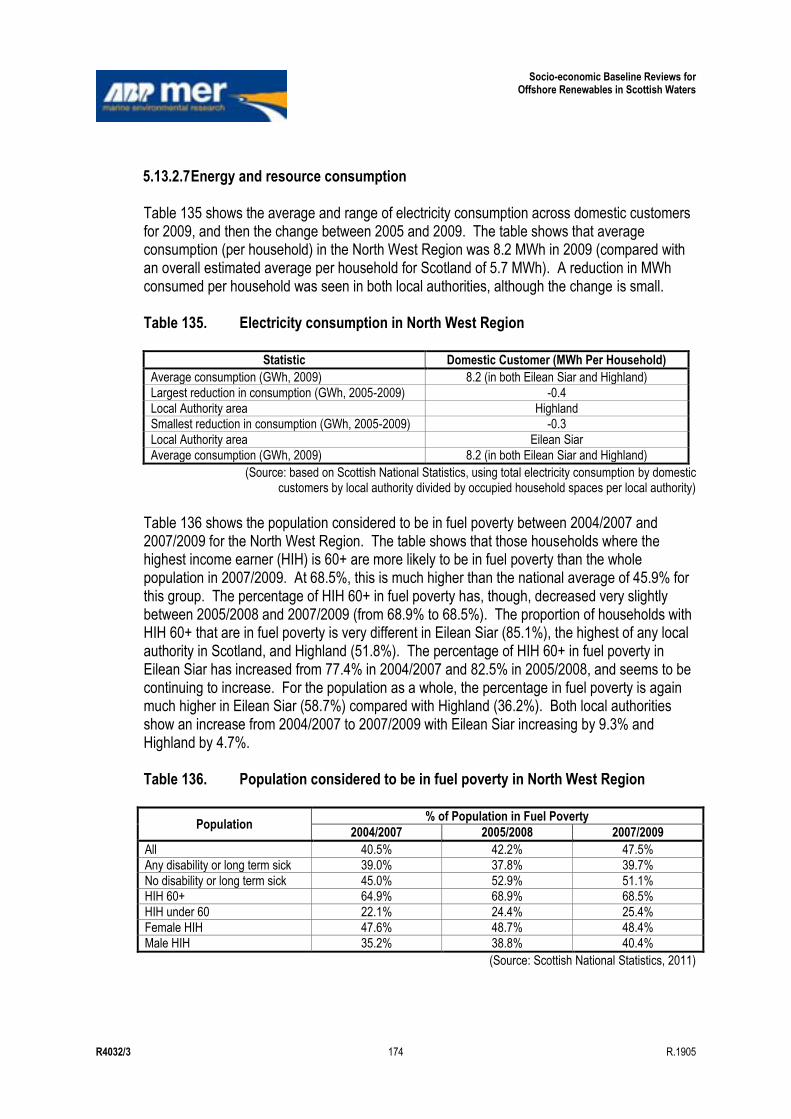
Socio-economic Baseline Reviews for Offshore Renewables in Scottish Waters
R4032/3 174 R.1905
5.13.2.7 Energy and resource consumption Table 135 shows the average and range of electricity consumption across domestic customers for 2009, and then the change between 2005 and 2009. The table shows that average consumption (per household) in the North West Region was 8.2 MWh in 2009 (compared with an overall estimated average per household for Scotland of 5.7 MWh). A reduction in MWh consumed per household was seen in both local authorities, although the change is small. Table 135. Electricity consumption in North West Region
Statistic Domestic Customer (MWh Per Household)
Average consumption (GWh, 2009) 8.2 (in both Eilean Siar and Highland)
Largest reduction in consumption (GWh, 2005-2009) -0.4
Local Authority area Highland Smallest reduction in consumption (GWh, 2005-2009) -0.3
Local Authority area Eilean Siar
Average consumption (GWh, 2009) 8.2 (in both Eilean Siar and Highland)
(Source: based on Scottish National Statistics, using total electricity consumption by domestic customers by local authority divided by occupied household spaces per local authority)
Table 136 shows the population considered to be in fuel poverty between 2004/2007 and 2007/2009 for the North West Region. The table shows that those households where the highest income earner (HIH) is 60+ are more likely to be in fuel poverty than the whole population in 2007/2009. At 68.5%, this is much higher than the national average of 45.9% for this group. The percentage of HIH 60+ in fuel poverty has, though, decreased very slightly between 2005/2008 and 2007/2009 (from 68.9% to 68.5%). The proportion of households with HIH 60+ that are in fuel poverty is very different in Eilean Siar (85.1%), the highest of any local authority in Scotland, and Highland (51.8%). The percentage of HIH 60+ in fuel poverty in Eilean Siar has increased from 77.4% in 2004/2007 and 82.5% in 2005/2008, and seems to be continuing to increase. For the population as a whole, the percentage in fuel poverty is again much higher in Eilean Siar (58.7%) compared with Highland (36.2%). Both local authorities show an increase from 2004/2007 to 2007/2009 with Eilean Siar increasing by 9.3% and Highland by 4.7%. Table 136. Population considered to be in fuel poverty in North West Region
Population % of Population in Fuel Poverty
2004/2007 2005/2008 2007/2009
All 40.5% 42.2% 47.5%
Any disability or long term sick 39.0% 37.8% 39.7%
No disability or long term sick 45.0% 52.9% 51.1% HIH 60+ 64.9% 68.9% 68.5%
HIH under 60 22.1% 24.4% 25.4%
Female HIH 47.6% 48.7% 48.4%
Male HIH 35.2% 38.8% 40.4%
(Source: Scottish National Statistics, 2011)
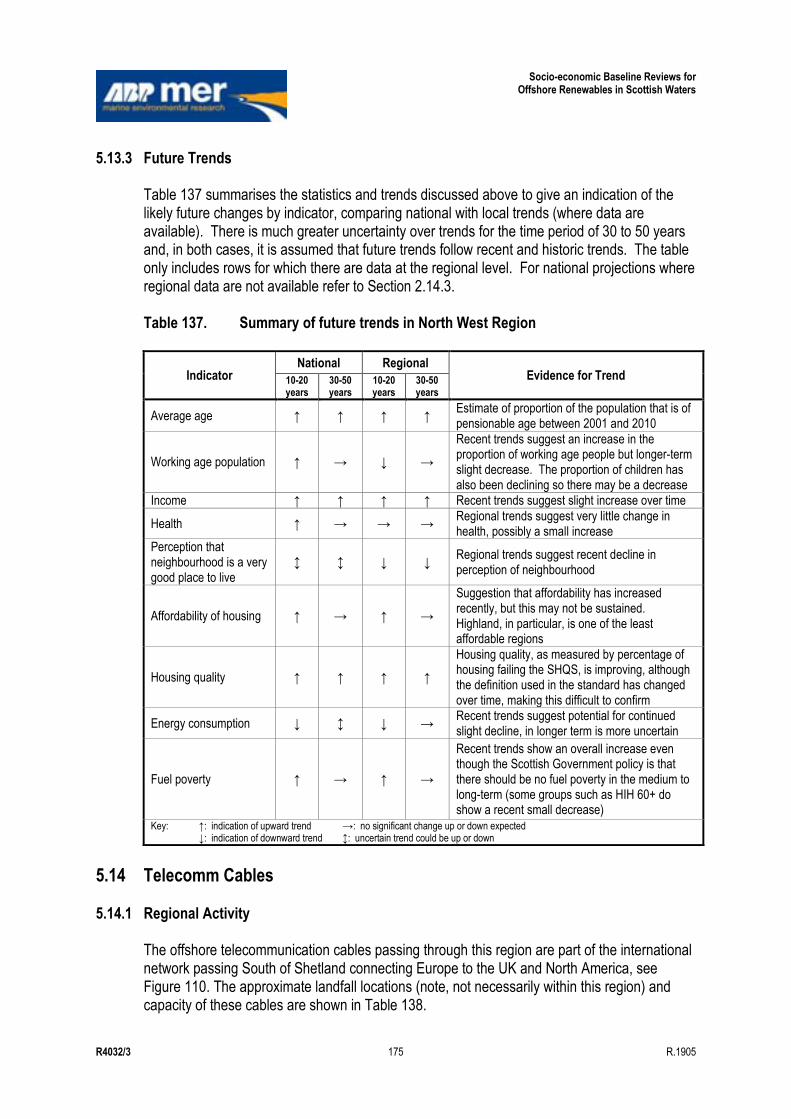
Socio-economic Baseline Reviews for Offshore Renewables in Scottish Waters
R4032/3 175 R.1905
5.13.3 Future Trends
Table 137 summarises the statistics and trends discussed above to give an indication of the likely future changes by indicator, comparing national with local trends (where data are available). There is much greater uncertainty over trends for the time period of 30 to 50 years and, in both cases, it is assumed that future trends follow recent and historic trends. The table only includes rows for which there are data at the regional level. For national projections where regional data are not available refer to Section 2.14.3. Table 137. Summary of future trends in North West Region
Indicator National Regional
Evidence for Trend 10-20 years
30-50 years
10-20 years
30-50 years
Average age ↑ ↑ ↑ ↑ Estimate of proportion of the population that is of pensionable age between 2001 and 2010
Working age population ↑ → ↓ →
Recent trends suggest an increase in the proportion of working age people but longer-term slight decrease. The proportion of children has also been declining so there may be a decrease
Income ↑ ↑ ↑ ↑ Recent trends suggest slight increase over time
Health ↑ → → → Regional trends suggest very little change in health, possibly a small increase
Perception that neighbourhood is a very good place to live
↕ ↕ ↓ ↓ Regional trends suggest recent decline in perception of neighbourhood
Affordability of housing ↑ → ↑ →
Suggestion that affordability has increased recently, but this may not be sustained. Highland, in particular, is one of the least affordable regions
Housing quality ↑ ↑ ↑ ↑
Housing quality, as measured by percentage of housing failing the SHQS, is improving, although the definition used in the standard has changed over time, making this difficult to confirm
Energy consumption ↓ ↕ ↓ → Recent trends suggest potential for continued slight decline, in longer term is more uncertain
Fuel poverty ↑ → ↑ →
Recent trends show an overall increase even though the Scottish Government policy is that there should be no fuel poverty in the medium to long-term (some groups such as HIH 60+ do show a recent small decrease)
Key: ↑: indication of upward trend →: no significant change up or down expected ↓: indication of downward trend ↕: uncertain trend could be up or down
5.14 Telecomm Cables
5.14.1 Regional Activity The offshore telecommunication cables passing through this region are part of the international network passing South of Shetland connecting Europe to the UK and North America, see Figure 110. The approximate landfall locations (note, not necessarily within this region) and capacity of these cables are shown in Table 138.
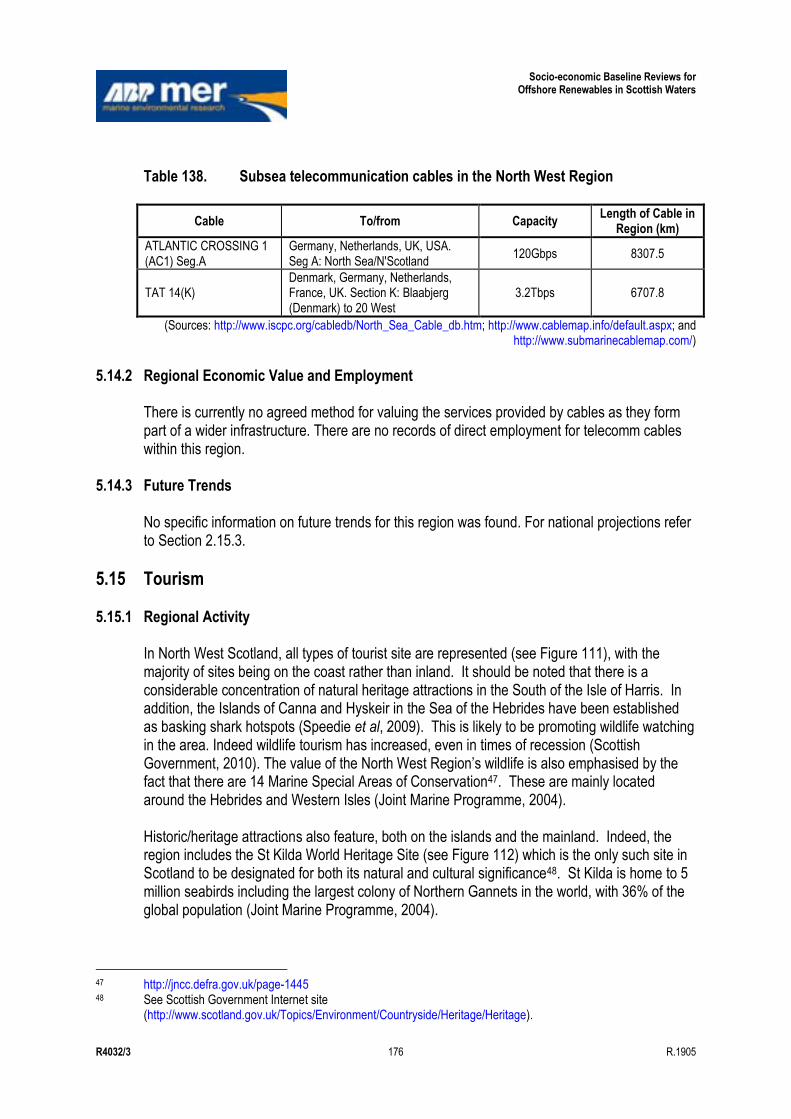
Socio-economic Baseline Reviews for Offshore Renewables in Scottish Waters
R4032/3 176 R.1905
Table 138. Subsea telecommunication cables in the North West Region
Cable To/from Capacity Length of Cable in
Region (km)
ATLANTIC CROSSING 1 (AC1) Seg.A
Germany, Netherlands, UK, USA. Seg A: North Sea/N'Scotland
120Gbps 8307.5
TAT 14(K) Denmark, Germany, Netherlands, France, UK. Section K: Blaabjerg (Denmark) to 20 West
3.2Tbps 6707.8
(Sources: http://www.iscpc.org/cabledb/North_Sea_Cable_db.htm; http://www.cablemap.info/default.aspx; and http://www.submarinecablemap.com/)
5.14.2 Regional Economic Value and Employment
There is currently no agreed method for valuing the services provided by cables as they form part of a wider infrastructure. There are no records of direct employment for telecomm cables within this region.
5.14.3 Future Trends No specific information on future trends for this region was found. For national projections refer to Section 2.15.3.
5.15 Tourism
5.15.1 Regional Activity In North West Scotland, all types of tourist site are represented (see Figure 111), with the majority of sites being on the coast rather than inland. It should be noted that there is a considerable concentration of natural heritage attractions in the South of the Isle of Harris. In addition, the Islands of Canna and Hyskeir in the Sea of the Hebrides have been established as basking shark hotspots (Speedie et al, 2009). This is likely to be promoting wildlife watching in the area. Indeed wildlife tourism has increased, even in times of recession (Scottish Government, 2010). The value of the North West Region‟s wildlife is also emphasised by the fact that there are 14 Marine Special Areas of Conservation47. These are mainly located around the Hebrides and Western Isles (Joint Marine Programme, 2004). Historic/heritage attractions also feature, both on the islands and the mainland. Indeed, the region includes the St Kilda World Heritage Site (see Figure 112) which is the only such site in Scotland to be designated for both its natural and cultural significance48. St Kilda is home to 5 million seabirds including the largest colony of Northern Gannets in the world, with 36% of the global population (Joint Marine Programme, 2004).
47 http://jncc.defra.gov.uk/page-1445 48 See Scottish Government Internet site
(http://www.scotland.gov.uk/Topics/Environment/Countryside/Heritage/Heritage).
Socio-economic Baseline Reviews for Offshore Renewables in Scottish Waters
R4032/3 177 R.1905
For more active tourism, North West Scotland has one designated bathing water at Achmelvich Bay, a site which also holds a Seaside Award (see Figure 113). Although overall visitor numbers do not exist for the region as a whole, information from VisitScotland can be used to provide an approximation. For the Western Isles49 alone, in 2009 UK visitors made around 0.08 million trips, stayed for 0.38 million nights and spent £20 million. Overseas visitors to the islands made 0.11 million trips, stayed for 0.44 million nights and spent £30 million.
5.15.2 Regional Economic Value and Employment In the Outer Hebrides, tourism is a significant contributor to the economy (Taylor et al, 2010). However, information on the number of jobs in tourism is not readily available..
5.15.3 Future Trends A recent study by the Scottish Government (2010) agrees with this trend. indicates that the trend in whale watching and eco-tourism is an upwards one. Thus, cetacean watching may continue to expand in this region. For further discussion on general trends in tourism, see Section 2.16.3 (National Overview).
5.16 Waste Disposal
5.16.1 Regional Activity The location of open, disused and closed dredge disposal sites are shown in Figure 114. The name of open disposal sites and the area of seabed each disposal site covers are shown in Table 139. Table 139. Area of seabed covered by open disposal sites in the North West Region
Name of Disposal Site Area of Seabed (m²)
Lochinver 0.037
Loch Nevis 0.059
Isle Of Eigg 0.116
Sound Of Canna 0.116
Port Mor Isle Of Muck 0.116
Ullapool (Loch Broom) 0.035
Total 0.478
(Source: Based on Cefas data, 2011) Data supplied by Marine Scotland indicated that no licences were issued for disposal of dredge spoil at open sites in this region in 2010.
49 Note that data for the Highlands are reported under the North East region.

Socio-economic Baseline Reviews for Offshore Renewables in Scottish Waters
R4032/3 178 R.1905
5.16.2 Regional Economic Value and Employment
It is not possible to calculate the GVA associated with dredge spoil disposal (Baxter et al, 2011). In addition there are no figures for direct employment in this activity.
5.16.3 Future Trends
The NRIP identified two locations in this region, Arnish and Kishorn, which could potentially support the offshore wind, wave and tidal industries. Arnish was identified as a site which could be used for installation of renewables and further supply chain manufacturing uses but that development required for this would include improved quay access. Kishorn Port has been identified as a potential site for offshore wind manufacturing, assembly and fabrication, operations and maintenance and decommissioning. Infrastructure development requirements to fulfil this role include deepening of the water channel and further deep water quay facilities, possibly up to 20m in depth (Scottish Enterprise and Scottish Highland and Island Enterprise (2010b).
5.17 Water Sports
5.17.1 Regional Activity
5.17.1.1 Surfing and windsurfing
The Outer Hebrides are exposed to Atlantic swells from the S, W and N, including NE swells coming from the direction of Scandinavia (http://www.lowpressure.co.uk). Some of the spots in this area are considered high quality although the remoteness of the location means they remain uncrowded most of the time (SAS, 2009). The SAS (2009) report shows about 16 surfing locations occur within the North West Region (Table 140 and Figure 115.) Some of these spots are also used for windsurfing.
Table 140. Surfing and windsurfing locations in the North West Region
General Location Surf Location*
Outer Hebrides*
Tolsta
Port of Ness
Europie
Barvas
Bus Stop
Bragar
Dalbeg
Dalmore
Cliff
Mangersta
Scarasta
Hosta
Culla Bay
Barra - West coast
Bagh Siar
Sutherland Oldshoremore * Specific beaches for windsurfing are not listed in the Windsurf magazine „beach guide‟ although the islands of North Uist and Barra are
listed as windsurfing locations.
(Source: Based on SAS, 2009 and „Stormrider Guides‟ 2010)
Socio-economic Baseline Reviews for Offshore Renewables in Scottish Waters
R4032/3 179 R.1905
5.17.1.2 Sea angling Sea angling is undertaken at a range of sites in this area particularly around the Isle of Skye, Gairloch and Mallaig although intensity is generally less than further South due to the remoteness of some areas causing access issues (Land Use Consultants, 2007). 5.17.1.3 Scuba diving The location of major scuba diving sites in this area can be seen in Figure 116. Sites are mainly distributed around the Inner Sound and North West coast of Skye. A total of six dive centres and eight dive charter boats along with a few dive clubs operate in the area (Table 147). Table 141. The number of dive centres, charter boats and diving clubs found in the
in North West Region
Facilities Number
Dive Centres 6
Charter Boats 8
ScotSAC Branches 3
BSAC Branches 1
(Source: BSAC: http://www.bsac.com/; ScotSAC: http://www.scotsac.com/; and http://finstrokes.com)
5.17.1.4 Small sail boat activities and sea kayaking A number of coastal dinghy sailing clubs can be found in the North West Region, primarily located in the more populated areas such as Portree, Kyle of Lochalsh and Stornoway (Figure 117). Sea kayaking in the North West Region is popular around the Isle of Skye and Sound of Sleat (Land Use Consultants, 2007) (Figure 118).
5.17.2 Regional Economic Value and Employment The only economic data available within this region was on recreational angling. 5.17.2.1 Angling Radford et al (2009) estimated the sea angling activity and economic value in eight regions of Scotland. Two of these regions, namely North and Western Isles, fall within the North West Region. As the areas in Radford et al (2009) do not align with the SORERs the values should only be taken as indicative values for comparison between areas. The total estimated regional sea angling activity and expenditure within these two regions is shown in Table 142. It has not been possible to obtain regional employment figures for activities relating directly to water sports in the North West.
Socio-economic Baseline Reviews for Offshore Renewables in Scottish Waters
R4032/3 180 R.1905
Table 142. Estimated regional sea angling activity and expenditure in North West Region
Region No. Resident Sea Anglers
Annual Sea Angler Days
Spent in Region
% of Total Activity
Undertaken on the Shore
Total Annual Sea Angler Expenditure
(£M)
% of Expenditure
Spent on Shore Angling
Number of Jobs
Supported
North Scotland 7894 144346 43% 11.2 41% 299
Western Isles 2515 80567 44% 9.2 42% 184
(Source: Radford et al, 2009)
5.17.3 Future Trends No regional detail on future trends were available, please refer to Section 2.18.3 for national projections.
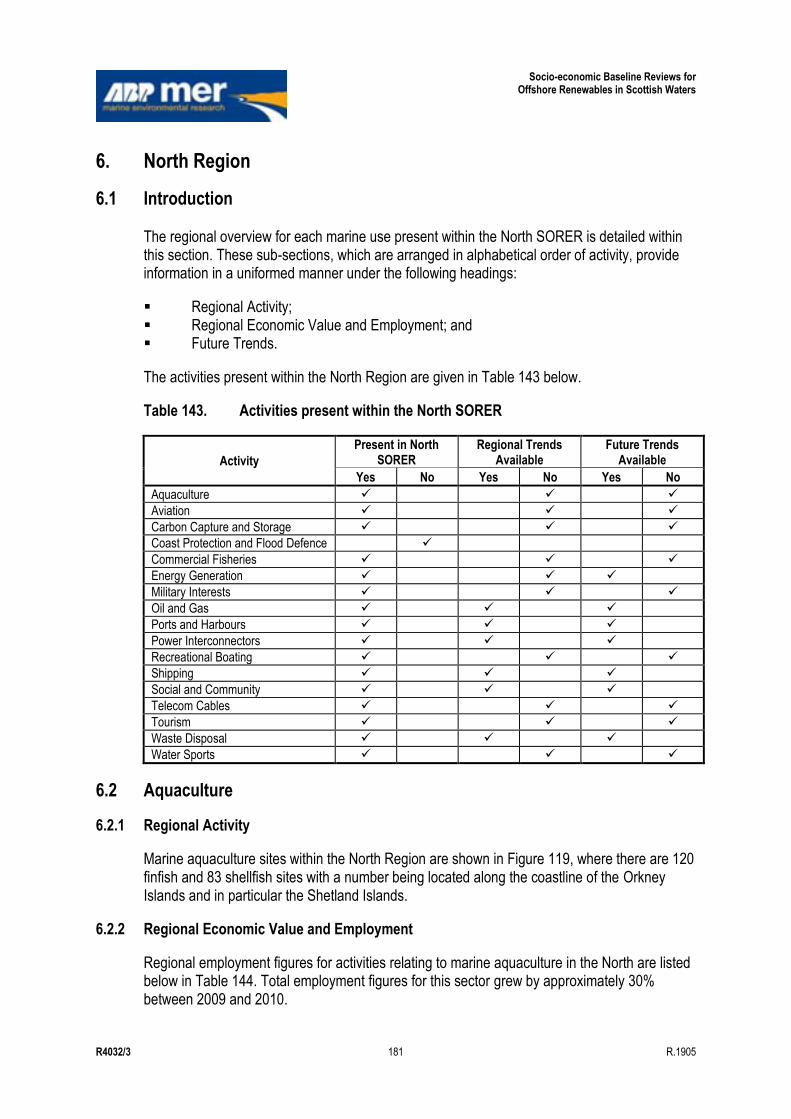
Socio-economic Baseline Reviews for Offshore Renewables in Scottish Waters
R4032/3 181 R.1905
6. North Region
6.1 Introduction The regional overview for each marine use present within the North SORER is detailed within this section. These sub-sections, which are arranged in alphabetical order of activity, provide information in a uniformed manner under the following headings:
Regional Activity; Regional Economic Value and Employment; and Future Trends.
The activities present within the North Region are given in Table 143 below.
Table 143. Activities present within the North SORER
Activity
Present in North SORER
Regional Trends Available
Future Trends Available
Yes No Yes No Yes No
Aquaculture
Aviation
Carbon Capture and Storage
Coast Protection and Flood Defence
Commercial Fisheries
Energy Generation
Military Interests
Oil and Gas
Ports and Harbours
Power Interconnectors
Recreational Boating
Shipping
Social and Community
Telecom Cables
Tourism
Waste Disposal
Water Sports
6.2 Aquaculture
6.2.1 Regional Activity
Marine aquaculture sites within the North Region are shown in Figure 119, where there are 120 finfish and 83 shellfish sites with a number being located along the coastline of the Orkney Islands and in particular the Shetland Islands.
6.2.2 Regional Economic Value and Employment
Regional employment figures for activities relating to marine aquaculture in the North are listed below in Table 144. Total employment figures for this sector grew by approximately 30% between 2009 and 2010.

Socio-economic Baseline Reviews for Offshore Renewables in Scottish Waters
R4032/3 182 R.1905
Table 144. North employment figures for activities relating to marine aquaculture
SIC, 2007 Full-time Employees Part-time Employees
2009 2010 2009 2009
Marine aquaculture (SIC 03210) 248 299 20 83
(Source: ONS, 2011)
6.2.3 Future Trends No regional detail on future trends were available, please refer to Section 2.2.3 for national projections
6.3 Aviation
6.3.1 Regional Activity Airports in this region include the „minor‟ airports of Kirkwall in Orkney and Sumburgh, Lerwick and Scatsta in the Shetland Islands (Figure 3). The number of ATMs, passengers (terminal and transit) and freight movements through each airport are shown in 145.
Table 145. Summary of activity at Scottish airports in the North Region
Airports ATMs Terminal
Passengers Transit
Passengers Freight
(tonnes)
Kirkwall 13,849 138,383 11,960 89
Sumburgh 8,435 139,146 1,568 53
Lerwick 2,011 4,709 0 0
Scatsta 12,704 269,754 347 752 ATM = Air Transport Movements. All totals include scheduled and chartered flights.
(Source: CAA, 2011) 6.3.2 Regional Economic Value and Employment
The value of this industry to the economy of the region was unavailable, as were figures for employment..
6.3.3 Future Trends There is no specific information on future trends for this region. For national projections refer to Section 2.3.3.
6.4 Carbon Capture and Storage
6.4.1 Regional Activity The hydrocarbon fields and saline aquifers identified by SCCS (2009) as having the potential to store CO2 in the North SORER region are shown below in Tables 146 and 147 respectively. The location of these potential CO2 storage sites are shown in Figure 120. CO2 storage in hydrocarbon fields cannot begin until hydrocarbon production ceases and the „close of production‟ year for the hydrocarbon fields are shown in Table 164, based on past production
Socio-economic Baseline Reviews for Offshore Renewables in Scottish Waters
R4032/3 183 R.1905
data (SCSS, 2009). In Table 200, the range in storage capacity of the saline aquifers relates to the percentage of the total pore volume available for CO2 storage. The significance of the storage capacity of the potential sites in this region, combined with potential CCS sites in the North East Region, is discussed in the CCS National overview. Table 146. Hydrocarbon fields assessed as having potential for CO2 storage alone
in the North Region
Field Name Close of Hydrocarbon
Production (year) Average Water Depth
of Field Estimated CO2 Storage (Mt)
Brae North GC 2015 + 99 + 52
Brae East GC 2020 = 116 = 111
Bruce GC 2020 = 122 = 197
Frigg (UK) Gas Field 2008 + 112 = 171
Brent Oil Field 2015 + 140 = 456
Total estimated storage capacity
987
GC = Gas Condensate field; + parameter is technically or economically feasible; = parameter is technically or economically borderline.
(Source, SCCS, 2009) Table 147. Saline aquifers that meet both geotechnical and storage capacity
requirements in the North Region
Saline Aquifer Area (km²) CO2 Storage Capacity
(0.2% Storage Efficiency) (Mt)
CO2 Storage Capacity (2% Storage
Efficiency) (Mt)
Grid + 17147 785 7847
Balder + 6251 347 3465
Flugga + 1926 61 611
Frigg + 1712 58 575
Helmdal = 11065 618 6177
Total storage capacity (Mt) 1312 18,675 + Meets best practise geotechnical requirements (for depth, permeability and porosity); = meets minimum geotechnical requirements
(Source: SCCS, 2009)
6.4.2 Regional Economic Value and Employment
It is not currently possible to attribute economic values to sea areas for future CO2 storage (Baxter et al, 2011). See Section 2.4.3 for estimates of the potential value of, and employment within, the emerging CCS sector at a national level.
6.4.3 Future Trends Further hydrocarbon fields or saline aquifers suitable for CO2 storage may yet be discovered (SCCS, 2009). There is no specific information on future trends for this region. For national projections refer to Section 2.4.3.
Socio-economic Baseline Reviews for Offshore Renewables in Scottish Waters
R4032/3 184 R.1905
6.5 Commercial Fisheries
6.5.1 Regional Activity 6.5.1.1 Fish catching activities Landings caught by UK vessels within the North SORER had an average annual value of £162 million (42.4% of the Scottish total) and an average annual live weight of 209,200 tonnes (48.8% of the Scottish total) for the ten year period from 2001 to 2010. Figures 121 to 124 show the annual average value (2001 to 2010) of the total landings taken from within this region, broken down for each ICES rectangle by species group, selected species, gear type and vessel length. Figures 125 to 127 show the value of all landings caught in the inshore and offshore waters of the West SORER waters by selected species, gear type and vessel length categories from 2001 to 2010. The type of species landings from within the North SORER differ significantly between inshore / offshore waters and between different locations within this region. Inshore, and particularly around the islands, shellfish account for the majority of the value and volume of species landed whereas offshore, the value and volume of landings are mainly pelagic and demersal species. Inshore, landings of scallops and other shellfish (excluding Nephrops) accounted for 57% of the total catch value in 2010 whilst demersal species made up 26% and pelagic species made up 16% of the total catch value. Offshore, landings of mackerel accounted for 36% of the total catch value in 2010, 27% were monkfish haddock and cod (combined), 11% were other whitefish, and herring and Nephrops each accounted for 9% of the total catch value. In 2010, 41% of the value of landings from inshore waters were taken by vessels 10m and under in length, and 46% were landed by vessels 15m and over; whereas offshore, 94% were landed by vessels 15m and over. For inshore waters, 34% of the total catch value was taken by pots, 26% by demersal trawl, 18% by dredges and 15% by pelagic trawl; whereas for offshore waters, 45% was taken by pelagic trawls and 37% by demersal trawls. Figures 128 and 129 show all the overflight (surveillance) sightings by vessel type and nationality in the region from 2006 to 2010. 52% of the national fishing effort occurs within the North Region with British vessels making up 78% of the sightings. Norwegian, Danish and French vessels account for a further 15%. 80% of the vessels fishing in the area are demersal trawlers with 7% being pelagic trawlers. The fishing is evenly distributed out the deep water where limited sightings have been recorded. The main administrative fishing ports in this region are Scrabster, Kirkwall (Orkney) and Lerwick (Shetland) and there are also 28 smaller ports throughout the region. All the ports are shown in Figure 130.
Socio-economic Baseline Reviews for Offshore Renewables in Scottish Waters
R4032/3 185 R.1905
6.5.1.2 Fish processing activities Shetland has the largest pelagic processing factory of its kind in Europe, Shetland Catch, which is based in Lerwick. Shetland also has a whitefish and wild shellfish processing factory in Scalloway among several other smaller processing units serving the local economy. The majority of Shetland whitefish is traded on to mainland businesses. Orkney has one of Europe‟s largest and most sophisticated crab processing factories, based in Stromness. It is operated by a cooperative, the Orkney Fishermen's Society, with over 75% of local crab fishermen belonging to it and employs 70 people onshore. The new factory, which was built in the mid 1990s, initially handled 200 tonnes of crab a year, but it has been extended many times since then and capacity has increased ten-fold (Reid, 2010). One of the reasons for its success is that it has largely been funded by the fishermen themselves and shareholders in the wider community who support them. 6.5.1.3 Wild salmon and sea trout There is one fixed engine, located on the North coast near Thurso, and no net and coble netting sites in the North SORER (see Figure 130). The main rod and line fishing rivers in this region are the Thurso (salmon) Halladale (salmon), Naver (salmon and sea trout), Borgie (salmon), Dionard (salmon and sea trout), Laxford (salmon). Stocks of sea rout have declined dramatically in the Laxford in the last twenty years (Gray J., 2009).
6.5.2 Regional Economic Value and Employment 6.5.2.1 Fish catching activities The North SORER is covered by the administrative ports of Scrabster, Kirkwall (Orkney) and Lerwick (Shetland). There are 1025 fishermen employed on Scottish based vessels in these districts (857 of these are based in Orkney and Shetland); 676 of these are employed full-time and 349 are part-time. There are 466 active vessels registered in these districts, 355 of which are 10m and under in length. Shetland is heavily dependent on the fishing industry and has 6% of the total employment in the catching sector in Scotland. The islands of Shetland, Orkney and the Western Isles combined account for 22% of the total catching employment in Scotland. Direct employment in the fishing sector has a whole accounts for between 5% and 10% in Shetland (Baxter et al., 2011) In the coastal Travel-to-Work area of Shetland, fisheries dependent employment (which includes direct employment in the fish catching, farming and processing sectors and indirect employment and induced impacts as a result of the demand for goods and services required by the fisheries sector) is estimated to account around 2 and 10% of all local jobs (Baxter et al., 2011).

Socio-economic Baseline Reviews for Offshore Renewables in Scottish Waters
R4032/3 186 R.1905
6.5.2.2 Fish processing activities For the North SORER, the largest concentration of employment in this sector is in Shetland. Rationalisation and downsizing of the processing industry has taken place in Shetland. Today only one major firm survives, together with several smaller businesses supplying the local market. The ONS (2011) and Employment Survey statistics for processing activities in the North SORER are shown in Table 148. Table 148. Employment in fish and shellfish processing and retail in the North
SORER
SIC, 2007
Full-time Employment
Part-time Employment
Total Employment
2009 2010 2009 2010 2009 2010
Processing and preserving of fish, crustaceans and molluscs (SIC 10200)
447 482 64 140 512 622
(Source: ONS, 2011)
6.5.2.3 Wild salmon and sea trout There is no specific information on economic value and employment for this region. For a national overview refer to Section 2.6.3.
6.5.3 Future Trends There is no specific information on future trends for this region. For national projections refer to Section 2.6.3.
6.6 Energy Generation
6.6.1 Regional Activity There is no specific information on activity for this region. The North does not host any major power stations, and it is not possible to identify the power stations from which the region obtains its electricity50. Hunterston B nuclear power station is located within this region, south of Largs in Ayrshire. The power station started generating in 1976, and is expected to be decommissioned in 2016. It has a net electrical output of 890MW.
6.6.2 Regional Economic Value and Employment Information on regional economic value for energy generation is not available; data on electricity generation and supply are very limited due to security issues.
50 Note that such information is not given out by power companies for security reasons.

Socio-economic Baseline Reviews for Offshore Renewables in Scottish Waters
R4032/3 187 R.1905
Direct employment in the electricity sector in the North Region can be estimated through looking at statistics from the ONS (2011) and Employment Survey. Figures for 2009 and 2010 for full and part time work under several relevant codes are given in Table 149. Although the number of jobs directly supported by the electricity sector is reasonably low, it is assumed that there will be other jobs in the wider energy generation sector, for example, jobs in research and associated activities. Table 149. Employment in the electricity sector in North by SIC Code
SIC Code, 2007 Full-time Part-time Totals
2009 2010 2009 2010 2009 2010
Production of electricity (3511) 48 202 3 12 51 211
Transmission of electricity (3512) 0 0 0 0 0 0
Distribution of electricity (3513) 48 51 7 8 55 59
Trade of electricity (3514) 0 0 0 0 0 0
Construction of utility projects for electricity and telecommunications (4222)
0 4 0 0 0 4
Electrical installation (4321) 117 108 6 4 124 116
Totals (Note that totals may not sum exactly due to rounding)
213 365 16 24 230 390
(Source: ONS, 2011)
6.6.3 Future Trends Although the data indicate that there are currently no jobs in the transmission of electricity sector, both tidal and wave devices are being tested within the North Region at the EMEC nursery sites (see Figure 131). The area also includes the Pentland Firth and Orkney Waters (PFOW) Strategic Area. The advent of offshore renewables could therefore lead to employment opportunities, as well as an increase in the number of jobs dependent on the wider energy generation sector, for example, engineering activities and related technical consultancy, and service activities incidental to water transport. Once renewable devices are established, the number of jobs relating to the production of electricity will be boosted.
6.7 Military Interests
6.7.1 Regional Activity The coastal military locations which occur within this region are shown in Figure 132. Military interests in this region include: Cape Wrath official gunnery and bombing range, mainly used for live gunnery practise
by the Royal Navy and allied navies and for live bombing practise by the RAF and the Fleet Air Arm (FAA); and
A „firing danger‟ and „other‟ exercise area to the East of Orkney (which extends into the North East SORER).
Socio-economic Baseline Reviews for Offshore Renewables in Scottish Waters
R4032/3 188 R.1905
6.7.2 Regional Economic Value and Employment The MOD Quarterly Manning Report (Defence Personnel by location) issued in August 2011, provides the number of MOD personnel (civilian and military) employed in each LA area at 1 July 2011 (MOD, 2011a). Four of these LAs fall entirely or partially within the North Region and the number of MOD personnel which are employed within each of these LA areas is shown in Table 150. However, as the LA areas do not align with the SORER boundaries, the values should only be taken as indicative values for comparison between areas. Table 150. MOD personnel by local authority areas which lie within the North
Region
Local Authority (LA) Area
SORER* MOD total Civilian Military
Orkney Islands N 0 0 0
Shetland Islands N 10 0 10
Highland NE, NW, N 680 600 80 * Note LAs may occur within more than one SORER. Where this is the case, the SORER containing the largest proportion of the LA
(visually assessed) is listed first, and subsequent SORERs contain decreasing proportions of the LA; „&‟ indicates that the LA appears to occupy roughly equal proportions of more than one SORERs.
(Source: MOD, 2011a) 6.7.3 Future Trends
There is no specific information on future trends for this region. For national projections refer to Section 2.8.3.
6.8 Oil and Gas
6.8.1 Regional Activity In this region, Oil and Gas activity is concentrated in offshore waters to the East and West of the Shetlands and to the East of the Orkney Islands (i.e. along the Eastern and Western borders of the SORER). Oil and Gas pipelines connect these areas of high activity with the Shetlands, Orkney and Aberdeen (in the North East SORER). There are 65 producing hydrocarbon fields in this region (51 producing oil; 4 gas and 10 condensate) (DECC website51), see Figure 133. Information on the annual production of crude oil from hydrocarbon fields in the UKCS are provided by DECC52. Based on this data, the quantities of crude oil produced from hydrocarbon fields located within the North SORER between 2008-2010 are shown in Table 151 indicative estimates of the total production of crude oil from hydrocarbon fields within this region was 18 million tonnes in 2008 and 2009 and 17 million tonnes in 2010 Gas production statistics are not allocated to hydrocarbon fields and hence it was not possible to estimate gas production from fields within this region.
51 http://og.decc.gov.uk/en/olgs/cms/explorationpro/explorationpro.aspx 52 https://www.og.decc.gov.uk/information/bb_updates/appendices/Appendix9.xls.
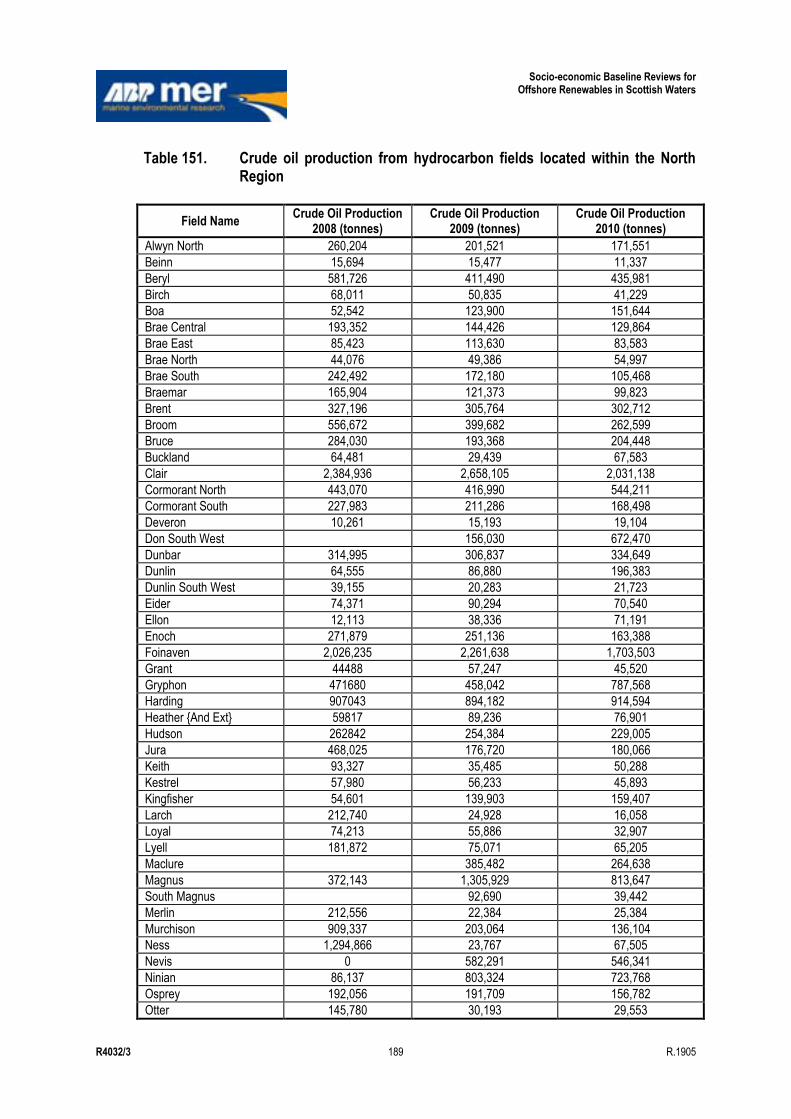
Socio-economic Baseline Reviews for Offshore Renewables in Scottish Waters
R4032/3 189 R.1905
Table 151. Crude oil production from hydrocarbon fields located within the North Region
Field Name Crude Oil Production
2008 (tonnes) Crude Oil Production
2009 (tonnes) Crude Oil Production
2010 (tonnes)
Alwyn North 260,204 201,521 171,551
Beinn 15,694 15,477 11,337
Beryl 581,726 411,490 435,981
Birch 68,011 50,835 41,229
Boa 52,542 123,900 151,644
Brae Central 193,352 144,426 129,864
Brae East 85,423 113,630 83,583
Brae North 44,076 49,386 54,997
Brae South 242,492 172,180 105,468
Braemar 165,904 121,373 99,823
Brent 327,196 305,764 302,712
Broom 556,672 399,682 262,599
Bruce 284,030 193,368 204,448
Buckland 64,481 29,439 67,583
Clair 2,384,936 2,658,105 2,031,138
Cormorant North 443,070 416,990 544,211
Cormorant South 227,983 211,286 168,498
Deveron 10,261 15,193 19,104
Don South West 156,030 672,470
Dunbar 314,995 306,837 334,649
Dunlin 64,555 86,880 196,383
Dunlin South West 39,155 20,283 21,723
Eider 74,371 90,294 70,540
Ellon 12,113 38,336 71,191
Enoch 271,879 251,136 163,388
Foinaven 2,026,235 2,261,638 1,703,503
Grant 44488 57,247 45,520
Gryphon 471680 458,042 787,568
Harding 907043 894,182 914,594
Heather {And Ext} 59817 89,236 76,901
Hudson 262842 254,384 229,005
Jura 468,025 176,720 180,066
Keith 93,327 35,485 50,288
Kestrel 57,980 56,233 45,893
Kingfisher 54,601 139,903 159,407
Larch 212,740 24,928 16,058
Loyal 74,213 55,886 32,907
Lyell 181,872 75,071 65,205
Maclure 385,482 264,638
Magnus 372,143 1,305,929 813,647
South Magnus 92,690 39,442
Merlin 212,556 22,384 25,384
Murchison 909,337 203,064 136,104
Ness 1,294,866 23,767 67,505
Nevis 0 582,291 546,341
Ninian 86,137 803,324 723,768
Osprey 192,056 191,709 156,782
Otter 145,780 30,193 29,553
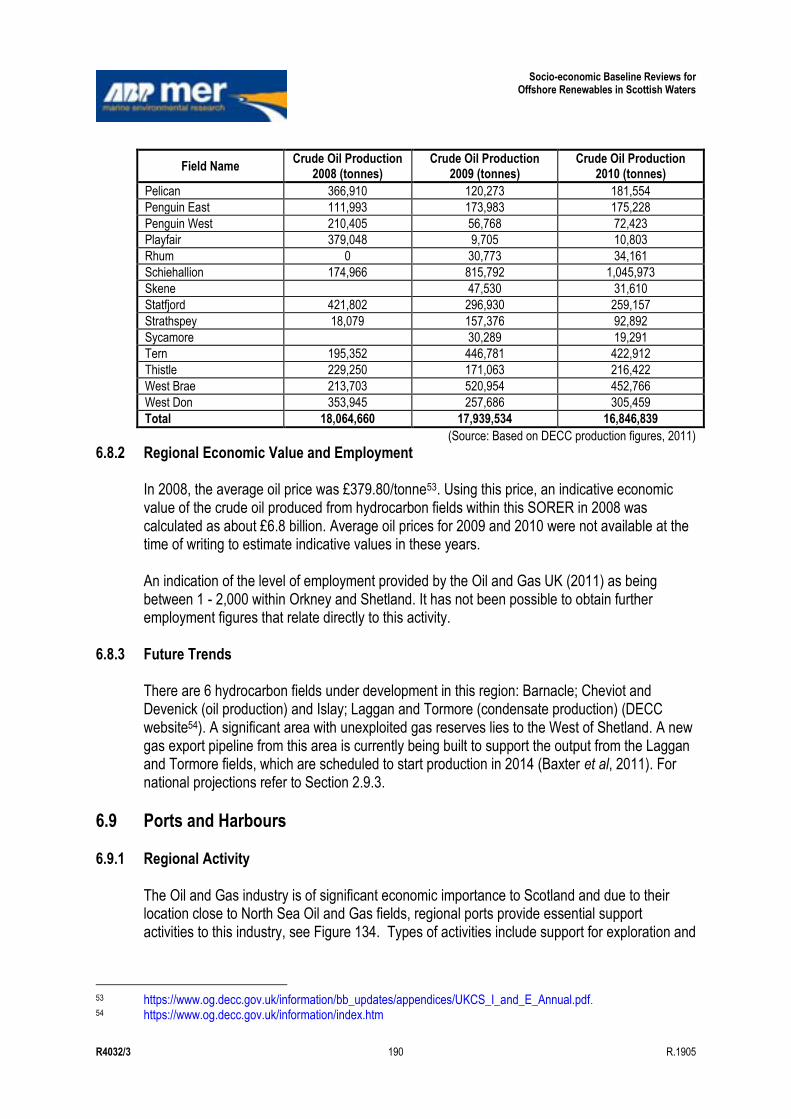
Socio-economic Baseline Reviews for Offshore Renewables in Scottish Waters
R4032/3 190 R.1905
Field Name Crude Oil Production
2008 (tonnes) Crude Oil Production
2009 (tonnes) Crude Oil Production
2010 (tonnes)
Pelican 366,910 120,273 181,554
Penguin East 111,993 173,983 175,228
Penguin West 210,405 56,768 72,423
Playfair 379,048 9,705 10,803
Rhum 0 30,773 34,161
Schiehallion 174,966 815,792 1,045,973
Skene 47,530 31,610
Statfjord 421,802 296,930 259,157
Strathspey 18,079 157,376 92,892
Sycamore 30,289 19,291
Tern 195,352 446,781 422,912
Thistle 229,250 171,063 216,422
West Brae 213,703 520,954 452,766
West Don 353,945 257,686 305,459
Total 18,064,660 17,939,534 16,846,839
(Source: Based on DECC production figures, 2011) 6.8.2 Regional Economic Value and Employment
In 2008, the average oil price was £379.80/tonne53. Using this price, an indicative economic value of the crude oil produced from hydrocarbon fields within this SORER in 2008 was calculated as about £6.8 billion. Average oil prices for 2009 and 2010 were not available at the time of writing to estimate indicative values in these years. An indication of the level of employment provided by the Oil and Gas UK (2011) as being between 1 - 2,000 within Orkney and Shetland. It has not been possible to obtain further employment figures that relate directly to this activity.
6.8.3 Future Trends There are 6 hydrocarbon fields under development in this region: Barnacle; Cheviot and Devenick (oil production) and Islay; Laggan and Tormore (condensate production) (DECC website54). A significant area with unexploited gas reserves lies to the West of Shetland. A new gas export pipeline from this area is currently being built to support the output from the Laggan and Tormore fields, which are scheduled to start production in 2014 (Baxter et al, 2011). For national projections refer to Section 2.9.3.
6.9 Ports and Harbours
6.9.1 Regional Activity The Oil and Gas industry is of significant economic importance to Scotland and due to their location close to North Sea Oil and Gas fields, regional ports provide essential support activities to this industry, see Figure 134. Types of activities include support for exploration and
53 https://www.og.decc.gov.uk/information/bb_updates/appendices/UKCS_I_and_E_Annual.pdf. 54 https://www.og.decc.gov.uk/information/index.htm
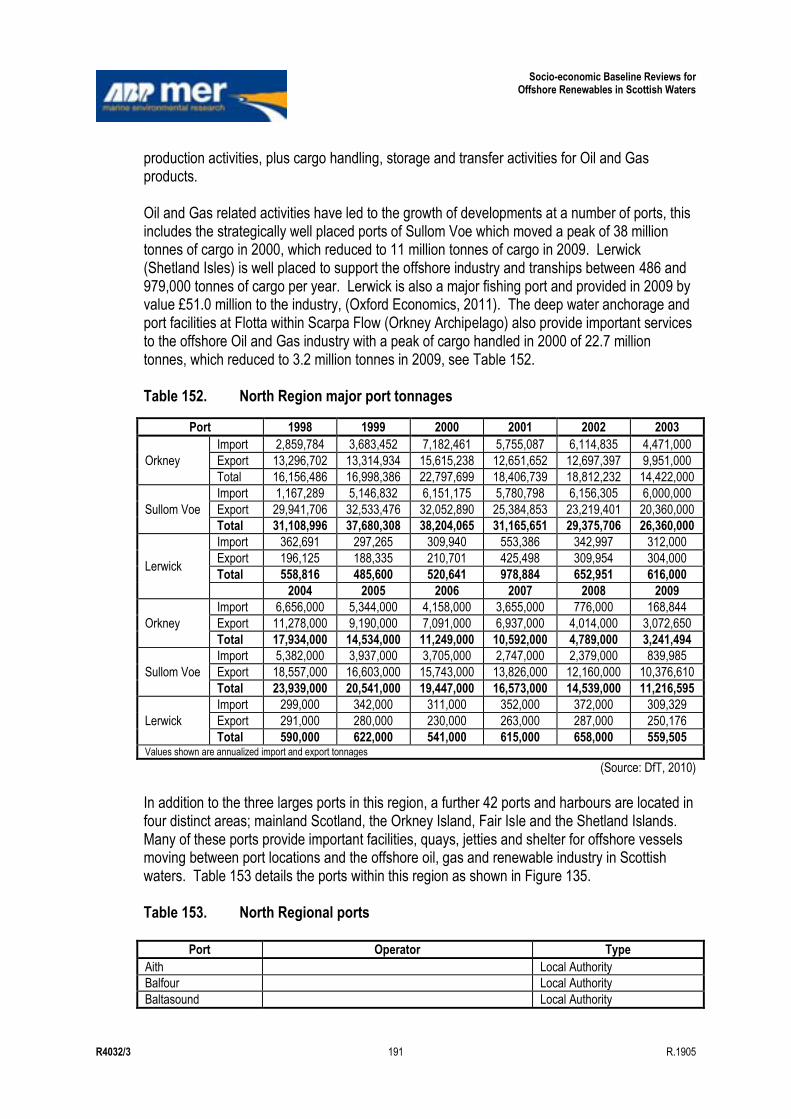
Socio-economic Baseline Reviews for Offshore Renewables in Scottish Waters
R4032/3 191 R.1905
production activities, plus cargo handling, storage and transfer activities for Oil and Gas products. Oil and Gas related activities have led to the growth of developments at a number of ports, this includes the strategically well placed ports of Sullom Voe which moved a peak of 38 million tonnes of cargo in 2000, which reduced to 11 million tonnes of cargo in 2009. Lerwick (Shetland Isles) is well placed to support the offshore industry and tranships between 486 and 979,000 tonnes of cargo per year. Lerwick is also a major fishing port and provided in 2009 by value £51.0 million to the industry, (Oxford Economics, 2011). The deep water anchorage and port facilities at Flotta within Scarpa Flow (Orkney Archipelago) also provide important services to the offshore Oil and Gas industry with a peak of cargo handled in 2000 of 22.7 million tonnes, which reduced to 3.2 million tonnes in 2009, see Table 152. Table 152. North Region major port tonnages
Port 1998 1999 2000 2001 2002 2003
Orkney
Import 2,859,784 3,683,452 7,182,461 5,755,087 6,114,835 4,471,000
Export 13,296,702 13,314,934 15,615,238 12,651,652 12,697,397 9,951,000
Total 16,156,486 16,998,386 22,797,699 18,406,739 18,812,232 14,422,000
Sullom Voe
Import 1,167,289 5,146,832 6,151,175 5,780,798 6,156,305 6,000,000
Export 29,941,706 32,533,476 32,052,890 25,384,853 23,219,401 20,360,000
Total 31,108,996 37,680,308 38,204,065 31,165,651 29,375,706 26,360,000
Lerwick
Import 362,691 297,265 309,940 553,386 342,997 312,000
Export 196,125 188,335 210,701 425,498 309,954 304,000
Total 558,816 485,600 520,641 978,884 652,951 616,000
2004 2005 2006 2007 2008 2009
Orkney
Import 6,656,000 5,344,000 4,158,000 3,655,000 776,000 168,844
Export 11,278,000 9,190,000 7,091,000 6,937,000 4,014,000 3,072,650
Total 17,934,000 14,534,000 11,249,000 10,592,000 4,789,000 3,241,494
Sullom Voe
Import 5,382,000 3,937,000 3,705,000 2,747,000 2,379,000 839,985
Export 18,557,000 16,603,000 15,743,000 13,826,000 12,160,000 10,376,610
Total 23,939,000 20,541,000 19,447,000 16,573,000 14,539,000 11,216,595
Lerwick
Import 299,000 342,000 311,000 352,000 372,000 309,329
Export 291,000 280,000 230,000 263,000 287,000 250,176
Total 590,000 622,000 541,000 615,000 658,000 559,505 Values shown are annualized import and export tonnages
(Source: DfT, 2010) In addition to the three larges ports in this region, a further 42 ports and harbours are located in four distinct areas; mainland Scotland, the Orkney Island, Fair Isle and the Shetland Islands. Many of these ports provide important facilities, quays, jetties and shelter for offshore vessels moving between port locations and the offshore oil, gas and renewable industry in Scottish waters. Table 153 details the ports within this region as shown in Figure 135. Table 153. North Regional ports
Port Operator Type
Aith Local Authority
Balfour Local Authority
Baltasound Local Authority
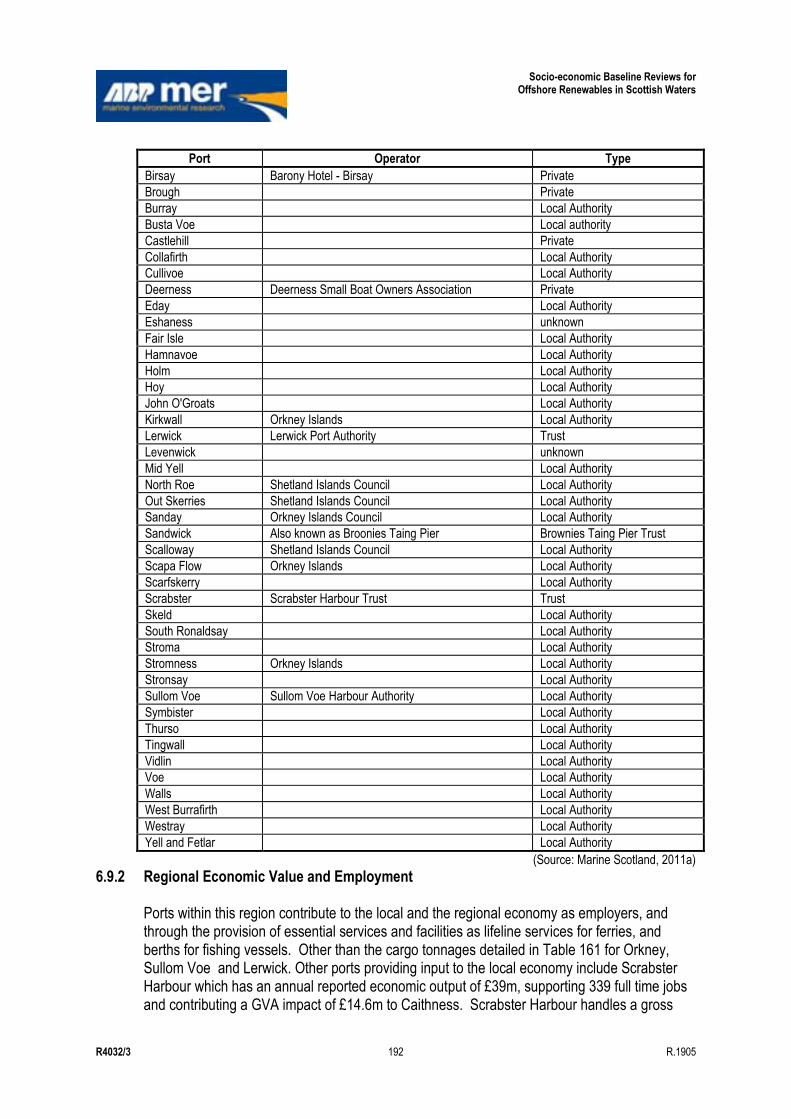
Socio-economic Baseline Reviews for Offshore Renewables in Scottish Waters
R4032/3 192 R.1905
Port Operator Type
Birsay Barony Hotel - Birsay Private
Brough Private
Burray Local Authority
Busta Voe Local authority
Castlehill Private
Collafirth Local Authority
Cullivoe Local Authority
Deerness Deerness Small Boat Owners Association Private
Eday Local Authority
Eshaness unknown
Fair Isle Local Authority
Hamnavoe Local Authority
Holm Local Authority
Hoy Local Authority
John O'Groats Local Authority
Kirkwall Orkney Islands Local Authority
Lerwick Lerwick Port Authority Trust
Levenwick unknown
Mid Yell Local Authority
North Roe Shetland Islands Council Local Authority
Out Skerries Shetland Islands Council Local Authority
Sanday Orkney Islands Council Local Authority
Sandwick Also known as Broonies Taing Pier Brownies Taing Pier Trust
Scalloway Shetland Islands Council Local Authority
Scapa Flow Orkney Islands Local Authority
Scarfskerry Local Authority
Scrabster Scrabster Harbour Trust Trust
Skeld Local Authority
South Ronaldsay Local Authority
Stroma Local Authority
Stromness Orkney Islands Local Authority
Stronsay Local Authority
Sullom Voe Sullom Voe Harbour Authority Local Authority
Symbister Local Authority
Thurso Local Authority
Tingwall Local Authority
Vidlin Local Authority
Voe Local Authority
Walls Local Authority
West Burrafirth Local Authority
Westray Local Authority
Yell and Fetlar Local Authority
(Source: Marine Scotland, 2011a) 6.9.2 Regional Economic Value and Employment
Ports within this region contribute to the local and the regional economy as employers, and through the provision of essential services and facilities as lifeline services for ferries, and berths for fishing vessels. Other than the cargo tonnages detailed in Table 161 for Orkney, Sullom Voe and Lerwick. Other ports providing input to the local economy include Scrabster Harbour which has an annual reported economic output of £39m, supporting 339 full time jobs and contributing a GVA impact of £14.6m to Caithness. Scrabster Harbour handles a gross
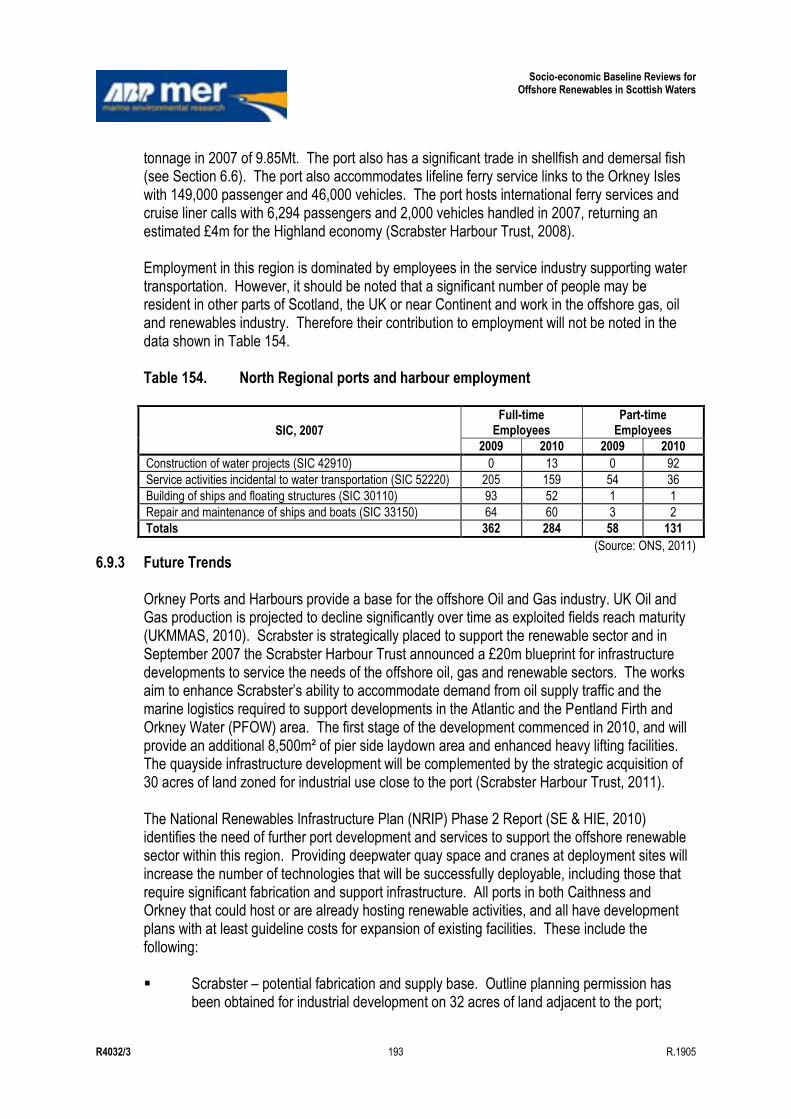
Socio-economic Baseline Reviews for Offshore Renewables in Scottish Waters
R4032/3 193 R.1905
tonnage in 2007 of 9.85Mt. The port also has a significant trade in shellfish and demersal fish (see Section 6.6). The port also accommodates lifeline ferry service links to the Orkney Isles with 149,000 passenger and 46,000 vehicles. The port hosts international ferry services and cruise liner calls with 6,294 passengers and 2,000 vehicles handled in 2007, returning an estimated £4m for the Highland economy (Scrabster Harbour Trust, 2008). Employment in this region is dominated by employees in the service industry supporting water transportation. However, it should be noted that a significant number of people may be resident in other parts of Scotland, the UK or near Continent and work in the offshore gas, oil and renewables industry. Therefore their contribution to employment will not be noted in the data shown in Table 154. Table 154. North Regional ports and harbour employment
SIC, 2007
Full-time Employees
Part-time Employees
2009 2010 2009 2010
Construction of water projects (SIC 42910) 0 13 0 92
Service activities incidental to water transportation (SIC 52220) 205 159 54 36
Building of ships and floating structures (SIC 30110) 93 52 1 1
Repair and maintenance of ships and boats (SIC 33150) 64 60 3 2
Totals 362 284 58 131
(Source: ONS, 2011) 6.9.3 Future Trends
Orkney Ports and Harbours provide a base for the offshore Oil and Gas industry. UK Oil and Gas production is projected to decline significantly over time as exploited fields reach maturity (UKMMAS, 2010). Scrabster is strategically placed to support the renewable sector and in September 2007 the Scrabster Harbour Trust announced a £20m blueprint for infrastructure developments to service the needs of the offshore oil, gas and renewable sectors. The works aim to enhance Scrabster‟s ability to accommodate demand from oil supply traffic and the marine logistics required to support developments in the Atlantic and the Pentland Firth and Orkney Water (PFOW) area. The first stage of the development commenced in 2010, and will provide an additional 8,500m² of pier side laydown area and enhanced heavy lifting facilities. The quayside infrastructure development will be complemented by the strategic acquisition of 30 acres of land zoned for industrial use close to the port (Scrabster Harbour Trust, 2011). The National Renewables Infrastructure Plan (NRIP) Phase 2 Report (SE & HIE, 2010) identifies the need of further port development and services to support the offshore renewable sector within this region. Providing deepwater quay space and cranes at deployment sites will increase the number of technologies that will be successfully deployable, including those that require significant fabrication and support infrastructure. All ports in both Caithness and Orkney that could host or are already hosting renewable activities, and all have development plans with at least guideline costs for expansion of existing facilities. These include the following: Scrabster – potential fabrication and supply base. Outline planning permission has
been obtained for industrial development on 32 acres of land adjacent to the port;

Socio-economic Baseline Reviews for Offshore Renewables in Scottish Waters
R4032/3 194 R.1905
Lyness – potential fabrication and supply base. Initial refurbishment of the former naval base has been completed with potential for further industrial development;
Kirkwall Pier – potential fabrication and supply base; Hatston Pier – potential fabrication and supply base. Work to extend the pier is
scheduled to commence in October 2011; Stromness Pier – potential small support vessel base. Subject to planning permission,
a new Pier of approximately 110 metres will be built at Copeland‟s Dock in Stromness commencing in the late autumn of 2011;
Gills Bay – potential base for large support and supply vessels; and St Margaret‟s Hope – potential base for small support vessels. Lead times vary, but the NRIP Phase 2 Report (SE & HIE, 2010) suggests three years to delivery should be allowed for, which includes obtaining planning permissions and financing. The NRIP Phase 2 report further suggests that larger scale deployments scheduled from 2017 onwards will need to be determined by 2013, with work needing to begin by 2014 at the latest. For the purposes of providing indicate phasing timelines for port development, the NRIP Phase 2 Report (SE & HIE, 2010) suggested: 2011-2015 – immediate needs being for deployment of devices at EMEC and other
testing facilities, before moving on to the deployment of small scale arrays at sites identified in the PFOW area. This includes survey work undertaken by various types of inshore and offshore survey vessels, predominantly multi-cats (20metres in length) and small workboats (10metres in length). Stromness is likely to be used for the largest number of sites given sailing times and specialist workforce location. Hatston and Kirkwall Harbours could also be used for Northerly sites, and Scrabster Harbour and Gills Bay providing mainland facilities for the Pentland Firth. Wick is already hosting survey work boats for offshore wind, and depending on which companies win the Environmental Impact Assessment contracts, White Head (Loch Eriboll) may be used.
2016-2020 – assuming the continuing progression of technology development and subject to the necessary grid infrastructure being in place, the industry will move towards deployment of arrays. Considerable associated port infrastructure will be required, the exact specifications for that infrastructure is not yet established, but will be clarified as the technology progresses and financial commitments to grid infrastructure, device manufacture and support vessels are made.
2020 onwards – operations and maintenance of installed devices. This activity, for economic and operation reasons, will need to be supported near the development sites. Port facilities to service this requirement will be sought ideally within four hours sailing time.
6.10 Power Interconnectors
6.10.1 Regional Activity Numerous domestic subsea power cables exist in this region, connecting the North coast of Scotland and Orkney and islands within the Shetland Islands (Figure 136).
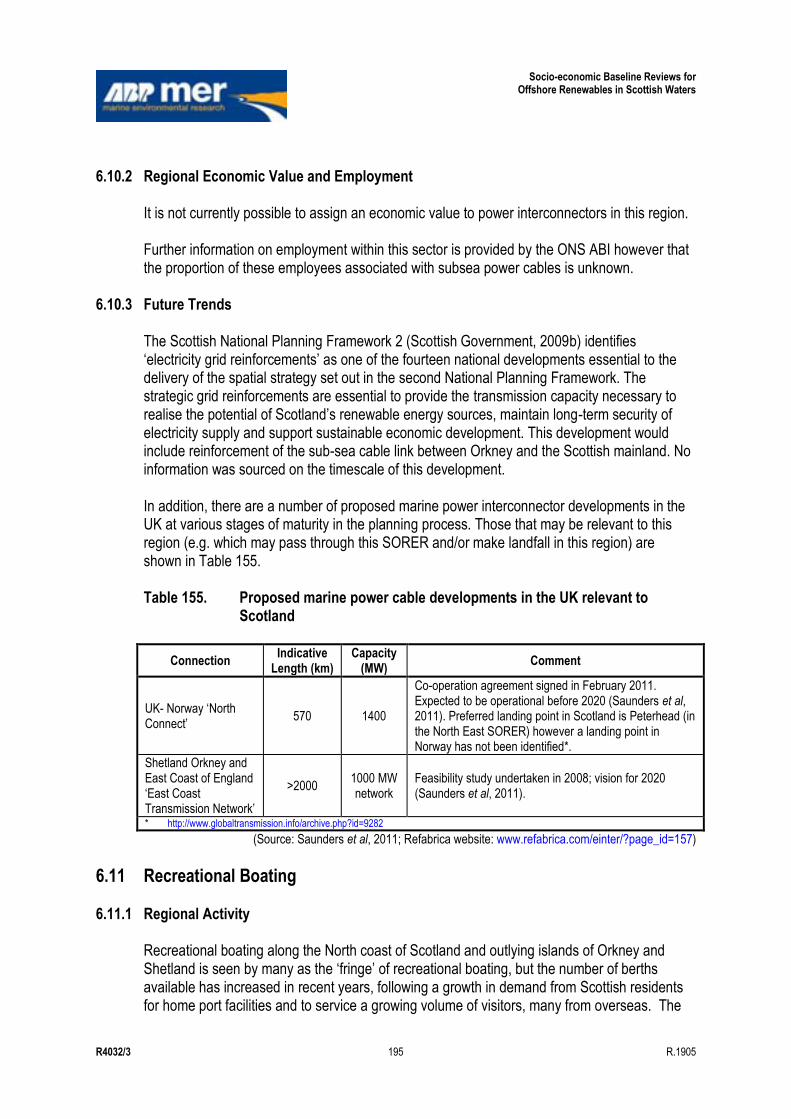
Socio-economic Baseline Reviews for Offshore Renewables in Scottish Waters
R4032/3 195 R.1905
6.10.2 Regional Economic Value and Employment
It is not currently possible to assign an economic value to power interconnectors in this region. Further information on employment within this sector is provided by the ONS ABI however that the proportion of these employees associated with subsea power cables is unknown.
6.10.3 Future Trends The Scottish National Planning Framework 2 (Scottish Government, 2009b) identifies „electricity grid reinforcements‟ as one of the fourteen national developments essential to the delivery of the spatial strategy set out in the second National Planning Framework. The strategic grid reinforcements are essential to provide the transmission capacity necessary to realise the potential of Scotland‟s renewable energy sources, maintain long-term security of electricity supply and support sustainable economic development. This development would include reinforcement of the sub-sea cable link between Orkney and the Scottish mainland. No information was sourced on the timescale of this development. In addition, there are a number of proposed marine power interconnector developments in the UK at various stages of maturity in the planning process. Those that may be relevant to this region (e.g. which may pass through this SORER and/or make landfall in this region) are shown in Table 155. Table 155. Proposed marine power cable developments in the UK relevant to
Scotland
Connection Indicative
Length (km) Capacity
(MW) Comment
UK- Norway „North Connect‟
570 1400
Co-operation agreement signed in February 2011. Expected to be operational before 2020 (Saunders et al, 2011). Preferred landing point in Scotland is Peterhead (in the North East SORER) however a landing point in Norway has not been identified*.
Shetland Orkney and East Coast of England „East Coast Transmission Network‟
>2000 1000 MW network
Feasibility study undertaken in 2008; vision for 2020 (Saunders et al, 2011).
* http://www.globaltransmission.info/archive.php?id=9282
(Source: Saunders et al, 2011; Refabrica website: www.refabrica.com/einter/?page_id=157)
6.11 Recreational Boating
6.11.1 Regional Activity Recreational boating along the North coast of Scotland and outlying islands of Orkney and Shetland is seen by many as the „fringe‟ of recreational boating, but the number of berths available has increased in recent years, following a growth in demand from Scottish residents for home port facilities and to service a growing volume of visitors, many from overseas. The
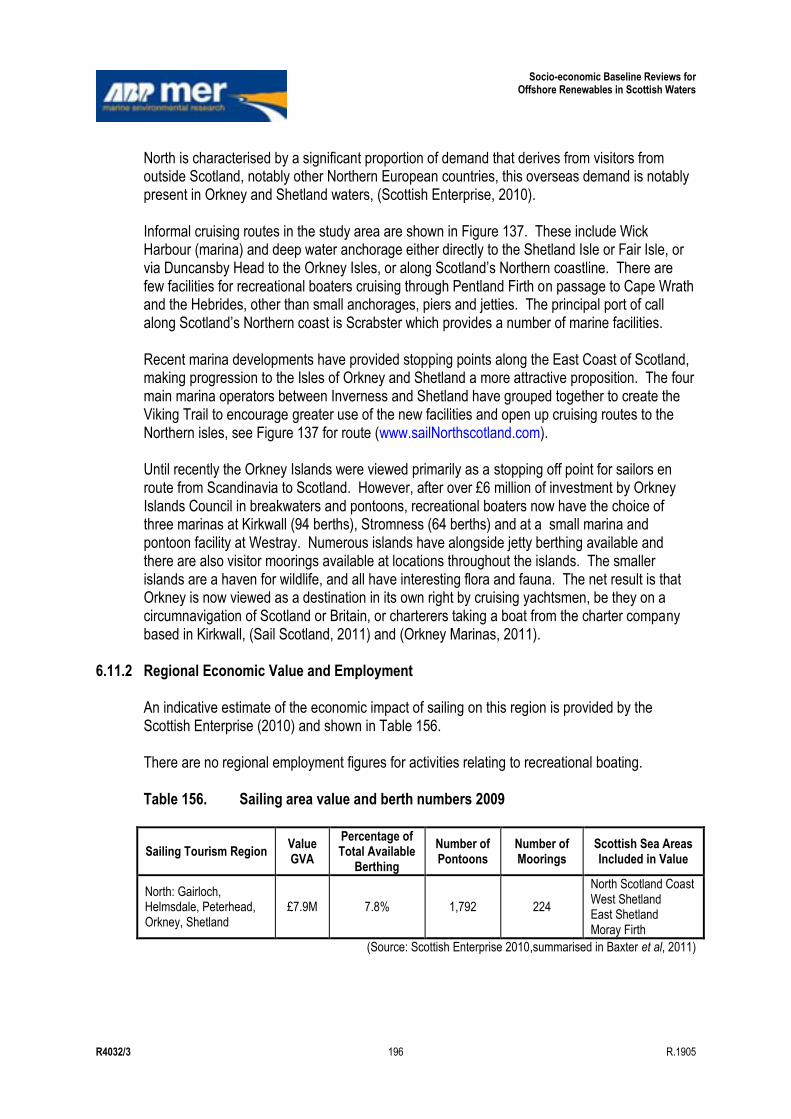
Socio-economic Baseline Reviews for Offshore Renewables in Scottish Waters
R4032/3 196 R.1905
North is characterised by a significant proportion of demand that derives from visitors from outside Scotland, notably other Northern European countries, this overseas demand is notably present in Orkney and Shetland waters, (Scottish Enterprise, 2010). Informal cruising routes in the study area are shown in Figure 137. These include Wick Harbour (marina) and deep water anchorage either directly to the Shetland Isle or Fair Isle, or via Duncansby Head to the Orkney Isles, or along Scotland‟s Northern coastline. There are few facilities for recreational boaters cruising through Pentland Firth on passage to Cape Wrath and the Hebrides, other than small anchorages, piers and jetties. The principal port of call along Scotland‟s Northern coast is Scrabster which provides a number of marine facilities. Recent marina developments have provided stopping points along the East Coast of Scotland, making progression to the Isles of Orkney and Shetland a more attractive proposition. The four main marina operators between Inverness and Shetland have grouped together to create the Viking Trail to encourage greater use of the new facilities and open up cruising routes to the Northern isles, see Figure 137 for route (www.sailNorthscotland.com). Until recently the Orkney Islands were viewed primarily as a stopping off point for sailors en route from Scandinavia to Scotland. However, after over £6 million of investment by Orkney Islands Council in breakwaters and pontoons, recreational boaters now have the choice of three marinas at Kirkwall (94 berths), Stromness (64 berths) and at a small marina and pontoon facility at Westray. Numerous islands have alongside jetty berthing available and there are also visitor moorings available at locations throughout the islands. The smaller islands are a haven for wildlife, and all have interesting flora and fauna. The net result is that Orkney is now viewed as a destination in its own right by cruising yachtsmen, be they on a circumnavigation of Scotland or Britain, or charterers taking a boat from the charter company based in Kirkwall, (Sail Scotland, 2011) and (Orkney Marinas, 2011).
6.11.2 Regional Economic Value and Employment An indicative estimate of the economic impact of sailing on this region is provided by the Scottish Enterprise (2010) and shown in Table 156. There are no regional employment figures for activities relating to recreational boating. Table 156. Sailing area value and berth numbers 2009
Sailing Tourism Region Value GVA
Percentage of Total Available
Berthing
Number of Pontoons
Number of Moorings
Scottish Sea Areas Included in Value
North: Gairloch, Helmsdale, Peterhead, Orkney, Shetland
£7.9M 7.8% 1,792 224
North Scotland Coast West Shetland East Shetland Moray Firth
(Source: Scottish Enterprise 2010,summarised in Baxter et al, 2011)
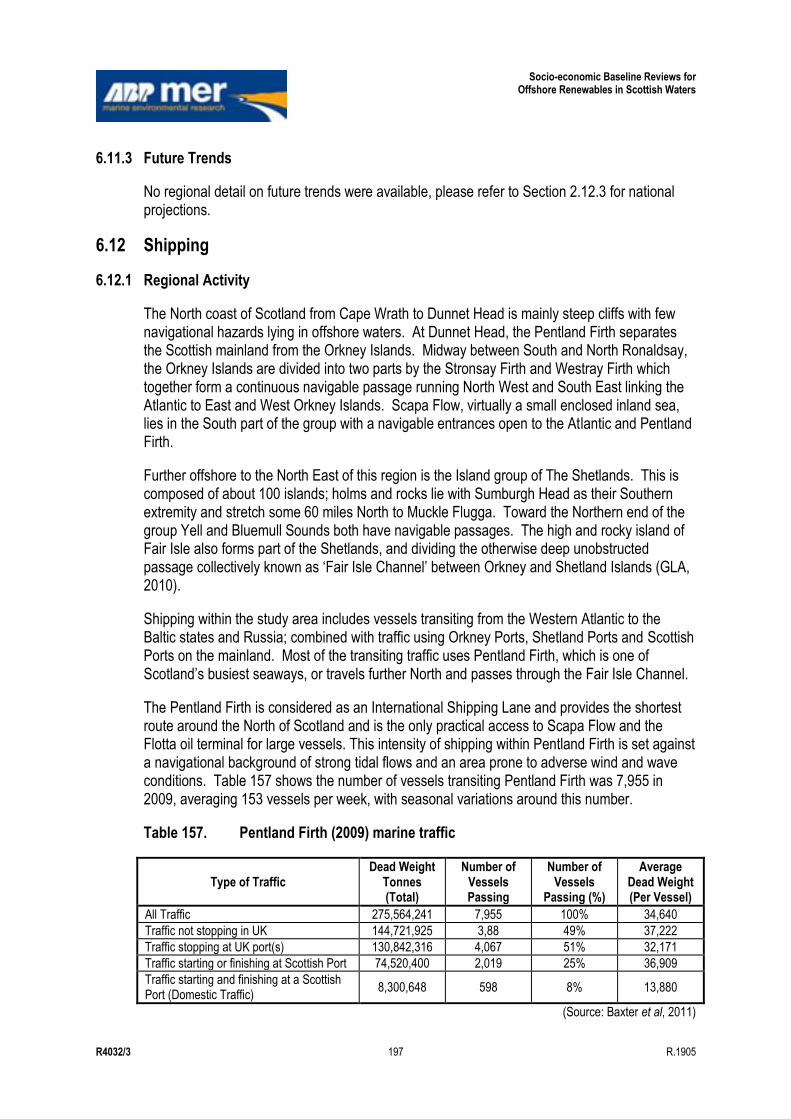
Socio-economic Baseline Reviews for Offshore Renewables in Scottish Waters
R4032/3 197 R.1905
6.11.3 Future Trends
No regional detail on future trends were available, please refer to Section 2.12.3 for national projections.
6.12 Shipping
6.12.1 Regional Activity
The North coast of Scotland from Cape Wrath to Dunnet Head is mainly steep cliffs with few navigational hazards lying in offshore waters. At Dunnet Head, the Pentland Firth separates the Scottish mainland from the Orkney Islands. Midway between South and North Ronaldsay, the Orkney Islands are divided into two parts by the Stronsay Firth and Westray Firth which together form a continuous navigable passage running North West and South East linking the Atlantic to East and West Orkney Islands. Scapa Flow, virtually a small enclosed inland sea, lies in the South part of the group with a navigable entrances open to the Atlantic and Pentland Firth.
Further offshore to the North East of this region is the Island group of The Shetlands. This is composed of about 100 islands; holms and rocks lie with Sumburgh Head as their Southern extremity and stretch some 60 miles North to Muckle Flugga. Toward the Northern end of the group Yell and Bluemull Sounds both have navigable passages. The high and rocky island of Fair Isle also forms part of the Shetlands, and dividing the otherwise deep unobstructed passage collectively known as „Fair Isle Channel‟ between Orkney and Shetland Islands (GLA, 2010).
Shipping within the study area includes vessels transiting from the Western Atlantic to the Baltic states and Russia; combined with traffic using Orkney Ports, Shetland Ports and Scottish Ports on the mainland. Most of the transiting traffic uses Pentland Firth, which is one of Scotland‟s busiest seaways, or travels further North and passes through the Fair Isle Channel.
The Pentland Firth is considered as an International Shipping Lane and provides the shortest route around the North of Scotland and is the only practical access to Scapa Flow and the Flotta oil terminal for large vessels. This intensity of shipping within Pentland Firth is set against a navigational background of strong tidal flows and an area prone to adverse wind and wave conditions. Table 157 shows the number of vessels transiting Pentland Firth was 7,955 in 2009, averaging 153 vessels per week, with seasonal variations around this number.
Table 157. Pentland Firth (2009) marine traffic
Type of Traffic Dead Weight
Tonnes (Total)
Number of Vessels Passing
Number of Vessels
Passing (%)
Average Dead Weight (Per Vessel)
All Traffic 275,564,241 7,955 100% 34,640
Traffic not stopping in UK 144,721,925 3,88 49% 37,222
Traffic stopping at UK port(s) 130,842,316 4,067 51% 32,171
Traffic starting or finishing at Scottish Port 74,520,400 2,019 25% 36,909
Traffic starting and finishing at a Scottish Port (Domestic Traffic)
8,300,648 598 8% 13,880
(Source: Baxter et al, 2011)
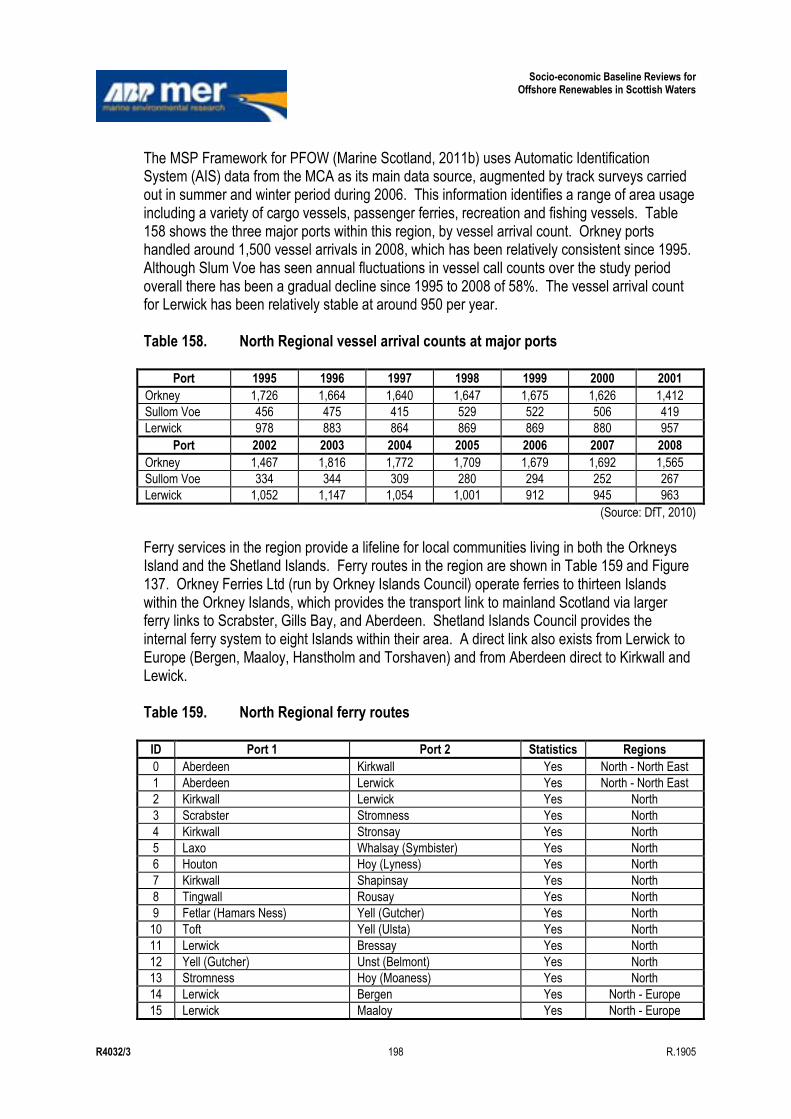
Socio-economic Baseline Reviews for Offshore Renewables in Scottish Waters
R4032/3 198 R.1905
The MSP Framework for PFOW (Marine Scotland, 2011b) uses Automatic Identification System (AIS) data from the MCA as its main data source, augmented by track surveys carried out in summer and winter period during 2006. This information identifies a range of area usage including a variety of cargo vessels, passenger ferries, recreation and fishing vessels. Table 158 shows the three major ports within this region, by vessel arrival count. Orkney ports handled around 1,500 vessel arrivals in 2008, which has been relatively consistent since 1995. Although Slum Voe has seen annual fluctuations in vessel call counts over the study period overall there has been a gradual decline since 1995 to 2008 of 58%. The vessel arrival count for Lerwick has been relatively stable at around 950 per year. Table 158. North Regional vessel arrival counts at major ports
Port 1995 1996 1997 1998 1999 2000 2001
Orkney 1,726 1,664 1,640 1,647 1,675 1,626 1,412
Sullom Voe 456 475 415 529 522 506 419
Lerwick 978 883 864 869 869 880 957
Port 2002 2003 2004 2005 2006 2007 2008
Orkney 1,467 1,816 1,772 1,709 1,679 1,692 1,565
Sullom Voe 334 344 309 280 294 252 267
Lerwick 1,052 1,147 1,054 1,001 912 945 963
(Source: DfT, 2010) Ferry services in the region provide a lifeline for local communities living in both the Orkneys Island and the Shetland Islands. Ferry routes in the region are shown in Table 159 and Figure 137. Orkney Ferries Ltd (run by Orkney Islands Council) operate ferries to thirteen Islands within the Orkney Islands, which provides the transport link to mainland Scotland via larger ferry links to Scrabster, Gills Bay, and Aberdeen. Shetland Islands Council provides the internal ferry system to eight Islands within their area. A direct link also exists from Lerwick to Europe (Bergen, Maaloy, Hanstholm and Torshaven) and from Aberdeen direct to Kirkwall and Lewick. Table 159. North Regional ferry routes
ID Port 1 Port 2 Statistics Regions
0 Aberdeen Kirkwall Yes North - North East
1 Aberdeen Lerwick Yes North - North East
2 Kirkwall Lerwick Yes North
3 Scrabster Stromness Yes North
4 Kirkwall Stronsay Yes North
5 Laxo Whalsay (Symbister) Yes North
6 Houton Hoy (Lyness) Yes North
7 Kirkwall Shapinsay Yes North
8 Tingwall Rousay Yes North
9 Fetlar (Hamars Ness) Yell (Gutcher) Yes North
10 Toft Yell (Ulsta) Yes North
11 Lerwick Bressay Yes North
12 Yell (Gutcher) Unst (Belmont) Yes North
13 Stromness Hoy (Moaness) Yes North
14 Lerwick Bergen Yes North - Europe
15 Lerwick Maaloy Yes North - Europe
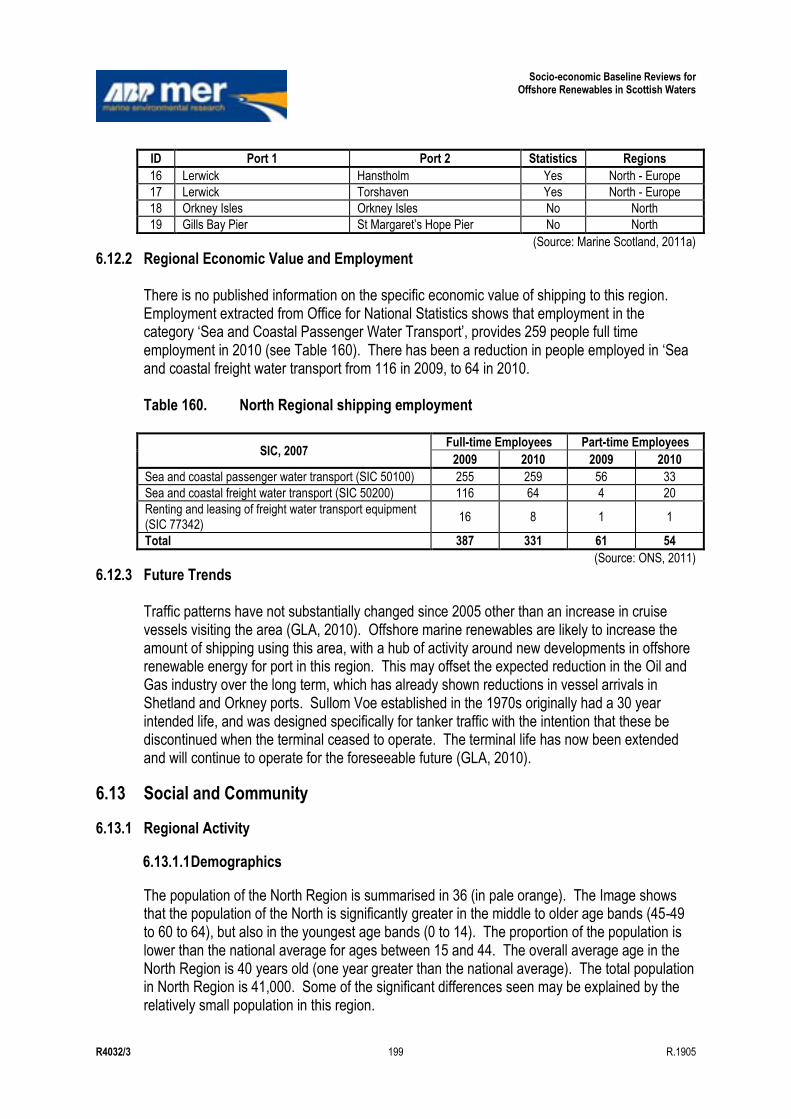
Socio-economic Baseline Reviews for Offshore Renewables in Scottish Waters
R4032/3 199 R.1905
ID Port 1 Port 2 Statistics Regions
16 Lerwick Hanstholm Yes North - Europe
17 Lerwick Torshaven Yes North - Europe
18 Orkney Isles Orkney Isles No North
19 Gills Bay Pier St Margaret‟s Hope Pier No North
(Source: Marine Scotland, 2011a) 6.12.2 Regional Economic Value and Employment
There is no published information on the specific economic value of shipping to this region. Employment extracted from Office for National Statistics shows that employment in the category „Sea and Coastal Passenger Water Transport‟, provides 259 people full time employment in 2010 (see Table 160). There has been a reduction in people employed in „Sea and coastal freight water transport from 116 in 2009, to 64 in 2010. Table 160. North Regional shipping employment
SIC, 2007 Full-time Employees Part-time Employees
2009 2010 2009 2010
Sea and coastal passenger water transport (SIC 50100) 255 259 56 33
Sea and coastal freight water transport (SIC 50200) 116 64 4 20
Renting and leasing of freight water transport equipment (SIC 77342)
16 8 1 1
Total 387 331 61 54
(Source: ONS, 2011) 6.12.3 Future Trends
Traffic patterns have not substantially changed since 2005 other than an increase in cruise vessels visiting the area (GLA, 2010). Offshore marine renewables are likely to increase the amount of shipping using this area, with a hub of activity around new developments in offshore renewable energy for port in this region. This may offset the expected reduction in the Oil and Gas industry over the long term, which has already shown reductions in vessel arrivals in Shetland and Orkney ports. Sullom Voe established in the 1970s originally had a 30 year intended life, and was designed specifically for tanker traffic with the intention that these be discontinued when the terminal ceased to operate. The terminal life has now been extended and will continue to operate for the foreseeable future (GLA, 2010).
6.13 Social and Community
6.13.1 Regional Activity
6.13.1.1 Demographics
The population of the North Region is summarised in 36 (in pale orange). The Image shows that the population of the North is significantly greater in the middle to older age bands (45-49 to 60 to 64), but also in the youngest age bands (0 to 14). The proportion of the population is lower than the national average for ages between 15 and 44. The overall average age in the North Region is 40 years old (one year greater than the national average). The total population in North Region is 41,000. Some of the significant differences seen may be explained by the relatively small population in this region.
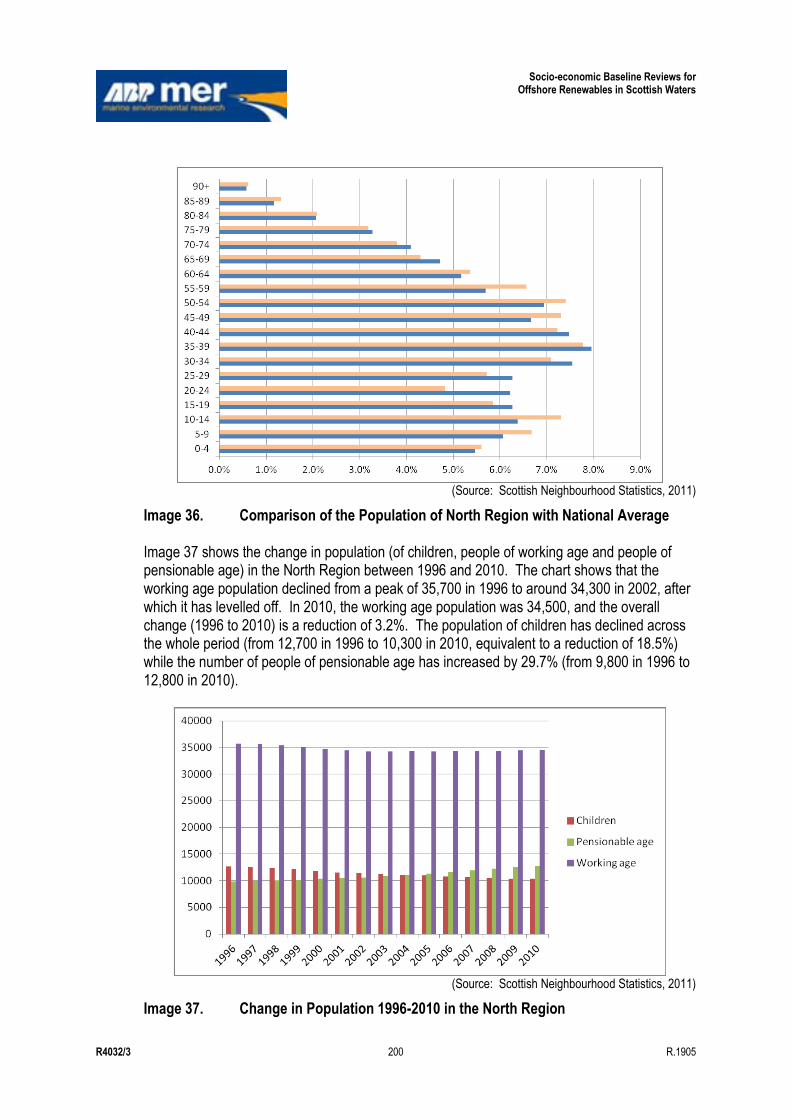
Socio-economic Baseline Reviews for Offshore Renewables in Scottish Waters
R4032/3 200 R.1905
(Source: Scottish Neighbourhood Statistics, 2011)
Image 36. Comparison of the Population of North Region with National Average Image 37 shows the change in population (of children, people of working age and people of pensionable age) in the North Region between 1996 and 2010. The chart shows that the working age population declined from a peak of 35,700 in 1996 to around 34,300 in 2002, after which it has levelled off. In 2010, the working age population was 34,500, and the overall change (1996 to 2010) is a reduction of 3.2%. The population of children has declined across the whole period (from 12,700 in 1996 to 10,300 in 2010, equivalent to a reduction of 18.5%) while the number of people of pensionable age has increased by 29.7% (from 9,800 in 1996 to 12,800 in 2010).
(Source: Scottish Neighbourhood Statistics, 2011)
Image 37. Change in Population 1996-2010 in the North Region
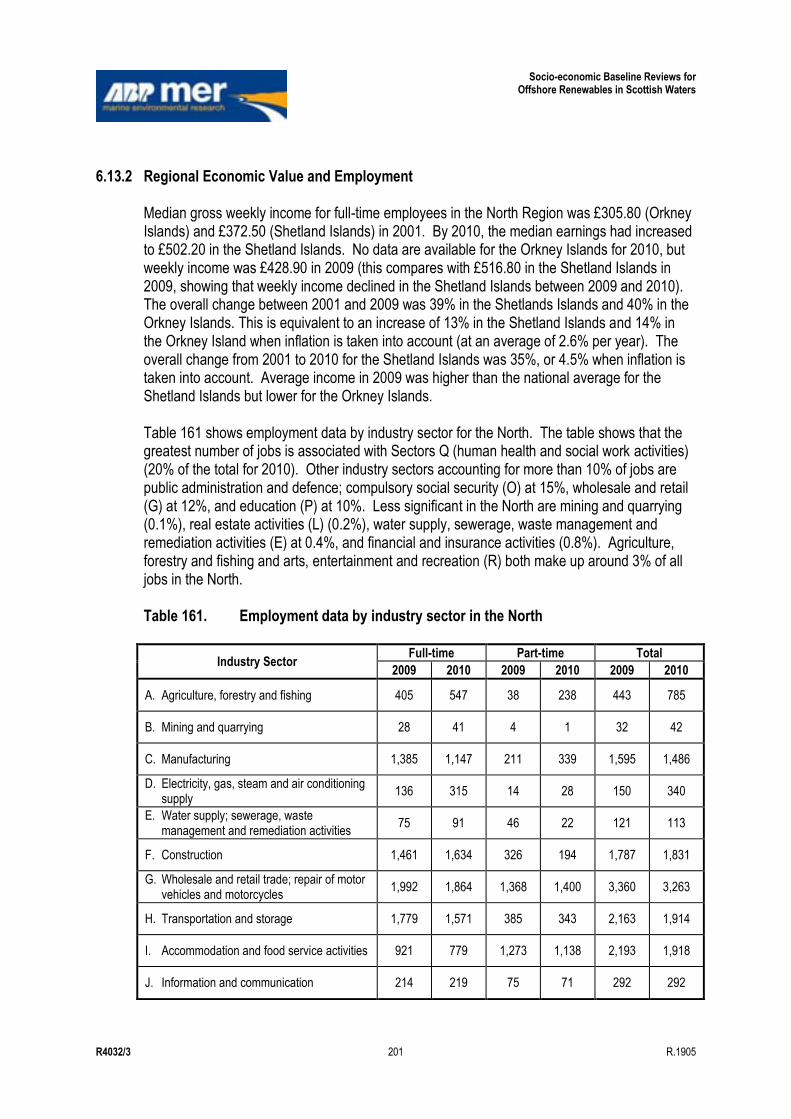
Socio-economic Baseline Reviews for Offshore Renewables in Scottish Waters
R4032/3 201 R.1905
6.13.2 Regional Economic Value and Employment
Median gross weekly income for full-time employees in the North Region was £305.80 (Orkney Islands) and £372.50 (Shetland Islands) in 2001. By 2010, the median earnings had increased to £502.20 in the Shetland Islands. No data are available for the Orkney Islands for 2010, but weekly income was £428.90 in 2009 (this compares with £516.80 in the Shetland Islands in 2009, showing that weekly income declined in the Shetland Islands between 2009 and 2010). The overall change between 2001 and 2009 was 39% in the Shetlands Islands and 40% in the Orkney Islands. This is equivalent to an increase of 13% in the Shetland Islands and 14% in the Orkney Island when inflation is taken into account (at an average of 2.6% per year). The overall change from 2001 to 2010 for the Shetland Islands was 35%, or 4.5% when inflation is taken into account. Average income in 2009 was higher than the national average for the Shetland Islands but lower for the Orkney Islands. Table 161 shows employment data by industry sector for the North. The table shows that the greatest number of jobs is associated with Sectors Q (human health and social work activities) (20% of the total for 2010). Other industry sectors accounting for more than 10% of jobs are public administration and defence; compulsory social security (O) at 15%, wholesale and retail (G) at 12%, and education (P) at 10%. Less significant in the North are mining and quarrying (0.1%), real estate activities (L) (0.2%), water supply, sewerage, waste management and remediation activities (E) at 0.4%, and financial and insurance activities (0.8%). Agriculture, forestry and fishing and arts, entertainment and recreation (R) both make up around 3% of all jobs in the North. Table 161. Employment data by industry sector in the North
Industry Sector Full-time Part-time Total
2009 2010 2009 2010 2009 2010
A. Agriculture, forestry and fishing 405 547 38 238 443 785
B. Mining and quarrying 28 41 4 1 32 42
C. Manufacturing 1,385 1,147 211 339 1,595 1,486
D. Electricity, gas, steam and air conditioning supply
136 315 14 28 150 340
E. Water supply; sewerage, waste management and remediation activities
75 91 46 22 121 113
F. Construction 1,461 1,634 326 194 1,787 1,831
G. Wholesale and retail trade; repair of motor vehicles and motorcycles
1,992 1,864 1,368 1,400 3,360 3,263
H. Transportation and storage 1,779 1,571 385 343 2,163 1,914
I. Accommodation and food service activities 921 779 1,273 1,138 2,193 1,918
J. Information and communication 214 219 75 71 292 292
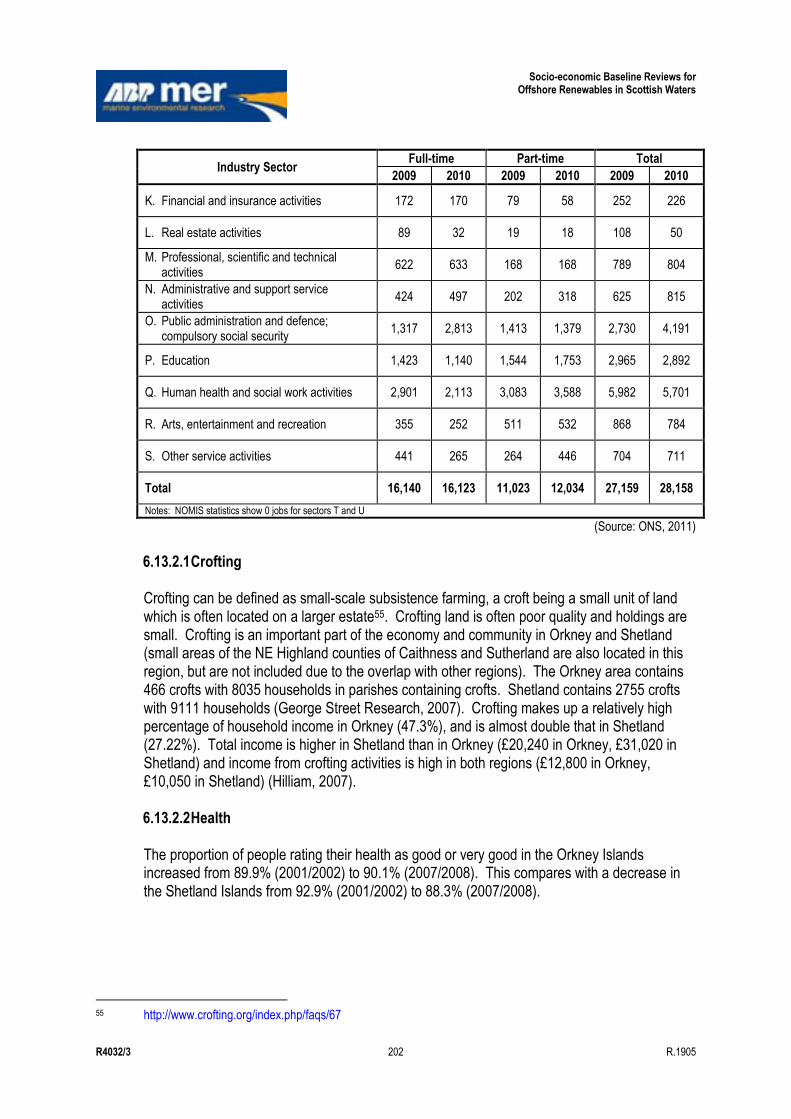
Socio-economic Baseline Reviews for Offshore Renewables in Scottish Waters
R4032/3 202 R.1905
Industry Sector Full-time Part-time Total
2009 2010 2009 2010 2009 2010
K. Financial and insurance activities 172 170 79 58 252 226
L. Real estate activities 89 32 19 18 108 50
M. Professional, scientific and technical activities
622 633 168 168 789 804
N. Administrative and support service activities
424 497 202 318 625 815
O. Public administration and defence; compulsory social security
1,317 2,813 1,413 1,379 2,730 4,191
P. Education 1,423 1,140 1,544 1,753 2,965 2,892
Q. Human health and social work activities 2,901 2,113 3,083 3,588 5,982 5,701
R. Arts, entertainment and recreation 355 252 511 532 868 784
S. Other service activities 441 265 264 446 704 711
Total 16,140 16,123 11,023 12,034 27,159 28,158
Notes: NOMIS statistics show 0 jobs for sectors T and U
(Source: ONS, 2011) 6.13.2.1 Crofting Crofting can be defined as small-scale subsistence farming, a croft being a small unit of land which is often located on a larger estate55. Crofting land is often poor quality and holdings are small. Crofting is an important part of the economy and community in Orkney and Shetland (small areas of the NE Highland counties of Caithness and Sutherland are also located in this region, but are not included due to the overlap with other regions). The Orkney area contains 466 crofts with 8035 households in parishes containing crofts. Shetland contains 2755 crofts with 9111 households (George Street Research, 2007). Crofting makes up a relatively high percentage of household income in Orkney (47.3%), and is almost double that in Shetland (27.22%). Total income is higher in Shetland than in Orkney (£20,240 in Orkney, £31,020 in Shetland) and income from crofting activities is high in both regions (£12,800 in Orkney, £10,050 in Shetland) (Hilliam, 2007). 6.13.2.2 Health The proportion of people rating their health as good or very good in the Orkney Islands increased from 89.9% (2001/2002) to 90.1% (2007/2008). This compares with a decrease in the Shetland Islands from 92.9% (2001/2002) to 88.3% (2007/2008).
55 http://www.crofting.org/index.php/faqs/67
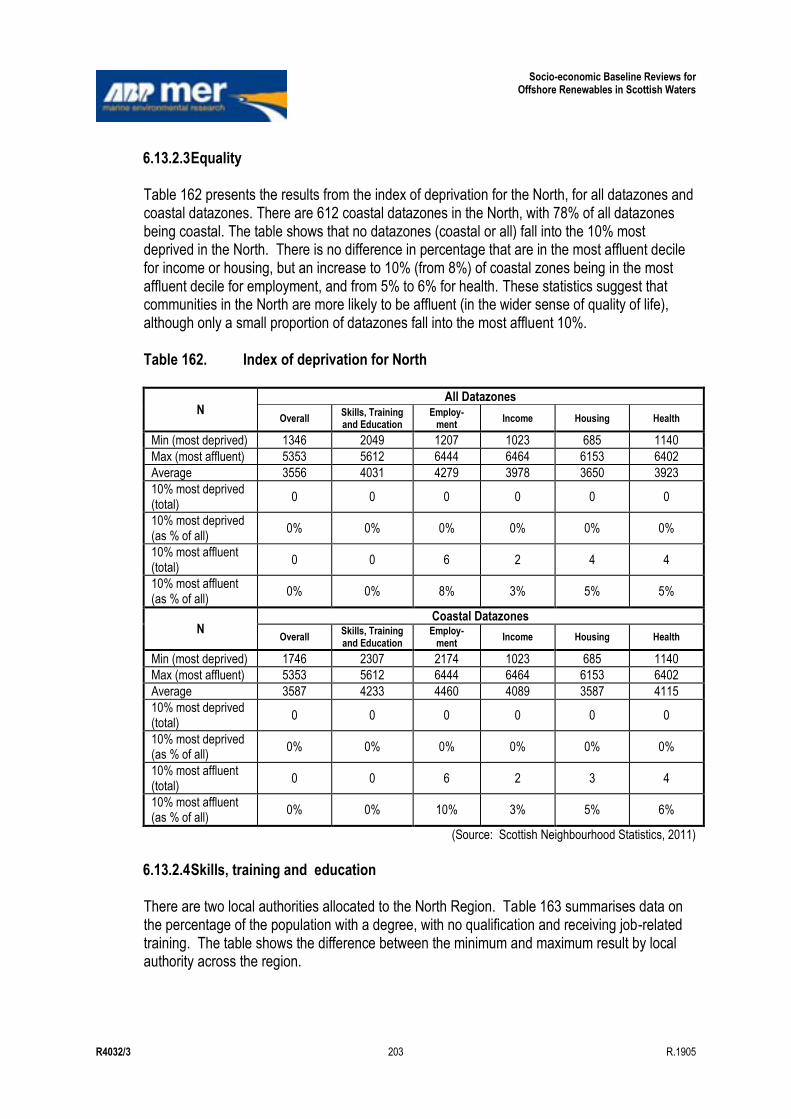
Socio-economic Baseline Reviews for Offshore Renewables in Scottish Waters
R4032/3 203 R.1905
6.13.2.3 Equality Table 162 presents the results from the index of deprivation for the North, for all datazones and coastal datazones. There are 612 coastal datazones in the North, with 78% of all datazones being coastal. The table shows that no datazones (coastal or all) fall into the 10% most deprived in the North. There is no difference in percentage that are in the most affluent decile for income or housing, but an increase to 10% (from 8%) of coastal zones being in the most affluent decile for employment, and from 5% to 6% for health. These statistics suggest that communities in the North are more likely to be affluent (in the wider sense of quality of life), although only a small proportion of datazones fall into the most affluent 10%. Table 162. Index of deprivation for North
N All Datazones
Overall Skills, Training and Education
Employ-ment
Income Housing Health
Min (most deprived) 1346 2049 1207 1023 685 1140
Max (most affluent) 5353 5612 6444 6464 6153 6402
Average 3556 4031 4279 3978 3650 3923
10% most deprived (total)
0 0 0 0 0 0
10% most deprived (as % of all)
0% 0% 0% 0% 0% 0%
10% most affluent (total)
0 0 6 2 4 4
10% most affluent (as % of all)
0% 0% 8% 3% 5% 5%
N Coastal Datazones
Overall Skills, Training and Education
Employ-ment
Income Housing Health
Min (most deprived) 1746 2307 2174 1023 685 1140
Max (most affluent) 5353 5612 6444 6464 6153 6402
Average 3587 4233 4460 4089 3587 4115
10% most deprived (total)
0 0 0 0 0 0
10% most deprived (as % of all)
0% 0% 0% 0% 0% 0%
10% most affluent (total)
0 0 6 2 3 4
10% most affluent (as % of all)
0% 0% 10% 3% 5% 6%
(Source: Scottish Neighbourhood Statistics, 2011)
6.13.2.4 Skills, training and education There are two local authorities allocated to the North Region. Table 163 summarises data on the percentage of the population with a degree, with no qualification and receiving job-related training. The table shows the difference between the minimum and maximum result by local authority across the region.
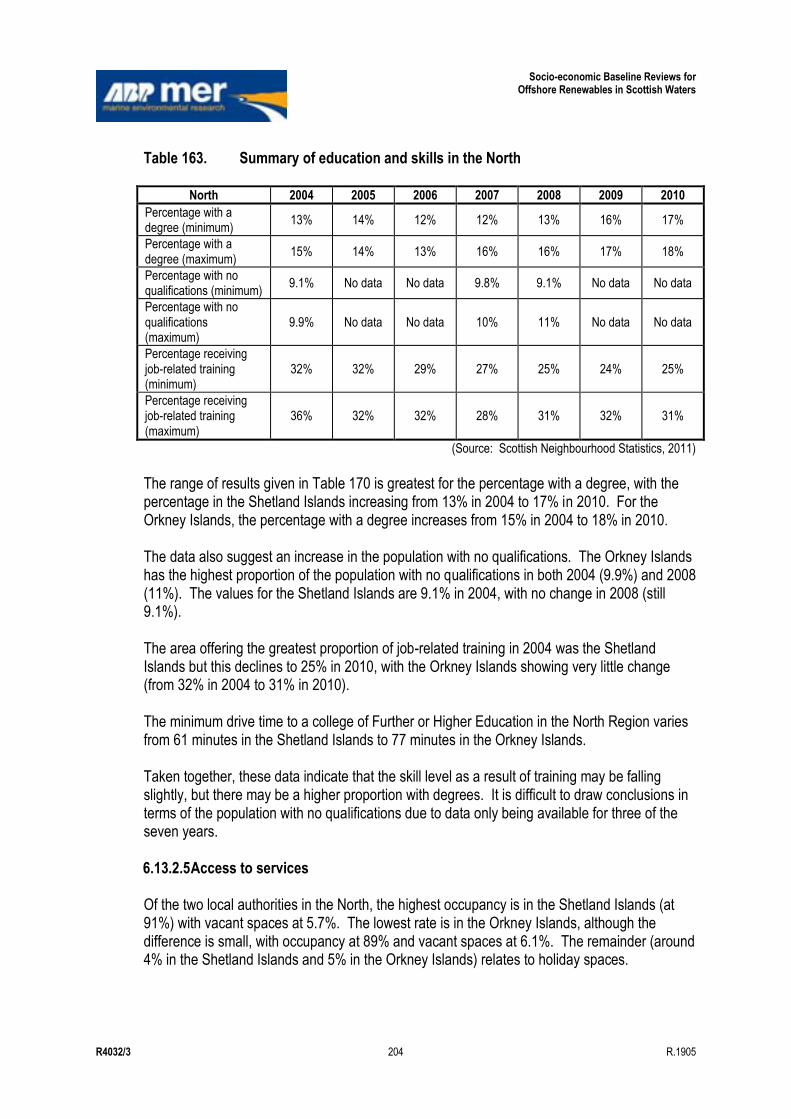
Socio-economic Baseline Reviews for Offshore Renewables in Scottish Waters
R4032/3 204 R.1905
Table 163. Summary of education and skills in the North
North 2004 2005 2006 2007 2008 2009 2010
Percentage with a degree (minimum)
13% 14% 12% 12% 13% 16% 17%
Percentage with a degree (maximum)
15% 14% 13% 16% 16% 17% 18%
Percentage with no qualifications (minimum)
9.1% No data No data 9.8% 9.1% No data No data
Percentage with no qualifications (maximum)
9.9% No data No data 10% 11% No data No data
Percentage receiving job-related training (minimum)
32% 32% 29% 27% 25% 24% 25%
Percentage receiving job-related training (maximum)
36% 32% 32% 28% 31% 32% 31%
(Source: Scottish Neighbourhood Statistics, 2011)
The range of results given in Table 170 is greatest for the percentage with a degree, with the percentage in the Shetland Islands increasing from 13% in 2004 to 17% in 2010. For the Orkney Islands, the percentage with a degree increases from 15% in 2004 to 18% in 2010. The data also suggest an increase in the population with no qualifications. The Orkney Islands has the highest proportion of the population with no qualifications in both 2004 (9.9%) and 2008 (11%). The values for the Shetland Islands are 9.1% in 2004, with no change in 2008 (still 9.1%). The area offering the greatest proportion of job-related training in 2004 was the Shetland Islands but this declines to 25% in 2010, with the Orkney Islands showing very little change (from 32% in 2004 to 31% in 2010). The minimum drive time to a college of Further or Higher Education in the North Region varies from 61 minutes in the Shetland Islands to 77 minutes in the Orkney Islands. Taken together, these data indicate that the skill level as a result of training may be falling slightly, but there may be a higher proportion with degrees. It is difficult to draw conclusions in terms of the population with no qualifications due to data only being available for three of the seven years. 6.13.2.5 Access to services Of the two local authorities in the North, the highest occupancy is in the Shetland Islands (at 91%) with vacant spaces at 5.7%. The lowest rate is in the Orkney Islands, although the difference is small, with occupancy at 89% and vacant spaces at 6.1%. The remainder (around 4% in the Shetland Islands and 5% in the Orkney Islands) relates to holiday spaces.
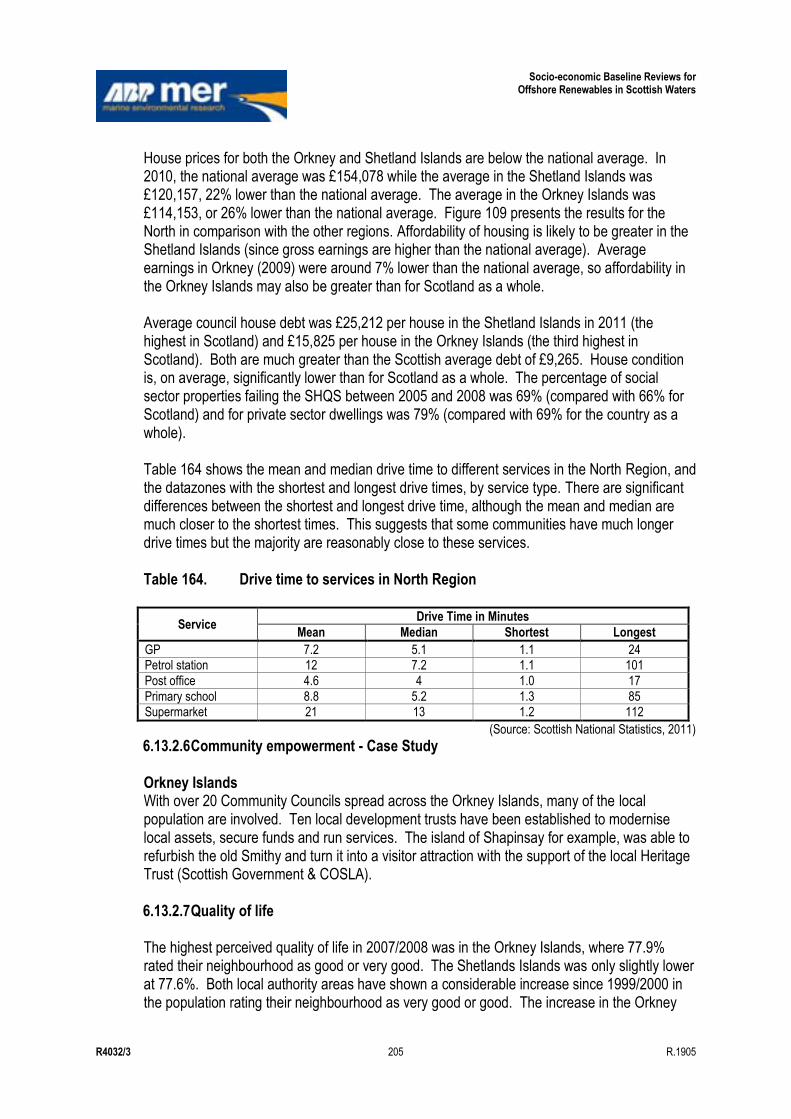
Socio-economic Baseline Reviews for Offshore Renewables in Scottish Waters
R4032/3 205 R.1905
House prices for both the Orkney and Shetland Islands are below the national average. In 2010, the national average was £154,078 while the average in the Shetland Islands was £120,157, 22% lower than the national average. The average in the Orkney Islands was £114,153, or 26% lower than the national average. Figure 109 presents the results for the North in comparison with the other regions. Affordability of housing is likely to be greater in the Shetland Islands (since gross earnings are higher than the national average). Average earnings in Orkney (2009) were around 7% lower than the national average, so affordability in the Orkney Islands may also be greater than for Scotland as a whole. Average council house debt was £25,212 per house in the Shetland Islands in 2011 (the highest in Scotland) and £15,825 per house in the Orkney Islands (the third highest in Scotland). Both are much greater than the Scottish average debt of £9,265. House condition is, on average, significantly lower than for Scotland as a whole. The percentage of social sector properties failing the SHQS between 2005 and 2008 was 69% (compared with 66% for Scotland) and for private sector dwellings was 79% (compared with 69% for the country as a whole). Table 164 shows the mean and median drive time to different services in the North Region, and the datazones with the shortest and longest drive times, by service type. There are significant differences between the shortest and longest drive time, although the mean and median are much closer to the shortest times. This suggests that some communities have much longer drive times but the majority are reasonably close to these services. Table 164. Drive time to services in North Region
Service Drive Time in Minutes
Mean Median Shortest Longest
GP 7.2 5.1 1.1 24 Petrol station 12 7.2 1.1 101
Post office 4.6 4 1.0 17
Primary school 8.8 5.2 1.3 85 Supermarket 21 13 1.2 112
(Source: Scottish National Statistics, 2011)
6.13.2.6 Community empowerment - Case Study Orkney Islands With over 20 Community Councils spread across the Orkney Islands, many of the local population are involved. Ten local development trusts have been established to modernise local assets, secure funds and run services. The island of Shapinsay for example, was able to refurbish the old Smithy and turn it into a visitor attraction with the support of the local Heritage Trust (Scottish Government & COSLA). 6.13.2.7 Quality of life The highest perceived quality of life in 2007/2008 was in the Orkney Islands, where 77.9% rated their neighbourhood as good or very good. The Shetlands Islands was only slightly lower at 77.6%. Both local authority areas have shown a considerable increase since 1999/2000 in the population rating their neighbourhood as very good or good. The increase in the Orkney
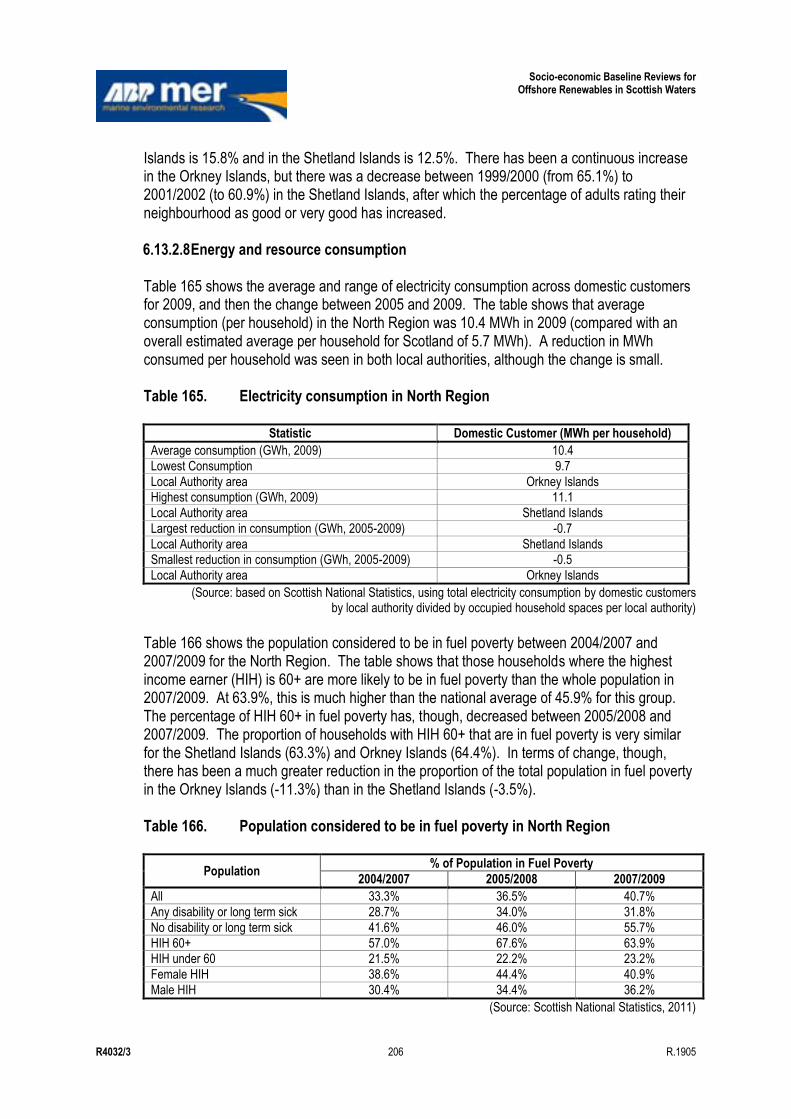
Socio-economic Baseline Reviews for Offshore Renewables in Scottish Waters
R4032/3 206 R.1905
Islands is 15.8% and in the Shetland Islands is 12.5%. There has been a continuous increase in the Orkney Islands, but there was a decrease between 1999/2000 (from 65.1%) to 2001/2002 (to 60.9%) in the Shetland Islands, after which the percentage of adults rating their neighbourhood as good or very good has increased. 6.13.2.8 Energy and resource consumption Table 165 shows the average and range of electricity consumption across domestic customers for 2009, and then the change between 2005 and 2009. The table shows that average consumption (per household) in the North Region was 10.4 MWh in 2009 (compared with an overall estimated average per household for Scotland of 5.7 MWh). A reduction in MWh consumed per household was seen in both local authorities, although the change is small.
Table 165. Electricity consumption in North Region
Statistic Domestic Customer (MWh per household)
Average consumption (GWh, 2009) 10.4
Lowest Consumption 9.7
Local Authority area Orkney Islands Highest consumption (GWh, 2009) 11.1
Local Authority area Shetland Islands
Largest reduction in consumption (GWh, 2005-2009) -0.7
Local Authority area Shetland Islands Smallest reduction in consumption (GWh, 2005-2009) -0.5
Local Authority area Orkney Islands
(Source: based on Scottish National Statistics, using total electricity consumption by domestic customers by local authority divided by occupied household spaces per local authority)
Table 166 shows the population considered to be in fuel poverty between 2004/2007 and 2007/2009 for the North Region. The table shows that those households where the highest income earner (HIH) is 60+ are more likely to be in fuel poverty than the whole population in 2007/2009. At 63.9%, this is much higher than the national average of 45.9% for this group. The percentage of HIH 60+ in fuel poverty has, though, decreased between 2005/2008 and 2007/2009. The proportion of households with HIH 60+ that are in fuel poverty is very similar for the Shetland Islands (63.3%) and Orkney Islands (64.4%). In terms of change, though, there has been a much greater reduction in the proportion of the total population in fuel poverty in the Orkney Islands (-11.3%) than in the Shetland Islands (-3.5%). Table 166. Population considered to be in fuel poverty in North Region
Population % of Population in Fuel Poverty
2004/2007 2005/2008 2007/2009
All 33.3% 36.5% 40.7%
Any disability or long term sick 28.7% 34.0% 31.8%
No disability or long term sick 41.6% 46.0% 55.7%
HIH 60+ 57.0% 67.6% 63.9% HIH under 60 21.5% 22.2% 23.2%
Female HIH 38.6% 44.4% 40.9%
Male HIH 30.4% 34.4% 36.2%
(Source: Scottish National Statistics, 2011)
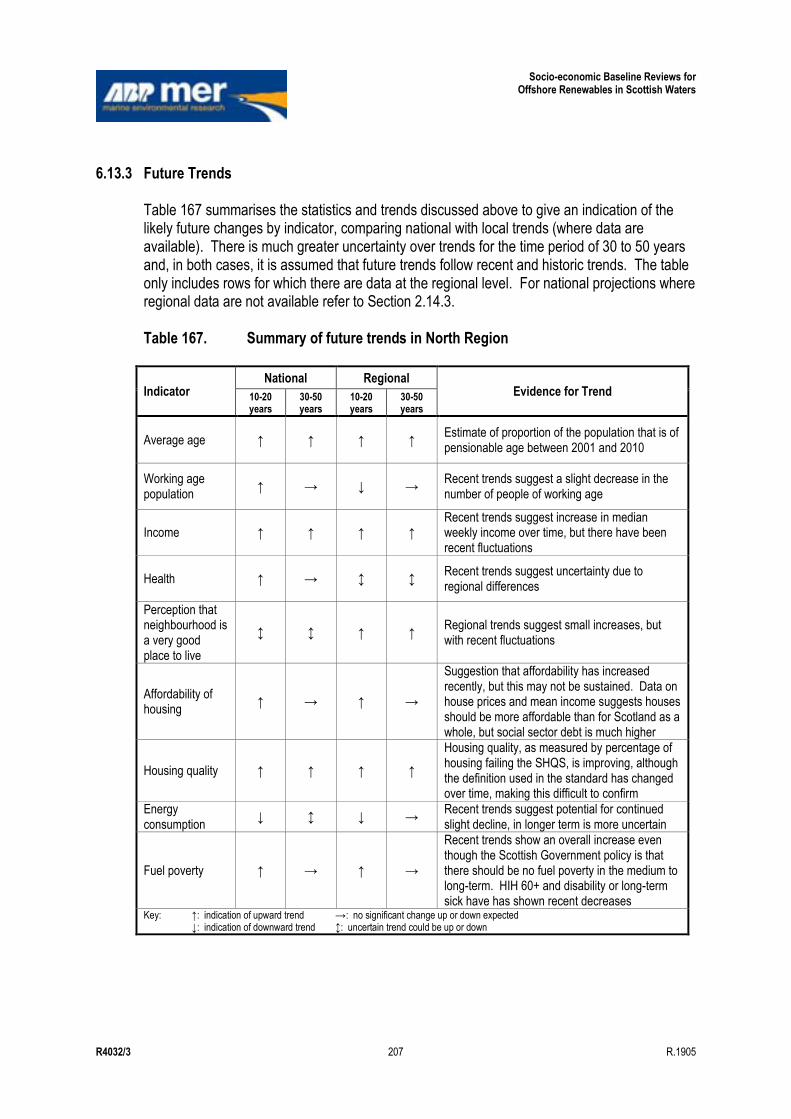
Socio-economic Baseline Reviews for Offshore Renewables in Scottish Waters
R4032/3 207 R.1905
6.13.3 Future Trends Table 167 summarises the statistics and trends discussed above to give an indication of the likely future changes by indicator, comparing national with local trends (where data are available). There is much greater uncertainty over trends for the time period of 30 to 50 years and, in both cases, it is assumed that future trends follow recent and historic trends. The table only includes rows for which there are data at the regional level. For national projections where regional data are not available refer to Section 2.14.3. Table 167. Summary of future trends in North Region
Indicator National Regional
Evidence for Trend 10-20 years
30-50 years
10-20 years
30-50 years
Average age ↑ ↑ ↑ ↑ Estimate of proportion of the population that is of pensionable age between 2001 and 2010
Working age population
↑ → ↓ → Recent trends suggest a slight decrease in the number of people of working age
Income ↑ ↑ ↑ ↑ Recent trends suggest increase in median weekly income over time, but there have been recent fluctuations
Health ↑ → ↕ ↕ Recent trends suggest uncertainty due to regional differences
Perception that neighbourhood is a very good place to live
↕ ↕ ↑ ↑ Regional trends suggest small increases, but with recent fluctuations
Affordability of housing
↑ → ↑ →
Suggestion that affordability has increased recently, but this may not be sustained. Data on house prices and mean income suggests houses should be more affordable than for Scotland as a whole, but social sector debt is much higher
Housing quality ↑ ↑ ↑ ↑
Housing quality, as measured by percentage of housing failing the SHQS, is improving, although the definition used in the standard has changed over time, making this difficult to confirm
Energy consumption
↓ ↕ ↓ → Recent trends suggest potential for continued slight decline, in longer term is more uncertain
Fuel poverty ↑ → ↑ →
Recent trends show an overall increase even though the Scottish Government policy is that there should be no fuel poverty in the medium to long-term. HIH 60+ and disability or long-term sick have has shown recent decreases
Key: ↑: indication of upward trend →: no significant change up or down expected ↓: indication of downward trend ↕: uncertain trend could be up or down
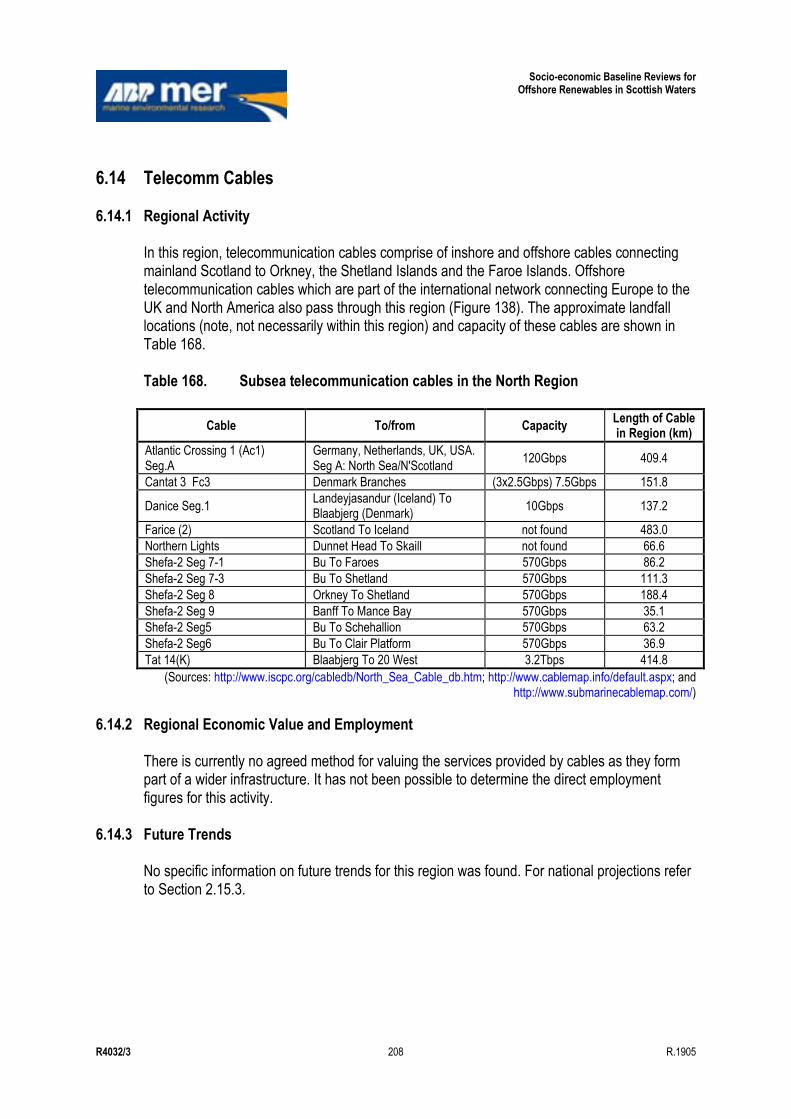
Socio-economic Baseline Reviews for Offshore Renewables in Scottish Waters
R4032/3 208 R.1905
6.14 Telecomm Cables
6.14.1 Regional Activity In this region, telecommunication cables comprise of inshore and offshore cables connecting mainland Scotland to Orkney, the Shetland Islands and the Faroe Islands. Offshore telecommunication cables which are part of the international network connecting Europe to the UK and North America also pass through this region (Figure 138). The approximate landfall locations (note, not necessarily within this region) and capacity of these cables are shown in Table 168. Table 168. Subsea telecommunication cables in the North Region
Cable To/from Capacity Length of Cable in Region (km)
Atlantic Crossing 1 (Ac1) Seg.A
Germany, Netherlands, UK, USA. Seg A: North Sea/N'Scotland
120Gbps 409.4
Cantat 3 Fc3 Denmark Branches (3x2.5Gbps) 7.5Gbps 151.8
Danice Seg.1 Landeyjasandur (Iceland) To Blaabjerg (Denmark)
10Gbps 137.2
Farice (2) Scotland To Iceland not found 483.0
Northern Lights Dunnet Head To Skaill not found 66.6
Shefa-2 Seg 7-1 Bu To Faroes 570Gbps 86.2
Shefa-2 Seg 7-3 Bu To Shetland 570Gbps 111.3
Shefa-2 Seg 8 Orkney To Shetland 570Gbps 188.4
Shefa-2 Seg 9 Banff To Mance Bay 570Gbps 35.1
Shefa-2 Seg5 Bu To Schehallion 570Gbps 63.2
Shefa-2 Seg6 Bu To Clair Platform 570Gbps 36.9
Tat 14(K) Blaabjerg To 20 West 3.2Tbps 414.8
(Sources: http://www.iscpc.org/cabledb/North_Sea_Cable_db.htm; http://www.cablemap.info/default.aspx; and http://www.submarinecablemap.com/)
6.14.2 Regional Economic Value and Employment There is currently no agreed method for valuing the services provided by cables as they form part of a wider infrastructure. It has not been possible to determine the direct employment figures for this activity.
6.14.3 Future Trends No specific information on future trends for this region was found. For national projections refer to Section 2.15.3.
Socio-economic Baseline Reviews for Offshore Renewables in Scottish Waters
R4032/3 209 R.1905
6.15 Tourism
6.15.1 Regional Activity Tourist sites in North Scotland include a range of attractions, with a considerable concentration of general tourist attractions on Orkney (Figure 139). Historic/heritage attractions and natural heritage attractions also feature in significant numbers on both Orkney and Shetland. Figure 140 shows the locations of coastal and maritime cultural heritage assets, including the World Heritage Site on Orkney. The Heart of Neolithic Orkney was designated as a World Heritage Site in 1999 and includes the tomb of Maeshowe, the Stones of Stenness, the Barnhouse Stone, the Watchstone, the Ring of Brodgar and associated monuments and stone settings, and the Skara Brae settlement56. Within the region, there are additionally several areas with seaside awards (see Figure 141). These include Sango Sands, Strathy Bay and Melvich Beach along the North coast, as well as some sites on Shetland. There are also a couple of designated bathing waters at Thurso and Dunnet. The importance of natural marine resources is also illustrated by this region having 9 Marine Special Areas of Conservation57, mainly in areas around the Northern Islets. Visitor numbers for the whole region are not readily available. However, it is possible to obtain data for Shetland and Orkney from VisitScotland. Data for 2009 indicate that UK visitors made 0.07 million trips to Orkney, stayed for 0.4 million nights and spent around £30 million. Considering Shetland, UK visitors made 0.04 million trips, stayed for 0.25 million nights and spent approximately £12 million (VisitScotland, 2010).
6.15.2 Regional Economic Value and Employment No economic value or employment information which is specific to the North Region has been identified (with the exception of the expenditure figures given above for Orkney and Shetland).
6.15.3 Future Trends For further discussion on trends in tourism, see Section 2.16.3 (National Overview)
6.16 Waste Disposal
6.16.1 Regional Activity The location of open, disused and closed dredge disposal sites are shown in Figure 142. The name of open disposal sites and the area of seabed each disposal site covers are shown in Table 169.
56 See Historic Scotland Internet site: http://www.historic-scotland.gov.uk/neolithic-orkney. 57 http://jncc.defra.gov.uk/page-1445
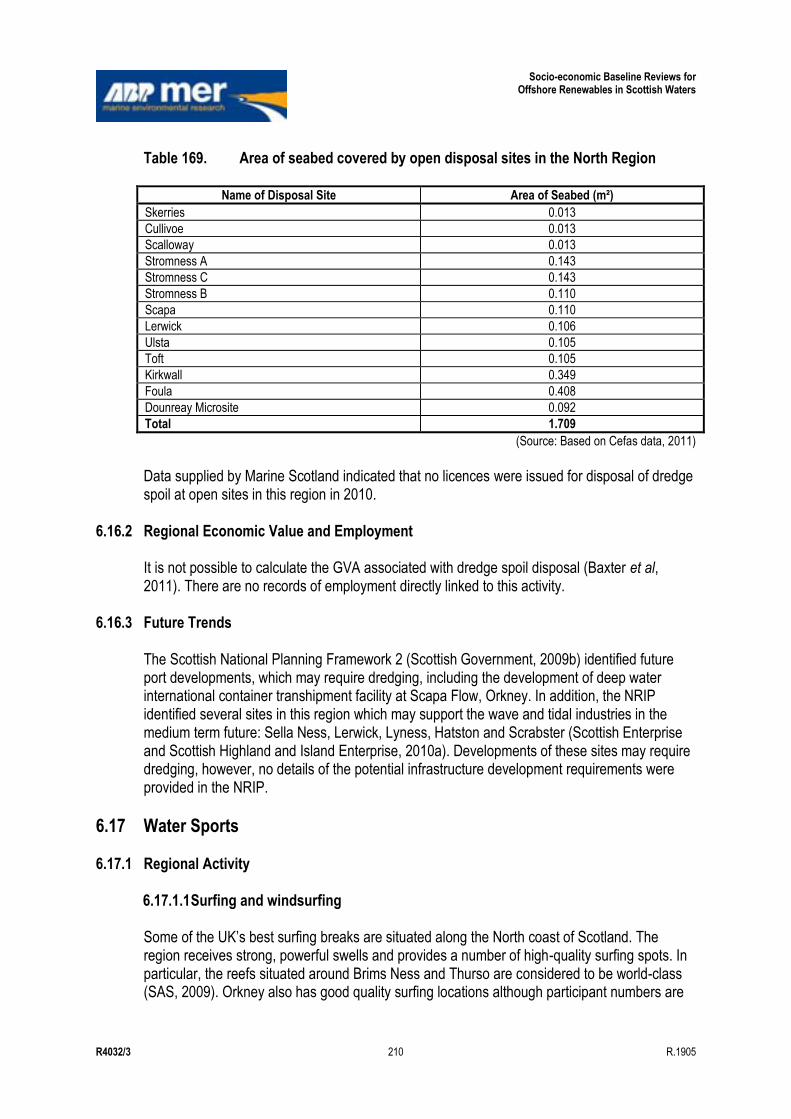
Socio-economic Baseline Reviews for Offshore Renewables in Scottish Waters
R4032/3 210 R.1905
Table 169. Area of seabed covered by open disposal sites in the North Region
Name of Disposal Site Area of Seabed (m²)
Skerries 0.013
Cullivoe 0.013
Scalloway 0.013
Stromness A 0.143
Stromness C 0.143
Stromness B 0.110
Scapa 0.110
Lerwick 0.106
Ulsta 0.105
Toft 0.105
Kirkwall 0.349
Foula 0.408
Dounreay Microsite 0.092
Total 1.709
(Source: Based on Cefas data, 2011) Data supplied by Marine Scotland indicated that no licences were issued for disposal of dredge spoil at open sites in this region in 2010.
6.16.2 Regional Economic Value and Employment It is not possible to calculate the GVA associated with dredge spoil disposal (Baxter et al, 2011). There are no records of employment directly linked to this activity.
6.16.3 Future Trends The Scottish National Planning Framework 2 (Scottish Government, 2009b) identified future port developments, which may require dredging, including the development of deep water international container transhipment facility at Scapa Flow, Orkney. In addition, the NRIP identified several sites in this region which may support the wave and tidal industries in the medium term future: Sella Ness, Lerwick, Lyness, Hatston and Scrabster (Scottish Enterprise and Scottish Highland and Island Enterprise, 2010a). Developments of these sites may require dredging, however, no details of the potential infrastructure development requirements were provided in the NRIP.
6.17 Water Sports
6.17.1 Regional Activity 6.17.1.1 Surfing and windsurfing Some of the UK‟s best surfing breaks are situated along the North coast of Scotland. The region receives strong, powerful swells and provides a number of high-quality surfing spots. In particular, the reefs situated around Brims Ness and Thurso are considered to be world-class (SAS, 2009). Orkney also has good quality surfing locations although participant numbers are

Socio-economic Baseline Reviews for Offshore Renewables in Scottish Waters
R4032/3 211 R.1905
less than on mainland North Scotland, primarily due to accessibility (SAS, 2010). The location of surfing breaks in the North area can be seen in Table 170 and Figure 143. Table 170. Surfing and windsurfing locations in the North Region
General Location Surf Location
Sutherland
Melvich
Strathy
Armadale Bay
Farr Bay
Torrisdale
Kyle of Tongue
Sandwood Bay
Point of Ness
Dunnet Bay
Castlehill to Murkle
Murkle Point
Thurso East*
Shit Pipe
Brimms Ness - The Point
Brimms Ness - The Cove
Brimms Ness - The Bowl
Sandside Bay*
Caithness
Gills Bay
Brunt Skerries
Harrow Harbour
Scarfskerry Reefs
Ham
Orkney
Marwick
Skail Bay Right
Skara Brae * Also listed in the Windsurf magazine „beach guide‟ (http://www.windsurf.co.uk/beachguide)
(Source: Based on SAS, 2009 and „Stormrider Guides‟, 2010 (http://www.lowpressure.co.uk); and Windsurf Magazine „Beach Guide‟, 2011 (http://www.windsurf.co.uk/beachguide))
Windsurfing on Orkney is a popular activity at Kirkwall‟s Scapa Beach and Orphir‟s Waulkmill Bay. In addition, the storm beach of Skaill Bay on the West coast of mainland Orkney and Sandwick, are popular spots (Visit Orkney, 2009). 6.17.1.2 Angling The main launch spots for charter based angling are Thurso in North Scotland and Stromness on Orkney (Radford et al., 2009). Wreck angling is popular in Scapa Flow and also on other wrecks found offshore from Orkney. Cod, pollack and mackerel, are the most popular target species in Caithness and Sutherland. There is some evidence, however, of sports fishing for rarer species such as porbeagle shark becoming more popular. In Orkney conger eel is found amongst the wrecks of Scapa Flow and is the most popular target species, followed by mackerel and bass (Radford et al., 2009).

Socio-economic Baseline Reviews for Offshore Renewables in Scottish Waters
R4032/3 212 R.1905
6.17.1.3 Scuba diving The most popular area for scuba diving in the region is around Scapa Flow in Orkney (Figure 144). This body of water is considered one of the finest wreck diving sites in Europe and has ranked among the top five wreck diving areas of the world (Jack Jackson, 2007; Baxter et al, 2011). While scuba diving has predominantly been based in Scapa Flow historically, it increasingly involves diving in other parts of Orkney (Jack Jackson, 2007; Visit Orkney, 2009) and also on Shetland. Recreational diving is predominantly charter based with an estimated 3000 visiting divers annually (The Orkney Hyperbaric Trust). A limited amount of diving is also undertaken on the mainland in this region. Details about the number of dive centres, charter boats and diving clubs found in the region can be seen in Table 171 and Figure 144. Table 171. The number of dive centres, charter boats and diving clubs found in the
region in North Region
Facilities Number
Dive Centres 4
Charter Boats 5
ScotSAC Branches 2
BSAC Branches 2
(Source: BSAC: http://www.bsac.com/; ScotSAC: http://www.scotsac.com/; and http://finstrokes.com)
6.17.1.4 Small sail boat activity and sea kayaking Dinghy sailing clubs are located in Kirkwall, Orkney and in Northern Shetland (Figure 145). In terms of popularity, kayaking around Orkney and the North coast of Scotland is not considered as important as other regions such as the Inner Hebrides and East Grampian Coast (Land Use Consultants, 2007) (Figure 146).
6.17.2 Regional Economic Value and Employment Regional economic values within this region were available for surfing and windsurfing, scuba diving and recreational angling. 6.17.2.1 Surfing and windsurfing While no estimates of the total value of surfing in the North Region are available the value of Scotland‟s largest surfing event, the O‟Neill Coldwater Classic at Thurso East has been calculated. The annual competition is an Association of Surfing Professionals (ASP), World Qualifying Series (WQS) event, which is listed as a six star event, the highest rating in the WQS and also the highest rated professional surf contest ever held in the UK (Event Scotland, 2010). The 2010 event achieved estimated spectator numbers of 5,500 over the 8-day event. The event resulted in an estimated expenditure of £440,000 to the local economy and an additional £420,000 within wider Scotland with major influential media coverage totalling £3.8m http://www.eventscotland.org/funding-and-resources/case-studies/o-neill-coldwater-classic-2010/.
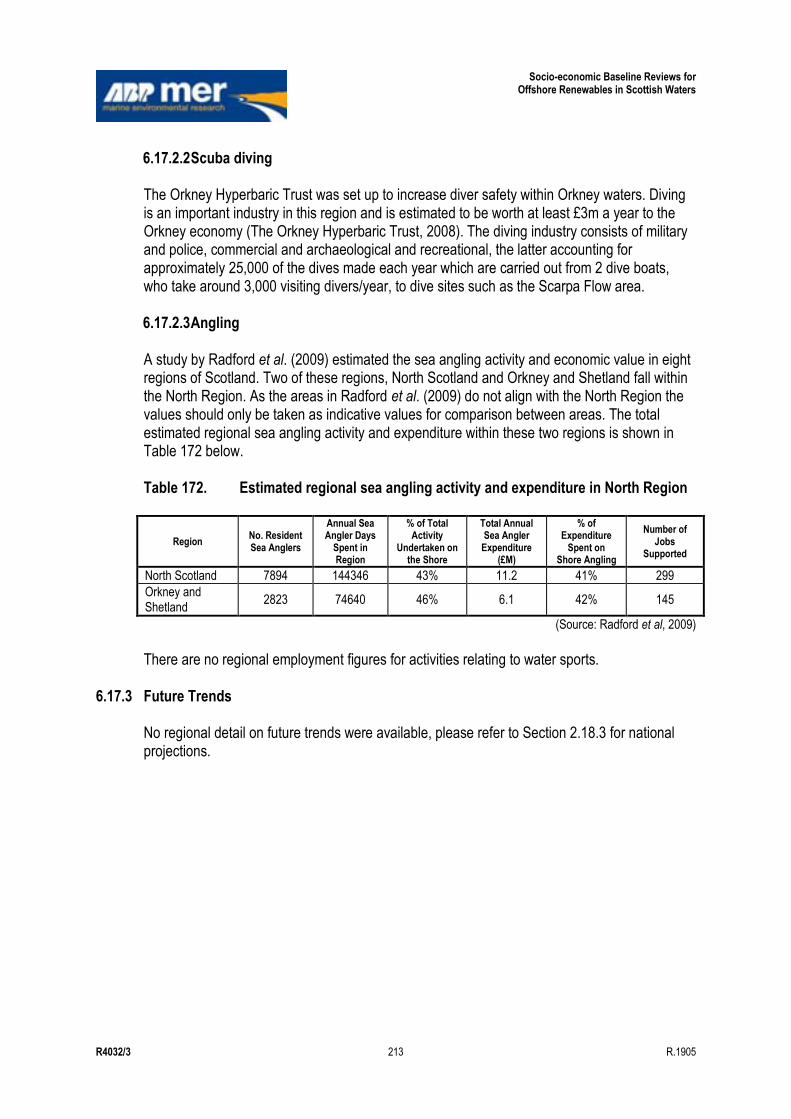
Socio-economic Baseline Reviews for Offshore Renewables in Scottish Waters
R4032/3 213 R.1905
6.17.2.2 Scuba diving The Orkney Hyperbaric Trust was set up to increase diver safety within Orkney waters. Diving is an important industry in this region and is estimated to be worth at least £3m a year to the Orkney economy (The Orkney Hyperbaric Trust, 2008). The diving industry consists of military and police, commercial and archaeological and recreational, the latter accounting for approximately 25,000 of the dives made each year which are carried out from 2 dive boats, who take around 3,000 visiting divers/year, to dive sites such as the Scarpa Flow area. 6.17.2.3 Angling A study by Radford et al. (2009) estimated the sea angling activity and economic value in eight regions of Scotland. Two of these regions, North Scotland and Orkney and Shetland fall within the North Region. As the areas in Radford et al. (2009) do not align with the North Region the values should only be taken as indicative values for comparison between areas. The total estimated regional sea angling activity and expenditure within these two regions is shown in Table 172 below. Table 172. Estimated regional sea angling activity and expenditure in North Region
Region No. Resident Sea Anglers
Annual Sea Angler Days
Spent in Region
% of Total Activity
Undertaken on the Shore
Total Annual Sea Angler
Expenditure (£M)
% of Expenditure
Spent on Shore Angling
Number of Jobs
Supported
North Scotland 7894 144346 43% 11.2 41% 299
Orkney and Shetland
2823 74640 46% 6.1 42% 145
(Source: Radford et al, 2009) There are no regional employment figures for activities relating to water sports.
6.17.3 Future Trends No regional detail on future trends were available, please refer to Section 2.18.3 for national projections.

Socio-economic Baseline Reviews for Offshore Renewables in Scottish Waters
R4032/3 214 R.1905
7. North East Region
7.1 Introduction The regional overview for each marine use present within the North East SORER is detailed within this section. These sub-sections, which are arranged in alphabetical order of activity, provide information in a uniformed manner under the following headings: Regional Activity; Regional Economic Value and Employment; and Future Trends. The activities present within the North East Region are given in Table 173 below. Table 173. Activities present within the North East SORER
Activity
Present in North East SORER
Regional Trends Available
Future Trends Available
Yes No Yes No Yes No
Aquaculture
Aviation
Carbon Capture and Storage
Coast Protection and Flood Defence
Commercial Fisheries
Energy Generation
Military Interests
Oil and Gas
Ports and Harbours
Power Interconnectors
Recreational Boating
Shipping
Social and Community
Telecom Cables
Tourism
Waste Disposal
Water Sports
7.2 Aquaculture
7.2.1 Regional Activity Marine aquaculture sites within the North East Region are shown in Figure 147. There are 5 finfish and 19 shellfish sites. It should be noted that only one shellfish site is actually located on the North East coast of Scotland. The remaining 18 shellfish and 5 finfish sites are located on the North and North West coast of mainland Scotland (within Loch Eriboll, Loch Laxford and Loch A Chairn Bhain) but fall within the North East SORER region assigned for this project.
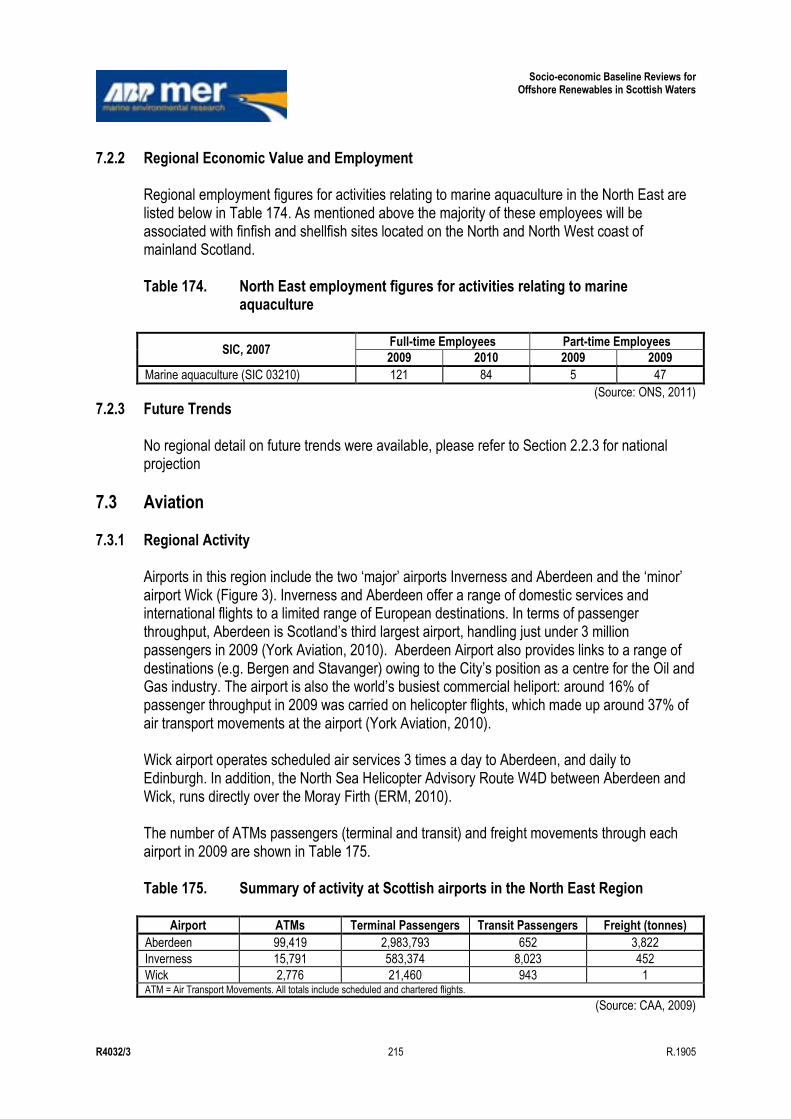
Socio-economic Baseline Reviews for Offshore Renewables in Scottish Waters
R4032/3 215 R.1905
7.2.2 Regional Economic Value and Employment Regional employment figures for activities relating to marine aquaculture in the North East are listed below in Table 174. As mentioned above the majority of these employees will be associated with finfish and shellfish sites located on the North and North West coast of mainland Scotland. Table 174. North East employment figures for activities relating to marine
aquaculture
SIC, 2007 Full-time Employees Part-time Employees
2009 2010 2009 2009
Marine aquaculture (SIC 03210) 121 84 5 47
(Source: ONS, 2011)
7.2.3 Future Trends No regional detail on future trends were available, please refer to Section 2.2.3 for national projection
7.3 Aviation
7.3.1 Regional Activity Airports in this region include the two „major‟ airports Inverness and Aberdeen and the „minor‟ airport Wick (Figure 3). Inverness and Aberdeen offer a range of domestic services and international flights to a limited range of European destinations. In terms of passenger throughput, Aberdeen is Scotland‟s third largest airport, handling just under 3 million passengers in 2009 (York Aviation, 2010). Aberdeen Airport also provides links to a range of destinations (e.g. Bergen and Stavanger) owing to the City‟s position as a centre for the Oil and Gas industry. The airport is also the world‟s busiest commercial heliport: around 16% of passenger throughput in 2009 was carried on helicopter flights, which made up around 37% of air transport movements at the airport (York Aviation, 2010). Wick airport operates scheduled air services 3 times a day to Aberdeen, and daily to Edinburgh. In addition, the North Sea Helicopter Advisory Route W4D between Aberdeen and Wick, runs directly over the Moray Firth (ERM, 2010). The number of ATMs passengers (terminal and transit) and freight movements through each airport in 2009 are shown in Table 175. Table 175. Summary of activity at Scottish airports in the North East Region
Airport ATMs Terminal Passengers Transit Passengers Freight (tonnes)
Aberdeen 99,419 2,983,793 652 3,822
Inverness 15,791 583,374 8,023 452
Wick 2,776 21,460 943 1 ATM = Air Transport Movements. All totals include scheduled and chartered flights.
(Source: CAA, 2009)
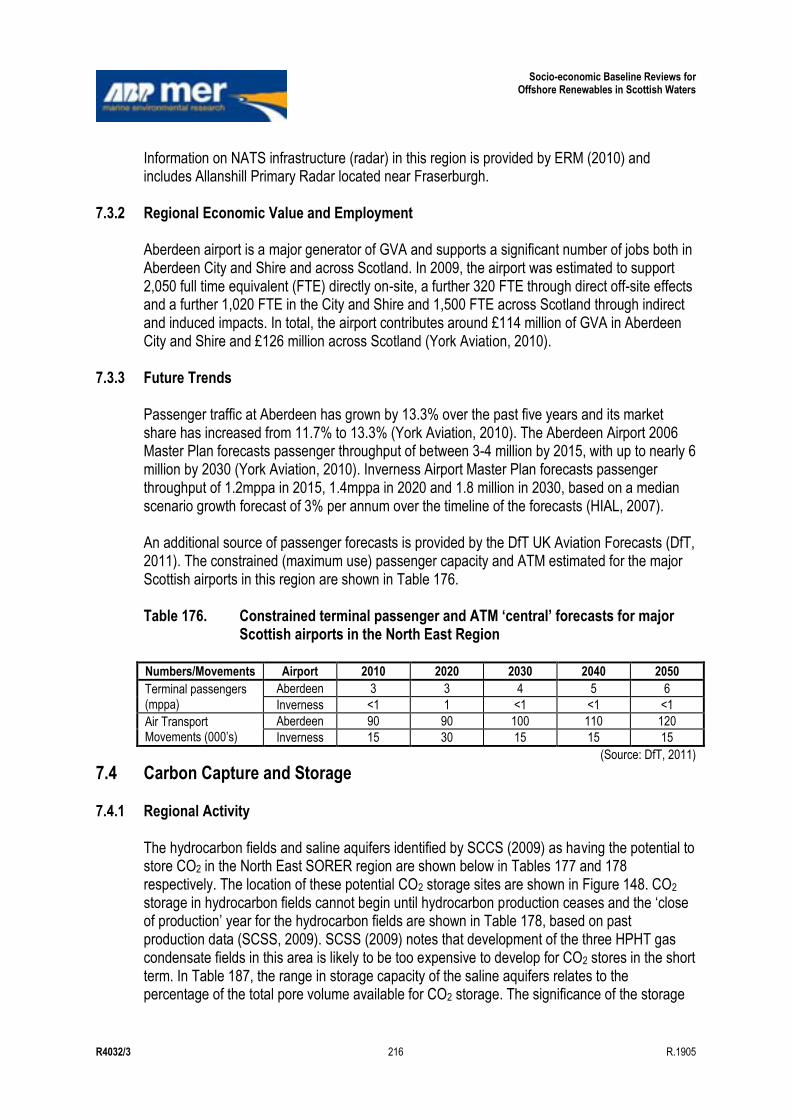
Socio-economic Baseline Reviews for Offshore Renewables in Scottish Waters
R4032/3 216 R.1905
Information on NATS infrastructure (radar) in this region is provided by ERM (2010) and includes Allanshill Primary Radar located near Fraserburgh.
7.3.2 Regional Economic Value and Employment Aberdeen airport is a major generator of GVA and supports a significant number of jobs both in Aberdeen City and Shire and across Scotland. In 2009, the airport was estimated to support 2,050 full time equivalent (FTE) directly on-site, a further 320 FTE through direct off-site effects and a further 1,020 FTE in the City and Shire and 1,500 FTE across Scotland through indirect and induced impacts. In total, the airport contributes around £114 million of GVA in Aberdeen City and Shire and £126 million across Scotland (York Aviation, 2010).
7.3.3 Future Trends Passenger traffic at Aberdeen has grown by 13.3% over the past five years and its market share has increased from 11.7% to 13.3% (York Aviation, 2010). The Aberdeen Airport 2006 Master Plan forecasts passenger throughput of between 3-4 million by 2015, with up to nearly 6 million by 2030 (York Aviation, 2010). Inverness Airport Master Plan forecasts passenger throughput of 1.2mppa in 2015, 1.4mppa in 2020 and 1.8 million in 2030, based on a median scenario growth forecast of 3% per annum over the timeline of the forecasts (HIAL, 2007). An additional source of passenger forecasts is provided by the DfT UK Aviation Forecasts (DfT, 2011). The constrained (maximum use) passenger capacity and ATM estimated for the major Scottish airports in this region are shown in Table 176. Table 176. Constrained terminal passenger and ATM ‘central’ forecasts for major
Scottish airports in the North East Region Numbers/Movements Airport 2010 2020 2030 2040 2050
Terminal passengers (mppa)
Aberdeen 3 3 4 5 6
Inverness <1 1 <1 <1 <1
Air Transport Movements (000‟s)
Aberdeen 90 90 100 110 120
Inverness 15 30 15 15 15
(Source: DfT, 2011)
7.4 Carbon Capture and Storage
7.4.1 Regional Activity The hydrocarbon fields and saline aquifers identified by SCCS (2009) as having the potential to store CO2 in the North East SORER region are shown below in Tables 177 and 178 respectively. The location of these potential CO2 storage sites are shown in Figure 148. CO2 storage in hydrocarbon fields cannot begin until hydrocarbon production ceases and the „close of production‟ year for the hydrocarbon fields are shown in Table 178, based on past production data (SCSS, 2009). SCSS (2009) notes that development of the three HPHT gas condensate fields in this area is likely to be too expensive to develop for CO2 stores in the short term. In Table 187, the range in storage capacity of the saline aquifers relates to the percentage of the total pore volume available for CO2 storage. The significance of the storage
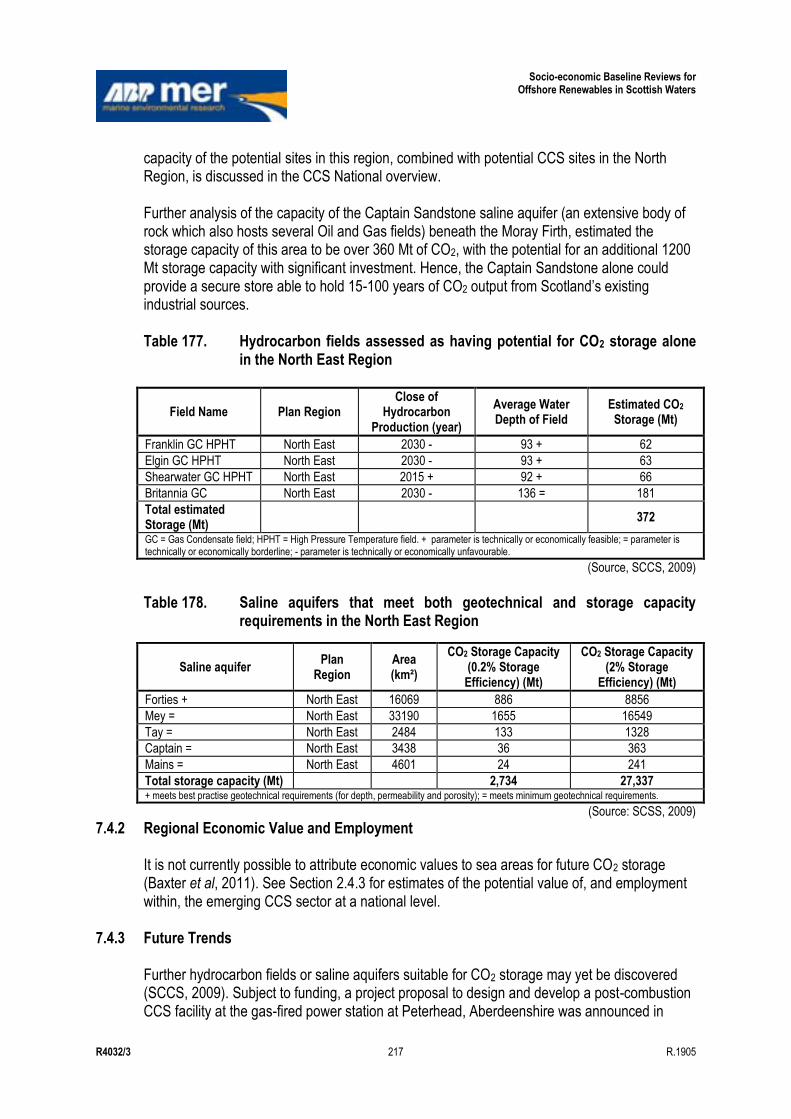
Socio-economic Baseline Reviews for Offshore Renewables in Scottish Waters
R4032/3 217 R.1905
capacity of the potential sites in this region, combined with potential CCS sites in the North Region, is discussed in the CCS National overview. Further analysis of the capacity of the Captain Sandstone saline aquifer (an extensive body of rock which also hosts several Oil and Gas fields) beneath the Moray Firth, estimated the storage capacity of this area to be over 360 Mt of CO2, with the potential for an additional 1200 Mt storage capacity with significant investment. Hence, the Captain Sandstone alone could provide a secure store able to hold 15-100 years of CO2 output from Scotland‟s existing industrial sources. Table 177. Hydrocarbon fields assessed as having potential for CO2 storage alone
in the North East Region
Field Name Plan Region Close of
Hydrocarbon Production (year)
Average Water Depth of Field
Estimated CO2 Storage (Mt)
Franklin GC HPHT North East 2030 - 93 + 62
Elgin GC HPHT North East 2030 - 93 + 63
Shearwater GC HPHT North East 2015 + 92 + 66
Britannia GC North East 2030 - 136 = 181
Total estimated Storage (Mt)
372
GC = Gas Condensate field; HPHT = High Pressure Temperature field. + parameter is technically or economically feasible; = parameter is technically or economically borderline; - parameter is technically or economically unfavourable.
(Source, SCCS, 2009) Table 178. Saline aquifers that meet both geotechnical and storage capacity
requirements in the North East Region
Saline aquifer Plan
Region Area (km²)
CO2 Storage Capacity (0.2% Storage
Efficiency) (Mt)
CO2 Storage Capacity (2% Storage
Efficiency) (Mt)
Forties + North East 16069 886 8856
Mey = North East 33190 1655 16549
Tay = North East 2484 133 1328
Captain = North East 3438 36 363
Mains = North East 4601 24 241
Total storage capacity (Mt) 2,734 27,337 + meets best practise geotechnical requirements (for depth, permeability and porosity); = meets minimum geotechnical requirements.
(Source: SCSS, 2009)
7.4.2 Regional Economic Value and Employment It is not currently possible to attribute economic values to sea areas for future CO2 storage (Baxter et al, 2011). See Section 2.4.3 for estimates of the potential value of, and employment within, the emerging CCS sector at a national level.
7.4.3 Future Trends Further hydrocarbon fields or saline aquifers suitable for CO2 storage may yet be discovered (SCCS, 2009). Subject to funding, a project proposal to design and develop a post-combustion CCS facility at the gas-fired power station at Peterhead, Aberdeenshire was announced in
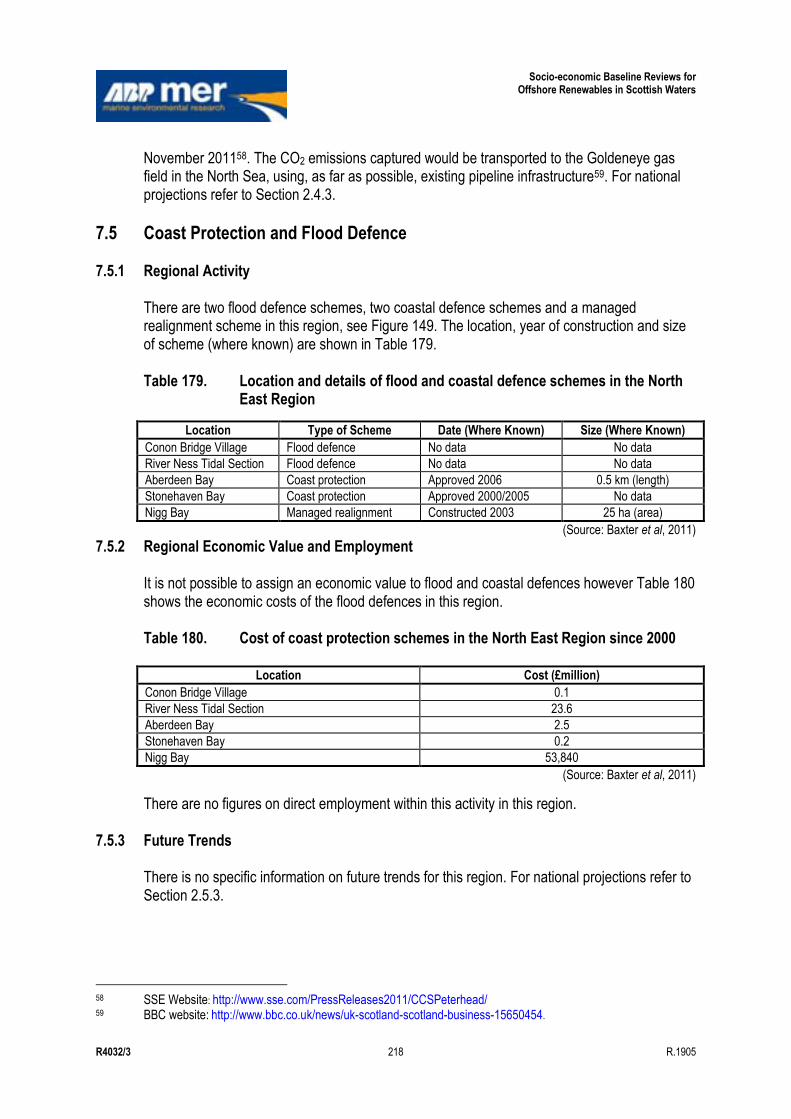
Socio-economic Baseline Reviews for Offshore Renewables in Scottish Waters
R4032/3 218 R.1905
November 201158. The CO2 emissions captured would be transported to the Goldeneye gas field in the North Sea, using, as far as possible, existing pipeline infrastructure59. For national projections refer to Section 2.4.3.
7.5 Coast Protection and Flood Defence
7.5.1 Regional Activity There are two flood defence schemes, two coastal defence schemes and a managed realignment scheme in this region, see Figure 149. The location, year of construction and size of scheme (where known) are shown in Table 179. Table 179. Location and details of flood and coastal defence schemes in the North
East Region
Location Type of Scheme Date (Where Known) Size (Where Known)
Conon Bridge Village Flood defence No data No data
River Ness Tidal Section Flood defence No data No data
Aberdeen Bay Coast protection Approved 2006 0.5 km (length)
Stonehaven Bay Coast protection Approved 2000/2005 No data
Nigg Bay Managed realignment Constructed 2003 25 ha (area)
(Source: Baxter et al, 2011) 7.5.2 Regional Economic Value and Employment
It is not possible to assign an economic value to flood and coastal defences however Table 180 shows the economic costs of the flood defences in this region. Table 180. Cost of coast protection schemes in the North East Region since 2000
Location Cost (£million)
Conon Bridge Village 0.1
River Ness Tidal Section 23.6
Aberdeen Bay 2.5
Stonehaven Bay 0.2
Nigg Bay 53,840
(Source: Baxter et al, 2011)
There are no figures on direct employment within this activity in this region.
7.5.3 Future Trends There is no specific information on future trends for this region. For national projections refer to Section 2.5.3.
58 SSE Website: http://www.sse.com/PressReleases2011/CCSPeterhead/ 59 BBC website: http://www.bbc.co.uk/news/uk-scotland-scotland-business-15650454.
Socio-economic Baseline Reviews for Offshore Renewables in Scottish Waters
R4032/3 219 R.1905
7.6 Commercial Fisheries
7.6.1 Regional Activity 7.6.1.1 Fish catching activities Landings caught by UK vessels within the North East SORER had an average annual value of £36.3 million (9.5% of the Scottish total) and an average annual live weight of 29,300 tonnes (6.8% of the Scottish total) for the ten year period from 2001 to 2010. Figures 150 to 153 show the annual average value (2001 to 2010) of the total landings taken from within this region, broken down for each ICES rectangle by species group, selected species, gear type and vessel length. Figures 154 to 156 show the value of all landings caught in the inshore and offshore waters of the West SORER waters by selected species, gear type and vessel length categories from 2001 to 2010. The majority of the value of landings from within the North East SORER is shellfish, however, the majority of the volume is pelagic species. There is a difference between the main species caught in inshore waters (within 12 nm from the coast) and offshore waters (greater than 12 nm from the coast). Inshore, landings of Nephrops accounted for 25% of the total catch value in 2010 whilst scallops made up 14% and other shellfish made up 55% of the total catch value. Offshore, landings of Nephrops accounted for 49% of the total catch value in 2010, 15% were haddock, 8% were scallops, 7% were monkfish and 6% were herring. In 2010, 48% of the value of landings from inshore waters were taken by vessels 10m and under in length, compared with 18% landed by vessels over 10m and under 15m and 34% landed by vessels 15m and over. Offshore, 94% of the value of landings was taken by vessels 15m and over in length.
For inshore waters, 31% of the total catch value was taken by pots, 26% by Nephrops trawls, 19% by dredges and 18% by „other trawls‟; whereas for offshore waters, 62% was taken by Nephrops trawls and 22% by demersal trawls.
Figures 157 and 158 show the overflight (surveillance) sightings by vessel type and nationality in the region from 2006 to 2010. Fishing is concentrated in the north of the Region and accounts for 13% of the national effort. British vessels are the most common nationality present at 95%. The majority (84%) are demersal trawlers, especially offshore, while pelagic trawlers and other gear types are seen closer to the coast.
The main administrative fishing ports in this region are Buckie, Fraserburgh, Peterhead and Aberdeen and there are also 20 smaller ports throughout the region. All the ports are shown in Figure 159.
Socio-economic Baseline Reviews for Offshore Renewables in Scottish Waters
R4032/3 220 R.1905
7.6.1.2 Fish processing activities
The North East SORER is one of the most important regions in the UK for the primary and mixed processing industry. There are several small to medium sized processing sites, for example carrying out filleting, freezing and smoking, concentrated around Fraserburgh and Peterhead. Whitefish and pelagic processing mainly takes places in this region.
The Peterhead and Fraserburgh Fish Processors Association (PFFPA) currently has 40 members, the majority being small processors employing between 5 and 20 staff. Collectively, the members employ around 3000 people.
There is now only one manufacturer of canned fish left in the UK, which is based in Fraserburgh. It focuses on the production of North Atlantic mackerel fillets and brisling sardines caught in the North Atlantic during the winter.
7.6.1.3 Wild salmon and sea trout
There are 5 fixed engine (2 on the North coast and 3 in the Moray Firth) and 13 net and coble netting sites (10 in the Moray Firth and 3 along the East coast) in the North East SORER (see Figure 159).
The main rod and line fishing rivers in this region are the Wick (second largest salmon fishing river in Caithness), Helmsdale (most productive salmon river in the North of Scotland and some sea trout fishing in summer months), Shin (salmon), Oykel (salmon), Carron (salmon), Alness (salmon and some sea trout), Conon (salmon and some sea trout), Beauly (salmon and some sea trout), Ness (one of the most productive salmon rivers in the North of Scotland), Nairn (salmon and some sea trout), Findhorn (salmon and some sea trout), Lossie (salmon and sea trout), Spey (probably the most famous salmon river in the world and one of the best sea trout rivers in the country), Deveron (salmon and sea trout), Don (salmon and sea trout), Dee (one of the best salmon rivers in Scotland and sea trout also caught) (Gray J., 2009). Sea trout catches have declined in recent years and salmon catches have also declined, one major impact being the building of hydro-electric dams, for example on the rivers Conon, Beauly and Shin.
7.6.2 Regional Economic Value and Employment 7.6.2.1 Fish catching activities The North East SORER is covered by the administrative ports of Buckie, Fraserburgh, Peterhead and Aberdeen. There are 1608 fishermen employed on Scottish based vessels in these districts; the largest numbers being located in Fraserburgh (789) and Peterhead (424). There are 1357 full-time fishermen and 251 part-time. There are 487 active vessels registered in these districts, 277 of which are 10m and under in length (Marine Scotland, 2011d). In the Fraserburgh Travel-to-work area, over 15% of total employment is directly involved in the fishing sector and in Peterhead between 5% and 10% is directly employed in the fishing sector (Baxter et al., 2011). Approximately 45% of the working population in the Fraserburgh area is

Socio-economic Baseline Reviews for Offshore Renewables in Scottish Waters
R4032/3 221 R.1905
either engaged in fishing directly or indirectly by providing the many services which are essential to keep a modern fishing fleet at sea (BPA, 2008). In 2010 fishing accounted for the employment of 789 individuals or 6% of the UK total (12,703) (MMO, 2012 http://www.marinemanagement.org.uk//fisheries/statistics/annual.htm). 7.6.2.2 Fish processing activities The largest concentration of employment in this sector in Scotland is located between Aberdeen and Fraserburgh. The ONS (2011) and Employment Survey statistics for processing activities in the North East SORER are shown in Table 181. Table 181. Employment in fish and shellfish processing and retail in the North East
SORER
SIC, 2007
Full-time Employment
Part-time Employment
Total Employment
2009 2010 2009 2010 2009 2010
Processing and preserving of fish, crustaceans and molluscs (SIC 10200)
2806 3220 320 350 3123 3571
(Source: ONS, 2011) 7.6.2.3 Wild salmon and sea trout There is no specific information on economic value and employment for this region. For a national overview refer to Section 2.6.3.
7.6.3 Future Trends There is no specific information on future trends for this region. For national projections refer to Section 2.6.3.
7.7 Energy Generation
7.7.1 Regional Activity Peterhead gas/oil power station is located within the region. It has an installed capacity of 1,540 MW60.
7.7.2 Regional Economic Value and Employment Information on regional economic value for energy generation is not available. The connectivity of the electricity grid means that the region cannot be delineated. In addition, data availability on electricity generation and supply is very limited due to security issues.
60 See Scottish Government Internet site
(http://www.scotland.gov.uk/Topics/Business-Industry/Energy/Infrastructure/Major-Power-Stations).

Socio-economic Baseline Reviews for Offshore Renewables in Scottish Waters
R4032/3 222 R.1905
Direct employment in the electricity sector in the North East Region can be estimated through looking at statistics from the ONS (2011) and Employment Survey. Figures for 2009 and 2010 for full and part time work under several relevant codes are given in Table 182 (note that jobs under other SIC codes will also be supported by the wider energy sector but have not been included here to avoid overestimation). Renewable energy related skills will already be in use in this region, since the Beatrice demonstration project is located here (see Figure 160). With a Round 3 wind zone proposed, employment in the electricity sector is likely to increase. Table 182. Employment in the electricity sector in North East by SIC Code
SIC Code, 2007 Full-time Part-time Totals
2009 2010 2009 2010 2009 2010
Production of electricity (3511) 362 785 23 53 385 838
Transmission of electricity (3512) 4 4 0 0 4 4
Distribution of electricity (3513) 398 448 28 21 426 469
Trade of electricity (3514) 5 5 1 1 6 6
Construction of utility projects for electricity and telecommunications (4222)
16 33 1 2 17 35
Electrical installation (4321) 2448 2056 140 97 2588 2153
Totals (Note that totals may not sum exactly due to rounding)
3,233 3,331 193 174 3,426 3,505
(Source: ONS, 2011)
7.7.3 Future Trends There is no specific information on future trends for this region. For national projections refer to Section 2.7.3.
7.8 Military Interests
7.8.1 Regional Activity The coastal military locations which occur within this region are shown in Figure 161. Military interests in this region include: Tain RAF bombing range on the Dornoch Firth; Kinloss and Lossiemouth RAF Bases (see Table 192 below); Black Dog Firing Range; Air Defence Radar at RAF Buchan; Hill of Dudwick Meteorological Weather Radar (DE Safeguarding, 2010); and Two predominantly offshore sea areas classified as both „firing danger‟ and „other‟
exercise areas adjacent to the Moray Firth. With regard to military aviation, additional information on RAF bases and exercise areas in this region are shown in Table 183.
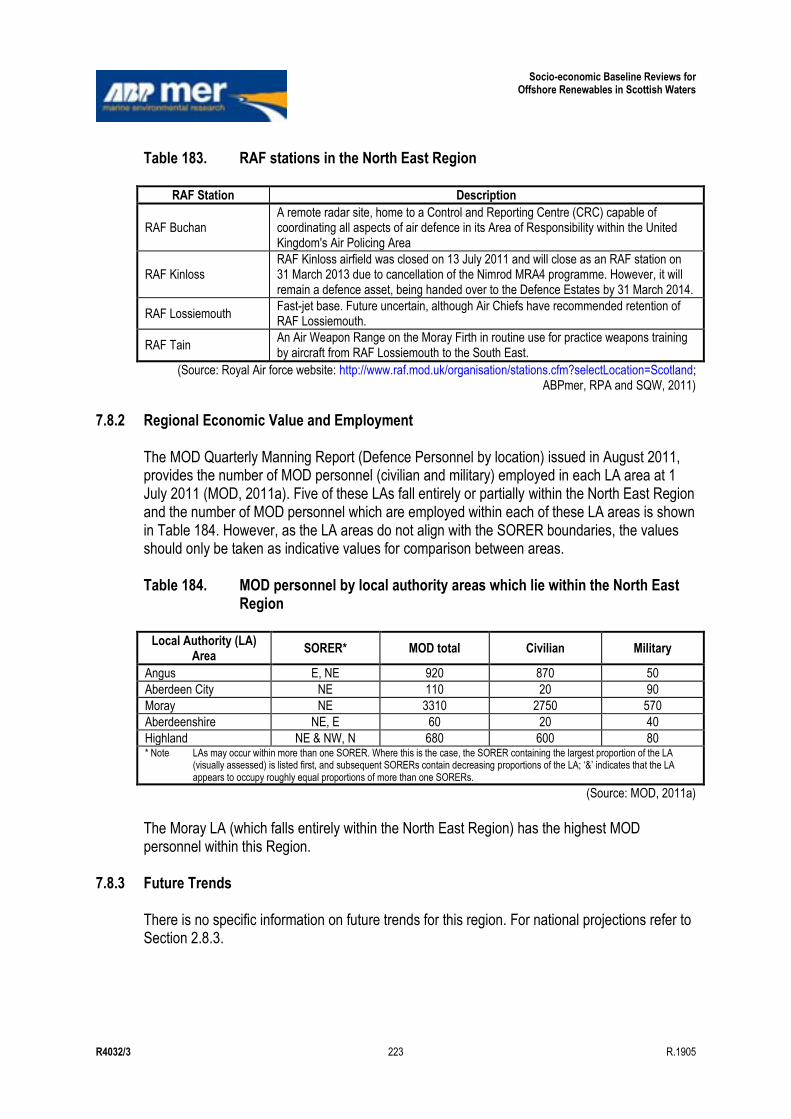
Socio-economic Baseline Reviews for Offshore Renewables in Scottish Waters
R4032/3 223 R.1905
Table 183. RAF stations in the North East Region
RAF Station Description
RAF Buchan A remote radar site, home to a Control and Reporting Centre (CRC) capable of coordinating all aspects of air defence in its Area of Responsibility within the United Kingdom's Air Policing Area
RAF Kinloss RAF Kinloss airfield was closed on 13 July 2011 and will close as an RAF station on 31 March 2013 due to cancellation of the Nimrod MRA4 programme. However, it will remain a defence asset, being handed over to the Defence Estates by 31 March 2014.
RAF Lossiemouth Fast-jet base. Future uncertain, although Air Chiefs have recommended retention of RAF Lossiemouth.
RAF Tain An Air Weapon Range on the Moray Firth in routine use for practice weapons training by aircraft from RAF Lossiemouth to the South East.
(Source: Royal Air force website: http://www.raf.mod.uk/organisation/stations.cfm?selectLocation=Scotland; ABPmer, RPA and SQW, 2011)
7.8.2 Regional Economic Value and Employment
The MOD Quarterly Manning Report (Defence Personnel by location) issued in August 2011, provides the number of MOD personnel (civilian and military) employed in each LA area at 1 July 2011 (MOD, 2011a). Five of these LAs fall entirely or partially within the North East Region and the number of MOD personnel which are employed within each of these LA areas is shown in Table 184. However, as the LA areas do not align with the SORER boundaries, the values should only be taken as indicative values for comparison between areas. Table 184. MOD personnel by local authority areas which lie within the North East
Region
Local Authority (LA) Area
SORER* MOD total Civilian Military
Angus E, NE 920 870 50
Aberdeen City NE 110 20 90
Moray NE 3310 2750 570
Aberdeenshire NE, E 60 20 40
Highland NE & NW, N 680 600 80 * Note LAs may occur within more than one SORER. Where this is the case, the SORER containing the largest proportion of the LA
(visually assessed) is listed first, and subsequent SORERs contain decreasing proportions of the LA; „&‟ indicates that the LA appears to occupy roughly equal proportions of more than one SORERs.
(Source: MOD, 2011a) The Moray LA (which falls entirely within the North East Region) has the highest MOD personnel within this Region.
7.8.3 Future Trends There is no specific information on future trends for this region. For national projections refer to Section 2.8.3.
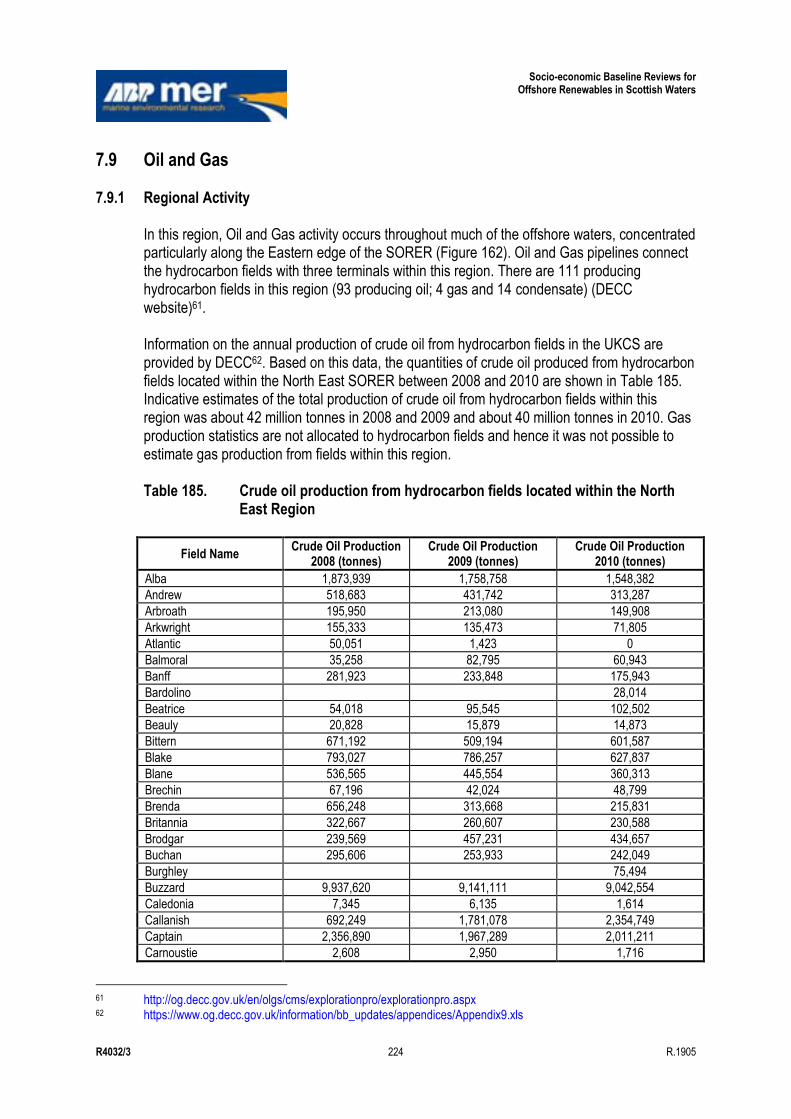
Socio-economic Baseline Reviews for Offshore Renewables in Scottish Waters
R4032/3 224 R.1905
7.9 Oil and Gas
7.9.1 Regional Activity In this region, Oil and Gas activity occurs throughout much of the offshore waters, concentrated particularly along the Eastern edge of the SORER (Figure 162). Oil and Gas pipelines connect the hydrocarbon fields with three terminals within this region. There are 111 producing hydrocarbon fields in this region (93 producing oil; 4 gas and 14 condensate) (DECC website)61. Information on the annual production of crude oil from hydrocarbon fields in the UKCS are provided by DECC62. Based on this data, the quantities of crude oil produced from hydrocarbon fields located within the North East SORER between 2008 and 2010 are shown in Table 185. Indicative estimates of the total production of crude oil from hydrocarbon fields within this region was about 42 million tonnes in 2008 and 2009 and about 40 million tonnes in 2010. Gas production statistics are not allocated to hydrocarbon fields and hence it was not possible to estimate gas production from fields within this region. Table 185. Crude oil production from hydrocarbon fields located within the North
East Region
Field Name Crude Oil Production
2008 (tonnes) Crude Oil Production
2009 (tonnes) Crude Oil Production
2010 (tonnes)
Alba 1,873,939 1,758,758 1,548,382
Andrew 518,683 431,742 313,287
Arbroath 195,950 213,080 149,908
Arkwright 155,333 135,473 71,805
Atlantic 50,051 1,423 0
Balmoral 35,258 82,795 60,943
Banff 281,923 233,848 175,943
Bardolino 28,014
Beatrice 54,018 95,545 102,502
Beauly 20,828 15,879 14,873
Bittern 671,192 509,194 601,587
Blake 793,027 786,257 627,837
Blane 536,565 445,554 360,313
Brechin 67,196 42,024 48,799
Brenda 656,248 313,668 215,831
Britannia 322,667 260,607 230,588
Brodgar 239,569 457,231 434,657
Buchan 295,606 253,933 242,049
Burghley 75,494
Buzzard 9,937,620 9,141,111 9,042,554
Caledonia 7,345 6,135 1,614
Callanish 692,249 1,781,078 2,354,749
Captain 2,356,890 1,967,289 2,011,211
Carnoustie 2,608 2,950 1,716
61 http://og.decc.gov.uk/en/olgs/cms/explorationpro/explorationpro.aspx 62 https://www.og.decc.gov.uk/information/bb_updates/appendices/Appendix9.xls
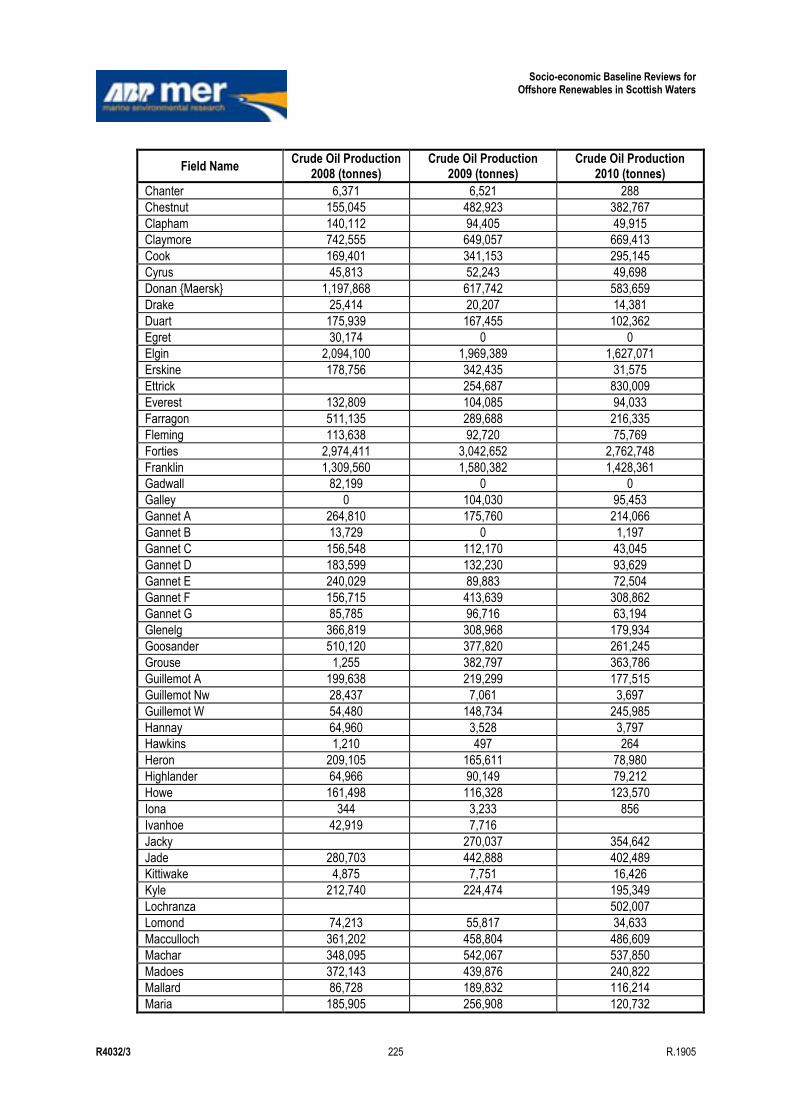
Socio-economic Baseline Reviews for Offshore Renewables in Scottish Waters
R4032/3 225 R.1905
Field Name Crude Oil Production
2008 (tonnes) Crude Oil Production
2009 (tonnes) Crude Oil Production
2010 (tonnes)
Chanter 6,371 6,521 288
Chestnut 155,045 482,923 382,767
Clapham 140,112 94,405 49,915
Claymore 742,555 649,057 669,413
Cook 169,401 341,153 295,145
Cyrus 45,813 52,243 49,698
Donan {Maersk} 1,197,868 617,742 583,659
Drake 25,414 20,207 14,381
Duart 175,939 167,455 102,362
Egret 30,174 0 0
Elgin 2,094,100 1,969,389 1,627,071
Erskine 178,756 342,435 31,575
Ettrick 254,687 830,009
Everest 132,809 104,085 94,033
Farragon 511,135 289,688 216,335
Fleming 113,638 92,720 75,769
Forties 2,974,411 3,042,652 2,762,748
Franklin 1,309,560 1,580,382 1,428,361
Gadwall 82,199 0 0
Galley 0 104,030 95,453
Gannet A 264,810 175,760 214,066
Gannet B 13,729 0 1,197
Gannet C 156,548 112,170 43,045
Gannet D 183,599 132,230 93,629
Gannet E 240,029 89,883 72,504
Gannet F 156,715 413,639 308,862
Gannet G 85,785 96,716 63,194
Glenelg 366,819 308,968 179,934
Goosander 510,120 377,820 261,245
Grouse 1,255 382,797 363,786
Guillemot A 199,638 219,299 177,515
Guillemot Nw 28,437 7,061 3,697
Guillemot W 54,480 148,734 245,985
Hannay 64,960 3,528 3,797
Hawkins 1,210 497 264
Heron 209,105 165,611 78,980
Highlander 64,966 90,149 79,212
Howe 161,498 116,328 123,570
Iona 344 3,233 856
Ivanhoe 42,919 7,716
Jacky 270,037 354,642
Jade 280,703 442,888 402,489
Kittiwake 4,875 7,751 16,426
Kyle 212,740 224,474 195,349
Lochranza 502,007
Lomond 74,213 55,817 34,633
Macculloch 361,202 458,804 486,609
Machar 348,095 542,067 537,850
Madoes 372,143 439,876 240,822
Mallard 86,728 189,832 116,214
Maria 185,905 256,908 120,732
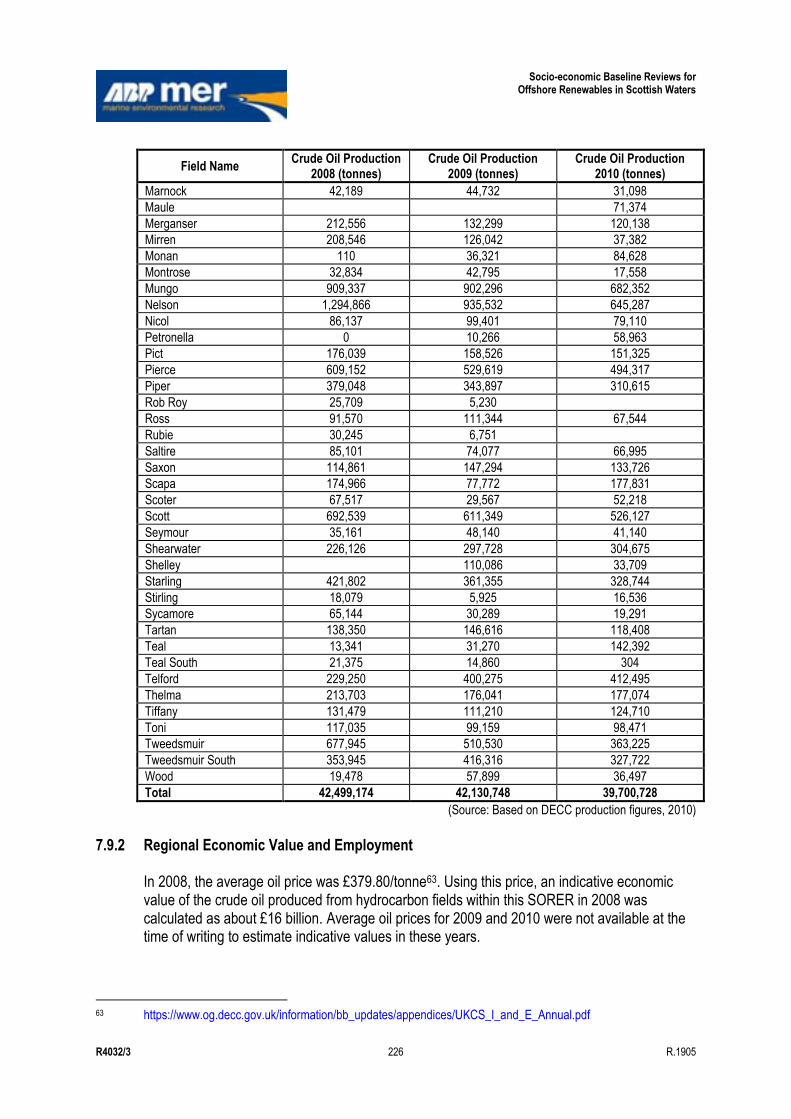
Socio-economic Baseline Reviews for Offshore Renewables in Scottish Waters
R4032/3 226 R.1905
Field Name Crude Oil Production
2008 (tonnes) Crude Oil Production
2009 (tonnes) Crude Oil Production
2010 (tonnes)
Marnock 42,189 44,732 31,098
Maule 71,374
Merganser 212,556 132,299 120,138
Mirren 208,546 126,042 37,382
Monan 110 36,321 84,628
Montrose 32,834 42,795 17,558
Mungo 909,337 902,296 682,352
Nelson 1,294,866 935,532 645,287
Nicol 86,137 99,401 79,110
Petronella 0 10,266 58,963
Pict 176,039 158,526 151,325
Pierce 609,152 529,619 494,317
Piper 379,048 343,897 310,615
Rob Roy 25,709 5,230
Ross 91,570 111,344 67,544
Rubie 30,245 6,751
Saltire 85,101 74,077 66,995
Saxon 114,861 147,294 133,726
Scapa 174,966 77,772 177,831
Scoter 67,517 29,567 52,218
Scott 692,539 611,349 526,127
Seymour 35,161 48,140 41,140
Shearwater 226,126 297,728 304,675
Shelley 110,086 33,709
Starling 421,802 361,355 328,744
Stirling 18,079 5,925 16,536
Sycamore 65,144 30,289 19,291
Tartan 138,350 146,616 118,408
Teal 13,341 31,270 142,392
Teal South 21,375 14,860 304
Telford 229,250 400,275 412,495
Thelma 213,703 176,041 177,074
Tiffany 131,479 111,210 124,710
Toni 117,035 99,159 98,471
Tweedsmuir 677,945 510,530 363,225
Tweedsmuir South 353,945 416,316 327,722
Wood 19,478 57,899 36,497
Total 42,499,174 42,130,748 39,700,728
(Source: Based on DECC production figures, 2010)
7.9.2 Regional Economic Value and Employment In 2008, the average oil price was £379.80/tonne63. Using this price, an indicative economic value of the crude oil produced from hydrocarbon fields within this SORER in 2008 was calculated as about £16 billion. Average oil prices for 2009 and 2010 were not available at the time of writing to estimate indicative values in these years.
63 https://www.og.decc.gov.uk/information/bb_updates/appendices/UKCS_I_and_E_Annual.pdf
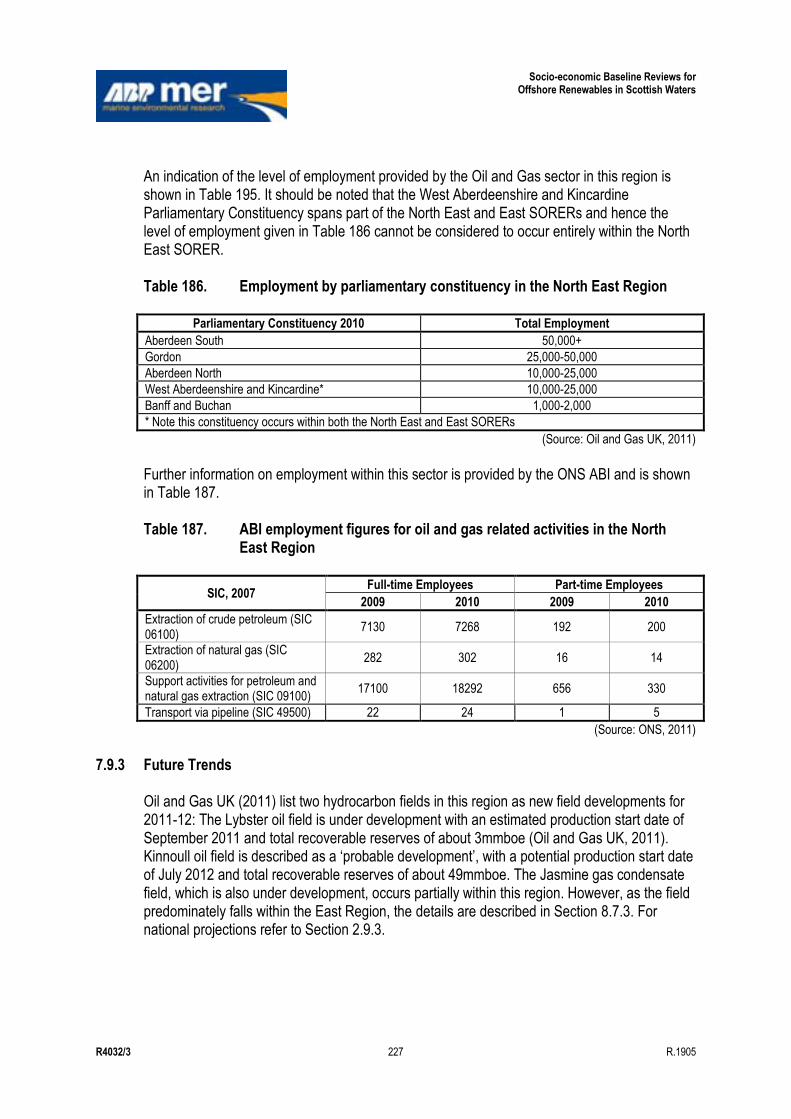
Socio-economic Baseline Reviews for Offshore Renewables in Scottish Waters
R4032/3 227 R.1905
An indication of the level of employment provided by the Oil and Gas sector in this region is shown in Table 195. It should be noted that the West Aberdeenshire and Kincardine Parliamentary Constituency spans part of the North East and East SORERs and hence the level of employment given in Table 186 cannot be considered to occur entirely within the North East SORER. Table 186. Employment by parliamentary constituency in the North East Region
Parliamentary Constituency 2010 Total Employment
Aberdeen South 50,000+
Gordon 25,000-50,000
Aberdeen North 10,000-25,000
West Aberdeenshire and Kincardine* 10,000-25,000
Banff and Buchan 1,000-2,000
* Note this constituency occurs within both the North East and East SORERs
(Source: Oil and Gas UK, 2011) Further information on employment within this sector is provided by the ONS ABI and is shown in Table 187. Table 187. ABI employment figures for oil and gas related activities in the North
East Region
SIC, 2007 Full-time Employees Part-time Employees
2009 2010 2009 2010
Extraction of crude petroleum (SIC 06100)
7130 7268 192 200
Extraction of natural gas (SIC 06200)
282 302 16 14
Support activities for petroleum and natural gas extraction (SIC 09100)
17100 18292 656 330
Transport via pipeline (SIC 49500) 22 24 1 5
(Source: ONS, 2011)
7.9.3 Future Trends Oil and Gas UK (2011) list two hydrocarbon fields in this region as new field developments for 2011-12: The Lybster oil field is under development with an estimated production start date of September 2011 and total recoverable reserves of about 3mmboe (Oil and Gas UK, 2011). Kinnoull oil field is described as a „probable development‟, with a potential production start date of July 2012 and total recoverable reserves of about 49mmboe. The Jasmine gas condensate field, which is also under development, occurs partially within this region. However, as the field predominately falls within the East Region, the details are described in Section 8.7.3. For national projections refer to Section 2.9.3.
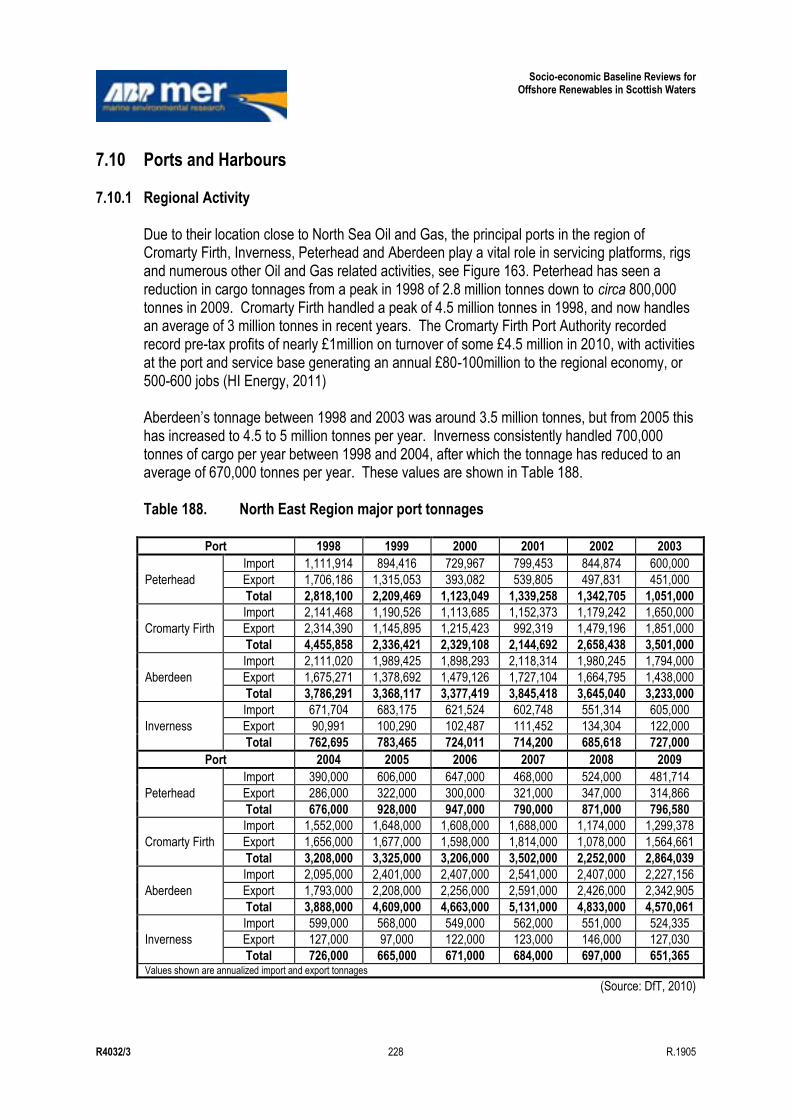
Socio-economic Baseline Reviews for Offshore Renewables in Scottish Waters
R4032/3 228 R.1905
7.10 Ports and Harbours
7.10.1 Regional Activity Due to their location close to North Sea Oil and Gas, the principal ports in the region of Cromarty Firth, Inverness, Peterhead and Aberdeen play a vital role in servicing platforms, rigs and numerous other Oil and Gas related activities, see Figure 163. Peterhead has seen a reduction in cargo tonnages from a peak in 1998 of 2.8 million tonnes down to circa 800,000 tonnes in 2009. Cromarty Firth handled a peak of 4.5 million tonnes in 1998, and now handles an average of 3 million tonnes in recent years. The Cromarty Firth Port Authority recorded record pre-tax profits of nearly £1million on turnover of some £4.5 million in 2010, with activities at the port and service base generating an annual £80-100million to the regional economy, or 500-600 jobs (HI Energy, 2011) Aberdeen‟s tonnage between 1998 and 2003 was around 3.5 million tonnes, but from 2005 this has increased to 4.5 to 5 million tonnes per year. Inverness consistently handled 700,000 tonnes of cargo per year between 1998 and 2004, after which the tonnage has reduced to an average of 670,000 tonnes per year. These values are shown in Table 188. Table 188. North East Region major port tonnages
Port 1998 1999 2000 2001 2002 2003
Peterhead
Import 1,111,914 894,416 729,967 799,453 844,874 600,000
Export 1,706,186 1,315,053 393,082 539,805 497,831 451,000
Total 2,818,100 2,209,469 1,123,049 1,339,258 1,342,705 1,051,000
Cromarty Firth
Import 2,141,468 1,190,526 1,113,685 1,152,373 1,179,242 1,650,000
Export 2,314,390 1,145,895 1,215,423 992,319 1,479,196 1,851,000
Total 4,455,858 2,336,421 2,329,108 2,144,692 2,658,438 3,501,000
Aberdeen
Import 2,111,020 1,989,425 1,898,293 2,118,314 1,980,245 1,794,000
Export 1,675,271 1,378,692 1,479,126 1,727,104 1,664,795 1,438,000
Total 3,786,291 3,368,117 3,377,419 3,845,418 3,645,040 3,233,000
Inverness
Import 671,704 683,175 621,524 602,748 551,314 605,000
Export 90,991 100,290 102,487 111,452 134,304 122,000
Total 762,695 783,465 724,011 714,200 685,618 727,000
Port 2004 2005 2006 2007 2008 2009
Peterhead
Import 390,000 606,000 647,000 468,000 524,000 481,714
Export 286,000 322,000 300,000 321,000 347,000 314,866
Total 676,000 928,000 947,000 790,000 871,000 796,580
Cromarty Firth
Import 1,552,000 1,648,000 1,608,000 1,688,000 1,174,000 1,299,378
Export 1,656,000 1,677,000 1,598,000 1,814,000 1,078,000 1,564,661
Total 3,208,000 3,325,000 3,206,000 3,502,000 2,252,000 2,864,039
Aberdeen
Import 2,095,000 2,401,000 2,407,000 2,541,000 2,407,000 2,227,156
Export 1,793,000 2,208,000 2,256,000 2,591,000 2,426,000 2,342,905
Total 3,888,000 4,609,000 4,663,000 5,131,000 4,833,000 4,570,061
Inverness
Import 599,000 568,000 549,000 562,000 551,000 524,335
Export 127,000 97,000 122,000 123,000 146,000 127,030
Total 726,000 665,000 671,000 684,000 697,000 651,365 Values shown are annualized import and export tonnages
(Source: DfT, 2010)
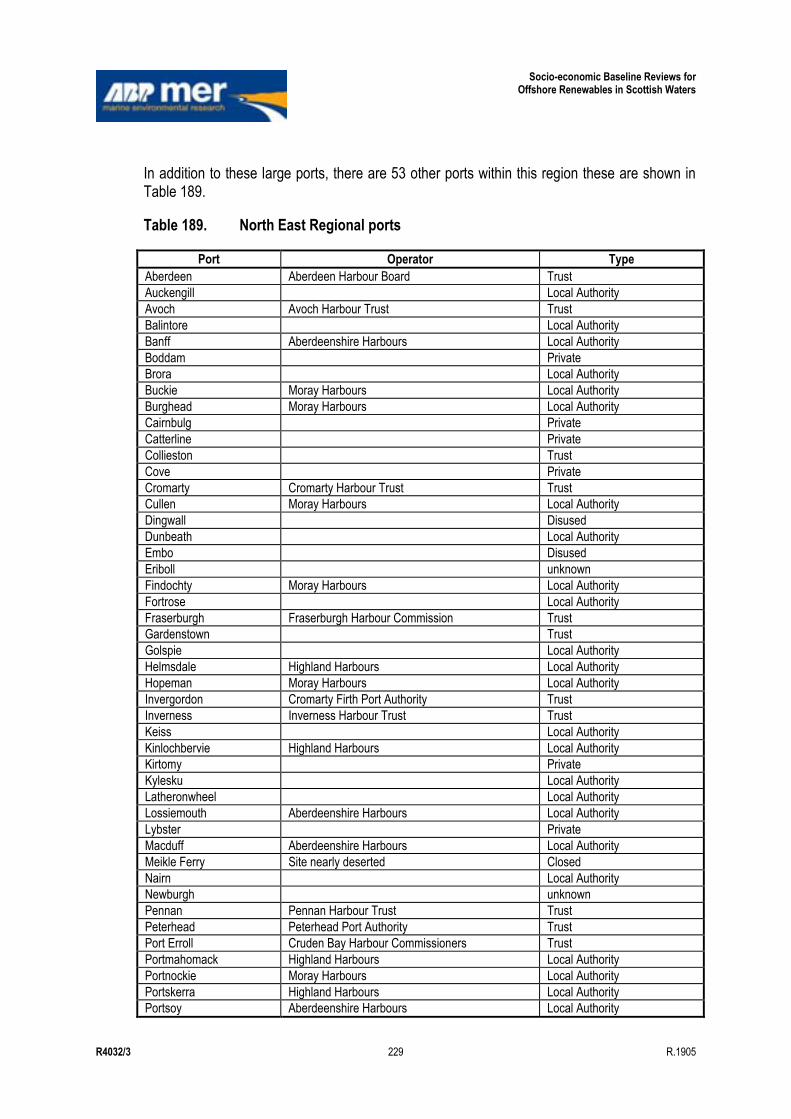
Socio-economic Baseline Reviews for Offshore Renewables in Scottish Waters
R4032/3 229 R.1905
In addition to these large ports, there are 53 other ports within this region these are shown in Table 189.
Table 189. North East Regional ports
Port Operator Type
Aberdeen Aberdeen Harbour Board Trust
Auckengill Local Authority
Avoch Avoch Harbour Trust Trust
Balintore Local Authority
Banff Aberdeenshire Harbours Local Authority
Boddam Private
Brora Local Authority
Buckie Moray Harbours Local Authority
Burghead Moray Harbours Local Authority
Cairnbulg Private
Catterline Private
Collieston Trust
Cove Private
Cromarty Cromarty Harbour Trust Trust
Cullen Moray Harbours Local Authority
Dingwall Disused
Dunbeath Local Authority
Embo Disused
Eriboll unknown
Findochty Moray Harbours Local Authority
Fortrose Local Authority
Fraserburgh Fraserburgh Harbour Commission Trust
Gardenstown Trust
Golspie Local Authority
Helmsdale Highland Harbours Local Authority
Hopeman Moray Harbours Local Authority
Invergordon Cromarty Firth Port Authority Trust
Inverness Inverness Harbour Trust Trust
Keiss Local Authority
Kinlochbervie Highland Harbours Local Authority
Kirtomy Private
Kylesku Local Authority
Latheronwheel Local Authority
Lossiemouth Aberdeenshire Harbours Local Authority
Lybster Private
Macduff Aberdeenshire Harbours Local Authority
Meikle Ferry Site nearly deserted Closed
Nairn Local Authority
Newburgh unknown
Pennan Pennan Harbour Trust Trust
Peterhead Peterhead Port Authority Trust
Port Erroll Cruden Bay Harbour Commissioners Trust
Portmahomack Highland Harbours Local Authority
Portnockie Moray Harbours Local Authority
Portskerra Highland Harbours Local Authority
Portsoy Aberdeenshire Harbours Local Authority
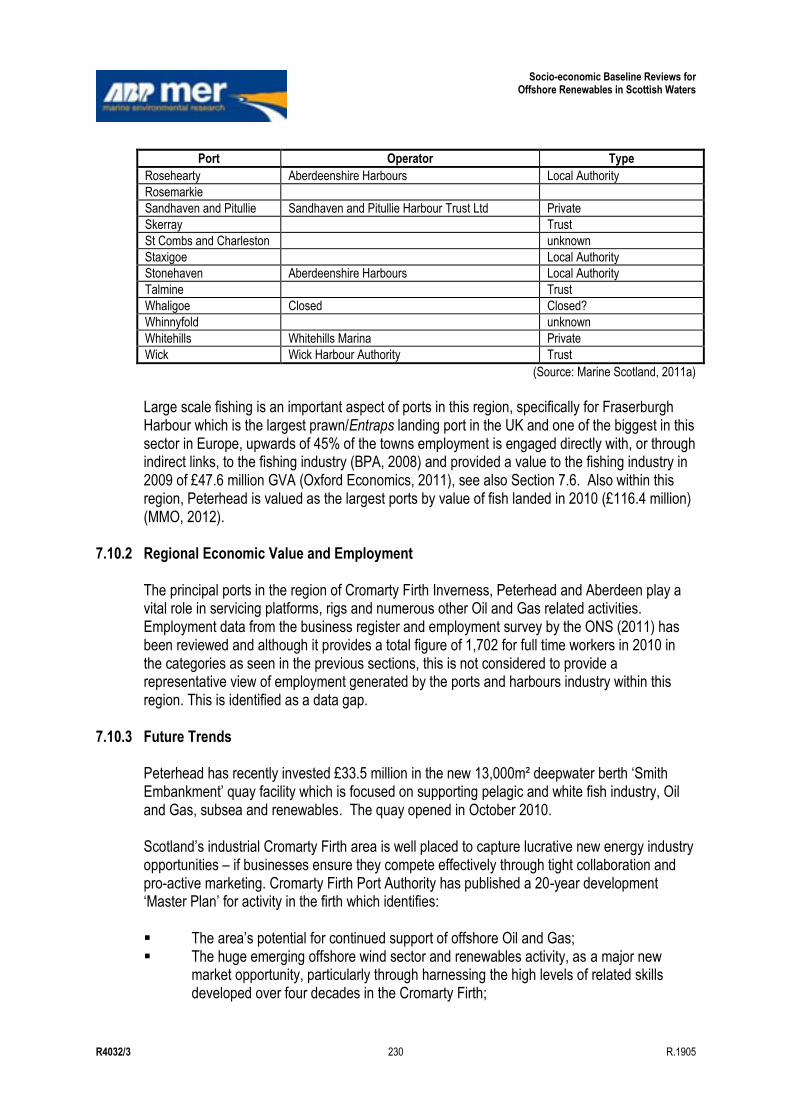
Socio-economic Baseline Reviews for Offshore Renewables in Scottish Waters
R4032/3 230 R.1905
Port Operator Type
Rosehearty Aberdeenshire Harbours Local Authority
Rosemarkie
Sandhaven and Pitullie Sandhaven and Pitullie Harbour Trust Ltd Private
Skerray Trust
St Combs and Charleston unknown
Staxigoe Local Authority
Stonehaven Aberdeenshire Harbours Local Authority
Talmine Trust
Whaligoe Closed Closed?
Whinnyfold unknown
Whitehills Whitehills Marina Private
Wick Wick Harbour Authority Trust
(Source: Marine Scotland, 2011a) Large scale fishing is an important aspect of ports in this region, specifically for Fraserburgh Harbour which is the largest prawn/Entraps landing port in the UK and one of the biggest in this sector in Europe, upwards of 45% of the towns employment is engaged directly with, or through indirect links, to the fishing industry (BPA, 2008) and provided a value to the fishing industry in 2009 of £47.6 million GVA (Oxford Economics, 2011), see also Section 7.6. Also within this region, Peterhead is valued as the largest ports by value of fish landed in 2010 (£116.4 million) (MMO, 2012).
7.10.2 Regional Economic Value and Employment The principal ports in the region of Cromarty Firth Inverness, Peterhead and Aberdeen play a vital role in servicing platforms, rigs and numerous other Oil and Gas related activities. Employment data from the business register and employment survey by the ONS (2011) has been reviewed and although it provides a total figure of 1,702 for full time workers in 2010 in the categories as seen in the previous sections, this is not considered to provide a representative view of employment generated by the ports and harbours industry within this region. This is identified as a data gap.
7.10.3 Future Trends Peterhead has recently invested £33.5 million in the new 13,000m² deepwater berth „Smith Embankment‟ quay facility which is focused on supporting pelagic and white fish industry, Oil and Gas, subsea and renewables. The quay opened in October 2010. Scotland‟s industrial Cromarty Firth area is well placed to capture lucrative new energy industry opportunities – if businesses ensure they compete effectively through tight collaboration and pro-active marketing. Cromarty Firth Port Authority has published a 20-year development „Master Plan‟ for activity in the firth which identifies: The area‟s potential for continued support of offshore Oil and Gas; The huge emerging offshore wind sector and renewables activity, as a major new
market opportunity, particularly through harnessing the high levels of related skills developed over four decades in the Cromarty Firth;
Socio-economic Baseline Reviews for Offshore Renewables in Scottish Waters
R4032/3 231 R.1905
Refocusing of the marine construction and other services towards renewable
industries; Maintain and expand existing operations in inspection, repair and maintenance (IRM)
of Oil and Gas platforms; and The Cromarty Firth Market Assessment and Development Plan stresses that breaking
into the new markets will require stronger collaboration, both within industry and with the public sector, at regional and national levels (HI Energy, 2011).
Aberdeen Harbour Authority is investing £65 million in a development strategy which will redevelop the existing wharves at Torry Quay and replace them with 300 metres of realigned quays which are designed for modern, deep draughted ships and heavy cargoes (Oil Voice, 2011) Inverness Harbour Trust continue to improve facilities at the harbour with the recent completion and opening of the North Longman Development, which included the provision of new marine leisure and boat lift facilities in 2009. This is being followed in 2011 by new road access routes into the port to allow 50m wind farm blades to be transported into the harbour. Fraserburgh Harbour recently opened a six berth repair Ship lift, and together with its dry dock, the facilities are regularly used by the harbour‟s fishing fleet, as well as a growing number of oil vessels and ferries. The facilities provide employment for a rage of ancillary trades including carpenters, painters and welders to service all types of vessels (BPA, 2008).
7.11 Power Interconnectors
7.11.1 Regional Activity There are no subsea domestic or international power interconnectors within this region, see Figure 164. Note subsea cables to/from developments, such as the Beatrice wind farm zone, have been excluded from this analysis.
7.11.2 Regional Economic Value and Employment It is not currently possible to assign an economic value to power interconnectors and there are no interconnectors within this region. As such, although information on employment within the power interconnector sector was available from the ONS ABI, it has been assumed that the employment figures were not associated with domestic or international subsea power cables.
7.11.3 Future Trends There are a number of proposed marine power interconnector developments in the UK at various stages of maturity in the planning process. Those that may be relevant to this region (e.g. may pass through and/or make landfall within the region) are shown in Table 190.
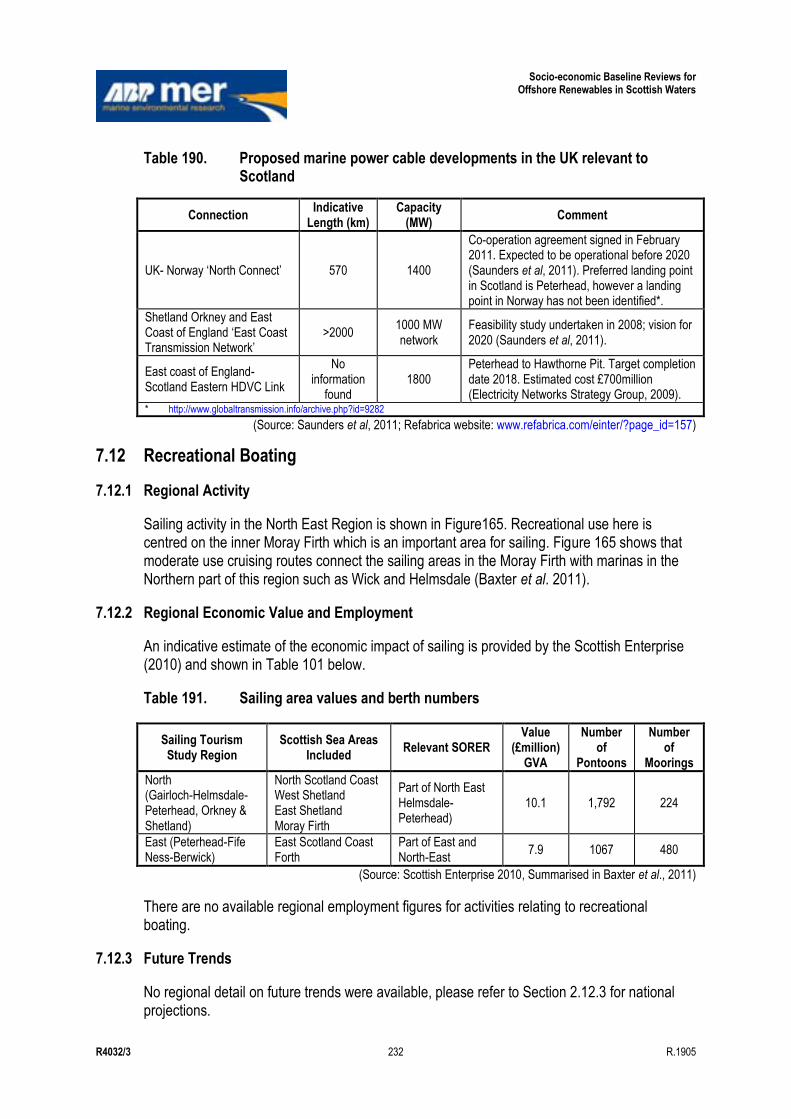
Socio-economic Baseline Reviews for Offshore Renewables in Scottish Waters
R4032/3 232 R.1905
Table 190. Proposed marine power cable developments in the UK relevant to Scotland
Connection Indicative
Length (km) Capacity
(MW) Comment
UK- Norway „North Connect‟ 570 1400
Co-operation agreement signed in February 2011. Expected to be operational before 2020 (Saunders et al, 2011). Preferred landing point in Scotland is Peterhead, however a landing point in Norway has not been identified*.
Shetland Orkney and East Coast of England „East Coast Transmission Network‟
>2000 1000 MW network
Feasibility study undertaken in 2008; vision for 2020 (Saunders et al, 2011).
East coast of England-Scotland Eastern HDVC Link
No information
found 1800
Peterhead to Hawthorne Pit. Target completion date 2018. Estimated cost £700million (Electricity Networks Strategy Group, 2009).
* http://www.globaltransmission.info/archive.php?id=9282
(Source: Saunders et al, 2011; Refabrica website: www.refabrica.com/einter/?page_id=157)
7.12 Recreational Boating
7.12.1 Regional Activity
Sailing activity in the North East Region is shown in Figure165. Recreational use here is centred on the inner Moray Firth which is an important area for sailing. Figure 165 shows that moderate use cruising routes connect the sailing areas in the Moray Firth with marinas in the Northern part of this region such as Wick and Helmsdale (Baxter et al. 2011).
7.12.2 Regional Economic Value and Employment
An indicative estimate of the economic impact of sailing is provided by the Scottish Enterprise (2010) and shown in Table 101 below.
Table 191. Sailing area values and berth numbers
Sailing Tourism Study Region
Scottish Sea Areas Included
Relevant SORER Value
(£million) GVA
Number of
Pontoons
Number of
Moorings
North (Gairloch-Helmsdale-Peterhead, Orkney & Shetland)
North Scotland Coast West Shetland East Shetland Moray Firth
Part of North East Helmsdale-Peterhead)
10.1 1,792 224
East (Peterhead-Fife Ness-Berwick)
East Scotland Coast Forth
Part of East and North-East
7.9 1067 480
(Source: Scottish Enterprise 2010, Summarised in Baxter et al., 2011)
There are no available regional employment figures for activities relating to recreational boating.
7.12.3 Future Trends
No regional detail on future trends were available, please refer to Section 2.12.3 for national projections.
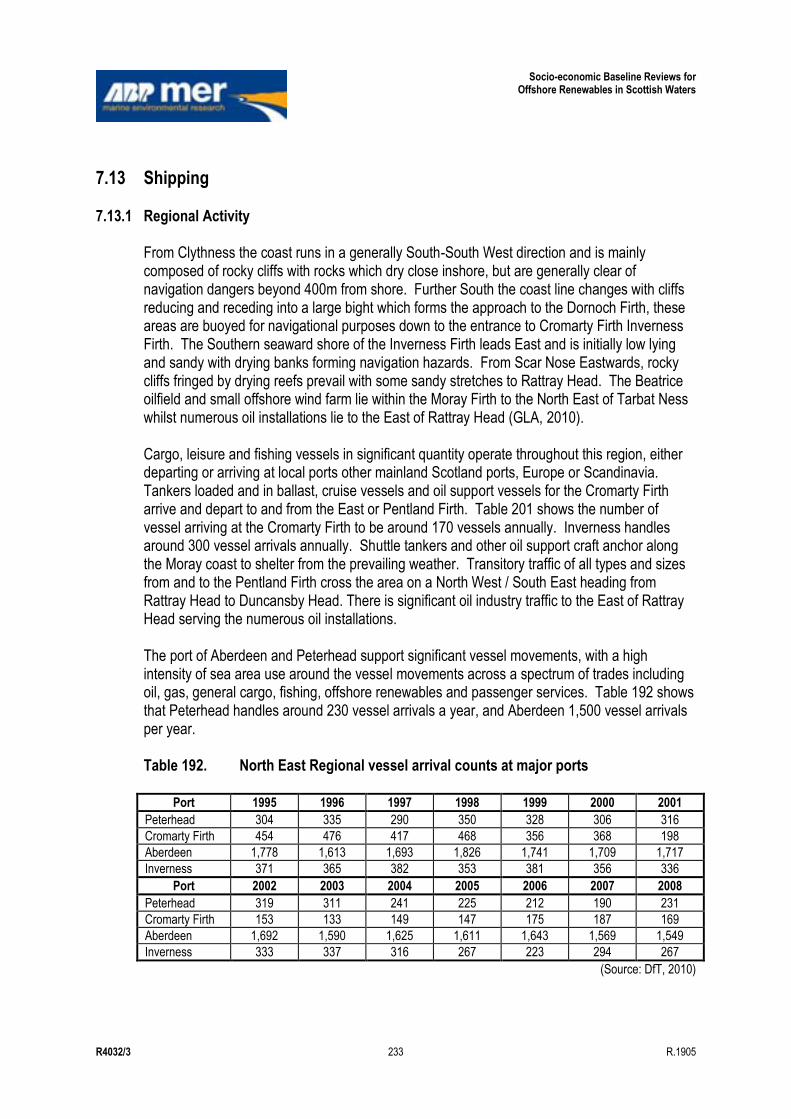
Socio-economic Baseline Reviews for Offshore Renewables in Scottish Waters
R4032/3 233 R.1905
7.13 Shipping
7.13.1 Regional Activity From Clythness the coast runs in a generally South-South West direction and is mainly composed of rocky cliffs with rocks which dry close inshore, but are generally clear of navigation dangers beyond 400m from shore. Further South the coast line changes with cliffs reducing and receding into a large bight which forms the approach to the Dornoch Firth, these areas are buoyed for navigational purposes down to the entrance to Cromarty Firth Inverness Firth. The Southern seaward shore of the Inverness Firth leads East and is initially low lying and sandy with drying banks forming navigation hazards. From Scar Nose Eastwards, rocky cliffs fringed by drying reefs prevail with some sandy stretches to Rattray Head. The Beatrice oilfield and small offshore wind farm lie within the Moray Firth to the North East of Tarbat Ness whilst numerous oil installations lie to the East of Rattray Head (GLA, 2010). Cargo, leisure and fishing vessels in significant quantity operate throughout this region, either departing or arriving at local ports other mainland Scotland ports, Europe or Scandinavia. Tankers loaded and in ballast, cruise vessels and oil support vessels for the Cromarty Firth arrive and depart to and from the East or Pentland Firth. Table 201 shows the number of vessel arriving at the Cromarty Firth to be around 170 vessels annually. Inverness handles around 300 vessel arrivals annually. Shuttle tankers and other oil support craft anchor along the Moray coast to shelter from the prevailing weather. Transitory traffic of all types and sizes from and to the Pentland Firth cross the area on a North West / South East heading from Rattray Head to Duncansby Head. There is significant oil industry traffic to the East of Rattray Head serving the numerous oil installations. The port of Aberdeen and Peterhead support significant vessel movements, with a high intensity of sea area use around the vessel movements across a spectrum of trades including oil, gas, general cargo, fishing, offshore renewables and passenger services. Table 192 shows that Peterhead handles around 230 vessel arrivals a year, and Aberdeen 1,500 vessel arrivals per year. Table 192. North East Regional vessel arrival counts at major ports
Port 1995 1996 1997 1998 1999 2000 2001
Peterhead 304 335 290 350 328 306 316
Cromarty Firth 454 476 417 468 356 368 198
Aberdeen 1,778 1,613 1,693 1,826 1,741 1,709 1,717
Inverness 371 365 382 353 381 356 336
Port 2002 2003 2004 2005 2006 2007 2008
Peterhead 319 311 241 225 212 190 231
Cromarty Firth 153 133 149 147 175 187 169
Aberdeen 1,692 1,590 1,625 1,611 1,643 1,569 1,549
Inverness 333 337 316 267 223 294 267
(Source: DfT, 2010)
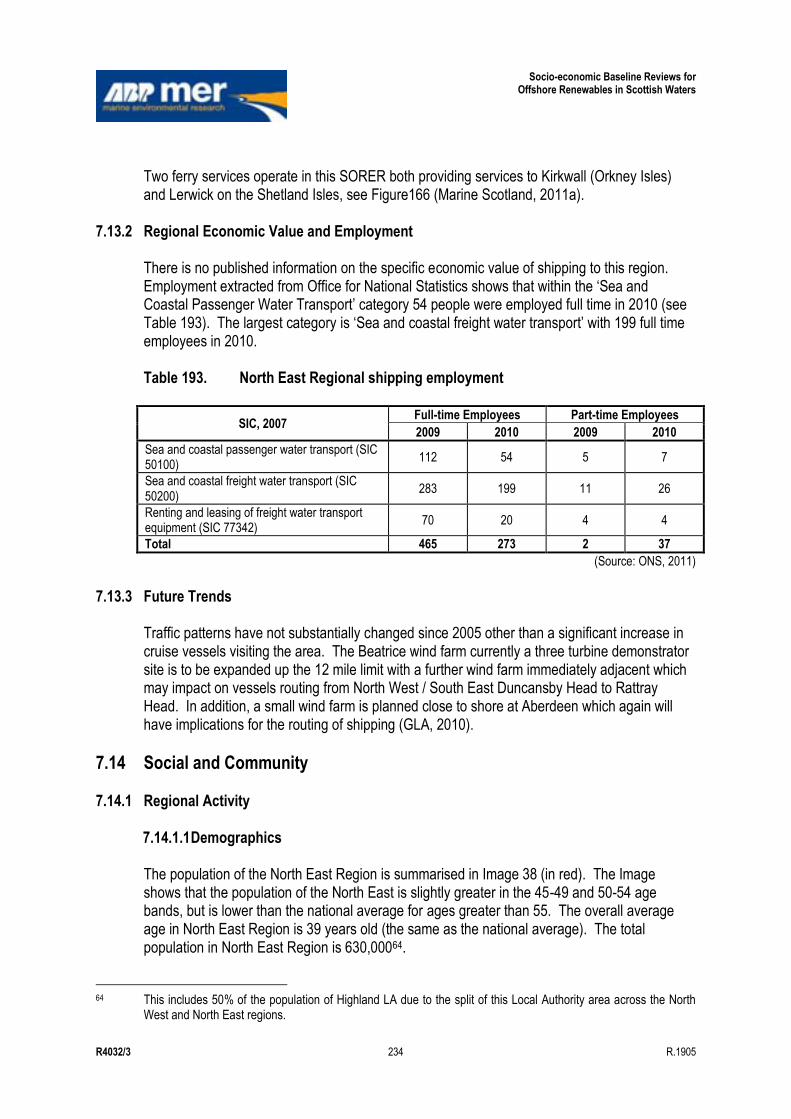
Socio-economic Baseline Reviews for Offshore Renewables in Scottish Waters
R4032/3 234 R.1905
Two ferry services operate in this SORER both providing services to Kirkwall (Orkney Isles) and Lerwick on the Shetland Isles, see Figure166 (Marine Scotland, 2011a).
7.13.2 Regional Economic Value and Employment There is no published information on the specific economic value of shipping to this region. Employment extracted from Office for National Statistics shows that within the „Sea and Coastal Passenger Water Transport‟ category 54 people were employed full time in 2010 (see Table 193). The largest category is „Sea and coastal freight water transport‟ with 199 full time employees in 2010. Table 193. North East Regional shipping employment
SIC, 2007 Full-time Employees Part-time Employees
2009 2010 2009 2010
Sea and coastal passenger water transport (SIC 50100)
112 54 5 7
Sea and coastal freight water transport (SIC 50200)
283 199 11 26
Renting and leasing of freight water transport equipment (SIC 77342)
70 20 4 4
Total 465 273 2 37
(Source: ONS, 2011)
7.13.3 Future Trends
Traffic patterns have not substantially changed since 2005 other than a significant increase in cruise vessels visiting the area. The Beatrice wind farm currently a three turbine demonstrator site is to be expanded up the 12 mile limit with a further wind farm immediately adjacent which may impact on vessels routing from North West / South East Duncansby Head to Rattray Head. In addition, a small wind farm is planned close to shore at Aberdeen which again will have implications for the routing of shipping (GLA, 2010).
7.14 Social and Community
7.14.1 Regional Activity 7.14.1.1 Demographics The population of the North East Region is summarised in Image 38 (in red). The Image shows that the population of the North East is slightly greater in the 45-49 and 50-54 age bands, but is lower than the national average for ages greater than 55. The overall average age in North East Region is 39 years old (the same as the national average). The total population in North East Region is 630,00064.
64 This includes 50% of the population of Highland LA due to the split of this Local Authority area across the North
West and North East regions.
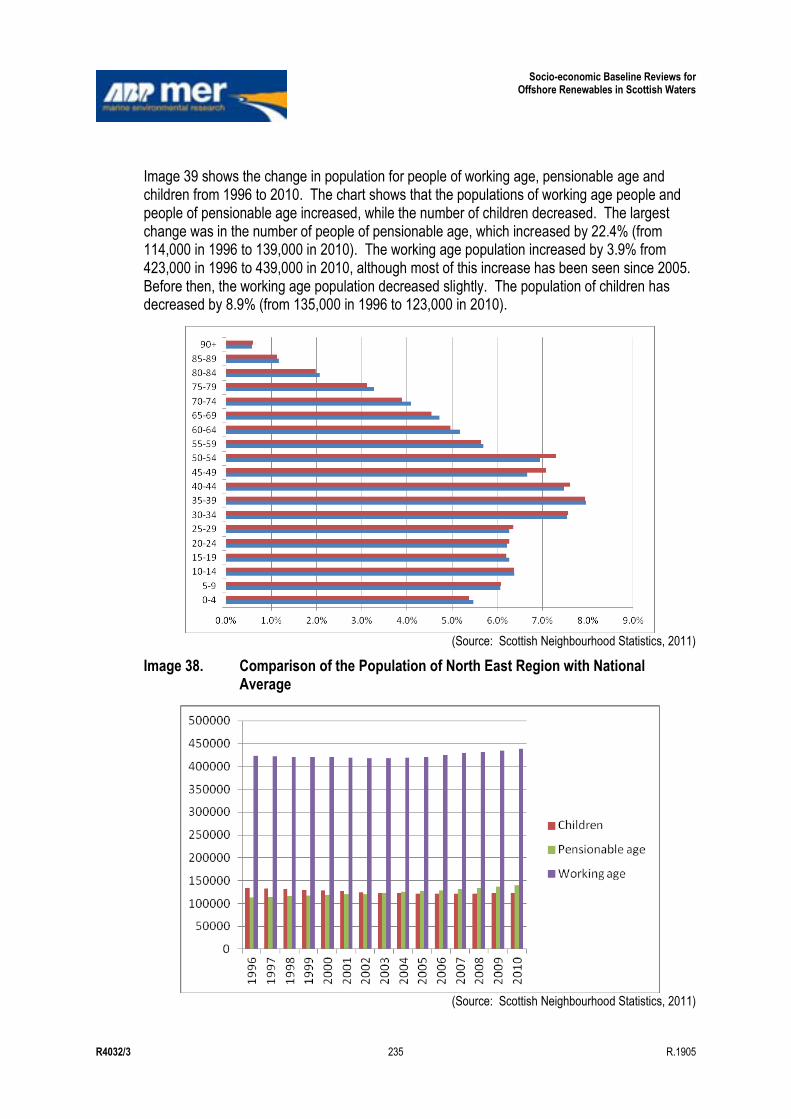
Socio-economic Baseline Reviews for Offshore Renewables in Scottish Waters
R4032/3 235 R.1905
Image 39 shows the change in population for people of working age, pensionable age and children from 1996 to 2010. The chart shows that the populations of working age people and people of pensionable age increased, while the number of children decreased. The largest change was in the number of people of pensionable age, which increased by 22.4% (from 114,000 in 1996 to 139,000 in 2010). The working age population increased by 3.9% from 423,000 in 1996 to 439,000 in 2010, although most of this increase has been seen since 2005. Before then, the working age population decreased slightly. The population of children has decreased by 8.9% (from 135,000 in 1996 to 123,000 in 2010).
(Source: Scottish Neighbourhood Statistics, 2011)
Image 38. Comparison of the Population of North East Region with National Average
(Source: Scottish Neighbourhood Statistics, 2011)
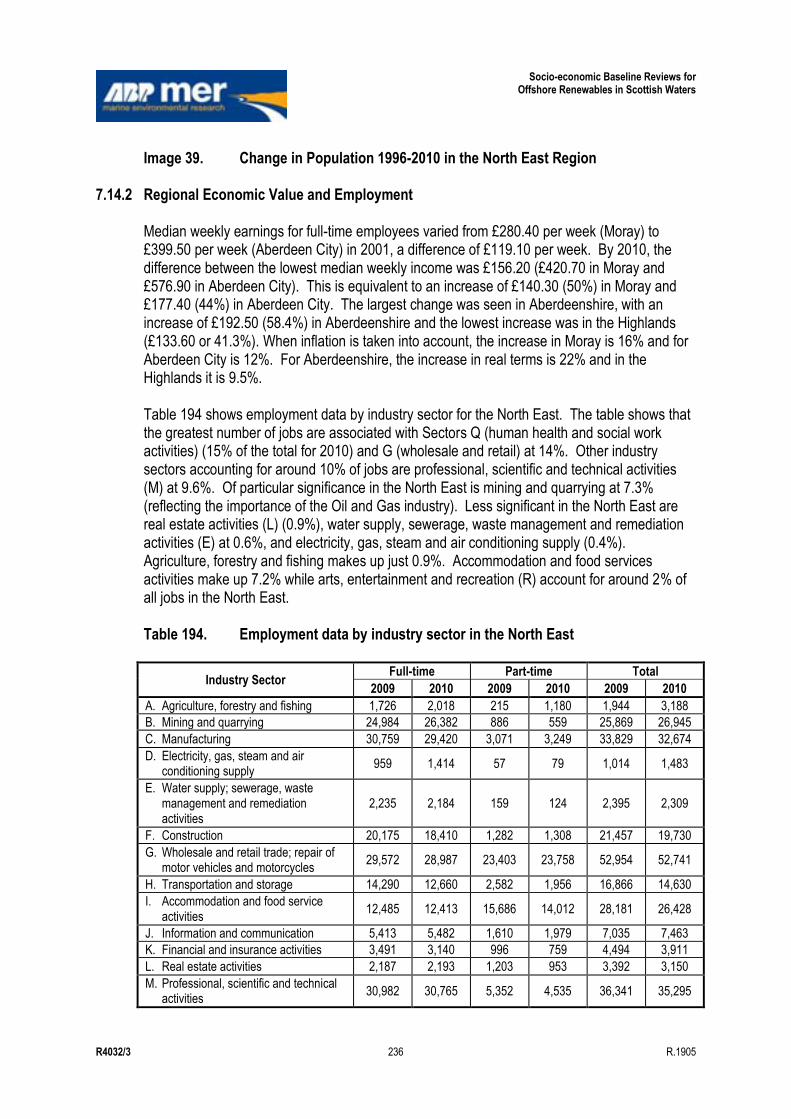
Socio-economic Baseline Reviews for Offshore Renewables in Scottish Waters
R4032/3 236 R.1905
Image 39. Change in Population 1996-2010 in the North East Region
7.14.2 Regional Economic Value and Employment Median weekly earnings for full-time employees varied from £280.40 per week (Moray) to £399.50 per week (Aberdeen City) in 2001, a difference of £119.10 per week. By 2010, the difference between the lowest median weekly income was £156.20 (£420.70 in Moray and £576.90 in Aberdeen City). This is equivalent to an increase of £140.30 (50%) in Moray and £177.40 (44%) in Aberdeen City. The largest change was seen in Aberdeenshire, with an increase of £192.50 (58.4%) in Aberdeenshire and the lowest increase was in the Highlands (£133.60 or 41.3%). When inflation is taken into account, the increase in Moray is 16% and for Aberdeen City is 12%. For Aberdeenshire, the increase in real terms is 22% and in the Highlands it is 9.5%. Table 194 shows employment data by industry sector for the North East. The table shows that the greatest number of jobs are associated with Sectors Q (human health and social work activities) (15% of the total for 2010) and G (wholesale and retail) at 14%. Other industry sectors accounting for around 10% of jobs are professional, scientific and technical activities (M) at 9.6%. Of particular significance in the North East is mining and quarrying at 7.3% (reflecting the importance of the Oil and Gas industry). Less significant in the North East are real estate activities (L) (0.9%), water supply, sewerage, waste management and remediation activities (E) at 0.6%, and electricity, gas, steam and air conditioning supply (0.4%). Agriculture, forestry and fishing makes up just 0.9%. Accommodation and food services activities make up 7.2% while arts, entertainment and recreation (R) account for around 2% of all jobs in the North East. Table 194. Employment data by industry sector in the North East
Industry Sector Full-time Part-time Total
2009 2010 2009 2010 2009 2010
A. Agriculture, forestry and fishing 1,726 2,018 215 1,180 1,944 3,188
B. Mining and quarrying 24,984 26,382 886 559 25,869 26,945
C. Manufacturing 30,759 29,420 3,071 3,249 33,829 32,674
D. Electricity, gas, steam and air conditioning supply
959 1,414 57 79 1,014 1,483
E. Water supply; sewerage, waste management and remediation activities
2,235 2,184 159 124 2,395 2,309
F. Construction 20,175 18,410 1,282 1,308 21,457 19,730
G. Wholesale and retail trade; repair of motor vehicles and motorcycles
29,572 28,987 23,403 23,758 52,954 52,741
H. Transportation and storage 14,290 12,660 2,582 1,956 16,866 14,630
I. Accommodation and food service activities
12,485 12,413 15,686 14,012 28,181 26,428
J. Information and communication 5,413 5,482 1,610 1,979 7,035 7,463
K. Financial and insurance activities 3,491 3,140 996 759 4,494 3,911
L. Real estate activities 2,187 2,193 1,203 953 3,392 3,150
M. Professional, scientific and technical activities
30,982 30,765 5,352 4,535 36,341 35,295
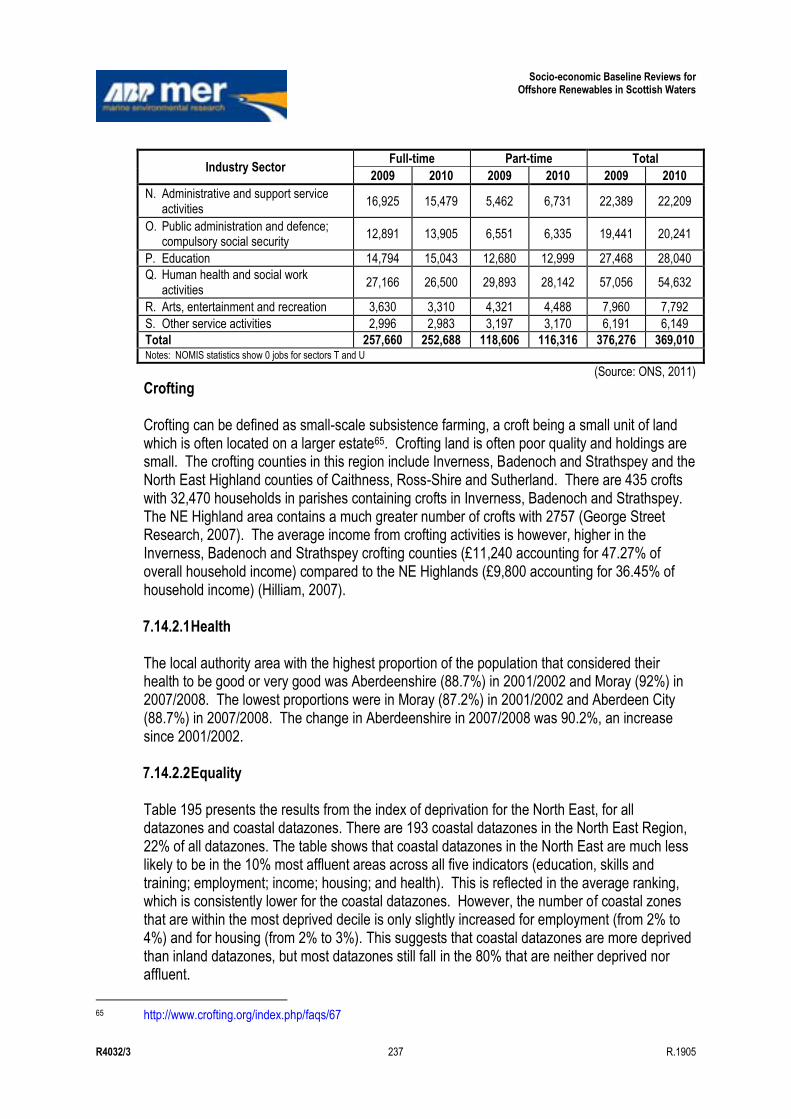
Socio-economic Baseline Reviews for Offshore Renewables in Scottish Waters
R4032/3 237 R.1905
Industry Sector Full-time Part-time Total
2009 2010 2009 2010 2009 2010
N. Administrative and support service activities
16,925 15,479 5,462 6,731 22,389 22,209
O. Public administration and defence; compulsory social security
12,891 13,905 6,551 6,335 19,441 20,241
P. Education 14,794 15,043 12,680 12,999 27,468 28,040
Q. Human health and social work activities
27,166 26,500 29,893 28,142 57,056 54,632
R. Arts, entertainment and recreation 3,630 3,310 4,321 4,488 7,960 7,792
S. Other service activities 2,996 2,983 3,197 3,170 6,191 6,149
Total 257,660 252,688 118,606 116,316 376,276 369,010 Notes: NOMIS statistics show 0 jobs for sectors T and U
(Source: ONS, 2011)
Crofting Crofting can be defined as small-scale subsistence farming, a croft being a small unit of land which is often located on a larger estate65. Crofting land is often poor quality and holdings are small. The crofting counties in this region include Inverness, Badenoch and Strathspey and the North East Highland counties of Caithness, Ross-Shire and Sutherland. There are 435 crofts with 32,470 households in parishes containing crofts in Inverness, Badenoch and Strathspey. The NE Highland area contains a much greater number of crofts with 2757 (George Street Research, 2007). The average income from crofting activities is however, higher in the Inverness, Badenoch and Strathspey crofting counties (£11,240 accounting for 47.27% of overall household income) compared to the NE Highlands (£9,800 accounting for 36.45% of household income) (Hilliam, 2007).
7.14.2.1 Health
The local authority area with the highest proportion of the population that considered their health to be good or very good was Aberdeenshire (88.7%) in 2001/2002 and Moray (92%) in 2007/2008. The lowest proportions were in Moray (87.2%) in 2001/2002 and Aberdeen City (88.7%) in 2007/2008. The change in Aberdeenshire in 2007/2008 was 90.2%, an increase since 2001/2002. 7.14.2.2 Equality Table 195 presents the results from the index of deprivation for the North East, for all datazones and coastal datazones. There are 193 coastal datazones in the North East Region, 22% of all datazones. The table shows that coastal datazones in the North East are much less likely to be in the 10% most affluent areas across all five indicators (education, skills and training; employment; income; housing; and health). This is reflected in the average ranking, which is consistently lower for the coastal datazones. However, the number of coastal zones that are within the most deprived decile is only slightly increased for employment (from 2% to 4%) and for housing (from 2% to 3%). This suggests that coastal datazones are more deprived than inland datazones, but most datazones still fall in the 80% that are neither deprived nor affluent.
65 http://www.crofting.org/index.php/faqs/67
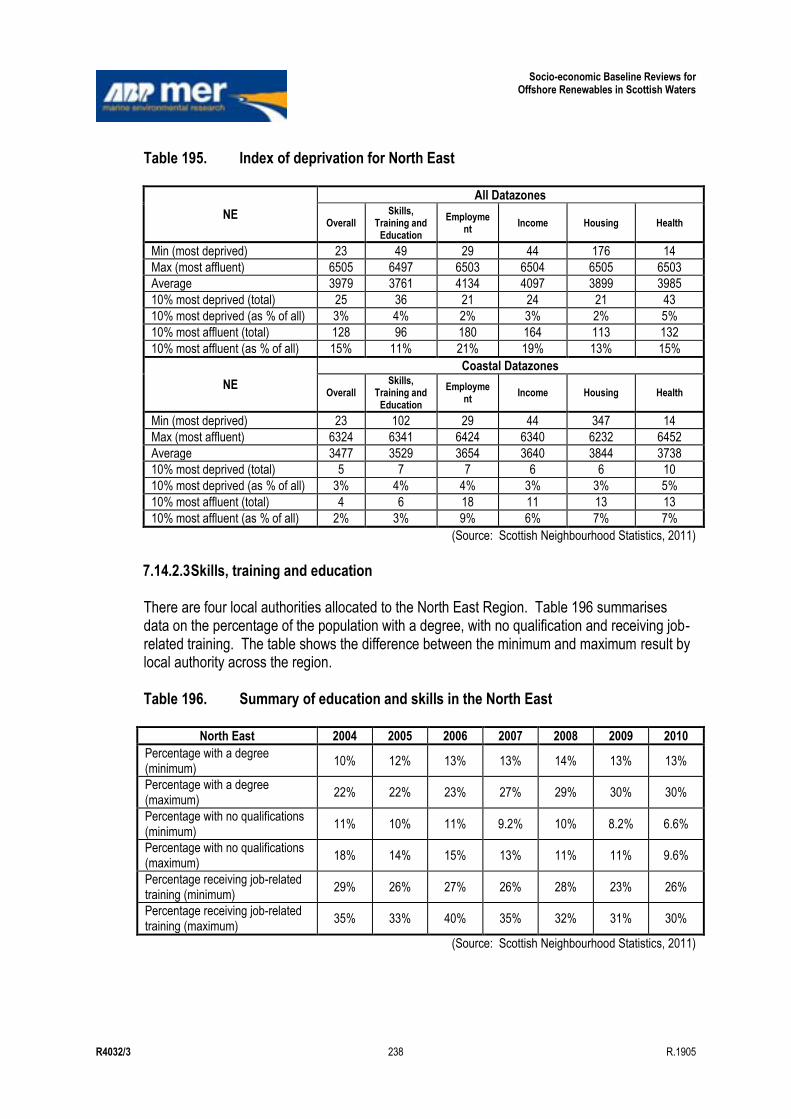
Socio-economic Baseline Reviews for Offshore Renewables in Scottish Waters
R4032/3 238 R.1905
Table 195. Index of deprivation for North East
NE
All Datazones
Overall Skills,
Training and Education
Employment
Income Housing Health
Min (most deprived) 23 49 29 44 176 14
Max (most affluent) 6505 6497 6503 6504 6505 6503
Average 3979 3761 4134 4097 3899 3985
10% most deprived (total) 25 36 21 24 21 43
10% most deprived (as % of all) 3% 4% 2% 3% 2% 5%
10% most affluent (total) 128 96 180 164 113 132
10% most affluent (as % of all) 15% 11% 21% 19% 13% 15%
NE
Coastal Datazones
Overall Skills,
Training and Education
Employment
Income Housing Health
Min (most deprived) 23 102 29 44 347 14
Max (most affluent) 6324 6341 6424 6340 6232 6452
Average 3477 3529 3654 3640 3844 3738
10% most deprived (total) 5 7 7 6 6 10
10% most deprived (as % of all) 3% 4% 4% 3% 3% 5%
10% most affluent (total) 4 6 18 11 13 13
10% most affluent (as % of all) 2% 3% 9% 6% 7% 7%
(Source: Scottish Neighbourhood Statistics, 2011)
7.14.2.3 Skills, training and education There are four local authorities allocated to the North East Region. Table 196 summarises data on the percentage of the population with a degree, with no qualification and receiving job-related training. The table shows the difference between the minimum and maximum result by local authority across the region. Table 196. Summary of education and skills in the North East
North East 2004 2005 2006 2007 2008 2009 2010
Percentage with a degree (minimum)
10% 12% 13% 13% 14% 13% 13%
Percentage with a degree (maximum)
22% 22% 23% 27% 29% 30% 30%
Percentage with no qualifications (minimum)
11% 10% 11% 9.2% 10% 8.2% 6.6%
Percentage with no qualifications (maximum)
18% 14% 15% 13% 11% 11% 9.6%
Percentage receiving job-related training (minimum)
29% 26% 27% 26% 28% 23% 26%
Percentage receiving job-related training (maximum)
35% 33% 40% 35% 32% 31% 30%
(Source: Scottish Neighbourhood Statistics, 2011)
Socio-economic Baseline Reviews for Offshore Renewables in Scottish Waters
R4032/3 239 R.1905
The range of results given in Table 205 is greatest for the percentage with a degree, with minimum of 10% in 2004 increasing to 13% in 2010 (Moray). The maximum is 22% in 2004 increasing to 30% in 2010 (Aberdeen City). In terms of the population with no qualifications, the range is between 11% and 18% in 2004, and between 6.6% and 9.6% in 2010. The area with the highest proportion of the population with no qualifications is Moray in both 2004 and 2010. The minimum values are for Aberdeenshire in 2004 and Highland in 2010 (Aberdeenshire has 8.2% with no qualifications in 2010). The area offering the lowest proportion of job-related training in 2004 was Aberdeenshire, very closely followed by Highland (29%). The areas with the highest rates of job-related training were Moray followed by Aberdeen City (32%) in 2004 and Aberdeen City, closely followed by Moray (30%) in 2010. The minimum drive time to a college of Further or Higher Education in the North East Region is an average of 53 minutes (Highland and Aberdeenshire) to a maximum of 100 minutes (Aberdeen City). The average is around 74 minutes, with Moray at 89 minutes. Taken altogether, the statistics suggest that the workforce has higher qualifications, but work-based skills obtained through job-related training may be reducing.
7.14.2.4 Access to services
There are four local authorities in the North East and the highest occupancy is in Aberdeenshire (at 94%) with vacant spaces at 4.3%. The lowest occupancy rate is in Highland (90%), with vacant spaces at 4%. This shows that there is only small variation in potential housing pressure across these four local authorities. Figure 80 shows that house prices in the North East Region are generally higher than the national average, with the exception of Moray. Even in Moray, mean house sale prices (£148,549) were only 4% below the national average in 2010. The highest house sale prices are in Aberdeenshire, with a mean value of £206,173, or 34% higher than the national average. Bank of Scotland (2011) shows that Highland is the second least affordable area in Scotland, with 27.6% of disposable earning being spent on mortgage payments. Aberdeenshire is third at 26.9%, Moray is fourth highest at 26.2%, and Aberdeen City is tenth highest at 24.1% (these compare with an average for Scotland of 22.4%). Highland has the one of the highest house price to earnings ratios for first-time buyers in Scotland (4.2), with Moray close behind at 4.0 (Bank of Scotland, 2011a). Council house debt in the North East is around the average for Scotland (£9,265 per house) for Moray (£9,068 per house), Aberdeen City (£9,404 per house) and Aberdeenshire (£9,756 per house) but is higher (£11,123) for Highland. The condition of housing is slightly better for social sector and private dwellings in the North East than in Scotland as a whole with 60% of social sector dwellings failing the SHQS (compared with the Scottish average of 66%) and 65% of private sector dwellings (compared with 69% for Scotland).
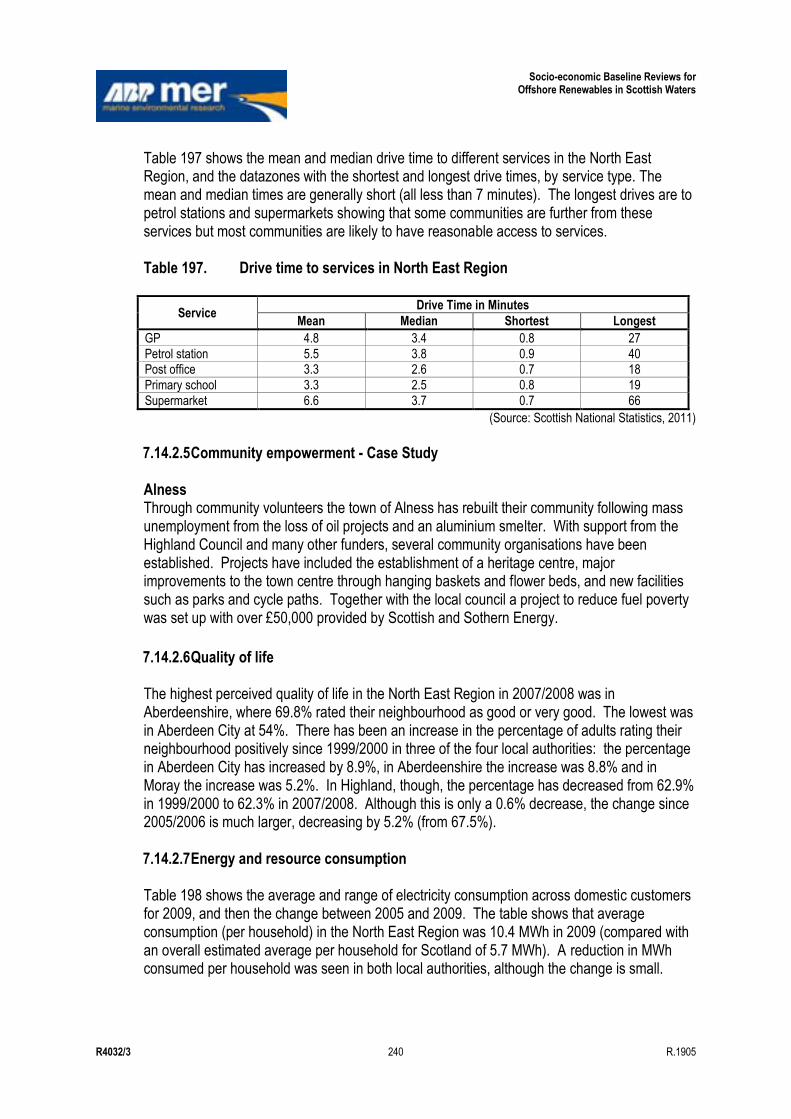
Socio-economic Baseline Reviews for Offshore Renewables in Scottish Waters
R4032/3 240 R.1905
Table 197 shows the mean and median drive time to different services in the North East Region, and the datazones with the shortest and longest drive times, by service type. The mean and median times are generally short (all less than 7 minutes). The longest drives are to petrol stations and supermarkets showing that some communities are further from these services but most communities are likely to have reasonable access to services. Table 197. Drive time to services in North East Region
Service Drive Time in Minutes
Mean Median Shortest Longest
GP 4.8 3.4 0.8 27
Petrol station 5.5 3.8 0.9 40 Post office 3.3 2.6 0.7 18
Primary school 3.3 2.5 0.8 19
Supermarket 6.6 3.7 0.7 66
(Source: Scottish National Statistics, 2011)
7.14.2.5 Community empowerment - Case Study Alness Through community volunteers the town of Alness has rebuilt their community following mass unemployment from the loss of oil projects and an aluminium smelter. With support from the Highland Council and many other funders, several community organisations have been established. Projects have included the establishment of a heritage centre, major improvements to the town centre through hanging baskets and flower beds, and new facilities such as parks and cycle paths. Together with the local council a project to reduce fuel poverty was set up with over £50,000 provided by Scottish and Sothern Energy.
7.14.2.6 Quality of life
The highest perceived quality of life in the North East Region in 2007/2008 was in Aberdeenshire, where 69.8% rated their neighbourhood as good or very good. The lowest was in Aberdeen City at 54%. There has been an increase in the percentage of adults rating their neighbourhood positively since 1999/2000 in three of the four local authorities: the percentage in Aberdeen City has increased by 8.9%, in Aberdeenshire the increase was 8.8% and in Moray the increase was 5.2%. In Highland, though, the percentage has decreased from 62.9% in 1999/2000 to 62.3% in 2007/2008. Although this is only a 0.6% decrease, the change since 2005/2006 is much larger, decreasing by 5.2% (from 67.5%).
7.14.2.7 Energy and resource consumption
Table 198 shows the average and range of electricity consumption across domestic customers for 2009, and then the change between 2005 and 2009. The table shows that average consumption (per household) in the North East Region was 10.4 MWh in 2009 (compared with an overall estimated average per household for Scotland of 5.7 MWh). A reduction in MWh consumed per household was seen in both local authorities, although the change is small.

Socio-economic Baseline Reviews for Offshore Renewables in Scottish Waters
R4032/3 241 R.1905
Table 198. Electricity consumption in North East Region
Statistic Domestic Customer (MWh per household)
Average consumption (GWh, 2009) 6.4 Lowest Consumption 4.9
Local Authority area Aberdeen City
Highest consumption (GWh, 2009) 8.2 Local Authority area Highland
Largest reduction in consumption (GWh, 2005-2009) -0.4
Local Authority area Aberdeen City; Aberdeenshire; Highland
Smallest reduction in consumption (GWh, 2005-2009) -0.3 Local Authority area Moray
(Source: based on Scottish National Statistics, using total electricity consumption by domestic customers by local authority divided by occupied household spaces per local authority)
Table 199 shows the population considered to be in fuel poverty between 2004/2007 and 2007/2009 for the whole of the North East Region. The table shows that those households where the highest income earner (HIH) is 60+ are more likely to be in fuel poverty than the whole population in 2007/2009. At 52.0%, this is higher than the national average of 45.9% for this group. The percentage of HIH 60+ in fuel poverty has also increased over time. There is variation across the region, with the highest percentage of HIH 60+ being in fuel poverty at 58.2% (Moray) and the lowest being 42.7% (Aberdeen City). Across the whole population, the highest percentage is in Highland (36.2%) and the lowest in Aberdeen City (21.8%). The change in percentage of the whole population in fuel poverty is an increase, ranging from just +1.9% in Aberdeenshire (from 29.7% to 31.6%) to +4.7% in Highland (from 31.5% to 36.2%). Table 199. Population considered to be in fuel poverty in North East Region
Population % of Population in Fuel Poverty
2004/2007 2005/2008 2007/2009
All 26.6% 28.8% 30.3% Any disability or long term sick 24.4% 26.6% 25.9%
No disability or long term sick 30.4% 34.2% 36.0%
HIH 60+ 47.9% 51.9% 52.0% HIH under 60 12.7% 15.3% 15.3%
Female HIH 33.0% 37.7% 39.3%
Male HIH 22.8% 25.0% 24.6%
(Source: Scottish National Statistics, 2011)
7.14.3 Future Trends
Table 200 summarises the statistics and trends discussed above to give an indication of the likely future changes by indicator, comparing national with local trends (where data are available). There is much greater uncertainty over trends for the time period of 30 to 50 years and, in both cases, it is assumed that future trends follow recent and historic trends. The table only includes rows for which there are data at the regional level. For national projections where regional data are not available refer to Section 2.14.3.

Socio-economic Baseline Reviews for Offshore Renewables in Scottish Waters
R4032/3 242 R.1905
Table 200. Summary of future trends in North East Region
Indicator National Regional
Evidence for Trend 10-20 years
30-50 years
10-20 years
30-50 years
Average age ↑ ↑ ↑ ↑ Estimate of proportion of the population that is of pensionable age between 2001 and 2010
Working age population ↑ → ↑ → Recent trends suggest an increase in the number of people of working age, following a decline to 2004
Income ↑ ↑ ↑ ↑ Recent trends suggest increase in median weekly income over time
Health ↑ → ↑ ↑ Recent trends suggest slight increase in perception of health
Perception that neighbourhood is a very good place to live
↕ ↕ ↑ ↑ Regional trends suggest small increases (in 3 of 4 local authorities)
Affordability of housing ↑ → ↑ →
Suggestion that affordability has increased recently, but this may not be sustained. This region is one where it is less affordable to buy property, while council house debt is around or slightly above the national average
Housing quality ↑ ↑ ↑ ↑
Housing quality, as measured by percentage of housing failing the SHQS, is improving, although the definition used in the standard has changed over time, making this difficult to confirm
Energy consumption ↓ ↕ ↓ → Recent trends suggest potential for continued slight decline, in longer term is more uncertain
Fuel poverty ↑ → ↑ →
Recent trends show an overall increase even though the Scottish Government policy is that there should be no fuel poverty in the medium to long-term. Disability and long-term sick has shown small decrease
Key: ↑: indication of upward trend →: no significant change up or down expected ↓: indication of downward trend ↕: uncertain trend could be up or down
7.15 Telecomm Cables
7.15.1 Regional Activity In this region, cables passing through inshore and offshore waters, comprise of a segment of the SHEFA 2 cable, linking mainland Scotland and Orkney and a fibre optic communications network linking „Points of Presence‟ between BP‟s Aberdeen office and several offshore oil platforms (as shown in Figure 167, Table 201), Figure 167 which also indicates the approximate landfall locations (note, not necessarily within this region) and capacity of these cables.

Socio-economic Baseline Reviews for Offshore Renewables in Scottish Waters
R4032/3 243 R.1905
Table 201. Subsea telecommunication cables in the North East Region
Cable To/from Capacity Length of Cable in
Region (km)
Central North Sea (CNS) Fibre Optic
Cruden Bay (Scotland), Forties Charlie, North Everest, Ula (North sea platforms)
155Mbps 297.9
SHEFA-2 Seg 9 Banff to Mance Bay 570Gbps 101.3
(Sources: http://www.submarinecablemap.com/; http://www.bp.com/assets/bp_internet/globalbp/STAGING/
global_assets/downloads/S/scotland_central_north_sea.pdf
7.15.2 Regional Economic Value and Employment
There is currently no agreed method for valuing the services provided by cables as they form part of a wider infrastructure. Although employment within this sector is provided by the ONS ABI the proportion of these employees associated with subsea telecommunication cables is unknown.
7.15.3 Future Trends No specific information on future trends for this region was found. For national projections refer to Section 2.15.3.
7.16 Tourism
7.16.1 Regional Activity Tourist sites in North East Scotland are concentrated along main routes (e.g. A9, A95, etc.), geographic features (e.g. Loch Ness) and the coast, as shown by Figure 168. There are a considerable number of natural heritage attractions, as well as historic/heritage attractions. Coastal and maritime cultural heritage assets can be seen in Figure 169. They are reasonably evenly spread along the coast and include several coastal heritage museums, a historic ship and a couple of accessible heritage assets. North East Scotland additionally has a significant number of designated bathing waters and seaside awards, as indicated by Figure 170. Although there are a couple of inland designated bathing waters, the majority are found on the coast and thus are likely to be relevant when considering offshore renewables. There are also two designated Marine Special Areas of Conservation66; the Moray Firth and an offshore area; Scanner Pockmark. Both of these will need to be taken into account by the offshore renewables industry Information on the number of visitors to areas within the region can be based on data from VisitScotland. Visitor figures for those from the UK and abroad visiting the East Region are as follows (VisitScotland, 2009):
66 http://jncc.defra.gov.uk/page-1445
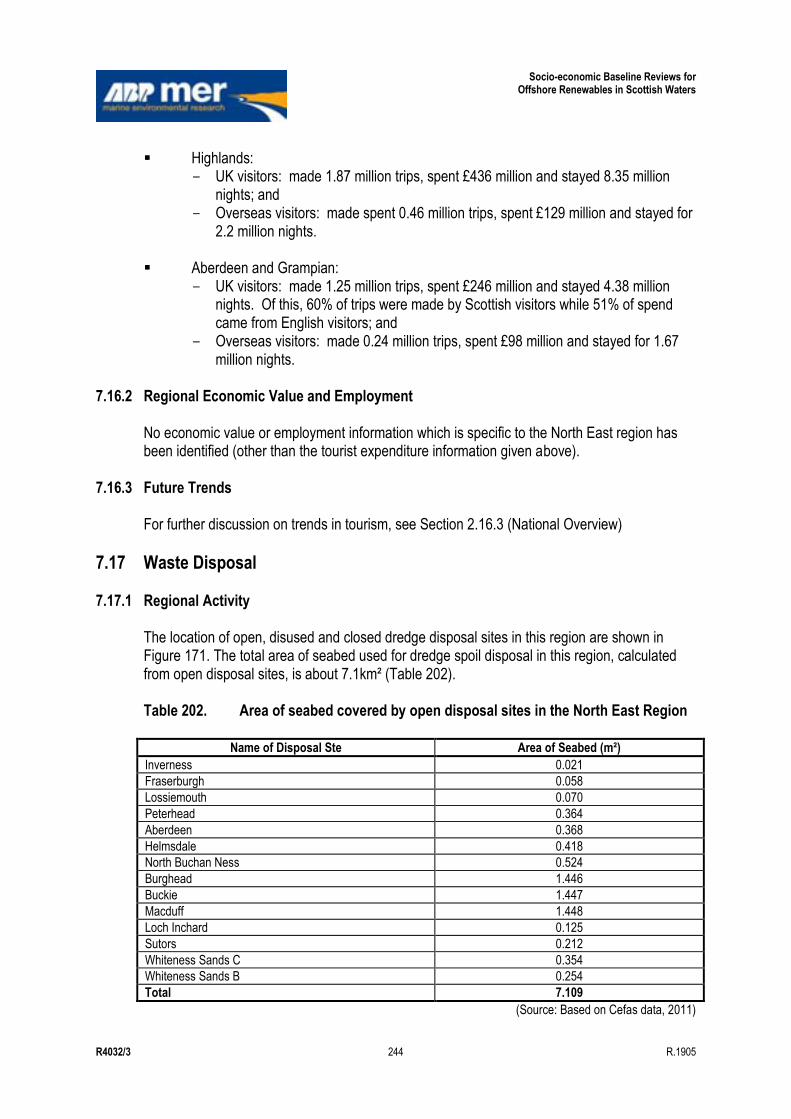
Socio-economic Baseline Reviews for Offshore Renewables in Scottish Waters
R4032/3 244 R.1905
Highlands: - UK visitors: made 1.87 million trips, spent £436 million and stayed 8.35 million
nights; and - Overseas visitors: made spent 0.46 million trips, spent £129 million and stayed for
2.2 million nights. Aberdeen and Grampian:
- UK visitors: made 1.25 million trips, spent £246 million and stayed 4.38 million nights. Of this, 60% of trips were made by Scottish visitors while 51% of spend came from English visitors; and
- Overseas visitors: made 0.24 million trips, spent £98 million and stayed for 1.67 million nights.
7.16.2 Regional Economic Value and Employment
No economic value or employment information which is specific to the North East region has been identified (other than the tourist expenditure information given above).
7.16.3 Future Trends For further discussion on trends in tourism, see Section 2.16.3 (National Overview)
7.17 Waste Disposal
7.17.1 Regional Activity The location of open, disused and closed dredge disposal sites in this region are shown in Figure 171. The total area of seabed used for dredge spoil disposal in this region, calculated from open disposal sites, is about 7.1km² (Table 202). Table 202. Area of seabed covered by open disposal sites in the North East Region
Name of Disposal Ste Area of Seabed (m²)
Inverness 0.021
Fraserburgh 0.058
Lossiemouth 0.070
Peterhead 0.364
Aberdeen 0.368
Helmsdale 0.418
North Buchan Ness 0.524
Burghead 1.446
Buckie 1.447
Macduff 1.448
Loch Inchard 0.125
Sutors 0.212
Whiteness Sands C 0.354
Whiteness Sands B 0.254
Total 7.109
(Source: Based on Cefas data, 2011)

Socio-economic Baseline Reviews for Offshore Renewables in Scottish Waters
R4032/3 245 R.1905
The licensed and actual tonnage of dredge spoil disposed of at open sites in this region in 2009/10 and 2010/11 are shown in Table 203. Table 203. Licensed and actual dredge disposal tonnage at sites in the North East
Region
Origin of Dredge Spoil
Dredge Disposal Site License Dates Licensed Tonnage
Actual Tonnage
Stonehaven Stonehaven B* 01/03/10-28/02/11 6000 4324
Aberdeen Aberdeen 01/05/09-30/04/10 195000 (M) 0
Aberdeen Aberdeen 01/05/09-30/04/10 14000 (C) 0
Aberdeen Aberdeen 20/05/10-19/05/13 870000 (M) 254850
Aberdeen Aberdeen 20/05/10-19/05/13 30000 (C) 8185
Boddam North Buchan Ness 15/09/09-14/09/10 15000 12141
Buckie Buckie 01/09/09-31/08/10 25600 0
Buckie Buckie 01/09/10-31/08/11 25600 1648
Findochty Buckie 01/03/09-28/02/10 5000 0
Burghead Burghead 01/09/09-31/08/10 32000 18346
Burghead Burghead 01/09/10-31/08/11 32000 0
Fraserburgh Fraserburgh 01/04/09-31/03/10 25500 0
Macduff Macduff 23/06/09-22/05/10 52000 3644
Macduff Macduff 29/06/10-28/06/11 52000 0
Peterhead Peterhead 07/05/10-06/05/11 22000 22000
Peterhead North Buchan Ness 30/01/09-29/01/10 9000 0
Peterhead North Buchan Ness 16/04/09-15/04/10 270000 0
Peterhead North Buchan Ness 16/04/09-15/04/10 270000 9352 M Maintenance dredge; C = capital dredge * Note this disposal sites also falls within the East Region and hence the dredge spoil quantity shown cannot be assigned completely to
the North East Region.
(Source: Marine Scotland Data, 2011a)
7.17.2 Regional Economic Value and Employment
It is not possible to calculate the GVA associated with dredge spoil disposal (Baxter et al, 2011). Figures are not available on the direct employment within this activity.
7.17.3 Future Trends The Scottish National Planning Framework 2 (Scottish Government, 2009b) identified future port developments, which may require dredging, including the development of ports and sites in the Inner Moray Firth. A strategy prepared by the Highland Council highlighted Cromarty Firth, which provides service base facilities and sheltered moorings for offshore Oil and Gas industry, and the potential of Nigg as a facility for decommissioning Oil and Gas installations and the manufacture and support services required by the renewable energy industry. In addition, the NRIP identified Nigg, Aberdeen, Ardersier, Peterhead and Wick as sites in this region which may support the offshore wind and/or wave and tidal industries. Infrastructure development at these sites may require dredging, for example, the NRIP identified potential dredging requirements to fulfil infrastructure requirements at Ardersier (dredging of sand would be
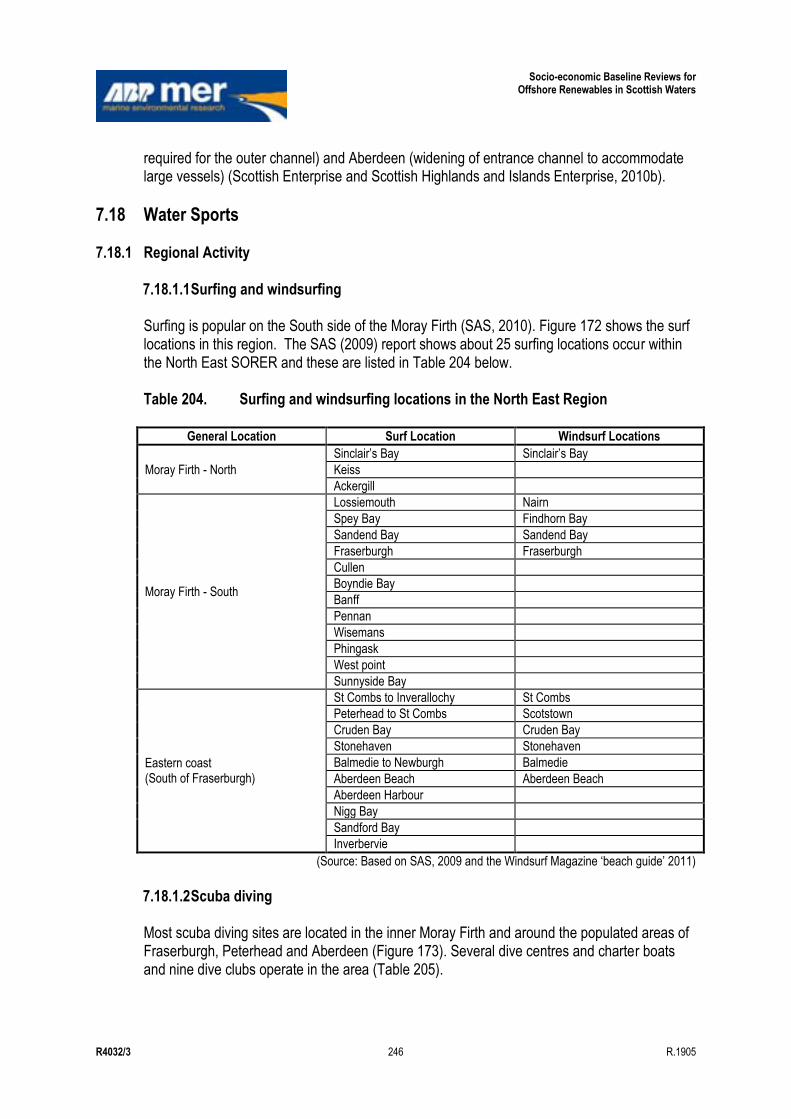
Socio-economic Baseline Reviews for Offshore Renewables in Scottish Waters
R4032/3 246 R.1905
required for the outer channel) and Aberdeen (widening of entrance channel to accommodate large vessels) (Scottish Enterprise and Scottish Highlands and Islands Enterprise, 2010b).
7.18 Water Sports
7.18.1 Regional Activity 7.18.1.1 Surfing and windsurfing Surfing is popular on the South side of the Moray Firth (SAS, 2010). Figure 172 shows the surf locations in this region. The SAS (2009) report shows about 25 surfing locations occur within the North East SORER and these are listed in Table 204 below. Table 204. Surfing and windsurfing locations in the North East Region
General Location Surf Location Windsurf Locations
Moray Firth - North
Sinclair‟s Bay Sinclair‟s Bay
Keiss
Ackergill
Moray Firth - South
Lossiemouth Nairn
Spey Bay Findhorn Bay
Sandend Bay Sandend Bay
Fraserburgh Fraserburgh
Cullen
Boyndie Bay
Banff
Pennan
Wisemans
Phingask
West point
Sunnyside Bay
Eastern coast (South of Fraserburgh)
St Combs to Inverallochy St Combs
Peterhead to St Combs Scotstown
Cruden Bay Cruden Bay
Stonehaven Stonehaven
Balmedie to Newburgh Balmedie
Aberdeen Beach Aberdeen Beach
Aberdeen Harbour
Nigg Bay
Sandford Bay
Inverbervie
(Source: Based on SAS, 2009 and the Windsurf Magazine „beach guide‟ 2011) 7.18.1.2 Scuba diving Most scuba diving sites are located in the inner Moray Firth and around the populated areas of Fraserburgh, Peterhead and Aberdeen (Figure 173). Several dive centres and charter boats and nine dive clubs operate in the area (Table 205).
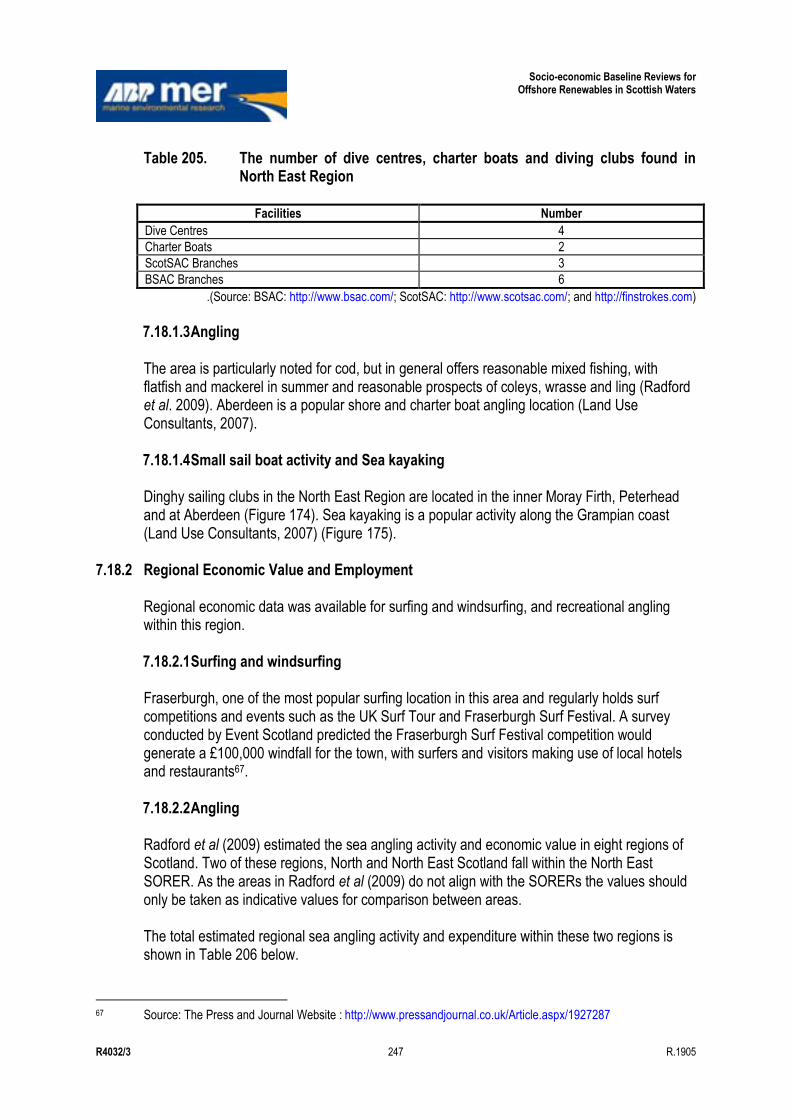
Socio-economic Baseline Reviews for Offshore Renewables in Scottish Waters
R4032/3 247 R.1905
Table 205. The number of dive centres, charter boats and diving clubs found in North East Region
Facilities Number
Dive Centres 4
Charter Boats 2
ScotSAC Branches 3
BSAC Branches 6
.(Source: BSAC: http://www.bsac.com/; ScotSAC: http://www.scotsac.com/; and http://finstrokes.com)
7.18.1.3 Angling The area is particularly noted for cod, but in general offers reasonable mixed fishing, with flatfish and mackerel in summer and reasonable prospects of coleys, wrasse and ling (Radford et al. 2009). Aberdeen is a popular shore and charter boat angling location (Land Use Consultants, 2007). 7.18.1.4 Small sail boat activity and Sea kayaking Dinghy sailing clubs in the North East Region are located in the inner Moray Firth, Peterhead and at Aberdeen (Figure 174). Sea kayaking is a popular activity along the Grampian coast (Land Use Consultants, 2007) (Figure 175).
7.18.2 Regional Economic Value and Employment Regional economic data was available for surfing and windsurfing, and recreational angling within this region. 7.18.2.1 Surfing and windsurfing Fraserburgh, one of the most popular surfing location in this area and regularly holds surf competitions and events such as the UK Surf Tour and Fraserburgh Surf Festival. A survey conducted by Event Scotland predicted the Fraserburgh Surf Festival competition would generate a £100,000 windfall for the town, with surfers and visitors making use of local hotels and restaurants67. 7.18.2.2 Angling Radford et al (2009) estimated the sea angling activity and economic value in eight regions of Scotland. Two of these regions, North and North East Scotland fall within the North East SORER. As the areas in Radford et al (2009) do not align with the SORERs the values should only be taken as indicative values for comparison between areas. The total estimated regional sea angling activity and expenditure within these two regions is shown in Table 206 below.
67 Source: The Press and Journal Website : http://www.pressandjournal.co.uk/Article.aspx/1927287
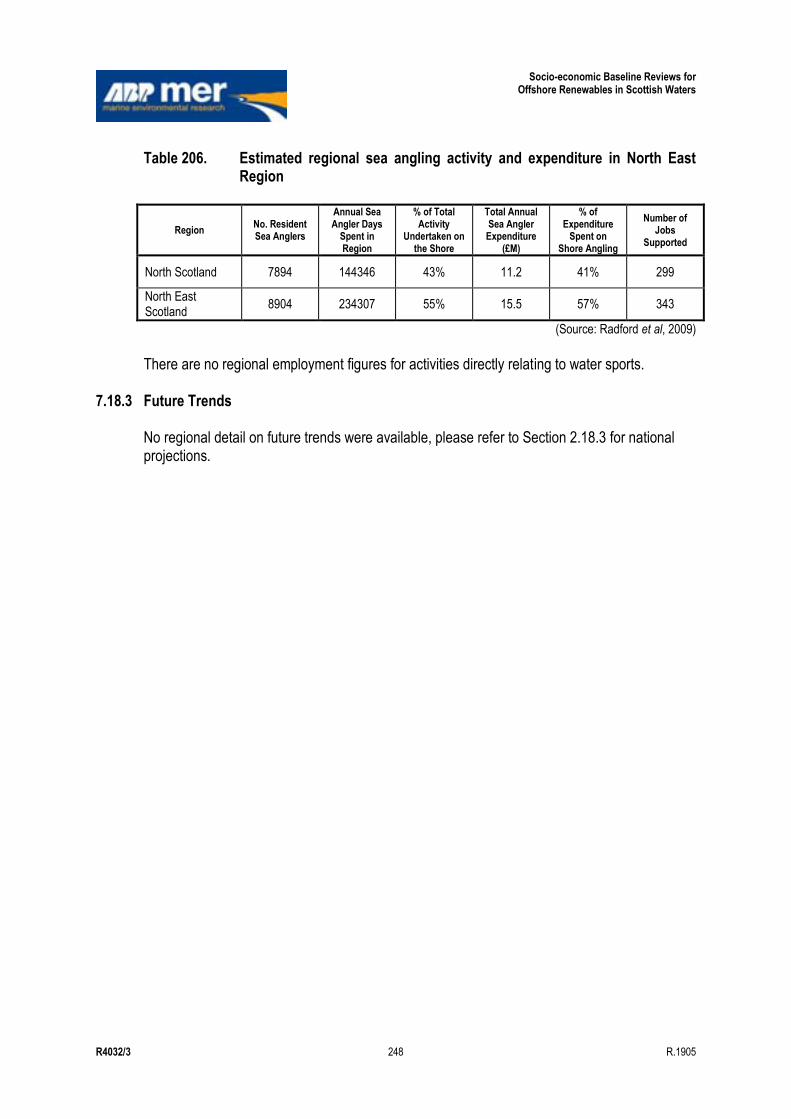
Socio-economic Baseline Reviews for Offshore Renewables in Scottish Waters
R4032/3 248 R.1905
Table 206. Estimated regional sea angling activity and expenditure in North East Region
Region No. Resident Sea Anglers
Annual Sea Angler Days
Spent in Region
% of Total Activity
Undertaken on the Shore
Total Annual Sea Angler Expenditure
(£M)
% of Expenditure
Spent on Shore Angling
Number of Jobs
Supported
North Scotland 7894 144346 43% 11.2 41% 299
North East Scotland
8904 234307 55% 15.5 57% 343
(Source: Radford et al, 2009) There are no regional employment figures for activities directly relating to water sports.
7.18.3 Future Trends No regional detail on future trends were available, please refer to Section 2.18.3 for national projections.

Socio-economic Baseline Reviews for Offshore Renewables in Scottish Waters
R4032/3 249 R.1905
8. East Region
8.1 Introduction
The regional overview for each marine use present within the East SORER is detailed within this section. These sub-sections, which are arranged in alphabetical order of activity, provide information in a uniformed manner under the following headings:
Regional Activity; Regional Economic Value and Employment; and Future Trends.
The activities present within the East Region are given in Table 207 below.
Table 207. Activities present within the East SORER
Activity
Present in East SORER
Regional Trends Available
Future Trends Available
Yes No Yes No Yes No
Aquaculture
Aviation
Carbon Capture and Storage
Coast Protection and Flood Defence
Commercial Fisheries
Energy Generation
Military Interests
Oil and Gas
Ports and Harbours
Power Interconnectors
Recreational Boating
Shipping
Social and Community
Telecom Cables
Tourism
Waste Disposal
Water Sports
8.2 Aviation
8.2.1 Regional Activity
Airports in this region include the „major‟ airport Edinburgh and the „minor‟ airport Dundee (Figure 3).
Edinburgh airport is Scotland‟s busiest airport, handling 9mppa, broadly similar to the combined throughput of Glasgow and Aberdeen. Of this figure, 4.9million are domestic passengers travelling to/from other UK destinations including the Scottish Islands. An extensive network of European flights operates from Edinburgh and additionally a small number of services to the Eastern seaboard of America (ABPmer, RPA and SQW, 2011). There are no existing
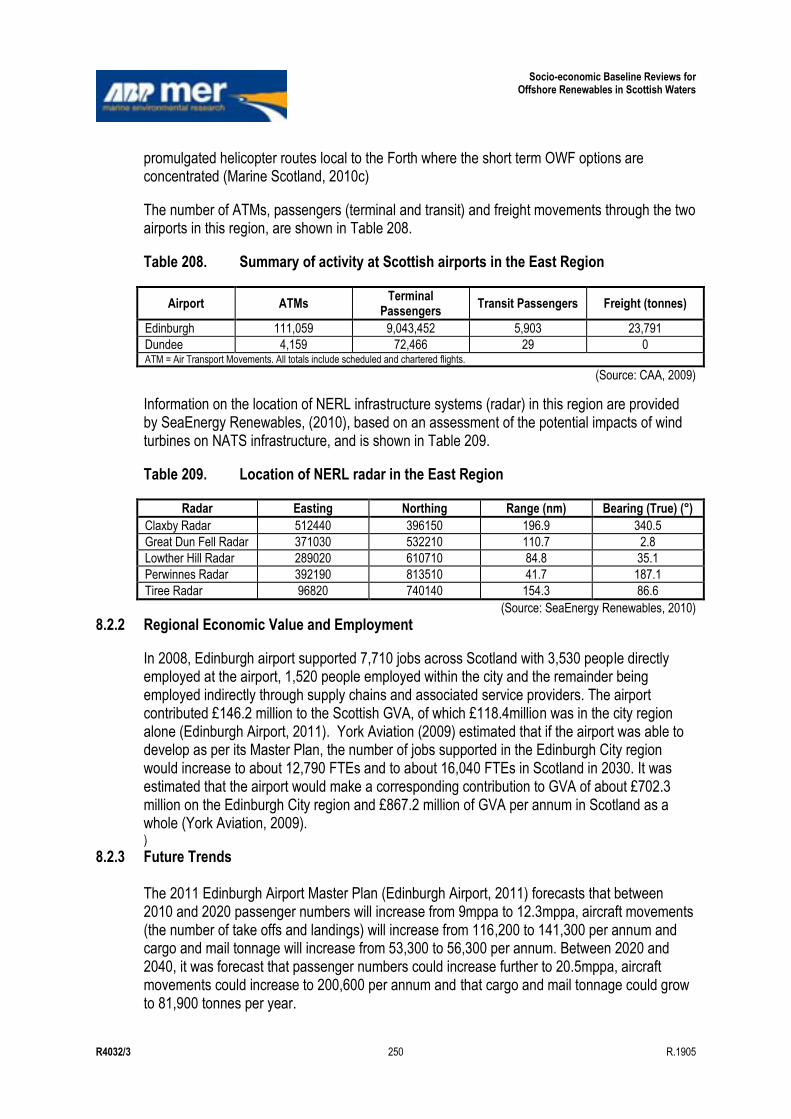
Socio-economic Baseline Reviews for Offshore Renewables in Scottish Waters
R4032/3 250 R.1905
promulgated helicopter routes local to the Forth where the short term OWF options are concentrated (Marine Scotland, 2010c)
The number of ATMs, passengers (terminal and transit) and freight movements through the two airports in this region, are shown in Table 208.
Table 208. Summary of activity at Scottish airports in the East Region
Airport ATMs Terminal
Passengers Transit Passengers Freight (tonnes)
Edinburgh 111,059 9,043,452 5,903 23,791
Dundee 4,159 72,466 29 0 ATM = Air Transport Movements. All totals include scheduled and chartered flights.
(Source: CAA, 2009)
Information on the location of NERL infrastructure systems (radar) in this region are provided by SeaEnergy Renewables, (2010), based on an assessment of the potential impacts of wind turbines on NATS infrastructure, and is shown in Table 209.
Table 209. Location of NERL radar in the East Region
Radar Easting Northing Range (nm) Bearing (True) (°)
Claxby Radar 512440 396150 196.9 340.5
Great Dun Fell Radar 371030 532210 110.7 2.8
Lowther Hill Radar 289020 610710 84.8 35.1
Perwinnes Radar 392190 813510 41.7 187.1
Tiree Radar 96820 740140 154.3 86.6
(Source: SeaEnergy Renewables, 2010)
8.2.2 Regional Economic Value and Employment
In 2008, Edinburgh airport supported 7,710 jobs across Scotland with 3,530 people directly employed at the airport, 1,520 people employed within the city and the remainder being employed indirectly through supply chains and associated service providers. The airport contributed £146.2 million to the Scottish GVA, of which £118.4million was in the city region alone (Edinburgh Airport, 2011). York Aviation (2009) estimated that if the airport was able to develop as per its Master Plan, the number of jobs supported in the Edinburgh City region would increase to about 12,790 FTEs and to about 16,040 FTEs in Scotland in 2030. It was estimated that the airport would make a corresponding contribution to GVA of about £702.3 million on the Edinburgh City region and £867.2 million of GVA per annum in Scotland as a whole (York Aviation, 2009). )
8.2.3 Future Trends The 2011 Edinburgh Airport Master Plan (Edinburgh Airport, 2011) forecasts that between 2010 and 2020 passenger numbers will increase from 9mppa to 12.3mppa, aircraft movements (the number of take offs and landings) will increase from 116,200 to 141,300 per annum and cargo and mail tonnage will increase from 53,300 to 56,300 per annum. Between 2020 and 2040, it was forecast that passenger numbers could increase further to 20.5mppa, aircraft movements could increase to 200,600 per annum and that cargo and mail tonnage could grow to 81,900 tonnes per year.
Socio-economic Baseline Reviews for Offshore Renewables in Scottish Waters
R4032/3 251 R.1905
Additional forecast information is provided by the DfT UK Aviation forecast (DfT, 2011). Table 210 shows the constrained (maximum use) passenger capacity and ATM forecasts up to the year 2050 for Edinburgh airport. Table 210. Constrained terminal passenger and ATM ‘central’ forecasts for major
Scottish airports in the East Region Numbers/Movements Airport 2010 2020 2030 2040 2050
Terminal passengers (mppa)
Edinburgh 9 13 15 20 20
Air Transport Movements (000‟s)
Edinburgh 100 170 190 230 180
(Source: DfT, 2011)
8.3 Coast Protection and Flood Defence
8.3.1 Regional Activity There are five flood defence schemes, three coast defence schemes and a managed realignment scheme in this region (Figure 176). The location, year of approval/construction and size of each scheme (where known) are shown in Table 211. Table 211. Location and details of flood and coastal defence schemes in the East
Region
Location Type of Scheme Construction Date
(Where Known) Area
(Where Known)
Carnoustie Flood protection No data No data
Tayview Caravan Park Monifieth Flood protection No data No data
Kincardine-on-Forth Flood protection No data No data
Bo‟ness Foreshore Flood protection No data No data
Prestonpans Flood protection No data No data
Carnoustie Coast protection Approved 2003 0.54km (length)
Tayview Caravan Park Monifieth Coast protection Approved 2003 0.4km (length)
Wemyss and Dysart Coast protection Approved 2000 No data
Skinflats Managed realignment Constructed 2010 12ha (area)
(Source: Baxter et al, 2011)
8.3.2 Regional Economic Value and Employment It is not possible to assign an economic value to flood and coastal defences, however, Table 212 shows the economic costs (where known) of the flood and coastal defences in this region.
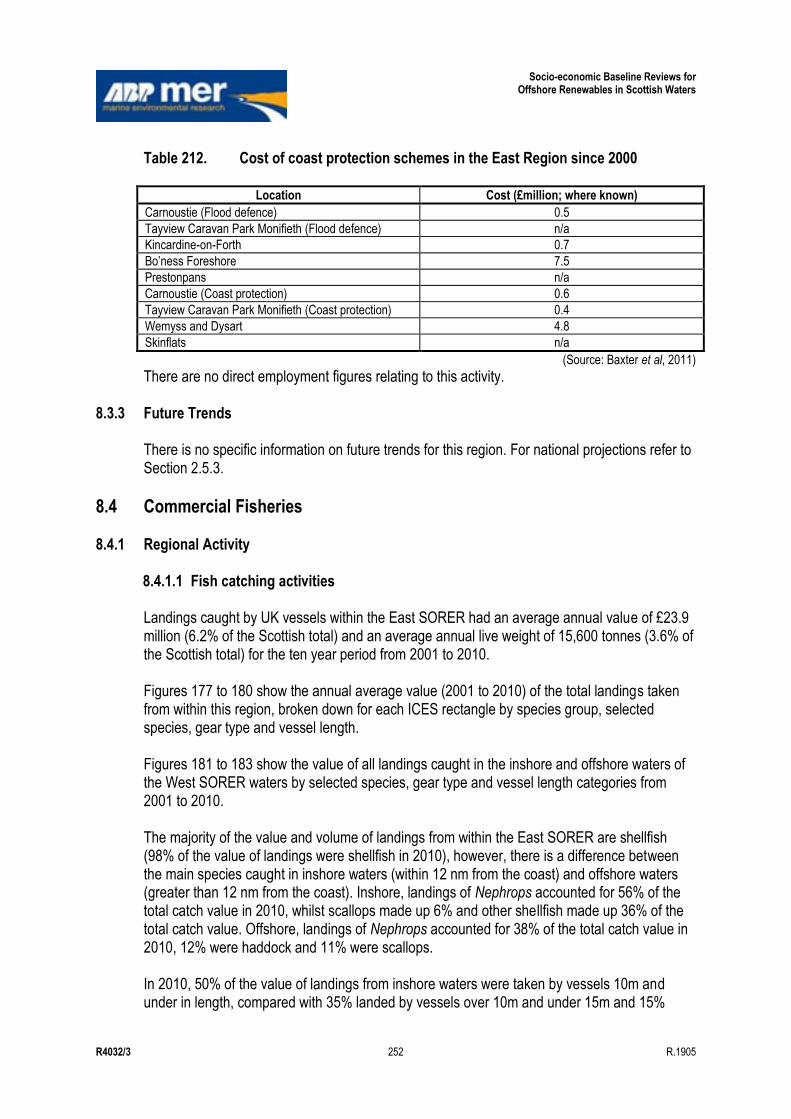
Socio-economic Baseline Reviews for Offshore Renewables in Scottish Waters
R4032/3 252 R.1905
Table 212. Cost of coast protection schemes in the East Region since 2000
Location Cost (£million; where known)
Carnoustie (Flood defence) 0.5
Tayview Caravan Park Monifieth (Flood defence) n/a
Kincardine-on-Forth 0.7
Bo‟ness Foreshore 7.5
Prestonpans n/a
Carnoustie (Coast protection) 0.6
Tayview Caravan Park Monifieth (Coast protection) 0.4
Wemyss and Dysart 4.8
Skinflats n/a
(Source: Baxter et al, 2011)
There are no direct employment figures relating to this activity.
8.3.3 Future Trends There is no specific information on future trends for this region. For national projections refer to Section 2.5.3.
8.4 Commercial Fisheries
8.4.1 Regional Activity 8.4.1.1 Fish catching activities Landings caught by UK vessels within the East SORER had an average annual value of £23.9 million (6.2% of the Scottish total) and an average annual live weight of 15,600 tonnes (3.6% of the Scottish total) for the ten year period from 2001 to 2010. Figures 177 to 180 show the annual average value (2001 to 2010) of the total landings taken from within this region, broken down for each ICES rectangle by species group, selected species, gear type and vessel length. Figures 181 to 183 show the value of all landings caught in the inshore and offshore waters of the West SORER waters by selected species, gear type and vessel length categories from 2001 to 2010. The majority of the value and volume of landings from within the East SORER are shellfish (98% of the value of landings were shellfish in 2010), however, there is a difference between the main species caught in inshore waters (within 12 nm from the coast) and offshore waters (greater than 12 nm from the coast). Inshore, landings of Nephrops accounted for 56% of the total catch value in 2010, whilst scallops made up 6% and other shellfish made up 36% of the total catch value. Offshore, landings of Nephrops accounted for 38% of the total catch value in 2010, 12% were haddock and 11% were scallops. In 2010, 50% of the value of landings from inshore waters were taken by vessels 10m and under in length, compared with 35% landed by vessels over 10m and under 15m and 15%
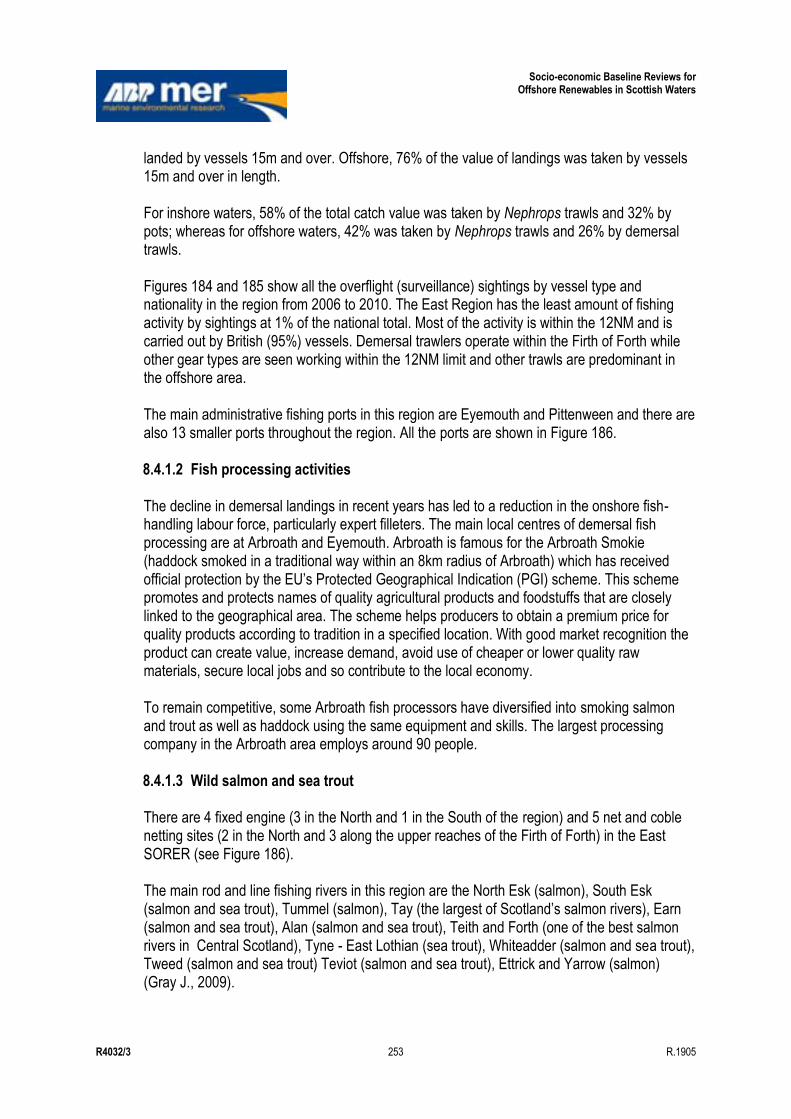
Socio-economic Baseline Reviews for Offshore Renewables in Scottish Waters
R4032/3 253 R.1905
landed by vessels 15m and over. Offshore, 76% of the value of landings was taken by vessels 15m and over in length. For inshore waters, 58% of the total catch value was taken by Nephrops trawls and 32% by pots; whereas for offshore waters, 42% was taken by Nephrops trawls and 26% by demersal trawls. Figures 184 and 185 show all the overflight (surveillance) sightings by vessel type and nationality in the region from 2006 to 2010. The East Region has the least amount of fishing activity by sightings at 1% of the national total. Most of the activity is within the 12NM and is carried out by British (95%) vessels. Demersal trawlers operate within the Firth of Forth while other gear types are seen working within the 12NM limit and other trawls are predominant in the offshore area. The main administrative fishing ports in this region are Eyemouth and Pittenween and there are also 13 smaller ports throughout the region. All the ports are shown in Figure 186. 8.4.1.2 Fish processing activities The decline in demersal landings in recent years has led to a reduction in the onshore fish-handling labour force, particularly expert filleters. The main local centres of demersal fish processing are at Arbroath and Eyemouth. Arbroath is famous for the Arbroath Smokie (haddock smoked in a traditional way within an 8km radius of Arbroath) which has received official protection by the EU‟s Protected Geographical Indication (PGI) scheme. This scheme promotes and protects names of quality agricultural products and foodstuffs that are closely linked to the geographical area. The scheme helps producers to obtain a premium price for quality products according to tradition in a specified location. With good market recognition the product can create value, increase demand, avoid use of cheaper or lower quality raw materials, secure local jobs and so contribute to the local economy. To remain competitive, some Arbroath fish processors have diversified into smoking salmon and trout as well as haddock using the same equipment and skills. The largest processing company in the Arbroath area employs around 90 people. 8.4.1.3 Wild salmon and sea trout There are 4 fixed engine (3 in the North and 1 in the South of the region) and 5 net and coble netting sites (2 in the North and 3 along the upper reaches of the Firth of Forth) in the East SORER (see Figure 186). The main rod and line fishing rivers in this region are the North Esk (salmon), South Esk (salmon and sea trout), Tummel (salmon), Tay (the largest of Scotland‟s salmon rivers), Earn (salmon and sea trout), Alan (salmon and sea trout), Teith and Forth (one of the best salmon rivers in Central Scotland), Tyne - East Lothian (sea trout), Whiteadder (salmon and sea trout), Tweed (salmon and sea trout) Teviot (salmon and sea trout), Ettrick and Yarrow (salmon) (Gray J., 2009).
Socio-economic Baseline Reviews for Offshore Renewables in Scottish Waters
R4032/3 254 R.1905
8.4.2 Regional Economic Value and Employment 8.4.2.1 Fish catching activities This is one of the smaller regional fisheries in the UK and employs the smallest number of fishermen compared with the five other SORERs, however, it is very important to many of the people who live there. The East SORER is covered by the administrative ports of Eyemouth and Pittenween. There are 356 fishermen employed on Scottish based vessels in these districts; 268 of these are employed full-time and 88 are part-time. There are 225 active vessels registered in these districts, 181 of which are 10m and under in length. In the Eyemouth Travel-to-Work area, between 10% an 15% of total employment is involved directly in the fishing sector (Baxter et al., 2011). 8.4.2.2 Fish processing activities The ONS (2011) and Employment Survey statistics for processing activities in the East SORER are shown in Table 213. Table 213. Employment in fish and shellfish processing and retail in the East
SORER
SIC Code
Full-time Employment
Part-time Employment
Total Employment
2009 2010 2009 2010 2009 2010
Processing and preserving of fish, crustaceans and molluscs (SIC 10200)
1625 1071 223 155 1849 1227
(Source: ONS, 2011)
8.4.2.3 Wild salmon and sea trout There is no specific information on economic value and employment for this region. For a national overview refer to Section 2.6.3.
8.4.3 Future Trends There is no specific information on future trends for this region. For national projections refer to Section 2.6.3.
8.5 Energy Generation
8.5.1 Regional Activity Major power stations located within this region include Torness, Cockenzie and Longannet. Further information on these is provided in the national section, (Section 2.7.3).
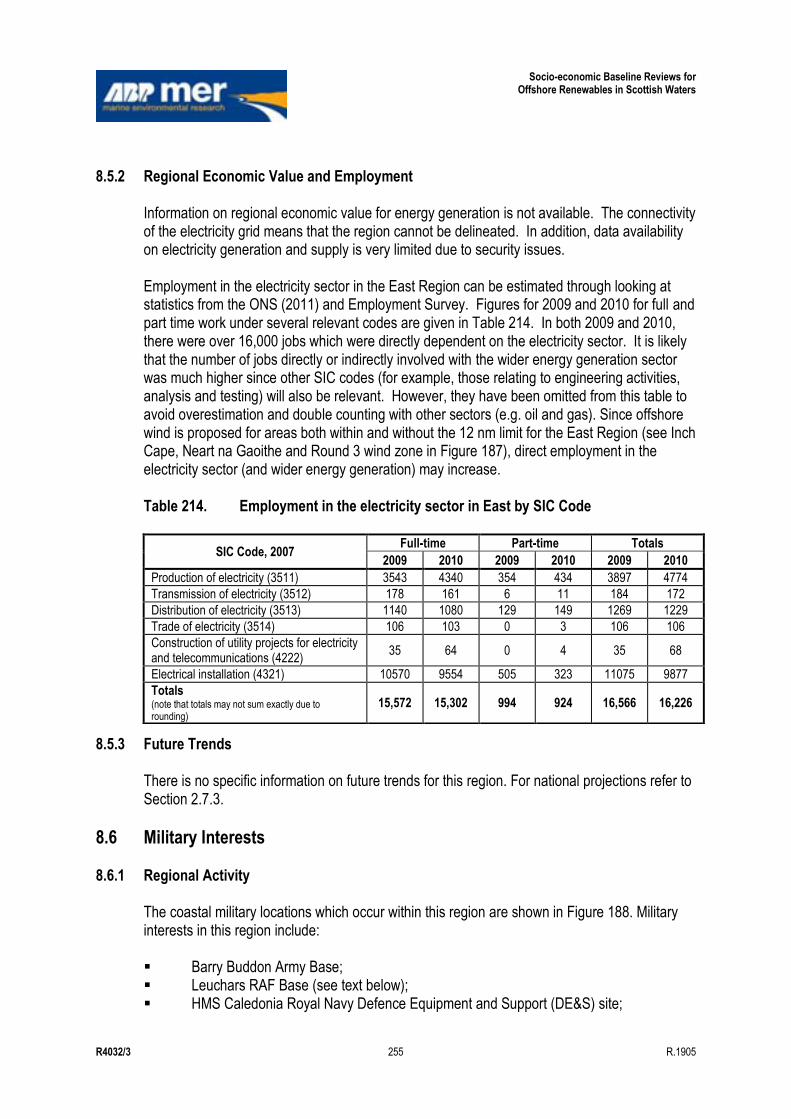
Socio-economic Baseline Reviews for Offshore Renewables in Scottish Waters
R4032/3 255 R.1905
8.5.2 Regional Economic Value and Employment
Information on regional economic value for energy generation is not available. The connectivity of the electricity grid means that the region cannot be delineated. In addition, data availability on electricity generation and supply is very limited due to security issues. Employment in the electricity sector in the East Region can be estimated through looking at statistics from the ONS (2011) and Employment Survey. Figures for 2009 and 2010 for full and part time work under several relevant codes are given in Table 214. In both 2009 and 2010, there were over 16,000 jobs which were directly dependent on the electricity sector. It is likely that the number of jobs directly or indirectly involved with the wider energy generation sector was much higher since other SIC codes (for example, those relating to engineering activities, analysis and testing) will also be relevant. However, they have been omitted from this table to avoid overestimation and double counting with other sectors (e.g. oil and gas). Since offshore wind is proposed for areas both within and without the 12 nm limit for the East Region (see Inch Cape, Neart na Gaoithe and Round 3 wind zone in Figure 187), direct employment in the electricity sector (and wider energy generation) may increase. Table 214. Employment in the electricity sector in East by SIC Code
8.5.3 Future Trends There is no specific information on future trends for this region. For national projections refer to Section 2.7.3.
8.6 Military Interests
8.6.1 Regional Activity The coastal military locations which occur within this region are shown in Figure 188. Military interests in this region include: Barry Buddon Army Base; Leuchars RAF Base (see text below); HMS Caledonia Royal Navy Defence Equipment and Support (DE&S) site;
SIC Code, 2007 Full-time Part-time Totals
2009 2010 2009 2010 2009 2010
Production of electricity (3511) 3543 4340 354 434 3897 4774
Transmission of electricity (3512) 178 161 6 11 184 172
Distribution of electricity (3513) 1140 1080 129 149 1269 1229
Trade of electricity (3514) 106 103 0 3 106 106
Construction of utility projects for electricity and telecommunications (4222)
35 64 0 4 35 68
Electrical installation (4321) 10570 9554 505 323 11075 9877
Totals (note that totals may not sum exactly due to rounding)
15,572 15,302 994 924 16,566 16,226
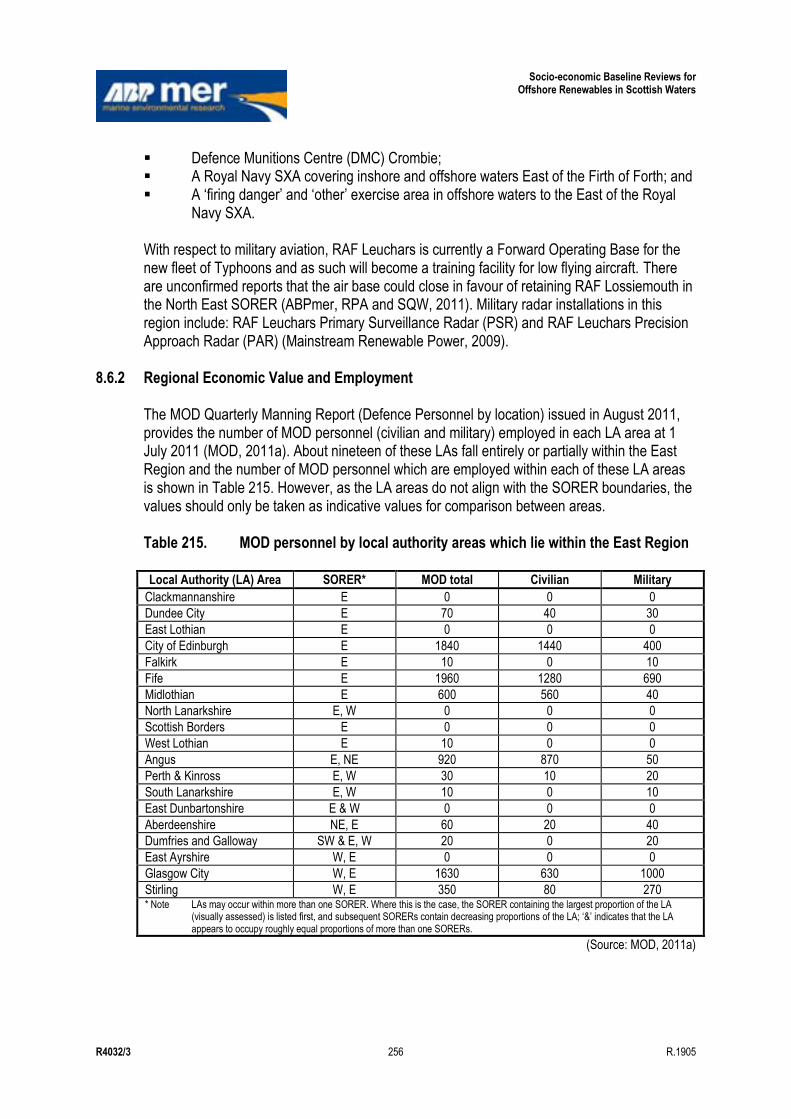
Socio-economic Baseline Reviews for Offshore Renewables in Scottish Waters
R4032/3 256 R.1905
Defence Munitions Centre (DMC) Crombie; A Royal Navy SXA covering inshore and offshore waters East of the Firth of Forth; and A „firing danger‟ and „other‟ exercise area in offshore waters to the East of the Royal
Navy SXA. With respect to military aviation, RAF Leuchars is currently a Forward Operating Base for the new fleet of Typhoons and as such will become a training facility for low flying aircraft. There are unconfirmed reports that the air base could close in favour of retaining RAF Lossiemouth in the North East SORER (ABPmer, RPA and SQW, 2011). Military radar installations in this region include: RAF Leuchars Primary Surveillance Radar (PSR) and RAF Leuchars Precision Approach Radar (PAR) (Mainstream Renewable Power, 2009).
8.6.2 Regional Economic Value and Employment The MOD Quarterly Manning Report (Defence Personnel by location) issued in August 2011, provides the number of MOD personnel (civilian and military) employed in each LA area at 1 July 2011 (MOD, 2011a). About nineteen of these LAs fall entirely or partially within the East Region and the number of MOD personnel which are employed within each of these LA areas is shown in Table 215. However, as the LA areas do not align with the SORER boundaries, the values should only be taken as indicative values for comparison between areas. Table 215. MOD personnel by local authority areas which lie within the East Region Local Authority (LA) Area SORER* MOD total Civilian Military
Clackmannanshire E 0 0 0
Dundee City E 70 40 30
East Lothian E 0 0 0
City of Edinburgh E 1840 1440 400
Falkirk E 10 0 10
Fife E 1960 1280 690
Midlothian E 600 560 40
North Lanarkshire E, W 0 0 0
Scottish Borders E 0 0 0
West Lothian E 10 0 0
Angus E, NE 920 870 50
Perth & Kinross E, W 30 10 20
South Lanarkshire E, W 10 0 10
East Dunbartonshire E & W 0 0 0
Aberdeenshire NE, E 60 20 40
Dumfries and Galloway SW & E, W 20 0 20
East Ayrshire W, E 0 0 0
Glasgow City W, E 1630 630 1000
Stirling W, E 350 80 270 * Note LAs may occur within more than one SORER. Where this is the case, the SORER containing the largest proportion of the LA
(visually assessed) is listed first, and subsequent SORERs contain decreasing proportions of the LA; „&‟ indicates that the LA appears to occupy roughly equal proportions of more than one SORERs.
(Source: MOD, 2011a)
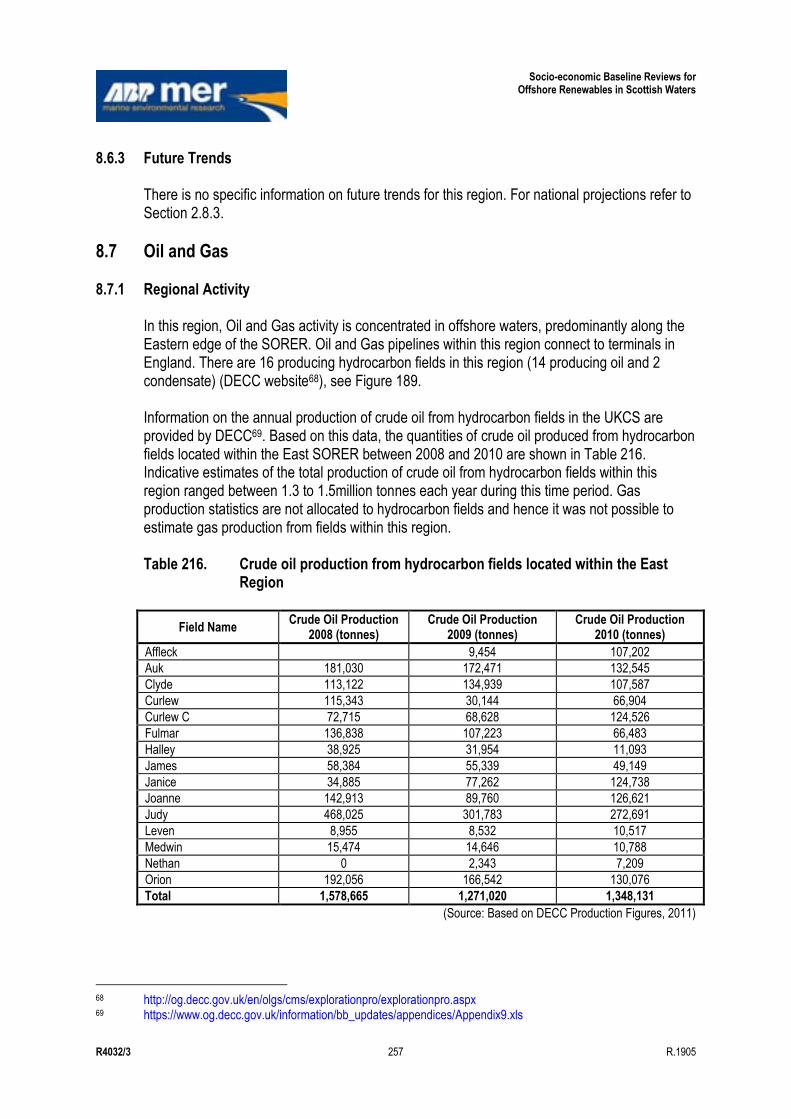
Socio-economic Baseline Reviews for Offshore Renewables in Scottish Waters
R4032/3 257 R.1905
8.6.3 Future Trends There is no specific information on future trends for this region. For national projections refer to Section 2.8.3.
8.7 Oil and Gas
8.7.1 Regional Activity In this region, Oil and Gas activity is concentrated in offshore waters, predominantly along the Eastern edge of the SORER. Oil and Gas pipelines within this region connect to terminals in England. There are 16 producing hydrocarbon fields in this region (14 producing oil and 2 condensate) (DECC website68), see Figure 189. Information on the annual production of crude oil from hydrocarbon fields in the UKCS are provided by DECC69. Based on this data, the quantities of crude oil produced from hydrocarbon fields located within the East SORER between 2008 and 2010 are shown in Table 216. Indicative estimates of the total production of crude oil from hydrocarbon fields within this region ranged between 1.3 to 1.5million tonnes each year during this time period. Gas production statistics are not allocated to hydrocarbon fields and hence it was not possible to estimate gas production from fields within this region. Table 216. Crude oil production from hydrocarbon fields located within the East
Region
Field Name Crude Oil Production
2008 (tonnes) Crude Oil Production
2009 (tonnes) Crude Oil Production
2010 (tonnes)
Affleck 9,454 107,202
Auk 181,030 172,471 132,545
Clyde 113,122 134,939 107,587
Curlew 115,343 30,144 66,904
Curlew C 72,715 68,628 124,526
Fulmar 136,838 107,223 66,483
Halley 38,925 31,954 11,093
James 58,384 55,339 49,149
Janice 34,885 77,262 124,738
Joanne 142,913 89,760 126,621
Judy 468,025 301,783 272,691
Leven 8,955 8,532 10,517
Medwin 15,474 14,646 10,788
Nethan 0 2,343 7,209
Orion 192,056 166,542 130,076
Total 1,578,665 1,271,020 1,348,131
(Source: Based on DECC Production Figures, 2011)
68 http://og.decc.gov.uk/en/olgs/cms/explorationpro/explorationpro.aspx 69 https://www.og.decc.gov.uk/information/bb_updates/appendices/Appendix9.xls
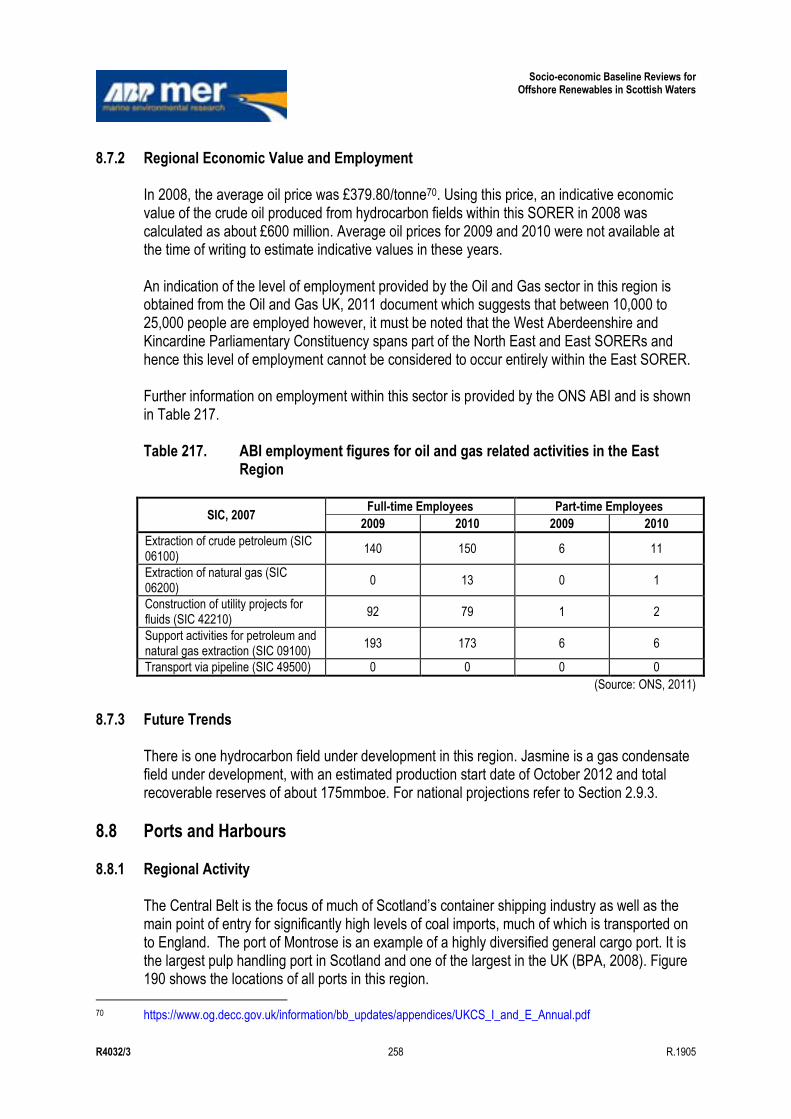
Socio-economic Baseline Reviews for Offshore Renewables in Scottish Waters
R4032/3 258 R.1905
8.7.2 Regional Economic Value and Employment In 2008, the average oil price was £379.80/tonne70. Using this price, an indicative economic value of the crude oil produced from hydrocarbon fields within this SORER in 2008 was calculated as about £600 million. Average oil prices for 2009 and 2010 were not available at the time of writing to estimate indicative values in these years. An indication of the level of employment provided by the Oil and Gas sector in this region is obtained from the Oil and Gas UK, 2011 document which suggests that between 10,000 to 25,000 people are employed however, it must be noted that the West Aberdeenshire and Kincardine Parliamentary Constituency spans part of the North East and East SORERs and hence this level of employment cannot be considered to occur entirely within the East SORER. Further information on employment within this sector is provided by the ONS ABI and is shown in Table 217. Table 217. ABI employment figures for oil and gas related activities in the East
Region
SIC, 2007 Full-time Employees Part-time Employees
2009 2010 2009 2010
Extraction of crude petroleum (SIC 06100)
140 150 6 11
Extraction of natural gas (SIC 06200)
0 13 0 1
Construction of utility projects for fluids (SIC 42210)
92 79 1 2
Support activities for petroleum and natural gas extraction (SIC 09100)
193 173 6 6
Transport via pipeline (SIC 49500) 0 0 0 0
(Source: ONS, 2011)
8.7.3 Future Trends There is one hydrocarbon field under development in this region. Jasmine is a gas condensate field under development, with an estimated production start date of October 2012 and total recoverable reserves of about 175mmboe. For national projections refer to Section 2.9.3.
8.8 Ports and Harbours
8.8.1 Regional Activity The Central Belt is the focus of much of Scotland‟s container shipping industry as well as the main point of entry for significantly high levels of coal imports, much of which is transported on to England. The port of Montrose is an example of a highly diversified general cargo port. It is the largest pulp handling port in Scotland and one of the largest in the UK (BPA, 2008). Figure 190 shows the locations of all ports in this region.
70 https://www.og.decc.gov.uk/information/bb_updates/appendices/UKCS_I_and_E_Annual.pdf
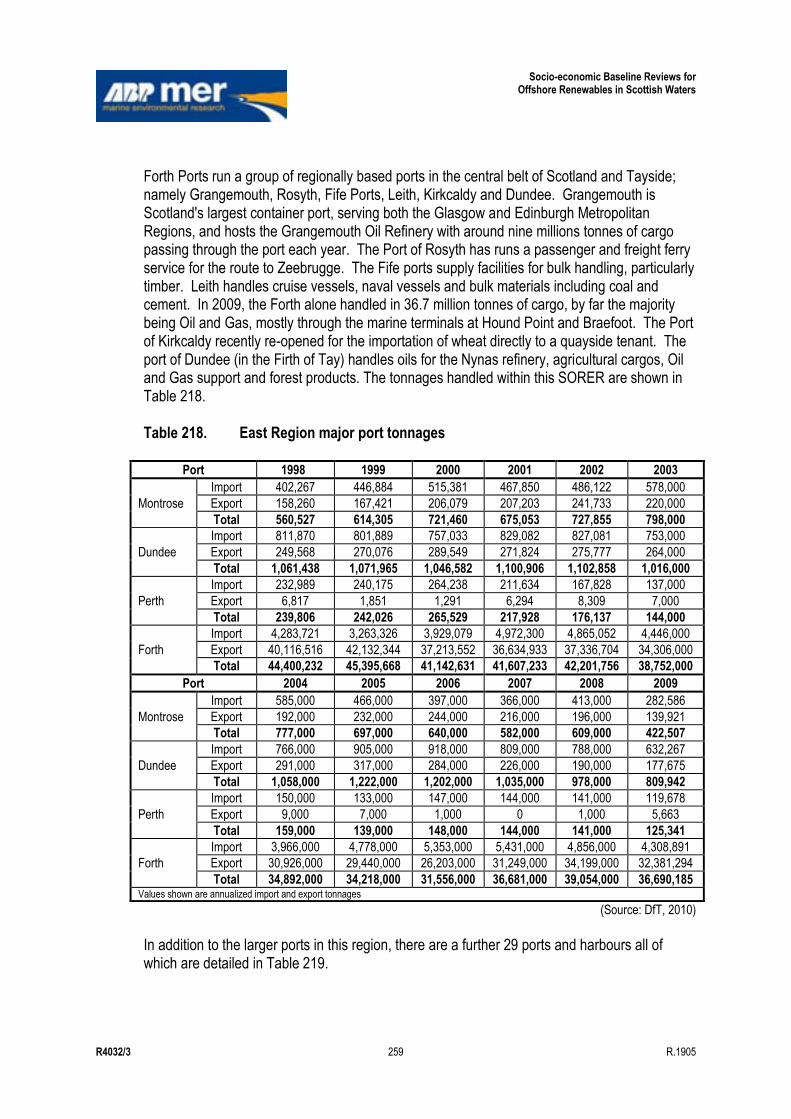
Socio-economic Baseline Reviews for Offshore Renewables in Scottish Waters
R4032/3 259 R.1905
Forth Ports run a group of regionally based ports in the central belt of Scotland and Tayside; namely Grangemouth, Rosyth, Fife Ports, Leith, Kirkcaldy and Dundee. Grangemouth is Scotland's largest container port, serving both the Glasgow and Edinburgh Metropolitan Regions, and hosts the Grangemouth Oil Refinery with around nine millions tonnes of cargo passing through the port each year. The Port of Rosyth has runs a passenger and freight ferry service for the route to Zeebrugge. The Fife ports supply facilities for bulk handling, particularly timber. Leith handles cruise vessels, naval vessels and bulk materials including coal and cement. In 2009, the Forth alone handled in 36.7 million tonnes of cargo, by far the majority being Oil and Gas, mostly through the marine terminals at Hound Point and Braefoot. The Port of Kirkcaldy recently re-opened for the importation of wheat directly to a quayside tenant. The port of Dundee (in the Firth of Tay) handles oils for the Nynas refinery, agricultural cargos, Oil and Gas support and forest products. The tonnages handled within this SORER are shown in Table 218. Table 218. East Region major port tonnages
Port 1998 1999 2000 2001 2002 2003
Montrose
Import 402,267 446,884 515,381 467,850 486,122 578,000
Export 158,260 167,421 206,079 207,203 241,733 220,000
Total 560,527 614,305 721,460 675,053 727,855 798,000
Dundee
Import 811,870 801,889 757,033 829,082 827,081 753,000
Export 249,568 270,076 289,549 271,824 275,777 264,000
Total 1,061,438 1,071,965 1,046,582 1,100,906 1,102,858 1,016,000
Perth
Import 232,989 240,175 264,238 211,634 167,828 137,000
Export 6,817 1,851 1,291 6,294 8,309 7,000
Total 239,806 242,026 265,529 217,928 176,137 144,000
Forth
Import 4,283,721 3,263,326 3,929,079 4,972,300 4,865,052 4,446,000
Export 40,116,516 42,132,344 37,213,552 36,634,933 37,336,704 34,306,000
Total 44,400,232 45,395,668 41,142,631 41,607,233 42,201,756 38,752,000
Port 2004 2005 2006 2007 2008 2009
Montrose
Import 585,000 466,000 397,000 366,000 413,000 282,586
Export 192,000 232,000 244,000 216,000 196,000 139,921
Total 777,000 697,000 640,000 582,000 609,000 422,507
Dundee
Import 766,000 905,000 918,000 809,000 788,000 632,267
Export 291,000 317,000 284,000 226,000 190,000 177,675
Total 1,058,000 1,222,000 1,202,000 1,035,000 978,000 809,942
Perth
Import 150,000 133,000 147,000 144,000 141,000 119,678
Export 9,000 7,000 1,000 0 1,000 5,663
Total 159,000 139,000 148,000 144,000 141,000 125,341
Forth
Import 3,966,000 4,778,000 5,353,000 5,431,000 4,856,000 4,308,891
Export 30,926,000 29,440,000 26,203,000 31,249,000 34,199,000 32,381,294
Total 34,892,000 34,218,000 31,556,000 36,681,000 39,054,000 36,690,185 Values shown are annualized import and export tonnages
(Source: DfT, 2010) In addition to the larger ports in this region, there are a further 29 ports and harbours all of which are detailed in Table 219.
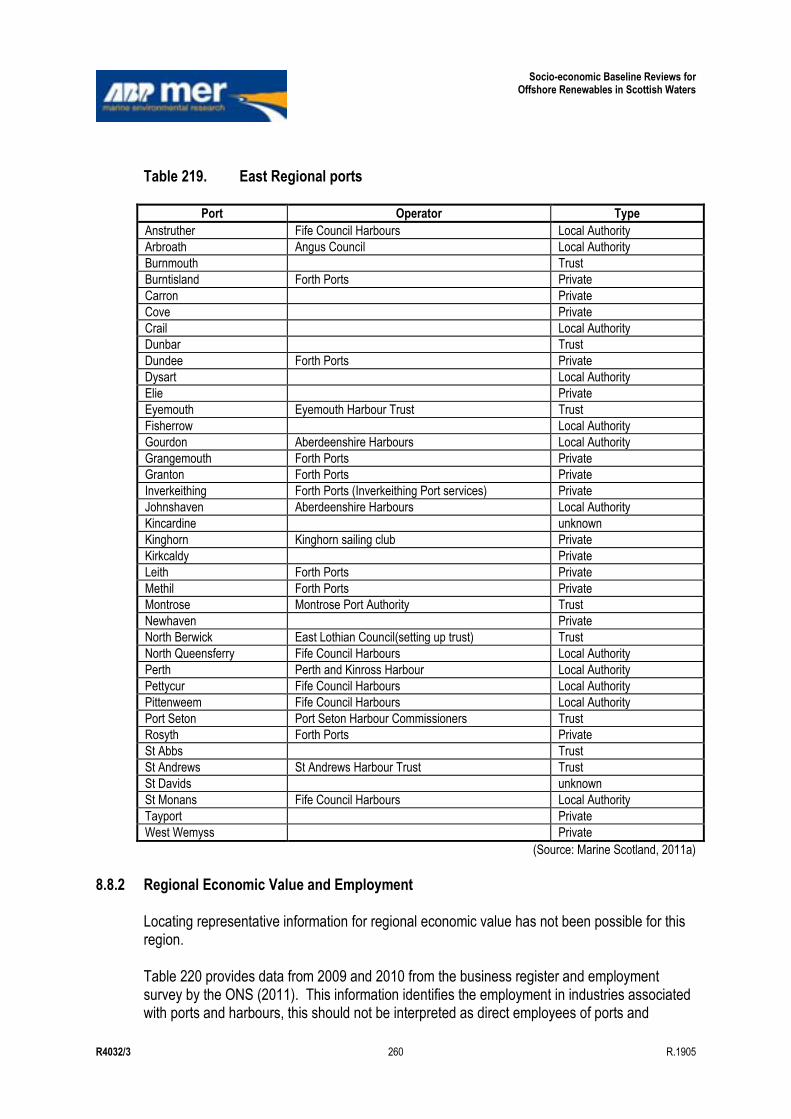
Socio-economic Baseline Reviews for Offshore Renewables in Scottish Waters
R4032/3 260 R.1905
Table 219. East Regional ports
Port Operator Type
Anstruther Fife Council Harbours Local Authority
Arbroath Angus Council Local Authority
Burnmouth Trust
Burntisland Forth Ports Private
Carron Private
Cove Private
Crail Local Authority
Dunbar Trust
Dundee Forth Ports Private
Dysart Local Authority
Elie Private
Eyemouth Eyemouth Harbour Trust Trust
Fisherrow Local Authority
Gourdon Aberdeenshire Harbours Local Authority
Grangemouth Forth Ports Private
Granton Forth Ports Private
Inverkeithing Forth Ports (Inverkeithing Port services) Private
Johnshaven Aberdeenshire Harbours Local Authority
Kincardine unknown
Kinghorn Kinghorn sailing club Private
Kirkcaldy Private
Leith Forth Ports Private
Methil Forth Ports Private
Montrose Montrose Port Authority Trust
Newhaven Private
North Berwick East Lothian Council(setting up trust) Trust
North Queensferry Fife Council Harbours Local Authority
Perth Perth and Kinross Harbour Local Authority
Pettycur Fife Council Harbours Local Authority
Pittenweem Fife Council Harbours Local Authority
Port Seton Port Seton Harbour Commissioners Trust
Rosyth Forth Ports Private
St Abbs Trust
St Andrews St Andrews Harbour Trust Trust
St Davids unknown
St Monans Fife Council Harbours Local Authority
Tayport Private
West Wemyss Private
(Source: Marine Scotland, 2011a)
8.8.2 Regional Economic Value and Employment Locating representative information for regional economic value has not been possible for this region. Table 220 provides data from 2009 and 2010 from the business register and employment survey by the ONS (2011). This information identifies the employment in industries associated with ports and harbours, this should not be interpreted as direct employees of ports and
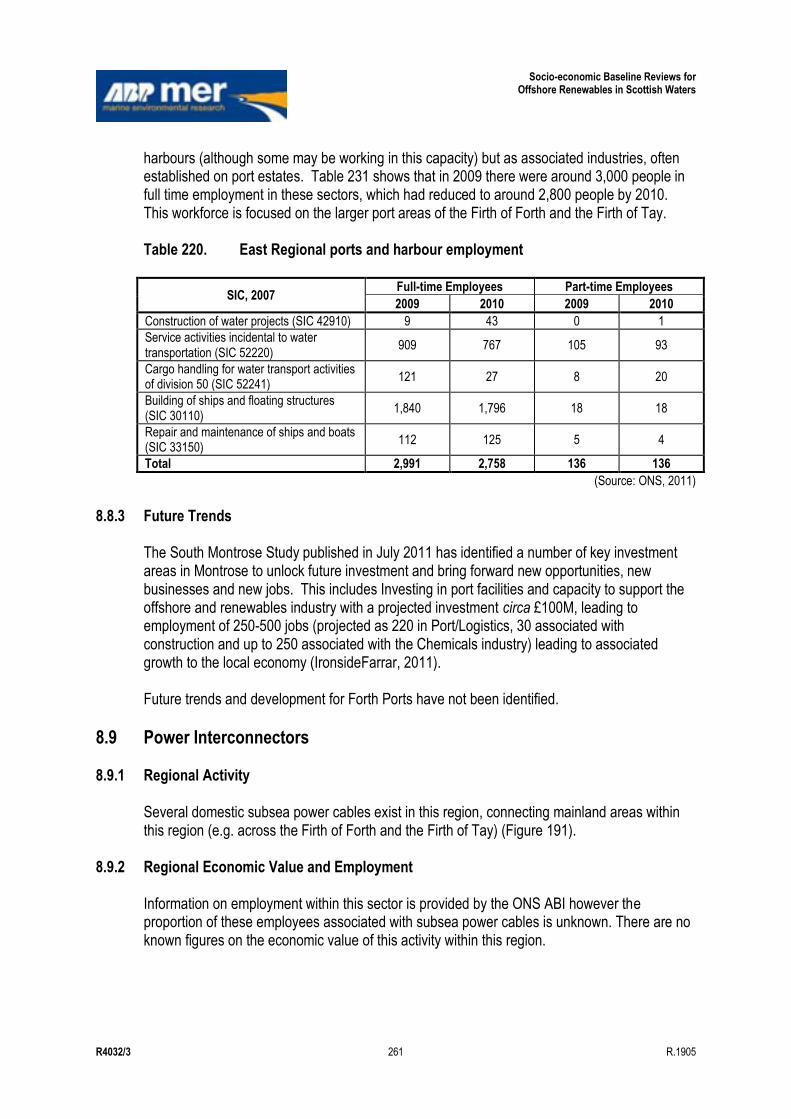
Socio-economic Baseline Reviews for Offshore Renewables in Scottish Waters
R4032/3 261 R.1905
harbours (although some may be working in this capacity) but as associated industries, often established on port estates. Table 231 shows that in 2009 there were around 3,000 people in full time employment in these sectors, which had reduced to around 2,800 people by 2010. This workforce is focused on the larger port areas of the Firth of Forth and the Firth of Tay. Table 220. East Regional ports and harbour employment
SIC, 2007 Full-time Employees Part-time Employees
2009 2010 2009 2010
Construction of water projects (SIC 42910) 9 43 0 1
Service activities incidental to water transportation (SIC 52220)
909 767 105 93
Cargo handling for water transport activities of division 50 (SIC 52241)
121 27 8 20
Building of ships and floating structures (SIC 30110)
1,840 1,796 18 18
Repair and maintenance of ships and boats (SIC 33150)
112 125 5 4
Total 2,991 2,758 136 136
(Source: ONS, 2011)
8.8.3 Future Trends The South Montrose Study published in July 2011 has identified a number of key investment areas in Montrose to unlock future investment and bring forward new opportunities, new businesses and new jobs. This includes Investing in port facilities and capacity to support the offshore and renewables industry with a projected investment circa £100M, leading to employment of 250-500 jobs (projected as 220 in Port/Logistics, 30 associated with construction and up to 250 associated with the Chemicals industry) leading to associated growth to the local economy (IronsideFarrar, 2011). Future trends and development for Forth Ports have not been identified.
8.9 Power Interconnectors
8.9.1 Regional Activity Several domestic subsea power cables exist in this region, connecting mainland areas within this region (e.g. across the Firth of Forth and the Firth of Tay) (Figure 191).
8.9.2 Regional Economic Value and Employment Information on employment within this sector is provided by the ONS ABI however the proportion of these employees associated with subsea power cables is unknown. There are no known figures on the economic value of this activity within this region.
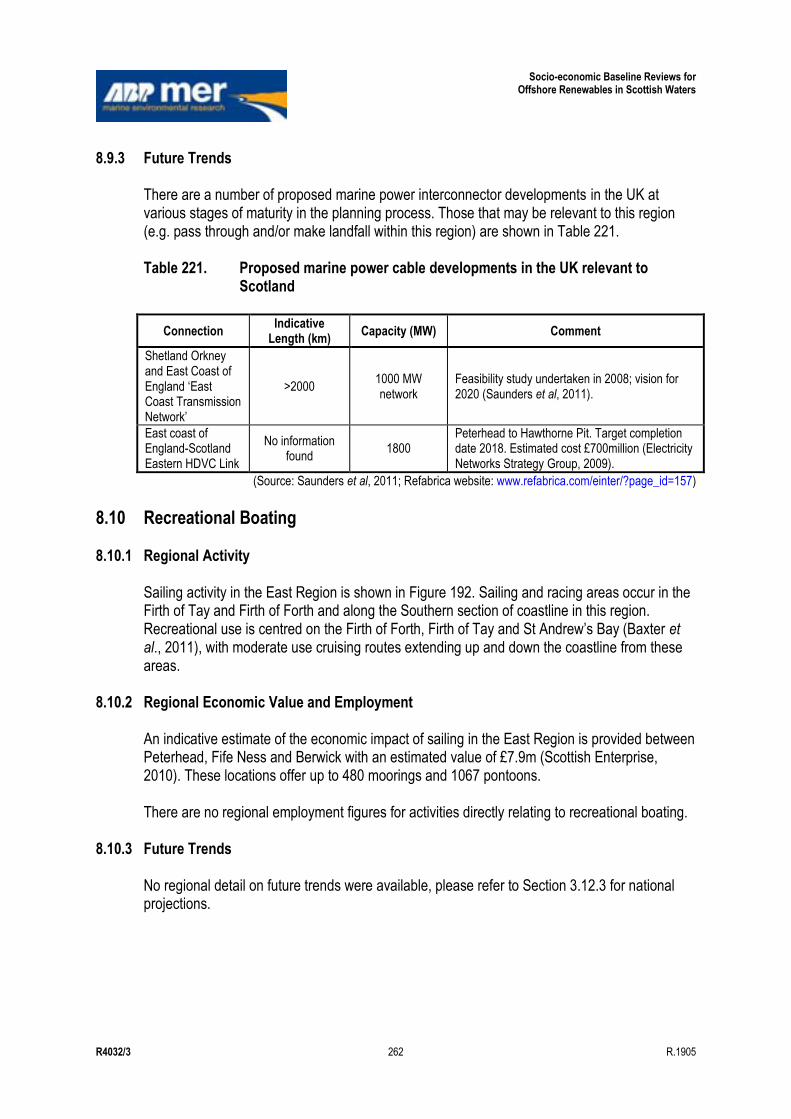
Socio-economic Baseline Reviews for Offshore Renewables in Scottish Waters
R4032/3 262 R.1905
8.9.3 Future Trends There are a number of proposed marine power interconnector developments in the UK at various stages of maturity in the planning process. Those that may be relevant to this region (e.g. pass through and/or make landfall within this region) are shown in Table 221. Table 221. Proposed marine power cable developments in the UK relevant to
Scotland
Connection Indicative
Length (km) Capacity (MW) Comment
Shetland Orkney and East Coast of England „East Coast Transmission Network‟
>2000 1000 MW network
Feasibility study undertaken in 2008; vision for 2020 (Saunders et al, 2011).
East coast of England-Scotland Eastern HDVC Link
No information found
1800 Peterhead to Hawthorne Pit. Target completion date 2018. Estimated cost £700million (Electricity Networks Strategy Group, 2009).
(Source: Saunders et al, 2011; Refabrica website: www.refabrica.com/einter/?page_id=157)
8.10 Recreational Boating
8.10.1 Regional Activity Sailing activity in the East Region is shown in Figure 192. Sailing and racing areas occur in the Firth of Tay and Firth of Forth and along the Southern section of coastline in this region. Recreational use is centred on the Firth of Forth, Firth of Tay and St Andrew‟s Bay (Baxter et al., 2011), with moderate use cruising routes extending up and down the coastline from these areas.
8.10.2 Regional Economic Value and Employment An indicative estimate of the economic impact of sailing in the East Region is provided between Peterhead, Fife Ness and Berwick with an estimated value of £7.9m (Scottish Enterprise, 2010). These locations offer up to 480 moorings and 1067 pontoons. There are no regional employment figures for activities directly relating to recreational boating.
8.10.3 Future Trends No regional detail on future trends were available, please refer to Section 3.12.3 for national projections.
Socio-economic Baseline Reviews for Offshore Renewables in Scottish Waters
R4032/3 263 R.1905
8.11 Shipping
8.11.1 Regional Activity From the Northerly boundary of this region, the coast runs in a generally South southwest direction to Fifeness. The coast North of the Forth is mainly composed of rocky cliffs, fringed by drying reefs providing some navigation hazards. There are a number of outlying banks and deeps along the coast most notably Bell Rock lying 9.5 miles South East of Whiting Ness. The Firth of Forth under one port authority provides a number of ports and terminals and an intensity of sea area use is evident, Table 222 shows the number of vessels arriving at the Forth Ports annually. The Forth is a major petroleum port exporting crude oil in up to VLCC size vessels as well as handling products and gas shipments. Large numbers of feeder container vessels visit whilst general bulk facilities dealing with timber, coal and aggregates. An International ferry operates from Rosyth and cruise vessels of all sizes visit the Firth. Small scale fishing is undertaken from some of the Fife coast ports and there is significant numbers of leisure users based in a number of marinas within the port authority area (GLA, 2010). Table 222. East Regional vessel arrival counts at major ports
Port 1995 1996 1997 1998 1999 2000 2001
Montrose 378 338 352 298 315 317 299
Dundee 307 326 373 315 355 339 363
Perth 203 150 99 117 171 161 104
Forth 3,751 3,824 3,803 3,971 3,598 3,755 3,897
Port 2002 2003 2004 2005 2006 2007 2008
Montrose 329 329 334 282 267 205 233
Dundee 376 351 335 342 364 293 271
Perth 93 97 113 95 110 100 93
Forth 3,797 4,110 3,784 3,827 3,585 3,424 3,338
(Source: DfT, 2010) One ferry service is established in this region, as shown in Figure 193. This operates between Rosyth and Zeebrugge providing a direct link to European and is therefore an important economic and social link to support business and transport within this region (Marine Scotland, 2011a).
8.11.2 Regional Economic Value and Employment There is no published information on the specific economic value of shipping to this region.
It has not been possible to derive economic values from publicly available data. Employment data from the business register and employment survey by the ONS (2011) has been reviewed and is not considered to provide a representative view of employment generated by the shipping industry within this region. This is identified as a data gap.
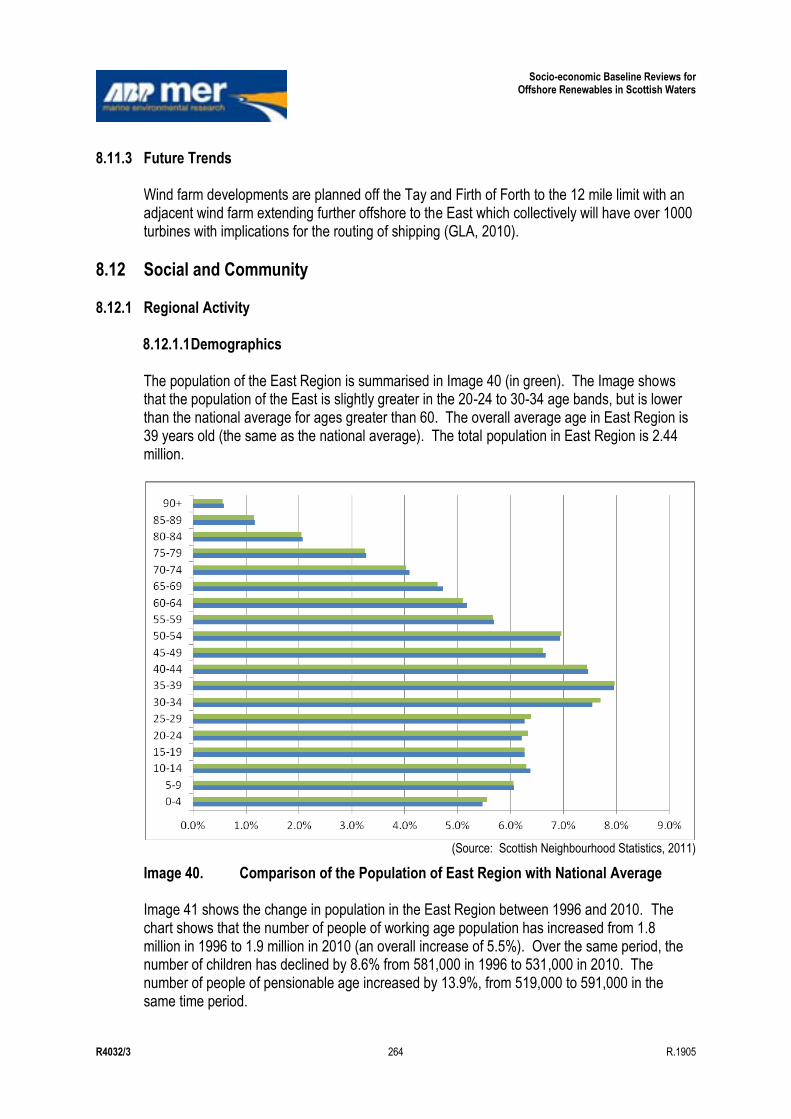
Socio-economic Baseline Reviews for Offshore Renewables in Scottish Waters
R4032/3 264 R.1905
8.11.3 Future Trends Wind farm developments are planned off the Tay and Firth of Forth to the 12 mile limit with an adjacent wind farm extending further offshore to the East which collectively will have over 1000 turbines with implications for the routing of shipping (GLA, 2010).
8.12 Social and Community
8.12.1 Regional Activity 8.12.1.1 Demographics The population of the East Region is summarised in Image 40 (in green). The Image shows that the population of the East is slightly greater in the 20-24 to 30-34 age bands, but is lower than the national average for ages greater than 60. The overall average age in East Region is 39 years old (the same as the national average). The total population in East Region is 2.44 million.
(Source: Scottish Neighbourhood Statistics, 2011)
Image 40. Comparison of the Population of East Region with National Average Image 41 shows the change in population in the East Region between 1996 and 2010. The chart shows that the number of people of working age population has increased from 1.8 million in 1996 to 1.9 million in 2010 (an overall increase of 5.5%). Over the same period, the number of children has declined by 8.6% from 581,000 in 1996 to 531,000 in 2010. The number of people of pensionable age increased by 13.9%, from 519,000 to 591,000 in the same time period.
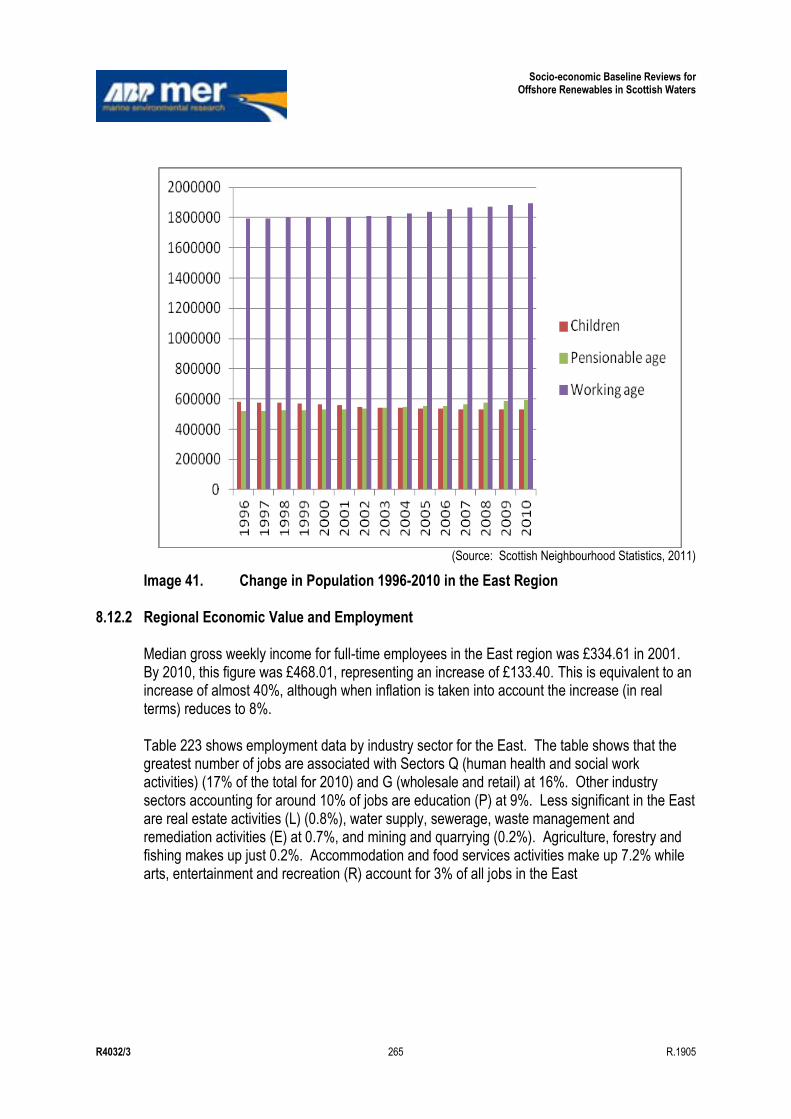
Socio-economic Baseline Reviews for Offshore Renewables in Scottish Waters
R4032/3 265 R.1905
(Source: Scottish Neighbourhood Statistics, 2011)
Image 41. Change in Population 1996-2010 in the East Region 8.12.2 Regional Economic Value and Employment
Median gross weekly income for full-time employees in the East region was £334.61 in 2001. By 2010, this figure was £468.01, representing an increase of £133.40. This is equivalent to an increase of almost 40%, although when inflation is taken into account the increase (in real terms) reduces to 8%. Table 223 shows employment data by industry sector for the East. The table shows that the greatest number of jobs are associated with Sectors Q (human health and social work activities) (17% of the total for 2010) and G (wholesale and retail) at 16%. Other industry sectors accounting for around 10% of jobs are education (P) at 9%. Less significant in the East are real estate activities (L) (0.8%), water supply, sewerage, waste management and remediation activities (E) at 0.7%, and mining and quarrying (0.2%). Agriculture, forestry and fishing makes up just 0.2%. Accommodation and food services activities make up 7.2% while arts, entertainment and recreation (R) account for 3% of all jobs in the East
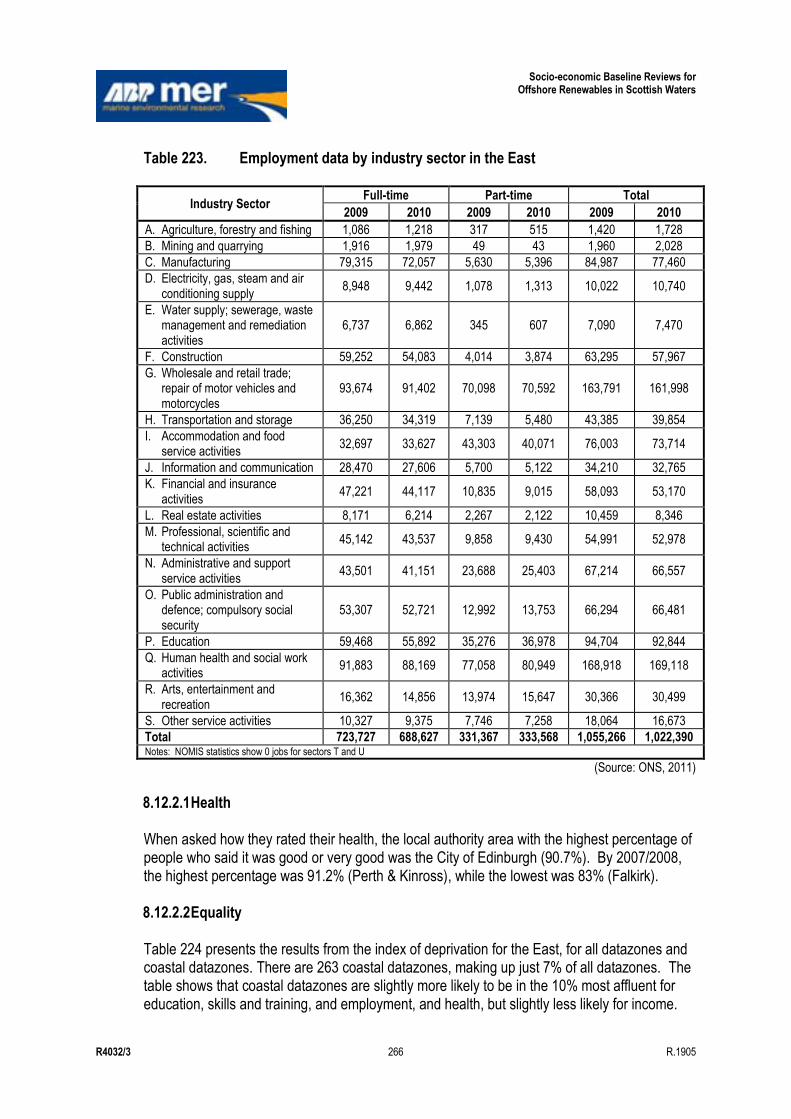
Socio-economic Baseline Reviews for Offshore Renewables in Scottish Waters
R4032/3 266 R.1905
Table 223. Employment data by industry sector in the East
Industry Sector Full-time Part-time Total
2009 2010 2009 2010 2009 2010
A. Agriculture, forestry and fishing 1,086 1,218 317 515 1,420 1,728
B. Mining and quarrying 1,916 1,979 49 43 1,960 2,028
C. Manufacturing 79,315 72,057 5,630 5,396 84,987 77,460
D. Electricity, gas, steam and air conditioning supply
8,948 9,442 1,078 1,313 10,022 10,740
E. Water supply; sewerage, waste management and remediation activities
6,737 6,862 345 607 7,090 7,470
F. Construction 59,252 54,083 4,014 3,874 63,295 57,967
G. Wholesale and retail trade; repair of motor vehicles and motorcycles
93,674 91,402 70,098 70,592 163,791 161,998
H. Transportation and storage 36,250 34,319 7,139 5,480 43,385 39,854
I. Accommodation and food service activities
32,697 33,627 43,303 40,071 76,003 73,714
J. Information and communication 28,470 27,606 5,700 5,122 34,210 32,765
K. Financial and insurance activities
47,221 44,117 10,835 9,015 58,093 53,170
L. Real estate activities 8,171 6,214 2,267 2,122 10,459 8,346
M. Professional, scientific and technical activities
45,142 43,537 9,858 9,430 54,991 52,978
N. Administrative and support service activities
43,501 41,151 23,688 25,403 67,214 66,557
O. Public administration and defence; compulsory social security
53,307 52,721 12,992 13,753 66,294 66,481
P. Education 59,468 55,892 35,276 36,978 94,704 92,844
Q. Human health and social work activities
91,883 88,169 77,058 80,949 168,918 169,118
R. Arts, entertainment and recreation
16,362 14,856 13,974 15,647 30,366 30,499
S. Other service activities 10,327 9,375 7,746 7,258 18,064 16,673
Total 723,727 688,627 331,367 333,568 1,055,266 1,022,390 Notes: NOMIS statistics show 0 jobs for sectors T and U
(Source: ONS, 2011)
8.12.2.1 Health
When asked how they rated their health, the local authority area with the highest percentage of people who said it was good or very good was the City of Edinburgh (90.7%). By 2007/2008, the highest percentage was 91.2% (Perth & Kinross), while the lowest was 83% (Falkirk).
8.12.2.2 Equality
Table 224 presents the results from the index of deprivation for the East, for all datazones and coastal datazones. There are 263 coastal datazones, making up just 7% of all datazones. The table shows that coastal datazones are slightly more likely to be in the 10% most affluent for education, skills and training, and employment, and health, but slightly less likely for income.
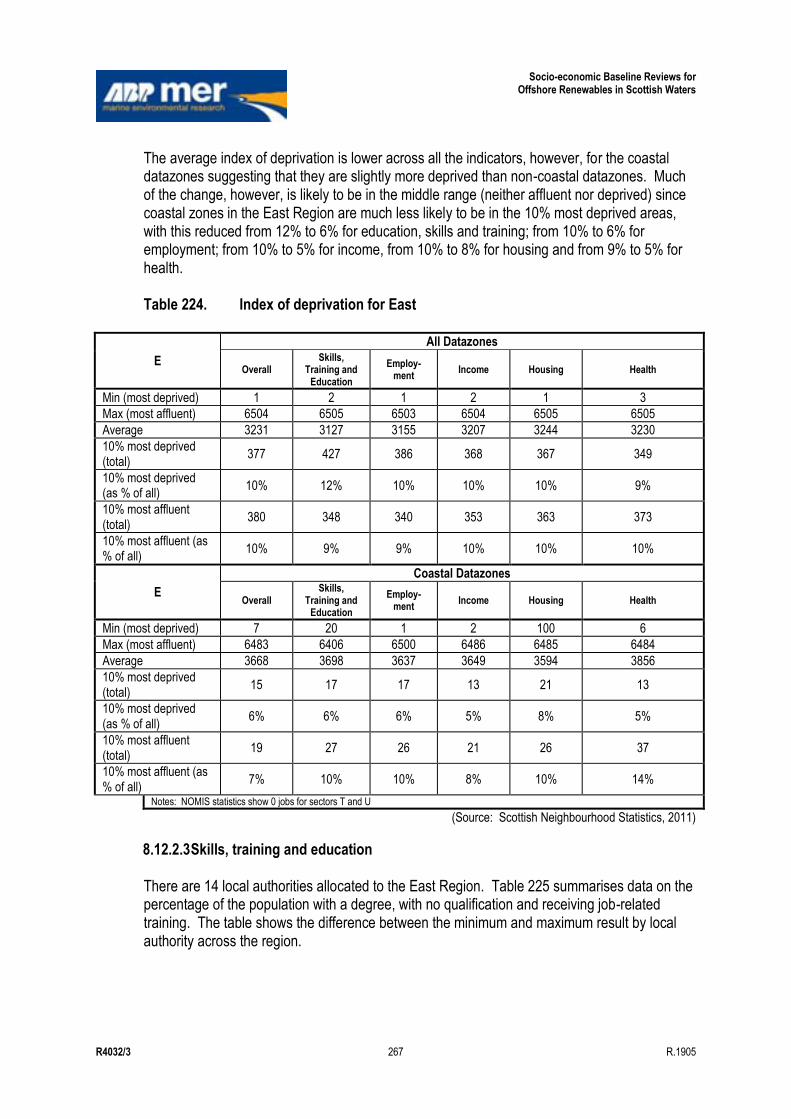
Socio-economic Baseline Reviews for Offshore Renewables in Scottish Waters
R4032/3 267 R.1905
The average index of deprivation is lower across all the indicators, however, for the coastal datazones suggesting that they are slightly more deprived than non-coastal datazones. Much of the change, however, is likely to be in the middle range (neither affluent nor deprived) since coastal zones in the East Region are much less likely to be in the 10% most deprived areas, with this reduced from 12% to 6% for education, skills and training; from 10% to 6% for employment; from 10% to 5% for income, from 10% to 8% for housing and from 9% to 5% for health. Table 224. Index of deprivation for East
E
All Datazones
Overall Skills,
Training and Education
Employ-ment
Income Housing Health
Min (most deprived) 1 2 1 2 1 3
Max (most affluent) 6504 6505 6503 6504 6505 6505
Average 3231 3127 3155 3207 3244 3230
10% most deprived (total)
377 427 386 368 367 349
10% most deprived (as % of all)
10% 12% 10% 10% 10% 9%
10% most affluent (total)
380 348 340 353 363 373
10% most affluent (as % of all)
10% 9% 9% 10% 10% 10%
E
Coastal Datazones
Overall Skills,
Training and Education
Employ-ment
Income Housing Health
Min (most deprived) 7 20 1 2 100 6
Max (most affluent) 6483 6406 6500 6486 6485 6484
Average 3668 3698 3637 3649 3594 3856
10% most deprived (total)
15 17 17 13 21 13
10% most deprived (as % of all)
6% 6% 6% 5% 8% 5%
10% most affluent (total)
19 27 26 21 26 37
10% most affluent (as % of all)
7% 10% 10% 8% 10% 14%
Notes: NOMIS statistics show 0 jobs for sectors T and U
(Source: Scottish Neighbourhood Statistics, 2011)
8.12.2.3 Skills, training and education There are 14 local authorities allocated to the East Region. Table 225 summarises data on the percentage of the population with a degree, with no qualification and receiving job-related training. The table shows the difference between the minimum and maximum result by local authority across the region.
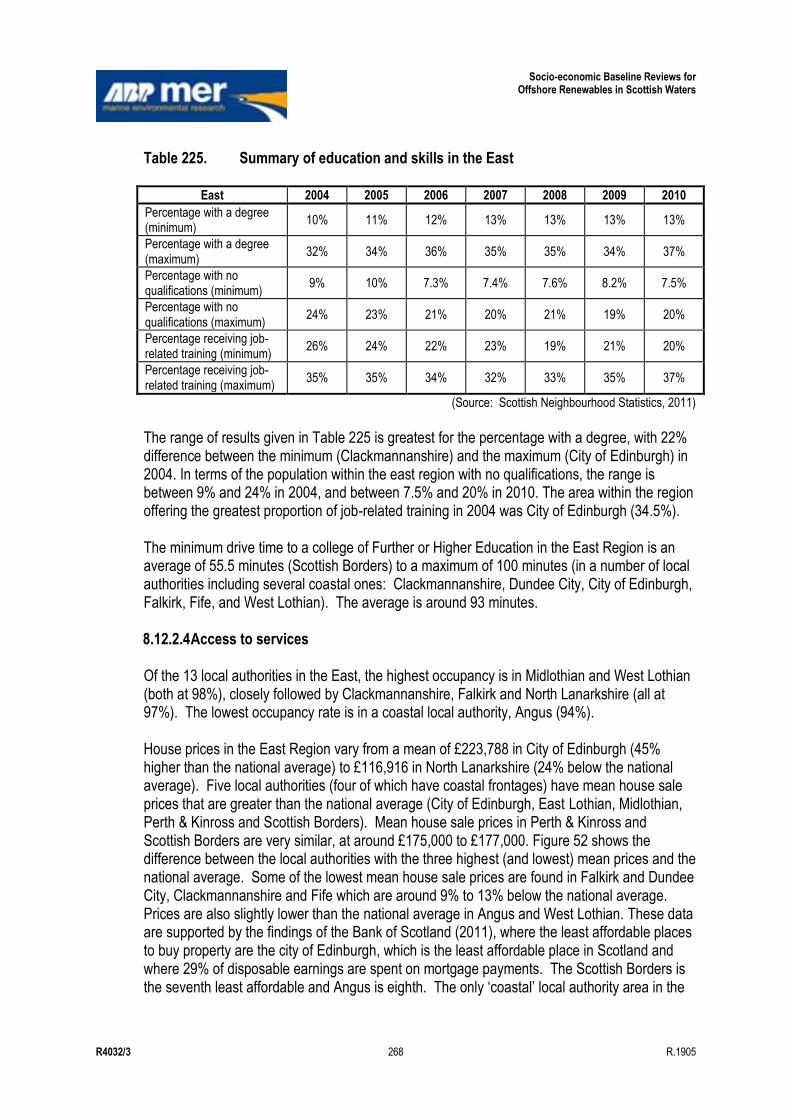
Socio-economic Baseline Reviews for Offshore Renewables in Scottish Waters
R4032/3 268 R.1905
Table 225. Summary of education and skills in the East
East 2004 2005 2006 2007 2008 2009 2010
Percentage with a degree (minimum)
10% 11% 12% 13% 13% 13% 13%
Percentage with a degree (maximum)
32% 34% 36% 35% 35% 34% 37%
Percentage with no qualifications (minimum)
9% 10% 7.3% 7.4% 7.6% 8.2% 7.5%
Percentage with no qualifications (maximum)
24% 23% 21% 20% 21% 19% 20%
Percentage receiving job-related training (minimum)
26% 24% 22% 23% 19% 21% 20%
Percentage receiving job-related training (maximum)
35% 35% 34% 32% 33% 35% 37%
(Source: Scottish Neighbourhood Statistics, 2011)
The range of results given in Table 225 is greatest for the percentage with a degree, with 22% difference between the minimum (Clackmannanshire) and the maximum (City of Edinburgh) in 2004. In terms of the population within the east region with no qualifications, the range is between 9% and 24% in 2004, and between 7.5% and 20% in 2010. The area within the region offering the greatest proportion of job-related training in 2004 was City of Edinburgh (34.5%). The minimum drive time to a college of Further or Higher Education in the East Region is an average of 55.5 minutes (Scottish Borders) to a maximum of 100 minutes (in a number of local authorities including several coastal ones: Clackmannanshire, Dundee City, City of Edinburgh, Falkirk, Fife, and West Lothian). The average is around 93 minutes. 8.12.2.4 Access to services Of the 13 local authorities in the East, the highest occupancy is in Midlothian and West Lothian (both at 98%), closely followed by Clackmannanshire, Falkirk and North Lanarkshire (all at 97%). The lowest occupancy rate is in a coastal local authority, Angus (94%). House prices in the East Region vary from a mean of £223,788 in City of Edinburgh (45% higher than the national average) to £116,916 in North Lanarkshire (24% below the national average). Five local authorities (four of which have coastal frontages) have mean house sale prices that are greater than the national average (City of Edinburgh, East Lothian, Midlothian, Perth & Kinross and Scottish Borders). Mean house sale prices in Perth & Kinross and Scottish Borders are very similar, at around £175,000 to £177,000. Figure 52 shows the difference between the local authorities with the three highest (and lowest) mean prices and the national average. Some of the lowest mean house sale prices are found in Falkirk and Dundee City, Clackmannanshire and Fife which are around 9% to 13% below the national average. Prices are also slightly lower than the national average in Angus and West Lothian. These data are supported by the findings of the Bank of Scotland (2011), where the least affordable places to buy property are the city of Edinburgh, which is the least affordable place in Scotland and where 29% of disposable earnings are spent on mortgage payments. The Scottish Borders is the seventh least affordable and Angus is eighth. The only „coastal‟ local authority area in the
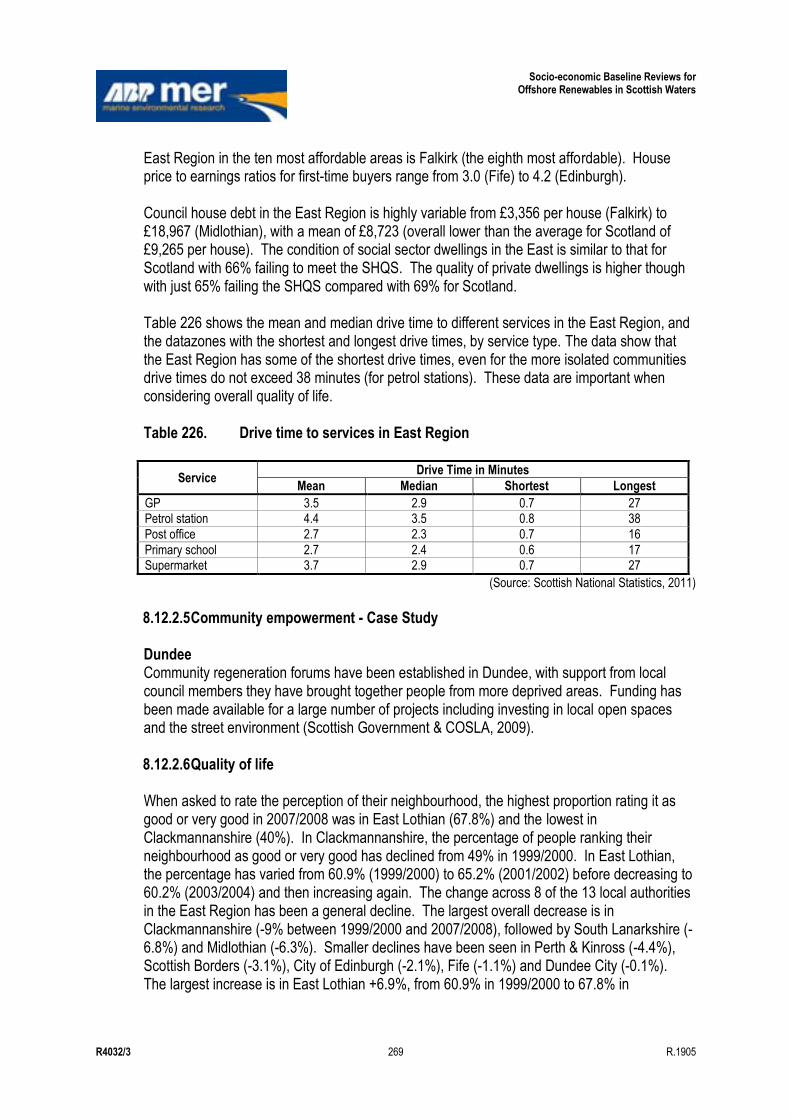
Socio-economic Baseline Reviews for Offshore Renewables in Scottish Waters
R4032/3 269 R.1905
East Region in the ten most affordable areas is Falkirk (the eighth most affordable). House price to earnings ratios for first-time buyers range from 3.0 (Fife) to 4.2 (Edinburgh). Council house debt in the East Region is highly variable from £3,356 per house (Falkirk) to £18,967 (Midlothian), with a mean of £8,723 (overall lower than the average for Scotland of £9,265 per house). The condition of social sector dwellings in the East is similar to that for Scotland with 66% failing to meet the SHQS. The quality of private dwellings is higher though with just 65% failing the SHQS compared with 69% for Scotland. Table 226 shows the mean and median drive time to different services in the East Region, and the datazones with the shortest and longest drive times, by service type. The data show that the East Region has some of the shortest drive times, even for the more isolated communities drive times do not exceed 38 minutes (for petrol stations). These data are important when considering overall quality of life. Table 226. Drive time to services in East Region
Service Drive Time in Minutes
Mean Median Shortest Longest
GP 3.5 2.9 0.7 27 Petrol station 4.4 3.5 0.8 38
Post office 2.7 2.3 0.7 16
Primary school 2.7 2.4 0.6 17 Supermarket 3.7 2.9 0.7 27
(Source: Scottish National Statistics, 2011)
8.12.2.5 Community empowerment - Case Study Dundee Community regeneration forums have been established in Dundee, with support from local council members they have brought together people from more deprived areas. Funding has been made available for a large number of projects including investing in local open spaces and the street environment (Scottish Government & COSLA, 2009).
8.12.2.6 Quality of life
When asked to rate the perception of their neighbourhood, the highest proportion rating it as good or very good in 2007/2008 was in East Lothian (67.8%) and the lowest in Clackmannanshire (40%). In Clackmannanshire, the percentage of people ranking their neighbourhood as good or very good has declined from 49% in 1999/2000. In East Lothian, the percentage has varied from 60.9% (1999/2000) to 65.2% (2001/2002) before decreasing to 60.2% (2003/2004) and then increasing again. The change across 8 of the 13 local authorities in the East Region has been a general decline. The largest overall decrease is in Clackmannanshire (-9% between 1999/2000 and 2007/2008), followed by South Lanarkshire (-6.8%) and Midlothian (-6.3%). Smaller declines have been seen in Perth & Kinross (-4.4%), Scottish Borders (-3.1%), City of Edinburgh (-2.1%), Fife (-1.1%) and Dundee City (-0.1%). The largest increase is in East Lothian +6.9%, from 60.9% in 1999/2000 to 67.8% in
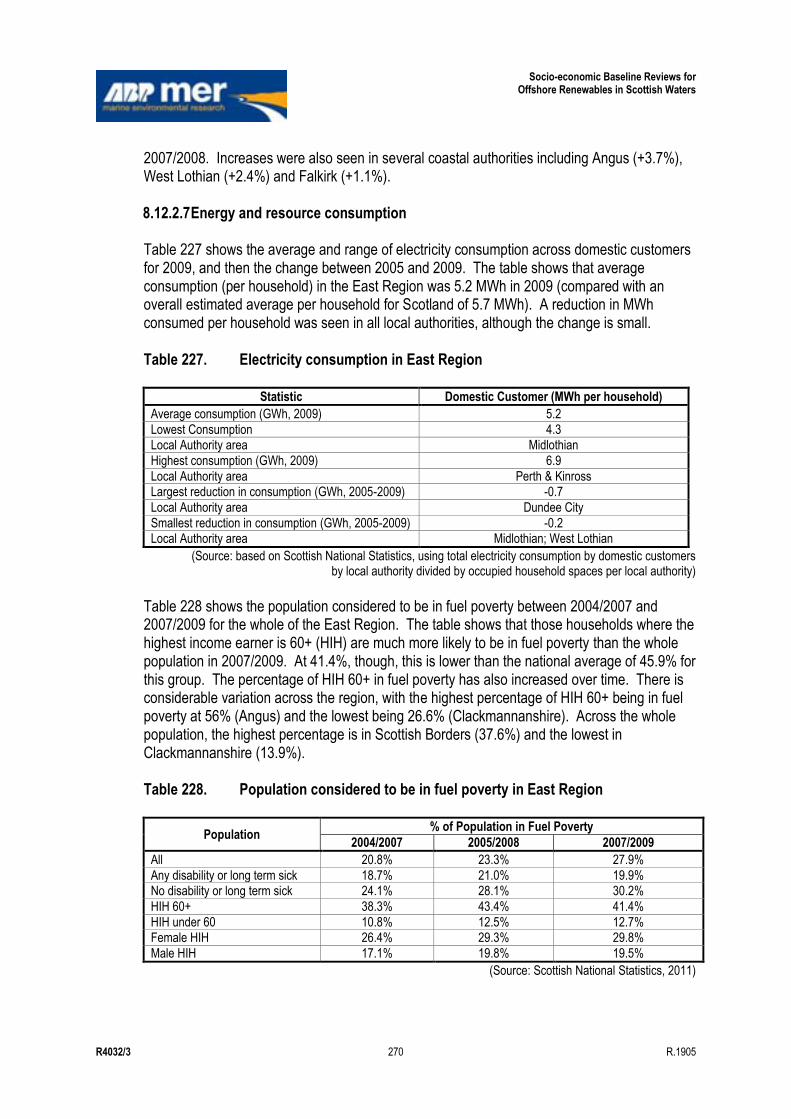
Socio-economic Baseline Reviews for Offshore Renewables in Scottish Waters
R4032/3 270 R.1905
2007/2008. Increases were also seen in several coastal authorities including Angus (+3.7%), West Lothian (+2.4%) and Falkirk (+1.1%). 8.12.2.7 Energy and resource consumption
Table 227 shows the average and range of electricity consumption across domestic customers for 2009, and then the change between 2005 and 2009. The table shows that average consumption (per household) in the East Region was 5.2 MWh in 2009 (compared with an overall estimated average per household for Scotland of 5.7 MWh). A reduction in MWh consumed per household was seen in all local authorities, although the change is small. Table 227. Electricity consumption in East Region
Statistic Domestic Customer (MWh per household)
Average consumption (GWh, 2009) 5.2
Lowest Consumption 4.3 Local Authority area Midlothian
Highest consumption (GWh, 2009) 6.9
Local Authority area Perth & Kinross Largest reduction in consumption (GWh, 2005-2009) -0.7
Local Authority area Dundee City
Smallest reduction in consumption (GWh, 2005-2009) -0.2 Local Authority area Midlothian; West Lothian
(Source: based on Scottish National Statistics, using total electricity consumption by domestic customers by local authority divided by occupied household spaces per local authority)
Table 228 shows the population considered to be in fuel poverty between 2004/2007 and 2007/2009 for the whole of the East Region. The table shows that those households where the highest income earner is 60+ (HIH) are much more likely to be in fuel poverty than the whole population in 2007/2009. At 41.4%, though, this is lower than the national average of 45.9% for this group. The percentage of HIH 60+ in fuel poverty has also increased over time. There is considerable variation across the region, with the highest percentage of HIH 60+ being in fuel poverty at 56% (Angus) and the lowest being 26.6% (Clackmannanshire). Across the whole population, the highest percentage is in Scottish Borders (37.6%) and the lowest in Clackmannanshire (13.9%). Table 228. Population considered to be in fuel poverty in East Region
Population % of Population in Fuel Poverty
2004/2007 2005/2008 2007/2009
All 20.8% 23.3% 27.9%
Any disability or long term sick 18.7% 21.0% 19.9% No disability or long term sick 24.1% 28.1% 30.2%
HIH 60+ 38.3% 43.4% 41.4%
HIH under 60 10.8% 12.5% 12.7% Female HIH 26.4% 29.3% 29.8%
Male HIH 17.1% 19.8% 19.5%
(Source: Scottish National Statistics, 2011)

Socio-economic Baseline Reviews for Offshore Renewables in Scottish Waters
R4032/3 271 R.1905
8.12.3 Future Trends Table 229 summarises the statistics and trends discussed above to give an indication of the likely future changes by indicator, comparing national with local trends (where data are available). There is much greater uncertainty over trends for the time period of 30 to 50 years and, in both cases, it is assumed that future trends follow recent and historic trends. The table only includes rows for which there are data at the regional level. For national projections where regional data are not available refer to Section 2.14.3. Table 229. Summary of future trends in East Region
Indicator National Regional
Evidence for Trend 10-20 years
30-50 years
10-20 years
30-50 years
Average age ↑ ↑ ↑ → Estimate of proportion of the population that is of pensionable age between 2001 and 2010
Working age population
↑ → ↑ → Recent trends suggest increase in the number of people of working age
Income ↑ ↑ ↑ ↑ Recent trends suggest increase in median weekly income over time, but the magnitude is variable across the region
Health ↑ → ↕ ↕ Recent trends suggest uncertainty due to regional differences
Perception that neighbourhood is a very good place to live
↕ ↕ ↓ ↓ Regional trends suggest decrease in 8 of 13 local authorities
Affordability of housing ↑ → ↑ →
Suggestion that affordability has increased recently, but this may not be sustained. There is variability across the region, although many areas are less affordable on average
Housing quality ↑ ↑ ↑ ↑
Housing quality, as measured by percentage of housing failing the SHQS, is improving and is already above the average for Scotland, although the definition used in the standard has changed over time, making this difficult to confirm
Energy consumption ↓ ↕ ↓ → Recent trends suggest potential for continued slight decline, in longer term is more uncertain
Fuel poverty ↑ → ↑ →
Recent trends show an overall increase even though the Scottish Government policy is that there should be no fuel poverty in the medium to long-term. Disability and long-term sick and HIH 60+ have shown small decreases
Key: ↑: indication of upward trend →: no significant change up or down expected ↓: indication of downward trend ↕: uncertain trend could be up or down
8.13 Telecomm Cables
8.13.1 Regional Activity Several telecommunication cables connecting England to Europe pass through offshore waters in the South East corner of this region, see Figure 194. In addition, a section of the offshore

Socio-economic Baseline Reviews for Offshore Renewables in Scottish Waters
R4032/3 272 R.1905
Norsea Coms cable, which supplies several offshore oil platforms, occurs in the North East corner of this region. The approximate landfall locations (note, not necessarily within this region) and capacity of these cables are shown in Table 230.
Table 230. Subsea telecommunication cables in the East Region
Cable To/from Capacity Length of Cable in
Region (km)
Norsea Coms A Valhal - Bu1 Clyde 160Gbps 28.96
Norsea Coms B Clyde To Judy 160Gbps 27.22
Pangea North UK/Denmark Redcar (UK) To Fano (Denmark) 7.2Tbps 48.33
(Sources: http://www.submarinecablemap.com/; http://www.bp.com/assets/bp_internet/globalbp/STAGING/
global_assets/downloads/S/scotland_central_north_sea.pdf
8.13.2 Regional Economic Value and Employment
There is currently no agreed method for valuing the services provided by cables as they form part of a wider infrastructure. Further information on employment within this sector is provided by the ONS ABI however the proportion of these employees associated with subsea telecommunication cables is unknown.
8.13.3 Future Trends
No specific information on future trends for this region was found. For national projections refer to Section 2.15.3.
8.14 Tourism
8.14.1 Regional Activity
Tourist sites in East Scotland include accommodation and camping facilities, general tourist attractions, historic/heritage attractions, natural heritage attractions, transport and travel related facilities (see Figure 195). Although sites are scattered throughout the region, there is a high density of sites along the coast, particularly in the Firth of Forth. This would be expected, given the proximity to Edinburgh. Indeed, the Firth of Forth additionally has several cultural and maritime heritage assets, as shown in Figure 196. These include a historic ship, sites designated under the Protection of Wrecks Act, a maritime museum and several listed buildings.
Popular activities in the East include surfing, which commonly occurs along the coast from Edinburgh to Coldingham Bay, where North-Westerly and Southern swells help to create consistent surf breaks (Baxter et al, 2011). The presence of Blue Flag Beaches71, designated bathing waters and areas with seaside awards (see Figure 197) is therefore likely to be
71 The Blue Flag is a voluntary eco-label which is awarded to around 3,650 beaches and marinas in 46 countries.
The programme is run by a non-government non-profit making organisation called the Foundation for Environmental Education (FEE). Beaches are awarded a Blue Flag provided that they comply with 32 criteria covering environmental education and information, water quality, environmental management, and safety and services. Awards are made on a season by season basis, and may be withdrawn during a season if the criteria are no longer met. For information on Blue Flag Beaches see the Blue Flag Internet site (www.blueflag.org).
Socio-economic Baseline Reviews for Offshore Renewables in Scottish Waters
R4032/3 273 R.1905
particularly important. A visual comparison between the maps of coastal award sites in all the regions indicates that East Scotland has one of the highest concentrations of such sites. In addition, the East Region is the only one which has some Blue Flag Beaches, namely:
Aberdour Silver Sands, Fife; Burntisland, Fife; Coldingham Bay, Scottish Borders; Elie Woodhaven (Ruby Bay), Fife; Leven East Beach, Fife; St Andrews East Sands, Fife; and St Andrews West Sands, Fife.
Thus, beach users are likely to be an important group for this region when considering the development of offshore renewables. There are also three areas designated as Marine Special Areas of Conservation72, namely; Firth of Tay & Eden Estuary, Isle of May and part of Berwickshire & Northumberland SAC. These SACs may well attract visitors for marine and coastal wildlife tourism. Visitor numbers and expenditure for 2009 for those from the UK coming to particular areas in the East SORER are (based on data from VisitScotland):
Edinburgh and the Lothians:
- UK visitors: made 2.46 million trips, spent £562 million and stayed 6.6 million nights; and
- Overseas visitors: made spent 1.33 million trips, spent £458 million and stayed for 7.44 million nights.
Angus and Dundee: - UK visitors: made 0.43 million trips, spent £74 million and stayed 1.5 million
nights; - Overseas visitors: made spent 0.07 million trips, spent £31 million and stayed for
0.71 million nights. Perthshire:
- UK visitors: made 0.74 million trips, spent £141 million and stayed 2.45 million nights;
- Overseas visitors: made spent 0.13 million trips, spent £45 million and stayed for 0.63 million nights.
Fife: - UK visitors: made 0.54 million trips, spent £106 million and stayed 1.93 million
nights; - Overseas visitors: made spent 0.13 million trips, spent £78 million and stayed for
0.87 million nights. Scottish Borders:
- UK visitors: made 0.37 million trips, spent £80 million and stayed 1.2 million nights;
72 http://jncc.defra.gov.uk/page-1445
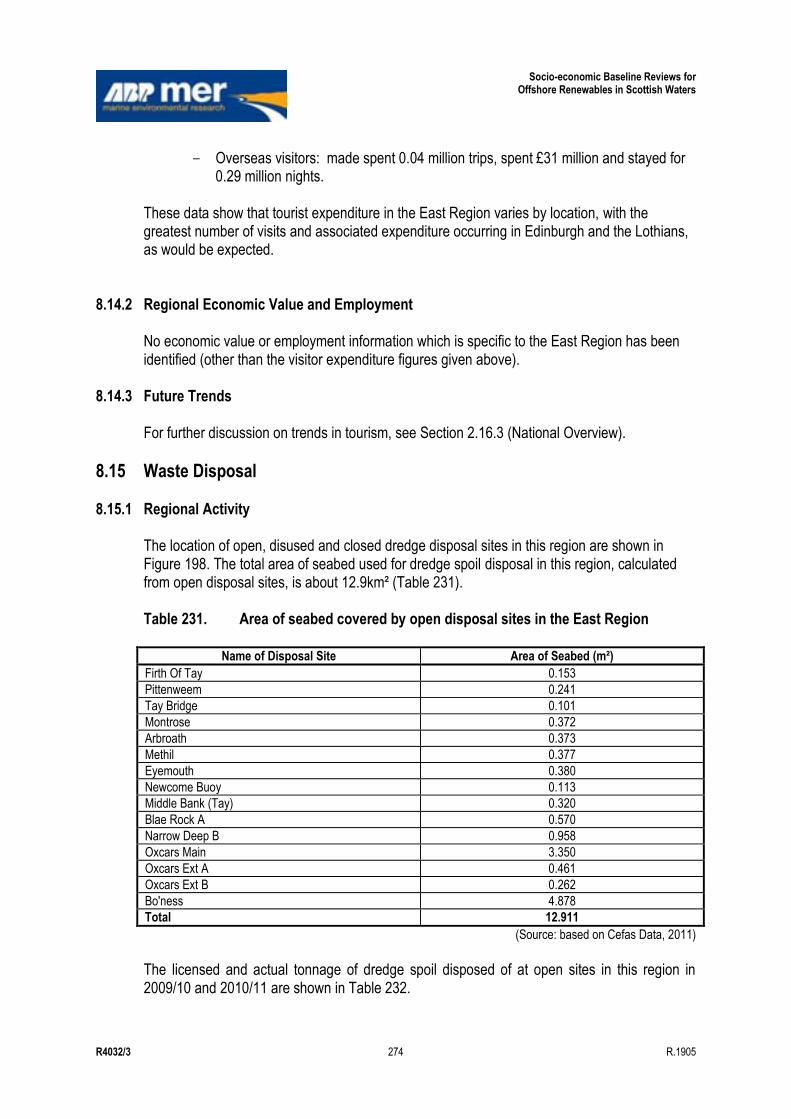
Socio-economic Baseline Reviews for Offshore Renewables in Scottish Waters
R4032/3 274 R.1905
- Overseas visitors: made spent 0.04 million trips, spent £31 million and stayed for 0.29 million nights.
These data show that tourist expenditure in the East Region varies by location, with the greatest number of visits and associated expenditure occurring in Edinburgh and the Lothians, as would be expected.
8.14.2 Regional Economic Value and Employment No economic value or employment information which is specific to the East Region has been identified (other than the visitor expenditure figures given above).
8.14.3 Future Trends For further discussion on trends in tourism, see Section 2.16.3 (National Overview).
8.15 Waste Disposal
8.15.1 Regional Activity The location of open, disused and closed dredge disposal sites in this region are shown in Figure 198. The total area of seabed used for dredge spoil disposal in this region, calculated from open disposal sites, is about 12.9km² (Table 231). Table 231. Area of seabed covered by open disposal sites in the East Region
Name of Disposal Site Area of Seabed (m²)
Firth Of Tay 0.153
Pittenweem 0.241
Tay Bridge 0.101
Montrose 0.372
Arbroath 0.373
Methil 0.377
Eyemouth 0.380
Newcome Buoy 0.113
Middle Bank (Tay) 0.320
Blae Rock A 0.570
Narrow Deep B 0.958
Oxcars Main 3.350
Oxcars Ext A 0.461
Oxcars Ext B 0.262
Bo'ness 4.878
Total 12.911
(Source: based on Cefas Data, 2011) The licensed and actual tonnage of dredge spoil disposed of at open sites in this region in 2009/10 and 2010/11 are shown in Table 232.
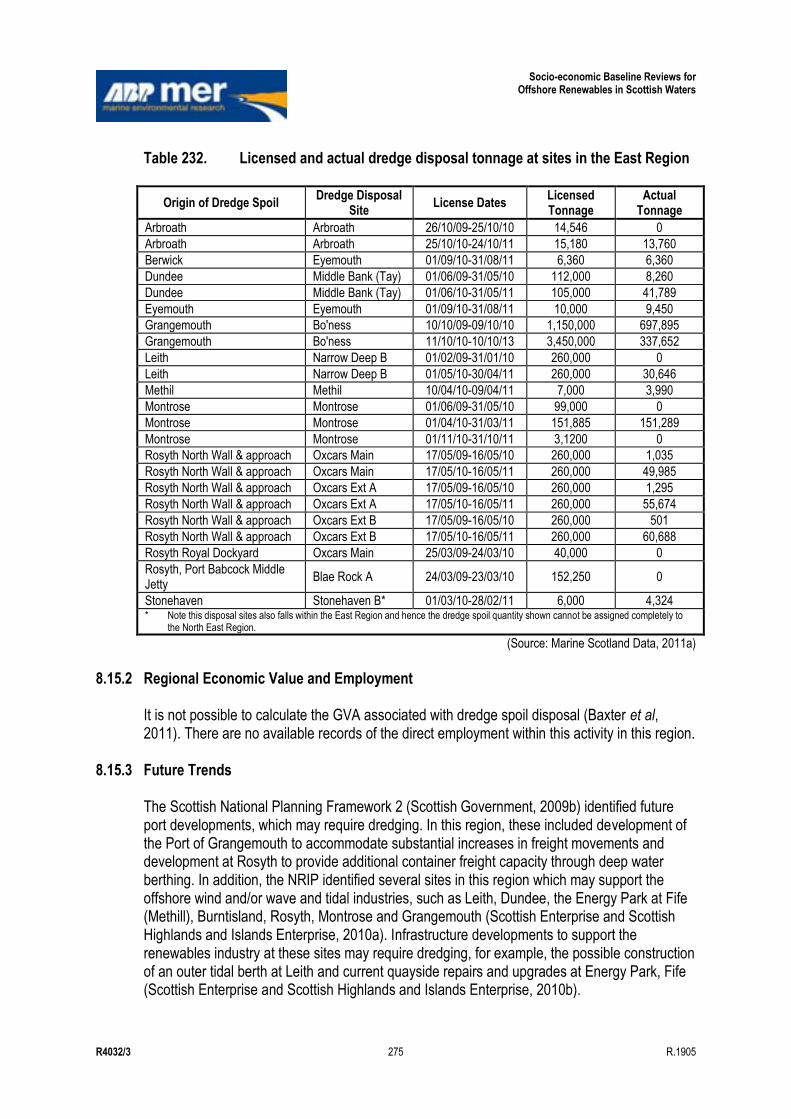
Socio-economic Baseline Reviews for Offshore Renewables in Scottish Waters
R4032/3 275 R.1905
Table 232. Licensed and actual dredge disposal tonnage at sites in the East Region
Origin of Dredge Spoil Dredge Disposal
Site License Dates
Licensed Tonnage
Actual Tonnage
Arbroath Arbroath 26/10/09-25/10/10 14,546 0
Arbroath Arbroath 25/10/10-24/10/11 15,180 13,760
Berwick Eyemouth 01/09/10-31/08/11 6,360 6,360
Dundee Middle Bank (Tay) 01/06/09-31/05/10 112,000 8,260
Dundee Middle Bank (Tay) 01/06/10-31/05/11 105,000 41,789
Eyemouth Eyemouth 01/09/10-31/08/11 10,000 9,450
Grangemouth Bo'ness 10/10/09-09/10/10 1,150,000 697,895
Grangemouth Bo'ness 11/10/10-10/10/13 3,450,000 337,652
Leith Narrow Deep B 01/02/09-31/01/10 260,000 0
Leith Narrow Deep B 01/05/10-30/04/11 260,000 30,646
Methil Methil 10/04/10-09/04/11 7,000 3,990
Montrose Montrose 01/06/09-31/05/10 99,000 0
Montrose Montrose 01/04/10-31/03/11 151,885 151,289
Montrose Montrose 01/11/10-31/10/11 3,1200 0
Rosyth North Wall & approach Oxcars Main 17/05/09-16/05/10 260,000 1,035
Rosyth North Wall & approach Oxcars Main 17/05/10-16/05/11 260,000 49,985
Rosyth North Wall & approach Oxcars Ext A 17/05/09-16/05/10 260,000 1,295
Rosyth North Wall & approach Oxcars Ext A 17/05/10-16/05/11 260,000 55,674
Rosyth North Wall & approach Oxcars Ext B 17/05/09-16/05/10 260,000 501
Rosyth North Wall & approach Oxcars Ext B 17/05/10-16/05/11 260,000 60,688
Rosyth Royal Dockyard Oxcars Main 25/03/09-24/03/10 40,000 0
Rosyth, Port Babcock Middle Jetty
Blae Rock A 24/03/09-23/03/10 152,250 0
Stonehaven Stonehaven B* 01/03/10-28/02/11 6,000 4,324 * Note this disposal sites also falls within the East Region and hence the dredge spoil quantity shown cannot be assigned completely to
the North East Region.
(Source: Marine Scotland Data, 2011a)
8.15.2 Regional Economic Value and Employment It is not possible to calculate the GVA associated with dredge spoil disposal (Baxter et al, 2011). There are no available records of the direct employment within this activity in this region.
8.15.3 Future Trends The Scottish National Planning Framework 2 (Scottish Government, 2009b) identified future port developments, which may require dredging. In this region, these included development of the Port of Grangemouth to accommodate substantial increases in freight movements and development at Rosyth to provide additional container freight capacity through deep water berthing. In addition, the NRIP identified several sites in this region which may support the offshore wind and/or wave and tidal industries, such as Leith, Dundee, the Energy Park at Fife (Methill), Burntisland, Rosyth, Montrose and Grangemouth (Scottish Enterprise and Scottish Highlands and Islands Enterprise, 2010a). Infrastructure developments to support the renewables industry at these sites may require dredging, for example, the possible construction of an outer tidal berth at Leith and current quayside repairs and upgrades at Energy Park, Fife (Scottish Enterprise and Scottish Highlands and Islands Enterprise, 2010b).
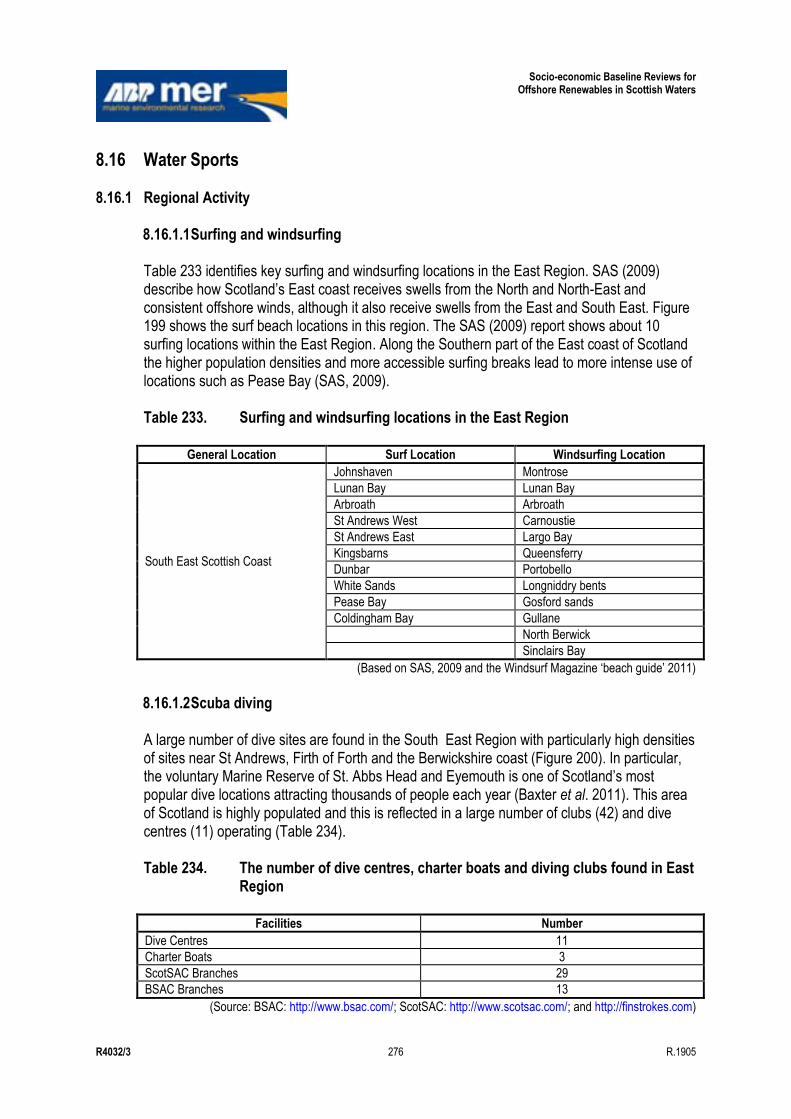
Socio-economic Baseline Reviews for Offshore Renewables in Scottish Waters
R4032/3 276 R.1905
8.16 Water Sports
8.16.1 Regional Activity 8.16.1.1 Surfing and windsurfing Table 233 identifies key surfing and windsurfing locations in the East Region. SAS (2009) describe how Scotland‟s East coast receives swells from the North and North-East and consistent offshore winds, although it also receive swells from the East and South East. Figure 199 shows the surf beach locations in this region. The SAS (2009) report shows about 10 surfing locations within the East Region. Along the Southern part of the East coast of Scotland the higher population densities and more accessible surfing breaks lead to more intense use of locations such as Pease Bay (SAS, 2009). Table 233. Surfing and windsurfing locations in the East Region
General Location Surf Location Windsurfing Location
South East Scottish Coast
Johnshaven Montrose
Lunan Bay Lunan Bay
Arbroath Arbroath
St Andrews West Carnoustie
St Andrews East Largo Bay
Kingsbarns Queensferry
Dunbar Portobello
White Sands Longniddry bents
Pease Bay Gosford sands
Coldingham Bay Gullane
North Berwick
Sinclairs Bay
(Based on SAS, 2009 and the Windsurf Magazine „beach guide‟ 2011)
8.16.1.2 Scuba diving A large number of dive sites are found in the South East Region with particularly high densities of sites near St Andrews, Firth of Forth and the Berwickshire coast (Figure 200). In particular, the voluntary Marine Reserve of St. Abbs Head and Eyemouth is one of Scotland‟s most popular dive locations attracting thousands of people each year (Baxter et al. 2011). This area of Scotland is highly populated and this is reflected in a large number of clubs (42) and dive centres (11) operating (Table 234). Table 234. The number of dive centres, charter boats and diving clubs found in East
Region
Facilities Number
Dive Centres 11
Charter Boats 3
ScotSAC Branches 29
BSAC Branches 13
(Source: BSAC: http://www.bsac.com/; ScotSAC: http://www.scotsac.com/; and http://finstrokes.com)
Socio-economic Baseline Reviews for Offshore Renewables in Scottish Waters
R4032/3 277 R.1905
8.16.1.3 Angling Sea Angling is undertaken along much of the East Region such as the Firth of Tay and East Lothian coast (Land Use Consultants, 2007). 8.16.1.4 Small sail boat activities and sea kayaking Coastal Dinghy sailing is popular in the East Region with a high density of clubs found around the Firth of Tay and inner Firth of Forth (Figure 201). The Firth of Forth is also a popular location for Sea kayaking (Land Use Consultants, 2007) (Figure 202).
8.16.2 Regional Economic Value and Employment Regional economic data was available for recreational angling and scuba diving within this SORER. 8.16.2.1 Angling Radford et al (2009) estimated the sea angling activity and economic value in eight regions of Scotland. Two of these regions, Edinburgh, Fife & North East fall within the East Region. As the areas in Radford et al (2009) do not align with the SORERs the values should only be taken as indicative values for comparison between areas. The total estimated regional sea angling activity and expenditure within these two regions is shown in Table 235 below. Table 235. Estimated regional sea angling activity and expenditure in East Region
Region No. Resident Sea Anglers
Annual Sea Angler Days
Spent in Region
% of Total Activity
Undertaken on the Shore
Total Annual Sea Angler Expenditure
(£M)
% of Expenditure
Spent on Shore Angling
Number of Jobs
Supported
Edinburgh, Fife & South East
20455 250868 50% 26.9 51% 504
North East Scotland
8904 234307 55% 15.5 57% 343
(Source: Radford et al, 2009) 8.16.2.2 Scuba diving Data collected by the Scottish Enterprise Borders (SEB) in 2007 estimated that 25,000 divers visited St Abbs/Eyemouth and contributed £3.7 million GVA to the local economy. The SEB data suggests that the activity supports 81.7FTEs in the Scottish Borders area and has a GVA of £1.5 million per annum (Scottish Enterprise Borders, 2008). No values for other activities at a regional scale were available.

Socio-economic Baseline Reviews for Offshore Renewables in Scottish Waters
R4032/3 278 R.1905
Similarly no regional employment figures for activities directly relating to water sports are available.
8.16.3 Future Trends A new study has shown that establishing the Berwickshire coast as one of the UK's leading dive locations could help to attract an additional 15,000 visitors to the region and lead to an additional £2m GVA for the Scottish economy a year. The independent report, commissioned by SEB, highlights that marketing St Abbs and Eyemouth as a single dive location, and encouraging more divers to visit off-peak and mid-week, would deliver substantial economic benefits for the towns as well as the region as a whole. The report also states that developing a long-term vision for the area and investing in new infrastructure to cope with increased demand could create an additional 59 jobs across Scottish Borders region and up to 100 new jobs across Scotland. Some of the proposals in the report include: •Increase the supply of accommodation for large dive groups such as a campsite, hostel or a part hotel •Improve changing facilities and restrooms in both St Abbs and Eyemouth, which offer easier access to the shore •Develop more mid-week and off-season packages to increase visitors at a time which will not cause further congestion in the towns as well as look at the potential of a park and ride scheme to limit the number of cars in St Abbs •Identify the potential of linking up with dive businesses in East Lothian and Northumberland to host a major watersports festival. Further development of diving off the Berwickshire coast forms part of a wider Adventure Sports strategy, being developed by SE Borders and its partners. By focusing on activities which capitalise on the natural assets of the Borders, SE Borders hopes to develop a strategy to help position the Borders as one of the UK's main locations for outdoor leisure activities such as equestrianism, mountain biking and diving, which will attract more overseas visitors as well as those from across the UK. .
Socio-economic Baseline Reviews for Offshore Renewables in Scottish Waters
R4032/3 279 R.1905
9. References ABPmer and RPA, 2011. A Socio-economic Methodology and Baseline for Pentland Firth and Orkney Waters Round 1 Wave and Tidal Developments. Report for The Crown Estate. Report R.1826. ABPmer and RPA, 2012. Socio-economic Baseline Review Methodology and Data Gap Analysis for Offshore Renewables in Scottish Waters. ABPmer Report No. R1904 ABPmer, RPA & SQW, 2011. Economic Assessment of Short Term Options for Offshore Wind Energy in Scottish Territorial Waters. ABPmer Report No. R1743, March 2011 Allan, G., McGregor, P.G., Swales, J.K. and Turner, K., 2006. Impact of alternative energy generation technologies on the Scottish economy: an illustrative input-output analysis, Proceedings of the Institution of Mechanical Engineers, Vol. 221 Part A: J. Power and Energy, pp243-254. Bank of Scotland (2011): Scotland has the UK‟s Most Affordable Housing, Press Release, 27 August 2011. Bank of Scotland (2011a): Scotland‟s Youngest House Buyers are in Midlothian, Press Release, 8 October 2011. Baxter, J.M., Boyd, I.L., Cox, M., Donald, A.E., Malcolm, S.J., Miles, H., Miller, B., Moffat, C.F., (Editors), 2011. Scotland's Marine Atlas: Information for the national marine plan. Marine Scotland, Edinburgh. Benfield, S and McConnell, S (2007): Marine and Coastal Visitor Management, Public Engagement and Interpretation in Argyll and the Islands: the way forward. Marine and Coastal Development Unit, Argyll & Bute Council, 2007, pp1-145. Black, K., 2011. Macroalgae for energy: What‟s going on in Scotland and Chile? Presentation to The Crown Estate, 31 March 2011. BMF, MCA, RYA and Lifeboats 2009. Water sports and Leisure Participation Survey 2009. Available online: http://www.britishmarine.co.uk/upload_pub/WatersportsandLeisureOmnibus2009finalpublic.pdf BMF, 2010. UK Leisure and Small Commercial Marine Industry Key Performance Indicators 2009/10. Available online: http://www.britishmarine.co.uk/upload_pub/KPIReport2010.pdf British Ports Association (BPA), 2008. „Scottish Ports Committee Ports In Scotland “Delivering Value”. Brown A., 2009. 2008 Survey of the UK Seafood Processing Industry. Published by Seafish. 104pp
Socio-economic Baseline Reviews for Offshore Renewables in Scottish Waters
R4032/3 280 R.1905
Brown, K.M., Curry, N., Dilley, R., Taylor, K. & Clark, M., 2010. Assessing future recreation demand. Scottish Natural Heritage Commissioned Report No.404. Bryden, JM (2007): Sustainable rural communities in crofting areas, a think-piece for the crofting inquiry, Committee of Inquiry on Crofting, May 2007, pp1-11. Bryden, D.M., Westbrook, S.R., Burns, B., Taylor, W.A., and Anderson, S. 2010. Assessing the economic impacts of nature based tourism in Scotland Scottish Natural Heritage Commissioned Report No. 398. Bullen, C., Johnson, K., Kerr, S. and Side, J., 2011. Tidal technology development and deployment in the UK: Tidal technologies: Key issues across planning and development for environmental regulators, Background Report on Task 1 of Sniffer ER20: Overview of political and economic context, and future projections for the size of the industry in the UK. Report prepared by ICIT, Heriot-Watt University. Civil Aviation Authority website: www.caa.co.uk Commission of the European Communities, 2009. Building a sustainable future for aquaculture: A new impetus for the Strategy for the Sustainable Development of European Aquaculture Cornwall Enterprise, 2001. Assessment of the Potential Contribution of Marinas & Water sports to Increasing Prosperity in Cornwall. DECC, 2011. Digest of UK Energy Statistics (DUKES), available from DECC Internet site (http://www.decc.gov.uk/en/content/cms/statistics/publications/dukes/dukes.aspx). Defence Estates Safeguarding, 2010. Defence Estates Safeguarding letter: D/DE/43/27 in response to Draft SEA for Offshore Wind dated 16 August 2010. Defra, 2004. Research into the Economic contribution of Sea Angling. Drew Associates. 71pp Defra, 2008. The United Kingdom operational program for the European Fisheries Fund (2007-2013). Department for Transport (DfT), 2002. The future development of air transport in the UK: Scotland: a national consultation. Department for Transport (DfT) 2007. Ports Policy Review Interim Report, 19 July 2007. Available from: www.dft.gov.uk/pgr/shippingports/ports/portspolicyreview/portspolicyreviewinterimreport Department for Transport (DfT) 2009. Draft National Policy Statement for Ports, 9 November 2009. Available from: http://webarchive.nationalarchives.gov.uk/+/http://www.dft.gov.uk/ consultations/closed/portsnps/consultation.pdf
Socio-economic Baseline Reviews for Offshore Renewables in Scottish Waters
R4032/3 281 R.1905
Department for Transport (DfT), 2010. Marine Transportation Statistics. Accessed 07 Nov 2011 : http://www.dft.gov.uk/statistics/series/ports/ Department for Transport (DfT), 2011. UK Aviation Forecasts. August 2011. Available online: http://www.dft.gov.uk/publications/uk-aviation-forecasts-2011 Edinburgh Airport, 2011. Edinburgh Airport Masterplan. July 2011. Available online: http://www.edinburghairport.com/assets/Internet/Edinburgh/Edinburgh%20downloads/PDFs/EdAir_masterplan_final.pdf EKOS Limited, 2008. „Firth of Clyde Socio Economic Review‟. February 2008 Electricity Networks Strategy Group, 2009. Our Electricity Transmission Network: A vision for 2020. A report by the Electricity Networks Strategy Group, March 2009. ERM, 2010. Beatrice Offshore Wind farm Ltd: Environmental Scoping Report. 12 March 2010. Event Scotland, 2010. Event Scotland News: Issue 23. http://www.eventscotland.org/funding-and-resources/downloads/get/40 FAO, 2010. The state of world fisheries and aquaculture. Fiona, A & Mackenzie, D (2007): The contribution of crofting in the 21st century, Comity of Inquiry on Crofting, article downloaded from Internet site: (http://www.google.co.uk/search?q=fiona+mackenzie+crofting&ie=utf-8&oe=utf-8&aq=t&rls=org.mozilla:en-GB:official&client=firefox-a). General Lighthouse Authorities (GLA), 2010. „The United Kingdom and Ireland - Marine Aids to Navigation Strategy - 2025 & beyond‟ George Street Research (2007): Survey of rural development and crofting, Final Report Area Pen Pictures, George Street Research, Committee of Inquiry on Crofting, 2007, pp1-18. Glasgow Airport, 2011. Our Vision: Glasgow Airport Draft Master Plan 2011. Available online: http://www.glasgowairport.com/assets/Internet/Glasgow/Glasgow%20downloads/Static_files/GLA_masterplan_2011_report.pdf Glasgow Prestwick Airport, 2008. Draft Master Plan. Available online: http://www.glasgowprestwick.com/userfiles/files/MasterPlan.pdf Gray J., 2009 http://www.trout-salmon-fishing.com/salmon-wheretofish-scotland.htm HI Energy, 2011. „Report proposes way forward for the Cromarty Firth‟ October 2010. Accessed: 25 Nov 2011. http://www.hi-energy.org.uk/Default.aspx.LocID-00tnew06y.RefLocID-00t007008.Lang-EN.htm
Socio-economic Baseline Reviews for Offshore Renewables in Scottish Waters
R4032/3 282 R.1905
Highlands and Islands Airports (HIAL), 2007. Inverness Airport Master Plan. July 2007. Available online: http://www.hial.co.uk/assets/_files/documents/apr_10/hia__1271761595_HIA_Inverness_Airport_MP_Aug_2.pdf Highlands and Islands Enterprise, 2007. Assessment of the Grid Connection Options for the Scottish Islands. Report produced by TNEI Services Ltd for the Highlands and Islands Enterprise, March 2007. Hilliam, D (2007): Survey of rural development and crofting, George Street Research, Committee of Inquiry on Crofting, November 2007, Paper 7.1, pp1-72. House of Commons (2010): Regional House Prices: Affordability and Income Ratios, Standard Note SN/SG/1922, 31 December 2010. IFAW (2009): Whale watching worldwide, tourism numbers, expenditures and expanding economic benefits, a report from the International Fund for Animal Welfare, pp1-239. IPA Energy + Water Economics and Scottish Renewables, 2010. Scottish Offshore Wind: Creating an Industry to Scottish Renewables, Final report, 4th August 2010, available from the Scottish Renewables Internet site (http://www.scottishrenewables.com/publications/scottish-offshore-wind-creating-industry/). IronsideFarrar, 2011. South Montrose „Draft Development Masterplan‟. July 2011. Accessed: 25 Nov 2011: http://www.angus.gov.uk/new/releases-archive/2011/SouthMontroseDraft DevelopmentMasterplan.pdf Jack Jackson, 2008. Top Dive Sites of the World. New Holland Publishers. Joint Marine Programme (2004): The tangle of the Clyde, why we must reform the management of Scotland‟s marine environment, WWF and Scottish Wildlife Trust, April 2004, pp 1-16. Kelly and Dworjanyn, 2008. The potential of marine biomass for anaerobic biogas production, The Crown Estate Kraan, S., 2011. Mass-cultivation of carbohydrate rich macroalgae, a possible solution for sustainable biofuel production. Mitigation and Adaptation Strategies for Global Change. DOI 10.1007/s11027-010-9275-5 Lambert, E., MacLeod, C.D., Hunter, C. and Pierce, G.J., 2011. The Future of Cetacean Watching in Scotland under Different Climate Change Scenarios – The Changing Nature of Scotland, eds. S.J. Marrs, S. Foster, C. Hendrie, E.C. Mackey, D.B.A. Thompson. TSO Scotland, Edinburgh. Land Use Consultants, 2007. A Review of Marine and Coastal Recreation in Scotland. Report No. F05AA608.
Socio-economic Baseline Reviews for Offshore Renewables in Scottish Waters
R4032/3 283 R.1905
Lazarow, N., 2008. Journal of Coastal Research SI 50 12 - 20 ICS2007 (Proceedings) Australia The value of coastal recreational resources: a case study approach to examine the value of recreational surfing to specific locales. ISSN 0749.0208. Lazarow, N. 2009. Using observed market expenditure to estimate the value of recreational surfing to the Gold Coast, Australia. Journal of Coastal Research, SI 56 (Proceedings of the 10th International Coastal Symposium), 1130-1134. Liptrott, S. 2011. Annan‟s seafood factories could provide seasonal jobs boost. Dumfries & Galloway Standard, 9 September {online]. Available at http://www.dgstandard.co.uk/dumfries-news/local-news-dumfries/local-news-dumfriesshire/2011/09/09/annan-s-seafood-factories-could-provide-seasonal-jobs-boost-51311-29388724/ Mainstream Renewable Power, 2009. Neart na Gaoithe Proposed Offshore Wind Farm: Scoping Report November 2009. Marine Management Organisation (MMO), 2011. UK Sea Fisheries Statistics 2010. 158pp Marine Scotland, 2009. Scottish Fish Farms Annual Production Survey, 2009. Marine Scotland, 2010a. Scottish Shellfish Farm Production Survey, 2010. Marine Scotland, 2010b. Blue Seas – Green Energy, A Sectoral Marine Plan for Offshore Wind Energy in Scottish Territorial Waters, Part A The Plan, available from the Scottish Government Internet site (http://scotland.gov.uk/Publications/2011/03/18141232/8). Marine Scotland, 2010c. Offshore Wind Energy in Scottish Territorial Waters Draft Plan and Strategic Environmental Assessment Analysis of Consultation Responses. Report for the Scottish Government, December 2010. ISBN: 978-0-7559-9900-2. Available online: http://www.scotland.gov.uk/Resource/Doc/336236/0110013.pdf Marine Scotland, 2011a. Data supplied by Marine Scotland as considered confidential. Marine Scotland, 2011b. Pentland Firth and Orkney Waters, Marine Spatial Plan Framework & Regional Locational Guidance for Marine Energy. Marine Scotland. March 2011. Marine Scotland, 2011c. Sea Trout Fishery Statistics – 2010 Season. Topic Sheet No. 69 v2. 4pp Marine Scotland, 2011d. Scottish Sea Fisheries Statistics 2010. Published by Marine Scotland, The Scottish Government, September 2011 DPPAS11957 (08/11). 92pp Marine Scotland, 2011e. http://www.scotland.gov.uk/Topics/marine/science/Publications/stats/SalmonSeaTroutCatches/SalmonSeaTrout2011
Socio-economic Baseline Reviews for Offshore Renewables in Scottish Waters
R4032/3 284 R.1905
MCCIP, 2008. Marine climate change impacts. Annual Report Card 2007–2008 MDS Transmodal, 2007. Update of 2006 forecasts and transhipment study (incorporating 2005 base year outturn data and taking account of the energy forecasts underlying the White Paper: Meeting the Energy Challenge). Published in the Department for Transport (DfT) 2007, „Ports Policy Review Interim Report‟. Cimarron, Price and McVittie (2006): A review of the benefits and opportunities attributed to Scotland‟s landscapes of wild character: Scottish National Heritage Commissioned Report No. 194 (ROAME No. F04NC18 MEDIN, 2011. MEDIN Data Guideline for the Leisure and Recreation Sector. MMO, 2012 http://www.marinemanagement.org.uk//fisheries/statistics/annual.htm). MOD, 2011a. TSP 10 - UK Regular Forces Stationed Location. Edition 01 July 2011. Released 11 August 2011. Available online: http://www.dasa.mod.uk/applications/newWeb/www/index.php?page=48&pubType=0&thiscontent=100&PublishTime=09:30:00&date=2011-08-11&disText=01July2011&from=listing &topDate=2011-08-11 MOD, 2011b. United Kingdom Defence Statistics, 2011. Published 28 September 2011. Available online: http://www.dasa.mod.uk/modintranet/UKDS/UKDS2011/ukds.php National Grid, SP Transmission and SSE Power Distribution, 2004. Interim Great Britain Severn Year Statement, November 2004, available from the National Grid Internet site (www.nationalgrid.com). NFO System Three Social Research and MORI (2002): Tourism Attitudes Survey, Report number P736, Prepared for VisitScotland and Scottish Natural Heritage, 2001, pp1-209. Office for National Statistics (ONS), 2011. Business Register and Employment Survey (2008 to 2010). Available at: http://www.nomisweb.co.uk/ Accessed: 17/11/11 Offshore Wind Industry Group (OWIG), 2010. Scotland‟s Offshore Wind Route Map, Developing Scotland‟s Offshore Wind Industry to 2020, available from the Scottish Government Internet site (http://www.scotland.gov.uk/Publications/2010/09/28115850/0). Oil and Gas UK, 2010. Economic report 2010. Oil and Gas UK, 2011. Economic report 2011. Oil Voice, 2011. „Aberdeen Harbour Announces Contractor For Torry Quay Development‟, March 2010 Accessed: 25 Nov 2011 http://www.oilvoice.com/n/Aberdeen_Harbour_Announces_Contractor_For_Torry_Quay_ Development/edfa7abe9.aspx
Socio-economic Baseline Reviews for Offshore Renewables in Scottish Waters
R4032/3 285 R.1905
ONS, 2009. UK Standard Industrial Classification of Economic Activities 2007 (SIC 2007): Structure and explanatory notes. ISBN 978-0-230-21012-7. Available online: http://www.ons.gov.uk/ons/guide-method/classifications/current-standard-classifications/standard-industrial-classification/index.html Orkney Marinas, 2011. Website: http://www.orkneymarinas.co.uk/ Accessed 15 July 2011. Oxford Economics, 2011. The economic impact of the UK Ports Industry. May 2011 Public Interest Research Centre on behalf of The Offshore Valuation Group, 2010. The Offshore Valuation, A valuation of the UK‟s offshore renewable energy resource. Report available from the Offshore Valuation Group Internet site (http://www.offshorevaluation.org/). Pugh, D. 2008. Socio-economic indicators of marine-related activities in the UK economy. The Crown Estate. Pure Marine Gen Ltd, 2011. Information and analysis of wave & tidal market in Scotland, Report commissioned by Invest NI and available from the Invest Northern Ireland Internet site (http://www.investni.com/). Radford, A., Riddington, G. and Gibson, H., 2009. Economic Impact of Recreational Sea Angling in Scotland. Prepared for the Scottish Government. July 2009. ISBN: 978-0-7559-8130-4 Reid, D. 2010. The Orkney crab industry. The Larder, 17 September 2010 (updated 23 March 2011) {online]. Available at http://www.list.co.uk/article/29527-the-orkney-crab-industry/ Robertson, G. 2009. Wind-Hydrogen Community on the Isle of Lewis. Thesis submitted in partial fulfilment for the requirement of degree in Master of Science in Energy Systems and the Environment, University of Strathclyde, September 2009. RPA & Cambridge Econometrics, 2008. The Economic Impact of Scotland‟s Natural Environment. Scottish Natural Heritage Commissioned Report No.304 (ROAME No. R07AA106). RR Donnelly (2008): Committee of inquiry on crofting, Final Report, Committee of Inquiry on Crofting, 2008, pp1-90. RYA, 2009. The RYA‟s Position on Offshore Energy Developments, December 2009. RYA, 2005. UK Coastal Atlas of Recreational Boating. Sail Scotland, 2011. http://www.sailscotland.co.uk Saunders, J., Tinch, R., Ozdemiroglu, E. & Hull, S., 2011. Valuing the Marine Estate and UK Seas: Dynamic Baseline Assessment (draft). Marine Estate Research Report for The Crown Estate.

Socio-economic Baseline Reviews for Offshore Renewables in Scottish Waters
R4032/3 286 R.1905
Scottish Centre for Carbon Storage (SCCS), 2009. Opportunities for CO2 storage around Scotland: An integrated strategic research study. Report for the Scottish Government. April, 2009. Scottish Centre for Carbon Storage (SCCS), 2011. Progressing Scotland‟s CO2 storage opportunities. Report for the Scottish Government. March, 2011. Scottish Council for Development & Industry, 2008. The future of electricity generation in Scotland. Report produced 9th December 2008 by Wood Mackenzie, available from the Scottish Council for Development & Industry Internet site (www.scdi.org.uk). Scottish Development International, Highlands and Islands Enterprise, and Scottish Enterprise, 2011. Scottish Offshore Renewables Development Sites, West Coast Cluster, available from the Scottish Development International Internet site (www.sdi.co.uk). Scottish Enterprise & Highlands & Islands Enterprise, 2010a. National Renewables Infrastructure Plan. February 2010. Scottish Enterprise & Highlands & Islands Enterprise, 2010b. National Renewables Infrastructure Plan Stage 2. July 2010. Scottish Enterprise, 2010. „Sailing Tourism In Scotland‟ February 2010 Scottish Enterprise Borders, 2008. Diving on the East Coast of the Scottish Borders, Scottish Enterprise Borders, Tourism Resources Company & EKOS Ltd., May 2008. Scottish Enterprise, 2006. Sailing in the Clyde Estuary: the potential for future development. A market assessment, economic impact study and action plan. Scottish Environmental Statistics Online (http://scotland.gov.uk/Topics/Statistics/Browse/Environment/seso). Scottish Executive, 2005. Scotland‟s Renewable Energy Potential: realising the 2020 target, Future Generation Group Report 2005, available from the Scottish Government Internet site (www.scotland.gov.uk/Resource/Doc/54357/0013233.pdf). Scottish Executive, 2006a. Scottish Tourism: the next decade. A tourism framework for change, Report published by the Scottish Executive, March 2006. Scottish Executive, 2006b. „Scotland‟s National Transport Policy‟. December 2006 Accessed: 15 November 2011. http://www.scotland.gov.uk/Resource/Doc/157751/0042649.pdf Scottish Executive, 2007. Scottish Marine Renewables SEA Scottish Government & COSLA (2009): Scottish community empowerment action plan, Scottish Government, 2009, pp1-65.
Socio-economic Baseline Reviews for Offshore Renewables in Scottish Waters
R4032/3 287 R.1905
Scottish Government and Scottish Enterprise, 2010. Carbon Capture and Storage – A Roadmap for Scotland. March 2010. Scottish Government, 2002. Scottish Economic Report, June 2002. Chapter 4: Selected Economic Issues – A. The Regional Employment of Contribution of the Fisheries Sector to the Scottish Economy. Report no. SE/2002/110. 95pp Scottish Government, 2009a. Scottish Transport Statistics. A National Statistics Publication for Scotland. No. 28, 2009 Edition. Scottish Government, 2009b. National Planning Framework for Scotland 2. Scottish Government (2009c): Scottish Index of Multiple Deprivation 2009: General Report, October 2009. Scottish Government, 2010a. Delivering Planning Reform for Aquaculture Scottish Government, 2010b. Scottish Transport Statistics. A national Statistics Publication for Scotland. No. 29, 2010 Edition. Scottish Government, 2010c. Energy in Scotland: A Compendium of Scottish Energy Statistics and Information, Report produced December 2010. Scottish Government, 2010d. Draft Electricity Generation Policy Statement 2010: Scotland – A Low Carbon Society, Report published by the Scottish Government, November 2010. Scottish Government (2010e): Governmental report to parliament: economic condition of crofting 2007-2010, Scottish Government, Report No. 1, December 2010, pp1-34. Scottish Government (2010f): The economic impact of wildlife tourism in Scotland, Scottish Government Social Research, pp1-51. Scottish Government, 2011a. 2020 Routemap for Renewable Energy in Scotland, available electronically on the Scottish Government Internet site (http://www.scotland.gov.uk/Publications/2011/08/04110353/0). Scottish Government, 2011b. Salmon Fishery Statistics – 2010 Season. Topic Sheet No. 68 v2. 4pp Scottish Government 2011c: The Scottish Heath Survey, Volume 1: Main Report, Scottish National Statistics, 2011, pp1-261. Scottish Government 2011d: Summary statistics for schools in Scotland, Statistical Bulletin Educational Series, Scottish National Statistics, No. 2, December 2011, pp1-27.
Socio-economic Baseline Reviews for Offshore Renewables in Scottish Waters
R4032/3 288 R.1905
Scottish Government, 2010e. Scottish House Condition Survey, Key Findings for 2009, report published 25 November 2010. Scottish Government, 2011f. Poverty and Income Inequality in Scotland: 2009-10, National Statistics Publication for Scotland, 12 May 2011. Scottish Government 2012: Scotland beats 2011 green energy target 29/03/2012 – Internet site: http://www.scotland.gov.uk/News/Releases/2012/03/geenenergytargets29032012 Scottish Government, SEPA, Highlands and Islands Enterprise, and Scottish Enterprise, 2010. A Low Carbon Economic Strategy for Scotland, Scotland – A Low Carbon Society, Report available from the Scottish Government Internet site (www.scotland.gov.uk/Resource/Doc/331364/0107855.pdf). Scottish Neighbourhood Statistics (http://www.sns.gov.uk/). ScottishPower Renewables, 2010. Proposed Argyll Array Offshore Windfarm: request for a Scoping Opinion, August 2010. Scottish Sea Angling Conservation Network, 2008.Scottish Sea Angling Conservation Network: Best Value Fisheries Management Scottish Sea Angling Conservation Network, 2010a. Solway Firth Partnership Conference February 2010 Scottish Sea Angling Conservation Network, 2010b.Spurdog Tagathon 2010. Scrabster Harbour Trust, 2008. Information Pack, presentation downloaded from http://www.scrabster.co.uk/files/downloads/download620.pdf SeaEnergy Renewables, 2010. Inch Cape Offshore Wind Farm: offshore wind turbines, inter-array cabling and associated offshore infrastructure. Environmental Impact Assessment, Scoping Report. August 2010. SIMA, 2009. 2008 SIMA Retail Distribution Study Speedie, C.D., Johnson, L. A., Witt, M.J., 2009. Basking Shark Hotspots on the West Coast of Scotland: Key sites, threats and implications for conservation of the species. Commissioned Report No.339. Sport Industry Research Centre, 2008. What Paths do for Scottish Society: An Economic and Social Impact Study, Scottish Natural Heritage Commissioned Report No. 280 (ROAME No. RO6AA607). SportScotland (2008): Sports Participation in Scotland 2008, Research Digest No. 110.
Socio-economic Baseline Reviews for Offshore Renewables in Scottish Waters
R4032/3 289 R.1905
SQW Consulting, 2008. Economic Impact of Glasgow Prestwick Airport. Final Report to Glasgow Prestwick Airport, South Ayrshire Council and Scottish Enterprise. February 2008. SSE Renewables, 2010. Islay Offshore Wind Farm: Scoping Documents, March 2010. Surfers Against Sewage (SAS), 2009. Guidance on environmental impact assessment of offshore renewable energy development on surfing resources and recreation. Surfers Against Sewage (SAS), 2010. The WAR Report: Waves Are Resources. Available online: http://www.sas.org.uk/news/2010/08/04/sas-release-the-war-report-waves-are-resources/ Taylor, W.A., Bryden, D.B., Westbrook, S.R., and Anderson, S., 2010. Nature Based Tourism in the Outer Hebrides. Scottish Natural Heritage Commissioned Report No. 353 (Tender 29007). The David Hume Institute, 2003. Central Scotland Airport Study. The Orkney Hyperbaric Trust, 2008. Proposal for the purchase and installation of a second chamber for the Orkney Hyperbaric Unit. The Parliamentary Office of Science and Technology, 2011. Biofuels from Algae. POSTNOTE 384. Thomson D., 2001. Hebrides and West Coast of Scotland: The social and cultural importance of the coastal fishing communities and their contribution to food security. In Understanding the Cultures of Fishing Communities: A Key to Fisheries Management and Food Security. FAO Fisheries Technical Paper 401. 287pp TNS Research International, 2011. Scottish Recreation Survey: annual summary report 2010. Scottish Natural Heritage Commissioned Report No.465. TNS Research International, 2010. Scottish Recreation Survey: annual summary report 2009. Scottish Natural Heritage Commissioned Report No.395. Tourism Resources Company et al, 2010. Sailing Tourism in Scotland, report for Scottish Executive, February 2010. TTC International & Roger Tym & Partners, 2006. Scottish Cruise Tourism Study, report for VisitScotland and Scottish Enterprise (Executive Summary only). United Kingdom Marine Monitoring and Assessment Strategy (UKMMAS), 2010. Charting Progress 2 Feeder Report Productive Seas. Department for Environment Food and Rural Affairs on behalf of UKMMAS (Eds. Saunders, J. and McKie, J.) 472pp Available online: http://chartingprogress.defra.gov.uk/
Socio-economic Baseline Reviews for Offshore Renewables in Scottish Waters
R4032/3 290 R.1905
Verso Economics, 2011. Worth the Candle? The Economic Impact of Renewable Energy Policy in Scotland and the UK, March 2011, available from the Verso Economics Internet site (www.versoeconomics.com). VisitScotland, 2011. Domestic Tourism – Review of Domestic Overnight Tourism to Scotland in 2010. VisitScotland, 2010. International Tourism – Review of International Overnight Tourism to Scotland in 2010. Visit Orkney, 2009. Get Active in Orkney Report. Warburton, C (1999): Marine wildlife tourism and whale-watching on the Island of Mull, West Scotland, MSc Thesis, University of Kent, September 1999, pp1-101. Wilding, T.A., Kelly, M.S. and Black, K.D. 2006. Alternative marine sources of protein and oil for aquaculture feeds: state of the art and recommendations for further research. The Crown Estate, 63 pages. York Aviation, 2009. The Economic Impact of Edinburgh Airport. Final report for Scottish Enterprise and BAA Edinburgh, August 2009. Available online: http://www.scotlandsglobalhub.com/media/downloads/edinburgh-airport-economic-impact-2009.pdf York Aviation, 2010. The Economic Impact of Aberdeen Airport: Executive Summary. Report for BAA Aberdeen, July 2010. Available online: http://www.aberdeenairport.com/static/Aberdeen/Downloads/PDF/Economic_Impact_of_Aberdeen_Airport.pdf
Figures
(Separate Volume 2)
Figures
Socio-economic Baseline Reviews for Offshore Renewables in Scottish Waters
R4032/3 i R.1905
Figures
1. Scottish Offshore Renewable Energy Regions 2. Aquaculture Sites within SORERs 3. Airports within SORERs 4. Carbon Dioxide Storage Potential within SORERs 5. Coastal Flood Defence since 1961 within SORERs 6. Annual Average Value (2001 to 2010) of Inshore and Offshore Landings within SORERs 7. Annual Average Fishing Value for All VMS Gear Types 8. Total Landings Value in all SORERs into the UK or by UK Vessels Landing Abroad by Selected
Species (2001 - 2010) 9. Total Landings Value in all SORERs into the UK or by UK Vessels Landing Abroad by Vessel
Length (2001 - 2010) 10. Total Landings into the UK or by UK Vessels Landing Abroad for Each SORER (2001 - 2010) 11. Surveillance Sightings by Nationality within SORERs 12. Surveillance Sightings by Gear Type within SORERs 13. Coastal Salmon & Sea Trout Fishing and Fishing Ports within SORERs 14. Renewable Energy within SORERs 15. Coastal Military Locations and Military Practice Areas within SORERs 16. Oil and Gas within SORERs 17. Port Locations within SORERs 18a. Interconnector Cables within SORERs 18b. Potential Future Interconnector Cables within SORERs 19. RYA Marinas, Sailing Clubs, Training Centres and Cruising Routes within SORERs 20. Shipping within SORERs 21. Ferry Routes within SORERs 22. Distribution of Businesses by Industry within SORERs 23. Average House Prices Across SORERs 24. Telecommunication Cables within SORERs 25. Key Tourist Sites within SORERs 26. Coastal Awards within SORERs 27. Coastal and Maritime Cultural Heritage Assets within SORERs 28. Distribution of Employment for Tourism Sectors within SORERs 29. Waste Disposal Grounds within SORERs 30. Surfing and Wind Surfing Locations within SORERs 31. Popularity of Canoeing and Kayaking for each SNH Seascape Unit within SORERs 32. Popular Dive Sites within SORERs 33. Dinghy Sailing Clubs within SORERs 34. Aquaculture Sites within SORER South West 35. Annual Average Value (2010 to 2010) of Landings by Fish Group within SORER South West 36. Annual Average Value (2001 to 2010) of Landings by Vessel Length within SORER South
West 37. Annual Average Value (2001 to 2010) of Landings by Fish Species within SORER South West 38. Annual Average Value (2001 to (2010) of Landings by Gear Type within SORER South West 39. Landings Value by Gear Type from 2001 to 2010 within SORER South West 40. Landings Value by Vessel Length from 2001 to 2010 within SORER South West

Socio-economic Baseline Reviews for Offshore Renewables in Scottish Waters
R4032/3 ii R.1905
41. Landings Value by Fish Species from 2001 to 2010 within SORER South West 42. Surveillance Sightings by Nationality within SORER South West 43. Surveillance Sightings by Gear Type within SORER South West 44. Coastal Salmon & Sea Trout Fishing Locations and Fishing Ports within SORER South West 45. Renewable Energy within SORER South West 46. Coastal Military Locations and Military Practice Areas within SORER South West 47. Oil and Gas within SORER South West 48. Port Locations within SORER South West 49. Interconnector Cables within SORER South West 50. RYA Marinas, Sailing Clubs, Training Centres and Cruising Routes within SORER South West 51. Ferry Routes within SORER South West 52. Average House Prices Across SORERs South West and East 53. Telecommunication Cables within SORER South West 54. Key Tourist Sites within SORER South West 55. Coastal and Maritime Cultural Heritage Assets within SORER South West 56. Coastal Awards within SORER South West 57. Waste Disposal Grounds within SORER South West 58. Dive Sites within SORER South West 59. Dinghy Sailing Clubs within SORER South West 60. Canoe and Kayaking Trips within SORER South West 61. Aquaculture Sites within SORER West 62. Coastal Flood Defence since 1961 within SORER West 63. Annual Average Value (2001 to 2010) of Landings by Fish Group within SORER West 64. Annual Average Value (2001 to 2010) of Landings by Vessel Length within SORER West 65. Annual Average Value (2001 to 2010) of Landings by Fish Species within SORER West 66. Annual Average Value (2001 to 2010) of Landings by Gear Type within SORER West 67. Landings Value by Gear Type from 2001 to 2010 within SORER West 68. Landings Value by Vessel Length from 2001 to 2010 within SORER West 69. Landings Value by Fish Species from 2001 to 2010 within SORER West 70. Surveillance Sightings by Nationality within SORER West 71. Surveillance Sightings by Gear Type within SORER West 72. Coastal Salmon & Sea Trout Fishing Locations and Port Locations within SORER West 73. Renewable Energy within SORER West 74. Coastal Military Locations and Military Practice Areas within SORER West 75. Oil and Gas within SORER West 76. Port Locations within SORER West 77. Interconnector Cables within SORER West 78. RYA Marinas, Sailing Clubs, Training Centres and Cruising Routes within SORER West 79. Ferry Routes within SORER West 80. Average House Prices Across SORERs North East and West 81. Telecommunication Cables within SORER West 82. Key Tourist Sites within SORER West 83. Coastal and Maritime Cultural Heritage Assets within SORER West 84. Coastal Awards within SORER West 85. Waste Disposal Grounds within SORER West

Socio-economic Baseline Reviews for Offshore Renewables in Scottish Waters
R4032/3 iii R.1905
86. Surfing and Wind Surfing Locations within SORER West 87. Dive Sites within SORER West 88. Dinghy Sailing within SORER West 89. Popularity of Canoeing and Kayaking for each Seascape Unit within SORER West 90. Aquaculture Sites within SORER North West 91. Coastal Flood Defence since 1961 within SORER North West 92. Annual Average Value (2001 to 2010) of Landings by Fish Group within SORER North West 93. Annual Average Value (2001 to 2010) of Landings by Gear Type within SORER North West 94. Annual Average Value (2001 to 2010) of Landings by Fish Species within SORER North West 95. Annual Average Value (2001 to 2010) of Landings by Gear Type within SORER North West 96. Landings Value by Gear Type from 2001 to 2010 within SORER North West 97. Landings Value by Vessel Length from 2001 to 2010 within SORER North West 98. Landings Value by Species from 2001 to 2010 within SORER North West 99. Surveillance Sightings by Nationality within SORER North West 100. Surveillance Sightings by Gear Type within SORER North West 101. Coastal Salmon & Sea Trout Fishing Locations and Fishing Ports within SORER North West 102. Renewable Energy within SORER North West 103. Coastal Military Locations and Military Practice Areas within SORER North West 104. Oil and Gas within SORER North West 105. Port Locations within SORER North West 106. Interconnector Cables within SORER North West 107. RYA Marinas, Sailing Clubs, Training Centres and Cruising Routes within SORER North West 108. Ferry Routes within SORER North West 109. Average House Prices Across SORERs North and North West 110. Telecommunication Cables within SORER North West 111. Key Tourist Sites within SORER North West 112. Coastal and Maritime Cultural Heritage Assets within SORER North West 113. Coastal Awards within SORER North West 114. Waste Disposal grounds within SORER North West 115. Surfing and Wind Surfing Locations within SORER North West 116. Dive Sites within SORER North West 117. Dinghy Sailing Clubs within SORER North West 118. Popularity of Canoeing and Kayaking for each SNH Seascape Unit within SORER North West 119. Aquaculture Sites within SORER North 120. Carbon Dioxide Storage Potential within SORER North 121. Annual Average Value (2001 to 2010) of Landings by Fish Group within SORER North 122. Annual Average Value (2001 to 2010) of Landings by Vessels Length within SORER North 123. Annual Average Value (2001 to 2010) of Landings by Fish Species within SORER North 124. Annual Average Value (2001 to 2010) of Landings by Gear Type within SORER North 125. Landings Value by Gear Type from 2001 to 2010 within SORER North 126. Landings Value by Vessel Length from 2001 to 2010 within SORER North 127. Landings Value by Species from 2001 to 2010 within SORER North 128. Surveillance Sightings by Nationality within SORER North 129. Surveillance Sightings by Gear Type within SORER North 130. Coastal Salmon & Sea Trout Fishing Locations and Fishing Ports within SORER North

Socio-economic Baseline Reviews for Offshore Renewables in Scottish Waters
R4032/3 iv R.1905
131. Renewable Energy within SORER North 132. Coastal Military Locations and Military Practice Areas within SORER North 133. Oil and Gas within SORER North 134. Port Locations within SORER North 135. Interconnector Cables within SORER North 136. RYA Marinas, Sailing Clubs, Training Centres and Cruising Routes within SORER North 137. Ferry Routes within SORER North 138. Telecommunication Cables within SORER North 139. Key Tourist Sites within SORER North 140. Coastal and Maritime Cultural Heritage Assets within SORER North 141. Coastal Awards within SORER North 142. Waste Disposal Grounds within SORER North 143. Surfing and Wind Surfing Locations within SORER North 144. Dive Sites within SORER North 145. Dinghy Sailing Clubs within SORER North 146. Popularity of Canoeing and Kayaking for each SNH Seascape Unit within SORER North 147. Aquaculture Sites within SORER North East 148. Carbon Dioxide Storage Potential within SORER North East 149. Coastal Flood Defence Schemes since 1961 within SORER North East 150. Annual Average Value (2001 to 2010) of Landings by Fish Group within SORER North East 151. Annual Average Value (2001 to 2010) of Landings by Fish Species within SORER North East 152. Annual Average Value (2001 to 2010) of Landings by Vessel Length within SORER North East 153. Annual Average Value (2001 to 2010) of Landings by Gear Type within SORER North East 154. Landings Value by Gear Type from 2001 to 2010 within SORER North East 155. Landings Value by Vessel Length from 2001 to 2010 within SORER North East 156. Landings Value by Species from 2001 to 2010 within SORER North East 157. Surveillance Sightings by Nationality within SORER North East 158. Surveillance Sightings by Gear Type within SORER North East 159. Coastal Salmon & Sea Trout Fishing Locations and Fishing Ports within SORER North East 160. Renewable Energy within SORER North East 161. Coastal Military Locations and Military Practice Areas within SORER North East 162. Oil and Gas within SORER North East 163. Port Locations within SORER North East 164. Interconnector Cables within SORER North East 165. RYA Marinas, Sailing Clubs, Training Centres and Cruising Routes within SORER North East 166. Ferry Routes within SORER North East 167. Telecommunication Cables within SORER North East 168. Key Tourist Sites within SORER North East 169. Coastal and Maritime Cultural Heritage Assets within SORER North East 170. Coastal Awards within SORER North East 171. Waste Disposal Grounds within SORER North East 172. Surfing and Wind Surfing Locations within SORER North East 173. Dive Sites within SORER North East 174. Dinghy Sailing Clubs within SORER North East 175. Popularity of Canoeing and Kayaking for each SNH Seascape Unit within SORER North East

Socio-economic Baseline Reviews for Offshore Renewables in Scottish Waters
R4032/3 v R.1905
176. Coastal Flood Defence Schemes since 1961 within SORER East 177. Annual Average Value (2001 to 2010) of Landings by Fish Group within SORER North 178. Annual Average Value (2001 to 2010) of Landings by Vessel Length within SORER East 179. Annual Average Value (2001 to 2010) of Landings by Fish Species within SORER East 180. Annual Average Value (2001 to 2010) of Landings by Gear Type within SORER East 181. Landings Value by Gear Type from 2001 to 2010 within SORER East 182. Landings Value by Vessel Length from 2001 to 2010 within SORER East 183. Landings Value by Species from 2001 to 2010 within SORER East 184. Surveillance Sightings by Nationality within SORER East 185. Surveillance Sightings by Gear Type within SORER East 186. Coastal Salmon & Sea Trout Fishing Locations and Fishing Ports within SORER East 187. Renewable Energy within SORER East 188. Coastal Military Locations and Military Practice Areas within SORER East 189. Oil and Gas within SORER East 190. Port Locations within SORER East 191. Interconnector Cables within SORER East 192. RYA Marinas, Sailing Clubs, Training Centres and Cruising Routes within SORER East 193. Ferry Routes within SORER East 194. Telecommunication Cables within SORER East 195. Key Tourist Sites within SORER East 196. Coastal and Maritime Cultural Heritage Assets within SORER East 197. Coastal Awards within SORER East 198. Waste Disposal Grounds within SORER East 199. Surfing and Wind Surfing Locations within SORER East 200. Dive Sites within SORER East 201. Dinghy Sailing Clubs within SORER East 202. Popularity of Canoeing and Kayaking for each SNH Seascape Unit within SORER East

Socio-economic Baseline Reviews for Offshore Renewables in Scottish Waters
R4032/3 vi R.1905
Insert 202 figures here Y:\4032_Socio-economic baseline for offshore renewables\GIS\Figures\Final_Comments\High_Res_Combined Y:\4032_Socio-economic baseline for offshore renewables\GIS\Figures\Final_Comments\LowRes_Combined Link to final figures uncombined – Y:\4032_Socio-economic baseline for offshore renewables\GIS\Figures\Final_Comments\

© Crown copyright 2012
You may re-use this information (excluding logos and images) free of charge in any format or medium, under the terms of the Open Government Licence. To view this licence, visit http://www.nationalarchives.gov.uk/doc/open-government-licence/ or e-mail: [email protected].
Where we have identified any third party copyright information you will need to obtain permission from the copyright holders concerned.
ISBN: 978-1-78256-198-9 (web only)
The Scottish GovernmentSt Andrew’s HouseEdinburghEH1 3DG
Produced for the Scottish Government by APS Group ScotlandDPPAS13542 (12/12)
Published by the Scottish Government, December 2012
w w w . s c o t l a n d . g o v . u k