Socially Desirable Responding on the MMPI -2, MCMI-III ...
99
Louisiana Tech University Louisiana Tech Digital Commons Doctoral Dissertations Graduate School Summer 2010 Socially Desirable Responding on the MMPI -2, MCMI-III, and PAI in a substance abuse treatment seing James Brian Rutland Follow this and additional works at: hps://digitalcommons.latech.edu/dissertations Part of the Clinical Psychology Commons , Counseling Psychology Commons , Personality and Social Contexts Commons , and the Quantitative Psychology Commons
Transcript of Socially Desirable Responding on the MMPI -2, MCMI-III ...

Louisiana Tech UniversityLouisiana Tech Digital Commons
Doctoral Dissertations Graduate School
Summer 2010
Socially Desirable Responding on the MMPI -2,MCMI-III, and PAI in a substance abuse treatmentsettingJames Brian Rutland
Follow this and additional works at: https://digitalcommons.latech.edu/dissertations
Part of the Clinical Psychology Commons, Counseling Psychology Commons, Personality andSocial Contexts Commons, and the Quantitative Psychology Commons

SOCIALLY DESIRABLE RESPONDING ON THE MMPI-2,
MCMI-III, AND PAI IN A SUBSTANCE ABUSE
TREATMENT SETTING
by
J. Brian Rutland, M.Ed.
A Dissertation Presented in Partial Fulfillment Of the Requirements for the Degree
Doctor of Philosophy
COLLEGE OF EDUCATION LOUISIANA TECH UNIVERSITY
August 2010

UMI Number: 3429509
All rights reserved
INFORMATION TO ALL USERS The quality of this reproduction is dependent upon the quality of the copy submitted.
In the unlikely event that the author did not send a complete manuscript and there are missing pages, these will be noted. Also, if material had to be removed,
a note will indicate the deletion.
UMT Dissertation Publishing
UMI 3429509 Copyright 2010 by ProQuest LLC.
All rights reserved. This edition of the work is protected against unauthorized copying under Title 17, United States Code.
A ® uest ProQuest LLC
789 East Eisenhower Parkway P.O. Box 1346
Ann Arbor, Ml 48106-1346

L O U I S I A N A T E C H U N I V E R S I T Y
THE GRADUATE SCHOOL
August 1, 2010 Date
We hereby recommend that the dissertation prepared under our supervision , J. Brian Rutland by
entitled
Socially Desirable Responding on the MMPI-2, MCMI-III, and PAI in a
Substance Abuse Treatment Setting
be accepted in partial fulfillment of the requirements for the Degree of Doctor of Philosophy
cWM Supervisor of Dissertation Research
Recommendation concurred^
Head of Department
Psychology & Behavioral Sciences Department
Advisory Committee
GS Form 13a (6/07)

ABSTRACT
Objectively scored measures of psychopathology are increasingly relied upon to
aid in the diagnosis of mental disorders and treatment planning, and three commonly used
measures are the MMPI-2, MCMI-III, and PAL A difficulty with such measures,
however, is that response sets are subject to both intentional and unintentional distortion
by examinees. Underreporting of psychopathology and attempts to present oneself in an
overly favorable light can be particularly difficult to detect. Therefore, scales and other
indices have been developed to identify underreporting and defensiveness. Paulhus
(2002) has developed and refined a model for this phenomenon of underreporting, which
he calls Socially Desirable Responding (SDR).
The intercorrelations of the major underreporting indicators of the three
instruments were evaluated, extending prior work that examined the concurrent validity of
pairs of the measures by examining all three at once and using a different sample.
Correlations between scales obtained in this study were found to be overwhelmingly
similar to correlations reported in previous studies. The factor structure of the
underreporting indices of the MMPI-2, MCMI-III, and PAI was examined in light of
Paulhus's SDR model. The ability of the major SDR scales to correctly differentiate
patients referred for either evaluation or treatment in a substance abuse treatment setting
was examined. The strongest predictors of group membership proved to be S from the
MMPI-2, Compulsiveness from the MCMI-III, and K from the MMPI-2, respectively.
iii

APPROVAL FOR SCHOLARLY DISSEMINATION
The author grants to the Prescott Memorial Library of Louisiana Tech University the right to
reproduce, by appropriate methods, upon request, any or all portions of this Dissertation. It is understood
that "proper request" consists of the agreement, on the part of the requesting party, that said reproduction
is for his personal use and that subsequent reproduction will not occur without written approval of the
author of this Dissertation. Further, any portions of the Dissertation used in books, papers, and other
works must be appropriately referenced to this Dissertation.
Finally, the author of this Dissertation reserves the right to publish freely, in the literature, at
any time, any or all portions of this Dissertation.
Author J. Brian Rutland
Date 08/01/2010
GS Form 14 (5/03)

TABLE OF CONTENTS
ABSTRACT iii
LIST OF TABLES vii
ACKNOWLEDGMENTS viii
CHAPTER ONE INTRODUCTION 1
Socially Desirable Responding 2
Measures of Personality and Psychopathology 5
MCMI-III 5
PAI 11
MMPI-2 18
Study Comparisons of Personality Measure Validity Scales 26
Socially Desirable Responding Model and the MMPI-2, PAI, and MCMI-III 30
Hypotheses 32
Hypothesis Set One: Scale Intercorrelations 33
Hypothesis Set Two: Factor Structure 34
Hypothesis Set Three: Prediction of Group Membership 35
Hypothesis Set Four: Cutoff Scores 36
CHAPTER TWO METHOD 37
Participants 37
Measures 38
CHAPTER THREE RESULTS 39
Descriptive Statistics 39
v

vi
Scale Intercorrelations 41
Factor Structure 52
Prediction of Group Membership 55
Cutoff Scores 62
CHAPTER FOUR DISCUSSION 68
Scale Intercorrelations 68
Personality and Overreporting 70
Socially Desirable Responding 72
Prediction of Group Membership 74
Cutoff Scores 76
Contributions to the Literature 76
Study Limitations and Directions for Future Research 77
REFERENCES 79
APPENDIX AIRB APPROVAL FORMS 88

LIST OF TABLES
Table 1 Descriptive Statistics for All Scales 40
Table 2 Independent Samples T Test for SDR Scales 41
Table 3 Scale Intercorrelations (Pearson's) 44
Table 4 Scale Intercorrelations (Spearman's) 48
Table 5 MMPI-2 and MCMI-III correlation comparisons with Morgan et al. (2002) 50
Table 6 MMPI-2 and PAI correlation comparisons with Braxton et al. (2007) 51
Table 7 Factor Loadings 55
Table 8 Structure Matrix for Discriminant Function for all SDR Scales 57
Table 9 Structure Matrix for Discriminant Function for Self-Deceptive Denial Scales 58
Table 10 Structure Matrix for Discriminant Function for Self-Deceptive Enhancement Scales 59
Table 11 Structure Matrix for Discriminant Function for Communion Management Scales 59
Table 12 Structure Matrix for Discriminant Function for All SDR Scales plus F, Fb, Fp,
and NIM. 61
Table 13 Cases Exceeding Cutoff Scores for Identified Underreporting Scales 63
Table 14 Area Under the Curve Scores for Underreporting Indices' Identifying Evaluees 64
Table 15 Sensitivity and Specificity Scores for Underreporting Indices' Identifying Evaluees 65
vii

ACKNOWLEDGMENTS
I owe an enormous debt for this project to my family. My wife and two sons have
been exceptionally gracious while making significant sacrifices to support and patiently
wait for me as I completed this work.
viii

CHAPTER ONE
INTRODUCTION
Among the tools upon which psychologists rely to aid in the clarification of
diagnosis are objectively scored self-report measures of personality and psychological
pathology. Three frequently used measures are the Minnesota Multiphasic Personality
Inventory, Second Edition (MMPI-2; Butcher, Dahlstrom, J. R. Graham, Tellegen, &
Kaemmer, 1989), the Millon Clinical Multiaxial Inventory, Third Edition (MCMI-III;
Millon, Davis, & Millon, 1997), and the Personality Assessment Inventory (PAI; Morey,
1991).
One difficulty in using such instruments, however, is that their interpretation is
subject to variability due to intentional and unintentional response distortion. This
distortion could result from random responding, poor understanding of test items,
intentional underrepresentation of symptomatology, or intentional exaggeration of
symptomatology, to name only a few possible reasons. The validity of obtained results is
of paramount importance in test interpretation. To increase the validity of self-report test
results, scales have been developed within each test to detect response distortion.
Baer and Miller (2002) summarize three major research designs found in the
literature on response distortion. The first is the simulation design, in which groups of
volunteers are asked to take a measure under various sets of instructions, e.g., standard
1

instructions, faking good, faking a particular disorder, etc. In such designs, attempts can
be made to maximize similarity to real-world settings by using realistic scenarios and
providing tangible incentives for escaping detection. A known-groups design compares
the scores of two groups whose response styles are known. For example, scores from
volunteers whose profiles suggest they have responded honestly are compared with scores
from a clinical population of individuals who have been discovered to have
misrepresented themselves. Finally, the differential prevalence design is used to compare
a group of participants with strong incentive to misrepresent themselves (e.g., clients
evaluated as part of a child custody hearing) with participants who have no apparent
motive to misrepresent themselves (e.g., student volunteers given standard instructions).
Of particular interest in substance abuse treatment settings is detecting the
underreporting of psychopathology, as these patients often seek to minimize their
symptoms (see for example Andrews, Kendler, Gillespie, & Neale, 2007; Chen, Fang,
Shyu, & Lin, 2006; Fals-Stewart, 1995,1996; Fals-Stewart & Lucente, 1997; James,
Lonczak, & D. D. Moore, 1996; Ledgerwood, Goldberger, Risk, Lewis, & Price, 2008).
Underreporting is alternatively called faking good, positive malingering, and
defensiveness. One widely used model of underreporting is Socially Desirable
Responding.
Socially Desirable Responding
In his overview of the topic, Paulhus (2002) notes that Socially Desirable
Responding, though typically measured by single scales, has been observed consistently
in factor analyses to be composed of at least two basic factors, vaguely named Alpha and
Gamma. Over the years, Paulhus writes, research has continued to refine the model and
3
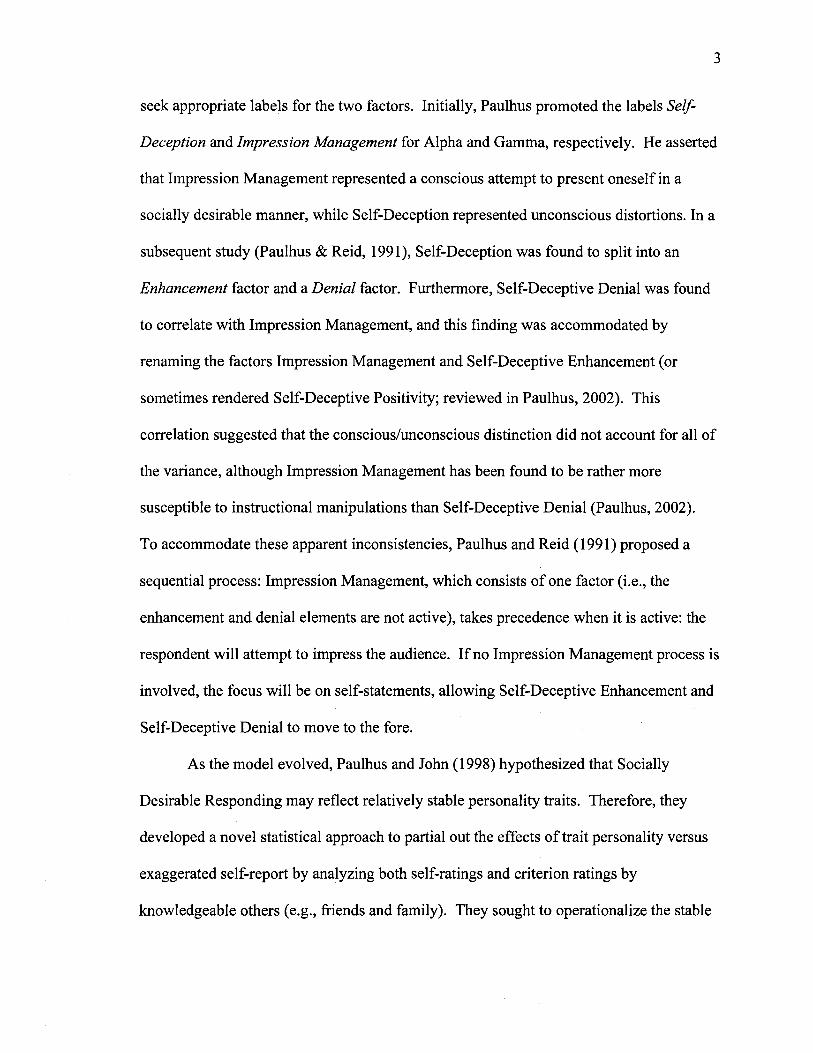
seek appropriate labels for the two factors. Initially, Paulhus promoted the labels Self-
Deception and Impression Management for Alpha and Gamma, respectively. He asserted
that Impression Management represented a conscious attempt to present oneself in a
socially desirable manner, while Self-Deception represented unconscious distortions. In a
subsequent study (Paulhus & Reid, 1991), Self-Deception was found to split into an
Enhancement factor and a Denial factor. Furthermore, Self-Deceptive Denial was found
to correlate with Impression Management, and this finding was accommodated by
renaming the factors Impression Management and Self-Deceptive Enhancement (or
sometimes rendered Self-Deceptive Positivity; reviewed in Paulhus, 2002). This
correlation suggested that the conscious/unconscious distinction did not account for all of
the variance, although Impression Management has been found to be rather more
susceptible to instructional manipulations than Self-Deceptive Denial (Paulhus, 2002).
To accommodate these apparent inconsistencies, Paulhus and Reid (1991) proposed a
sequential process: Impression Management, which consists of one factor (i.e., the
enhancement and denial elements are not active), takes precedence when it is active: the
respondent will attempt to impress the audience. If no Impression Management process is
involved, the focus will be on self-statements, allowing Self-Deceptive Enhancement and
Self-Deceptive Denial to move to the fore.
As the model evolved, Paulhus and John (1998) hypothesized that Socially
Desirable Responding may reflect relatively stable personality traits. Therefore, they
developed a novel statistical approach to partial out the effects of trait personality versus
exaggerated self-report by analyzing both self-ratings and criterion ratings by
knowledgeable others (e.g., friends and family). They sought to operationalize the stable

4
traits using common attributes such as intelligence, as well as the basic traits identified in
the widely used Five-Factor Model of personality: Neuroticism (defined as a tendency
towards psychological distress), Extraversion (a broad trait which includes sociability and
positive emotionality), Conscientiousness (characterized by organization and diligence),
Openness to Experience (which includes characteristics such as unconventionality,
intellectual curiosity, and aesthetic interests), and Agreeableness (characterized by level
of trusting, sympathy, and cooperativeness; Costa & McCrae, 1992). Their method of
analysis involves calculating a residual index that allows for a factor analysis of the
variance beyond that which is due to personality (that is, the exaggerated portion of the
self-rating; Paulhus & John, 1998). Their analysis revealed that the Alpha dimension
correlates highly with ratings of intelligence and narcissism, as well as the personality
traits Openness and Extraversion. Gamma, on the other hand, correlated with stability
and the personality traits Conscientiousness and Agreeableness. Similarly, Self-
Deceptive Enhancement was found to correlate with Alpha, while Self-Deceptive Denial
was found to correlate with Gamma. Additionally, men score higher, on average, than
women on Alpha measures, and women score higher than men on Gamma measures.
Based on these findings, Paulhus (2002), in his latest update to the model to date,
suggests that Alpha represents an Egoistic Bias in which the individual self-deceptively
exaggerates social and intellectual status, incorporating the prior factor of Self-Deceptive
Enhancement. Gamma, he points out, represents a Moralistic Bias in which the
individual self-deceptively denies socially-deviant traits and claims moralistic attributes,
incorporating the prior factor of Self-Deceptive Denial. Paulhus states that this first tier
functions at a trait level and tends to be stable across situations. However, he asserts that

5
there is also a situational component to Alpha and Gamma, which may or may not be
present in a response set depending upon whether there is a perceived audience (i.e.,
whether responses are anonymous). He goes on to state that on this second tier, which
accounts for the Impression Management aspect of Socially Desirable Responding, Alpha
contains a sense of bragging and self-promotion, which he labels Agency Management.
The impression management goal for Agency Management is to appear superior and more
competent than potential competitors. Gamma contains a component of minimization of
faults or excuse-making, which Paulhus labels Communion Management. The impression
management agenda for Communion Management is to fit in or avoid conflict.
Measures of Personality and Psychopathology
As noted above, psychologists often rely upon objectively scored measures of
personality and psychopathology to aid in obtaining accurate diagnoses of mental
disorders. Three commonly used objectively scored measures include the MCMI-III, the
PAI, and the MMPI-2. These instruments and the scales used for interpreting the validity
of profiles and the response styles of test takers are reviewed below.
MCMI-III
MCMI-III and its validity scales. The Millon Clinical Mulitaxial Inventory was
introduced in 1983 by Theodore Millon to accompany his theory of personality
psychopathology, which he asserted accounted for most, if not all, psychiatric conditions
(Strack, 2002). Strack, in his interpretive guide to the instrument, notes that the MCMI-
III is a theory-driven instrument, and the test-development strategy followed by Millon
placed a premium on harmony between the instrument and his theory of psychopathology.
For this reason, its personality disorder scales only correlate modestly with the Diagnostic
6
and Statistical Manual of Mental Disorders, currently in its fourth edition (DSM-IV-TR,
APA, 2000), and with other measures of personality disorders (Craig, 1999). The MCMI-
II, released in 1987, revised the instrument to reflect the changes in nosology espoused in
the third edition of the DSM, and introduced three validity scales, which Millon termed
Modifying Indices. When the DSM-IV was released, Millon also released a new edition
of his inventory, the MCMI-III, which is the current edition as of this writing. In its
current form, the MCMI-III is made up of 175 true or false items and the following
scales: a Validity Index, consisting of three test items that are independent of all other
scales; three Modifying Indices measuring response bias; 14 personality scales; and 10
clinical syndrome scales (Strack, 2002). Unlike the other two measures under
consideration here, the MCMI-III transforms raw scores into base rate (BR) scores rather
than T scores, based on the belief that T scores are inappropriate for psychological and
personality disorders, because they are not normally distributed in the population (Craig,
1999). Base rate scores anchor cutoff scores on the prevalence of the characteristic in the
psychiatric population (Choca, 2004). Additionally, as predicted by Millon's theory,
scores obtained on the Personality Style scales and the Personality Disorder scales
typically have been found to be more stable over time than scores on the Clinical
Syndrome scales, suggesting that the personality scales effectively are tapping into a more
ingrained and stable trait structure (Craig, 1999).
Interpretation of test validity requires analysis of two scales (Strack, 2002). First
is the Validity Index, which is comprised of three highly improbable statements. If even
one of the items is endorsed "True," caution is warranted in interpreting test results. If
two or more are endorsed, the results are considered not valid (Strack, 2002).

7
The second way that MCMI-III results may be invalidated is if the Scale X (the
Disclosure Index) raw score is less than 34 or greater than 178, with low scores
suggesting underreporting and high scores suggesting overreporting (Strack, 2002).
However, these cutoff points have been found to inadequately discriminate when
concurrently compared with other objective measures of psychopathology (Morgan,
Schoenberg, Dorr, & Burke, 2002). In the standard system of interpretation, Scale X is
the only one of the three Modifying Indices that can invalidate the profile. With a valid
profile, each of the three indices provides the clinician with information about the
patient's response style. Scales Y and Z also provide statistical modification of base rate
scores on personality and clinical syndrome scales known to be susceptible to the types of
response bias represented by each of these scales (Strack, 2002). However, it has been
argued that these corrections do not entirely counterbalance the effects of intentional
attempts to distort one's presentation (Choca, 2004). Therefore, the interpreter is advised
to recognize and account for any observed distortions.
Scale X, the Disclosure Index, is based on a composite score from the personality
scales. Low scores are interpreted as representing an underreporting of symptomatology,
or defensiveness. Choca (2004) notes that test takers instructed to fake good still
typically obtain acceptable scores on this scale, suggesting that scores that would call into
question the validity of the profile per Millon's recommended cutoffs represent such a
profound defensiveness (or perhaps lack of insight) that attempting to interpret other
scales would be meaningless. High scores, on the other hand, are interpreted as
exaggeration of psychopathology. In the mid range, scores may be interpreted as
representing a less open (toward the low end) or more open and frank (toward the high
8
end) response style. As noted previously, extremely low (less than 34) and extremely
high (greater than 178) raw scores on Scale X render the profile invalid based on Millon's
recommended cutoffs (Strack, 2002). However, Morgan et al. (2002) found that a cutoff
score of 89 was a better discrminator of students attempting to fake bad.
Scale Y, the Desirability Index, measures the tendency to present oneself in an
overly favorable light, and becomes clinically interpretable when base rate scores exceed
74 (Strack, 2002). The higher the score, the more the respondent is denying personal or
psychological problems. Taken alone, low scores on Scale Y typically are not interpreted.
Millon has not established cutoff scores for Y which invalidate a test profile. Instead,
high scores result in a statistical modification to scales known to be susceptible to positive
self-presentation (Strack, 2002).
Scale Z, the Debasement Index, measures the tendency to overreport or exaggerate
psychological problems (Strack, 2002). Depending on the setting and the referral
question, high base rate scores on Scale Z may be interpreted as a cry for help, perceived
extreme distress, or as an attempt to malinger psychopathology for personal gain (Strack,
2002). As with Scale Y, neither high nor low scores technically invalidate the test profile.
Low scores on Scale Z are not clinically significant, while high scores result in a
statistical modification to scales known to be susceptible to symptom overreporting
(Strack, 2002).
In addition to interpreting each modifying index independently, the literature also
provides rules of thumb for interpreting response style from the pattern of scores (Strack,
2002). For example, a pattern made up of a relatively low Scale X score and high Scale Y
score may indicate a faking good response style. High scores on Scales X and Z may

9
indicate a faking bad response style. Low Scale X and high Scale Y and Z scores may
indicate defensiveness. Similar to other objectively scored self-report measures, the
MCMI-III has been reported to be more effective at detecting faking bad than faking good
response styles (Craig, 1999).
MCMI-III and underreporting. As previously noted, Scale Y is the prototypical
indicator for underreporting on the MCMI-III. Extremely low scores on Scale X also
suggest underreporting (Choca, 2004). Choca also notes that although it is possible to
take the MCMI-III in an honest manner and return no significant elevations on any scale,
at least one scale is elevated, in the majority of cases. In the rare case of an honest profile
with no elevations on clinical scales, one would expect to see characteristics of several
traits endorsed, but none reaching clinically significant levels. Otherwise, Choca notes
that individuals who respond defensively typically exhibit notable (but not clinically
significant) elevations on Scale Y and one or more of the following scales: Compulsive,
Histrionic, or Narcissistic.
MCMI-III and the Five-Factor Model. Saulsman and Page (2004) report a
hypothesis that personality disorders represent exaggerations of normal personality
dimensions, and they cite an extensive body of research empirically supporting
meaningful relationships between personality disorders and normal personality traits. Of
particular interest in the present study is the relationship between purported measures of
personality disorders, such as the MCMI-III, and measures of normal personality. One
such study was conducted by Dyce and O'Connor (1998), who factor analyzed the facets
of the Five-Factor Model, as measured by the NEO-PI-R, and the Personality Disorder
scales from the MCMI-III. The authors obtained five factors with the following scale

loadings, which they interpret as corresponding to the Five-Factor Model of normal
personality: a Neuroticism factor with Depressive, Dependent, Avoidant, Passive-
Aggressive, Self-Defeating, and Borderline representing the scale loadings; Antisocial,
Sadistic, Narcissistic, and Paranoid loaded negatively on an Agreeableness factor; an
Extraversion factor with Schizoid and Avoidant loading negatively and Histrionic
positively; and a Conscientiousness factor with Compulsivity loading strongly and
positively and Antisocial loading moderately and negatively.
Similarly, Saulsman and Page (2004) conducted a meta-analysis of studies relating
the Five-Factor Model of normal personality with the personality disorders classified in
the DSM. They note that Extraversion and Conscientiousness provide some of the most
discriminating information regarding the Five-Factor Model's correlations with
personality disorders. Of particular interest for the current review are the correlations
they reported for the MCMI-III with the Five-Factor Model of personality. Large
correlations were found for the MCMI-III's Histrionic scale and Extraversion (.60, p <
.0001) and the MCMI's Compulsive scale and Conscientiousness (.52, p < .0001).
Similar results were reported by Aluja and colleagues (2007) in their study with Spanish-
speaking participants.
Furthermore, Craig (1999) asserted, based on his review of the literature, that the
Histrionic and Compulsive scales of the MCMI measure normal personality styles rather
than personality disorders. He also noted that the Histrionic and Compulsive scales are
correlated with measures of psychological health, they do not correlate with other
measures of their respective disorders, and are rarely elevated in clinical samples. As
further evidence that these scales may be better understood as measures of normal

11
personality, he notes that individuals with an obsessive-compulsive disorder diagnosis
were not found to have significant elevations on the Compulsive scale.
PAI
PAI and its validity scales. The Personality Assessment Inventory (Morey, 1991,
2007) is comprised of four validity scales, eleven clinical scales, five treatment scales,
and two interpersonal scales. Like the MCMI, the PAI is also a theory-derived instrument
and was developed using a similar model of construct validity (Morey, 2003), though it
differs from the MCMI in its focus. Millon's focus was developing a measure consistent
with his own theory of psychopathology (Strack, 2002), while Morey's theoretical focus
was developing a measure that was consistent with significant themes in the literature on
the nosology of mental disorders and significant themes in the literature on clinical
practice (Morey, 2003). The PAI also differs from the MCMI and MMPI in that its items
use a four-alternative scale (totally false, slightly true, mainly true, and very true) whereas
both the MCMI-III and MMPI-2 are scored based on true or false item responses. Despite
its relatively short history, the PAI has joined the MCMI and MMPI as one of the most
commonly used objective personality measures in clinical settings (Piotrowski, 2000).
The four scales used to interpret test validity and response style are labeled
Inconsistency (ICN), Infrequency (INF), Negative Impression (NIM), and Positive
Impression (PIM, Morey, 2003). Unlike the MCMI and MMPI, validity scales on the PAI
are interpreted independently from the clinical scales; that is, elevations on the validity
scales do not result in statistical corrections to other scale scores (Morey, 2003). ICN is
designed to assess whether the respondent is answering consistently throughout the
assessment. It is comprised of five pairs of items with similar meaning that would be
expected to be endorsed in the same (either positive or negative) direction and five pairs
of items with opposite meaning that would be expected to be endorsed in the opposite
direction (Morey, 2003). The INF scale detects whether the respondent answered items
randomly or carelessly and consists of items that are free from psychopathological
meaning, not bizarre, and were seldom endorsed in both normal and clinical subjects in
the normative sample (Morey, 2003).
The NIM scale is designed to detect symptom exaggeration or negative response
distortion (Morey, 2003). Morey recommends that scores below 73 T are considered low
and indicate very little negative response distortion. Moderate elevations, between 73 T
and 847; suggest some exaggeration of symptoms and problems, and scores in this range
warrant caution when interpreting other scales. Scores between 847 and 92T suggest a
higher probability of distortion and may be indicative of a particularly negative view of
one's life or situation, though the possibility of intentional distortion is also present.
Scores above 92 T invalidate the profile, though interpretation of scale elevations may
provide useful information with regard to the types of symptoms the respondent attempted
to convey (though they should not be interpreted as symptoms the respondent actually
experienced). Morey cautions that NIM is not a malingering scale per se; rather,
elevations indicate a response style in which the respondent reports a more negative or
pathological account than might be provided by an objective observer. That is to say,
even a profile with a moderately elevated T score on NIM may provide an accurate record
of an individual's own perceptions. In this sense, NIM elevations may be seen as not only
a negative response style, but also a negative perception style. With regard to
malingering, research participants instructed to simulate severe mental disorders obtained
13
an average score of 1107 on NIM; a random profile yields an average score of 96T
(Morey, 2003). Morey concludes that NIM is more efficient at detecting the malingering
of more severe psychopathology (e.g., schizophrenia) than milder mental disorders (e.g.,
anxiety or depression).
The Malingering Index (MAL) has been developed to provide a clinician with
additional tools for the detection of malingering (Morey, 2003). This is not a scale;
rather, it is a set of eight unusual profile features that have been observed more frequently
in the profiles of research participants instructed to simulate mental disorders than in the
profiles of normal or clinical normative sample participants. Each of the eight
characteristics is either present or not present; each present characteristic adds a point to
the score. Morey reports that simulated malingered profiles yielded a mean score of
about 4 (£D=0.74), while the mean of the clinical standardization sample was 0.8
(5!D=0.98). A score of 3, therefore, lies two standard deviations above the mean for the
clinical sample and should alert the clinician to the possibility of malingering. Scores of 5
or above are extremely uncommon in the clinical standardization sample and found most
commonly in samples of individuals instructed to simulate severe mental illness.
Morey (2003) also has endorsed a third measure of malingering for the PAI, a
discriminant function analysis developed by Rogers et al. (1996). The Rogers
discriminant function (RDF) is based on a formula made up of weighted values from 20
PAI scales that yields a cutting score of approximately 0 (0.12368). Respondents whose
score is greater than zero can be considered to be malingering, while scores less than zero
can be considered to be free from negative response distortion (Rogers, 1996).
Morey (2003) notes that each of the three methods of detecting malingering
described above appears to detect a slightly different type of negative response distortion.
That is, the NIM scale is more strongly influenced by psychopathology than the
Malingering index, while RDF appears to be relatively free from the influence of
psychopathology. NIM correlates with the Malingering Index at .61 and with RDF at only
.09. MAL and RDF correlate at .26.
Morey (2003) proposes, based on his review of the research, that the three
methods can be used in tandem to suggest the degree to which covert and overt factors are
indicated. When all three measures are significantly and similarly elevated, effortful
distortion can be hypothesized. When all three are elevated, with NIM highly elevated,
RDF moderately elevated, and MAL in between, an effortful but sincere (e.g., a "cry for
help") may be hypothesized. When NIM is elevated but RDF is average, again with
MAL in between, a more covert negative distortion, such as that which commonly
presents in the cognitive distortions of a depressive episode, may be hypothesized.
PAI and underreporting. Positive distortion, or the respondent's reluctance to
admit flaws or to attempt to present highly favorably are measured primarily by PIM
(Morey, 2003). Morey notes that detecting positive distortion or defensiveness is one of
the most difficult challenges for test developers, as measures of defensiveness typically
correlate with normal functioning. As with NIM, PIM was developed by selecting items
that were endorsed infrequently by both community and clinical samples, but endorsed
more frequently by research participants instructed to present themselves favorably. And
just as NIM items tend to be endorsed more frequently by participants in the clinical
sample than participants in the normal sample, PIM items are endorsed more frequently

by those in the normal sample than those in the clinical sample. Additionally, the
tendency to present oneself favorably appears commonly in the normal population, and in
clinical studies 30-40% of participants from normal populations will be detected as
"faking good" on indices of social desirability (Morey, 2003).
Morey (2003) recommends that scores below 44T on PIM be interpreted as honest
responding. Scores from 44Tto 51 Tare low scores and suggest that the respondent did
not attempt to present in an unrealistically positive fashion, though caution is warranted
toward the upper end of this range. Moderate elevations, 577 to 68T, suggest that the
respondent wishes to be portrayed in a positive light, though this could be a covert rather
than an overt distortion. Nevertheless, profiles with PIM scores in this range should be
interpreted cautiously. Above 6ST, or a raw score of 23, the profile's validity becomes
questionable, as the respondent was unwilling to admit even the common shortcomings
which most individuals will acknowledge. This cut score has been challenged, however,
by Peebles and Moore (1998), who found that a raw score of 18 better differentiated
college students who were faking good, as well as by Cashel et al. (1995) and Fals-
Stewart (1996). In any event, scores in this range are extremely rare.
An additional tool to aid in the detection of defensiveness is available in Morey's
(2003) Defensiveness Index (DEF). It is similar to MAL in that it consists of eight
unusual profile features commonly observed in profiles in which research participants
have been instructed to present a positive impression. Because of the weighting of one
item, potential scores range from 0 to 9. The recommended cutting score is 6 (707) for
DEF (Morey, 2003).
A discriminant function formula also has been developed by Cashel, Rogers,
Sewell, and Martin-Cannici (1995) and endorsed by Morey (2003), known as the Cashel
discriminant function (CDF). Cashel et al. report that scores below 135 (487) may be
interpreted as representing honest responding. Scores between 145 and 160 (55 to 617)
suggest a moderate level of distortion and merit cautious interpretation. Scores greater
than 160 (>61 J) suggest that the respondent overtly attempted to present favorably and
indicate a high level of response distortion; these profiles may possess questionable
validity and clinical hypotheses must reflect this distortion. In the initial study by Cashel
et al., CDF also detected malingered profiles, and subsequent research by Morey and
Lanier (1998) confirmed this. However, Bagby and colleagues (2002) failed to replicate
this finding.
Again paralleling the three malingering indicators, the three defensiveness
indicators (PIM, DEF, and CDF) appear to detect somewhat different properties of
defensiveness. Morey (2003) reports that PIM correlated .56 with DEF and .06 with
CDF, which in turn correlated .32 with DEF. The differences between indicators seems
to be that PIM is influenced by the respondent's true mental health status, CDF seems to
be relatively free from such influence, and DEF lies between the two. Interpretation of
the indicators follows a similar pattern to that recommended for the malingering
indicators. When all three indicators are highly elevated, research suggests an overt and
willful defensiveness. In profiles in which CDF is somewhat elevated, with a greater
elevation in DEF and an even greater elevation on PIM (i.e., PIM > DEF > CDF, while
CDF is elevated), a mixture of both covert and overt factors is likely in play. An elevated
score on PIM with an average CDF score and an intermediate DEF score (i.e., PIM >

DEF > CDF, but CDF is not elevated) seems to indicate covert defensiveness, likely due
to factors such as lack of insight.
Morey and Lanier (1998) reported that, in a sample of undergraduate volunteers,
PIM performed the best of the three underreporting indicators, followed closely by the
Defensiveness index, and lastly by CDF, though all performed adequately and provided
useful information. Of particular interest, they found that CDF increased in both positive
and negative dissimulators, suggesting that it may serve as a broad measure of distortion
in general rather than defensiveness in particular. Fals-Stewart (1996), in a mixed-design
study of participants instructed to respond defensively and participants from a
differentially prevalent group (court-mandated substance abuse treatment patients), found
that PIM yielded mixed results. Using the standard cutoff for PIM, a hit rate of only 72%
was obtained, with a high false-negative rate of 51%. Using a more sensitive cutoff, he
obtained an 84% hit rate, but with a tendency toward making false-positive identifications
(at a rate of 19%). Baity and colleagues (2007) also found the PIM scale to be the best
discriminator of naive faking in a sample of psychiatric patients. Similarly, Baer and
Wetter (1997) found that both PIM and DEF were effective at discriminating uncoached
faking good from standard instructions in a college student sample, but were not
significantly effective at detecting coached faking good. Also of note, they found that
scales on the interpersonal style scale Warmth (WRM, described below) were higher for
the uncoached faking good condition than the other two conditions.
PAI and normal personality traits. Two additional scales that are of interest in
the present study are the PAI's two measures of normal personality, the interpersonal
styles scales. The first scale, labeled Dominance (DOM), is a bipolar scale measuring the
extent to which an individual is controlling, submissive, or autonomous in interpersonal
relationships. Morey (2007) asserts that low scorers (<357) are individuals who tend to
appear submissive and uncertain in social interactions. Moderately low scorers (35 to
447) are individuals who appear modest and self-conscious in social interactions.
Average scorers (45 to 597) are individuals who may appear relatively more confident
and adaptable in social situations, giving and relinquishing control appropriately.
Moderately high scorers (60 to 697) are individuals who may appear self-confident and
forceful in social situations. High scorers (>707) are individuals who tend to be
domineering and intolerant in social situations.
The second scale, labeled Warmth (WRM), is a bipolar scale measuring an
individual's tendency toward either empathic warmth and engagement or withdrawal and
mistrust in interpersonal relationships. Morey (2007) indicates that low scorers (<35 7)
are individuals who tend to appear uneasy, uninvested, and cold in social interactions.
Moderately low scorers (35 to 447) are individuals who may appear somewhat distant in
interpersonal relationships. Average scorers (45 to 597) are individuals who may appear
relatively adaptable in relationships comfortable with appropriate intimacy but also
capable of maintaining appropriate distance. High scorers (>607) are individuals who
may appear warm, friendly, and sympathetic in relationships. Exceptionally high scorers
(>707) may be perceived by others as too trusting for their own good and may avoid
conflict in relationships at all costs.
MMPI-2
MMPI-2 and its validity scales. The first edition of the Minnesota Multiphasic
Personality Inventory was introduced in 1942, reaching its final state of refinement in

1951 (Nichols, 2001). The MMPI and its successor, the MMPI-2, published in 1989, are
the subject of more than 14,000 books and articles and are the most widely used and
researched objective measures of psychopathology (Butcher, 2006). In what was at the
time a notable departure from standard procedures for the development of
psychodiagnostic instruments, and also in small contrast with both the MCMI and the PAI
(which both used a hybrid approach to test development), a purely empirical rather than a
purely logical keying approach was used to develop clinical scale test items (Graham,
1999). In this approach, responses were not keyed based on a predetermined and
subjectively derived direction. Rather, statistical item analysis was used to determine
how test items differentiated criterion groups. Because of this, the standardization sample
is of supreme importance in the interpretation of the MMPI. Limitations in the original
standardization sample gave rise to the restandardization that resulted in the MMPI-2.
With regard to interpretation, there have been a variety of scales and methods
developed to help examiners evaluate the validity and response styles of MMPI-2
profiles, and these have been described in dozens of books and hundreds of articles with
varying degrees of consensus. While there are a variety of approaches, this review will
focus on the techniques described in Graham's (1999) authoritative guide, MMPI-2:
Assessing Personality and Psychopathology.
The first step in interpreting an MMPI-2 profile is to note the number of omitted
items. While the MMPI-2 manual suggests that profiles with more than 30 omitted items
should be interpreted extremely cautiously, Graham (1999) recommends great caution in
interpreting profiles with 10 or more omitted items and that profiles with 30 or more
omitted items are not interpretable at all.

The Infrequency, or F scale, was based on a set of items that was endorsed by less
than 10% of the standardization sample and is meant to detect unconventional, atypical,
or deviant response styles. Scores lower than 50 on scale F are indicative of a normal or
socially conforming response style, though they could also suggest a defensive or faking
good response style, particularly when the L and K scales are elevated (Graham, 1999).
A mild elevation of T scores between 50 and 65 often indicate that the individual is
endorsing a specific problem area. Scores between 65 and 79 often are obtained by
individuals with particularly socially deviant convictions or by individuals with more
severe psychological disorders. Scores between 80 and 99 on the F scale are indicative of
an exaggeration of symptoms, perhaps as a cry for help. Scores greater than 100 on scale
F could represent a variety of response styles and may be indicative of an invalid profile.
Scores in this range could be obtained by hospitalized psychiatric patients with very
severe psychopathology, such as delusions and hallucinations. However, scores greater
than 100 also could represent a random response style, in which case scores on the TRIN
scale would be expected to be greater than 80; or deliberate attempts to fake bad, in which
case the Fb and F(p) scales (described below) would be similarly elevated (i.e., all three
well above 100; Graham, 1999).
The F, L, and K scales (L and K are described below) are the three most
commonly used validity scales for determining response styles on the MMPI-2.
However, there are also several other major indices that are important in assessing profile
validity. The Back Infrequency scale (Fb) complements the F scale, whose items are
confined to the first 361 test items. The Fb scale is made up of 40 items in the second
half of the test which were endorsed by fewer than 10% of the MMPI-2 restandardization

21
sample. It correlates highly with the F scale and can be useful in helping to determine
whether an individual's response style varied over the course of the test. For example, if
an individual's score on scale F was normal but the score on Fb was somewhat elevated,
this may be indicative of a test taker who responded inconsistently as the test wore on,
perhaps due to fatigue or disinterest.
The Variable Response Inconsistency Scale (VRIN) and the True Response
Inconsistency Scale (TRIN) provide complementary information about the consistency
with which an individual responds to test items. The VRIN scale consists of 47 pairs of
items whose content is either similar or opposite and would therefore be expected to be
answered in a consistent manner. When a response to one item in a pair is inconsistent
with a response to the other item in the pair, the raw score for the scale is increased
(Graham, 1999).
The TRIN scale is designed to detect a response style in which an individual
indiscriminately tends to answer either true or false. The scale is composed of 20 pairs of
items with opposite content; a pair of true items or a pair of false items would increase the
raw score by one point. Higher TRIN scale raw scores are indicative of the tendency to
indiscriminately provide true responses while lower scores indicate a tendency toward
false responses (Graham 1999).
In an effort to compensate for the fact that high scores on the F scale often may be
due to severe psychopathology, the Infrequency-Psychopathology, or Fp, scale was
developed. This scale consists of 27 items that rarely were answered by both the MMPI-2
restandardization sample, as well as by a sample of psychiatric inpatients. Subsequent
research on the scale has suggested that it adds incrementally to the F scale in helping to

discriminate between persons faking bad and psychiatric inpatients (Arbisi & Ben-Porath,
1998). Research also has suggested that a raw score greater than 9 on the Fp scale may be
a useful cutoff for identifying malingered or exaggerated response styles (Graham, 1999).
A final indicator that is commonly relied upon in MMPI-2 interpretation is the F-
K index. Its development was based on the observation that individuals who were
attempting to exaggerate their symptoms tended to score considerably higher on the F
scale than on the K scale. The index is calculated by simply subtracting the K scale raw
score from the F scale raw score. Graham (1999) observes that a cutoff score of 11 has
been recommended for the index, and that in general any positive difference between F
and K suggests exaggeration, with the likelihood of exaggeration rising as the difference
rises. However, he also notes that support for the overall utility of the index has been
mixed in the empirical literature. Additionally, research also has found support for
negative values of F-K suggesting a fake good response style (Bagby, Rogers, & Buis,
1994), though in general the support for this has also been at best mixed (Graham, 1999).
MMPI-2 and underreporting. There are several scales used to assess
underreporting on the MMPI-2, but the L scale and the K scale are the most commonly
used. The Lie, or L scale, was developed to detect attempts by the respondent to present
in an overly favorable light, particularly attempts that are deliberate and unsophisticated.
L scale T scores that fall below 50 are considered normal and suggest an open and frank
response style. T scores between 55 and 65 suggest defensiveness or denial of problems.
T scores above 65 are extreme, and such profiles are considered not interpretable.
Extremely low scores on the L scale may suggest a response style in which an individual

is exaggerating problems, though such an interpretation is most appropriate when the
score on the K scale is also quite low and the F scale score is very high (Graham, 1999).
The Correction, or K scale, was developed to detect the more subtle attempts by
test takers to present themselves favorably to which the L scale was insensitive. High
scores on scale K are thought to represent defensiveness, which could produce artificially
low scores on certain clinical scales; therefore a statistical procedure was developed to
compensate for this by raising T scores on clinical scales that have been found to be most
susceptible to defensive response styles (Graham, 1999). However, developed for the
original MMPI, the K scale correction has not received good empirical support in studies
of its use with the MMPI-2, particularly in studies using normal or psychologically
healthy populations (Graham, 1999). Despite its apparently limited utility, the K scale
correction continues to be included in standard scoring and interpretation of the MMPI-2
(Graham, 1999).
Graham (1999) asserts that T scores below 40 on scale K may be indicative of a
wide range of response styles. For example, such low scores could be indicative of an
attempt to fake bad or exaggerate symptoms, acute psychotic disorganization or
confusion, an overly critical view of self or others, lack of insight, social conformity or
over-compliance with authority, general suspiciousness or cynicism, or social
awkwardness. Scores on scale K between 40 and 55 are generally thought to indicate the
response style of an individual who is generally well-adjusted and possesses a balanced
view of one's positive and negative characteristics. Scores over 55 suggest a defensive
response style, with scores in the 55 to 65 range suggesting defensiveness, an attempt to
appear controlled and effective, intolerance, lack of insight, or an above-average level of
ego strength (provided the test taker is not otherwise judged to be psychologically
disturbed). Scores greater than 65 may be more specifically linked to attempts to fake
good (Graham, 1999).
There are also several other scales that have been developed to measure
underreporting on the MMPI-2, though they typically enjoy less coverage in the literature
than the frequently studied L and K scales (Graham, 1999). The Superlative, or S scale,
was developed to identify individuals who present themselves as moral, responsible, and
free from psychological problems. The recommended cutoff score for determining honest
responders from those faking good is a raw score of 29 (T= 54). Based on his review of
the literature, Graham (1999) concluded that in nonclinical settings the index may
significantly add incremental validity to the K scale in determining honest versus faking
good response styles, but that it does not appear to be effective at identifying psychiatric
patients who fake good.
The Positive Malingering (Mp) scale is made up of a selection of items that were
endorsed in the opposite direction by participants instructed to fake good than by
participants instructed to respond honestly or to fake bad, with a higher score indicating
faking good. One study (Bagby, Rogers, Buis, & Kalemba, 1994) found Mp to be more
effective than L or K at differentiating honest from faking good response sets in a sample
of undergraduate volunteers.
The Edwards Social Desirability (Esd) scale consists of 10 expert-rated items
believed to reflect socially desirable responding. One study reported incremental validity
over L and K with Esd in a simulation population (Bagby et al., 1997).

The Wiggins Social Desirability (WSD) scale consists of 40 items selected based
on their endorsement by research participants instructed to respond in a socially desirable
manner. Baer and colleagues (1995) found that WSD contributed incremental validity
over L and K in a sample of undergraduate participants.
The Other Deception (Od) scale is made up of the subset of items from both the
Mp and WSD scales that possessed the best item-total correlations. Bagby and colleagues
(1997) found incremental validity for this scale over L and K in their simulation study
with a student sample.
More broadly, Bagby and colleagues (1999) found that a composite raw score
combining the WSD and S scale scores better discriminated underreporters in a sample of
child custody litigants than L and K. In an earlier study comparing groups of students and
psychiatric patients, Bagby and colleagues (1997) found the Od and S scales to be most
effective at distinguishing between honest and faking good students, Esd and L scales
most effective at distinguishing between honest patients and those instructed to suppress
their symptoms, and WSD most effective at distinguishing between honest students and
patients faking good. Similarly, Baer and colleagues (1995) found incremental validity
over L and K when adding WSD and S. In a separate study (Baer, Wetter, & Berry,
1995), Baer reported that WSD was more resistant to the effects of coaching than the
other underreporting scales.
Baer and Miller (2002) recently published a meta-analysis of empirical studies
evaluating the various underreporting scales on the MMPI-2. They found the WSD scale
to be the most resistant to the effects of coaching, and that it also offered the highest
sensitivity, specificity, Negative Predictive Power (NPP), and Positive Predictive Power

(PPP) of the studies reviewed in the meta-analysis. The L scale had high specificity, PPP,
and NPP, but below average sensitivity, while the K scale was average in all 4 categories.
PPP was best for WSD (.75), followed by L and Mp (.72). They also note that coaching
makes underreporting very difficult to detect, though the WSD scale seems most robust.
However, this finding was based on just two studies included in the meta-analysis (Baer
& Sekirnjak, 1997; Baer et al., 1995). They note that studies evaluating incremental
validity were mixed and inconclusive, and that in general different interpretation
strategies produce different mixes of risk of committing either Type I or Type II error, so
considering population characteristics and referral question is important. Overall, the
authors suggest that support for L and K is robust enough to warrant their continued use
as primary indicators of underreporting, but that WSD and S have produced enough
incremental validity in a few studies to warrant additional research. They conclude that L
and K are reasonably effective at detecting uncoached feigners, and that WSD is robust
with coached underreporters. Also, they note that a significant weakness in the available
literature on underreporting is that there are very few known-groups and differential
prevalence designs, and instead an overabundance of studies with university students.
Finally, they also note that in situations with significant incentive for underreporting (e.g.,
personnel selection and child custody settings), it is not clear whether validity scale
elevations are due to concealment of significant problems or to presenting in a socially
desirable fashion.
Study Comparisons of Personality Measure Validity Scales
Comparisons of the MMPI-2 and MCMI-III validity scales. A number of
studies have compared various assessment instruments and evaluated the validity indices
of personality assessment instruments using an established and well-researched
instrument as a criterion measure (see for example Antoni, 2008; Bagby et al., 2002;
Blais, Benedict, & Norman, 1994, 1995; Bollinger, 1998; Bow, Flens, Gould, &
Greenhut, 2006; DeViva & Bloem, 2003; Ganellen, 1996; Grillo, Brown, Hilsabeck, & J.
R. Price, 1994; Hardie, 2005; Lees-Haley, 1992). An early study comparing the validity
indices of two personality measures was conducted by Blais, Benedict, and Norman
(1995). In their study, they compared the validity indices of the MMPI-2 and a previous
edition of Millon's inventory, the MCMI-II, which was the first edition to introduce the
X, Y, and Z Modifying Indices. Essentially, they used the MMPI-2's validity scales as
criterion measures, given the MMPI's long history and well-established validity, to
compare the validity indices of each measure. In their study of inpatient test results, they
found the MCMI-II's Scale X and Scale Z to be highly intercorrelated, although they did
not correlate identically with similar scales on the MMPI-2. They concluded that Scale X
is relatively unidimensional, loading on a defensiveness factor and tapping a construct
similar to that of the MMPI-2's K scale. They suggested that Scale Z is more
multidimensional, detecting both defensiveness and psychopathology. They also reported
that Scale Y (Desirability) appears to load well on a social desirability factor, but that it
also loads heavily on an extraversion factor, seen in its high correlation with the MMPI-
2's Social Introversion (Si) clinical scale.
In a recent study, Morgan, Schoenberg, Dorr, and Burke (2002) updated the work
of Blais and colleagues (1995), comparing various aspects of the validity indices of the
MCMI-III and the MMPI-2 using a sample of inpatient psychiatric patients. In their
study, the modifying indices on the MCMI-III correlated highly with the validity scales

on the MMPI-2, with the exception of the MMPI-2's Fp scale. They noted that the
correlation between the MMPI-2's F scale and the MCMI-III's Scale X is roughly twice
that found between Fp and X. They suggested that this indicates that Fp is less influenced
by psychopathology.
The researchers also found that the MCMI-III's X and Z scales were highly
intercorrelated, which they note was consistent with the findings of Blais et al. (1995).
They suggest that these scales need additional work to increase their psychometric utility.
Morgan and colleagues (2002) also found large negative correlations between the MCMI-
III's Desirability scale (Scale Y) and all of the MMPI-2 's overreport measures, suggesting
that Scale Y is serving its intended purpose to some degree.
Morgan et al. (2002) also compared the MCMI-III's Scale X with several
recommended cutoff scores for the MMPI-2'sF, Fb, and F-K, and this analysis produced
the finding that they reported as most significant: the MCMI-III has a much higher
tolerance for overreport than the MMPI-2. This is based on the observation that the
MCMI-III's Scale X remained valid with their average psychiatric inpatient participant at
or beyond the recommended cutoffs for each of the MMPI-2 overreporting validity scales,
with the exception of F-K. Most notably, Scale X levels remained valid until reaching the
F scale equivalent raw scores of >27 (or T score of 119), which matches the most liberal
recommended cutoff for the MMPI-2 F scale. That is to say, in their sample, MCMI-III
profiles remained valid as measured by Scale X long after they had exceeded cutoff
scores typically observed for the MMPI-2. Additionally, Scale X scores became invalid
well after scores on the MMPI-2's Fp exceeded maximum cutoffs, further demonstrating
the MCMI-III's tolerance for overreporting symptoms.
Although Morgan and colleagues (2002) did not report comparisons of sensitivity
of the underreporting scales of the MMPI-2 and MCMI-III, they did report the
intercorrelations. They reported that MMPI-2's L scale correlated significantly with the
MCMI-III's Y scale at .42, and negatively with the X and Z scales at -.49 and -.45,
respectively. They reported that stronger significant correlations with the K scale of .56
for the Y scale and negative correlations with the X and Z scales of -.81 and -.72,
respectively.
Comparisons of the MMPI-2 and PAI validity scales. Carr, Moretti, and Cue
(2005) compared MMPI-2 and PAI (as well as Child Abuse Potential Inventory and Child
Behavior Checklist) validity scale scores for parents undergoing child custody
evaluations, a differentially prevalent population in which positive self-presentation
would be expected. For the MMPI-2 they focused attention on the L, K, and F scales, and
found frequent significant elevations on the L scale, and smaller elevations on scales K
and F. Using a T score cutoff of 65, 60% of the profiles in their sample were invalid; at a
T score of 70, 49% were invalid. In both cases, elevations on the L scale accounted for
the vast majority of invalid profiles, though up to 20% of profiles also had elevated F and
K scale scores. They further noted that clients with elevated L scale scores tended to have
lower scores on clinical scales, presenting themselves not only as generally less
symptomatic, but particularly less paranoid and socially introverted. Elevated K scale
scores were associated with lower scores on scales measuring hypochondriasis,
conversion hysteria, and social introversion. On the PAI, they found that approximately
18% of profiles reached the invalidating threshold of 92 T on PIM, and none of the
profiles were invalidated based on other validity indices.

Braxton, Calhoun, Williams, and Boggs (2007) compared the validity indices of
the MMPI-2 and the PAI in an archival sample of 219 inpatients and 253 outpatients at a
VA Medical Center who were administered both instruments within 5 days of one another
as part of routine psychological testing. Using standard validity criterion, they found that
the PAI produced fewer invalid profiles than the MMPI-2 for both inpatients (37% versus
63%, respectively) and outpatients (21% versus 47%, respectively), and that this
difference was largely due to measures of negative distortion. On the other hand, they
reported that along the validity indices measuring positive distortion, the instruments were
concordant in 86% of cases. These results were consistent with those reported by LePage,
Mogge, and Sharpe (2001) in their comparison of the validity indices of MMPI-2 and PAI
profiles in a matched sample of 90 pairs of inpatients at a rural psychiatric hospital. They
also noted that when Fp was used instead of the F scale for negative distortion, the
MMPI-2 produced significantly fewer invalid profiles.
Among the incidental findings reported by Braxton et al. (2007) for inpatients, the
PAI's PIM scale correlated significantly with the MMPI's K scale at .61 and L scale at
.30. The PAI's DEF correlated significantly with K at .48 and with L at .25. CDF
correlated negatively with K at -.30 and nonsigificantly with L at .08. (Similar
correlations were reported for the outpatient sample.)
Socially Desirable Responding Model and the MMPI-2, PAI, and MCMI-III
With regard to the measures under review in this study, Paulhus (2002) notes that
the MMPI-2's K scale has been found to load on the Alpha factor, while the L scale has
been found to load, albeit weakly, on the Gamma factor. Additionally, Bagby and
Marshall (2004) factor analyzed MMPI-2 validity scales from an archival sample of 345
university students who took the instrument under standard instructions. They found two
factors. Scales K, S, Esd, and the Positive Mental Health Scale (PMH4) loaded on the
first factor, which they labeled Self-Deception. Scales L, WSD, and Od loaded on the
second factor, which they labeled Impression Management. However, this labeling was
apparently based on the labels assigned to the factor loadings in prior research, not upon
their own evaluation of the factors. Applied to the current revision of Paulhus's model, it
is not entirely clear which aspects of Alpha and Gamma these MMPI-2 scales may be
detecting (i.e., Enhancement versus Denial, Agency versus Communion, or some
constellation of all of these).
Similarly, Strong, Greene, and Kordinak (2002) evaluated several MMPI-2
underreporting scales in light of Paulhus's model of Socially Desirable Responding.
They selected L, WSD, and Mp to represent Impression Management, and K, Esd, and S
to represent Self-Deceptive Positivity. They found that the Impression Management
(corresponding with Gamma) factor is categorical in nature and that scales measuring this
domain may best be interpreted with a specific threshold for either the presence or
absence of the response set. For example, when the threshold is met, the validity of the
profile may be questioned. On the other hand, their analyses supported a dimensional
interpretation for Self-Deceptive Positivity (corresponding with Alpha) scales, signaling
to the interpreter the degree to which the response set is active. This study confirmed
prior findings (Strong, Greene, Hoppe, Johnston, & Olesen, 1999) in which Paulhus's
earlier sequential processing theory of Socially Desirable Responding was applied to
interpretation of MMPI-2 profiles. As in the more recent study, the profiles of child
custody litigants in this sample were found to exhibit a categorical, present or absent,
structure along the conscious Impression Management factor, and a dimensional structure
along the presumably unconscious Self-Deceptive Positivity factor.
Peebles and Moore (1998) evaluated the PAI's PIM and DEF using Paulhus's
Balanced Inventory of Desirable Responding, an instrument built upon Paulhus's original
two-factor model of Socially Desirable Responding, as the criterion measure for positive
impression management. Though Peebles and Moore's analyses did not directly look at
the factor structure of PIM or the Defensiveness index, they reported correlations with
PIM of .747 for Self-Deception and .714 for Impression Management, and correlations
with the Defensiveness index of .716 for Self-Deception and .647 for Impression
Management, suggesting that PIM incorporates both aspects of Socially Desirable
Responding.
A search of the literature was also conducted to identify studies applying
Paulhus's model of SDR to the MCMI-III or its predecessors. This search obtained no
results.
Hypotheses
Goals for the Study
There were two goals for the present study. The first goal of the present research
was to extend previous work by Morgan et al. (2002) and Braxton et al. (2007) in several
ways. First, the researchers attempted to replicate previously reported correlations
between the MMPI-2, MCMI-III, and PAI using data from a different sample (residential
substance abuse treatment patients as opposed to inpatient and outpatient psychiatric
patients) and with a focus on positive (rather than negative) response distortion. Second,

the researchers broadened the cross-test comparisons by examining all three measures at
one time.
The second goal was to examine these instruments in light of Paulhus's (2002)
model of Socially Desirable Responding. First, the factor structure of the major
underreporting indices of the MCMI-III, PAI, and MMPI-2 was examined in relation to
Paulhus's model. Second, the ability of the underreporting measures to predict group
membership in light of the model was evaluated.
Hypothesis Set One: Scale Intercorrelations
Consistent with Morgan et al. (2002), it was predicted that the positive distortion
validity indices of the MMPI-2 and MCMI-III would be significantly correlated;
specifically, positive correlations between the MMPI-2's L scale and the MCMI-III's Y
scale, and negative correlations with the X and Z scales. It also was predicted that there
would be significant positive correlations between the MMPI's K scale and the MCMI-
III's Y scale, and negative correlations with the X and Z scales.
Consistent with Braxton et al. (2007), it also was predicted that the PAI's PIM
scale and DEF would each be positively and significantly correlated with the MMPI-2's
K scale, and more modestly with the L scale, and that the correlations would be slightly
stronger for PIM than DEF. Drawing inferences about the potential intercorrelations
between the MCMI-III and PAI based on the correlations reported for each with MMPI-2
scales, it was predicted that the PAI's PIM and DEF would be significantly correlated
with the MCMI-III's Y scale, and negatively correlated with both the X and Z scales.

Hypothesis Set Two: Factor Structure
With regard to Socially Desirable Responding, it was predicted that exploratory
factor analyses would confirm the factor structure reported by Paulhus (2002) and Bagby
and Marshall (2004), and the MMPI-2's K scale would load on the Alpha factor and the L
scale on the Gamma.
Based on intercorrelations reported by Morgan and colleagues (2002), it was
expected that the MCMI-III's Y and Z scales would load on Alpha due to their slightly
stronger correlation with the MMPI-2's K scale than its L scale.
It was unclear how the PAI's PIM and DEF would load. Braxton and colleagues
(2007) reported significant correlations for both indices with K and moderate correlations
for both with L. Conversely, Peebles and Moore (1998) reported high positive
correlations for PIM and Defensiveness with both scales of Paulhus's BIDR. This
suggests that these measures capture aspects of both Alpha and Gamma. In light of
Paulhus's (2002) assertion that a key distinction between Alpha and Gamma is a
personality difference in which the former represents the Egoistic Bias tendency to view
oneself as more competent and the latter a tendency to view oneself without moral flaws,
and the former the Moralistic Bias tendency to manage impressions to enhance the
appearance of competence and the latter to deny faults and avoid conflict, it was predicted
that the PAI's Dominance interpersonal style (DOM) would load on the Alpha factor and
the Warmth interpersonal style (WRM) would load on the Gamma factor.
Additionally, data were evaluated in light of both the personality trait aspect of
Paulhus's Socially Desirable Responding model, as well as the conscious/unconscious
dimension. It was expected that a factor structure in which measures of normal
personality load with standard measures of underreporting as predicted above would
allow for confirmation of Paulhus's theorized constellations of attributes associated with
each factor. The finding reported by Baer and Wetter (1997) that uncoached intentional
faking good in a sample of college students resulted in higher WRM scores than for either
the standard instruction or the coached faking good condition was expected to inform
interpretation of whether a conscious/unconscious (or intentional/unintentional)
dimension could be detected based on factor loadings.
Hypothesis Set Three: Prediction of Group Membership
Though an archival sample of patients was utilized in this study, the participants
fell naturally into two groups. One group of the patients were referred (often by an
employee assistance program) for evaluation of suspected problem substance use; the
other half were individuals referred specifically for treatment. Based on clinical
experience with the population, it was known that members of the evaluation group
typically had significant motivation to present favorably. Therefore, it was expected that
the evaluation group's scores on measures of underreporting would exhibit more
defensiveness than the treatment group. Specifically, the patients in the evaluation group
were expected to have higher average scores on underreporting and relevant personality
scales than members of the treatment group, and these differences would be interpreted in
light of the SDR model. Additional analysis would determine how well the various
positive distortion indices predict membership in either the treatment or the evaluation
groups. Because comparisons were to be made between indices based on their loadings
on the factors derived in the factor analysis, it was not practical to formulate meaningful
hypotheses before the factor loadings of each index were known.

Hypothesis Set Four: Cutoff Scores
In keeping with the hypotheses regarding group differences, it was expected that
there would be higher percentages of patients in the evaluation group whose scores on
underreporting measures fall in ranges considered to represent defensiveness, as reviewed
above, than in the treatment group. The planned analyses focus on the five most
commonly used underreporting indices: L, K, and S from the MMPI-2; PIM from the
PAI; and Y from the MCMI-III. It was expected, in keeping with results reported by
Carr, Moretti, and Cue (2005), that the MMPI-2's L scale would produce more cases with
questionable validity than either K or the PAI's PIM scale. In light of stronger scale
intercorrelations between the MCMI-III's Y scale and MMPI-2's K scale than between Y
and L (as reported by Morgan et al. 2002), it was expected that MCMI-III's scale Y
would return fewer cases of questionable validity than the L scale. It was unknown how
S and PIM would perform.

CHAPTER TWO
METHOD
Participants
The data for this study were derived from clinical archives of 359 individuals who
were referred from a residential substance abuse treatment center in the south central
United States. They completed two or more of the MMPI-2, MCMI-III, and PAI as part
of a standard psychodiagnostic evaluation. The referring treatment center is a private
facility offering 5-day evaluation services and up to 90-day treatment programs.
Approximately two-thirds of the sample consisted of individuals participating in a 5-day
evaluation; the other one third of the sample consisted of individuals entering treatment.
The sample was 43% female and 57% male. Because the referring treatment facility is
privately operated and does not accept public funding such as Medicare or Medicaid,
patients are typically more affluent and have more education than patients in publically
funded treatment facilities. The mean years of education for this sample is 17.4, and over
74% of the sample work in the healthcare field. The mean age of participants is 41 years
(SD = 12).
Because the referral questions fall into two separate categories—treatment
planning versus evaluation—the participants in each group have different motives and
orientations toward testing. Based on clinical experience with the population, evaluation
37

38
patients, on the whole, are more likely than treatment group patients to be faking good.
These patients typically have been referred for evaluation by professional boards or other
employee assistance programs. As such, they have considerable motivation to present
favorably. Patients already admitted for treatment typically exhibit less motivation to
present favorably, though some level of defensiveness and positive distortion is still
expected. Despite the different referral questions, all patients were administered the
psychological tests during their first week at the center.
Measures
The measures for this study are the MMPI-2, MCMI-III, and the PAI. All three
instruments and their relevant validity scales have been reviewed in the previous literature
review. The 12th edition of SPSS® and Microsoft® Office Excel® 2007 were used for all
analyses.
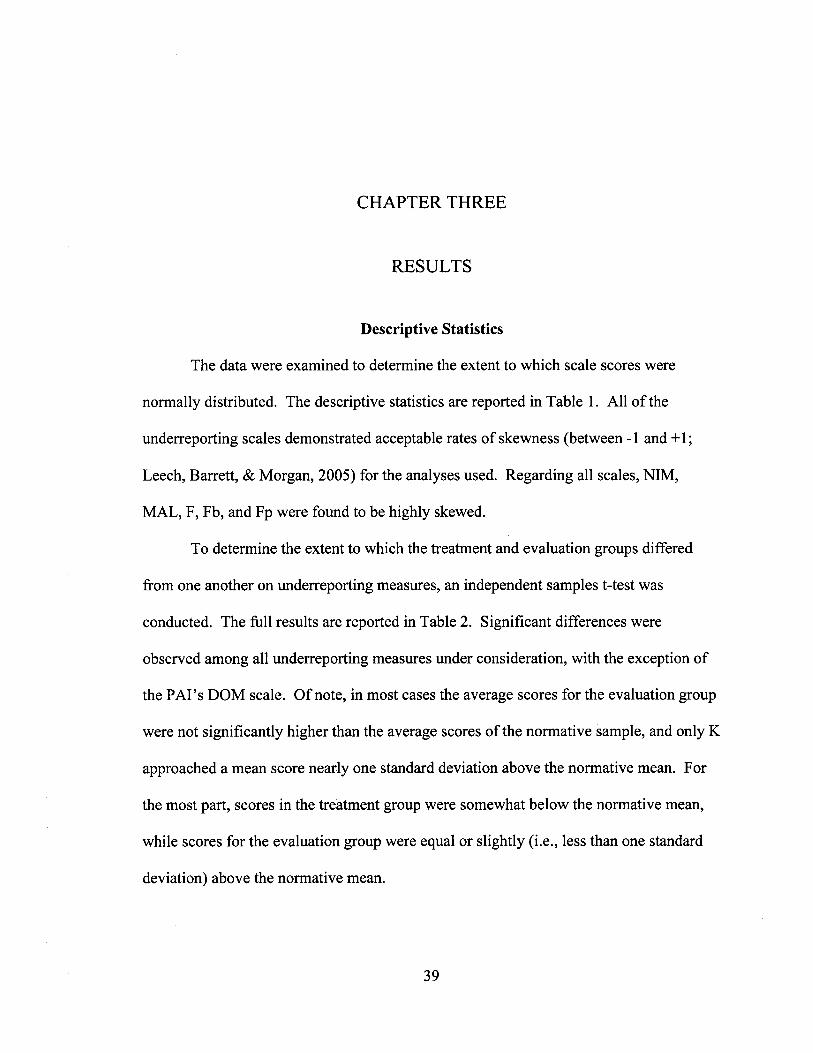
CHAPTER THREE
RESULTS
Descriptive Statistics
The data were examined to determine the extent to which scale scores were
normally distributed. The descriptive statistics are reported in Table 1. All of the
underreporting scales demonstrated acceptable rates of skewness (between -1 and +1;
Leech, Barrett, & Morgan, 2005) for the analyses used. Regarding all scales, NIM,
MAL, F, Fb, and Fp were found to be highly skewed.
To determine the extent to which the treatment and evaluation groups differed
from one another on underreporting measures, an independent samples t-test was
conducted. The full results are reported in Table 2. Significant differences were
observed among all underreporting measures under consideration, with the exception of
the PAI's DOM scale. Of note, in most cases the average scores for the evaluation group
were not significantly higher than the average scores of the normative sample, and only K
approached a mean score nearly one standard deviation above the normative mean. For
the most part, scores in the treatment group were somewhat below the normative mean,
while scores for the evaluation group were equal or slightly (i.e., less than one standard
deviation) above the normative mean.
39

Table 1
Descriptive Statistics for All Scales
Scale N Min Max Mean SD Skewness Kurtosis
NIM
PIM
DOM
WRM
DEF
CDF
MAL
RDF
L
F
Fb
Fp
K
S
WSD
Si
X
Y
Z
HIST
COMP
349 44
349 15
110
75
349 15 74
349 17 72
349 31 70
348 20 85
349 44 84
348 20 82
84
120
120
120
345 30 80
284 30 77
284 30 78
345 30 82
314 0 100
314 5 100
314 0 98
311 0 120
311 2 116
345 34
345 37
344 42
284 42
50.81
47.69
49.56
51.96
46.34
39.15
49.81
44.45
54.10
54.76
56.46
50.97
56.93
53.71
51.39
49.33
46.74
65.75
42.00
61.98
61.63
11.06
13.37
9.96
10.29
11.00
11.74
8.95
9.54
10.49
15.51
16.96
12.57
11.60
12.02
10.13
11.12
23.66
20.02
29.96
22.35
23.11
2.57
-0.38
-0.18
-0.32
0.17
0.38
1.57
0.54
0.48
2.02
1.79
2.56
-0.39
-0.13
0.16
0.79
0.22
-0.99
-0.20
-0.20
-0.21
7.68
-0.58
0.16
0.04
-0.97
0.02
2.24
0.92
-0.09
4.86
2.79
8.59
-0.53
-0.99
-0.50
0.05
-0.76
0.56
-1.18
0.04
-0.27
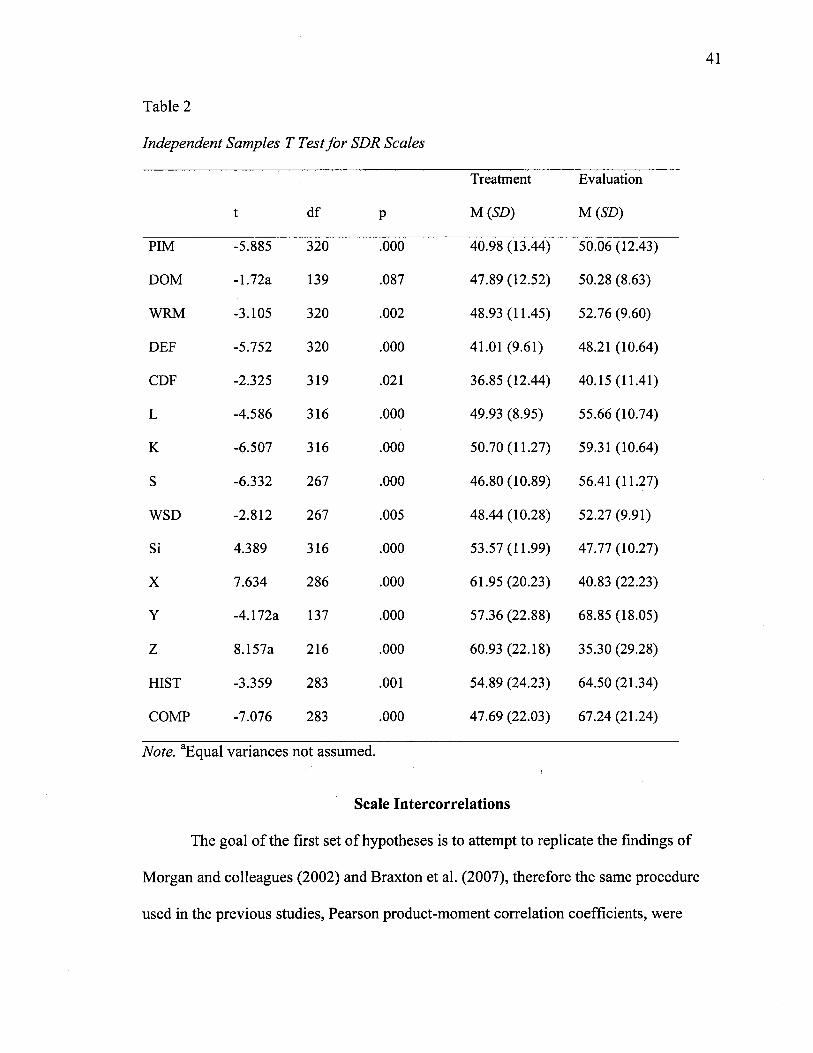
Table 2
Independent Samples T Test for SDR Scales
t df P
Treatment
M (SD)
Evaluation
M(SD)
PIM -5.885 320 .000 40.98 (13.44) 50.06 (12.43)
DOM -1.72a 139 .087 47.89 (12.52) 50.28 (8.63)
WRM -3.105 320 .002 48.93(11.45) 52.76 (9.60)
DEF -5.752 320 .000 41.01 (9.61) 48.21 (10.64)
CDF -2.325 319 .021 36.85 (12.44) 40.15 (11.41)
L -4.586 316 .000 49.93 (8.95) 55.66 (10.74)
K -6.507 316 .000 50.70(11.27) 59.31 (10.64)
S -6.332 267 .000 46.80(10.89) 56.41 (11.27)
WSD -2.812 267 .005 48.44 (10.28) 52.27 (9.91)
Si 4.389 316 .000 53.57(11.99) 47.77 (10.27)
X 7.634 286 .000 61.95 (20.23) 40.83 (22.23)
Y -4.172a 137 .000 57.36 (22.88) 68.85 (18.05)
Z 8.157a 216 .000 60.93 (22.18) 35.30 (29.28)
HIST -3.359 283 .001 54.89 (24.23) 64.50 (21.34)
COMP -7.076 283 .000 47.69 (22.03) 67.24 (21.24)
Note. "Equal variances not assumed.
Scale Intercorrelations
The goal of the first set of hypotheses is to attempt to replicate the findings of
Morgan and colleagues (2002) and Braxton et al. (2007), therefore the same procedure
used in the previous studies, Pearson product-moment correlation coefficients, were

computed to examine the strength of the relationships between the various scales.
Fisher's z transformations were conducted to determine whether correlations obtained in
the current study differ significantly from those reported by Morgan and colleagues and
Braxton and colleagues.
The correlation coefficients for the analyzed scales are reported in Table 3. All
hypotheses regarding specific scale intercorrelations were supported. Specifically, L and
K were both significantly correlated with Y and negatively with X and Z. L and K also
were significantly correlated with PIM and DEF, with stronger correlations observed with
PIM than with DEF. The largest overall correlations were observed between K and S, X
and Z, F and Fb, and (negatively) Z with S and K.
For the underreporting indices of the MMPI-2, large significant correlations were
obtained for L with K, S, and WSD. WSD correlated significantly but modestly with K
and S. The relationship between K and S was particularly strong. For the underreporting
indices of the PAI, a large significant correlation was observed between PIM and DEF,
while a small significant correlation was found with CDF. A moderate significant
relationship was observed between DEF and CDF. For the MCMI-III, large negative
correlations were observed for Y with both X and Z.
Between measures of underreporting, the largest correlations were observed
between PIM and S, PIM and K, PIM and Y, and PIM and L, respectively. Medium to
small correlations were found, from larger to smaller, for K and Y, DEF and L, DEF and
WSD, PIM and WSD, L and Y, WSD and S, L and CDF, and Y and CDF. Overall, the
smallest correlations were found with CDF, which correlated modestly with DEF, WSD,
L, PIM, and Y, and not at all with K or S. Small to medium correlations were also

observed between CDF and several measures of overreporting, including RDF, MAL,
and NIM from the PAI, and Fp from the MMPI-2, at values similar to the correlations
observed with underreporting indices. This suggests that CDF may not be a pure
measure of underreporting. Additionally, a strong negative correlation was observed
between Y and Si, consistent with Blais and colleague's (1995) assertion that Y may
better reflect extraversion than social desirability.
With regard to personality measures, the largest overall correlation between a
personality measure and any other measure was observed between Si and Y (negatively).
Additionally, large negative correlations were observed for Si with HIST, S, and K.
Large negative correlations were found between Si and DEF, PIM, WRM, and DOM.
Large positive correlations with Si were observed in Z, X, Fb, and F. Similarly, a large
correlation was observed for HIST with Y and with WRM. A large correlation also was
found for Y with DOM and WRM.
As noted above, several overreporting scales exhibited a degree of skewness
which violates the assumptions of normality required for Pearson's product-moment
correlations. Therefore, additional analysis was conducted for these scales using
Spearman's rho. Table 4 summarizes the results. Among measures of overreporting, the
largest correlations were observed between Z and X with Fb. Large correlations were
also observed for Z and X with F and NIM. Medium correlations were found between
NIM and F, Fb, and Fp, as well as Fp with X and Z. Small or no correlations were
observed for RDF and MAL with all other measures of overreporting.

44
Table 4
Scale Intercorrelations (Pearson's)
NIM PIM DOM WRM DEF CDF
NIM
PIM
DOM
WRM
DEF
CDF
MAL
RDF
L
F
Fb
Fp
K
S
WSD
Si
X
Y
Z
HIST
COMP
1
-.576**
-.240**
_ 34-7**
-.447**
.153**
.282**
.140**
-.265**
.602**
.677**
.517**
-.596**
-.565**
-.093
.489**
.670**
-.530**
.603**
-.416**
-.512**
-.576**
1
.257**
.392**
.764**
.198**
-.028
.023
.561**
-.508**
-.565**
-.275**
.649**
.722**
.364**
-.545**
-.675**
.584**
-.681**
.377**
.648**
-.240**
.257**
1
.377**
.413**
179**
.131*
-.133*
.104
-.225**
-.204**
-.066
.218**
I93**
.305**
-.566**
-.231**
.520**
-.295**
.423**
. 2 62 * *
-.347**
.392**
3 7 7 * *
1
.348**
.036
.086
-.345**
.227**
-.397**
-.348**
-.240**
.383**
.385**
.351**
-.574**
-.314**
.510**
-.358**
.570**
.256**
-,447**
.764**
.413**
.348**
1
.344**
.191**
.096
.461**
-.397**
-.454**
-.119*
.530**
.600**
.416**
-.561**
-.562**
.555**
-.614**
.304**
.539**
.153**
.198**
279**
.036 3 4 4 * *
1
.293**
.337**
.232**
.089
.055
.282**
-.048
.014
.251**
-.111*
.014
.115*
-.054
.048
.006
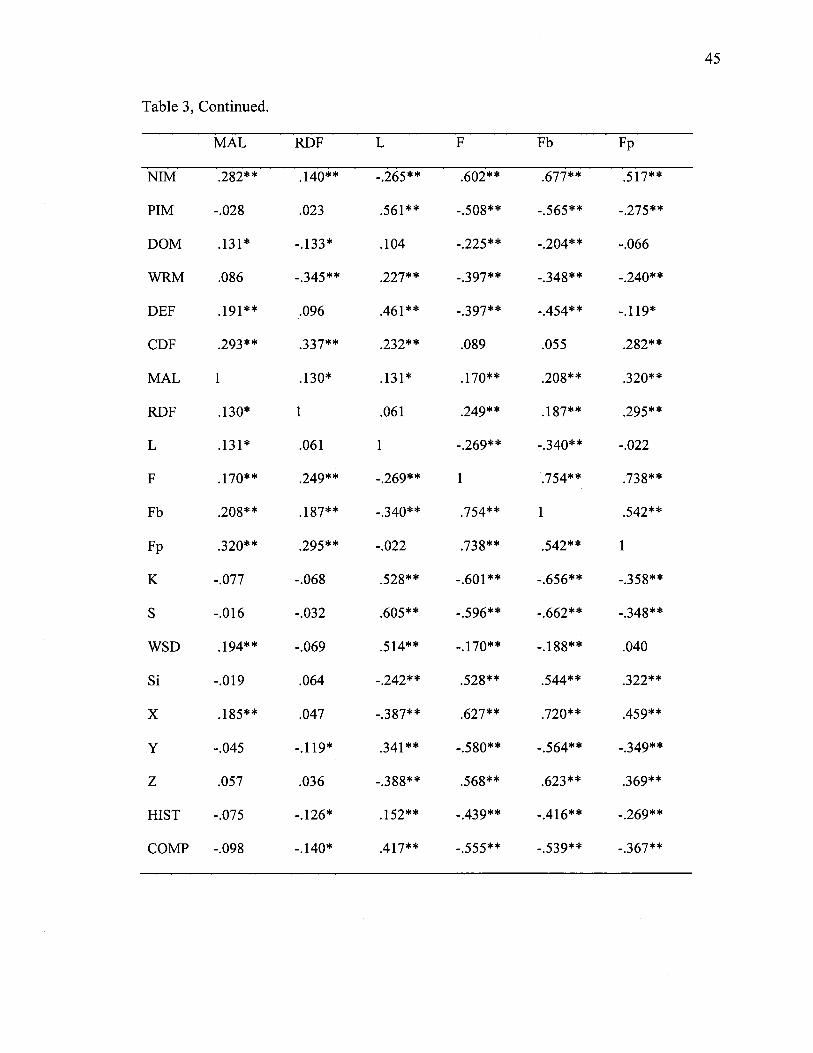
Table 3, Continued.
MAL RDF L F Fb Fp
NIM .282** .140** -.265** .602** .677** 517**
PIM -.028 .023 .561** -.508** -.565** -.275**
DOM .131* -.133* .104 -.225** -.204** -.066
WRM .086 -.345** .227** - 397** -.348** -.240**
DEF 192** .096 .461** -.397** -.454** -.119*
CDF 293** .337** .232** .089 .055 .282**
MAL 1 .130* .131* .170** .208** .320**
RDF .130* 1 .061 .249** .187** .295**
L .131* .061 1 -.269** -.340** -.022
F .170** .249** -.269** 1 .754** .738**
Fb .208** .187** -.340** .754** 1 542**
Fp .320** 295** -.022 .738** .542** 1
K -.077 -.068 .528** -.601** -.656** -.358**
S -.016 -.032 .605** -.596** -.662** -.348**
WSD 294** -.069 .514** -.170** -.188** .040
Si -.019 .064 -.242** .528** .544** .322**
X .185** .047 -.387** .627** .720** .459**
Y -.045 -.119* .341** -.580** -.564** -.349**
Z .057 .036 -.388** .568** .623** .369**
HIST -.075 -.126* .152** -.439** -.416** -.269**
COMP -.098 -.140* 417** -.555** -.539** -.367**
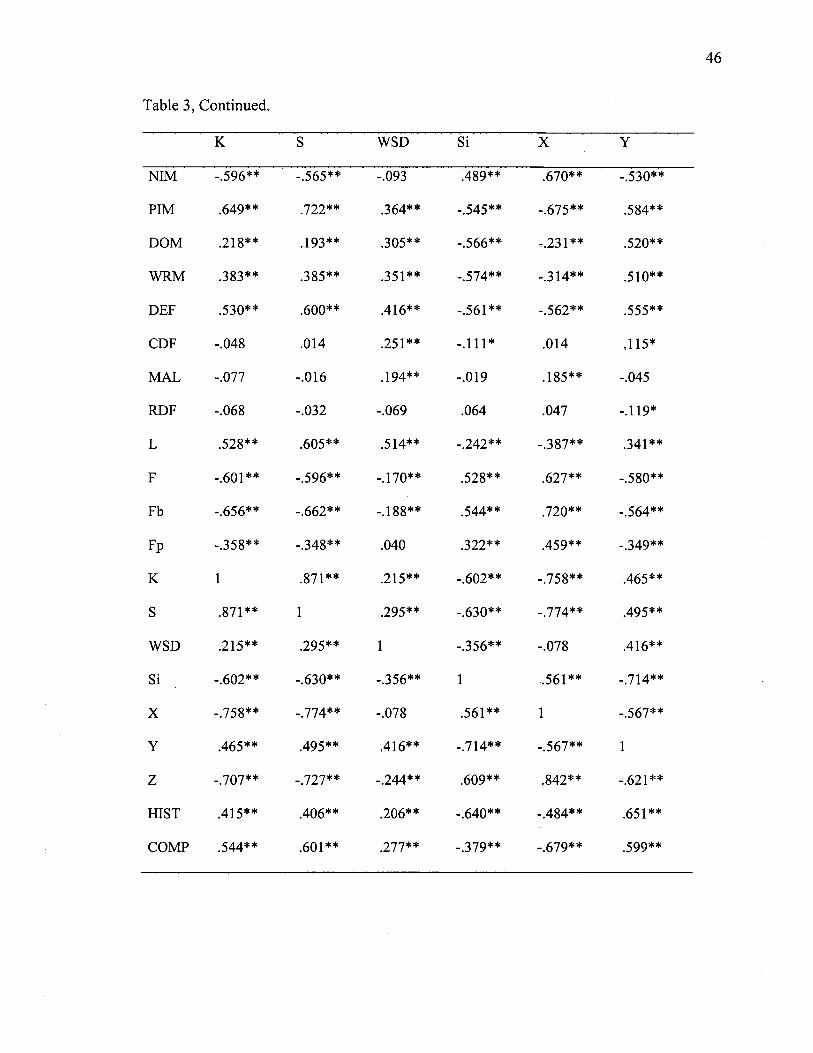
46
Table 3, Continued.
K WSD Si X
NIM
PIM
DOM
WRM
DEF
CDF
MAL
RDF
L
F
Fb
Fp
K
S
WSD
Si
X
Y
Z
HIST
COMP
-.596**
.649**
.218**
.383**
.530**
-.048
-.077
-.068
.528**
-.601**
-.656**
-.358**
1
.871**
.215**
- .602**
-.758**
.465**
-.707**
.415**
.544**
-.565**
.722**
293**
.385**
.600**
.014
-.016
-.032
.605**
-.596**
- .662**
-.348**
.871**
1
.295**
-.630**
-.774**
.495**
-.727**
.406**
.601**
-.093
.364**
.305**
.351**
.416**
.251**
194**
-.069
.514**
170**
188**
040
215**
295**
1
-.356**
-.078
.416**
-.244**
.206**
.277**
.489**
-.545**
-.566**
-.574**
-.561**
-.111*
-.019
.064
-.242**
.528**
.544**
.322**
-.602**
-.630**
-.356**
1
.561**
-.714**
.609**
-.640**
-.379**
.670**
-.675**
-.231**
-.314**
-.562**
.014
.185**
.047
-.387**
.627**
.720**
.459**
-.758**
. 774**
-.078
.561**
1
-.567**
.842**
-.484**
-.679**
-.530**
.584**
.520**
.510**
.555**
.115*
-.045
-.119*
.341**
-.580**
-.564**
-.349**
.465**
.495**
.416**
. 724**
-.567**
1
-.621**
.651**
.599**

47
Table 3, Continued.
Z HIST COMP
NIM .603** -.416** -.512**
PIM -.681** 3 7 7 * * .648**
DOM -.295** .423** .262**
WRM -.358** .570** .256**
DEF -.614** .304** .539**
CDF -.054 .048 .006
MAL .057 -.075 -.098
RDF .036 -.126* -.140*
L -.388** .152** 427**
F .568** -.439** -.555**
Fb .623** -.416** -.539**
F p .369** -.269** -.367**
K -.707** .415** .544**
S -.727** .406** .601**
WSD -.244** .206** .277**
Si .609** -.640** -.379**
X .842** -.484** -.679**
Y -.621** .651** .599**
Z 1 -.467** -.617**
HIST -.467** 1 .365**
COMP -.617** .365** 1
Note, n (PAI x PAI) = 349; n (MMPI-2 x MMPI-2) = 345; n (MCMI-III x MCMI-III) = 314; n (PAI x MMPI-2) = 336; n (PAI x MCMI-III) = 305; n (MMPI-2 x MCMI-III) = 312.** p < 0.01 (2-tailed), * p< 0.05 (2-tailed).

48
Table 4
Scale Intercorrelations (Spearman's)
NIM MAL Fb Fp
NIM
PIM
DOM
WRM
DEF
CDF
MAL
RDF
L
F
Fb
Fp
K
S
WSD
Si
X
Y
Z
HIST
COMP
1
- .622* *
.197**
-.273**
-.531**
.042
.075
.025
-.339**
.472**
.593**
.305**
-.625**
-.633**
-.132*
.462**
.678**
-.431**
.688**
-.357**
-.532**
.075
.025
.110*
.083
.208**
.294**
1
.139**
.150**
.100
.114*
.272**
-.034
.022
.204**
-.084
.132*
.020
.050
-.064
-.103
.472**
-.498**
-.254**
-.359**
-.450**
-.080
.100
.126*
- .228* *
1.000
.679**
.525**
-.540**
-.557**
. 194**
.550**
.605**
-.563**
.624**
-.398**
-.564**
.593**
-.636**
-.259**
-.338**
-.553**
-.113*
.114*
.082
-.375**
.679**
1
.390**
-.704**
-.732**
-.232**
.591**
.748**
-.521**
.737**
-.395**
-.597**
.305**
-.150*
-.110
-.129*
-.096
.224**
.272**
.145*
.109
.525**
.390**
1
-.226**
-.238**
.105
.283**
.362**
-.253**
.336**
-.205**
-.273**
.688**
-.694**
-.285**
-.353**
-.635**
-.081
.050
.016
-.403**
.624**
.737**
.336**
-.720**
-.737**
-.242**
.624**
.877**
-.610**
1
-.465**
-.650**
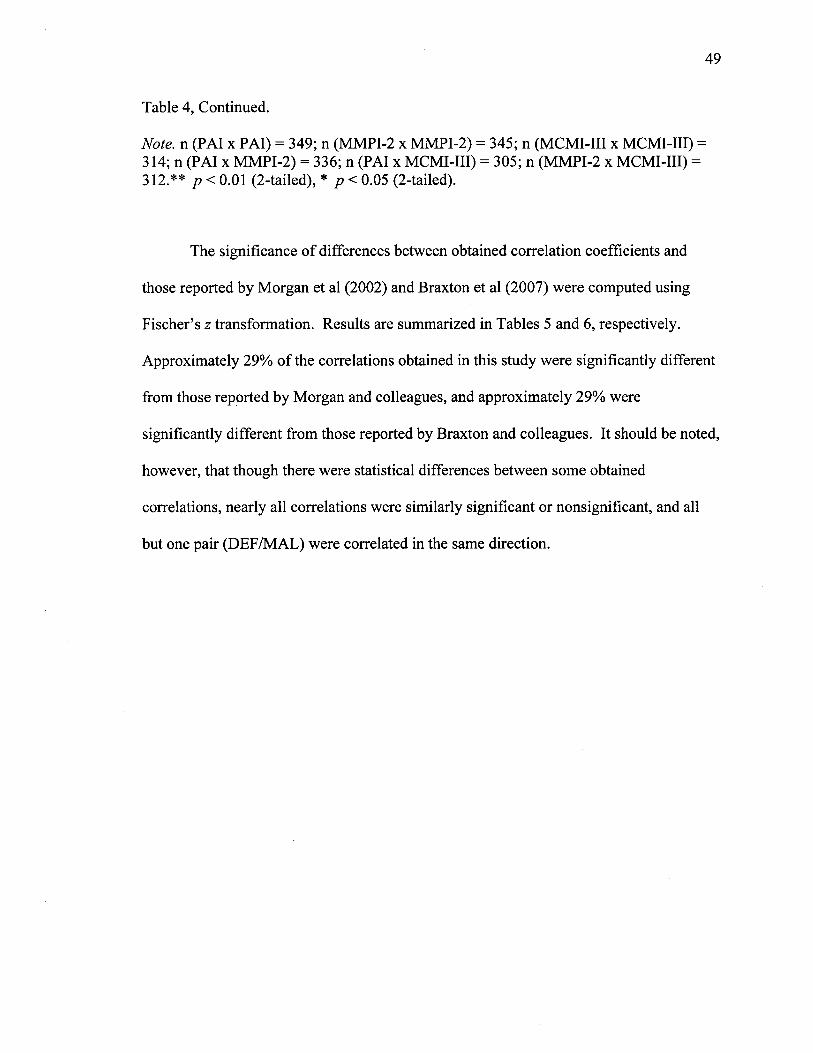
49
Table 4, Continued.
Note, n (PAI x PAI) = 349; n (MMPI-2 x MMPI-2) = 345; n (MCMI-III x MCMI-III) = 314; n (PAI x MMPI-2) = 336; n (PAI x MCMI-III) = 305; n (MMPI-2 x MCMI-III) = 312.** p < 0.01 (2-tailed), * p < 0.05 (2-tailed).
The significance of differences between obtained correlation coefficients and
those reported by Morgan et al (2002) and Braxton et al (2007) were computed using
Fischer's z transformation. Results are summarized in Tables 5 and 6, respectively.
Approximately 29% of the correlations obtained in this study were significantly different
from those reported by Morgan and colleagues, and approximately 29% were
significantly different from those reported by Braxton and colleagues. It should be noted,
however, that though there were statistical differences between some obtained
correlations, nearly all correlations were similarly significant or nonsignificant, and all
but one pair (DEF/MAL) were correlated in the same direction.

50
Table 15
MMPI-2 and MCMI-III correlation comparisons with Morgan et al. (2002)
Scale Significant Difference? Scale Significant Difference?
L/F No Fb/Fp No
L/K No Fb/X No
L/Fb No Fp/X No
L/Fp No Fp/Y No
L/X No Fp/Z No
L/Y No X/Z No
L/Z No F/Fb Yes
F/K No F/Fp Yes
F/X No F/Y Yes
K/Fb No F/Z Yes
K/Fp No Fb/Y Yes
K/X No Fb/Z Yes
K/Y No X/Y Yes
K/Z No Y/Z Yes

Table 2
MMPI-2 and PAI correlation comparisons with Braxton et al. (2007)
Scales Significant Scales
Difference?
Significant Scales
Difference?
Significant
Difference?
L/F
L/K
L/Fb
L/Fp
F/K
F/Fp
K/Fb
K/Fp
Fb/Fp
No
No
No
No
No
No
No
No
No
NIM/PIM No
NIM/DEF No
NIM/RDF No
NIM/FB No
NIM/FP No
NIM/K No
NIM/L No
PIM/DEF No
PIM/CDF No
PIM/RDF No
PIM/F
PIM/FB
PIM/FP
PIM/K
DEF/RDF
DEF/L
DEF/F
DEF/FB
DEF/FP
DEF/K
CDF/MAL
CDF/FP
MAL/RDF
MAL/FP
RDF/F
RDF/L
RDF/FB
RDF/FP
RDF/K
No
No
No
No
No
No
No
No
No
No
No
No
No
No
No
No
No
No
No
F/Fb
NIM/CDF
NIM/MAL
NIM/F
PIM/MAL
PIM/L
DEF/CDF
DEF/MAL
CDF/RDF
CDF/L
CDF/F
CDF/FB
CDF/K
MAL/L
MAL/FB
MAL/K
MAL/F
Yes
Yes
Yes
Yes
Yes
Yes
Yes
Yes
Yes
Yes
Yes
Yes
Yes
Yes
Yes
Yes
Yes
Factor Structure
A principal components analysis with promax rotation was conducted on the
positive distortion scales of all three measures, as well as on relevant personality-related
scales (Si, HIST, COMP, DOM, and WRM) based on their theoretical relationships with
SDR as reviewed above, in order to examine the underlying structure of the scales. In
addition, Z was included because of its strong negative correlation with several measures
of underreporting (Table 4). Promax rotation was used because measures of positive
distortion are theorized to be intercorrelated (Paulhus, 2002). Scales included in the
analysis included the underreporting indices of the PAI (PIM and DEF), select
underreporting indices of the MMPI-2 (L, K, S, and WSD, and scales Y and Z of the
MCMI-III. In addition, several direct and indirect measures of normal personality were
included in the analysis, including DOM and WRM from the PAI, Si from the MMPI-2,
and HIST and COMP from the MCMI-III. One measure of underreporting, the PAI's
CDF, was omitted from the primary analysis, because it was found to correlate
indiscriminately with measures of both overreporting and underreporting, based on small
and medium significant correlations (see Table 3).
The principal components analysis with promax rotation extracted three factors
with eigenvalues greater than 1.0. Examination of the scree plot suggested either three or
four factors. Therefore additional analysis was conducted using a parallel analysis
technique with "dummy" variables of random values (Ledesma & Valero-Mora, 2007).
This analysis favored the retention of three factors.
The first factor is anchored by S and K, and it also includes Z (loading
negatively), COMP, and DEF. This factor corresponds to the previously identified
Gamma factor of SDR (Paulhus, 2002). It includes measures characteristic of a denial of
problems as well as COMP, a correlate of the normal personality trait Conscientiousness
(Saulsman & Page, 2004), which Paulhus identified as loading on the Gamma factor of
SDR. It is labeled Self-Deceptive Denial, in keeping with Paulhus's nomenclature.
The second factor is anchored by DOM and HIST, and includes WRM, Si
(loading negatively, in the direction of extraversion), and Y. It includes measures
characteristic of a tendency to present oneself in a more positive light, as well as Si and
HIST, measures highly correlated with the normal personality trait Extraversion
(Saulsman & Page). This factor is labeled Self-Deceptive Enhancement, in keeping with
Paulhus's model, and is consistent with the Alpha factor identified in previous iterations
of the model.
The third factor is anchored by WSD and also includes L, which also loaded
moderately on the first factor. This factor is consistent with the subfactor of Gamma
labeled recently by Paulhus as Communion Management, identified in a previous factor
analysis (Bagby & Marshall, 2004) as Impression Management. In keeping with
Paulhus's latest nomenclature, the construct has been labeled Communion Management.
The factor loadings are presented in Table 7.
As hypothesized, Y, Z, and DOM all loaded on an Alpha factor, Self-Deceptive
Enhancement, and L loaded on Gamma factors, Self-Deceptive Denial and Communion
Management. Unexpectedly, and inconsistent with previous research, K loaded on a
Gamma factor, Self-Deceptive Denial. Also unexpectedly, WRM loaded on an Alpha
factor (Self-Deceptive Enhancement). Furthermore, due to its modest loading on the
Communion Management factor, it is not clear that WRM provided much utility in
helping to distinguish between intentional and unintentional distortion.
As noted above, the third factor, Communion Management, appears to best
capture the more overt defensiveness. Additional principal components analyses were
performed to include CDF, which also loaded on and anchored the Communion
Management factor. In this iteration, L's loading on the third factor decreased slightly,
while its affinity for the first factor increased slightly. Because CDF was moderately
correlated with Fp, an additional analysis was conducted to include Fp. Surprisingly, Fp
loaded strongly and positively on the third factor. This resulted in an additional decrease
in L's loading on the third factor and increase in loading on the first factor. Other scales'
loadings remained virtually the same. This strengthens the assertion that the third factor
captures an intentional sort of distortion, and with Fp this factor may represent a global
intentional distortion, rather than defensiveness per se.

55
Table 15
Factor Loadings
Self-Deceptive Self-Deceptive Communion
Denial Enhancement Management
s .961
K .946 -.141
Z -.835 -.160 .155
PIM .778 .180
COMP .726
DEF .528 .149 .309
DOM -.271 .830 .205
HIST .147 .802 -.220
WRM .713 .107
Si -.298 -.712
Y .258 .652 .109
WSD -.188 .229 .912
L .533 -.308 .613
Note. Factor loadings < .10 have been omitted.
Prediction of Group Membership
The ability of the scales to predict membership in either the treatment or the
evaluation group was tested using discriminant function analysis. Initially, a discriminant
function was calculated for all of the SDR scales. Because DOM did not significantly
vary between the two groups (see Table 2), it was omitted from the analysis.
Additionally, due to missing values, 112 cases were omitted, resulting in 247 cases
considered in the analysis. One function was generated and was significant, A=.802, chi
square (12,7V=247)=50.17, p<.001. Treatment condition accounted for 19.7% of function
variance. Correlation coefficients with the function (see Table 8) suggested that S,
COMP, Z (negatively), and K were the best predictors of treatment condition, while
WSD, WRM, and HIST were the least effective predictors. Original classification of
cases resulted in 73.1% of treatment cases to be correctly classified and 70.4% of
evaluation cases, for an overall classification rate of 71.2%. Cross-validation resulted in
65.7% of treatment cases being correctly grouped and 69.8% of evaluation cases being
correctly classified, for an overall rate of 68.6%.
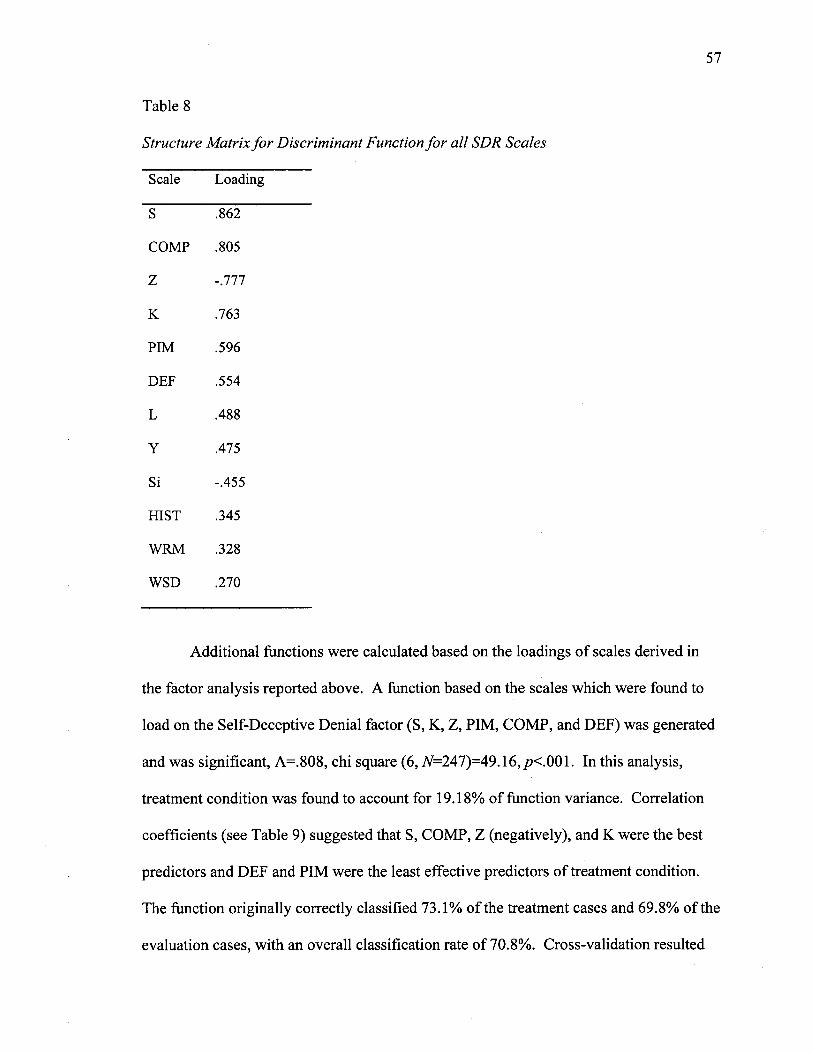
57
Table 15
Structure Matrix for Discriminant Function for all SDR Scales
Scale Loading
S .862
COMP .805
Z -.777
K .763
PIM .596
DEF .554
L .488
Y .475
Si -.455
HIST .345
WRM .328
WSD .270
Additional functions were calculated based on the loadings of scales derived in
the factor analysis reported above. A function based on the scales which were found to
load on the Self-Deceptive Denial factor (S, K, Z, PIM, COMP, and DEF) was generated
and was significant, A=.808, chi square (6,7V=247)=49.16, p<.001. In this analysis,
treatment condition was found to account for 19.18% of function variance. Correlation
coefficients (see Table 9) suggested that S, COMP, Z (negatively), and K were the best
predictors and DEF and PIM were the least effective predictors of treatment condition.
The function originally correctly classified 73.1% of the treatment cases and 69.8% of the
evaluation cases, with an overall classification rate of 70.8%. Cross-validation resulted

58
in 68.7% of treatment cases and 67.5% of evaluation cases being correctly classified,
with an overall classification rate of 67.8%.
Table 9
Structure Matrix for Discriminant Function for Self-Deceptive Denial Scales
Scale Loading
S .878
COMP .820
Z -.791
K .777
PIM .607
DEF .564
For the Self-Deceptive Enhancement factor (HIST, WRM, Si, Y—again, DOM
was omitted), a significant function was also generated, A=.922, chi square (4,
Ar=301)=22.27,p<.001. Treatment condition was found to account for 7.8% of function
variance. Correlation coefficients (Table 10) suggested that Y and Si (negatively) were
the best predictors of treatment condition, while WRM was the least effective predictor.
The function originally correctly classified 50.6% of the treatment cases and 70.6% of the
evaluation cases, for an overall classification rate of 64.5%. Cross-validation of the
function resulted in correct classification of 50.6% of treatment cases and 70.1% of
evaluation cases, for an overall classification rate of 64.2%.

59
Table 15
Structure Matrix for Discriminant Function for Self-Deceptive Enhancement Scales
Scale Loading
~Y $68
Si -.842
HIST .700
WRM .509
For the Communion Management factor (WSD, L), a significant function was
generated, A=.951, chi square (2,7V=284)=13.36,/?=.001. Treatment condition accounted
for 4.9% of this function's variance. Correlation coefficients (Table 11) suggested that L
was the better predictor of treatment condition. The function originally correctly
classified 64.0% of treatment cases and 54.1% of evaluation cases, for an overall
classification rate of 56.9%. In cross-validation, the function correctly predicted 64.0%
of treatment cases and 53.6% of evaluation cases, for an overall classification rate of
56.5%.
Table 11
Structure Matrix for Discriminant Function for Communion Management Scales
Scale Loading
L .943
WSD .758
A final discriminant function was calculated using all of the SDR scales as well as
F, Fb, Fp, and NIM. This function was also significant, A=.688, chi square (16,
7V=246)=84.00, /?<.001. Treatment condition accounted for 31.1% of function variance.
In this analysis, SDR scales were negatively correlated with the function. Correlation
coefficients (Table 12) indicated that Fb and F were the best predictors, followed closely
by, S, COMP, Z, and K (all negatively), while WSD, NIM, WRM, and HIST were among
the least effective predictors. The function originally correctly classified 72.7% of
treatment cases and 84.0% of evaluation cases, for an overall classification rate of 80.9%.
Cross-validation of the function resulted in correct classification of 63.6% of treatment
cases and 81.1% of evaluation cases, for an overall classification rate of 76.2%.

61
Table 15
Structure Matrix for Discriminant Function for All SDR Scales plus F, Fb, Fp, and NIM
Scale Loading
Fb .705
F .631
S -.625
COMP -.579
Z .561
K -.544
PIM -.421
DEF -.396
Fp .360
L -.347
Y -.329
Si .313
HIST -.234
WRM -.217
NIM .197
WSD -.190

62
Cutoff Scores
In addition, the recommended cutoff scores for the primary underreporting indices
of each measure, L, K, S, PIM, and Y were examined. Table 13 summarizes the
percentage of cases exceeding various cutoff scores. As expected, a higher percentage of
cases in the evaluation group exceeded recommended cutoffs than in the treatment group.
It was also predicted that L would produce more cases of questionable validity than K,
PIM, or Y. As described above, scores above 657" on L and K, above 687 on PIM, and
above 85 BR on Y yield questionable profile validity due to overt defensiveness. While
L did produce a higher rate of overtly defensive elevations than PIM or Y, K produced
more than any of these scales. Therefore the hypothesis was only partially supported. Of
note, in the treatment condition, L, K, and Y all produced a consistent rate (8%) of
profiles above the recommended cutoff.
Considering the full range of scores, PIM identified the most cases with scores
falling in a range indicative of defensiveness, followed by K, S, L, Y, and finally DEF.
Next, a receiver operating characteristic (ROC) curve (Pintea & Moldovan, 2009)
was calculated to explore the sensitivity and specificity of the underreporting indices. S,
COMP, and K were the best predictors of membership in the evaluation group, with area
under the curve (AUC) of .75, .73, and .72, respectively. These scores represent fair
discrimination. All other scales produced scores in the poor range. The results of the
ROC curve are summarized in Table 14. Table 15 shows the complete sensitivity and
specificity values for various cutting scores for S, COMP, and K. All other
underreporting scales have been omitted because their AUCs were in the poor range. In

addition, because this study is based upon a differential prevalence design and not a pure
known groups design, recommended cutoff scores were not derived from these results.
Table 13
Cases Exceeding Cutoff Scores for Identified Underreporting Scales
Scale Recommended
Cutoff
Evaluation Group
Percentage (N)
Treatment Group
Percentage (N)
All Cases3
Percentage (N)
L >54 7* 49.1% (109) 32.3% (31) 44.6% (154)
55-657 27.9% (62) 24.0% (23) 27.2% (94)
>65 r 21.2% (47) 8.3% (8) 17.4% (60)
K >547* 66.7% (148) 37.5% (36) 58.3% (201)
55-657 35.1% (78) 29.2% (28) 32.2% (111)
>65 r 31.5% (70) 8.3% (8) 26.1% (90)
S >537* 60.8% (118) 28% (21) 52.1% (148)
PIM >43b 75.9% (170) 39.8% (39) 61.3% (214)
44-567 39.7% (89) 28.6% (28) 36.7% (128)
57-687 32.1% (72) 9.2% (9) 27.8% (97)
>687c 4.0% (9) 2.0% (2) 3.2% (11)
DEF >697* 3.1% (7) 1.0% (1) 3.2% (11)
Y >74 BRb 40% (80) 20.5% (18) 34.7% (109)
75-84 BR 28% (56) 12.5% (11) 24.5% (77)
>84 BR° 12% (24) 8.0% (7) 10.2% (32)
Note, includes cases for which treatment condition is unknown. Includes all scores suggestive of defensiveness. °Scores in this range produce profiles of questionable validity due to overt defensiveness.

64
Table 15
Area Under the Curve Scores for Underreporting Indices' Identifying Evaluees
Asymptotic 95%
Confidence Interval
Asymptotic Lower Upper
Scale Area Std. Error Sig.a Bound Bound
S .749 .035 .000 .681 .816
COMP .732 .036 .000 .662 .802
K .723 .036 .000 .652 .793
PIM .686 .039 .000 .610 .762
DEF-T .666 .037 .000 .593 .739
L .647 .040 .000 .568 .725
Y .625 .041 .003 .544 .706
WRM .599 .043 .018 .515 .682
HIST .597 .043 .020 .514 .681
WSD T .586 .042 .039 .504 .668
Si .360 .040 .001 .282 .439
Note. aNull hypothesis: true area = 0.5

65
Table 15
Sensitivity and Specificity Scores for Underreporting Indices' Identifying Evaluees
Scale Positive if Greater Than or Equal Toa Sensitivity 1 - Specificity
29.00 1.000 1.000
31.50 .988 .970
34.00 .982 .940
36.00 .976 .866
38.00 .976 .821
40.00 .953 .776
42.00 .935 .746
44.00 .905 .701
46.00 .870 .672
48.50 .846 .597
51.00 .799 .493
53.00 .751 .448
55.00 .669 .388
56.50 .627 .373
57.50 .627 .358
59.00 .556 .224
78.00 .000 .000

66
Table 15, Continued.
Scale Positive if Greater Than or Equal Toa Sensitivity 1 - Specificity
COMP " LOO 1.000 1.000
5.50 , 1.000 .970
10.50 1.000 .940
14.00 .988 .896
17.00 .988 .881
20.50 .982 .836
24.50 .959 .791
27.00 .947 .791
31.00 .935 .761
35.00 .917 .746
38.50 .911 .687
42.00 .888 .642
45.50 .846 .552
48.00 .828 .507
51.50 .781 .448
54.50 .692 .373
57.50 .663 .328
61.00 .604 .299
64.50 .544 .239
66.50 .521 .179
117.00 .000 .000

Table 15, Continued.
Scale Positive if Greater than or Equal Toa Sensitivity 1 - Specificity
S 29.00 1.000 1.000
31.50 .994 .940
33.50 .970 .910
36.50 .964 .866
39.50 .917 .642
42.00 .882 .552
45.50 .805 .448
49.00 .728 .388
52.50 .645 .284
55.00 .586 .209
57.50 .527 .164
78.00 .000 .000
Note. aScores which yielded Specificity <.50 and >.00 have been omitted.

CHAPTER FOUR
DISCUSSION
There were two major goals for this study: to replicate and extend work by
Morgan et al. (2002) and Braxton et al. (2007) in comparing the validity indices of the
MMPI-2, MCMI-III, and PAI, and to evaluate the underreporting indices of these
measures in light of Paulhus's (2002) model of Socially Desirable Responding (SDR).
Scale Intercorrelations
Regarding the first goal, scale correlations have been reported. Approximately
70% of the correlations obtained in this study were statistically similar to correlations
reported by Morgan et al. (2002) and Braxton et al. (2007). All correlations, with the
exception of the correlation between DEF and MAL, were correlated in the same
direction and similarly significant or not significant compared with the referent studies.
Therefore the correlations reported by Morgan and colleagues and Braxton and colleagues
have been successfully replicated with a population different from those previously
studied. The differences observed are likely due to the unique nature of the sample used
for this study: a relatively well-educated population of individuals at a substance abuse
treatment center. These results speak to the stability and reliability of these measures for
use in a variety of clinical settings.
68
Examining the obtained correlations more closely, the largest between-measure
correlations for over-reporting measures were found for the MMPI-2's Fb with X and Z
of the MCMI-III. Other large between-measure correlations included the PAI's NIM with
Fb of the MMPI-2, and X and Z of the MCMI-III; and the MMPI-2's F with X and Z of
the MCMI-III. Based on these large correlations, it appears that X and Z of the MCMI-III
(whose correlation with one another was the largest among measures of overreporting),
NIM of the PAI, and F and Fb of the MMPI-2 may be capturing very similar information
regarding a test-taker's response style.
With regard to measures of underreporting, large correlations were found with the
PAI's PIM and all of the other primary measures of underreporting: the MMPI-2's L, K,
and S, as well as the MCMI-III's Y, though its largest correlations were with S and K,
respectively. For clinicians, this suggests that one may expect PIM to perform most
similarly to S and K of the MMPI-2.
Very large correlations were also found between the PAI's DEF and PIM. Large
correlations also were observed for DEF with S and K of the MMPI-2, and with Y of the
MCMI-III. It correlated at a medium level with L and WSD of the MMPI-2. Because the
scales appear to share so much common variance, clinicians may therefore expect DEF to
perform very similarly to PIM.
Notably, CDF of the PAI correlated at a small level or not at all with all other
measures of underreporting, with the exception of a medium correlation with DEF.
Furthermore, medium correlations were found for CDF with MAL and RDF of the PAI,
and small correlations with many other measures of overreporting. This finding increases
the ambiguity of the interpretation of CDF, and it highlights the need for further
investigation into the meaning and contribution of this scale in the interpretation of
response style.
The MCMI-III's Y scale correlated moderately with the primary underreporting
indices of the MMPI-2, L, K, and S, as well as with PIM of the PAI. Y's strongest
correlation with any underreporting index was with PIM, but overall Y's correlations with
other measures of underreporting were among the lowest observed. From a clinical
perspective, this suggests that Y may not be tapping underreporting in the same manner as
other common measures of defensiveness. Indeed, Y's strongest overall correlation was
with Si of the MMPI-2 in a direction indicating extraversion. Blais et al. (1995) reported
a similar finding with Si of the MMPI-2 and Y of the MCMI-II. This correlation suggests
a significant portion of Y's variance may be driven by Extraversion, and emphasizes the
role of personality in defensiveness.
Large correlations were found for L, K, and S of the MMPI-2 with one another,
and the correlation between K and S was the largest observed among underreporting
measures across all instruments. WSD of the MMPI-2 correlated at a medium level with
L, the PAI's PIM, and the MCMI-III's Y, but only small correlations were found with K
and S.
Personality and Underreporting
Measures of personality and other scales which have been found to correlate with
measures of normal personality were also examined. As expected, Si and HIST
correlated well with one another in the direction indicative of extraversion. Additionally,
WRM and DOM of the PAI were found to have large correlations with each of these
measures, suggesting that extraversion accounts for a significant portion of the scales'
variance. The MCMI-III's COMP, which has been found to correlate with measures of
the normal personality trait conscientiousness, correlated at a medium level in the
direction indicating extraversion with Si and HIST, and small correlations were found
with DOM and WRM.
Large correlations also were noted between measures of personality and measures
of both overreporting and underreporting. The large correlations between Y and
measures of extraversion were discussed above. Si also was found to have large and
negative correlations with K and S of the MMPI-2 and PIM of the PAI, and medium and
negative correlations with WSD. Small and negative correlations were found for Si with
L. HIST, on the other hand, was found to have medium correlations with S, K, PIM, and
DEF, and small correlations with L and WSD. These findings suggest that Extraversion
exerts a force of varying levels across measures of defensiveness.
COMP's largest correlations were with PIM and S, but large correlations also
were observed with DEF, K, and Y. Medium correlations for COMP were found with L
and small correlations found with WSD. This suggests that Conscientiousness, as
expressed through COMP, also exerts a level of influence on measures of defensiveness,
and that this relationship differs somewhat from that of Extraversion.
DOM and WRM of the PAI, on the other hand, provided a much murkier picture.
They both were found to have large correlations with Y, but only medium correlations
with PIM, DEF, K, and S, and small correlations with L and CDF. It was somewhat
surprising that while DOM and WRM correlated only to a medium degree with one
another, they each were found to have large correlations with Si and HIST in the direction
of Extraversion. Furthermore, they did not correlate very strongly with any of the specific

72
measures of underreporting. All told, these measures did not appear to provide extremely
useful information in understanding the role of personality in measures of defensiveness.
Measures of personality also were observed to be related to measures of
overreporting. Of note, measures of Extraversion had large correlations in the direction
indicative of introversion (i.e., positive with Si and negative with HIST) with many
measures of overreporting, notably F, Fb, X, and Z. Similarly, COMP had large negative
correlations with X, Z, NIM, F, and Fb. From these results it is clear that personality—
and Extraversion in particular—shares an important relationship with response style, and
that in general more introversion and less Conscientiousness were associated with
overreporting of psychopathology in this sample.
Socially Desirable Responding
The second goal for this study was to evaluate the underreporting indices of the
MMPI-2, MCMI-III, and PAI in light of Paulhus's model of socially desirable responding
(SDR). To this end, a factor analysis of the underreporting indices and relevant
personality scales was conducted.
The factor analysis yielded three factors, labeled Self-Deceptive Denial, Self-
Deceptive Enhancement, and Communion Management, in keeping with Paulhus's latest
(2002) nomenclature. In relation to the Alpha and Gamma constructs of SDR, Self-
Deceptive Denial and Communion Management correspond with Gamma and Self-
Deceptive Enhancement corresponds with Alpha. Overall, this model accounted for over
72% of the variance, with more than 51% coming from the Self-Deceptive Denial factor.
Generally, measures loaded as expected. The loadings for S, L, and WSD were
generally consistent with the loadings reported by Bagby and Marshall (2004). A notable

difference, however, was that the MMPI-2's K scale loaded on a Gamma factor with L,
but in previous work (reported by Paulhus, 2002), K loaded separately from L on an
Alpha factor. The reason for this discrepancy is not entirely clear. It is possible that the
presence of the additional scales, and the Extraversion-associated scales (e.g., Y, Si,
HIST) in particular, accentuated the similarities between K and L. It is also possible that
unique aspects of the sample used in this study (e.g., substance abuse setting, higher
levels of education) attenuated results. It is important to note, however, that while K and
L did load together on the first factor, L loaded higher on the third factor (also associated
with Gamma).
The PAI and MCMI-III had not previously been evaluated in light of Paulhus's
model. Based upon this factor analysis, PIM and DEF of the PAI loaded on the Self-
Deceptive Denial factor. Y of the MCMI-III loaded on the Self-Deceptive Enhancement
factor.
In general, the first factor, Self-Deceptive Denial, corresponds to Gamma and is
anchored by S and K of the MMPI-2, and also includes the MCMI-III's COMP, a
measure highly correlated with the personality trait Conscientiousness. The second
factor, Self-Deceptive Enhancement, corresponds to Alpha and is anchored by the PAI's
DOM and the MCMI-III's HIST. All of the scales loading on this second factor are
heavily laden with the personality trait Extraversion, as reviewed in the discussion of
scale intercorrelations above. Of note, the only traditional measure of defensiveness
which loaded on this factor was Y; its correlations with measures of Extraversion have
been discussed above. The third factor, labeled Communion Management, is considered
a sub factor of Gamma and is anchored by the MMPI-2's WSD, with L also loading here.
L also had a strong, but somewhat lower, loading on the Self-Deceptive Denial factor.
The PAI's DEF also loaded moderately on this factor, though it was classified as
belonging to Self-Deceptive Denial due to its higher loading on the first factor.
It was expected that the loadings of WRM of the PAI and WSD of the MMPI-2
would aid in the possible detection of unconscious or unintentional underreporting, based
on their performance in previous studies with coached and uncoached participants (Bagby
et al., 1997; Baer & Wetter, 1997). However, it is not clear that the loadings of these or
any other scales were particularly helpful in this regard. It is possible that additional
analysis, which was beyond the scope of this study, would further explore this
phenomenon.
Prediction of Group Membership
Having identified this factor structure, the scales were examined to determine their
ability to predict membership in the evaluation group, comprised of individuals who were
being assessed as part of a 5-day evaluation, and who based on clinical experience with
the population were believed to have significant motivation to present themselves in a
favorable light. T tests confirmed that the scales under examination did differ
significantly between members of the two groups, with the exception of the PAI's DOM
personality style scale.
To examine prediction of group membership, five separate discriminant functions
were formulated. The first examined all of the scales included in the factor analysis,
though DOM was excluded for the reason noted previously. The cross-validated
discriminant function was able to correctly classify almost 70% of cases in the evaluation
group, over 65% of cases in the treatment group, and over 68% of cases overall. Based

on correlations with the function, S, COMP, Z (negatively correlated), and K were,
respectively, the best predictors of group membership. WSD, WRM, and HIST were the
weakest predictors. The ROC curve analysis yielded similar results, with S, COMP, and
K proving to be the best predictors of membership in the evaluation condition.
Separate discriminant functions also were calculated for the scales loading on each
of the three factors identified through principal components analysis. The function
calculated for the Self-Deceptive Denial scales achieved an overall cross-validated
prediction rate of nearly 68%. The function calculated for the Self-Deceptive
Enhancement scales achieved a correct cross-validated classification rate of over 64%.
The function calculated for the Communion Management factor achieved an overall
cross-validated classification rate of nearly 57%.
Finally, a discriminant function was calculated for all of the SDR scales, as well as
the major overreporting indices: F, Fb, Fp, and NIM. This function achieved much better
classification rates. Cross-validated classification rates for the treatment group was over
63%, for the evaluation group was 81%, and for all cases was over 76%).
Several clinical applications are suggested by these results. First, there is some
evidence that S and K of the MMPI-2 may be particularly useful in the detection of
defensiveness. Additionally, elevations on COMP of the MCMI-III, and presumably
other measures of conscientiousness, may also suggest defensiveness.
COMP's utility in predicting group membership is intriguing. Paulhus (2002) has
discussed the role of personality in Socially Desirable Responding. That COMP should
prove a good predictor of group membership is in line with his findings, but also raises
other possibilities. COMP, as a personality dimension (selected here due to its correlation
with the personality trait Conscientiousness), might be expected to be equally represented
in both the treatment and evaluation patients. That it helped to discriminate between
members of the two groups may suggest a more state-dependent expression of the trait.
It is also important to note that the ability to predict group membership increased
greatly when measures of overreporting (e.g., F, Fb, Fp, and NIM) were included in the
analysis. For clinicians, this highlights the importance of evaluating all response style
indicators when interpreting results.
Cutoff Scores
When commonly recommended cutoff scores were examined for the most
common indices, the MMPI-2's K scale produced the largest number of profiles of
questionable validity, followed by L, and the MCMI-III's Y scale. The PAI's PIM
produced the fewest such profiles. However, for profiles whose scores suggest any level
of underreporting (i.e., by exceeding minimum recommended cutoff scores), the PAI's
PIM yielded the largest number, followed closely by K, then S, L, and Y.
In light of these findings, the recommended cutoff scores for PIM appear to make
it one of the more difficult to interpret, as it was the most likely to raise suspicion of
defensiveness, and the least likely to yield an invalid profile as a result of excessive
defensiveness.
Contributions to the Literature
Overall, this study contributes to the literature in a variety of ways. First, it
extends previous analysis of cross-test comparison of the response style scales of three
common objective measures of psychopathology by including all three measures in one

analysis and by drawing from a novel population. The consistency of interscale
correlations obtained in this study with this sample helps to support the stability and
reliability of these measures, while also providing clinicians with useful information
about how similar indicators of dissimulation across different assessment measures
perform in relation to one another.
Second, this study provides additional support for the major themes of Paulhus's
model of Socially Desirable Responding. Furthermore, it applies the model and evaluates
a variety of underreporting scales in a natural clinical setting with a differential
prevalence design. This design offers some advantages over designs in which faking
good is prescribed by researchers. For example, it yields greater external validity due to
its use of a real-world sample in a real-world clinical setting. However, this design also
offers some disadvantage, notably that group differences are presumed. While statistical
analysis of group differences supported the assumption that members of the evaluation
group did, on average, appear to present themselves in a more favorable light than did
members of the treatment group, the groups are not homogenous with regard to test-
taking orientation. It is likely that many members of the evaluation group did not attempt
to present themselves in a more favorable light; similarly, many members of the treatment
group did appear to present themselves in a more favorable light, with at least 8% of the
treatment patients yielding profiles with such defensiveness that the validity of their
results may be called into question based on recommended cutoff scores.
Study Limitations and Directions for Future Research
A primary limitation of this study is that analyses were conducted at the scale
level. This is a particular weakness of the factor analysis and of the analyses evaluating
scales in light of Paulhus's SDR model. The scales under review were not developed to
specifically measure aspects of his model, and while scales did appear to relate to
particular domains of the model, they are not pure measures of the constructs. An avenue
for future research would be to include Paulhus's instrument, or another multifaceted
measure, for detecting socially desirable responding and comparing scores across
measures. Such a study would be strengthened by conducting analyses at both the scale
and the item level. By examining item-level relationships with Paulhus's measure, new
scales more directly measuring Paulhus's construct could be developed for these
assessment instruments.
A second limitation is that no pure measures of normal personality were included.
In light of the apparent predominance of Extraversion observed in the second factor, Self-
Deceptive Enhancement, it is recommended that future research include an established
measure of normal personality, such as the NEO-PI-R, which had been used by Paulhus in
previous work with this model (2002). Future research could be strengthened by
including both the basic scales and facet-level scores of the NEO-PI-R to determine the
more nuanced aspects of personality that affect response style.
As discussed previously, the differential prevalence design used in this study
offers both strengths and weaknesses. An additional weakness is that the heterogeneity in
the sample groups limited the ability to draw inferences about cutoff scores based on
sensitivity and specificity. Future research could perform analyses which were beyond
the scope of this study to examine ideal cutoff scores in more detail.
REFERENCES
Aluja, A., Garcia, L. F., Cuevas, L., & Garcia, O. (2007). The MCMI-III personality
disorders scores predicted by the NEO-FFI-R and the ZKPQ-50-CC: A
comparative study. Journal of Personality Disorders, 27(1), 58-71.
doi:10.1521/pedi.2007.21.1.58
American Psychiatric Association. (2000). Diagnostic and statistical manual of mental
disorders (4th ed.). Washington, DC: Author.
Andrews, P. W., Kendler, K. S., Gillespie, N., & Neale, M. C. (2007). The sensitivity of
variance component estimates to underreporting: Method and application to
substance abuse data. Twin Research and Human Genetics, 70(5), 721-728. doi:
10.1375/twin. 10.5.721
Antoni, M. H. (2008). Studies Relating the MCMI and the MMPI. In Millon, T. & Bloom,
C. (Eds.), The Millon inventories: A practitioner's guide to personalized clinical
assessment (2nd ed., pp. 157-176). New York: Guilford Press.
Arbisi, P. A., & Ben-Porath, Y. S. (1998). The ability of Minnesota Multiphasic
Personality Inventory—2 validity scales to detect fake-bad responses in psychiatric
inpatients. Psychological Assessment, 10(3), 221-228. doi:10.1037/1040-
3590.10.3.221
79
Baer, R. A., & Miller, J. (2002). Underreporting of psychopathology on the MMPI-2: A
meta-analytic review. Psychological Assessment, 14(1), 16-26. doi: 10.1037/1040-
3590.14.1.16
Baer, R. A., & Sekirnjak, G. (1997). Detection of underreporting on the MMPI-2 in a
clinical population: Effects of information about validity scales. Journal of
Personality Assessment, 69(3), 555-567. doi:10.1207/sl5327752jpa6903_9
Baer, R. A., & Wetter, M. W. (1997). Effects of information about validity scales on
underreporting of symptoms on the Personality Assessment Inventory. Journal of
Personality Assessment, 68(2), 402-413. doi:10.1207/sl5327752jpa6802_10
Baer, R. A., Wetter, M. W., & Berry, D. T. R. (1995). Effects of information about
validity scales on underreporting of symptoms on the MMPI-2: An analogue
investigation. Assessment, 2(2), 189-200.
Baer, R. A., Wetter, M. W., Nichols, D. S., Greene, R., & Berry, D. T. R. (1995).
Sensitivity of MMPI-2 validity scales to underreporting of symptoms.
Psychological Assessment, 7(4), 419-423. doi:10.1037/1040-3590.7.4.419
Bagby, R. M., & Marshall, M. B. (2004). Assessing underreporting response bias on the
MMPI-2. Assessment, 11(2), 115-126. doi:10.1177/1073191104265918
Bagby, R. M., Nicholson, R. A., Bacchiochi, J. R., Ryder, A. G., & Bury, A. S. (2002).
The predictive capacity of the MMPI-2 and PAI validity scales and indexes to
detect coached and uncoached feigning. Journal of Personality Assessment, 75(1),
69-86.

Bagby, R. M., Nicholson, R. A., Buis, T., Radovanovic, H., & Fidler, B. J. (1999).
Defensive responding on the MMPI-2 in family custody and access evaluations.
Psychological Assessment, 11(1), 24-28. doi: 10.1037/1040-3590.11.1.24
Bagby, R. M., Rogers, R., & Buis, T. (1994). Detecting malingered and defensive
responding on the MMPI-2 in a forensic inpatient sample. Journal of Personality
Assessment, 62(2), 191-203. doi:10.1207/sl5327752jpa6202_2
Bagby, R. M., Rogers, R., Buis, T., & Kalemba, V. (1994). Malingered and defensive
response styles on the MMPI-2: An examination of validity scales. Assessment,
7(1), 31-38. doi:10.1177/1073191194001001005
Bagby, R. M., Rogers, R., Nicholson, R. A., Buis, T., Seeman, M. V., & Rector, N. A.
(1997). Effectiveness of the MMPI-2 validity indicators in the detection of
defensive responding in clinical and nonclinical samples. Psychological
Assessment, 9(4), 406-413.
Baity, M. R., Siefert, C. J., Chambers, A., & Blais, M. A. (2007). Deceptiveness on the
PAI: A study of naive faking with psychiatric inpatients. Journal of Personality
Assessment, Special Issue on the Personality Assessment Inventory, 55(1), 16-24.
doi: 10.1207/s 15327752jpa8801_03
Blais, M. A., Benedict, K. B., & Norman, D. K. (1994). Associations among the MCMI-II
clinical syndrome scales and the MMPI-2 clinical scales. Assessment, 1(4), 407-
413.
Blais, M. A., Benedict, K. B., & Norman, D. K. (1995). Concurrent validity of the
MCMI-II Modifier Indices. Journal of Clinical Psychology, 51(6), 783-789.
doi: 10.1002/1097-4679( 199511)51:6<783:: AID-JCLP2270510609>3,0.CO;2-8

Bollinger, A. R. (1998). Validity of the MMPI-2 and MCMI-II personality disorder scales
among combat veterans with posttraumatic stress disorder. Dissertation Abstracts
International: Section B: The Sciences and Engineering, 59(4), 1841.
Bow, J. N., Flens, J. R., Gould, J. W., & Greenhut, D. (2006). An analysis of
administration, scoring, and interpretation of the MMPI-2 and MCMI-II/III in
child custody evaluations. Journal of Child Custody, 2(4), 1-22.
doi:10.1300/J190v02n04_01
Braxton, L. E., Calhoun, P. S., Williams, J. E., & Boggs, C. D. (2007). Validity rates of
the Personality Assessment Inventory and the Minnesota Multiphasic Personality
Inventory-2 in a VA Medical Center setting. Journal of Personality Assessment,
88(1), 5-15. doi:10.1207/sl5327752jpa8801_02
Butcher, J. N. (2006). MMPI-2: A Practitioner's Guide. Washington, DC: American
Psychological Association.
Butcher, J. N., Dahlstrom, W. G., Graham, J. R., Tellegen, A., & Kaemmer, B. (1989).
MMPI-2: Manual for administering and scoring. Minneapolis: University of
Minnesota Press.
Carr, G. D., Moretti, M. M., & Cue, B. J. H. (2005). Evaluating parenting capacity:
Validity problems with the MMPI-2, PAI, CAPI, and ratings of child adjustment.
Professional Psychology: Research and Practice, 36(2), 188-196.
doi: 10.1037/0735-7028.36.2.188
Cashel, M. L., Rogers, R., Sewell, K., & Martin-Cannici, C. (1995). The Personality
Assessment Inventory (PAI) and the detection of defensiveness. Assessment, 2(4),
333-342. doi:10.1177/1073191195002004004
Chen, W. J., Fang, C., Shyu, R., & Lin, K. (2006). Underreporting of illicit drug use by
patients at emergency departments as revealed by two-tiered urinalysis. Addictive
Behaviors, 37(12), 2304-2308. doi:10.1016/j.addbeh.2006.02.015
Choca, J. P. (2004). Interpreteive Guide to the Millon Clinical Multiaxial Inventory (Vol.
3). Washington, DC: American Psychological Association.
Costa, P. T., & McCrae, R. R. (1992). Normal personality assessment in clinical practice:
The NEO Personality Inventory. Psychological Assessment, 4(1), 5-13.
Craig, R. J. (1999). Overview and current status of the Millon Clinical Multiaxial
Inventory. Journal of Personality Assessment, 72(3), 390-406.
DeViva, J. C., & Bloem, W. D. (2003). Symptom exaggeration and compensation seeking
among combat veterans with posttraumatic stress disorder. Journal of Traumatic
Stress, 16(5), 503-507. doi:10.1023/A:1025766713188
Dyce, J. A., & O'Connor, B. P. (1998). Personality disorders and the five-factor model: A
test of facet-level predictions. Journal of Personality Disorders, 72(1), 31-45.
Fals-Stewart, W. (1995). The effect of defensive responding by substance-abusing
patients on the Millon Clinical Multiaxial Inventory. Journal of Personality
Assessment, 64(3), 540-551. doi:10.1207/sl5327752jpa6403_l 1
Fals-Stewart, W. (1996). The ability of individuals with psychoactive substance use
disorders to escape detection by the Personality Assessment Inventory.
Psychological Assessment, 5(1), 60-68. doi:10.1037/1040-3590.8.1.60

Fals-Stewart, W., & Lucente, S. (1997). Identifying positive dissimulation by substance-
abusing individuals on the Personality Assessment Inventory: A cross-validation
study. Journal of Personality Assessment, 68(2), 455-469.
doi: 10.1207/s 15327752jpa6802_l 3
Ganellen, R. J. (1996). Comparing the diagnostic efficiency of the MMPI, MCMI-II, and
Rorschach: A review. Journal of Personality Assessment, 67(2), 219-243.
doi: 10.1207/s 15327752jpa6702_l
Graham, J. R. (1999). MMPI-2: Assessing Personality and Psychopathology (3rd ed.).
New York: Oxford University Press.
Grillo, J., Brown, R. S., Hilsabeck, R., & Price, J. R. (1994). Raising doubts about claims
of malingering: Implications of relationships between MCMI-II and MMPI-2
performances. Journal of Clinical Psychology, 50(A), 651-655. doi: 10.1002/1097-
4679(199407)50:4<651::AID-JCLP2270500424>3.0.CO;2-C
Hardie, J. C. (2005). A comparison of the MCMI-III and the MMPI-2 in a chronic pain
population. Dissertation Abstracts International: Section B: The Sciences and
Engineering, 65(12), 6653.
James, W. H., Lonczak, H. S., & Moore, D. D. (1996). The role of denial and
defensiveness in drug use among adolescents. Journal of Child & Adolescent
Substance Abuse, 5(2), 17-42. doi:10.1300/J029v05n02_02
Ledesma, R. D., & Valero-Mora, P. (2007). Determining the number of factors to retain
in EFA: An easy-to-use computer program for carrying out parallel analysis.
Practical Assessment, Research and Evaluation, 12(2), 1-11.
Ledgerwood, D. M., Goldberger, B. A., Risk, N. K., Lewis, C. E., & Price, R. K. (2008).
Comparison between self-report and hair analysis of illicit drug use in a
community sample of middle-aged men. Addictive Behaviors, 33(9), 1131-1139.
doi: 10.1016/j .addbeh.2008.04.009
Leech, N. L., Barrett, K. C., & Morgan, G. A. (2005). SPSS for intermediate statistics:
Use and interpretation (2nd ed.). New Jersey: Lawrence Erlbaum Associates, Inc.
Lees-Haley, P. R. (1992). Efficacy of MMPI-2 validity scales and MCMI-II modifier
scales for detecting spurious PTSD claims: F, F-K, Fake Bad scale, Ego Strength,
Subtle-Obvious subscales, DIS, and DEB. Journal of Clinical Psychology, 48(5),
681-689. doi: 10.1002/1097-4679( 199209)48:5<681::AID-
JCLP2270480516>3.0.CO;2-Q
LePage, J. P., Mogge, N. L., & Sharpe, W. R. (2001). Validity rates of the MMPI-2 and
PAI in a rural inpatient psychiatric facility. Assessment, 5(1), 67-74.
doi: 10.1177/107319110100800106
Millon, T., Davis, R., & Millon, C. (1997). MCMI-III: Manual. Minneapolis, MN: NCS
Pearson, Inc.
Morey, L. C. (1991). Personality Assessment Inventory Professional Manual. Odessa, FL:
Personality Assessment Resources, Inc.
Morey, L. C. (2003). Essentials of PAI Assessment. New York: John Wiley & Sons.
Morey, L. C. (2007). Personality Assessment Inventory Professional Manual (2nd ed.).
Lutz, FL: Psychological Assessment Resources, Inc.

86
Morey, L. C., & Lanier, V. W. (1998). Operating characteristics of six response distortion
indicators for the Personality Assessment Inventory. Assessment, 5(3), 203-214.
doi: 10.1177/107319119800500301
Morgan, C. D., Schoenberg, M. R., Dorr, D., & Burke, M. J. (2002). Overreport on the
MCMI-III: Concurrent validation with the MMPI-2 using a psychiatric inpatient
sample. Journal of Personality Assessment, 78(2), 288-300.
doi: 10.1207/S 15327752JPA7802_05
Nichols, D. S. (2001). Essentials of MMPI-2 Assessment. New York: John Wiley & Sons.
Paulhus, D. L. (2002). Socially desirable responding: The evolution of a construct. The
role of constructs in psychological and educational measurement., 49-69.
Paulhus, D. L., & John, O. P. (1998). Egoistic and moralistic biases in self-perception:
The interplay of self-deceptive styles with basic traits and motives. Journal of
Personality, Defense mechanisms in contemporary personality research, 66(6),
1025-1060. doi: 10.1111/1467-6494.00041
Paulhus, D. L., & Reid, D. B. (1991). Enhancement and denial in socially desirable
responding. Journal of Personality and Social Psychology, 60(2), 307-317.
doi: 10.1037/0022-3514.60.2.307
Peebles, J., & Moore, R. J. (1998). Detecting socially desirable responding with the
Personality Assessment Inventory: The Positive Impression Management Scale
and the Defensiveness Index. Journal of Clinical Psychology, 54(5), 621-628.
doi: 10.1002/(SICI) 1097-4679( 199808)54:5<621:: AID-JCLP8>3.0.CO;2-N

Pintea, S., & Moldovan, R. (2009). The receiver-operating characteristic (ROC) analysis:
Fundamentals and applications in clinical psychology. Journal of Cognitive &
Behavioral Psychotherapies, 9(1), 49-66.
Piotrowski, C. (2000). How popular is the Personality Assessment Inventory in practice
and training. Psychological Reports, 5(5(1), 65.
Rogers, R., Sewell, K. W., Morey, L. C., & Ustad, K. L. (1996). Detection of feigned
mental disorders on the Personality Assessment Inventory: A discriminant
analysis. Journal of Personality Assessment, 67(3), 629-640.
doi:10.1207/sl5327752jpa6703_15
Saulsman, L. M., & Page, A. C. (2004). The five-factor model and personality disorder
empirical literature: A meta-analytic review. Clinical Psychology Review, 23(8),
pl055 - 1085.
Strack, S. (2002). Essentials of Millon Inventories Assessment (2nd ed.). New York: John
Wiley & Sons.
Strong, D. R., Greene, R. L., Hoppe, C., Johnston, T., & Olesen, N. (1999). Taxometric
analysis of impression management and self-deception on the MMPI-2 in child-
custody litigants. Journal of Personality Assessment, 73(1), 1-18.
doi:10.1207/S15327752JPA730101
Strong, D. R., Greene, R. L., & Kordinak, S. T. (2002). Taxometric analysis of impression
management and self-deception in college student and personnel evaluation
settings. Journal of Personality Assessment, Personality autobiographies, 75(1),
161-175. doi: 10.1207/S15327752JPA7801 10

APPENDIX A
IRB APPROVAL FORMS
88

LOUISIANA TECH U N I V E R S I T Y
MEMORANDUM
OFFICE OF UNIVERSITY RESEARCH
TO: Mr. Brian Rutland and Dr. Tony Young
FROM: Barbara Talbot, University Research
SUBJECT: HUMAN USE COMMITTEE REVIEW
DATE: June 16, 2009
In order to facilitate your project, an EXPEDITED REVIEW has been done for your proposed study entitled:
"Socially Desirable Responding on the MMPI-2, MCM1-111 and PAI in a Substance Abuse Treatment Setting"
# HUC-655
The proposed study's revised procedures were found to provide reasonable and adequate safeguards against possible risks involving human subjects. The information to be collected may be personal in nature or implication. Therefore, diligent care needs to be taken to protect the privacy of the participants and to assure that the data are kept confidential. Informed consent is a critical part of the research process. The subjects must be informed that their participation is voluntary. It is important that consent materials be presented in a language understandable to every participant. If you have participants in your study whose first language is not English, be sure that informed consent materials are adequately explained or translated. Since your reviewed project appears to do no damage to the participants, the Human Use Committee grants approval of the involvement of human subjects as outlined.
Projects should be renewed annually. This approval was finalized on May 18, 2009 and this project will need to receive a continuation review by the IRB if the project, including data analysis, continues beyond May 18, 2010. Any discrepancies in procedure or changes that have been made including approved changes should be noted in the review application. Projects involving NIH funds require annual education training to be documented. For more information regarding this, contact the Office of University Research.
You are requested to maintain written records of your procedures, data collected, and subjects involved. These records will need to be available upon request during the conduct of the study and retained by the university for three years after the conclusion of the study. If changes occur in recruiting of subjects, informed consent process or in your research protocol, or if unanticipated problems should arise it is the Researchers responsibility to notify the Office of Research or IRB in writing. The project should be discontinued until modifications can be reviewed and approved.
If you have any questions, please contact Dr. Mary Livingston at 257-4315.
A MEMBER OF THE UNIVERSITY OF LOUISIANA SYSTEM
P.O. BOX 3092 • RUSTON, LA 71272 • TELEPHONE (318) 257-5075 • FAX (318> 257-5079 AN EQUAL OPPORTUNITY UNIVERSITY