
Social Work Services Strategic Forum Recruitment …...Social Work Services Strategic Forum...
80
Social Work Services Strategic Forum Recruitment and Retention Project : Survey Findings Recruitment and retention in the social service workforce in Scotland Shona Mulholland, Jo Fawcett and Sue Granville Why Research The set of actions in the Vision and Strategy for Social Services 2015-2020 identify the need to develop a better understanding of recruitment, retention and workforce planning in the social services sector. To progress this the Social Work Services Strategic Forum, supported by the Office of the Chief Social Work Adviser, commissioned a research project in 2016 to better inform the understanding of the issues and approaches and to support Forum partners and other stakeholders to consider what further actions might be required, individually or in partnership, to address issues identified, learn from useful approaches and share good practice. The first part of the project comprised a Literature Review which has been published separately. The literature review helped to inform the development of questions included in a follow-up survey which comprised a sector-wide online survey and a small set of qualitative interviews. This report presents the findings from the online survey and qualitative interviews. The report of the survey findings was presented and discussed at the September 2016 meeting of the Social Work Services Strategic Forum. It was also part of the set of evidence used at a Forum Workshop in November 2016 which was the first step in a refresh of the Vision and Strategy to identify any new actions to be taken forward as of March 2017.
Transcript of Social Work Services Strategic Forum Recruitment …...Social Work Services Strategic Forum...

Social Work Services Strategic Forum
Recruitment and Retention Project : Survey Findings
Recruitment and retention in the social service workforce in Scotland
Shona Mulholland, Jo Fawcett and Sue Granville
Why Research
The set of actions in the Vision and Strategy for Social Services 2015-2020 identify the
need to develop a better understanding of recruitment, retention and workforce planning in
the social services sector.
To progress this the Social Work Services Strategic Forum, supported by the Office of the
Chief Social Work Adviser, commissioned a research project in 2016 to better inform the
understanding of the issues and approaches and to support Forum partners and other
stakeholders to consider what further actions might be required, individually or in
partnership, to address issues identified, learn from useful approaches and share good
practice.
The first part of the project comprised a Literature Review which has been published
separately. The literature review helped to inform the development of questions included in
a follow-up survey which comprised a sector-wide online survey and a small set of
qualitative interviews. This report presents the findings from the online survey and
qualitative interviews.
The report of the survey findings was presented and discussed at the September 2016
meeting of the Social Work Services Strategic Forum. It was also part of the set of
evidence used at a Forum Workshop in November 2016 which was the first step in a
refresh of the Vision and Strategy to identify any new actions to be taken forward as of
March 2017.

Contents
Executive Summary ................................................................................................ 1
1 Introduction ....................................................................................................... 1
2 Recruitment and retention ................................................................................ 1
3 Challenges ........................................................................................................ 2
Pay, funding and competition ............................................................................ 2
Terms and conditions ........................................................................................ 3
Qualifications and training requirements ........................................................... 3
Skills, increased responsibility or workloads ..................................................... 3
The image of the social service sector .............................................................. 4
Issues around diversity ...................................................................................... 4
Issues around geography .................................................................................. 4
4 Mitigation .......................................................................................................... 5
5 Workforce planning........................................................................................... 5
1 Introduction ...................................................................................................... 7
1.1 Background ................................................................................................... 7
1.2 Research requirements ................................................................................. 7
1.3 Methodology .................................................................................................. 8
1.4 Online survey respondent profile ................................................................... 9
1.4.1 Sector ................................................................................................. 10
1.4.2 Employees.......................................................................................... 10
1.4.3 Staff types .......................................................................................... 11
1.4.4 Respondent role ................................................................................. 12
1.4.5 Working areas .................................................................................... 13
1.4.6 Service types ...................................................................................... 14
1.5 The recruitment and retention landscape .................................................... 15
1.5.1 Zero hours contracts .......................................................................... 15
1.5.2 Use of pay freeze ............................................................................... 15
1.5.3 Living wage ........................................................................................ 16
1.5.4 Use of staff surveys ............................................................................ 17
1.6 Qualitative respondent profile ...................................................................... 17
2 Recruitment .................................................................................................... 19
2.1 Areas for research ....................................................................................... 19
2.2 Profile of respondents ................................................................................. 19
2.3 Recruitment difficulties ................................................................................ 20

2.4 Time taken to fill vacant posts ..................................................................... 21
2.5 Changes in difficulty .................................................................................... 21
2.6 Recruitment methods .................................................................................. 22
2.7 Recruitment challenges ............................................................................... 23
2.8 Mitigating against recruitment challenges ................................................... 23
2.9 Other factors relating to recruitment ............................................................ 24
3 Retention ........................................................................................................ 27
3.1 Areas for research ....................................................................................... 27
3.2 Profile of respondents ................................................................................. 27
3.3 Retention difficulties .................................................................................... 27
3.4 Retention challenges ................................................................................... 29
3.5 Mitigating against retention challenges ....................................................... 29
3.6 Other factors relating to retention ................................................................ 30
4 Recruitment and retention issues ................................................................ 33
4.1 Issues around pay, funding and competition ............................................... 33
4.1.1 The Living Wage ................................................................................ 34
4.1.2 Funding and commissioning .............................................................. 35
4.1.3 Competition, both from within and outwith the sector ........................ 36
4.2 Terms and conditions .................................................................................. 37
4.3 Issues around qualifications and training requirements .............................. 37
4.4 Issues around skills, increased responsibility or workloads ........................ 39
4.4.1 Skills ................................................................................................... 39
4.4.2 The availability of applicants or suitable applicants ........................... 40
4.5 Issues around the image of the social service sector ................................. 41
4.6 Issues around diversity ................................................................................ 43
4.7 Issues around geography ............................................................................ 43
4.8 Other issues ................................................................................................ 44
4.9 Mitigation measures .................................................................................... 44
4.10 No difficulties ............................................................................................ 46
5 Workforce planning ....................................................................................... 47
5.1 Areas for research ....................................................................................... 47
5.2 Profile of respondents ................................................................................. 47
5.3 Workforce planning within the organisation................................................. 47
5.4 Specific tools ............................................................................................... 51
5.5 Changes to workforce planning ................................................................... 58
5.6 Other comments on workforce planning ...................................................... 59

6 Conclusions ................................................................................................... 60
Appendix 1: Summary of findings from Literature Review ................................. 1
Appendix 2: Online questionnaire ......................................................................... 3

Acknowledgments
Thanks to all those who took part in the online survey and telephone discussions and to the Project Reference Group who provided input and offered advice as required.

1
Executive Summary
1 Introduction
In February 2016, the Social Work Services Strategic Forum, through the Office of the Chief Social Work Adviser, commissioned a review of the recruitment and retention challenges that the Scottish social service sector faces. The findings from the research will be considered by the Strategic Forum in order to better inform national policy development going forward. In March 2016, the remit of this work was expanded to include gathering information on workforce planning and workforce planning tools.
This report presents the findings from the online survey and qualitative interviews, conducted from June to August 2016, amongst a range of stakeholders across much of the social service sector in Scotland1. One hundred and sixty-three stakeholders, representing organisations from a wide range of areas and service types and employing several thousand service sector staff across the voluntary, independent and public sectors, took part in an online survey. Fifty of these respondents also gave more detailed information via telephone discussions.
The research looked at recruitment and retention issues relating to the following staff types:
Care / Support Workers.
Social Workers.
Allied Health Professionals.
Registered Nurses.
Mental Health Officers2.
Managers.
2 Recruitment and retention
There were both past and anticipated difficulties in recruiting many of the staff types mentioned above:
Most respondents reported that their organisation has experienced difficulties, either regularly or occasionally, in recruiting care or support workers, registered nurses, mental health officers, managers and social workers.
Most also anticipated some increase in difficulty in recruiting care or support workers and registered nurses.
1 Child care agencies, childminding and day care of children were not included in the remit.
2 Mental health officers are Social Workers who have completed the relevant training.

2
The most commonly used method of recruitment, for most staff types, was online recruitment websites.
In relation to staff retention, the majority of respondents have experienced difficulty, either regularly or occasionally, in retaining care or support workers; many also report difficulties in retaining mental health officers, managers and social workers.
Most also anticipate an in increase difficulties in retaining care or support workers.
The majority of respondents agreed to some extent that recruitment and retention issues have had a negative impact on both level and quality of service.
3 Challenges
One main issue identified by respondents to the online survey was that of low pay. This issue was seen as a particular challenge in recruiting most types of staff and also in retaining care or support staff in particular.
In relation to retention, high workloads were cited by many respondents as a key challenge in retaining most other types of staff.
Both in the online survey and during the qualitative interviews, respondents were able to expand on the challenges they face in recruitment and retention. The main points are summarised below.
Pay, funding and competition
Many comments from respondents related to the introduction of the ‘Living Wage’ (£8.25 per hour) due to be implemented in October 2016.
While respondents were supportive of this initiative, many felt that it had not been fully
thought through. Respondents commented that it presents a massive array of challenges
to recruitment and retention including:
Inconsistencies in the way that this is being implemented and funded across local authorities.
That while providers are expected to implement the increase, this is not being fully funded.
That the implementation will have a major impact on pay differentials between different grades of staff, for example between auxiliary staff and care or support staff; between day staff and those working at night; or between care or support staff and those who manage them.
One main issue anticipated related to the recruitment and retention of managers as, respondents feel, the difference in complexity of the work undertaken by managers in relation to the work of those who they manage is not matched by the pay that providers are able to offer.
A recurring comment in relation to commissioning or funding was the need for increased local authority funding. Respondents felt that a lack of funding detracts

3
from the capacity to recruit and retain high quality candidates and to offer training and development to staff.
Respondents were concerned that the commissioning process does not allow providers to offer guaranteed hours and this was seen as a major issue in relation to recruitment.
Several respondents mentioned issues with competition from other sectors, with comments that there is high demand and competition for the same pool of potential staff or that staff are lost to other sectors.
Respondents reported that staff can earn more in the retail or hospitality sectors. In addition, many commented that local authorities are able to offer more competitive rates, terms and conditions for similar posts.
Terms and conditions
Issues around staff not wanting to work out of hours or anti-social hours and the demand for flexible working patterns were seen by online respondents as challenges in recruiting and retaining care or support workers.
Several respondents reported that the type of work as well as anti-social hours can be a deterrent. One key issue related to staff wanting to work limited, flexible or, alternatively, set hours and providers not being able to offer these because of service demands.
Qualifications and training requirements
The online data indicates that training and qualification requirements are seen as having a positive effect of retention, however, this differs from the findings in relation to recruitment where many felt that training and qualification requirements did not have an impact.
Qualifications and training as well as registration requirements featured in discussions, with respondents voicing concern that they would lose staff once they are required to get higher levels of qualifications in order to register.
The requirement for qualifications and training was also raised specifically in relation to care or support workers. Several respondents commented that, while this is applauded, it also raises a number of challenges including a lack of funding for training.
Skills, increased responsibility or workloads
The online data shows that high workloads are seen as a particular barrier to retention for social workers and managers.
During discussions there were also comments in relation to increased responsibility or workloads, specifically, that staff have an increasing workload and more complex roles but that this is not recognised by the pay levels offered.

4
Several of those interviewed also mentioned the issue of career pathways; there were comments that there is a lack of career progression for social workers.
Respondents commented that the skills required in the sector have changed and are changing and that there is a challenge in reconciling the career opportunities, skills needed and the pay that is typically on offer in the sector.
The availability of skills or a lack of relevant skills emerged, in the online survey, as a main barrier to recruitment; particularly in relation to managers.
Respondents commented on a general lack of candidates with relevant skills while others raised the issue of a lack of candidates with experience. Respondents felt that these issues would increase as many of, what is seen as an ageing workforce, retire and there is an increasing need to attract new people into the sector
The image of the social service sector
The online data shows that a large majority of respondents feel that more positive stories about, or promotion of, social care would help aid recruitment; many also feel it would help retention. During discussions, many respondents commented that it is difficult to attract candidates as the social service sector is seen as less appealing and is seen as having a lower status than, for example, the NHS.
Respondents wanted to see this issue addressed and provided suggestions as to how this could be achieved. These included a high profile campaign aimed at increasing the value placed on the sector, and those that work in it, by the general public. Respondents also commented on the need for more publicising of good news and success stories from the sector. There was a feeling that there should be a single body, a coalition of existing bodies, or some other national approach to raising the profile and promoting the value of the sector.
Issues around diversity
Several respondents commented on the need to recruit younger people to the sector given the ageing workforce. However, respondents felt that working in the care sector is not being promoted well as a career option and so is never top of mind, despite the fact that it is a sector that will need increasing numbers of staff.
It appears, from comments made by respondents, that there is already some work underway across the country to address this issue. Respondents reported work with universities, colleges and schools to promote careers in the sector to young people as well as increases in the use of modern apprenticeships and also voluntary placements.
Issues around geography
Respondents reported that one of the main issues in recruiting and retaining staff in rural areas relates to transport, for example the expense of running a car or a lack of public transport. Declining numbers of young people in rural areas, reducing the available pool of applicants, was also seen as an increasing problem.

5
4 Mitigation
In relation to measures used to mitigate against the issues faced in relation to recruitment, the use of improved recruitment materials (more user-friendly) and support for applicants was identified as most successful by online respondents.
When asked about measures used to address retention issues, many online respondents identified the use of pay increases as the most successful.
During the qualitative phase of research, several mitigation measures mentioned by respondents related to finding ways of increasing the number of young people entering the profession and selling careers in the social service sector to young people.
Organisations have different initiatives to improve on recruitment and retention and examples include: changes to hours, terms or conditions; paying for training and support for staff working towards qualifications; recruiting internally; better interviewing and induction and better management; bonuses for staff who help recruit others; more or better use of recruitment events and websites; building links in the community, with education establishments, with job centres and with other relevant organisations; and offering better career opportunities.
The online survey asked specifically about the use of a shared recruitment platform and almost half of those who replied felt that this would benefit the sector as a whole. Respondents also made suggestions for other approaches that could be developed in the future to help counteract issues of recruitment and retention. These included new approaches to funding qualifications; new or joint approaches to training resources or making training more portable; more partnership working or restructuring services; better career paths and career opportunities; more innovative approaches to advertising.
5 Workforce planning
Almost all respondents reported that their organisation discusses workforce planning at senior levels and collects a variety of workforce data. Most collect data on current staff numbers and costs, current vacancies and current training activity.
Most organisations use this information for budget setting, day to day management and planning for short-term needs.
Relatively few use any sort of formal planning tools; the one most widely used is the SSSC Workforce Planning Guide. Indeed, tools seem to be used particularly in relation to training and skills needs, with use for workforce planning less in evidence. Planning for training needs appears to be well in hand in most organisations, although respondents commented that issues around changes to training requirements and funding for training can impact plans.
There was acknowledgement that issues, in particular the ageing workforce, mean that workforce planning does need to be addressed. However, there were also

6
comments that planning is very reliant on budgets and that it is not easy to forecast factors such as future demand and future funding.
It appears that there is an appetite for a national planning tool, and acknowledgement that there is a need to describe the sector; the scale, volume and capacity; as well as an increasing need to quantify and describe the value of social care, particularly within the integrated landscape.
Respondents did, however, identify a number of potential issues including: the need for any tool to be used consistently; also that any tool would need to be able to adapt to local needs; that there would have to be training available; and that any tool would need to be built on robust information.
There were queries over whether such a tool would be effective for service needs which can change daily and also whether it is possible to plan for the long term in a sector which is affected by many changes such as demographics and funding.

7
1 Introduction This report presents the findings from research amongst a range of stakeholders across much of the social service sector in Scotland3. One hundred and sixty-three stakeholders, representing organisations from a wide range of areas and service types and employing several thousand service sector staff across the voluntary, independent and public sectors, took part in an online survey. Fifty of these respondents also gave more detailed information via telephone discussions.
1.1 Background
In 2015, members of the Social Work Services Strategic Forum, key stakeholders working in the social service sector, published ‘Social Services in Scotland, a shared vision and strategy 2015 – 2020’. The Vision is for a:
“socially just Scotland with excellent social services delivered by a skilled and valued workforce which works with others to empower, support and protect people, with a focus on prevention, early intervention and enablement.” Recruitment and retention of staff working in the social service sector has long been seen as key to improving service provision, standards and outcomes.
In the last five years, a number of studies and reports, in Scotland and across the UK, have examined recruitment and retention issues and the Vision and Strategy highlights the benefits associated with improved recruitment and retention. These benefits include time, cost and an improvement in consistency and continuity for people who use services.
1.2 Research requirements
In February 2016, the Social Work Services Strategic Forum, through the Office of the Chief Social Work Adviser, commissioned a review of the recruitment and retention challenges that the Scottish social service sector faces. The findings from the research will be considered by the Strategic Forum in order to better inform national policy development going forward. In March 2016, the remit of this work was expanded to include gathering information on workforce planning and workforce planning tools. The research had the following elements:
A literature review to look at the recruitment and retention knowledge and evidence already available and, from this, to identify gaps in the data.
An online questionnaire amongst the full range of stakeholders.
Qualitative in-depth interviews to explore the detail behind the data.
The findings from this review will be considered by stakeholders from across the sector through the Social Work Services Strategic Forum.
3 Child care agencies, childminding and day care of children were not included in the remit.

8
1.3 Methodology
The brief called for a literature review aimed at summarising existing recruitment and retention knowledge and identifying gaps in the data. These findings were used to aid the design of materials for the next stages of research. A summary of findings is included in Appendix 1.
Forum members reported that there have been several recent pieces of research around social services and that these have involved their members and stakeholders completing surveys or taking part in interviews. Members were particularly keen to avoid asking people to provide information they have already provided recently in other research. The online survey and subsequent interviews, therefore, focused on gaps in existing information.
The online survey was developed in conjunction with the Forum and the survey link was issued via the networks of Scottish Care, CCPS, SWS and SOLACE. In addition, Forum members advertised the survey link via using their own communication methods such as websites and newsletters. The survey was available for completion during June and July 2016.
The survey looked at:
Staff recruitment.
Staff retention (including performance and review).
Workforce planning / development.
Although the survey was widely advertised, it was up to individual respondents to decide whether or not to reply. It should be noted, therefore, that while the survey gave those who wished to comment an opportunity to do so, given the self-selecting nature of this type of exercise, any figures quoted here cannot be extrapolated to a wider population outwith the respondent sample.
The online methodology offered an easily accessible route to completion for those who wished to take part and ensured a wide geographical spread and cost-effective methodology. However, the survey had to be limited to ensure that the time taken to complete would not prove onerous or off-putting; this meant that it was not possible to ask all respondents all of the questions4. Instead, respondents were asked to state their main area of involvement and were then directed to the set of questions relevant to that area; recruitment or retention/review or workforce planning.
It should be noted that while 163 responses can be regarded as a robust sample; representing organisations employing several thousand members of the workforce and covering the whole of Scotland and all service types, when broken down into sub groups some base sizes do become small.
4 The survey questions are included in Appendix 2.

9
As shown in the following table, almost all of those who replied (154 out of 163) had some involvement in recruitment, retention or workforce planning.
Nine respondents who said they had no direct involvement in recruitment, retention or workforce planning were directed to a general comments section in the survey rather than to the specific question sets.
Almost all of the 154 respondents involved in the areas of interest to this survey had some involvement in recruitment and retention and almost half said their main area of involvement was workforce planning (73 respondents).
The following table shows the responses.
Table 1.1: Areas of involvement
All areas*
(Base: 163)
%
Main area**
(Base: 154)
%
Main area
Number
Staff recruitment 87 19 29
Staff retention 85 6 9
Staff performance / review 86 28 43
Workforce planning / development 91 47 73
None of these 6 - -
Source: Q2b & Q2c * Figures do not add to 100% as respondents could choose multiple options ** Figures may not add to 100% due to rounding
As respondents only answered the section of the questionnaire relevant to their main area of involvement, the base sizes for the questions relating to recruitment (29 respondents) and retention/review (52 respondents) are low and should be regarded as indicative only.
Given the low base size, in the chapter relating to recruitment, numbers rather than percentages have been used.
1.4 Online survey respondent profile
Respondents were asked to provide some information about their organisation and themselves. This information allowed us to look for differences and commonalities across different types of sector, providers, size of organisation and geographic location.
The following paragraphs outline the profile of the organisations represented by respondents. Where possible and relevant, information from the SSSC’s ‘Scottish Social Service Sector: Report on 2014 Workforce Data5’ has been referenced to give some idea of how this profile compares with the overall sector profile.
5 http://data.sssc.uk.com/images/WDR/WDR2014.pdf

10
It should be noted, however, that the sample for this survey was self-selecting rather than a targeted representative sample. In addition, the SSSC data includes services that were not covered in the remit of this research; child care agencies, childminding and day care of children. The SSSC data is also based on workforce numbers and active services whereas all data reported from our survey is based on organisations. Therefore these references should be taken as illustrative and should not be used to make direct comparisons.
1.4.1 Sector
Data from the SSSC indicates that 27% of the social service workforce works in the voluntary sector, 31% in the public sector and 41% in the private sector.
The following tables present a summary of the profile information from the 154 respondents who completed this survey and who were involved in one of the specific question areas. The first table looks at the sector represented by respondents and shows that almost half of the 154 respondents (49%) who were involved in recruitment, retention or workforce planning were from organisations in the voluntary (not for profit) or 3rd sector.
Table 1.2: Sector
Main area of involvement*
Total
(Base: 154)
%
Recruitment
(Base: 29)
%
Retention /
Review
(Base: 52)
%
Workforce
Planning
(Base: 73)
%
Voluntary (Third) sector provider /
employer 49 66 40 49
Independent (Private) provider /
employer 22 17 25 22
Local Authority Department 16 3 25 14
Health and Social Care Partnership 8 7 10 7
Other 5 7 - 8
Source: Q1a * Figures may not add to 100% due to rounding
Organisations in the ‘other’ category included: membership organisations; government, regulatory and representative bodies; an organisation involved in media; and a public sector funded provider.
1.4.2 Employees
In 2014, the social service sector in Scotland employed almost 200,000 people; this represents almost 8% of Scottish employment.
Respondents were also asked about the number of employees in their organisations and, as can be seen in the table below, the highest proportion (42%) came from large organisations with over 500 employees; many of these were local authorities or large voluntary organisations working across all or much of Scotland.

11
Table 1.3: Employee numbers
Total
(Base: 154)
%
Independent
sector
(Base: 38)
%
Public
sector
(Base: 40)
%
Voluntary
sector
(Base: 76)
%
25 or fewer 8 24 5 3
26 - 50 8 13 - 9
51 - 100 12 26 - 12
101 - 250 19 26 5 22
251 – 500 10 8 5 13
Over 500 42 3 83 41
Not applicable 1 - 3 -
Source: Q1f * Figures may not add to 100% due to rounding
1.4.3 Staff types
The review considered the following range of staff types working within the social service sector:
Auxiliary - Administrative / Support Staff e.g. clerical, finance and HR and/or Ancillary (catering, domestic, gardening ) staff.
Care / Support Workers - providing direct care and support (e.g. support workers in a care home service or care at home services) and/or may supervise work of other care staff and contribute to assessment of care needs and development and implementation of care plans (e.g. senior residential care / support workers).
Social Workers.
Allied Health Professionals – e.g. Occupational Therapists, Speech and Language Therapists, Dieticians, Physiotherapists etc.
Registered Nurses.
Mental Health Officers6.
Managers: Unit / Project Manager - have responsibility for the management of care and service provision in a discrete service delivery area.
Managers: Group Manager - have overall responsibility for the management of care and service provision in two or more discrete service delivery areas (e.g. a group of care homes, a care home comprising a number of service delivery units).
6 Mental health officers are social workers who have completed the relevant training; almost all mental
health officers are employed by local authorities.

12
Managers: Director / Chief Executive / Head of Service - highest level of overall responsibility for the management of care and service provision. Staff at this level have a place on their organisation’s governing body.
As shown in the following table, respondents’ organisations employed or represented a variety of staff types; almost all (96%) involved care or support workers, which is to be expected as data from the SSSC indicates that care staff make up 79% of the sector workforce in Scotland.
Table 1.4: Staff types
Total
(Base: 154)
%
Independent
sector
(Base: 38)
%
Public
sector
(Base: 40)
%
Voluntary
sector
(Base: 76)
%
Auxiliary 79 63 83 84
Care / Support Workers 96 97 88 100
Social Workers 36 13 95 16
Allied Health Professionals 24 16 58 11
Registered Nurses 35 42 38 30
Mental Health Officers 21 5 65 5
Unit / Project Manager 79 66 83 84
Group Manager 68 42 83 72
Director / Chief Executive / Head of
Service 79 61 80 88
Source: Q1d * Figures do not add to 100% as respondents could choose multiple options
1.4.4 Respondent role
Respondents were asked about their own role in their organisation and the following table shows that the majority (66%) were directors or managers.
Table 1.5: Respondent role
Total
(Base: 154)
%
Independent
sector
(Base: 38)
%
Public
sector
(Base: 40)
%
Voluntary
sector
(Base: 76)
%
Business owner 5 21 - -
Director / Manager 66 61 58 72
Supervisor 8 11 10 5
HR / payroll 20 16 8 29
Business administration 2 3 - 3
Policy / strategy 11 13 18 7
Other 5 3 13 1
Source: Q2a * Figures do not add to 100% as respondents could choose more than one role
13
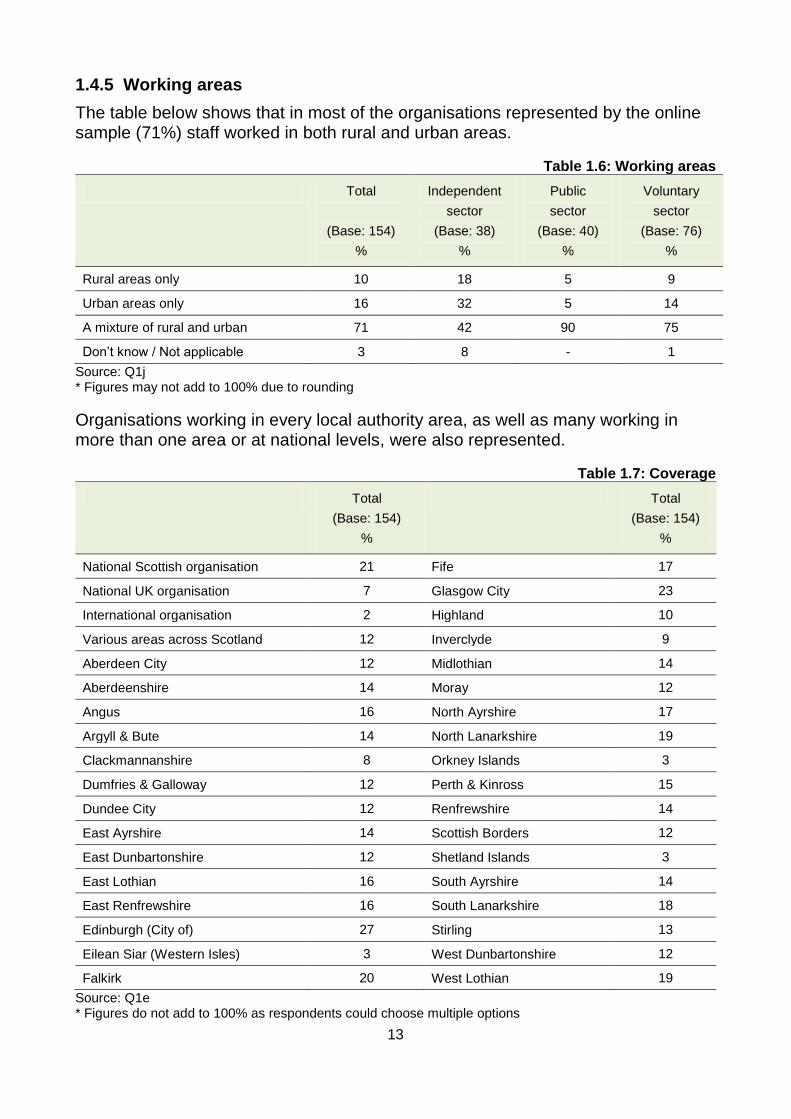
1.4.5 Working areas
The table below shows that in most of the organisations represented by the online sample (71%) staff worked in both rural and urban areas.
Table 1.6: Working areas
Total
(Base: 154)
%
Independent
sector
(Base: 38)
%
Public
sector
(Base: 40)
%
Voluntary
sector
(Base: 76)
%
Rural areas only 10 18 5 9
Urban areas only 16 32 5 14
A mixture of rural and urban 71 42 90 75
Don’t know / Not applicable 3 8 - 1
Source: Q1j * Figures may not add to 100% due to rounding
Organisations working in every local authority area, as well as many working in more than one area or at national levels, were also represented.
Table 1.7: Coverage
Total
(Base: 154)
%
Total
(Base: 154)
%
National Scottish organisation 21 Fife 17
National UK organisation 7 Glasgow City 23
International organisation 2 Highland 10
Various areas across Scotland 12 Inverclyde 9
Aberdeen City 12 Midlothian 14
Aberdeenshire 14 Moray 12
Angus 16 North Ayrshire 17
Argyll & Bute 14 North Lanarkshire 19
Clackmannanshire 8 Orkney Islands 3
Dumfries & Galloway 12 Perth & Kinross 15
Dundee City 12 Renfrewshire 14
East Ayrshire 14 Scottish Borders 12
East Dunbartonshire 12 Shetland Islands 3
East Lothian 16 South Ayrshire 14
East Renfrewshire 16 South Lanarkshire 18
Edinburgh (City of) 27 Stirling 13
Eilean Siar (Western Isles) 3 West Dunbartonshire 12
Falkirk 20 West Lothian 19
Source: Q1e * Figures do not add to 100% as respondents could choose multiple options

14
1.4.6 Service types
The SSSC workforce data shows that the two largest service types in the social service sector in Scotland are housing support/care at home (employing almost 66,000 staff) and care homes for adults (just under 55,000).
This survey presented a list of service types and asked respondents to identify the areas in which their organisation operated. All of the services listed in the survey were represented in the sample; the largest proportion (66%) involved care at home support services and more than half (56%) involved housing support services.
Table 1.8: Service types
Total
(Base: 154)
%
Independent
sector
(Base: 38)
%
Public
sector
(Base: 40)
%
Voluntary
sector
(Base: 76)
%
Adoption service 14 - 55 -
Adult day care 36 5 68 36
Adult placement service 18 3 58 4
Residential Care homes for older
people 31 21 63 20
Nursing care for older people 19 37 30 5
Central and strategic staff 21 5 65 7
Fieldwork service (adults) 27 3 68 17
Fieldwork service (children) 23 - 75 8
Fieldwork service (generic) 16 - 53 4
Fieldwork service (justice) 19 - 65 4
Fostering service 17 - 60 3
Housing support service 56 24 53 74
Care at home support service 66 47 68 75
Nurse agency 3 5 8 -
Offender accommodation service 10 5 20 8
Substance misuse / Addiction
services 25 5 60 16
Residential child care (includes
secure accommodation services) 29 13 63 18
School care accommodation
(residential schools) 9 5 18 7
Other 17 16 15 18
Not applicable 1 - 1 -
Source: Q1c * Figures do not add to 100% as respondents could choose multiple options
Child care agencies, childminding and day care of children were not included in the remit of this research.

15
1.5 The recruitment and retention landscape
In order to form a picture of the landscape in which respondents are seeking to recruit and retain staff, the online survey included some questions about terms and conditions within organisations.
1.5.1 Zero hours contracts
Respondents were asked if their organisation makes use of zero hours contracts.
Data from the SSSC indicates that around 10% of the workforce in Scotland are on some type of zero-hours contracts and 40% of the organisations in this survey make use of zero-hours contract for any employees. As can be seen in the chart below, the use of zero hours contracts was highest amongst organisations in the voluntary sector (50%) and lowest in the public sector (18%).
Chart 1.1: Use of zero hours contracts
Source: Q1g * Figures may not add to 100% due to rounding
1.5.2 Use of pay freeze
Respondents were also asked whether their organisation has, or intends to, make use of a pay freeze. While most had not (51%), 32% said that they had and this number rose to 43% within the voluntary sector.
Chart 1.2: Whether made use of a pay freeze
Source: Q1i * Figures may not add to 100% due to rounding
40%
51%
9%
39%
55%
5%
18%
58%
25%
50% 46%
3%
0%10%20%30%40%50%60%70%80%90%
100%
Yes No Don't know / Not applicable
Total (Base: 154) Independent sector (Base: 38)
Public sector (Base: 40) Voluntary sector (Base: 76)
32%
3%
51%
13% 16%
3%
63%
18% 28%
3%
48%
23%
43%
4%
47%
5%
0%10%20%30%40%50%60%70%80%90%
100%
Yes within the last 2years
No but it is planned forthe next year
No / not within the last2 years
Don't know / Notapplicable
Total (Base: 154) Independent sector (Base: 38)
Public sector (Base: 40) Voluntary sector (Base: 76)

16
1.5.3 Living wage
In April 2016, the UK Government introduced a law requiring all employers to pay the ‘national Living Wage’7 (this replaced the National Minimum Wage). This means that all employees aged 25 or over and not in the first year of an apprenticeship, are legally entitled to at least £7.20 per hour.
The survey asked respondents whether their organisation paid the £7.20 per hour to those legally entitled or to all workers. As can be seen in the following chart, the majority paid the amount to all workers.
Chart 1.3: Payment of national Living Wage (set by the UK government)
Source: Q1h * Figures may not add to 100% due to rounding
The new ‘national Living Wage’ is different from the ‘Living Wage8’, which was launched in 2001. The ‘Living Wage’ is an hourly rate of pay set independently and updated annually by the Living Wage Foundation and is calculated according to the basic cost of living in the UK. Employers choose to pay the ‘Living Wage’ on a voluntary basis.
The Scottish Living Wage Accreditation Initiative9 was established in April 2014 in order to promote this higher rate and to recognise Scottish employers who pay their staff the ‘Living Wage’. The Initiative works in partnership with the Living Wage Foundation and is funded by the Scottish Government.
The 2016/17 budget settlement included a commitment made by the Scottish Government and local government with additional resources allocated to health and social care partnerships to enable payment of the ‘Living Wage’ of £8.25 per hour from October 1st 2016 to care workers providing direct care and support to adults in care homes, care at home, and housing support.
7 https://www.livingwage.gov.uk/
8 http://www.livingwage.org.uk/
9 http://scottishlivingwage.org/
88%
6% 6%
84%
11% 5%
83%
3%
15%
93%
5% 1%
0%
10%
20%
30%
40%
50%
60%
70%
80%
90%
100%
Yes to all workers Yes where legally required Don't know / Not applicable
Total (Base: 154) Independent sector (Base: 38)
Public sector (Base: 40) Voluntary sector (Base: 76)

17
The online survey asked about the impact of the ‘national Living Wage’ (£7.20 per hour), as this had already been introduced. However, the impact of the introduction of the ‘Living Wage’ (£8.25 per hour) was raised by many respondents during the qualitative interviews and these points are discussed later in this report.
1.5.4 Use of staff surveys
One final information question asked whether organisations make use of staff surveys to obtain views and feedback from staff. The following chart shows that most do so; over half survey their staff annually (59%) with 33% carrying out their staff survey less frequently.
Chart 1.4: Whether make use of a staff survey
Source: Q1k
* Figures may not add to 100% due to rounding
1.6 Qualitative respondent profile
At the end of the online survey, respondents were asked to state their willingness to provide more detailed feedback by way of a telephone interview and 72 said yes.
Initial data from the online survey was used to develop a topic guide for the interviews, which again included questions on each of the areas noted above. The discussions covered the headings in these topics but gave respondents the opportunity to talk in-depth about any areas of particular interest to themselves or their organisations.
The telephone interviews were carried out with 50 of these respondents from across geographical areas; organisation, service and staff types, and roles. Interviews were conducted during July and early August 2016. Discussions focused either on recruitment and retention or on workforce planning, with 40 focusing on issues mainly related to recruitment and retention and ten with a greater focus on workforce planning matters:
59%
33%
6% 1%
68%
18% 11%
3%
53%
40%
5% 3%
58%
37%
5%
0%10%20%30%40%50%60%70%80%90%
100%
Yes annually Yes less frequently No Don't know / Notapplicable
Total (Base: 154) Independent sector (Base: 38)
Public sector (Base: 40) Voluntary sector (Base: 76)

18
Table 1.9: Qualitative interviews
Interview focus
Total Independent
sector
Public
sector
Voluntary
sector
Other
organisation
Recruitment / retention focus 40 12 8 18 2
Workforce planning focus 10 1 4 5 -
Researchers made notes of the discussions and these were discussed and compared to allow the researchers to identify, for example, issues relating to the online data, any common themes, any areas specific to certain sectors or services and any differences of opinion.

19
2 Recruitment
2.1 Areas for research
The literature review indicated the need for additional information in relation to:
Methods used to recruit.
Challenges to recruitment.
Methods used to mitigate against these challenges.
2.2 Profile of respondents
Twenty-nine respondents said that their main area of involvement related to recruitment.
The majority of these respondents (19 out of the 29) came from voluntary sector organisations; five came from the independent sector; three from local authorities or health and social care partnerships and two from other organisations.
Most respondents were owners, managers or directors or their organisation (14) or worked in HR or payroll (14).
All of the service types listed in the survey were represented in the sample; the largest numbers were from care at home support services and housing support services (15 respondents each).
All staff types were represented and all 29 respondents said that their organisation employs or represents care or support workers.
Various sizes of organisations were included; 11 respondents worked in organisations employing fewer than 100 staff while 18 worked in larger organisations (including 12 in organisations employing over 500 staff).
Staff in these organisations worked predominantly in a mixture of urban and rural areas. The only area of Scotland not represented in the recruitment part of the sample was Eilean Siar (Western Isles).
The following sections present data from the online questionnaire completed by these 29 respondents.
As noted earlier in this report the small base size means that any figures quoted here should be regarded as indicative only.

20
2.3 Recruitment difficulties
The online survey sought to establish whether respondents’ organisations have experienced difficulties in recruiting particular types of staff. Respondents were asked: ‘In the past 2 years, how frequently have you encountered difficulties in recruiting …..’:
Care / Support Workers.
Social Workers.
Allied Health Professionals.
Registered Nurses.
Mental Health Officers10.
Managers.
The following table shows the responses to this question; each column is based on the numbers who said they employ each particular type of staff and, again, the small base sizes should be borne in mind. Most respondents reported that their organisation has experienced difficulties, either regularly or occasionally, in recruiting care or support workers (26 out of the 29 who recruit this type of staff), registered nurses (7 out of 10), mental health officers (4 out of 6), managers (15 out of 24) and social workers (5 out of 8).
Table 2.1: Whether had difficulties in recruiting staff types
Care /
Support
Workers
(Base: 29)
Social
Workers
(Base: 8)
Allied Health
Professionals
(Base: 5)
Registered
Nurses
(Base: 10)
Mental
Health
Officers
(Base: 6)
Managers
(Base: 24)
Regularly 21 2 - 7 3 6
Occasionally 5 3 1 - 1 9
Never 2 1 - - - 3
Don’t know 1 2 4 3 2 6
Source: Q3a
The majority of respondents have regularly experienced difficulties in recruiting care or support workers (21 out of 29). Looking at the data across sectors shows that this proportion was highest in the voluntary sector and lowest in the independent sector:
Independent sector (3 out of 7).
Public sector (2 out of 3).
Voluntary sector (16 out of 19).
10
Mental health officers are social workers who have completed the relevant training; almost all mental
health officers are employed by local authorities.

21
2.4 Time taken to fill vacant posts
Online respondents were also asked to give an indication of the length of time taken to fill vacant posts; again most respondents commented on care or support workers or managers with few providing details for other staff posts.
The table below shows responses to this question; again, each column is based on the numbers who said they employ each particular type of staff and again the small base sizes should be borne in mind.
As shown in the following table, a majority (21 out of 29) said that it takes between one and three months to fill vacant care or support worker posts; five take on average less than a month, while one reported that it takes over three months.
Table 2.2: Time to fill vacant posts
Care /
Support
Workers
(Base: 29)
Social
Workers
(Base: 8)
Allied Health
Professionals
(Base: 5)
Registered
Nurses
(Base: 10)
Mental
Health
Officers
(Base: 6)
Managers
(Base: 24)
Within a month 5 1 - - - 2
1-3 months 21 3 2 2 3 10
More than 3 months 1 1 - 5 1 5
Don’t know 2 3 3 3 2 7
Source: Q3d
Comments from respondents who took part in the qualitative interviews indicate that from the initial advert to offering the post can take as a minimum around 10-12 weeks and, respondents commented, applicants can be lost (particularly ancillary staff) in this time period as they will have probably applied for a number of jobs and been offered one elsewhere.
2.5 Changes in difficulty
Respondents were also asked: ‘And looking ahead to the next 2 years, do you expect any changes in the difficulty of recruiting …’: and given the same list of staff types.
The majority anticipated some increase in difficulty in recruiting care or support workers (20 out of 29) and registered nurses (6 out of 10); half of those who replied (3 out of 6) anticipated difficulties in recruiting mental health officers.
As was the case above, each column in the following table is based on the numbers who said they employ each particular type of staff and the small base sizes should be borne in mind.

22
Table 2.3: Whether expect changes in difficulty in recruiting staff types
Care /
Support
Workers
(Base: 29)
Social
Workers
(Base: 8)
Allied Health
Professionals
(Base: 5)
Registered
Nurses
(Base: 10)
Mental
Health
Officers
(Base: 6)
Managers
(Base: 24)
Expect much greater
difficulty 10 1 - 3 2 4
Expect a little more
difficulty 10 1 - 3 1 7
No change expected 7 4 2 1 1 6
Expect less difficulty 1 - - - - -
Don’t know 1 2 3 3 2 7
Source: Q3b
2.6 Recruitment methods
Respondents were asked: ‘What are the main methods that you use to recruit staff?’ Results show that the most common method used in recruitment was online recruitment websites; the most common methods for each staff type were: Care / Support Workers: online recruitment websites (25 out of the 29
respondents who employ this type of staff) and word of mouth (23 out of 29)
Social Workers: online recruitment websites (6 out of 8) and internal vacancy adverts (5 out of 8)
Allied Health Professionals: online recruitment websites (2 out of 5)
Registered Nurses: online recruitment websites (5 out of 10) and internal vacancy adverts (5 out of 10).
Mental Health Officers: online recruitment websites (4 out of 6)
Managers: online recruitment websites (16 out of 24) and internal vacancy adverts (14 out of 24).
Other recruitment methods mentioned by respondents included:
Care or support workers: posters or flyers; open days; recruitment events and attending fayres; guest lecturing at colleges and other interaction with universities or colleges; social media; or radio.
Managers: social media.

23
2.7 Recruitment challenges
Respondents were also asked: ‘Which of the following would you say represents the single greatest challenge in recruiting each of these staff types?’ Results show that the most common challenge to recruitment is that of low pay; the main challenges mentioned in relation to recruiting each staff type were: Care / Support Workers: low pay (20 out of the 29 respondents who employ this
type of staff) and competition from other sectors (20 out of 29)
Social Workers: low pay (5 out of 8)
Allied Health Professionals: each of the five respondents gave different answers
Registered Nurses: demand for flexible working patterns, limited career opportunities or pathways and not wanting to work out of hours / anti-social hours (each mentioned by 3 of the 10 who employ registered nurses).
Mental Health Officers: low pay and availability of skills or lack of relevant skills were (each mentioned by 3 of the 6 who employ mental health officers)
Managers: low pay (10 out of 24) and availability of skills or lack of relevant skills (9 out of 24).
2.8 Mitigating against recruitment challenges
Respondents were then asked: ‘What measures have you used to address or mitigate the particular issues you have faced in relation to recruitment over the past 2 years?’ and were also invited to rate the success of these measures, on a scale of 1 to 10 (where 1 is not at all successful and 10 is completely successful).
An average score (out of 10) was calculated for each measure and is also shown in the table below; the nearer to 10, the higher the perceived success.
As can be seen in the following table, the use of ‘improved recruitment materials (more user-friendly) and support for applicants’ gained the highest rating (6.75 out of 10).

24
Table 2.4: Mitigation methods
All staff types
(Base: 29)
Average score
out of 10
Improved recruitment materials (more user friendly) and support
for applicants 17 6.75
Shared recruitment platforms 4 6.67
Enhanced pay 14 6.08
Flexible and agile working 13 6.08
In-house training / paying for training 23 5.90
Enhanced employment conditions 12 5.67
Increased opportunities for in-house staff to move post 8 5.63
Increase in advertising / positive promotion of the sector / service 19 5.00
Shared advertising / positive promotion of the sector / service 2 5.00
Increased use of employment agencies 9 3.56
Offer to pay registration fees / disclosure fees 7 2.80
Source: Q4b and Q4c
2.9 Other factors relating to recruitment
Various factors that may have a bearing on recruitment were highlighted during the literature review or from discussions with Forum members. The survey sought to test views on these factors by asking respondents the extent to which they agreed or disagreed with a series of statements.
The first of these looked at the impact of recruitment issues on both level and quality of service. As shown in the chart below, the majority of respondents agreed to some extent that recruitment issues have had a negative impact on both level (25 out of 29) and quality (22 out of 29) of service.
Chart 2.1: Agreement with statements (Base: 29)
Source: Q5
0% 10% 20% 30% 40% 50% 60% 70% 80% 90% 100%
Recruitment issues have had adirect negative impact on ourability to deliver the quality of
service we would like
Recruitment issues have had adirect negative impact on ourability to deliver the level of
service we would like
Agree strongly Agree slightly Neither agree nor disagree
Disagree slightly Disagree strongly Don't know / No reply
12 13
1 1
2
11 11 5 2

25
Respondents were also asked about pay and training with the largest proportions neither agreeing nor disagreeing that the UK Living Wage directive has had a positive impact on their ability to recruit to posts (13 out of 29) or that the opportunity to be trained and gain qualifications in order to be registered has had a positive impact on their ability to recruit posts (14 out of 29). Most of those who disagreed with these statements came from the voluntary sector.
Chart 2.2: Agreement with statements (Base: 29)
Source: Q5
Statements about methods of recruitment saw almost half of respondents (14 out of 29) agreeing to some extent that a shared recruitment platform for all vacancies would benefit the sector as a whole. More disagreed to some extent (13 out of 29) than agreed (10 out of 29) that in the last 2 years they have seen an increase in their use of employment agencies as an aid to recruitment.
Chart 2.3: Agreement with statements (Base: 29)
Source: Q5
0% 10% 20% 30% 40% 50% 60% 70% 80% 90% 100%
The opportunity to be trained andgain qualifications in order to be
registered has had a positiveimpact on our ability to recruit
posts
The UK Living Wage directive hashad a positive impact on our ability
to recruit to posts
Agree strongly Agree slightly Neither agree nor disagree
Disagree slightly Disagree strongly Don't know / No reply
7 13 4 2 3
2 6 14 2 5
0% 10% 20% 30% 40% 50% 60% 70% 80% 90% 100%
In the last 2 years we have seenan increase in our use of
employment agencies as an aid torecruitment
A shared recruitment platform forall vacancies would benefit the
sector as a whole
Agree strongly Agree slightly Neither agree nor disagree
Disagree slightly Disagree strongly Don't know / No reply
5
3 7 6 3 10
9 7 3 3 2

26
Finally, respondents were asked whether they agreed or disagreed that more positive stories about / or promotion of social care would help aid recruitment. As shown in the chart below, most (24 out of 29) agreed.
Chart 2.4: Agreement with statements (Base: 29)
Source: Q5
0% 10% 20% 30% 40% 50% 60% 70% 80% 90% 100%
More positive stories about / orpromotion of social care would
help aid recruitment
Agree strongly Agree slightly Neither agree nor disagree
Disagree slightly Disagree strongly Don't know / No reply
22 2 5

27
3 Retention
3.1 Areas for research
Findings from the literature review highlighted the need for further information on:
Challenges to retention.
Ways being used to mitigate against these challenges.
Many of the issues discussed in the previous chapter on recruitment were also apparent in relation to retention or review.
3.2 Profile of respondents
Fifty-two respondents said that their main area of involvement related to retention. This relatively small base size means that any figures quoted here should be treated with caution.
Respondents came from voluntary sector organisations (21 out of the 52), the independent sector (13) and the public sector (18 including 13 from local authorities and five from health and social care partnerships).
Most respondents were owners, managers or directors or their organisation (38) or worked in HR or payroll (9).
All of the service types listed in the survey were represented in the retention sample; the largest numbers were from care at home support services (34 respondents). All staff types were represented and most respondents (48) said that their organisation employs or represents care or support workers. Various sizes of organisations were included; 14 respondents worked in organisations employing fewer than 100 staff while 38 worked in larger organisations (including 21 in organisations employing over 500 staff).
Staff in these organisations worked predominantly in a mixture of urban and rural areas. The only area of Scotland not represented in the sample for the retention questions was the Shetland Islands.
The following sections present data from the online questionnaire completed by these 52 respondents.
3.3 Retention difficulties
The online survey sought to establish whether respondents have experienced difficulties in retaining particular types of staff. Respondents were asked: ‘In the past 2 years, how frequently have you encountered difficulties in retaining …..’:
Care / Support Workers.
Social Workers.

28
Allied Health Professionals.
Registered Nurses.
Mental Health Officers.
Managers.
The following table shows the responses to this question; each column is based on the numbers who said they employ each particular type of staff and, again, the small base sizes should be borne in mind. Most respondents reported that their organisation has experienced difficulties, either regularly or occasionally, in retaining care or support workers (41 out of the 48 who employ this type of staff), mental health officers (11 out of 13), managers (23 out of 42) and social workers (15 out of 21).
Table 3.1: Whether had difficulties in retaining staff types
Care /
Support
Workers
(Base: 48)
Social
Workers
(Base:21)
Allied Health
Professionals
(Base: 14)
Registered
Nurses
(Base: 18)
Mental
Health
Officers
(Base: 13)
Managers
(Base: 42)
Regularly 22 6 1 6 4 8
Occasionally 19 9 5 1 7 15
Never 6 4 2 5 - 14
Don’t know 1 2 6 6 2 5
Source: Q7a
Respondents were also asked: ‘And looking ahead to the next 2 years, do you expect any changes in the difficulty of retaining …’: and given the same list of staff types as above. The following table shows that a majority (34 out of 48) anticipate difficulties in retaining care or support workers.
Table 3.2: Whether expect changes in difficulty in retaining staff types
Care /
Support
Workers
(Base: 48)
Social
Workers
(Base:21)
Allied Health
Professionals
(Base: 14)
Registered
Nurses
(Base: 18)
Mental
Health
Officers
(Base: 13)
Managers
(Base: 42)
Expect much greater
difficulty 17 4 1 5 3 8
Expect a little more
difficulty 17 5 3 2 2 8
No change expected 11 5 5 6 5 16
Expect less difficulty 3 3 - - 1 4
Don’t know - 4 5 5 2 6
Source: Q7b

29
3.4 Retention challenges
Respondents were asked: ‘Which of the following would you say represent the greatest challenge in retaining staff?’ and results show the main challenges mentioned in relation to retaining each staff type were:
Care / Support Workers: low pay (30 out of the 48 respondents who employ this type of staff), competition from other sectors (29 out of 48) and registration requirements (27 out of 48)
Social Workers: high workloads (14 out of 21)
Allied Health Professionals: high workloads (3 out of 14)
Registered Nurses: competition from other sectors (5 out of 18)
Mental Health Officers: high workloads (5 out of 13)
Managers: high workloads (13 out of 42)
3.5 Mitigating against retention challenges
Respondents were then asked: ‘Which of the following measures does your organisation use to help address or mitigate against retention issues? ’ and were also invited to rate the success of these measures. An average score (out of 10) was calculated for each measure and is also shown in the table below; the nearer to 10, the higher the perceived success.
Although reducing probation periods received the highest average score (8.00 out of 10), this measure was only mentioned by one respondent. Pay increases were mentioned by 15 respondents and received an average score of 7.53.
Table 3.3: Mitigation methods
All staff types
(Base: 52)
Average score
out of 10
Reducing probation periods 1 8.00
Pay increase 15 7.53
Improved induction processes 22 7.38
Increased opportunities for promotion / career progression 13 7.31
Offering free / low cost training 43 7.27
Open to negotiate flexible working 33 7.00
Giving staff regular opportunities to feedback on concerns 44 6.89
Listening to / acting on staff feedback 44 6.88
Willing to support secondment opportunities 19 6.58
Availability of paid overtime 19 6.58
Additional incentives (bonus / additional leave etc) 11 6.55
Offering ‘time off’ or sabbatical opportunities 11 5.64
Source: Q8a and Q8b

30
3.6 Other factors relating to retention
Various factors that may have a bearing on retention were highlighted during the literature review or from discussions with Forum members. The survey sought to test views on these factors by asking respondents the extent to which they agreed or disagreed with a series of statements.
The first of these looked at the impact of retention issues on both level and quality of service. As shown in the chart below, the majority of respondents agreed to some extent that, as was the case with recruitment, retention issues have had a negative impact on both quality (34 out of 52) and level (31 out of 52) of service.
Chart 3.1: Agreement with statements (Base: 52)
Source: Q9
Respondents were also asked about pay and training and the following chart shows that the largest proportion of respondents agreed that the opportunity to be trained and gain qualifications in order to be registered has had a positive impact on their ability to retain staff (26 out of 52). This finding indicates that training and qualification requirements are seen as having a positive effect of retention and this differs from the finding in relation to recruitment where many felt that these did not have an impact.
The chart below also shows that highest proportions neither agreed nor disagreed that the introduction of the Living Wage directive has had a positive impact on their ability to retain staff (17 out of 52).
0% 10% 20% 30% 40% 50% 60% 70% 80% 90% 100%
Staff turnover is having a negativeeffect on our ability to deliver the
level of service we would like
Staff turnover is having a negativeeffect on our ability to deliver thequality of service we would like
Agree strongly Agree slightly Neither agree nor disagree
Disagree slightly Disagree strongly Don't know / No reply
16 18 7 5 5 1
18 13 7 7 7

31
Chart 3.2: Agreement with statements (Base: 52)
Source: Q9
The following chart shows that, in relation to staffing, the same proportion agreed, as neither agreed nor disagreed, that in the last two years they have seen an increase in their use of overtime to counter retention issues (16 out of 52 for each). Most (27 out of 52) disagreed to some extent that in the last two years they have seen an increase in their use of agency staff to counter retention issues. However, data from those offering specific services shows a different picture; well over half of those offering care home services (10 out of 14) and adult day care (9 out of 15) said they had seen an increase in the use of agency staff.
Chart 3.3: Agreement with statements (Base: 52)
Source: Q9
0% 10% 20% 30% 40% 50% 60% 70% 80% 90% 100%
The introduction of the LivingWage has had a positive impact
on our ability to retain staff
The opportunity to be trained andgain qualifications in order to be
registered has had a positiveimpact on our ability to retain staff
Agree strongly Agree slightly Neither agree nor disagree
Disagree slightly Disagree strongly Don't know / No reply
9 17 11 5 5 5
7 10 18 6 8 3
0% 10% 20% 30% 40% 50% 60% 70% 80% 90% 100%
In the last 2 years we have seenan increase in our use of agencystaff to counter retention issues
In the last 2 years we have seenan increase in our use of overtime
to counter retention issues
Agree strongly Agree slightly Neither agree nor disagree
Disagree slightly Disagree strongly Don't know / No reply
10 6 16 5 11 4
10 9
2
3 24 4

32
Finally, respondents were asked whether they agreed or disagreed that more positive stories about / or promotion of social care would help aid retention. As shown in the chart below, most (36 out of 52) agreed.
Chart 3.4: Agreement with statements (Base: 52)
Source: Q9
0% 10% 20% 30% 40% 50% 60% 70% 80% 90% 100%
More positive stories from orpromotion of social care would
help aid retention
Agree strongly Agree slightly Neither agree nor disagree
Disagree slightly Disagree strongly Don't know / No reply
16 20 10 3 3

33
4 Recruitment and retention issues The online survey invited respondents to include additional comments in relation to the questions in the recruitment and the retention sections and also provided all respondents with the opportunity to add any additional comments at the end of their response. The respondents who took part in the telephone discussions also provided more in-depth comments on a range of issues.
This chapter looks at the main issues identified by respondents, both to the online survey and during telephone discussions. Many of these issues were common to both recruitment and retention. Wherever relevant, data from the online survey, detailed in the preceding chapters, is referenced. The main issues identified by respondents were:
Pay, funding and competition.
Terms and conditions.
Qualifications and training requirements.
Skills, increased responsibility or workloads.
The image of the social service sector.
Issues around diversity.
Issues around geography.
These issues, as well as methods that are being used to mitigate against them, are discussed in more detail in the following sections.
4.1 Issues around pay, funding and competition
Low pay was identified by respondents to the online survey as a major challenge to recruiting many types of staff, particularly care or support workers, managers and social workers. This was also an issue in relation to retention, particularly for care or support workers.
Indeed, a main comment from respondents related to the pay that service providers are able to offer. For example, a respondent from one local authority simply said: “Salary not competitive in this area”. Many respondents simply commented that low pay is a challenge to recruitment.
In relation to challenges to recruiting and retaining both social workers and allied health professionals, a small number of respondents simply said ‘salary’ or ‘salary expectations’.
Several respondents commented on difficulties in recruiting managers, for example: “As a charity we are not able to pay the wages for quality managers that the private and local authority employers can”.
However, responses to the online survey and comments from the interviews show that while the rates of pay available, particularly for care or support workers, are
34
seen by most as issues for recruitment and retention, there is a more complicated picture involving:
the introduction of the £8.25 ‘Living Wage’;
funding and commissioning issues; and/or
competition, both from within and outwith the sector.
These issues are discussed below.
4.1.1 The Living Wage
While some respondents to the online survey felt that the introduction of the ‘National Living Wage’ of £7.20 had had a positive impact on their ability to recruit or retain staff, many felt it had not yet had an impact. Many comments from respondents during interviews focused on the introduction of the ‘Living Wage’ (£8.25 per hour) due to be implemented in October 2016.
The 2016/17 budget settlement included a commitment made by the Scottish Government and local government with additional resources allocated to health and social care partnerships to enable payment of the ‘Living Wage’ of £8.25 per hour from October 1st 2016 to care workers providing direct care and support to adults in care homes, care at home, and housing support. The Living Wage is a shared priority for Scottish Government, COSLA and provider organisations. A ‘Living Wage in Care National Partners Group’ was established to provide collective oversight to the local delivery of the commitment with membership consisting of Scottish Government, COSLA, CCPS, Scottish Care and UNISON.
The majority of respondents fully supported increased pay for workers in the sector and many were were supportive of this initiative.
However, it was clear that respondents felt there could be challenges around its
implementation and some respondents commented that they believed the “on costs” to
have been underestimated in the analysis. These interviews were conducted during July
and August when local negotiations on the arrangements for implementation of the Living
Wage commitment were still underway.
During discussions, some respondents raised concerns including:
That the tender culture is still driving prices down and local authorities are slow and inconsistent in responding to Scottish Government provisions. This means that some national voluntary organisations are withdrawing from parts of Scotland. Other local authorities are requiring that the Living Wage is introduced sooner.
Respondents feel that there are inconsistencies between local authorities which can create problems for national organisations in relation to pay levels between regions or nations. Organisations do not want to be in a position where they are paying different rates for the same job a few miles apart.

35
A small number of respondents said that they had heard that funding will not be passed on by local authorities, meaning that the providers will pay the increased wage but may not receive additional funding to help them do so.
Some respondents reported that agreement on how to resource this commitment had yet to be agreed with the local authority.
Examples of comments on these issues include:
One independent employer commented: “The UK Government [National] Living Wage
has had a massive impact as we are not paid this much by the local authorities, and 95%
of our business comes from local authorities. At the moment it’s difficult to plan as we still
don’t know what we will be paid by the local authorities from this past April; neither do we
know what we will be paid from October and we are likely to be pulling out from some local
authority areas simply because we can’t afford to run our business there. We will have to
make decisions on where we are going to be delivering services” (independent employer).
“One local authority has come out under the framework agreement stating what the fee
would be capped at and they expect the provider to pay the Living Wage out of that. We
are having to withdraw from the North East because we can't afford to do it in a two to one
service" (voluntary organisation).
"One local authority want the Living Wage by 1st August 2016 and as a truly national
organisation we can't pay different rates in different areas" (voluntary organisation).
The impact of the introduction of the Living Wage on pay differentials was also of great concern to many respondents. For example, one voluntary sector provider commented that the pay differential between grades of staff may also have an increasingly negative impact on recruitment: “We used to offer a more attractive wage than our (private) competitors were able to but with the introduction of the Scottish Living Wage in October we may find the differentials reduced”.
There were also several comments that out of hours pay enhancements, when added to the Living Wage would mean that in some cases staff would be earning more than those who manage them. One respondent commented: “The implementation of the Living Wage will have severe consequences in retaining managers. Frontline staff will potentially be earning more than senior managers. ”.
A voluntary sector provider commented: “As the minimum wage rises, but without any corresponding rise in organisational income, it is getting harder and harder to offer differential rates to managers compared to the staff they manage”.
A respondent from a health and social care partnership commented: “Jobs and responsibilities related to managers are ever expanding and there are very few differences between some of our manager graded posts and some of the staff posts that sit beneath them. Many staff are now looking at what the managers are having to deal with, the breadth and complexity of their work load and asking why they would want to do this for very little remuneration?”
4.1.2 Funding and commissioning
The key comment in relation to commissioning / funding was the need for increased local authority funding. There were also comments that a lack of funding detracts

36
from the capacity to recruit and retain high quality candidates and to offer training and development to staff. One organisation in the voluntary sector commented that it is difficult to have long term planning alongside short term funding.
In addition, several respondents mentioned the impact that budget cuts have on their ability to pay a competitive salary. Some commented on the commissioning process for services with one, a voluntary sector provider, saying: “Commissioning via spot purchase does not allow providers to offer set contracts to staff. Sessional work with no guaranteed hours is therefore the norm. This is hopeless for younger people who cannot get a mortgage or have a guaranteed income for their families”.
Many respondents, from the independent and voluntary sectors, commented on issues relating to staff working for organisations with high levels of work coming via local authorities; they said that commissioning process means that employers are unable to guarantee hours and this means that there is no stability for staff.
4.1.3 Competition, both from within and outwith the sector
Several respondents mentioned competition, with comments that there is high demand and competition for the same pool of potential staff or that staff are lost to other sectors. Indeed, in the data from the online survey, competition from other sectors was seen as a main challenge to recruiting and retaining care or support workers to retaining registered nurses.
Many respondents, predominantly from the voluntary sector, also commented on expected difficulties in recruiting care or support workers, saying that they are unable to offer competitive terms and conditions in relation to other sectors or to local authority employers.
There were many comments from respondents that staff can earn more in the retail or hospitality sectors or that local authorities are able to offer more competitive rates for similar posts. Some examples include:
Many respondents commented that staff who are trained in the independent
sector then immediately move to local authorities where pay is typically about 35%-40% better (one example was a current rate of pay of £8.02 compared to £11 per hour from the local authority).
Many respondents also commented that local authorities pay higher hourly rates of pay and also offer better benefits and terms and conditions (e.g. 20% pension).
Several respondents commented that independent and voluntary sector organisations facilitate training and then lose trained staff to local authorities; however most were unable to provide figures and one said that, while there is anecdotal evidence to support this, it is not a reason that is given on staff exit surveys.
Some respondents commented that their local authority had approached some of their staff with offers of work; one commented that local authorities have little or no budget for training care or support workers and therefore look to recruit

37
well trained people from service providers in the independent or voluntary sectors.
“Disproportionate higher salary competition from HSCPs.” (voluntary sector provider in relation to care or support workers, social workers, registered nurses and managers).
There were several comments that staff can earn more money working in the retail sector, doing a job that is less likely to be stressful and demanding and that probably also offers better working hours or shifts.
A small number commented that in areas of high employment and high living costs, those looking for work and already in the area go to other sectors (for example retail) because it is better paid and the work involved is less likely to be taxing. Some respondents commented that there is no hope of attracting people into the area because of low pay and high living costs.
4.2 Terms and conditions
Issues around staff not wanting to work out of hours or anti-social hours and the demand for flexible working patterns were also identified by online respondents as challenges in recruiting and retaining care or support workers and the online data also indicated that conditions of employment are seen as recruitment challenge in recruiting care or support workers and managers.
The SSSC’s ‘Scottish Social Service Sector: Report on 2014 Workforce Data11’ indicates 51% of the workforce work full time (more than 30 hours per week) and, in this survey, several respondents reported that the type of work as well as anti-social hours can be a challenge to recruitment and retention. Comments included: That some people only want to work limited hours (often a maximum of 20
hours) because of the potential impact on their benefits, however some service providers want people who can work longer or full time hours.
That the hours of work are not always flexible and they are often unsocial.
Several respondents mentioned difficulties in finding candidates willing to work split shifts or other unfavourable hours.
There were also a small number of comments that shift working and rota requirements can pose challenges in recruiting registered nurses.
4.3 Issues around qualifications and training requirements
As mentioned in the previous chapter, training and qualification requirements are seen as having a positive effect of retention; this differs from the online findings in relation to recruitment where many felt that these did not have an impact. The issue of qualifications and training as well as registration requirements also featured in discussions:
11
http://data.sssc.uk.com/images/WDR/WDR2014.pdf

38
Some respondents were concerned that they would lose staff once they are required to get higher levels of qualifications (SVQ9 was described as degree level). Respondents commented that some staff are not academically minded.
Some respondents felt that a significant proportion of potential workers do not pass the PVG checks on the basis of minor dishonesty offences and that if the level of the check were to lessen, this may widen the pool of applicants.
There were comments that technicalities and the amount of training needed for personal care can be off-putting to a lot of potential workers e.g. manual handling, administering medicines etc.
A small number also mentioned that it is difficult to find candidates with the desire, or possibly the ability, to undertake the training required; there were also comments on the cost to organisations of training or induction.
The requirement for qualifications and training was also raised specifically in relation to care or support workers. Several respondents commented that, while this is applauded, it also raises a number of challenges including:
A lack of funding for training; respondents commented that the cost of providing training and paying for staff’s time while they undertake training is very costly.
One local authority respondent commented that there is maybe too much distinction between different types of care and that they would like to see an opportunity for a career in generic care: “there are so many routes and so many qualifications, it’s very confusing”.
Respondents also commented on bureaucratic and slow processes. There was a feeling that all paperwork (particularly that for registration) makes it difficult for people entering the sector and that the PVG scheme, Care Inspectorate and the SSSC need to better work together to make it easier; particularly as literacy is seen as an issue for quite a lot of potential recruits.
A small number of respondents mentioned issues around career offices; respondents felt that many people apply because they are forced to, rather than because the job is suitable or that they are suitable for the job. There were reports that people do not turn up for interview and that anecdotally this seems to be because they have been told to apply for a certain number of jobs. One local authority respondent said things are improving now with a better, partnership, co-ordinated approach to positive promotion of work or “a career” in the care sector.
There were some concerns over any requirements for more advanced qualifications and the impact this might have on retention of existing staff; or that it might discourage others from working in the sector. There were also comments that increased qualifications will not necessarily equip staff better to perform their job. One respondent in the independent sector also noted that there may be an expectation of higher pay for higher qualifications.

39
4.4 Issues around skills, increased responsibility or workloads
The online data shows that high workloads are seen as barriers to retention particularly for social workers and managers.
During the qualitative discussions, some respondents commented on increased levels of responsibility and increased workloads, especially when related to pay levels. This included a voluntary sector provider who said: “Levels of responsibility placed on staff are too high for the wages paid and they can do a much less stressful job for the same money in a supermarket for example”.
Several of those interviewed also mentioned the issue of career pathways; there were comments that there is a lack of career progression for social workers and one respondent felt that there should be a way for internal staff to train ‘on the job’ to become a social worker.
4.4.1 Skills
Several respondents commented that the skills required in the sector have changed and are changing. They said that many providers in the past could simply offer a home help service but now the market is much more about personal and intimate care so the required skillset has changed. As such, organisations need people who can take on different and more difficult work.
Respondents also commented that there is a challenge in reconciling the career opportunities, skills needed and the pay that is typically on offer in the sector. For example: “More and more they are being asking to skill up and be flexible but the level of salary doesn’t reflect that” and “The reality is that the tasks and capability of the work is such that it warrants better levels of pay than we can offer”.
In relation to managers, some respondents had problems recruiting managers due to qualification requirements. Respondents noted that some have the required qualification but are not seen as having the ability to manage a team of staff or vice versa. Some respondents have recruited managers internally as, they felt, these individuals will have a very clear understanding about the role and requirements. They added that once this pool has been exhausted there is a need to go externally to recruit new managers.
Respondents also felt that a key issue about external recruitment is the quality and number of applications received. One noted that non-care staff posts such as supervisors, trainee managers and coordinators are very hard to fill and attributed this partly to the low pay rates in the sector. In addition, this respondent felt that their service user needs are particularly demanding and even those with prior experience can struggle to meet service user needs in her sector: there are specific issues in relation to managing a dispersed workforce including difficulties in providing supervision and training to staff who are not office-based.
In relation to nightcare staff: there were comments that this group of staff are sometimes hard to find. In addition, some respondents commented that many people want to have a career and nightcare staff do not get the same opportunities

40
as other staff to undertake training as it is generally scheduled during the day. One organisation reported that they are trying to make as many courses as possible available online and that they have noted night workers making use of these.
There were also comments in relation to increased responsibility or workloads, mostly from respondents within the public sector and specifically, that social workers have an increasing workload and more complex roles. One local authority respondent commented: “Social workers are paid reasonably well, although the demands of the job have changed a lot and there are much higher expectations on social workers these days. They are expected to deliver a better service but with less resources”.
Several respondents felt that increased requirements for qualifications linked to registration for home care staff and also qualification requirements for residential child care staff will have an impact on retention, for example: “We have a significant number of staff who are highly skilled in their job but who don't necessarily have the academic ability to achieve a qualification at degree level” (independent sector provider). Some respondents commented specifically on mental health officers; these respondents mentioned issues of greater responsibility for no additional pay while issues of location and the ageing workforce profile were also raised.
4.4.2 The availability of applicants or suitable applicants
The availability of skills or a lack of relevant skills emerged, in the online survey, as a main barrier to recruitment; particularly in relation to managers.
A small number of respondents also commented on this issue; some mentioned a general lack of candidates with relevant skills while others raised the issue of a lack of candidates with experience. This included one voluntary sector provider who said: “Candidates with the right skills and experience are very difficult to find. There seems to be a shortage of care workers, we have recruited people who are new to care and have worked out really well, generally as the population grows older and more people require care, I anticipate this could become more difficult”. Several respondents felt this situation will increase given the ageing population and increasing demand for services.
In relation to the issue of an ageing workforce, a local authority respondent said: “The profile of the workforce is changing, due to demographic change, there is a significant proportion of the existing management and practice cohort due to retire in the coming years - this means that there are fewer staff with the experience desirable to take up management posts. The role of managers is getting more and more complex and voluminous as savings are made at all levels of organisation - the job is becoming less attractive and is not sufficiently well remunerated to compensate for this”.
One respondent in the independent sector suggested that colleges should have stronger entry criteria and to ensure that those considering a career in the sector are made fully aware of specific roles and responsibilities; another respondent in

41
the same sector commented that there is a need not simply for qualifications but to ensure those entering the sector have the required personal skills.
In relation to specific staff; there were comments that there seems to be a shortage of trained or qualified nurses, especially health visitors, district nurses or nurses who wish to work with complex client groups such as drug misuse. One respondent noted that since a nursing degree at universities has been introduced, the number of student nurses has decreased considerably, leading to a large shortage of nurses across the country. This respondent felt that many more nurses should be in training than at present. A small number of respondents said that most nurses prefer to work for the NHS.
There were some comments on difficulties in recruiting and retaining social workers. For example, one respondent felt universities do not equip social workers to do the job well on arrival from university. This respondent also had concerns about high caseloads and poor management and noted that external factors can also impact on the ability to recruit; such as poor quality or lack of housing preventing people from moving to the area. This respondent pointed out that it is often not just the job that potential staff are considering; if they are moving area, they also want to know there is good quality housing, schools, options for a social life etc.
Respondents also commented on issue around succession planning and recruiting new managers. Respondents felt that while there are many internal candidates who could progress to managerial or higher managerial roles, many do not do so as they prefer to retain their ‘hands-on’ roles in care. Alternatively, there were comments that while some staff are more than able to take on workforce scheduling, many do not have the skills or the wish to undertake budgeting or other strategic roles.
Another specific category, recruitment and succession planning for social work managers, was described as extremely difficult: “more challenging than recruiting social workers”. One respondent felt that this may be down to the nature of the job and a vocation to stay ‘hands on’ in social work but regardless it is seen as an issue.
4.5 Issues around the image of the social service sector
The online data shows that many respondents feel that more positive stories about, or promotion of, social care would help aid recruitment and retention. During the qualitative discussions, respondents also commented that it is difficult to attract candidates as the social service sector is seen as less appealing and is seen as having a lower status than, for example, the NHS.
Respondents provided suggestions as to how this could be addressed:
Almost all respondents referred to broadcast media of high profile incidents that tarnish the reputation of the sector as a whole. In particular, residential care was highlighted as having attracted very bad press. One respondent referred to

42
a recent case as an example of where there was an abundance of negative publicity but that no-one had come forward to talk about the number of instances where tragic incidents are averted. Many respondents felt that there should be more publicity to show the good work being done across the sector and to show how much more widespread these sort of cases would be without the work being done by front line staff.
A key comment made by respondents was that there is a need for those working in the social care sector to be valued, both by other professionals and by the general public. Respondents suggested a need for a sector wide high profile campaign to promote the great work that is done; to redress the balance; and to stress the career opportunities available in the social care sector. One respondent suggested something along the lines of army recruitment campaigns.
Some respondents commented that universities need to do more in promoting opportunities for graduates in the care sector, addressing negative perceptions around career opportunities and the challenging and fulfilling nature of the roles available in the sector.
Many respondents wanted to see the sector promoted and suggestions included:
A single body to negotiate with government on the range of issues; such as funding, training, qualifications, sector profile, pay and conditions; that affect workers across the social service sector.
A strong sector skills council role (one respondent saw this as the SSSC).
A longer term approach akin to the McCrone report “ensuring the journey around training and registration is the right one with a good link of reward and payment with developing knowledge” “If we carry on as we are we will see many more failures at an individual and organisational level”.
A national strategy on recruitment and retention in the sector.
A consistent approach from local authorities on commissioning and funding.
Positive campaigning to promote the social service sector and careers within the sector.
One respondent commented that a lot of potential nurses do not have experience of what a care home is like, have negative perceptions of working in one or feel that they would not be able to use the full extent of their nursing skills. They felt that this negative image appears to be reinforced by those who train nurses, so working in the care home sector is not something a lot of nurses want to do or are encouraged to do.
There were similar comments, from a number of respondents, in relation to recruiting young people; that neither young people nor their parents see the sector as somewhere that the young people could have a career. This issue is discussed in more detail in the following section.

43
4.6 Issues around diversity
The issue of diversity, in terms of age or equality groups, did not figure to any large extent in the data from the online survey. However, in qualitative comments and interviews, several respondents commented on the need to recruit younger people to the sector given the ageing workforce.
Several respondents noted that a number of their staff are close (or relatively close) to retirement so there will be an increasing need to recruit at all levels in the future. Most noted the need to encourage young people to want to work in the sector, however, respondents felt that working in the care sector is not being promoted well as a career option and so is never top of mind, despite the fact that it is a sector that will need increasing numbers of staff. The post of care or support worker is, therefore, often viewed by many as a fill-in post until ‘something better comes along’.
An independent sector respondent said: “The care sector is not necessarily promoted within the schools, when we should be capturing the people who will become the future of our workforce. We need to ensure that we are accessing all methods possible to promote the care profession for what it is, thus enabling us to make plans for the future such as becoming an employer that can offer greater flexibility for employees who have caring responsibilities for example.”
Targeting young people through apprenticeships is a route a few respondents mentioned as helpful and there is evidence, from several areas, of work underway with universities, colleges and schools to promote careers in the sector to young people.
Several other respondents commented on the need to find ways to engage with school children and promote careers in social care. Some respondents wanted to see more modern apprenticeships and volunteer placements.
4.7 Issues around geography
In the qualitative comments and interviews respondents made the following points in relation to challenges caused by geography:
For some staff working in remote, rural or semi-rural areas it can be too expensive to run a car to get to work or between different service users.
That young people often leave more rural areas and that is becoming an issue as care staff retire and need to be replaced. Some in rural areas find the pool of potential workers for their sector is very limited e.g. in areas with high retirement levels.
Alternatively, areas of high employment also mean a smaller pool of potential employees.
Respondents commented that there are enormous difficulties linked to public transport to get people to their place of work particularly for early shifts. Initiatives such as shared transport for several staff members are encouraged

44
but do not always work. In addition, when young people are recruited they rely on parents to drive them and this is not sustainable in the long term.
A respondent from a health and social care partnership said: “Recruiting in a remote and rural setting is intensely difficult”.
4.8 Other issues
Brexit was seen as a potential issue; many respondents could not confirm the percentage of their workforce that is non-UK but those giving figures suggested 15%-20%. There was a feeling that in some areas a lack of immigration could lead to a major reduction in the pool of applicants, particularly for care or support worker positions. Many talked of the great work ethic of those coming from outside the UK.
4.9 Mitigation measures
The online data indicates that improved recruitment materials and support for applicants is seen as the most useful way of mitigating against recruitment challenges while pay increases are seen as most useful in recruiting against retention issues.
Other potential methods of mitigating against challenges, mentioned by several respondents during interviews, included increasing the number of young people entering the profession and selling careers in the social service sector to young people. Examples included:
Going into local schools and/or colleges to meet students or to give talks at career events.
Offering placements or shadowing to students to get a feel for the job; then when students are still at college they can be on a bank of staff to fill in when there are shortages.
Using social media and/or personal contacts to find new staff; it is a challenging job to be a care worker so those already in the profession can be good ambassadors to others who might be looking for a new job or change in employment.
A recruitment drive at the end of the college year when students are finishing their courses.
Offering modern apprenticeships.
Offering voluntary placements so that people can get a feel for what working in the sector is like; young people tend to have a relatively clear (and accurate) image of what it would be like to go into nursing or become a doctor, but there is no clear image of working in the care sector.
Working with Princes Trust.
The qualitative interviews indicate that every organisation is trying its own initiatives to improve on retention of care or support workers. Examples include: changing total hours worked per week to make the headline salary more appealing, changing terms and conditions to make trade-offs that improve hourly pay (after consultation

45
with staff), improving terms and conditions generally. These all have some degree of short term success but were also described as “just sticking plasters”.
Several respondents commented on training; some is offered externally while others offer their own training. Respondents felt that there are inconsistencies with some organisations ‘pushing through’ staff very quickly. They feel that more care needs to be taken and more emphasis placed on making the training suitable for the needs of the post. There are some issues around academic requirements which put some staff off but these can be mitigated against by well-planned and well-delivered, tailored support.
There were various examples of other work underway in organisations to improve recruitment and interviewing processes. These included:
Internal recruitment if possible.
Open and honest interviews so potential staff have a good idea of what the job will entail; one respondent shows videos so interviewees do understand the reality of what they will be asked to do e.g. personal care; being clear that some clients will have dementia or mental health issues and can be aggressive.
Carers have to have a five day induction before they know if they will get a job.
A staff scheme where the employer pays a bonus to any member of staff who helps to recruit someone else.
Word of mouth or Recommend a Friend schemes.
Holding recruitment events.
Better use of recruitment websites.
New staff meeting the service users they will be working with at interview or informally after the interview, so they get to meet each other early on and then a decision can be taken as to the match. The matching process is carried out with the team leader, the service user’s family and service user to ensure everyone matches from the start (e.g. matched on levels of fitness, energy, hobbies, interests etc).
Building stronger links with the community.
Working with organisations for the long term unemployed.
Working with recruitment hubs and job centres.
Working with other organisations to attract staff.
Employing effective managers with good communication skills.
Emphasising good working conditions and job satisfaction over monetary reward.
Offering roles elsewhere in the organisation to develop skills and offer opportunities for personal development.

46
There were also some suggestions for other approaches that could be developed in the future to help counteract issues of recruitment and retention. These included
Scottish Government / the SSSC providing funding for the delivery of any new qualifications that may be required.
A new approach to providing funding for PVG requirements and the SSSC registration.
To offer training passports to those working in the sector.
Joint training resources between health, social care and independent care providers.
A restructuring of services within local authorities.
Partnership working.
A two tier system for qualifications or training.
Allowing more time for staff to achieve the required qualifications and to identify training providers to deliver these.
The development of formal career paths (for those who want them) and more informal work (for those who do not). There were comments on the need for clear and attractive career pathways and a suggestion that there should be a path from care worker through to social worker that can be completed internally.
More innovative advertising, perhaps making use of case studies or similar to show how rewarding a career in the social service sector can be.
Finding ways to attract potential employees into hard to recruit areas.
The online survey asked specifically about the use of a shared recruitment platform and almost half of those who replied felt that this would benefit the sector as a whole.
However, during the qualitative interviews there were mixed views on a shared recruitment platform with some saying it is available, some saying it has no real benefit and others thinking it could be helpful (particularly if supported by positive promotion of the sector and career opportunities).
4.10 No difficulties
A small number of respondents said they do not expect difficulties in recruitment or retention and commented further. There were comments relating to care or support workers, these respondents reported that they are paying higher wages or offering enhanced rewards packages.
The small number who commented that they do not expect difficulties in retaining managers reported that this was due to organisational changes or that they were offering improved terms and conditions.

47
5 Workforce planning
5.1 Areas for research
While one of the most common themes in our review of literature was reference to the importance of workforce planning, there was little hard evidence on the incidence of use or on specific tools being used.
5.2 Profile of respondents
Seventy-three respondents said that their main area of involvement related to workforce planning or development.
Respondents came from voluntary sector organisations (36 out of the 73), the independent sector (18) and the public sector (19 including 10 from local authorities and five from health and social care partnerships).
Most respondents were owners, managers or directors or their organisation (57) or had a policy or strategy role (12).
All of the service types listed in the survey were represented in the sample; the largest numbers were from care at home support services (53 respondents). All staff types were represented and most respondents (48) said that their organisation employs or represents care or support workers.
Various sizes of organisations were included; 19 respondents worked in organisations employing fewer than 100 staff while 53 worked in larger organisations (including 32 in organisations employing over 500 staff).
Staff in these organisations worked predominantly in a mixture of urban and rural areas. All local authority areas were represented in the sample.
The following sections present data from the online questionnaire completed by these 73 respondents; the small base sizes at sector level should be borne in mind.
This data is presented alongside a summary of any relevant comments made by the 50 respondents who took part in telephone discussions; ten of these 50 telephone discussions had an in-depth focus on workforce planning matters.
5.3 Workforce planning within the organisation
The 73 online respondents were asked a series of questions about workforce planning within their organisation, beginning with: ‘Who do you discuss workforce planning with?’
As shown in the following table, almost all (95%) discuss workforce planning with other managers or senior staff.
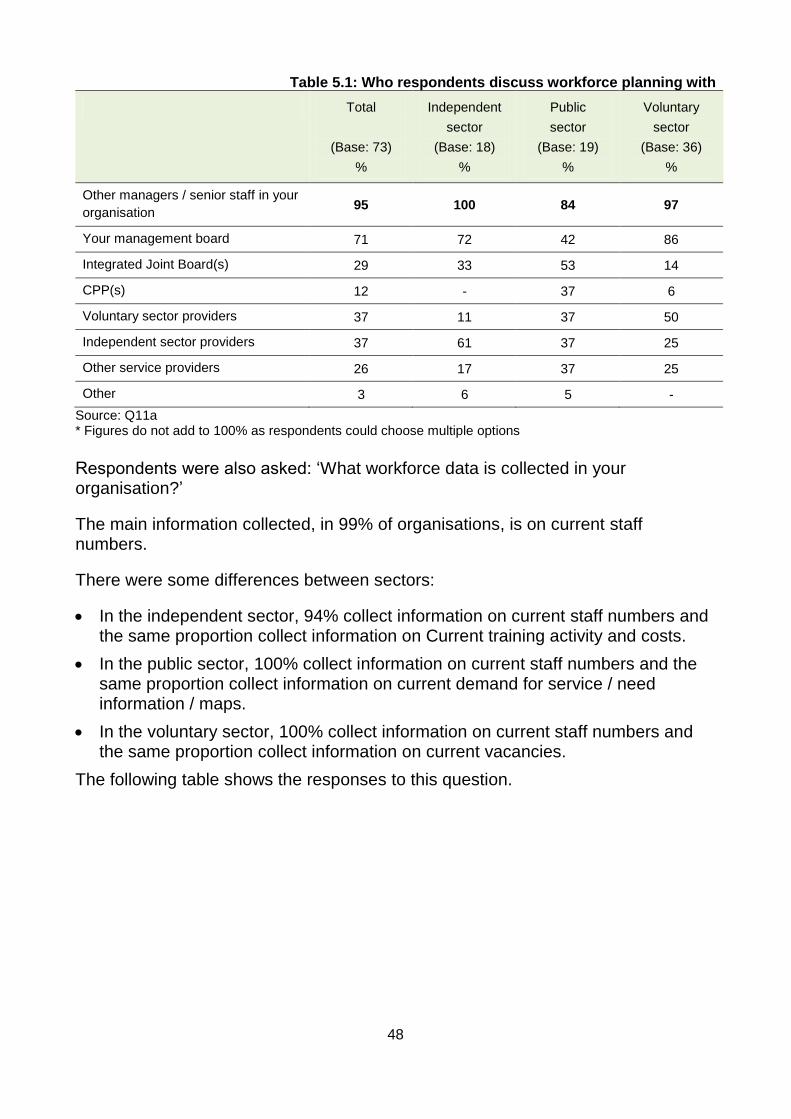
48
Table 5.1: Who respondents discuss workforce planning with
Total
(Base: 73)
%
Independent
sector
(Base: 18)
%
Public
sector
(Base: 19)
%
Voluntary
sector
(Base: 36)
%
Other managers / senior staff in your
organisation 95 100 84 97
Your management board 71 72 42 86
Integrated Joint Board(s) 29 33 53 14
CPP(s) 12 - 37 6
Voluntary sector providers 37 11 37 50
Independent sector providers 37 61 37 25
Other service providers 26 17 37 25
Other 3 6 5 -
Source: Q11a * Figures do not add to 100% as respondents could choose multiple options
Respondents were also asked: ‘What workforce data is collected in your organisation?’
The main information collected, in 99% of organisations, is on current staff numbers.
There were some differences between sectors:
In the independent sector, 94% collect information on current staff numbers and the same proportion collect information on Current training activity and costs.
In the public sector, 100% collect information on current staff numbers and the same proportion collect information on current demand for service / need information / maps.
In the voluntary sector, 100% collect information on current staff numbers and the same proportion collect information on current vacancies.
The following table shows the responses to this question.

49
Table 5.2: Workforce data collected
Total
(Base: 73)
%
Independent
sector
(Base: 18)
%
Public
sector
(Base: 19)
%
Voluntary
sector
(Base: 36)
%
Current staff numbers 99 94 100 100
Projected staff numbers 47 50 37 50
Current vacancies 93 78 95 100
Current skills / map of workforce 66 61 63 69
Projected skills need / map of
workforce 41 28 42 47
Current recruitment activity and costs 85 89 58 97
Projected recruitment activity and
costs 53 56 37 61
Current training activity and costs 92 94 84 94
Projected training activity and costs 71 78 58 75
Current staff costs 92 89 89 94
Projected staff costs 68 67 58 75
Current demand for service / need
information / maps 73 61 100 64
Projected demand for service / need
information / maps 47 50 74 31
Data on diversity / equality 70 56 84 69
Data on attendance at work 88 78 95 89
Staff feedback / staff survey data 90 83 89 94
Service user / carer feedback 89 78 84 97
Other 1 - 1 -
Don’t know 1 1 - -
Source: Q11b * Figures do not add to 100% as respondents could choose multiple options
When asked: ‘How is this data being used?’ the main answers given differed across sectors, as shown in the following table:
In the independent sector, 88% use the information in day to day management.
In the public sector, 100% use the information to plan for future workforce needs (i.e. numbers and skills) in the short term (1-2 years).
In the voluntary sector, 100% use the information for budget-setting.

50
Table 5.3: How data is being used
Total
(Base: 73)
%
Independent
sector
(Base: 18)
%
Public
sector
(Base: 19)
%
Voluntary
sector
(Base: 36)
%
Collected but not used 6 12 5 3
Used to plan for future workforce
needs (i.e. numbers and skills) in the
short term (1-2 years)
82 76 100 75
Used to plan for future workforce
needs (i.e. numbers and skills) in the
medium term (3-5 years)
35 29 47 31
Used for service delivery planning /
strategic commissioning of services 78 76 63 86
Used for budget-setting 88 65 84 100
Used in day to day management 82 88 68 86
Other 1 - - 3
Source: Q11c * Figures do not add to 100% as respondents could choose multiple options
Respondents were then asked: ‘Where in your organisation does the role of workforce planning sit?’ The main answer given, from all sectors, was ‘with the Senior Management Team’.
Table 5.4: Where role of workforce planning sits in organisation
Total
(Base: 73)
%
Independent
sector
(Base: 18)
%
Public
sector
(Base: 19)
%
Voluntary
sector
(Base: 36)
%
With the Senior Management Team 82 78 84 83
There is one person with a specific
Workforce Planning role 7 11 11 3
Within HR 32 28 16 42
At the operations level 32 33 21 36
With the Integrated Joint Board (IJB) 10 6 32 -
With the Community Planning
Partnership (CPP) 4 - 16 -
Other 7 11 11 3
Source: Q12 * Figures do not add to 100% as respondents could choose multiple options

51
5.4 Specific tools
A number of tools and guidelines have been developed and promoted over the last decade. While there is information available on these tools there is little evidence as to whether these are being used or, if they are being used, by whom. Respondents were asked about their awareness and use of the following:
SSSC Workforce Planning Guide.
SIRCC – Towards a Competent and Confident Residential Child Care Workforce. A Guide for Residential Managers to the Registration and Continual Professional Development of Residential Child Care Staff.
VSSSWU: Workforce Planning - A Toolkit for Voluntary Sector Social Services in Scotland.
EVOC Care Training Needs Analyser (ECTNA).
Skills for Care Workforce Planning Resources.
Indicator of Relative Need (IoRN) tool.
NHS 6 Step Model.
Local authority tool / guidance.
Organisation’s own tool / guidance.
In the first question on workforce planning tools, respondents were asked: ‘Which of the following workforce planning tools are you aware of?’ The following table shows that, across all sectors, the main answer given, by 53%, was the SSSC’s Workforce Planning Guide.
In the public sector both the SSSC Workforce Planning Guide and the relevant local authority’s own tool or guidance were mentioned by 53%.
Around one in five (18%) were not aware of any tool; this answer was lowest in the public sector (5%).

52
Table 5.5: Awareness of tools
Total
(Base: 73)
%
Independent
sector
(Base: 18)
%
Public
sector
(Base: 19)
%
Voluntary
sector
(Base: 36)
%
Not aware of any tool / guidance 18 22 5 22
SSSC Workforce Planning Guide 53 39 53 61
SIRCC – Towards a Competent and
Confident Residential Child Care
Workforce.
21 11 37 17
VSSSWU: Workforce Planning - A
Toolkit for Voluntary Sector Social
Services in Scotland
11 - 11 17
EVOC Care Training Needs Analyser
(ECTNA) 4 - - 8
Skills for Care Workforce Planning
Resources 14 11 16 14
Indicator of Relative Need (IoRN)
tool 19 28 37 6
NHS 6 Step Model 10 6 21 6
Local authority tool / guidance 21 17 53 6
Organisation’s own tool / guidance 37 33 42 36
Other 3 - 11 -
Source: Q13a * Figures do not add to 100% as respondents could choose multiple options
Respondents were then asked: ‘And which, if any, are used in your organisation?’ and asked to rate the usefulness of tools used, on a scale of 1 to 10 (where 1 is not at all useful and 10 is invaluable).
An average score (out of 10) was calculated for each measure and is also shown in the table below; the nearer to 10, the higher the perceived usefulness of the tool.
As shown in the following table, while the VSSSWU: Workforce Planning tool received the highest average score (8.00 out of 10), this tool was only used by two respondents.
In terms of tools used by higher numbers or respondents; Skills for Care Workforce Planning Resources, used by seven respondents, attracted the highest average score (7.43).

53
Table 5.6: Use and rating of tools
Total %
(Base: 60)
Number Average score
out of 10
VSSSWU: Workforce Planning - A
Toolkit for Voluntary Sector Social
Services in Scotland
3 2 8.00
Skills for Care Workforce Planning
Resources 12 7 7.43
SSSC Workforce Planning Guide 40 24 6.91
Local authority tool / guidance 23 14 6.62
Organisation’s own tool / guidance 32 23 6.57
NHS 6 Step Model 3 2 6.50
SIRCC – Towards a Competent
and Confident Residential Child
Care Workforce.
17 10 6.33
Indicator of Relative Need (IoRN)
tool 12 7 6.17
EVOC Care Training Needs
Analyser (ECTNA) 3 2 4.50
Other 2 1 -
No tool used 12 7 -
Source: Q13b & Q13c * Figures do not add to 100% as respondents could choose multiple options
Respondents were then invited to comment on the strengths and weaknesses of the tools used and comments are summarised below:
SSSC Workforce Planning Guide: five respondents made comments including that the tool is useful or appropriate, although one said that it is quite generic and so is a challenge to relate it to the organisation’s structures and resources.
SIRCC – Towards a Competent and Confident Residential Child Care Workforce. A Guide for Residential Managers to the Registration and Continual Professional Development of Residential Child Care Staff: one respondent commented saying: “The Individual Audit checklist is quite helpful. Also the fact that it is written in a positive "can do" approach. Of course it is now quite out of date as regards the New Standards for Residential Child care qualifications” (independent sector provider).
There were no comments on VSSSWU: Workforce Planning - A Toolkit for Voluntary Sector Social Services in Scotland.
EVOC Care Training Needs Analyser (ECTNA): one respondent, from a voluntary sector provider, commented: “This was a useful start but needs further development and tweaking to adequately meet our training records and reporting needs. We are using spreadsheets now for training records and

54
reports. Has limited support / resource available and delays in getting back in contact with any queries”.
Skills for Care Workforce Planning Resources: a respondent from a voluntary sector provider said: “These are a helpful in terms of information but not always easy to fully adopt because of restricted resources or funding pressures”.
Indicator of Relative Need (IoRN) tool: four respondents commented on this tool. Comments included: that it is used extensively in the respondent’s care homes; that the tool is being introduced; that the tool is useful for giving a general indication of needs but not so useful for planning for individual needs; and that it “Does not give an holistic view of staff needs (according to the Care Inspectorate)” (independent sector provider).
NHS 6 Step Model: one respondent commented: “We've worked with partners on the 6 step model in order to develop the first whole system workforce development plan (independent sector provider).
Local authority tool / guidance: four commented including: that it is effective and gives a consistent approach and that there is a need for tools to be developed in relation to integration; the need for a joined-up approach to planning.
Seven respondents commented on their organisation’s own tool, including:
That it is basic / limited (three respondents).
That it allows them to focus on their own areas of need / interest (two respondents).
That it complements other guidance or tools (one comment).
That it is under review (one comment).
A respondent from a voluntary sector provider gave a detailed comment: “The strength of the workforce planning tool allows us to plan to meet the SSSC Registration timescales in order for the staff to achieve the various qualifications for their role. It also allows us to develop staff training which is built around the service user care plans which makes the training to the teams person centred. It also allows us to monitor staffing levels identify high risk areas proactively and take the action needed to fill vacancies as soon as we can. We are currently working on developing a calibre analysis/ succession planning tool that will let us identify and grow our managers of the future. This is something that we have not set out to proactively do. This will enable employees in [organisation] know that when they apply for future posts that they will have developed the skills knowledge and experience needed to be a success in the post”.
During a number of the qualitative interviews, discussion focused more on workforce planning and the tools currently in use within organisation.
Of those interviewed:
Five organisations use the SSSC Workforce Planning Guide.
One uses the VSSSWU tool.

55
One uses the EVOC Care Training Needs Analyser.
One uses the Skills for Care Workforce Planning Resources.
One has used the Indicator of Relative Need (IoRN) tool.
One is adapting the NHS 6 Step Model as it has been tried and proven to work in the NHS.
Three use their local authority’s tool or guidance.
Three use their organisation’s own tool / guidance.
One organisation does not currently use a formal planning tool.
However, from discussions it appears that many organisations are in the early stages of using these tools, are exploring their use, or are looking at ways to help plan within the integration agenda. Some of those who do use tools say they are used inconsistently or sporadically.
Findings from discussions indicate that tools seem to be used particularly in relation to training and skills needs, with use for workforce planning less in evidence. Planning for training needs appears to be well in hand in most organisations, although issues around changes to training requirements and funding for training can impact upon plans.
There were comments that planning is very reliant on budgets: “planning is determined by money”. Some respondents said they had their own spreadsheets that could be updated as required to help plan in the short and medium term. While past trends and experience are sometimes used to guide planning, it is not easy to forecast factors such as future demand and, especially, future funding. Indeed, some of the providers were facing challenges in planning for the introduction of the Living Wage in October 2016 as there has been little or no information from their local authorities as to what funding would be available to them’. In addition, some organisations working across local authorities reported differences in approach between areas which were also presenting problems.
There was also acknowledgement that issues, in particular the ageing workforce, mean that workforce planning does need to be addressed.
One respondent was keen for any planning, and planning tools, to recognise and maximise the use of new and emerging care technology, as well as focusing on staff.
While strategic plans do include workforce planning, many focus on recruitment and retention strategies.
Online respondents were asked: ‘What are the main barriers to using a workforce planning tool?’ and the main answers given were uncertainty (unknown funding / service needs etc) (59%) and time to dedicate to this (58%).

56
Table 5.7: Barriers to using a workforce planning tool
Total
(Base: 73)
%
Independent
sector
(Base: 18)
%
Public
sector
(Base: 19)
%
Voluntary
sector
(Base: 36)
%
Awareness / availability of an
appropriate tool 36 44 37 31
Need for training on workforce
planning 30 22 37 31
Availability of data 27 22 37 25
Uncertainty (unknown funding /
service needs etc) 59 50 42 72
Time to dedicate to this 58 50 68 56
Other 4 6 - 6
Don’t know 4 - 5 6
Source: Q16 * Figures do not add to 100% as respondents could choose multiple options
When asked: ‘How likely would you be to use a nationally available workforce planning tool / suite of tools?’, as shown in the chart below, a majority (71%) said they would be very or quite likely.
Chart 5.1: Likelihood of using a nationally available workforce planning tool (Base: 73)
Source: Q17 * Figures may not add to 100% due to rounding
Those answering very or quite likely were given the opportunity to comment further and 31 did so. Comments included: That the organisation is not currently using a tool, or that the tool in use is not
effective (six comments).
That this would provide a consistent or standardised approach (five).
22%
37%
17%
23%
44%
37%
56%
48%
17%
11%
7%
3%
1%
17%
16%
25%
21%
0% 10% 20% 30% 40% 50% 60% 70% 80% 90% 100%
Independent sector
Public sector
Voluntary sector
Total
Very likely Quite likely Not very likely Not at all Likely Don't know / No reply

57
That this would provide an approach more in line with the current challenges within the sector, including integration, or would reflect best practice (three).
That this would aid in planning (three).
That a standard tool would aid planning discussions between organisations and also stakeholders (two).
That this would provide a more structured approach (two).
That it would provide a tested framework and would have credibility (two).
That this would enable robust sector-wide reporting and planning (two).
Specific areas that respondents would like to see included: The need for the tool to be able to adapt to specific local needs.
The need to consider the impact of implementation.
The need to link to fees.
Respondents also said that the tool would have to be easy to use, be able to fit with all businesses and be based on robust underpinning evidence. Those saying they were not very or not at all likely to use a nationally available workforce planning tool or suite of tools were also asked to comment and five respondents gave the following comments: That such a tool would be too generic (two comments).
That existing tools are suitable.
That the organisation does not have the need.
That the organisation does not have the capacity to use such a tool.
Qualitative discussions also looked at whether respondents saw a need for a national tool. It appears that there is an appetite for such a tool, and acknowledgement that there is a need to describe the sector; the scale, volume and capacity; as well as an increasing need to quantify and describe the value of social care, particularly within the integrated landscape.
However there were a number of potential issues and these included:
That such a tool would need to be built on / have access to or contain up to date, robust information at national and local levels.
The need for any tool to be used consistently across sectors.
That in some services and some situations a generic tool would be of little use; any tool would need to be able to be adapted to local needs.
The need for training in how to use such a tool (and issues around making time for training and use).
Queries over whether existing IT would be sufficient.

58
Queries over how effective such a tool might be for services which change all the time and in which change must be effected quickly to meet needs. For example, one respondent felt that while a planning tool might be useful for a care home with a set number of beds, for a care at home service where demand fluctuates sometimes from day to day, it may not be as useful.
Many respondents felt that it would be difficult to plan more than five years ahead; several plan for one or two years at present. There was a comment that demographic projections can be used to look further ahead, however other respondents felt that changes to the sector and to the way care is delivered mean that this is not always helpful. One respondent felt it would not be possible to plan for more than one or two years in advance: “we’re dealing with people so it’s impossible to plan in advance”. It appears that respondents in the public sector can see more use and benefit in planning tools than those in the voluntary or independent sectors.
5.5 Changes to workforce planning
When asked: ‘Do you have any plans to change the way in which workforce planning is carried out within your organisations?’:
26 (36%) said yes.
25 (34%) said no.
22 (30%) said they do not know.
Those who said yes were asked to comment further and 22 did so. The main comment made by respondents was that they are in the process of reviews related to their workforce, including skills and training; some commented that they are reviewing the planning tools already in use or that planning tools would be useful during their reviews.
Other changes included:
A stronger focus on, or more strategic approach to, workforce planning (four comments).
Investment in IT to aid in workforce planning / better use of technology (three).
Using a more collaborative approach to workforce planning (two).
Using workforce information more extensively to inform strategic planning and external commissioning (one local authority).
Engaging staff specifically for workforce planning (independent sector provider).
Three respondents commented that current issues with commissioning, qualification requirements or uncertain demand has made workforce challenging difficult.
Respondents were also asked: ‘Which of the following actions have you taken with regards workforce planning?’ As shown in the following table, different sectors have taken different actions: in the independent sector, 89% have changed

59
recruitment methods; in the public sector, 79% have identified skills training needs; and in the voluntary sector, 89% have developed recruitment strategies.
Table 5.8: Actions taken
Total
(Base: 73)
%
Independent
sector
(Base: 18)
%
Public
sector
(Base: 19)
%
Voluntary
sector
(Base: 36)
%
Changed recruitment methods 73 89 32 86
Undertaken workforce skills
development planning 49 22 68 53
Identified skills training needs 74 61 79 78
Developed recruitment strategies 71 56 53 89
Developed retention strategies 51 39 32 67
Undertaken short-term (1-2 years)
workforce planning 51 33 63 53
Undertaken medium-term (3-4
years) workforce planning 16 11 26 14
Undertaken long-term (5+ years)
workforce planning 10 17 5 8
Succession planning 51 33 47 61
Profiled the workforce (eg who might
retire in the next few years) 38 44 47 31
Other 3 - 11 -
None / Don’t know 4 6 5 3
Source: Q15 * Figures do not add to 100% as respondents could choose multiple options
5.6 Other comments on workforce planning
Finally in this section, respondents were invited to provide any other comments or suggestions they have in relation to workforce planning and ten respondents did so. Comments included:
Difficulties in workforce planning due to changing training or registration requirements (and associated costs).
Difficulties in planning in an uncertain climate and the need for all involved in funding / commissioning to work together and for all voices to be heard.
The need for integrated workforce planning and for this to take account of new structures and resources.
The need for proper systems and capacity as well as accurate, relevant data to help with planning.

60
6 Conclusions There are both past and anticipated difficulties in recruiting and retaining many types of staff in the social service sector, particularly care or support workers, and many respondents felt that recruitment and retention issues have had a negative impact on both level and quality of service. The main challenges to recruitment and retention identified by respondents were issues around:
Low pay.
Procurement.
Competition; from within and outwith the sector.
Increasing workloads and responsibility.
Terms and conditions, including out of hours and anti-social hours.
Qualifications and training requirements.
The need for career pathways.
A lack of candidates with relevant skills.
A need to improve the image of the social service sector.
Respondents reported that the most successful mitigation methods include:
The use of improved, more user-friendly, recruitment materials and support for applicants.
Pay increases; especially in relation to addressing retention issues.
Various recruitment initiatives, particularly those aimed specifically at recruiting young people.
While almost all respondents reported that their organisation discusses workforce planning at senior levels and collects a variety of workforce data, relatively few use any sort of formal planning tools. While there is some appetite for a national planning tool, a number of issues were raised, including the need for both consistency and adaptability and the need for any tool to be built on robust information.
There was acknowledgement that workforce planning issues, such as the ageing workforce, need to be addressed. However, there were also comments that planning is very reliant on budgets and that it is not easy to forecast factors such as future demand and future funding. Planning for training needs, however, appears to be well in hand in most organisations.
Overall the findings suggest there will be very real challenges in maintaining both the quantity and quality of services going forward unless there are interventions to increase the long term appeal of the sector as a source of rewarding employment and a path to genuine career opportunities.

1
Appendix 1: Summary of findings from
Literature Review The literature review involved examination of the recruitment and retention knowledge and evidence already available on the Scottish social service sector, with the primary aim of identifying gaps in the existing data. In this way, we aimed to ensure that primary research with stakeholders would not replicate other recent studies and they would not be asked to give information they had already provided in other research.
As might be expected, a vast array of existing literature was identified. We considered reports dating from 2006 onwards but with a key focus on those published within the last two to three years. The data included in these reports has been gathered from the workforce, service users and employer organisations as well as other stakeholders. This range of perspectives, as well as differences in methodology, inevitably means some variations in statistics presented; nevertheless, the themes are generally consistent and often longstanding.
Many of the reports we considered focus on subsets of the workforce, by services and/or employer i.e. public sector, independent sector or voluntary sector. Each of these accounts for a significant proportion of the total workforce although the nature of the services, posts and the profile within each can be very different.
The reports produced by the SSSC are almost unique in encompassing the workforce across all employer organisations and are widely referenced for provision of a broad overview.
In order to provide a concise summary and overview of existing data and gaps, the chart overleaf uses a “traffic light system” to indicate the quality and quantity of recent data available for each key area of information requirement that has been agreed for this review. Information areas highlighted in green are those where we identified relatively robust and recent data sources, amber denotes that there is information available that might usefully be supplemented and red denotes a gap in the data that we have been able to access. The chart shows availability of data for each employer type.

2
Appendix 1 Chart 1: Range of recent data
Topic Public Sector Independent Sector
Voluntary Sector
Workforce Size
Recruitment data:
- methods used
- challenges
- by service
- by post
- mitigation
Workforce Retention data:
- challenges
- by service
- by post
- mitigation
Pay and Condition Disparities
Influence of Public Funding N/A
Use of Employment Agencies
Use of Short-Measures
Workforce Planning
- incidence of use
- specific tools
Our recommendations for question areas for the next stage of research took account of the above summary of available information.

3
Appendix 2: Online questionnaire THE POSITION ON RECRUITMENT AND RETENTION IN THE SOCIAL SERVICE WORKFORCE IN SCOTLAND Thank you for participating in this research which we are carrying out for the Social Work Services Strategic
Forum who are overseeing the implementation of the Social Services in Scotland: a Shared Vision and
Strategy 2015-2020 which was launched last year. The findings will feed into the Forum’s project relating to
the recruitment and retention challenges that the Scottish social service workforce faces, in order to inform
policy development going forward.
The survey should take around 15 minutes to complete. The information you provide will be confidential.
If you would like to submit any additional comments or have any queries about the survey please don’t
hesitate to contact Shona Mulholland at Why Research using [email protected] or on 0131 524
8171.
Thank you from the project partners for your time and support, it is greatly appreciated. We would be grateful
if you could submit your response no later than 10th
June. (NB The survey period was extended until 27th
July 2016)
ABOUT YOUR ORGANISATION
A very small number of questions require an answer to allow us to look for differences or commonalities
across different types of organisations. We would be grateful if you could answer these questions (marked
***) which will help us when we analyse the survey findings.
Q1a How would you describe your organisation? *** PLEASE TICK THE ONE THAT BEST APPLIES
1 Local Authority Department
(please write in Department) …………………………….
2 Umbrella / Representative body e.g. Coalition of Care and Support Providers
in Scotland (CCPS)
3 Membership organisation (paid registration / membership)
4 Professional body
5 Independent (private) provider / employer
6 Public sector funded provider / employer
7 Voluntary (third) sector provider / employer
8 Representing self-employed workers
9 Health and Social Care Partnership
10 Other
(please write in type of organisation) ……………………..
Q1b Is your organisation mainly in or related to the …. ***
1 Independent (private) sector
2 Public sector
3 Voluntary (not for profit) / third sector
4 Other (write in)

4
Q1c. In which type of service(s) does your organisation work? *** MULTI CODE ALLOWED
1 Adoption service
2 Adult day care
3 Adult placement service
4 Residential Care homes for older people
5 Nursing care for older people
6 Central and strategic staff
7 Fieldwork service (adults)
8 Fieldwork service (children)
9 Fieldwork service (generic)
10 Fieldwork service (justice)
11 Fostering service
12 Housing support service
13 Care at home support service
14 Nurse agency
15 Offender accommodation service
16 Substance misuse / Addiction services
17 Residential child care (includes secure accommodation services)
18 School care accommodation (residential schools)
19 Other
(please write in) …………………………………….
20 Not applicable
Q1d What types of people are employed by / involved with / represented by your organisation? ***
MULTI CODE ALLOWED
1 Auxiliary - Administrative / Support Staff e.g. clerical, finance and HR and/or Ancillary staff – e.g.
catering, domestic, gardening
2 Care / Support Workers - provide direct care and support (e.g. support workers in a care home service or
care at home services) and/or may supervise work of other care staff and contribute to assessment of
care needs and development and implementation of care plans (e.g. senior residential care / support
workers)
3 Social Workers
4 Allied Health Professionals – e.g. Occupational Therapists, Speech and Language Therapists, Dieticians,
Physiotherapists etc
5 Registered Nurses
6 Mental Health Officers
7 Managers: Unit / Project Manager - have responsibility for the management of care and service provision
in a discrete service delivery area
8 Managers: Group Manager - have overall responsibility for the management of care and service provision
in two or more discrete service delivery areas (e.g. a group of care homes, a care home comprising a
number of service delivery units)
9 Managers: Director / Chief Executive / Head of Service - highest level of overall responsibility for the
management of care and service provision. Staff at this level have a place on the organisation’s
governing body.

5
Q1e What area(s) does your organisation cover? ***
National Scottish organisation 1 Fife 19
National UK organisation 2 Glasgow City 20
International organisation 3 Highland 21
Various areas across Scotland 4 Inverclyde 22
Aberdeen City 5 Midlothian 23
Aberdeenshire 6 Moray 24
Angus 7 North Ayrshire 25
Argyll & Bute 8 North Lanarkshire 26
Clackmannanshire 9 Orkney Islands 27
Dumfries & Galloway 10 Perth & Kinross 28
Dundee City 11 Renfrewshire 29
East Ayrshire 12 Scottish Borders 30
East Dunbartonshire 13 Shetland Islands 31
East Lothian 14 South Ayrshire 32
East Renfrewshire 15 South Lanarkshire 33
Edinburgh (City of) 16 Stirling 34
Eilean Siar (Western Isles) 17 West Dunbartonshire 35
Falkirk 18 West Lothian 36
Q1f How many people are employed by your organisation? ***
1 25 or fewer
2 26 - 50
3 51 - 100
4 101 - 250
5 251-500
6 Over 500
7 Not applicable
Q1g Does your organisation make use of zero hours contracts?
1 Yes
2 No
3 Not applicable
Q1h Does your organisation pay the UK Government Living Wage? (£7.20 for employees over 25)
1 Yes – to all workers
2 Yes – where legally required
3 Not applicable
Q1i Has your organisation made use of a pay freeze?
1 Yes – within the last 2 years
2 No - but it is planned for the next year
3 No / not within the last 2 years
4 Not applicable
Q1j Do your staff work in …
1 Rural areas only
2 Urban areas only
3 A mixture or rural and urban
4 Not applicable
Q1k Does your organisation use a staff survey to obtain views and feedback from staff?
1 Yes, annually
2 Yes, less frequently
3 No
4 Don't know / Not applicable

6
ABOUT YOU
Q2a What is your role? ***
1 Business owner
2 Director / Manager
3 Supervisory
4 HR / Payroll
5 Business administration
6 Policy / strategy role
7 Other
(please write in) …………………………………
Q2b With which of the following areas do you have any involvement? ***
Q2c And which would you say is your main area of involvement? *** (This selection will allow us to
direct you to the questions most relevant to your area of operation or interest. If you have more than
one main area, please select the one on which you feel best able to answer questions).
Q2b (MULTI) *** Q2c (SINGLE) ***
1 Staff recruitment Staff recruitment
2 Staff retention Staff retention
3 Staff performance / review Staff performance / review
4 Workforce planning / development Workforce planning / development
None of these
STAFF RECRUITMENT – FOR ALL CHOOSING Staff Recruitment at Q2c
Q3a In the past 2 years, how frequently have you encountered difficulties in recruiting …..
Regularly Occasionally Never DK / NA
Care / Support Workers
Social Workers
Allied Health Professionals
Registered Nurses
Mental Health Officers
Managers
Q3b And looking ahead to the next 2 years, do you expect any changes in the difficulty of recruiting
Expect much
greater difficulty
Expect a little
more difficulty
No change
expected
Expect less
difficulty
DK / NA
Care / Support Workers
Social Workers
Allied Health Professionals
Registered Nurses
Mental Health Officers
Managers
IF Difficulties expected – WHY / IF No difficulties expected – WHY

7
Q3c What are the main methods that you use to recruit staff? MULTICODE
Care /
Support
Workers
Social
Workers
Allied Health
Professionals
Registered
Nurses
Mental
Health
Officers
Managers
Employment agencies
Online recruitment websites
Newspaper adverts
Sector and specialist
magazines / newsletters /
networks
Head hunting
Direct from colleges
From own training
programmes
Internal vacancy adverts
(noticeboard or web /
intranet)
Word of mouth
Via Apprenticeships
Don’t know / Not applicable
Q3d And in general, how long does it take to fill a vacant post for each of these staff types?
Within a month / 1-3 months / More than 3 months / DK NA
Q4a Which of the following would you say represents the single greatest challenge in recruiting
each of these staff types?
Q4a Care /
Support
Workers
Social
Workers
Allied Health
Professionals
Registered
Nurses
Mental
Health
Officers
Managers
Low Pay
Conditions of employment
Availability of skills / lack of
relevant skills and experience
Lack of resources for
recruitment
Registration qualification and
training requirements
Competition from other
sectors (e.g. retail)
Recruiting people under 45
Ensuring representation of
equality groups
Restrictions on length of
contract we are able to offer
Demand for flexible working
patterns
Limited career opportunities
and pathways
Lack of ‘home grown’
expertise staying on and
choosing to progress
Geographical location
Do not want to work out of
hours/antisocial hours
Other
Write in
No challenges

8
Q4b What measures have you used to address or mitigate the particular issues you have faced in
relation to recruitment over the past 2 years? MULTI CODE
Q4b
1 Enhanced pay
2 Enhanced employment conditions
3 In-house training / paying for training
4 Offer to pay registration fees / disclosure fees
5 Shared recruitment platforms
6 Increase in advertising / positive promotion of the sector / service
7 Shared advertising / positive promotion of the sector / service
8 Increased use of employment agencies
9 Increased opportunities for in-house staff to move post
10 Flexible and agile working
11 Improved recruitment materials (more user friendly) and support for applicants
12 Other (Write in)
13 Don’t know / Not applicable
THE FOLLOWING QUESTION WILL BE ASKED FOR EACH MEASURE USED:
Q4c. On a scale of 1 to 10 (where 1 is not at all successful and 10 is completely successful), please
rate the success, in general, of each mitigation measure used.
1
Not at all
successful
2 3 4 5 6 7 8 9 10
Completely
successful
Don’t
know
Q5 Please indicate the extent to which you agree or disagree that ….
Agree strongly
Agree
slightly
Neither Disagree
slightly
Disagree
strongly
Don’t
know
Recruitment issues have had a direct
negative impact on our ability to
deliver the level of service we would
like
Recruitment issues have had a direct
negative impact on our ability to
deliver the quality of service we would
like
The UK Living Wage directive has had
a positive impact on our ability to
recruit to posts
In the last 2 years we have seen an
increase in our use of employment
agencies as an aid to recruitment
The opportunity to be trained and gain
qualifications in order to be registered
has had a positive impact on our
ability to recruit posts
A shared recruitment platform for all
vacancies would benefit the sector as
a whole
More positive stories about / or
promotion of social care would help
aid recruitment

9
Q6 Please use the following box to provide any other comments or suggestions you have in relation to
staff recruitment.
STAFF RETENTION – FOR ALL CHOOSING Staff Retention / Review at Q2c
Q7a In the past 2 years, how frequently have you encountered difficulties in retaining …..
Regularly Occasionally Never DK / NA
Care / Support Workers
Social Workers
Allied Health Professionals
Registered Nurses
Mental Health Officers
Managers
Q7b And looking ahead to the next 2 years, do you expect any changes in the difficulty of retaining
…
Expect
much
greater
difficulty
Expect a
little more
difficulty
No change
expected
Expect less
difficulty
DK / NA
Care / Support Workers
Social Workers
Allied Health Professionals
Registered Nurses
Mental Health Officers
Managers
IF Difficulties expected – WHY / IF No difficulties expected - WHY

10
Q7c Which of the following would you say represent the greatest challenge in retaining staff?
Q7c Care /
Support
Workers
Social
Workers
Allied Health
Professionals
Registered
Nurses
Mental
Health
Officers
Managers
Low Pay
Conditions of employment
Registration requirements
for training and
qualifications
Competition from other
sectors offering better pay
and conditions (eg retail)
Competition from other
social service employers
offering better pay and
conditions
Lack of awareness and
expertise about how to
retain and keep staff
Lack of opportunities for
career progression / career
pathway
Restrictions on length of
contract we are able to
offer
Demand for flexible
working patterns
Dissatisfaction with
leadership and
management
High workloads
The job requires working
out of hours / anti-social
hours
Lack of full time
opportunities
Lack of training and
development of staff to
develop new skills and
adapt to new working
environment
Other
Write in
No challenges

11
Q8a Which of the following measures does your organisation use to help address or mitigate
against retention issues? (MULTI CODE ALLOWED)
Q8a
1 Giving staff regular opportunities to feedback on concerns
2 Listening to / acting on staff feedback
3 Offering free / low cost training
4 Pay increase
5 Additional incentives (bonus / additional leave etc)
6 Availability of paid overtime
7 Reducing probation periods
Improved induction processes
8 Open to negotiate flexible working
9 Offering ‘time off’ or sabbatical opportunities
10 Willing to support secondment opportunities
11 Increased opportunities for promotion / career progression
12 Other Write in
13 None used
14 Don’t know / Not applicable
THE FOLLOWING QUESTION WILL BE ASKED FOR EACH MEASURE USED:
Q8b. On a scale of 1 to 10 (where 1 is not at all successful and 10 is completely successful), please
could you rate the success, in general, of ….
1
Not at all
successful
2 3 4 5 6 7 8 9 10
Completely
successful
Don’t
know
Q9 Please indicate the extent to which you agree or disagree that ….
Agree strongly
Agree
slightly
Neither Disagree
slightly
Disagree
strongly
Don’t
know
Staff turnover is having a negative
effect on our ability to deliver the level
of service we would like
Staff turnover is having a negative
effect on our ability to deliver the
quality of service we would like
The introduction of the Living Wage
has had a positive impact on our
ability to retain staff
In the last 2 years we have seen an
increase in our use of overtime to
counter retention issues
The opportunity to be trained and gain
qualifications in order to be registered
has had a positive impact on our
ability to retain staff
In the last 2 years we have seen an
increase in our use of agency staff to
counter retention issues
More positive stories from or
promotion of social care would help
aid retention

12
Q10 Please use the following box to provide any other comments or suggestions you have in relation
to staff retention.
WORKFORCE PLANNING – FOR ALL CHOOSING Workforce Planning at Q2c
Q11a Who do you discuss workforce planning with? (MULTI CODE ALLOWED)
1 Other managers / senior staff in your organisation
2 Your management board
3 Integrated Joint Board(s)
4 CPP(s)
5 Voluntary sector providers
6 Independent sector providers
7 Other service providers
8 Other write in
9 None
Q11b What workforce data is collected in your organisation? (MULTI CODE ALLOWED)
1 Current staff numbers
2 Projected staff numbers
3 Current vacancies
4 Current skills / map of workforce
5 Projected skills need / map of workforce
6 Current recruitment activity and costs
7 Projected recruitment activity and costs
8 Current training activity and costs
9 Projected training activity and costs
10 Current staff costs
11 Projected staff costs
12 Current demand for service / need information / maps
13 Projected demand for service / need information / maps
14 Data on diversity / equality
15 Data on attendance at work
16 Staff feedback / staff survey data
17 Service user / carer feedback
18 Other Write in
19 None
Q11c How is this data being used? (MULTI CODE ALLOWED)
1 Collected but not used
2 Used to plan for future workforce needs (i.e. numbers and skills) in the short term (1-2 years)
3 Used to plan for future workforce needs (i.e. numbers and skills) in the medium term (3-5 years)
4 Used for service delivery planning / strategic commissioning of services
5 Used for budget-setting
6 Used in day to day management
7 Other Write in

13
Q12 Where in your organisation does the role of workforce planning sit?
(MULTI CODE ALLOWED)
1 With the Senior Management Team
2 There is one person with a specific Workforce Planning role
3 Within HR
4 At the operations level
5 With the Integrated Joint Board (IJB)
6 With the Community Planning Partnership (CPP)
7 Other Write in
Q13a Which of the following workforce planning tools are you aware of?
Q13b And which, if any, are used in your organisation?
Aware of Used
1 Not aware of any tool / guidance No tool / guidance used
2 SSSC Workforce Planning Guide SSSC Workforce Planning Guide
3 SIRCC – Towards a Competent and Confident
Residential Child Care Workforce. A Guide for
Residential Managers to the Registration and
Continual Professional Development of
Residential Child Care Staff
SIRCC – Towards a Competent and Confident
Residential Child Care Workforce. A Guide for
Residential Managers to the Registration and
Continual Professional Development of
Residential Child Care Staff
4 VSSSWU: Workforce Planning - A Toolkit for
Voluntary Sector Social Services in Scotland
VSSSWU: Workforce Planning - A Toolkit for
Voluntary Sector Social Services in Scotland
5 EVOC Care Training Needs Analyser (ECTNA) EVOC Care Training Needs Analyser (ECTNA)
6 Skills for Care Workforce Planning Resources Skills for Care Workforce Planning Resources
7 Indicator of Relative Need (IoRN) tool Indicator of Relative Need (IoRN) tool
8 NHS 6 Step Model NHS 6 Step Model
9 Local authority tool / guidance Local authority tool / guidance
10 Organisation’s own tool / guidance Organisation’s own tool / guidance
11 Other
Write in
Other
Write in
ASK ABOUT THE SPECIFIC PLANNING TOOL USED:
Q13c On a scale of 1 to 10 (where 1 is not at all useful and 10 is invaluable), please could you rate
the value to your organisation of….
1
Not at
all
useful
2 3 4 5 6 7 8 9 10
Invaluable
Don’t
know
Q13d Please use the following box to provide any comments you may have on strengths and
weaknesses of…..
Q14 Do you have any plans to change the way in which workforce planning is carried out within
your organisations?
1 Yes
Write in
2 No
3 Don’t know

14
Q15 Which of the following actions have you taken with regards workforce planning?
1 Changed recruitment methods
2 Undertaken workforce skills development planning
3 Identified skills training needs
4 Developed recruitment strategies
5 Developed retention strategies
6 Undertaken short-term (1-2 years) workforce planning
7 Undertaken medium-term (3-4 years) workforce planning
8 Undertaken long-term (5+ years) workforce planning
9 Succession planning
10 Profiled the workforce (eg who might retire in the next few years)
11 Other (Write in)
Q16 What are the main barriers to using a workforce planning tool?
1 Awareness / availability of an appropriate tool
2 Need for training on workforce planning
3 Availability of data
4 Uncertainty (unknown funding / service needs etc)
5 Time to dedicate to this
6 Other (Write in)
Q17 How likely would you be to use a nationally available workforce planning tool / suite of tools?
1 Very likely
2 Quite likely
3 Not very likely
4 Not at all likely
5 Don’t know
Those answering Very / quite likely will be given an open text box to say why
Not very / not at all likely will be given an open text box to say why
Q18 Please use the following box to provide any other comments or suggestions you have in
relation to workforce planning
GENERAL – ASK ALL
Q19 Please use the following box to provide any comments or suggestions you have in relation to
staff recruitment, retention, review or workforce planning
FOLLOW-ON RESEARCH – ASK ALL
Q20 We will be conducting a series of more in-depth discussions with a selection of respondents.
Would you be willing, if selected, to take part in a telephone discussion with one of our researchers?
If YES: Please provide your:
Name
Organisation Name
Contact email
Best telephone number to contact you
Thank you very much for taking the time to complete this survey. We value your views and would like to thank
you for participating.
Please click ‘submit’ below to complete your response.

15