Social Structure and Conflict - Brown University · Social Structure and Conflict* ... organized...
63
Social Structure and Conflict * Jacob Moscona † Nathan Nunn ‡ James A. Robinson § 21 February 2017 Abstract: We present evidence that the intensity and endurance of civil wars and conflicts can depend on the social structures of the societies involved. More specifically we argue that ‘segmentary lineage societies’ will tend to experience conflict which is more violent, of larger scale and more enduring that societies which feature different types of kinship systems. We investigate this by coding for 145 African ethnic groups whether or not they were historically organized as segmentary lineages and show that indeed such groups are prone to conflict along these lines. We show that the results are robust to a number of potential confounders such as historical political centralization, the importance of Islam and contemporary development outcomes. We argue that the causal connection works through the fact that in a segmentary lineage society it is easier to mobilize fighters and solve the collective action problem. The argument can help to explain the incidence and nature of conflicts in the Sahel and the Horn of Africa as well as the Middle East. Keywords: Civil War, Conflict, Social Structure, Segmentary Lineage JEL Classification: D74,O55,Z1. * For comments, we thank Jean Ensminger and Sara Lowes. † M.I.T. (email: [email protected]) ‡ Harvard University, NBER and BREAD. (email: [email protected]) § University of Chicago, NBER, and BREAD. (email: [email protected])
-
Upload
trinhduong -
Category
Documents
-
view
215 -
download
0
Transcript of Social Structure and Conflict - Brown University · Social Structure and Conflict* ... organized...
Social Structure and Conflict*
Jacob Moscona† Nathan Nunn
‡ James A. Robinson§
21 February 2017
Abstract: We present evidence that the intensity and enduranceof civil wars and conflicts can depend on the social structures ofthe societies involved. More specifically we argue that ‘segmentarylineage societies’ will tend to experience conflict which is moreviolent, of larger scale and more enduring that societies which featuredifferent types of kinship systems. We investigate this by codingfor 145 African ethnic groups whether or not they were historicallyorganized as segmentary lineages and show that indeed such groupsare prone to conflict along these lines. We show that the resultsare robust to a number of potential confounders such as historicalpolitical centralization, the importance of Islam and contemporarydevelopment outcomes. We argue that the causal connection worksthrough the fact that in a segmentary lineage society it is easierto mobilize fighters and solve the collective action problem. Theargument can help to explain the incidence and nature of conflicts inthe Sahel and the Horn of Africa as well as the Middle East.
Keywords: Civil War, Conflict, Social Structure, Segmentary Lineage
JEL Classification: D74, O55, Z1.
*For comments, we thank Jean Ensminger and Sara Lowes.†M.I.T. (email: [email protected])‡Harvard University, NBER and BREAD. (email: [email protected])§University of Chicago, NBER, and BREAD. (email: [email protected])
1. Introduction
Civil wars are a prevalent feature of the modern world. In 2013 there were 34 on going civil wars,
18 in Asia and the Middle East, 14 in Africa and 2 in the Americas (UCDP/PRIO Armed Conflict
Dataset). Some of these wars have been very protracted, for example the conflict between the
Lord’s Resistance Army and the Ugandan state can be traced back to 1987 (Allen and Vlassenroot,
2010). The civil war in Mindanao, the southern island of the Philippines has been on going since
the late 1960s. These wars also caused a great deal of damage and loss of human life. In 2013
alone, for example, an estimated 70,451 people died fighting in civil wars (UCDP Battle-Related
Deaths Dataset) and 10.7 million civilians were newly displaced (UNHCR Statistical Yearbook
2013). At the end of 2013, it is estimated that there were over 33 million people displaced by
conflict in total.
In this paper, we propose a new explanation that can help to account for the incidence and
longevity of civil war. Civil wars are created and sustained not simply by the costs and benefits
of fighting, but also by an ability to solve the collective action problem. Though often this can be
short circuited by forced recruitment, for example of children, and some surveys suggest that such
forced recruitment is quantitatively very large (Humphries and Weinstein, 2008), many people
clearly enter into conflict voluntarily. The importance of these issues is dramatically illustrated
by the recent success of Islamic State in mobilizing large numbers of fighters in Syria and Iraq
to carve out an extensive territory. Though their ability to do this is obviously related to many
things, that they are so successful at mobilization is remarkable. A similar situation arose with
the Houthi conquest of much of Yemen in 2015.
A critical aspect of the ability of a group to solve the collective action problem and mobilize
fighters towards a goal is the nature of the social structure of the people under consideration.
Though people in the West might be considered to be living in “nuclear families,” in most parts
of the world where we observe civil war, people live in much more complex social structures,
connected by kinship and other ties. Perhaps the most famous ethnographic example of a society
organized based on such a kinship structure is the Nuer, studied by Evans-Pritchard (1940a) in
the 1930s. The Nuer, living in what is now the South Sudan, became the archetype of what
anthropologists call a “segmentary lineage society.”
The basis of such a society is unilineal descent where people trace their ancestry back either
1
through the male (a patrilineal society), or female line (matrilineal). A lineage is a group of
persons within such a society that are differentiated geneologically from others. Individuals in a
lineage trace their ancestry back to a common, often mythical, founder, such as Somali in Somalia.
A segmentary lineage society is then defined as a lineage society in which sub-sets or segments
of a full lineage function as coherent autonomous corporate groups (Smith, 1956, pp. 39–40).
The important distinctive aspect of segmentary lineage societies is that they fuse a number of
distinct activities and functions into the segment which takes on political, judicial and adminis-
trative functions. As Fortes (1953, p. 26) puts it: “the individual has no legal or political status
except as a member of a lineage;. . . all legal and political relations in the society take place in the
context of the lineage system. . . all the members of a lineage are to outsiders jurally equal and
represent the lineage when they exercise legal and political rights and duties in relation to society
at large. This is what underlies. . . collective responsibility.”
Figure 1 displays a hypothetical segmentary lineage system. In the figure triangles indicate
individuals and the straight lines indicate descent, with each row of triangles indicating a
generation. All individuals in the figure descend from a common ancestor indicator by “I”. Also,
shown in the figure are segments of the full lineage. The segments can be of different size. In
the figure, the smallest segment shown is the “Minimal Segment”. The next larger is the “Minor
Segment” and the largest is the “Major Segment”.
Although it is true that the presence of ancestry and decent is universal among human
societies, not all group trace descent through unilineal lineages. Another common kinship form
is cognatic descent where individuals can simultaneously belong to two sets of groups and trace
their lineage through either their mother’s relatives or father’s relatives, or both. As well, many
small scale societies, for example hunter gatherer groups such as the Hadza or San, have no
established elaborate kinship system at all. In addition, the importance of kinship systems also
varies widely. Unlike in a segmentary lineage society, where lineage and kinship are of the
utmost importance, in many societies, local residence alone functions as a source of identity, even
though this clearly mixes together individuals who are not genetically related. In other societies,
completely different types of social structures, such as age sets and age grades, provide the main
way of organizing people and the primary ‘corporate form’, meaning that they are central in
administrative and political life
A number of scholars in the anthropology literature have hypothesized that there is a relation-
2

Maximal Lineage
I
Major Segment
A B
MinorSegment
1 2 3 4
a b c d e f g hMinimal
Segment
i ii iii iv v vi vii viii ix x xi xii xiii xiv xv xvi
1
Figure 1: The figure provides a representation of a hypothetical segmentary lineage society.
ship between the social structure of groups and the extent of civil conflict. More specifically, it
has been argued that segmentary lineage societies are more prone to become engaged in conflicts
that are longer and larger in scale than societies that do not have a segmentary lineage structure.
This is not because segmentary lineage societies harbor particular grievances or structures of
costs and benefits of fighting, but simply because the social structure is well-designed to mobilize
combatants when a dispute or conflict occurs. To see why this is the case, consider Figure 1.
An important aspect of segmentary lineage societies is that lineage, as well as the segments
within a lineage, take a corporate form and are central in administrative and political life. Thus,
lineages and segments and one’s responsibility to them is of the utmost importance. In the
figure, if individual “i” were to have a dispute with individual “ix”, within a segmentary lineage
system, this would mean that all individuals belonging to “Major Segment A” would be allied
with and come to the defence of individual “i”. Similarly, all individuals in “Major Segment
B” would be allied with and come to the defence of individual “ix”. Thus, a dispute between
two individuals immediately escalates into a dispute between to large communities. Outside
of segmentary lineage systems, these allegiances do not exist and the dispute instead would
3
comprise, at most, a small number of friends or family of the two involved in the dispute.
This logic is illustrated by a traditional Bedouin proverb that is roughly translated as: “I
against my brothers; my brothers and I against my cousins; my cousins, my brothers, and I
against the world.” (e.g., Barth, 1973, p. 13; Combs-Schilling, 1985, p. 660). Thus, the number of
individuals involved in a conflict depends on the geneological distance of those involved in the
dispute. Because of one’s membership in a set of nested segments and the strong obligations to
one’s kinsmen within the segments, in segmentary lineage societies small-scale dispute can easily
escalate into larger-scale and sustained fighting and even warfare.
In the historical context, the external enemy was typically those from another tribe or even
ethnic group. In the modern context, and particularly in Africa, conflict can take the form of
civil conflict, where the external enemy is the government. However, even in the context of civil
war, the same characteristics of segmentary lineage societies are still at play. The structure allows
segments to effectively mobilize against the common enemy, which in the setting of civil war is
the government.
This characteristic of segmentary lineage systems has been long-recognized by anthropolo-
gists. For example, (Sahlins, 1961, p. 323, 333) writes “the segmentary lineage organization is a
successful predatory organization in conflicts with other tribes. . . [Conflict], even if it has been
initiated by a small lineage segment, it pits ‘all of us’ against ‘them’. (p. 142 Evans-Pritchard,
1940a), describes the organization of the Nuer, a segmentary lineage group: “Each segment is
itself segmented and there is opposition between its parts. The members of any segment unite for
war against adjacent segments of the same order and unite with these adjacent segments against
larger sections.”
The goal of this paper is to take this long-standing hypotheses to the data by constructing,
for the first time, a database of whether or not societies within Africa belong to a segmentary
lineage society. Although segmentary lineage societies are present all over the world, we restrict
our analysis to the continent of Africa since this is the only part of the world for which fine-
grained conflict data are available with full coverage over an extended period of time. We use
conflict data from the Armed Conflict Location and Event Data Project (ACLED), a geo-coded
data set that catalogues information about each conflict event in Africa since 1997. The database
includes information on the location, date, and characteristics of what they term “politically
violent events”. These include conflict that we would consider part of a civil conflict, namely
4
between the government military and other non-government groups. These account for 39.4%
of the 117,823 events in their database. The other 60.6% of the conflict events do not involve the
government military and instead involve rebels, militias, rioters, protesters, civilians, and others
that do not fall within these classifications.
We also collect information on the social organization of ethnic groups within Africa; par-
ticularly, whether they are traditionally organized into a segmentary lineage system. Since this
information is not available in standard ethnographic sources such as the Ethnographic Atlas or
the Standard Cross-Cultural Sample, this was done using existing ethnographies to code whether
or not societies are organized by segmentary lineages. The primary source used for the data
construction was the Ethnographic Survey of Africa, which is a series of studies, produced from the
1940s until the 1970s, that were edited by Daryll Forde. We identified an ethnic group as having a
segmentary lineage organization: if (1) there is a recognized and known unilineal descent system;
(2) the branching of the lineage determines both administrative divisions and political allegiances;
and (3) lineages influenced residence location. We code an ethnicity as not having a segmentary
lineage organization if any of these three characteristics are not present.1 In the end, we are able
to definitively categorize 145 African ethnic groups, 74 of which are segmentary lineage societies
and 71 of which are not.2
We merge our coding of societies with and without segmentary lineage organization with
information on the location and intensity of conflicts from 1997–2015 using a digitized map of the
location of ethnic groups taken from (Murdock, 1959). We then measure the prevalence of conflict,
using the ACLED data, in the locations of each ethnic group. This strategy follows the same logic
as Michalopoulos and Papaioannou (2013) who examine the cross-ethnicity relationship between
historical state centralization and economic prosperity.
In addition to being the only feasible strategy given data limitations, we feel that using
location to link segmentary lineage is the best one. Disputes and conflicts that do not involve the
government military will tend to be localized and very near to the locations of the participants.
Thus, the location of the conflict viz a vis the social structure of the dominant ethnic group is
the relationship of interest. For conflicts that involve the government military – i.e., conflicts that
1Section 3 of the paper describe our coding method in detail and in the Appendix we document the sources thatare used.
2Based on NASA EarthData estimates of population in 2000, our sample comprises 212 million people, or ∼ 37.8%of Africa’s population at the time.
5
we typically refer to as civil conflicts – the conflicts tend to occur within the ethnic homelands
of the combatants.3 Therefore, for these forms of conflicts as well, the presence of a segmentary
lineage organization of the ethnic groups in the location of the conflict is the relevant relationship
of interest.4
Our analysis consists of two strategies. Our first is to estimate the cross-ethnicity relationship
between the traditional presence of a segmentary lineage system and the presence and intensity
of conflict from 1997–2015. Our estimates show a positive and statistically significant relationship
between segmentary lineage and a wide range of conflict measures, including conflict fatalities
and conflict duration. As well, the estimated effects are very large in magnitude. For example,
when the dependent variable is years of conflict between 1997 and 2015, we find that segmentary
lineage societies experience 3 more years of conflict on average, which is sizeable given that this
is about half a standard deviation.
We find that these relationships are robust to controlling for a large number of covariates,
including: country fixed effects, historical covariates (namely, political centralization and histor-
ical development as measured by settlement complexity), and a host of geographic covariates
(agricultural suitability, altitude, distance from the equator, amount of land inhabited by the
ethnic group, distance from center of the ethnic group to nearest country border, and an indicator
for the ethnic group being split by a national border). The estimates of interest are very similar
whether or not we condition on these covariates.
As a first step towards examining channels, we also condition our estimates on a set of
covariates that are potentially endogenous to social structure, namely, per capita income as
measured by satellite night light density, population density, and an indicator if the ethnic group’s
primary religion is Islam. We find that adding these contemporary controls does reduce our
estimated effect by approximately 30%, suggestion that income and islam may be part of the
channel explaining our findings. Importantly, however, we find that 70% of the total effect remains
3See for example the recent findings of Michalopoulos and Papaioannou (2016).4This said, it is true that it would also be informative to examine the relationship between the social structure of the
participants of the conflict and the incidence of conflict. However, this is not feasible for a number of reasons. First, wedo not have sufficiently fine-grained information to identify the ethnicity of the participants involved in the conflicts.For example, in many cases we just know that they are “protestors” or “civilians”. As well, with this strategy we arenot able to assign ethnicity to the conflicts that do not occur, since we have no information on who the participantswould have been. When we use location, the location allows us to link the presence of non-conflict to a measure ofsocial structure. This is not possible when we use the ethnicity of actors involved in the conflict.
6

explained by other channels.5
The conditional correlations suffer from the standard inference issues that plague cross-
sectional estimates, namely the presence of omitted factors, particularly those that are unobserv-
able to the researcher. Given this, we implement a second set of estimates that attempt to address
the presence of omitted factors that may bias our estimates. We first restrict attention to pairs of
ethnic groups that share a border and where one has a segmentary lineage organization and the
other does not. In our sample, there are 68 such pairs. We take 10km-by-10km grid-cells to be
the unit of observation, and implement a regression discontinuity identification strategy, where
we estimate the impact of segmentary lineage on conflict across grid-cells that are restricted to be
sufficiently close to the border, while controlling for two-dimensional running variables.
We find that the RD estimates are qualitatively identical to our OLS estimates. The estimates
are positive and highly significant. Quantitatively, the estimated effects are about half the
magnitude of the OLS estimates. These findings hold for each of our measures of conflict, for
a range of different bandwidths, and for a number of different strategies for accounting for the
two-dimensional running variables.
The benefit of the RD estimates over the OLS estimates is that unobservable factors are better
accounted for. As long as unobservables vary smoothly over space, because physically close
units have a similar geography, climate, and history, they will be controlled for with the RD
estimation strategy. However, a shortcoming of the strategy is that other factors may also vary
discontinuously at the border. In other words, there may be other differences between the ethnic
group besides the presence of segmentary lineage and the RD estimates may be capturing these
differences as well.
To explore the importance of this potential issue, we first check average differences in observ-
able characteristics between societies with and without segmentary lineages. We find that the two
groups are balanced on a wide variety of observable covariates.6 Second, we place a number of
additional restrictions on our ethnicity pairs, effectively restricting our analysis to pairs that are
matched based on: language group, modern country, historical economic development, historical
political centralization, as well as the propensity score based on these measures. We find that our
5 We recognize that interpreting estimates that condition on endogenous covariates has the usual inference issuesand so should be treated with caution. For more details see Angrist and Pischke (2008).
6 The balance of observables across ethnic group with and without segmentary lineage organization is consistentwith arguments suggesting that the presence of segmentary lineage societies is not correlated with a large set ofstructural factors, but is an idiosyncratic process (Evans-Pritchard and Fortes, 1940).
7
estimates are robust to these matching strategies. Thus, the matched RD estimates show that close
to the border of ethnic groups with and without segmentary lineage organization, but otherwise
the same in terms of other important observable dimensions, conflict is discontinuously higher
on the segmentary lineage side of the border.
An important aspect of the RD estimates is that it is important that the border is correctly
identified and that it does actually delineate differences in the locations of different ethnic groups.
We check whether this assumption is satisfied in the data by using information from the third
round of the Afrobarometer surveys on the location and ethnicity of over 5,500 respondents.
Estimating our RD equations, but with self-reported ethnicity as the outcome variable. We
find a sharp discontinuity at ethnicity borders, which provides confidence that our regression
discontinuity results really do capture the differences in social structures corresponding to the
different ethnicities on either side of the border.
The primary mechanism explaining our estimated relationship between segmentary lineage
and conflict is the structure of segmentary lineage systems, which because of their strong in-
group allegiances and their segmented structure can result in significant escalation of initially
small disputes to large scale conflicts. Given this, we attempt to unpack our conflict finding
by examining the effects of segmentary lineage on the onset of conflicts versus their impact on
the duration of existing conflicts. The mechanisms that have been identified by anthropologists
suggest that segmentary lineage likely affects both onset and duration, but the effect may be
particularly important for duration. Examining these two effects with hazard models, we find that
segmentary lineage both increases the probability of a conflict starting, as well as the duration of
conflict given its start. As well, we find the effect on duration is stronger statistically and larger
in magnitude.
We implement a second method to examine the escalation effect of segmentary lineage, which
is to estimate the relationship between segmentary lineage and conflicts of different scales. We
measure the scale of a conflict by the number of fatalities in the conflict and create the following
four groups: conflicts with no fatalities, conflicts with 1–10 fatalities, conflicts with 11–100 fatali-
ties, and conflicts with more than 100 fatalities. We find that a segmentary lineage organization is
associated with conflicts of all types, but the estimated relationship is significantly stronger, both
in terms of statistical significance and magnitude, for larger-scale conflicts. In addition, these
differences are large. For example, we find that while segmentary lineage societies have 0.66
8
more conflicts with zero fatalities (or 0.5% of the mean), they have 1.561 more conflicts with more
than 100 fatalities (or 62% of the mean). These findings are consistent with segmentary lineages
having a particularly strong effect on the escalation of conflicts once they start.
Our findings contribute to a better understanding of the incidence, intensity, and longevity
of violence in developing countries (see Blattman and Miguel (2010) for an overview). This
literature has proposed various types of explanations, many based on the dichotomy between
‘greed’ and ‘grievance’ (see Collier and Sambanis, 2005a,b). Greed factors influence whether
or not individuals or groups decide to engage in civil war. These include things like the
presence of natural resources, such as oil and diamonds, or ‘lootable wealth’ (Weinstein, 2006,
Ross, 2004, 2006) and possibly the presence of international aid (De Ree and Nillesen, 2009,
Nunn and Qian, 2014, Crost, Felter and Johnston, 2014). On the grievance side civil war could
be induced by inequality in society (Cederman, Gleditsch and Buhaug, 2013), the presence of
ethnic cleavages (Montalvo and Reynal-Querol, 2005, Esteban, Mayoral and Ray, 2012), arbitrary
national boundaries (Michalopoulos and Papaioannou, 2016), or the lack of political account-
ability and democracy (Gleditsch and Ruggeri, 2010) or other types of exploitative institutions
(Richards, 1996, Wood, 2003). Also important could be factors that influence the opportunity
cost of engaging in conflict (Miguel, Satyanath and Saiegh, 2004, Dube and Vargas, 2013) perhaps
turning fighting in civil war into a kind of occupational choice (Debos, 2011, 2016, Hoffman,
2011, McGovern, 2011). A final recurrent theme is that civil war occurs as a consequence of state
weakness proxied by GDP per-capita (Fearon and Laitin, 2003) or measured more directly by state
history (Depetris-Chauvin, 2014).7
Our findings also contribute to a well-established anthropological literature that through case
studies has hypothesized and documented the impacts that segmentary lineage structures have
on conflict escalation. See for example Evans-Pritchard (1940a,b), Bohannon (1958), Kelly (1985),
Lewis (1994, 1989), Salzman (2007), Zeman (2009), Stearns (2013), Ahmed (2013), Hoehne (2015).
While these studies focus on the impacts that segmentary lineages can have on within ethnicity
conflict, whether it be individuals from the same village against one another or individuals
from separate villages against one another, they also recognize that in some cases segmentary
lineage can also be effective in mobilizing fighters of one ethnicity against another ethnicity. For
7There is a great deal of controversy about the empirical explanatory power of any of these theories, e.g. the debateover the impact of negative economic shocks on civil war outbreak (see Miguel et al., 2004, Ciccone, 2013), or theconnection between income per-capita and civil war (Djankov and Reynal-Querol, 2010).
9
example, Sahlins argues that a segmentary lineage could be a “successful predatory organization
in conflicts with other tribes” (Sahlins, 1961, p. 323).
An important point about our analysis is that we are not able to test this consequence of
segmentary lineage organization. In particular, our estimates, particularly our RD estimates,
examine the impact of segmentary lineage on conflict within the ethnicity in question. Thus, any
conflicts that occur outside of the group itself, will not be captured in our estimates. Examining
such a relationship would require that we know who the parties in each conflict were and to
which ethnicity they belonged. This information is not available. Thus, we are able to show that
segmentary lineage societies experience more conflict within their own society. We are unable
to examine whether segmentary lineage societies are also more involved in conflicts occurring
elsewhere outside of their ethnic group.
Our findings also contribute to a deeper understanding of the consequences of the pre-colonial
characteristics of African societies. A number of important studies have documented the impor-
tance of political centralization for economic outcomes today (e.g., Gennaioli and Rainer, 2007,
Michalopoulos and Papaioannou, 2013). Although this aspect of pre-colonial societies is clearly
an important determinant of subsequent development, our analysis draws from an important
anthropology literature that documents how pre-colonial African societies were organized in
many different ways that cannot be adequately described by their being more or less centralized.
One important form of organization for both more-centralized and less-centralized societies
was a segmentary lineage organization. The relationship between political centralization and
segmentary lineage organization is a point to which we will return throughout the paper, and
will be central to our empirical analysis.
Thus, our findings also contribute to the limited number of pre-existing studies by economists
or political scientists that examine the importance of social structure within developing countries.
A seminal paper by Gneezy, Leonard and List (2009) shows that whether or not a society is
matrilineal or patrilineal influences how competitive women are compared to men. Relatedly,
La Ferrara (2007) and Lowes (2016) have examined other aspects of the difference between
these two groups. Dunning and Harrison (2010) shows how the social institution of cousinage
influenced the appeal of ethnic political appeals in Mali. Greif (1994) examined institutional
divergence between Genoa and other parts of the Mediterranean by positing differences in
underlying kinship relations which did not allow the Genoese to use community enforcement
10
mechanisms in contractual relations and Greif and Tabellini (2010), building on a large historical
literature, use a similar argument to explain the historical divergence between Europe and China.
Economists following the seminal work of Becker (1981) have developed models of resource
allocation where the family is distinct from other people, usually being linked by altruism. Such
distinctions between family and non-family have a basis in biology (see Hamilton, 1963, Henrich
and Henrich, 2007) and have been applied to study problems of development (e.g. by Banfield,
1958). Kinship as determined by family ties has also been extensively used in the literature on
social networks (see Ansell and Padgett, 1993, Naidu, Robinson and Young, 2015) . In political
economy family ties have also been explored as sources of political power and dynastic politics
(see Dal Bo, Dal Bo and Snyder, 2009, Querubín, 2016, Cruz, Labonne and Querubin, 2015).
Nevertheless, to our knowledge none of these literatures have examined the type of distinction
we study, which exploits the differential nature of kinship organization across different societies.
The paper proceeds as follows. In the next section we review the existing anthropological
explanations for why some societies are organized along the basis of segmentary lineages and
others are not. We then discuss case study evidence which makes a causal link between segmen-
tary lineage organization and conflict. Section 3 discusses the data and in particular the way in
which we coded whether or not a particular society has a segmentary lineage structure based
on ethnographic sources. Section 4 presents our OLS estimates, while section 5 presents our RD
estimates. Section 6 reports additional estimates that provide insights into mechanisms. Section
7 concludes.
2. Background
A. Theories on the Causes of Segmentary Organization
Though why some societies are organized in segmentary lineages and not others has never been
a focus of anthropological research, several theories have been presented to explain the origin of
11

segmentary organization.8 One school of thought, exemplified by the work of anthropologist
Daryll Forde, suggests that there is an ecological basis for the development of segmentary
lineage societies (Forde, 1953, 1970, Verdon, 1982). Forde sees lineage organization as historically
dominant and argues that a less “exacting” physical environment would have allowed groups to
preserve tribal organization based on lineage structures:
“[T]he much less exacting physical conditions for both cultivation and cattle-
rearing, which permitted greater stability of settlement and did not impose exten-
sive seasonal movements and dispersal in search of dry season pastures and water
supplies, made it possible for the segmenting agnatic descent groups to maintain
territorial continuity and to combine in securing and defending resources over an
expanding field from the land holding minor lineage to the tribe” (Forde, 1970, p. 21).
Forde cites the presence of a perennial river as an ecological characteristic that might preserve
a segmentary structure (p. 22). If individuals are able to survive without significant travel outside
their tribal sub-group’s territory, and without forming associations (economic or otherwise) with
individuals outside of their tribal sub-group, then the segmentary lineage system tends to be
maintained.
Anthropologist E.E. Evans-Pritchard made a similar type of argument: that group characteris-
tics which allowed (or forced) tribes to survive with limited interactions outside more immediate
geographical or genealogical networks bolstered segmentary organization. In his analysis of the
Nuer, Evans-Pritchard writes, “Nuer have, it will be acknowledged, a low technology which,
taken with their meagre food-supply and scanty trade, may be supposed to have some effect on
their social relations and their character. Social ties are narrowed, as it were, and the people of a
village and camp are drawn closer together, in a moral sense, for they are as a consequence highly
interdependent” (Evans-Pritchard, 1940a, p. 89). Lack of access to trade or ability to interact with
8Indeed, since the 1970s such notions as segmentary lineages have been severely criticized by anthropologists manyof whom have come to see kinship as being much more fluid and flexible and not contained so well into differentcategories (see Kuper, 1982, Schneider, 1984, Carsten, 2003, Sahlins, 2013). In consequence they have not been interestedin proposing theories of the origins of such organization. Another line of thought argues that concepts like segmentarylineages were largely imposed on African societies by colonial anthropologists and administrators and therefore donot represent the reality of African society (see Kuper, 2014). Nevertheless, our reading of the ethnographic evidenceis that, even though there are always many idiosyncratic differences between any two societies, it is possible to makesuch a classification based on clear and observable criteria, and whether or not this is important for different socialoutcomes is an empirical issue which has never been investigated before econometrically to our knowledge. If, forexample, lineage organization in Africa was as irrelevant as Kuper (1982) claims, then one would not expect it to berobustly and significantly correlated with any social variable of interest.
12
distant groups strengthened genealogical bonds that form the basis of the segmentary structure
and inhibited the development of other relationships that might interfere with lineage allegiances.
Similar arguments were made by Fortes (1953, p. 24) who also notes a relationship with the
scale of the community when he observes “unilineal descent groups are not of significance among
peoples who live in small groups, depend on rudimentary technology, and have little durable
property” the latter idea was first proposed by Lowie (1921, p. 149) who argued that the roots
of unilineal descent groups could be traced in part to the transmission of property rights so that
one would not expect unilineal descent to emerge in societies without property to transfer, such
as many hunter-gatherer groups (see Richards, 1950, for an application of this idea to explain the
lack of unilineal descent amongst the Bemba).
Others claim that segmentary organization is not dependent on physical conditions but instead
is a diffused ideology that can, however, be made more or less prominent in daily life by changing
external conditions (Smith, 1956, Salzman, 1978). Philip Salzman argues that since physical
conditions are constantly changing, it cannot be that the divergence of tribal organization was
dependent on ecological differences. Instead, for segmentary lineage organization to develop, it
has to be part of tribal culture as an “asserted ideology.” While particular ecological conditions
may strengthen or weaken a segmentary system by making it more or less advantageous as a
social ideology during a given time period, the system develops as a part of tribal culture and not
in response to particular ecological conditions (Salzman, 1978).
Anthropologist Raymond Kelly presents additional evidence suggesting that segmentary lin-
eage structures are ideological and do not result purely from being in close proximity (because
of ecological conditions, etc.) to the same group of people. Kelly finds fault with a claim
made in Verdon (1982) that “Nuer [a segmentary lineage group] patterns of association are
reducible to ecological exigencies” (Kelly, 1983, p.906). He argues that although Lou Nuer
(one of the sub-tribes of the Nuer) “dry season aggregations share pastures with neighboring
Dinka groups. . . this does not engender a pattern of military alliance among the Nuer and Dinka
aggregated at the same locations, but instead leads to quite the opposite: armed conflict. This
same lack of correspondence between dry season aggregations and patterns of alliance is the
norm. For example, portions of the Kwachbur section of the Lak tribe share dry season pastures
with the Riah section of the Thiang tribe, yet the Kwachbur identify themselves as part of Lak and
form military alliances accordingly” (p. 906). This suggests that segmentary lineage systems are
13
the product of tribal ideology and do not form and incorporate all individuals in close geographic
proximity because of unexacting ecological conditions (Forde, 1970) or inability to form social
relationships across longer distances (Evans-Pritchard, 1940a).
While more recent work in anthropology thus suggests that segmentary lineage adoption is
based on ideological development rather than ecological conditions, we nevertheless include a
broad range of geographic control variables in our model. Moreover, we find no correlation
between segmentary lineage organization and a broader set of geographic variables, including,
for example, mean temperature, mean altitude, ethnic group land area, malaria ecology, absolute
latitude, a measure of agricultural suitability, and dependence on agriculture or animal hus-
bandry. These findings are consistent with the notion that the creation and or persistence of
segmentary lineage organization may be a quite idiosyncratic matter and possibly related to the
type of ideological forces that Salzman and Kelly discuss.
B. Case Studies: Segmentary Organization and Conflict
There is a great deal of case study evidence from conflicts in Africa and the Middle East
which suggests an intimate link between segmentary lineage organization and the initiation and
propagation of conflict. These studies of conflict and its causes span the fields of anthropology,
ethnography, and political science and help delineate the mechanisms that link segmentary
lineage organization to conflict. A main conclusion from these case studies, which is corroborated
by our empirical analysis, is the strong impact that segmentary lineage organization can have on
the continuation and exacerbation of conflict. While the link between segmentary structure and
conflict initiation is less overt, once a conflict begins, segmentary lineage organization makes it
much more difficult to demobilize and resolve. It has this effect primarily by broadening the
conflict’s reach and institutionalizing opposition among large portions of society.
Apart from the Nuer in the South Sudan, one of the best studied classic segmentary lineage
societies is in Somalia. Somali social structure is dominated by segmentary organization. The
anthropologist Ioan Lewis argues that the segmentary lineage system plays a major role in
shaping and exacerbating conflict in Somalia. In A Pastoral Democracy, Lewis writes that “quarrels
between individuals which result in loss of life or property or both are often quickly followed
by retaliation where there is little thought of negotiation. Within a clan bitter feuds develop
and persist, often for many years and sometimes generations, erupting spasmodically as later
14
incidents occur, and being temporarily forgotten only in the context of wider hostilities” (p. 243).
Not only do these animosities, institutionalized by the segmentary lineage structure, lead to
the scale-up of conflict, but they are so entrenched that the national government can do almost
nothing to halt violence rooted in lineage opposition. Lewis continues, “Inevitable government
intervention eventually halts fighting between groups and causes compensation to be paid, but
this is little deterrent to continued bloodshed” (p. 244).
In Blood and Bone, Lewis outlines the mechanistic link between segmentary lineage organization
and violence during the 1980s, which was ostensibly unrelated to tribal antagonism. After the
Ogaadeen war of 1977–1978, there was an “upsurge of tribalism.” What seemed like emergent
Somali nationalism was in reality the fact that “President Siyad had consolidated the position
of his own clan and family” (p. 225). Lewis describes the strategy of the government, which
was not to develop a national identity but rather to recruit as many tribal segments as possible
within the segmentary system. However, this was met with corresponding allegiances among
segments opposed to the government: “The regime’s appeal for Daarood solidarity evoked a
corresponding attempt by the Isaaq to invoke a wider based, higher level ‘Prrir’ solidarity to
include the important Hawiye clans in whose territory Mogadishu, the capital of the republic,
is located” (p. 226). This growing societal polarization along tribal and genealogical lines lay at
the foundation of Somalia’s “political” conflict. Lewis concludes, “As in the past, political unity
was now not absolutely limited to the clan level” and the segmentary structure allowed both the
government and opposition forces to mobilize large swaths of the lineage system for their cause
(p. 232).
In Somalia, the relationship between lineage organization and violent conflict remains relevant
in the present day. A 2015 Rift Valley Institute Report reaffirms its importance in a discussion of
an upsurge of conflict during 2006:
“The Warsangeli/Dubays fighters secured the support of other Warsangeli sub-
clans and lineages in eastern Sanaag and around US $20,000 were sent by the diaspora
for rations and ammunition. Warsangeli military officers, not all of them members
of the Dubays sub-clan, coordinated the fighting, which meant that fighting in the
Majayahan area involved and concerned all the Warsangeli. This is very much in
line with the segmentary logic of the northern Somali society as a whole: as soon
as a common threat emerges from outside, members of a descent group unite at the
15

highest necessary level (sub-clan, clan or clan-family). Conversely, in the absence of
such a threat, a group breaks up into smaller units that fend for themselves” (p. 127).
The segmentary organization forces an individual to align with large portions of society against
external threat, even if the individual or the individual’s tribal segment have no personal or
pragmatic incentive to participate in conflict (other than a desire to preserve lineage loyalty). This
facilitates and drastically simplifies recruitment to conflict.
This cycle in which segmentary organization exacerbates conflict has been described in several
other countries and ethnic homelands. South Sudan is home to the Nuer and the Dinka, two
ethnic groups that strictly abide by segmentary lineage organization. Evans-Pritchard writes
of the Nuer: “Between tribe and tribe, there is no means of bringing together the parties to a
dispute and compensation is neither offered or demanded. . . if a man of one tribe kills a man of
another tribe, retribution can only take the form of intertribal warfare” (Evans-Pritchard, 1940b, p.
278). Segmentary organization can thus facilitate the scale-up of existing hostilities and intensify
conflict. Evans-Pritchard writes:
“Each segment is itself segmented and there is opposition between its parts. The
members of any segment unite for war against adjacent segments of the same order
and unite with these adjacent segments against larger sections. Nuer themselves state
this structural principle clearly in the expression of their political values. Thus they
say that if the Leng tertiary section of the Lou tribe fights the Nyarkwac tertiary section
– and, in fact, there has been a long feud between them – the villages which compose
each section will combine to fight” (Evans-Pritchard, 1940a, p. 142).
He concludes, “Hostility between smaller segments of a tribe may involve the larger segments of
which they form part. A quarrel between two villages may thus, as we have noted, bring about a
fight between secondary, and even primary, tribal sections” (p. 160).
Segmentary lineage structure can thus result in the escalation of conflict that begins as a feud
among small portions of the society. This scale-up logic applies even to conflicts that begin
as feuds among individual Nuer, especially following homicide. Although “responsibility for
homicide and the duty of exacting vengeance directly fall only on the close agnatic kin of
slayer and slain, the communities to which the two parties belong are, in one way or another,
involved in the hostility that ensues and, often enough, in any fighting that may result from
16
the dispute (Evans-Pritchard, 1940a, p. 150). The Dinka similarly exhibit patterns of allegiance
which, as in the Nuer case, can exacerbate conflict. Lienhardt describes the process by which
large segments of Dinka society are compelled to unite in conflict with outsiders or Dinka with
more distant genealogical ties. Lienhardt asserts, “It is only when Dinka from different parts of
the country meet together among foreigners that their common culture and language may draw
them together, simply as Dinka, in opposition to foreigners whom they understand less well than
each other” (Lienhardt, 1958, p. 107). As in Somalia, segmentary lineage structures in Sudan
exacerbate violent conflict, both within and among ethnic groups.
Conflict among the Tiv of Nigeria – a segmentary lineage society – exhibits a similar pattern.
Bohannan asserts that the “spread of war is determined by the segmentary order of the groups
involved. The fighting spreads until equivalent segments are engaged and it is limited to them”
(Bohannon, 1958, p. 46). She elaborates on this process in the context of a specific example
of conflict: “When fighting broke out between Morov of MbaKetsa and MbaHura of Tondov,
all MbaKetsa was engaged against all Tondov. The spread of the war thus followed the order of
political segmentation” (ibid.). The segmentary structure facilitated recruitment to conflict, which
significantly escalated a feud that began between just two tribal segments.
C. Other Systems of Kinship
There is no overarching taxonomy of kinship systems accepted by anthropologists; nevertheless,
the existing literature identifies several important systems which clearly do not have the form of
the segmentary lineage system and they make up our control group.
Most studied are the non-segmentary systems in modern Zambia, particularly the Bemba and
the Lozi.9 Radcliffe-Brown (1950, p. 42), discussing this part of Central Africa, points out that
“The typical corporate group in that region is a village constituted by the persons who attach
themselves to a headman. This group is an open, not a closed group; that is, individuals or
families may join or leave it, moving from one village to another. It is usual that a number of the
inhabitants of a village at any time should be related, either by cognatic ties or through marriage
with the headman or with one another, but they do not form a unilineal kin group, which is by
it’s constitution a ‘closed’ group”.
9The Lozi are the dominant ethnic group in a region of western Zambia called Barotseland or Loziland.
17
Radcliffe-Brown (1950, p. 43) later points to what he perceives as the key difference between
societies based on unilineal descent and those based on cognatic descent. “It is the corporate kin
group. . . that controls the use of land, whether for hunting, for pastoral life, or for cultivation;
that exacts vengeance for the killing of a member, or demands and receives an indemnity. . . A
continuing social structure requires the aggregation of individuals into distinct separated groups,
each with its own solidarity, every person belonging to one group of any set. . . In kinship systems
cognatic kinship cannot provide this; it is only made possible by the use of the principle of
unilineal descent.”
The major scholar of the Lozi was the anthropologist Max Gluckman who in a series of works
documented their social, economic and political systems. Significant for our present discussion
is his summary statement “No corporate unilineal group of kinsmen exists among the Lozi.
Every child. . . has a right to make its home in a village of either of its mother’s parents and to
inherit there. It also has these rights with the kin of its father. . . There are no broadly based
unilineal groups associating in common rights of residence, ownership, inheritance, production
etc. ” (Gluckman, 1950, pp. 171, 173). This reinforces Radcliffe-Brown’s characterization of such
a society, one with cognatic descent, as being “open”. Moreover, “The only corporate group of
kindred is the village” (Gluckman, 1950, p. 167) and since people are always moving about or
are moved about by the Lozi king “the pattern of kinship links in local communities is constantly
altering” (p. 177).
As Gluckman points out, the kinship system of the Lozi is shared not just by other ethnic
groups of Central Africa, such as the Bemba (see Richards, 1950), and the Tonga but also the
Wabena of Tanzania and the Ankole and Toro of Uganda (Gluckman, 1950, p. 178). These Central
African contrasts are interesting since while the Lozi and Bemba had states prior to colonial
contact, the Tonga were a stateless society (see Colson, 1951).10
Analyses of cognatic kinship groups illustrate that they are very different in structure from
segmentary lineage groups. Most important for thinking about the mechanisms linking social
structure and conflict is the fact that segmentary lineage societies are both “closed” in a way
cognatic societies are not and the fact that all of the functions that a corporate group might
10There is a great deal of consensus about the nature of these systems in this part of Africa. For example, Fortesstates “among the Bemba, the Tonga, the Lozi and many of their neighbors. . . the social structure must be thoughtof as a system of interconnected politico-legal statuses symbolized and sanctioned by ritual and not as a collective ofpeople organized in self-perpetuating descent units” (Fortes, 1953, p. 37).
18
undertake, social, political, juridicial or administrative are fused together in a segmentary lineage
group. These elements seem to create a far greater social solidarity in segmentary lineage societies
and much greater ability to engage in collective action. This is not so in societies with cognatic
kinship where “There is, in these societies, a clearer structural differentiation between the field
of domestic relations based on kinship and descent and the field of political relations, than in
segmentary societies” (Fortes, 1953, p. 26). This analysis is echoed in Gluckman’s description
of the Lozi when he notes “I have described how Loziland is divided and the Lozi people are
grouped into neighbourhoods. . . and pointed out that this was not the administrative and military
organization of the nation. This organization consisted of a number of sections. . . The members
[of which] did not live in a compact block, within a defined area, but were scattered over the
whole of Barotseland” (Gluckman, 1951, p. 31).
Robinson (2001) develops a theoretical model where societies which feature “closed groups”
(ethnic groups) experience more conflict than societies with “open groups” (classes) due to the
mitigating effects that social mobility has on conflict.
Cognatic kinship societies do not exhaust the types of kinship systems in our dataset. Other
prominent cases are those of societies, like the Kikuyu in Kenya, which are dominated by age
groups, not lineages. The politics and administration of the Kikuyu is organized along the lines
of age, not lineage. One could imagine that age could also provide a useful axis for mobilization
and collective action and there is some evidence that it does today (see the essays in Kurimoto and
Simonse, 1998). Moreover, the Zulu state was created by Shaka by turning age sets into military
regiments Gluckman (1940), Eldredge (2014). Nevertheless, what is distinct about segmentary
lineage societies is that while segments may oppose each other locally, they unite together in
larger lineage groups to oppose other. This process of what Evans-Pritchard (1940a, p. 137) called
“fission and fusion” implies that a segmentary lineage society could mobilize far more people
than one based on age where different age sets or grades stand opposed to each other with no
institutionalized way of uniting.11
Finally, also distinct are very small scale societies which never develop either unilineal or
cognatic kinship in any institutionalized form, these include such groups as the Hadza or the San
11This is not to say that age sets and lineage structures cannot arise in the same society. The Nuer had age sets,though they were not of importance in terms of the organization of the society while lineage was critical in Zulusociety and indeed it is coded as a segmentary lineage society in our data despite Shaka Zulu’s military innovations(indeed, Gluckman, 1950, counterpoises it to the Lozi).
19
people.
3. Data
A. Conflict Data (ACLED)
Our main conflict data come from the Armed Conflict Location and Event Data Project (ACLED),
which provides details of all known conflict evens within Africa from 1997–2014. Included in
the information provided is the location of the event (latitude and longitude), the actors involved
(government forces, rebel milita, civilians, protestors, etc), and the motivation of the actors involve
(e.g., aimed at taking over land, riots, protests, etc).
Both our OLS and RD analyses rely on the reported latitude and longitude of each conflict
event. Using the location, we assign each conflict to a particular ethnic group using a digitized
version of the map of ethnic boundaries taken from Murdock (1959).12 This is the same map as
used in Michalopoulos and Papaioannou (2013).
Given the potentially different effects that segmentary lineage structures have on civil conflicts
relative to within ethnicity conflicts, our analysis distinguishes between a host of different types
of conflicts. Specifically, we examine the following four types of conflict events: (1) an aggregate
measure of conflict that includes all conflict types; (2) conflicts that are part of a civil war;
(3) conflicts that are not part of a civil war; (4) conflicts that are more localized and between
unorganized groups (i.e., do not involve government forces or rebel groups). We provide a precise
definition of each below.
1. All Conflicts. This is an aggregate measure that includes all conflict events listed in the
ACLED database (with the exclusion of conflicts that result in no fatalities).
2. Civil Conflict. This is a measure that include all conflict events that involve the government
military or rebels (who are seeking to replace the central government) as one of the actors.13
3. Non-Civil Conflict. This includes all conflict events that are not coded as being part of a
civil conflict.14
12The digitized version is taken from Nunn (2008).13In the ACLED database, this includes all events for which the interaction variable is any integer from 10–28.14In the ACLED database, this includes all events for which the interaction variable is any integer from 30–67.
20
4. Within Ethnicity Conflict. This includes conflict events for which both actors in the conflict
are geographically local and/or ethnically local groups.15
We construct a range of different measures of the extent of the presence of the different forms
of conflict from 1997–2004: number of conflict events, number of conflict deaths, and number of
months during the sample period that experienced a conflict incidence.
Thus, in total we have three different measures of conflict extent/intensity and four different
types of conflict, resulting in twelve different conflict measures.
B. Identifying Segmentary Lineage Societies
The central variable of our analysis is a measure of whether ethnic groups were a segmentary
lineage society. The most commonly used ethnographic source is the Ethnographic Atlas, which
is a digitized database providing information on over 100 characteristics of 1,265 ethnic groups
globally. However, this source does not include information on whether an ethnic group has
a segmentary lineage system.16 Therefore, to identify the presence or absence of a segmentary
lineage system, we relied an alternative source, the Ethnographic Survey of Africa, a multi-volume
work that compiles ethnographic information from a large number of African ethnic groups. The
Survey, edited by Daryll Forde, was published over the course of several decades, beginning dur-
ing the late-1940s, by the International African Institute in London. It is divided into individual
volumes, first by region and then by ethnic group, and each entry contains detailed information
about the political, social, cultural, and economic practices of each ethnic group, as well as a
description of the ecological environment. When a particular group was not included in the
Ethnographic Survey, or when the information there was insufficient to determine whether or not
it was a segmentary lineage society, we then consulted primarily the references from Murdock’s
Ethnographic Atlas to try to determine if the group had a segmentary lineage structure.
For a group to be coded as being a segmentary lineage society, they needed to satisfy the
following three criteria.17
15This includes values of the interaction variable from 40–47, 50–57 and 60–67. We exclude conflicts in which one ofthe participants is listed as “other," defined as “outside/external force (eg. UN)."
16It does contain related concepts. The Ethnographic Atlas has information on the presence of clans and whetherliving arrangements are organized around them i.e., variables v15/v16. It also has information on whether there arelineages that are unilineal (matrilineal or patrilineal) i.e., v17/v19. However, whether or not a society had a segmentarylineage structure is not a simple composition of these. These measures are correlated with our constructed segmentarylineage variable, but the two variables only explain about 11% of the total variation. (??)
17The sources used to code each tribe are included in the online Appendix.
21
1. The first criterion is that the society must be based on unilineal descent and there must
have been direct and explicit evidence that peoples’ identities are based on their lineages.
Moreover, all individuals must be aware of their genealogical connection to members of all
other sub-groups.
2. The second criterion is that the segments of the lineages take on a corporate form. Branching
lineage segments determine both administrative functions and political allegiances, and
centralized political authority entirely divorced from the lineage structure does not exist.
For example, Evans-Pritchard and Fortes (1940, p. 13) write that segmentary societies
are organized in “equilibrium between a number of segments, spatially juxtaposed and
structurally equivalent, which are defined in local and lineage, and not in administrative
terms. . . the set of inter-segmentary relations that constitutes the political structure is a
balance of opposed local loyalties and of divergent lineage and ritual ties”.
3. The third necessary criterion is that the members of the ethnic group live closest, geo-
graphically, to individuals with whom they are most genealogically related and farther
from individuals with a more distant common ancestor. Sahlins (1961) emphasizes this
characteristic of segmentary organization: “The closer the genealogical relation between
focal lines, the closer their respective segments on the ground” (p. 328).18 Thus, a third
necessary condition is that there is explicit evidence that a geographic organization based
on the lineage system is expected and observed in a consistent pattern.
For an ethnic group to be coded as non-segmentary lineage society, we required direct evidence
that either of the three criteria were not satisfied. That is, lack of evidence for either criteria is
not sufficient for a variable to be coded as not being a segmentary lineage system. We required
direct evidence that the criteria were not satisfied. Thus, in the end we are only able to code
our segmentary lineage society variable for a subset of all ethnic groups within Africa, 145 in
total (using the ethnic classification from Murdock (1959), for which we were able to definitively
conclude that the ethnic group did or did not have a segmentary lineage system. For all other
18Radcliffe-Brown (1950, p. 42) notes about societies which lack unilineal descent “Some of these tribes have clans,. . . but the clans are dispersed and not corporate. Thus the Ila and Bemba and other tribes have dispersed matrilinealclans. The members of one clan are scattered through the tribe; they do not ever come together to take any kind ofcollective action, and have no single authority (headman or clan council).” Fortes (1953, p. 36) concurs observing that“A lineage cannot easily act as a corporate group if its members can never get together for the conduct of their affairs.It is not surprising therefore to find that the lineage in African societies is generally locally anchored.”
22
ethnic groups, the existing evidence was not sufficient to determine with confidence whether an
ethnic group is organized based on segmentary lineages or not.
As a check on the validity of our coding, after the variable construction, we consulted the exist-
ing secondary literature to determine whether scholars had previously characterized or described
specific ethnic groups as having a segmentary lineage organization or not. Reassuringly, in all
cases (42 in total), our classification matched the existing consensus. These literature matches,
where applicable, are listed along with our original coding source in the paper’s Appendix.19
The 145 ethnic groups are shown in Figure 2. Segmentary lineage societies are depicted in blue
and non-segmentary lineage societies in green. The map shows that we have managed to identify
segmentary lineage societies and definitively non-segmentary lineage societies from many parts
of Africa. There are large clusters of observations in Uganda, Tanzania and Kenya, they are also
present in Ethiopia, in Mozambique the Democratic Republic of the Congo and even Zambia, and
also in West Africa, in Nigeria, Ghana, Liberia and southern Sierra Leone.
C. Descriptive Statistics
Table 1 presents descriptive statistics. Column 1 reports the mean and standard deviations of
various measures for the 74 African societies that we code as being segmentary lineage societies,
while column 2 reports the means and standard deviations for the 71 non-segmentary lineage
ethnic groups. Column 3 reports the difference in means between the two groups (and the
standard deviation in brackets).
Panel A of the table reports statistics for four conflict measures, constructed from the ACLED
database: log conflict incidents for all conflicts, civil conflicts, non-civil conflicts, and within-
ethnicity conflicts. As reported, we observe that for all conflict measures, conflict is significantly
higher within segmentary lineage societies.
19This is not to say that there is not some inevitable controversy in the literature on the classification of differentsocieties. Sahlins (1961), for example, argues that the Dinka are not a segmentary lineage society. In our dataset theyare because as in the relevant volume of the ethnographic survey of Africa, Butt (1952, p. 121) writes “There appearsto be a co-ordination of territorial and kinship units which suggests the type of segmentary organization typical of theneighboring Nuer tribes.” She cites earlier work by Stubbs as saying, “Each lineage is controlled by its lineage headsand elders and it seems that within a wut [village settlement] the members of a lineage build their homesteads neareach other and herd their cattle in common.” This meshes with the definition we are working with. De Wolf, 1990
(referencing in part Kelly, 1985) writes that the “larger size of [Nuer] minimal segments" is the primary difference insocial structure between the Nuer and Dinka.” Sahlins seems to have been working toward a narrower definition ofsegmentary lineage than is standard and against the contributors to the Tribes Without Rulers project (Middleton andTait, 1958) who argued that there could be some variation in groups that could be considered to have a segmentarylineage organization. In Tribes without Rulers, the Dinka are listed as a segmentary lineage society (Middleton and Tait,1958, p. 14).
23
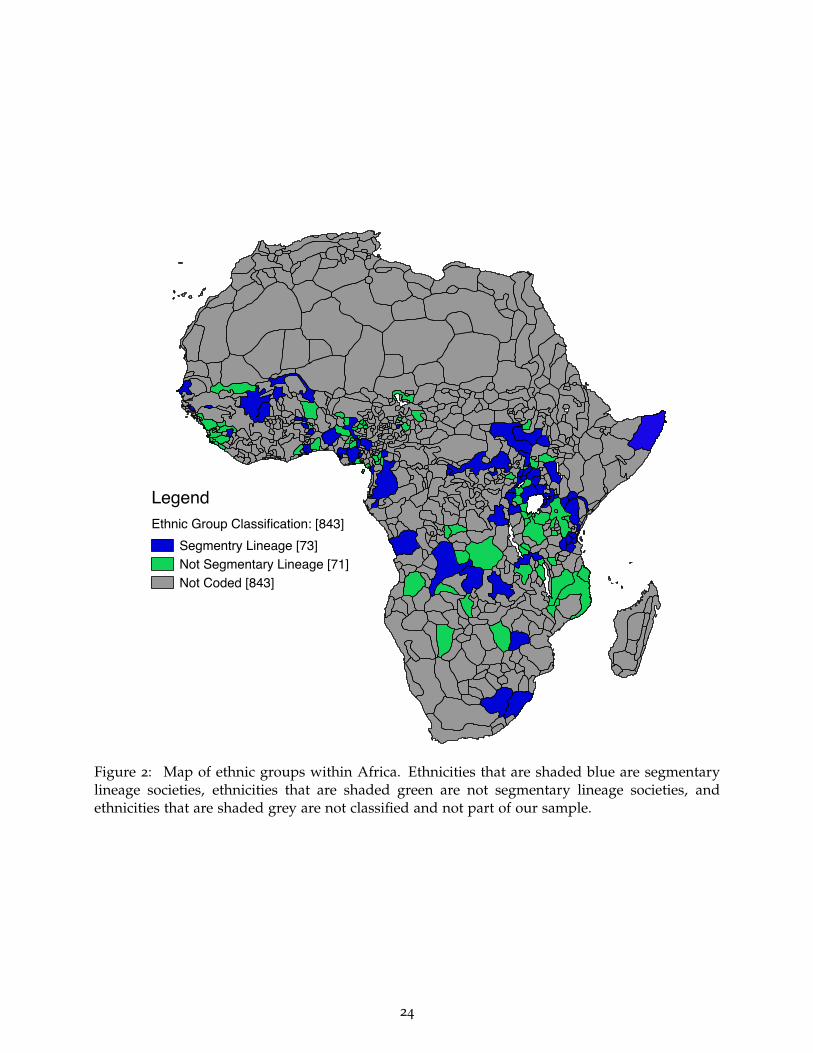
Figure 2: Map of ethnic groups within Africa. Ethnicities that are shaded blue are segmentarylineage societies, ethnicities that are shaded green are not segmentary lineage societies, andethnicities that are shaded grey are not classified and not part of our sample.
24
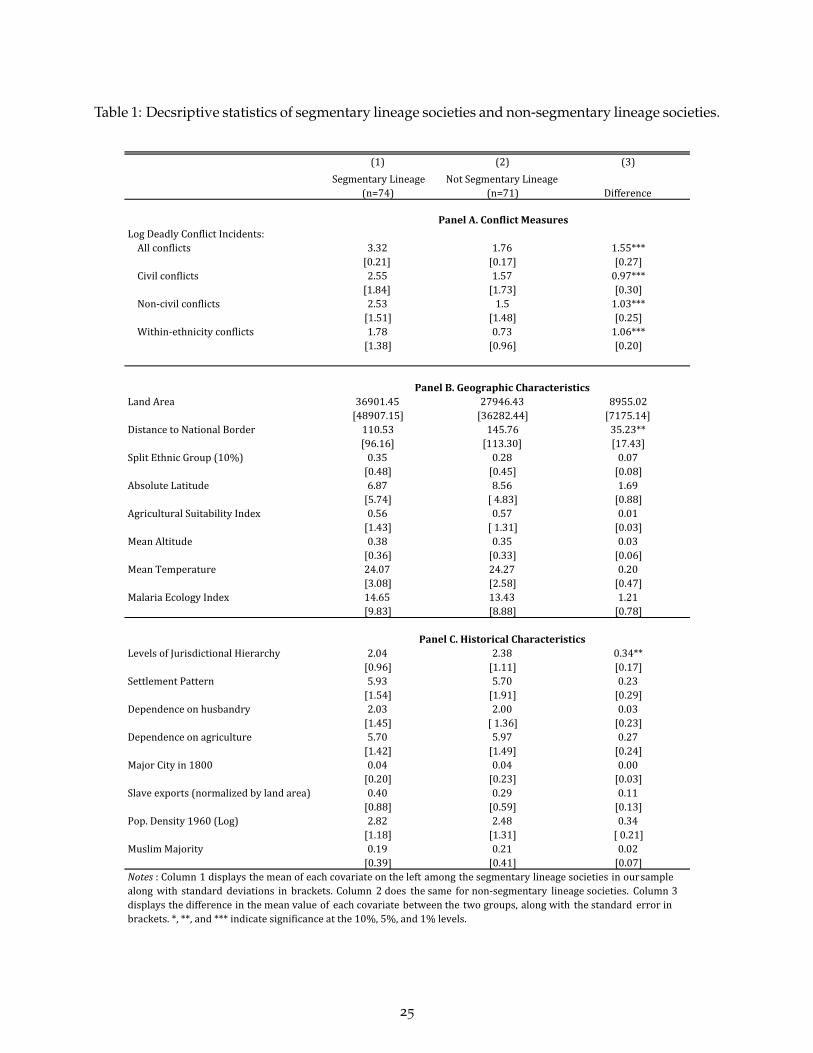
Table 1: Decsriptive statistics of segmentary lineage societies and non-segmentary lineage societies.
(1) (2) (3)SegmentaryLineage
(n=74)NotSegmentaryLineage
(n=71) Difference
PanelA.ConflictMeasuresLogDeadlyConflictIncidents:Allconflicts 3.32 1.76 1.55***
[0.21] [0.17] [0.27]Civilconflicts 2.55 1.57 0.97***
[1.84] [1.73] [0.30]Non-civilconflicts 2.53 1.5 1.03***
[1.51] [1.48] [0.25]Within-ethnicityconflicts 1.78 0.73 1.06***
[1.38] [0.96] [0.20]
PanelB.GeographicCharacteristicsLandArea 36901.45 27946.43 8955.02
[48907.15] [36282.44] [7175.14]DistancetoNationalBorder 110.53 145.76 35.23**
[96.16] [113.30] [17.43]SplitEthnicGroup(10%) 0.35 0.28 0.07
[0.48] [0.45] [0.08]AbsoluteLatitude 6.87 8.56 1.69
[5.74] [4.83] [0.88]AgriculturalSuitabilityIndex 0.56 0.57 0.01
[1.43] [1.31] [0.03]MeanAltitude 0.38 0.35 0.03
[0.36] [0.33] [0.06]MeanTemperature 24.07 24.27 0.20
[3.08] [2.58] [0.47]MalariaEcologyIndex 14.65 13.43 1.21
[9.83] [8.88] [0.78]
PanelC.HistoricalCharacteristicsLevelsofJurisdictionalHierarchy 2.04 2.38 0.34**
[0.96] [1.11] [0.17]SettlementPattern 5.93 5.70 0.23
[1.54] [1.91] [0.29]Dependenceonhusbandry 2.03 2.00 0.03
[1.45] [1.36] [0.23]Dependenceonagriculture 5.70 5.97 0.27
[1.42] [1.49] [0.24]MajorCityin1800 0.04 0.04 0.00
[0.20] [0.23] [0.03]Slaveexports(normalizedbylandarea) 0.40 0.29 0.11
[0.88] [0.59] [0.13]Pop.Density1960(Log) 2.82 2.48 0.34
[1.18] [1.31] [0.21]MuslimMajority 0.19 0.21 0.02
[0.39] [0.41] [0.07]Notes : Column 1 displays the mean of each covariate on the left among the segmentary lineage societies in oursamplealong with standard deviations in brackets. Column 2 does the same for non-segmentary lineage societies. Column 3displays the difference in the mean value of each covariate between the two groups, along with the standard error inbrackets.*,**,and***indicatesignificanceatthe10%,5%,and1%levels.
25
Panel B reports descriptive statistics but for eight geographic measures. The measures include
land area of the ethnic group, distance from the ethnic group’s centroid to the nearest national
border, an indicator variable that equals one if an ethnic groups is split by a national border,
distance from the equator, average altitude, average temperature, and average malaria ecology
index. As can be seen, the differences are not statistically different from zero in all cases but one.
Panel C reports balance statistics using eight historical measures. These include: the number
of levels of jurisdictional hierarchy beyond the local community, fixed effects measuring the
historical complexity of settlement, measures of pre-industrial dependence of an ethnic group
on animal husbandry and agriculture, the presence of a major city in 1800, the log number of
slave taken per land area, the natural log of population density in 1960, and an indicator that
equals one if, in the contemporary period, the majority of the ethnic group is Muslim. Again, in
all cases but one, the differences between the two groups are not statistically different from zero.
The one measure that is statistically different for segmentary lineage societies is levels of juris-
dictional hierarchy beyond the local community, which is a particularly important characteristic
given existing evidence that this is associated with better development outcomes today (Gennaioli
and Rainer, 2007, Michalopoulos and Papaioannou, 2013). Since it is plausible that stateless
societies might experience more conflict than ones with a state, it may be that any finding that
being a segmentary lineage society is associated with greater conflict intensity is due to the fact
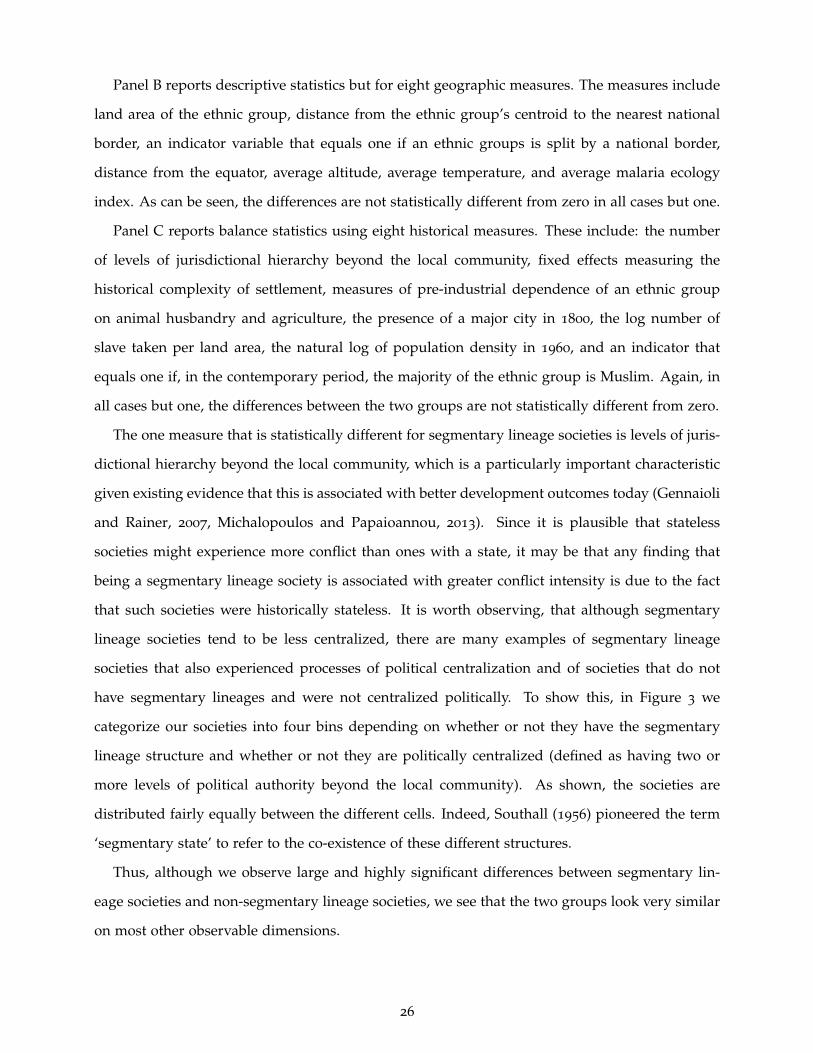
that such societies were historically stateless. It is worth observing, that although segmentary
lineage societies tend to be less centralized, there are many examples of segmentary lineage
societies that also experienced processes of political centralization and of societies that do not
have segmentary lineages and were not centralized politically. To show this, in Figure 3 we
categorize our societies into four bins depending on whether or not they have the segmentary
lineage structure and whether or not they are politically centralized (defined as having two or
more levels of political authority beyond the local community). As shown, the societies are
distributed fairly equally between the different cells. Indeed, Southall (1956) pioneered the term
‘segmentary state’ to refer to the co-existence of these different structures.
Thus, although we observe large and highly significant differences between segmentary lin-
eage societies and non-segmentary lineage societies, we see that the two groups look very similar
on most other observable dimensions.
26
Figure 3: Matrix showing the number of segmentary lineage and non-segmentary lineagesocieties that are considered stateless or having a state by the Ethnographic Atlas. Stateless isdefined by having a jurisdictional hierarchy measure of 0 or 1, while having a state is defined ashaving a jurisdictional hierarchy measure of 2, 3, or 4.
4. OLS Estimates
We now turn to our estimating equations. We first present the relationship between our segmen-
tary lineage indicator variable and several dependent variables that measure the extent of conflict
in a given ethnic homeland. We begin by presenting our baseline OLS estimating equation:
yi = α+ βISLi + X′iΓ + εi (1)
where yi is a measure of conflict intensity among ethnic group i, ISLi is an indicator variable that
equals one if ethnic group i has a segmentary lineage organization and zero if it does not. The
coefficient of interest is β, which we expect to be positive. Segmentary lineage societies are more
likely to participate in conflicts. X is a vector of historical and geographic covariates. The set of
geographic controls includes: the natural log of the land area occupied by the ethnic group, the
natural log of the minimum distance between the ethnic group centroid and a national border, an
indicator variable that equals one if the ethnic group is cut by a national border, average altitude,
the absolute value of latitude, longitude, and the average agricultural suitability. The historical
controls include: pre-industrial political centralization (levels of political authority beyond the
local community) and pre-industrial economic development measured by the complexity of
settlement patterns which is a 1–8 integer measure.20
Estimates of (1) are reported in Table 2. The table reports estimates using a number of different
measures of conflict taken from the ACLED database. Each panel reports estimates of a different
20The finer details of the construction and measurement of these covariates is provided in the paper’s appendix.
27

type of conflict, either all conflicts, civil conflicts, non-civil conflicts, or within ethnic group
conflicts. The intensity of each conflict is measured in three different ways, either using the
log number of conflict events (columns 1–3), the log number of conflict deaths (column 4–6), or
the log number of months of conflict (columns 7–9).
For each outcome of interest, we report three specifications, each with a different set of
covariates. The first specification, reported in columns 1, 4 and 7, is the most parsimonious
and only includes country fixed effects. In the second specification (columns 2, 5, and 8), we also
control for our set of geographical covariates, The final specification (columns 3, 6 and 9) also
includes the above mentioned historical covariates.
We find that regardless of which measure of conflict we use, or which specification, we estimate
a positive and significant relationship between the presence of segmentary lineage organization
and conflict. The magnitudes of the estimated effects are large. For example, according to the
estimates for number of conflict events (columns 1–3), a segmentary lineage society has between
80–110% more conflict events than a society that does not have a segmentary lineage organization.
Interestingly, the magnitude of the effects are fairly similar across the different conflict types.
Thus, segmentary lineage organization appears to have similar effects on all forms of conflict.
In Figure 4 we report the partial correlation plots for the specification that examines total
conflict incidents and includes country fixed effects, the geographic controls, and the historical
controls (column 3). For each of our conflict types, we find a strong positive relationship between
the presence of a segmentary lineage society and conflict. The relationships appear general and to
not be driven by a small number of influential observations. Interestingly, consistent with priors,
the strength of the relationships appear to be greater for more localized conflicts. The fit appears
tightest for localized within-group conflicts, and the relationship for civil conflicts appear to be
less strong than for non-civil conflicts.
A noteworthy group in the figures is the the Lele, in Kasai province of the Democratic Republic
of the Congo. They are a society based on age sets, not lineage (Douglas, 1963) and this has
been an area of the country with little conflict. Also noteworthy are the Bemba and Toro, two
societies singled out by anthropologists, as we discussed above, as not having segmentary lineage
structures, and who also have experienced relatively little conflict. On the other hand, noticeable
towards the upper right of the figure are such societies as the Kissi, in Sierra Leone, a segmentary
lineage society (see Middleton and Tait, 1958, Massing, 1980) whose territory experienced a
28
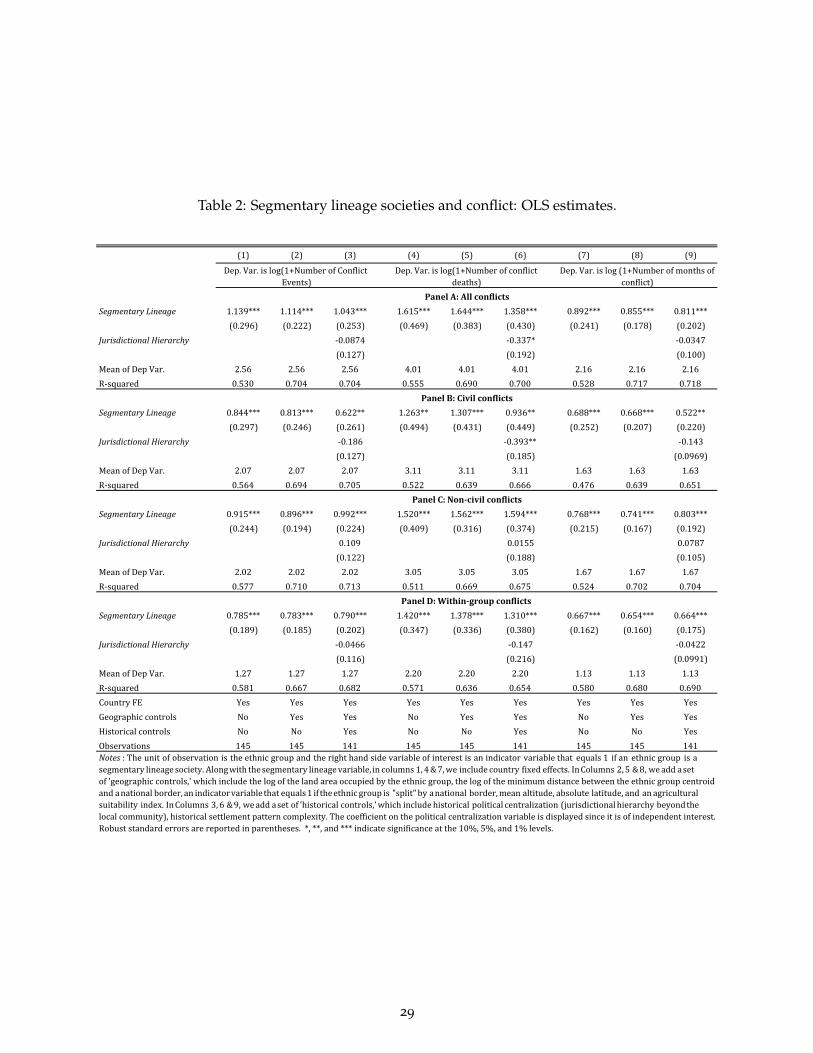
Table 2: Segmentary lineage societies and conflict: OLS estimates.
(1) (2) (3) (4) (5) (6) (7) (8) (9)
PanelA:AllconflictsSegmentaryLineage 1.139*** 1.114*** 1.043*** 1.615*** 1.644*** 1.358*** 0.892*** 0.855*** 0.811***
(0.296) (0.222) (0.253) (0.469) (0.383) (0.430) (0.241) (0.178) (0.202)JurisdictionalHierarchy -0.0874 -0.337* -0.0347
(0.127) (0.192) (0.100)MeanofDepVar. 2.56 2.56 2.56 4.01 4.01 4.01 2.16 2.16 2.16R-squared 0.530 0.704 0.704 0.555 0.690 0.700 0.528 0.717 0.718
PanelB:CivilconflictsSegmentaryLineage 0.844*** 0.813*** 0.622** 1.263** 1.307*** 0.936** 0.688*** 0.668*** 0.522**
(0.297) (0.246) (0.261) (0.494) (0.431) (0.449) (0.252) (0.207) (0.220)JurisdictionalHierarchy -0.186 -0.393** -0.143
(0.127) (0.185) (0.0969)MeanofDepVar. 2.07 2.07 2.07 3.11 3.11 3.11 1.63 1.63 1.63R-squared 0.564 0.694 0.705 0.522 0.639 0.666 0.476 0.639 0.651
PanelC:Non-civilconflictsSegmentaryLineage 0.915*** 0.896*** 0.992*** 1.520*** 1.562*** 1.594*** 0.768*** 0.741*** 0.803***
(0.244) (0.194) (0.224) (0.409) (0.316) (0.374) (0.215) (0.167) (0.192)JurisdictionalHierarchy 0.109 0.0155 0.0787
(0.122) (0.188) (0.105)MeanofDepVar. 2.02 2.02 2.02 3.05 3.05 3.05 1.67 1.67 1.67R-squared 0.577 0.710 0.713 0.511 0.669 0.675 0.524 0.702 0.704
PanelD:Within-groupconflictsSegmentaryLineage 0.785*** 0.783*** 0.790*** 1.420*** 1.378*** 1.310*** 0.667*** 0.654*** 0.664***
(0.189) (0.185) (0.202) (0.347) (0.336) (0.380) (0.162) (0.160) (0.175)JurisdictionalHierarchy -0.0466 -0.147 -0.0422
(0.116) (0.216) (0.0991)MeanofDepVar. 1.27 1.27 1.27 2.20 2.20 2.20 1.13 1.13 1.13R-squared 0.581 0.667 0.682 0.571 0.636 0.654 0.580 0.680 0.690CountryFE Yes Yes Yes Yes Yes Yes Yes Yes YesGeographiccontrols No Yes Yes No Yes Yes No Yes YesHistoricalcontrols No No Yes No No Yes No No YesObservations 145 145 141 145 145 141 145 145 141
Dep.Var.islog(1+NumberofConflictEvents)
Dep.Var.islog(1+Numberofconflictdeaths)
Dep.Var.islog(1+Numberofmonthsofconflict)
Notes : The unit of observation is the ethnic group and the right hand side variable of interest is an indicator variable that equals 1 if an ethnic group is asegmentary lineagesociety. Alongwith thesegmentary lineagevariable, in columns 1, 4&7,we include country fixed effects. InColumns 2, 5 &8, weadd asetof'geographiccontrols,'whichincludethelogofthelandareaoccupiedbytheethnicgroup,thelogoftheminimumdistancebetweentheethnicgroupcentroidand anational border, an indicatorvariable that equals1 if theethnic group is "split" by anational border,mean altitude, absolute latitude, and an agriculturalsuitability index. InColumns 3, 6 &9, weadd aset of 'historical controls,'which includehistorical political centralization (jurisdictional hierarchy beyondthelocalcommunity),historicalsettlementpatterncomplexity.Thecoefficientonthepoliticalcentralizationvariableisdisplayedsinceitisofindependentinterest.Robuststandarderrorsarereportedinparentheses.*,**,and***indicatesignificanceatthe10%,5%,and1%levels.
29
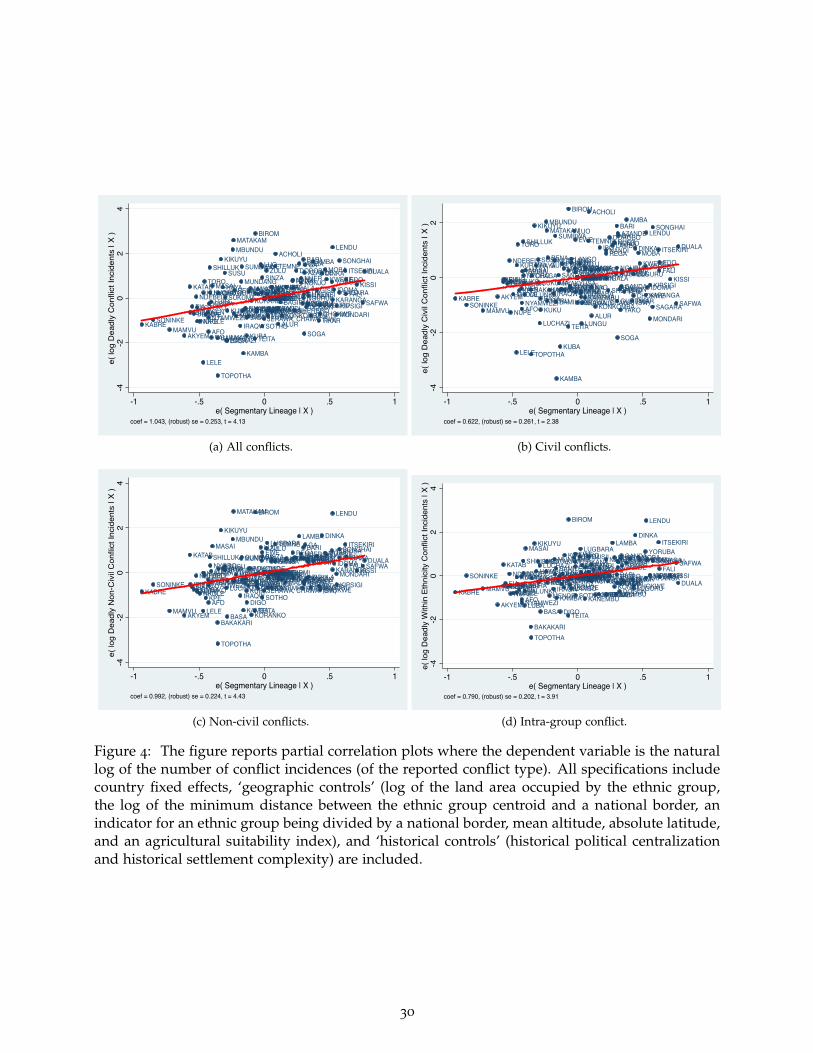
KABRESONINKEMAMVU
AKYEM
KATAB
IBIBIOFIABEMBA
NDEBELELOTUKO
NUPENKOLE
LELE
KURAMA, GURE (NE)TORO
KPENEN
AFO
NYAMWEZI
IGBIRA
SHILLUK
NYOROLUBA
YALUNKA
MASAI
BAKAKARI
TOPOTHA
CHAGA
KIKUYU
HAYA
SUSU
SUKUMA
LUCHAZIBASA
KUKU
MBUNDUMATAKAM
MERU
BENA
MENDEIRAQW
MUNDANG
SUMBWA
BAMILEKE
KAMBA
SANDAWENYAKYUSA
KUBA
DIGOFIPA
POKOMOMAKONDEKORANKO
TEITA
BAMBARA
BIROM
TENDAPIMBWETUMBUKA
LOZILANGO
LUO
TURKANA
EWESINZA
SOTHOJERAWA, CHAWAI (SW)
BUBIGURMAKUNGBALANTEFANGFONMIJERTEINNGWATOVAIANUAKRUANDA
ZULU
LUGBARA
MUMMINIANKALUNGUNGBANDI
NYANJA
KANEMBU
WOLOF
TEMNE
GUSII
ACHOLI
KONGO
YAO
ALUR
BAGIRMI
KONKOMBA
MADIIBO
REGANANDIIGALA
SHERBRO
DOROBOLAMBA
NUERKONJO
NDEMBU
BARI
NGURUGURENSI
SOGA
AZANDEGA
DOGONYAKOTIV
GANDAGBARIZIGULATEM
AMBA
GISU
TIKARCHOKWELUGURU
DINKAMOBAKWEREYORUBA
KARANGA
LENDU
IDOMA
MONDARIKIPSIGI
SAGARA
SONGHAIITSEKIRI
FALI
EDOKISSI
SAFWA
DUALA
-4-2
02
4e(
log
Dea
dly
Con
flict
Inci
dent
s | X
)
-1 -.5 0 .5 1e( Segmentary Lineage | X )
coef = 1.043, (robust) se = 0.253, t = 4.13
(a) All conflicts.
KABRESONINKE
MAMVU
AKYEM
KATABIBIBIOFIABEMBA
NDEBELE
LOTUKO
NUPE
NKOLE
LELE
KURAMA, GURE (NE)
TORO
KPENEN
AFONYAMWEZI
IGBIRA
SHILLUK
NYOROLUBAYALUNKA
MASAI
BAKAKARI
TOPOTHA
CHAGA
KIKUYU
HAYASUSU
SUKUMA
LUCHAZI
BASAKUKU
MBUNDUMATAKAM
MERU
BENA
MENDEIRAQW
MUNDANG
SUMBWA
BAMILEKE
KAMBA
SANDAWENYAKYUSA
KUBA
DIGOFIPA
POKOMOMAKONDE
KORANKO
TEITA
BAMBARA
BIROM
TENDAPIMBWETUMBUKA
LOZILANGO
LUO
TURKANA
EWE
SINZA
SOTHOJERAWA, CHAWAI (SW)
BUBIGURMAKUNGBALANTEFANGFONMIJERTEINNGWATOVAIANUAKRUANDA
ZULU
LUGBARAMUMMINIANKA
LUNGU
NGBANDI
NYANJA
KANEMBU
WOLOF
TEMNE
GUSII
ACHOLI
KONGO
YAO
ALUR
BAGIRMI
KONKOMBA
MADI
IBOREGANANDI
IGALASHERBRO
DOROBOLAMBANUERKONJO
NDEMBU
BARI
NGURU
GURENSI
SOGA
AZANDEGA
DOGON
YAKO
TIVGANDA
GBARIZIGULA
TEM
AMBA
GISU
TIKARCHOKWE
LUGURU
DINKAMOBAKWEREYORUBA
KARANGA
LENDU
IDOMA
MONDARI
KIPSIGI
SAGARA
SONGHAI
ITSEKIRI
FALIEDO
KISSI
SAFWA
DUALA
-4-2
02
e( lo
g D
eadl
y C
ivil
Con
flict
Inci
dent
s | X
)
-1 -.5 0 .5 1e( Segmentary Lineage | X )
coef = 0.622, (robust) se = 0.261, t = 2.38
(b) Civil conflicts.
KABRESONINKE
MAMVUAKYEM
KATAB
IBIBIOFIABEMBA
NDEBELE
LOTUKONUPENKOLE
LELE
KURAMA, GURE (NE)TORO
KPE
NEN
AFO
NYAMWEZIIGBIRA
SHILLUKNYOROLUBAYALUNKA
MASAI
BAKAKARI
TOPOTHA
CHAGA
KIKUYU
HAYASUSUSUKUMA
LUCHAZI
BASA
KUKU
MBUNDU
MATAKAM
MERUBENAMENDE
IRAQW
MUNDANGSUMBWA
BAMILEKE
KAMBA
SANDAWENYAKYUSAKUBADIGO
FIPA
POKOMOMAKONDE
KORANKOTEITA
BAMBARA
BIROM
TENDAPIMBWETUMBUKALOZI
LANGO
LUO
TURKANAEWESINZA
SOTHOJERAWA, CHAWAI (SW)
BUBIGURMAKUNGBALANTEFANGFONMIJERTEINNGWATOVAIANUAKRUANDA
ZULULUGBARA
MUMMINIANKALUNGUNGBANDI
NYANJA
KANEMBU
WOLOF
TEMNE
GUSII
ACHOLIKONGOYAOALURBAGIRMIKONKOMBAMADI
IBOREGANANDI
IGALA
SHERBRODOROBO
LAMBA
NUERKONJO
NDEMBU
BARI
NGURU
GURENSI
SOGAAZANDE
GA
DOGONYAKO
TIVGANDAGBARI
ZIGULATEM
AMBAGISU
TIKARCHOKWELUGURU
DINKA
MOBAKWEREYORUBA
KARANGA
LENDU
IDOMAMONDARIKIPSIGI
SAGARASONGHAIITSEKIRI
FALIEDO
KISSISAFWADUALA
-4-2
02
4e(
log
Dea
dly
Non
-Civ
il C
onfli
ct In
cide
nts
| X )
-1 -.5 0 .5 1e( Segmentary Lineage | X )
coef = 0.992, (robust) se = 0.224, t = 4.43
(c) Non-civil conflicts.
KABRE
SONINKE
MAMVU
AKYEM
KATAB
IBIBIOFIABEMBA
NDEBELE
LOTUKONUPENKOLELELE
KURAMA, GURE (NE)TOROKPE
NEN
AFONYAMWEZI
IGBIRA
SHILLUK
NYORO
LUBA
YALUNKA
MASAI
BAKAKARITOPOTHA
CHAGA
KIKUYU
HAYASUSU
SUKUMA
LUCHAZI
BASA
KUKUMBUNDUMATAKAM
MERUBENA
MENDEIRAQW
MUNDANG
SUMBWABAMILEKE
KAMBA
SANDAWENYAKYUSAKUBA
DIGO
FIPAPOKOMO
MAKONDE
KORANKO
TEITA
BAMBARA
BIROM
TENDAPIMBWETUMBUKALOZILANGO
LUOTURKANAEWE
SINZA
SOTHO
JERAWA, CHAWAI (SW)BUBIGURMAKUNGBALANTEFANGFONMIJERTEINNGWATOVAIANUAKRUANDA
ZULULUGBARA
MUMMINIANKALUNGU
NGBANDINYANJA
KANEMBU
WOLOFTEMNE
GUSII
ACHOLIKONGO
YAOALURBAGIRMI
KONKOMBAMADI
IBO
REGA
NANDI
IGALA
SHERBRODOROBO
LAMBA
NUER
KONJONDEMBU
BARINGURU
GURENSI
SOGA
AZANDEGA
DOGONYAKO
TIVGANDAGBARI
ZIGULATEM
AMBAGISU
TIKARCHOKWELUGURU
DINKA
MOBAKWEREYORUBA
KARANGA
LENDU
IDOMA
MONDARIKIPSIGI
SAGARASONGHAI
ITSEKIRI
FALIEDOKISSI
SAFWA
DUALA
-4-2
02
4e(
log
Dea
dly
With
in E
thni
city
Con
flict
Inci
dent
s | X
)
-1 -.5 0 .5 1e( Segmentary Lineage | X )
coef = 0.790, (robust) se = 0.202, t = 3.91
(d) Intra-group conflict.
Figure 4: The figure reports partial correlation plots where the dependent variable is the naturallog of the number of conflict incidences (of the reported conflict type). All specifications includecountry fixed effects, ‘geographic controls’ (log of the land area occupied by the ethnic group,the log of the minimum distance between the ethnic group centroid and a national border, anindicator for an ethnic group being divided by a national border, mean altitude, absolute latitude,and an agricultural suitability index), and ‘historical controls’ (historical political centralizationand historical settlement complexity) are included.
30
great deal of conflict during the Sierra Leone civil war. We also see there the Songhai from
the Democratic Republic of the Congo, a segmentary lineage society studied by Rouch (1954).
Also noticeable are the Douala, a society in the Cameroon commonly identified as being of the
segmentary lineage form (e.g., Ardener, 1956, Terretta, 2013).
All of the variables from Table 2 are count variables of some form, either of the number of
deaths, incidents, or years of conflict. Given this, we check that our estimates are robust to
estimation methods other than OLS, namely Poisson or a negative binomial regression model.
Table 3 reports estimates using both models for the most stringent specification that includes
country fixed effects, geographic controls, and the historical controls. As reported, our findings
are robust to the use of alternative estimators. In every specification in Table 3, the coefficient on
the segmentary lineage indicator is positive, and in all specifications but one highly significant.
We next turn to the question of channels and the sensitivity of our estimates to accounting for a
set of covariates measured contemporaneously to conflict. To motivate our chosen covariates, we
return to the example of the Nuer, who in addition to being a segmentary lineage society, are very
poor today. The South Sudan today, dominated by the Nuer and Dinka ethnic groups, has a GDP
per-capita of around $2,000. Given this, it is possible that our estimates are picking up, in part, the
relationship between poverty and conflict, along the lines suggested by Fearon and Laitin (2003).
This would occur if segmentary lineage societies have lower incomes today, either due to a causal
effect or due to omitted factors. Thus, in our analysis, we account for two measures of economic
prosperity. One is a measure of night light intensity normalized by population, measured in 2000
(Henderson, Storeygard and Weil, 2012, Michalopoulos and Papaioannou, 2013). The second is
population density (in 2000), which is a Malthusian measure of prosperity.
In many segmentary lineage societies involved in conflict, whether in the Horn of Africa, the
Sahel or the Arabian peninsular, the dominant religion is Islam. It is clear in many of these
cases that Islam is used as a tool of mobilization and has ideological force, so it is possible
that our estimates are also influenced by the fact that many such societies practice Islam, which
provides powerful ideological tools, such as the notion of Jihad, which facilitates mobilization
for conflict. To account for this possibility, we use data from the World Religion Database, which
records religious affiliation for different ethnicities in Africa, to construct an indicator variable
that equals one if Islam is the dominant religion of the ethnic group.
To better understand whether part of the reduced-form effects of segmentary lineage systems
31
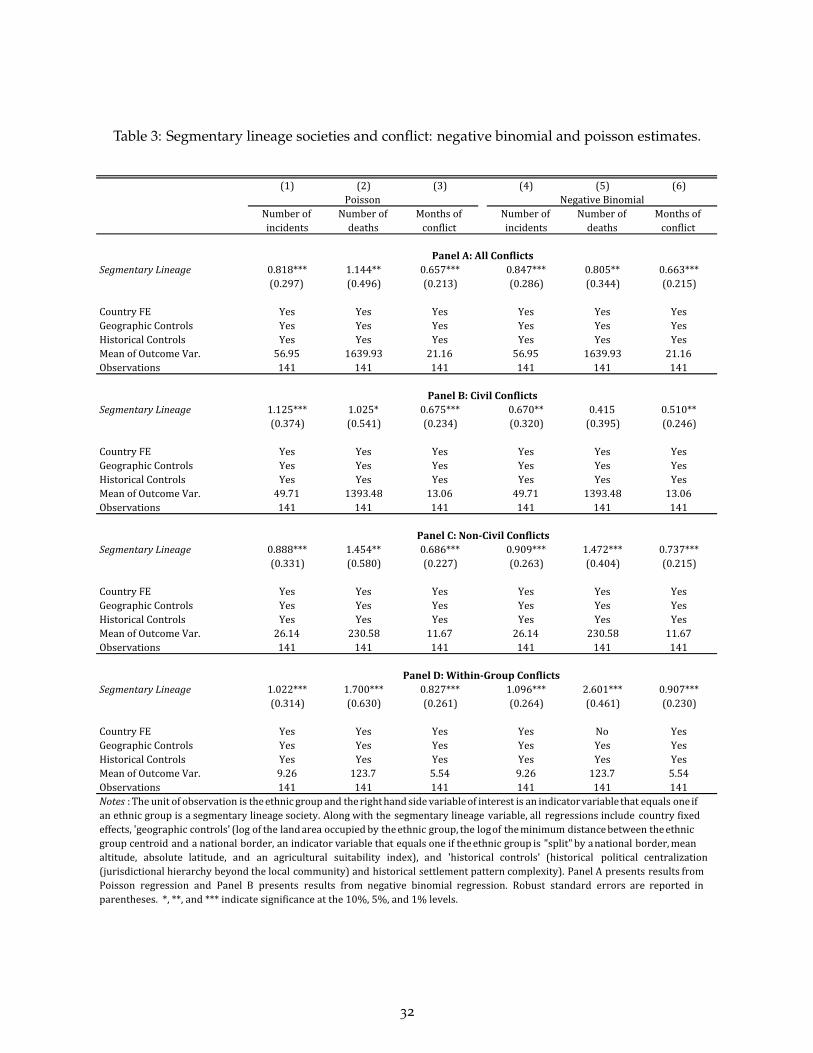
Table 3: Segmentary lineage societies and conflict: negative binomial and poisson estimates.
(1) (2) (3) (4) (5) (6)
Numberofincidents
Numberofdeaths
Monthsofconflict
Numberofincidents
Numberofdeaths
Monthsofconflict
PanelA:AllConflictsSegmentaryLineage 0.818*** 1.144** 0.657*** 0.847*** 0.805** 0.663***
(0.297) (0.496) (0.213) (0.286) (0.344) (0.215)
CountryFE Yes Yes Yes Yes Yes YesGeographicControls Yes Yes Yes Yes Yes YesHistoricalControls Yes Yes Yes Yes Yes YesMeanofOutcomeVar. 56.95 1639.93 21.16 56.95 1639.93 21.16Observations 141 141 141 141 141 141
PanelB:CivilConflictsSegmentaryLineage 1.125*** 1.025* 0.675*** 0.670** 0.415 0.510**
(0.374) (0.541) (0.234) (0.320) (0.395) (0.246)
CountryFE Yes Yes Yes Yes Yes YesGeographicControls Yes Yes Yes Yes Yes YesHistoricalControls Yes Yes Yes Yes Yes YesMeanofOutcomeVar. 49.71 1393.48 13.06 49.71 1393.48 13.06Observations 141 141 141 141 141 141
PanelC:Non-CivilConflictsSegmentaryLineage 0.888*** 1.454** 0.686*** 0.909*** 1.472*** 0.737***
(0.331) (0.580) (0.227) (0.263) (0.404) (0.215)
CountryFE Yes Yes Yes Yes Yes YesGeographicControls Yes Yes Yes Yes Yes YesHistoricalControls Yes Yes Yes Yes Yes YesMeanofOutcomeVar. 26.14 230.58 11.67 26.14 230.58 11.67Observations 141 141 141 141 141 141
PanelD:Within-GroupConflictsSegmentaryLineage 1.022*** 1.700*** 0.827*** 1.096*** 2.601*** 0.907***
(0.314) (0.630) (0.261) (0.264) (0.461) (0.230)
CountryFE Yes Yes Yes Yes No YesGeographicControls Yes Yes Yes Yes Yes YesHistoricalControls Yes Yes Yes Yes Yes YesMeanofOutcomeVar. 9.26 123.7 5.54 9.26 123.7 5.54Observations 141 141 141 141 141 141Notes : The unit of observation is theethnic groupand therighthand side variableof interest is an indicatorvariable that equals one ifan ethnic group is a segmentary lineage society. Along with the segmentary lineage variable, all regressions include country fixedeffects, 'geographic controls' (log of the landarea occupied by theethnic group, the logof theminimum distancebetween theethnicgroup centroid and a national border, an indicator variable that equals one if theethnic group is "split" by anational border,meanaltitude, absolute latitude, and an agricultural suitability index), and 'historical controls' (historical political centralization(jurisdictional hierarchy beyond the local community) and historical settlement pattern complexity). Panel A presents results fromPoisson regression and Panel B presents results from negative binomial regression. Robust standard errors are reported inparentheses.*,**,and***indicatesignificanceatthe10%,5%,and1%levels.
Poisson NegativeBinomial
32
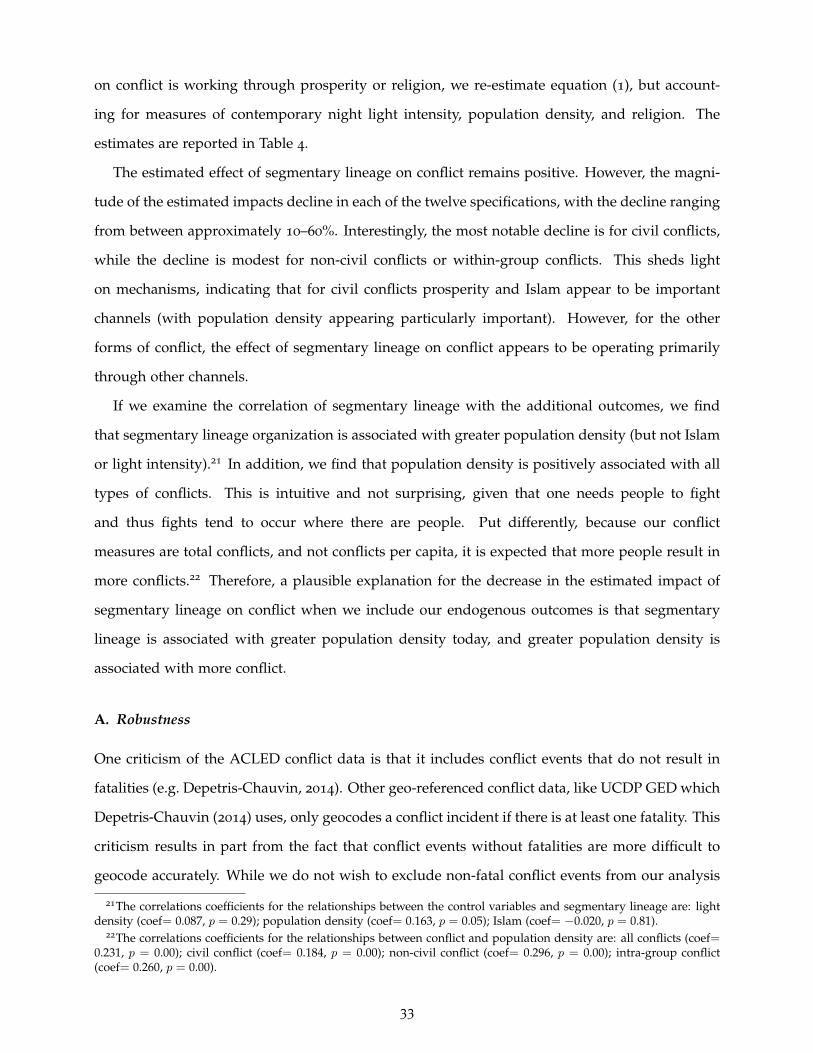
on conflict is working through prosperity or religion, we re-estimate equation (1), but account-
ing for measures of contemporary night light intensity, population density, and religion. The
estimates are reported in Table 4.
The estimated effect of segmentary lineage on conflict remains positive. However, the magni-
tude of the estimated impacts decline in each of the twelve specifications, with the decline ranging
from between approximately 10–60%. Interestingly, the most notable decline is for civil conflicts,
while the decline is modest for non-civil conflicts or within-group conflicts. This sheds light
on mechanisms, indicating that for civil conflicts prosperity and Islam appear to be important
channels (with population density appearing particularly important). However, for the other
forms of conflict, the effect of segmentary lineage on conflict appears to be operating primarily
through other channels.
If we examine the correlation of segmentary lineage with the additional outcomes, we find
that segmentary lineage organization is associated with greater population density (but not Islam
or light intensity).21 In addition, we find that population density is positively associated with all
types of conflicts. This is intuitive and not surprising, given that one needs people to fight
and thus fights tend to occur where there are people. Put differently, because our conflict
measures are total conflicts, and not conflicts per capita, it is expected that more people result in
more conflicts.22 Therefore, a plausible explanation for the decrease in the estimated impact of
segmentary lineage on conflict when we include our endogenous outcomes is that segmentary
lineage is associated with greater population density today, and greater population density is
associated with more conflict.
A. Robustness
One criticism of the ACLED conflict data is that it includes conflict events that do not result in
fatalities (e.g. Depetris-Chauvin, 2014). Other geo-referenced conflict data, like UCDP GED which
Depetris-Chauvin (2014) uses, only geocodes a conflict incident if there is at least one fatality. This
criticism results in part from the fact that conflict events without fatalities are more difficult to
geocode accurately. While we do not wish to exclude non-fatal conflict events from our analysis
21The correlations coefficients for the relationships between the control variables and segmentary lineage are: lightdensity (coef= 0.087, p = 0.29); population density (coef= 0.163, p = 0.05); Islam (coef= −0.020, p = 0.81).
22The correlations coefficients for the relationships between conflict and population density are: all conflicts (coef=0.231, p = 0.00); civil conflict (coef= 0.184, p = 0.00); non-civil conflict (coef= 0.296, p = 0.00); intra-group conflict(coef= 0.260, p = 0.00).
33
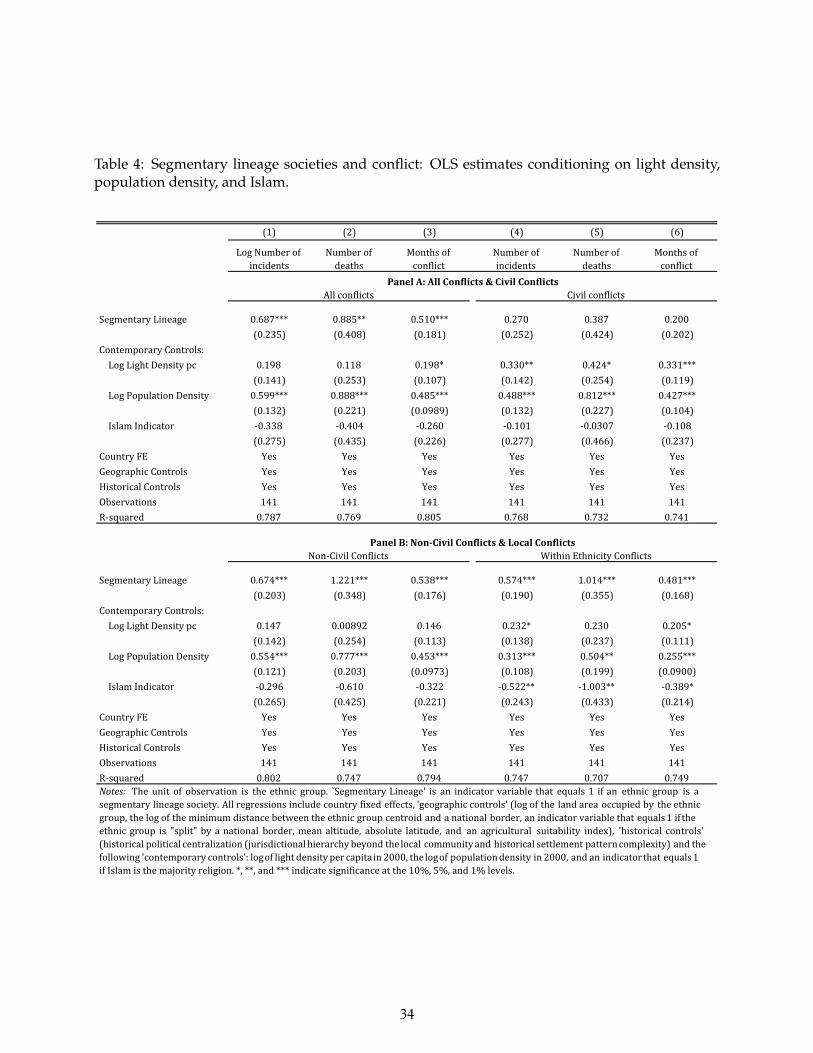
Table 4: Segmentary lineage societies and conflict: OLS estimates conditioning on light density,population density, and Islam.
(1) (2) (3) (4) (5) (6)
LogNumberofincidents
Numberofdeaths
Monthsofconflict
Numberofincidents
Numberofdeaths
Monthsofconflict
PanelA:AllConflicts&CivilConflicts
SegmentaryLineage 0.687*** 0.885** 0.510*** 0.270 0.387 0.200(0.235) (0.408) (0.181) (0.252) (0.424) (0.202)
ContemporaryControls:LogLightDensitypc 0.198 0.118 0.198* 0.330** 0.424* 0.331***
(0.141) (0.253) (0.107) (0.142) (0.254) (0.119)LogPopulationDensity 0.599*** 0.888*** 0.485*** 0.488*** 0.812*** 0.427***
(0.132) (0.221) (0.0989) (0.132) (0.227) (0.104)IslamIndicator -0.338 -0.404 -0.260 -0.101 -0.0307 -0.108
(0.275) (0.435) (0.226) (0.277) (0.466) (0.237)CountryFE Yes Yes Yes Yes Yes YesGeographicControls Yes Yes Yes Yes Yes YesHistoricalControls Yes Yes Yes Yes Yes YesObservations 141 141 141 141 141 141R-squared 0.787 0.769 0.805 0.768 0.732 0.741
PanelB:Non-CivilConflicts&LocalConflicts
SegmentaryLineage 0.674*** 1.221*** 0.538*** 0.574*** 1.014*** 0.481***(0.203) (0.348) (0.176) (0.190) (0.355) (0.168)
ContemporaryControls:LogLightDensitypc 0.147 0.00892 0.146 0.232* 0.230 0.205*
(0.142) (0.254) (0.113) (0.138) (0.237) (0.111)LogPopulationDensity 0.554*** 0.777*** 0.453*** 0.313*** 0.504** 0.255***
(0.121) (0.203) (0.0973) (0.108) (0.199) (0.0900)IslamIndicator -0.296 -0.610 -0.322 -0.522** -1.003** -0.389*
(0.265) (0.425) (0.221) (0.243) (0.433) (0.214)CountryFE Yes Yes Yes Yes Yes YesGeographicControls Yes Yes Yes Yes Yes YesHistoricalControls Yes Yes Yes Yes Yes YesObservations 141 141 141 141 141 141R-squared 0.802 0.747 0.794 0.747 0.707 0.749Notes: The unit of observation is the ethnic group. `Segmentary Lineage' is an indicator variable that equals 1 if an ethnic group is asegmentary lineage society. All regressions include country fixed effects, 'geographic controls' (log of the land area occupied by the ethnicgroup, the log of the minimum distance between the ethnic group centroid and a national border, an indicator variable that equals1 if theethnic group is "split" by a national border, mean altitude, absolute latitude, and an agricultural suitability index), 'historical controls'(historical political centralization (jurisdictional hierarchy beyond the local communityand historical settlement patterncomplexity) and thefollowing 'contemporary controls': logof light density per capita in 2000, the logof populationdensity in 2000, and an indicator that equals1ifIslamisthemajorityreligion.*,**,and***indicatesignificanceatthe10%,5%,and1%levels.
Allconflicts Civilconflicts
Non-CivilConflicts WithinEthnicityConflicts
34
(since, for example, instances of violence against civilians may not result in death but remain
relevant) it is important to establish the robustness of our results to the use of UCDP GED data.
We therefore re-estimate our baseline specifications using the UCDP GED data. Appendix Table
A1 reports the results of this exercise for our outcomes of interest. We find that the estimates
using the UCDP GED data are very similar to the estimates using the ACLED data.
Another potential concern is that our results are being driven by outliers or a small number of
conflicts events with large numbers of fatalities and that last for a long period of time. An example
would be the conflicts initiated by the Lord’s Resistance Army in Uganda, which have primarily
occurred within the territory of segmentary lineage societies like the Acholi. Though this does
not appear to be the case from the partial correlation plots reported in Figure 3, we investigate
this possibility further here. Specifically, we also re-estimate our baseline specification with both
geographic and historical controls, but we remove observations whose value for the dependent
variable falls in the top 5 percent. For the outcome variables related to conflict duration, rather
than remove the top 5 percent we removed observations related to all ethnic groups who engaged
in conflict for all 18 years. The estimates, which we report in Panel A of Table A2 in the Appendix,
show that our estimates are robust to this procedure.
A final concern is that there tends to be more conflict in capital cities because of their high
population densities and because these are natural focal points for any form of coordinated or
group violence. In addition, conflicts that occur in or near capitals may be more likely to be
observed and to enter into our database. Given these potential concerns, we also check the
robustness of our estimates to the omission of ethnic groups that have a national capital city
within their territory. These estimates are reported in Panel B of Table A2. The estimates remain
robust to this procedure.
B. Accounting for Observables
The strong positive correlation between our segmentary lineage indicator variable and various
measures of conflict coincide with our hypothesis that segmentary lineage organization propa-
gates conflict. However, as with any conditional correlation there is concern that omitted factors
may generate biased estimates.
In Tables 2–4, we provided informal evidence of the robustness of our estimates to controlling
for observable characteristics. In columns 1–3 of appendix Table A4, we more formally assess the
35
potential role of unobservables using the methods developed by Altonji, Elder and Taber (2005)
to determine how much greater the influence of unobservable variables compared to observable
variables would have to be in order to explain away the positive relationship between segmentary
lineage societies and conflict. We find that the influence of unobservable characteristics would
generally have to be significantly greater than the influence of observable characteristics to explain
away our findings. Therefore, it appears unlikely that the our results could be explained by
unobserved variation.
As an alternative strategy, we also calculate the minimum possible true value for the coefficient
on our segmentary lineage variable using the methods from Oster (2014). As reported in columns
3–6 of appendix Table A4, we find that all of the coefficients remain positive and economically
significant. Thus, using this method yields the same conclusion as when the method from Altonji
et al. (2005) is used.
5. Accounting for Unobservables: Spatial RD Estimates
Despite the fact that our findings are robust to accounting for observable characteristics, there
remains the concern that there are unobservables that may be biasing our estimates. For example,
if ethnic groups have an unobservable propensity to participate in local conflict, and historically
this affected whether ethnic groups adopted a segmentary lineage form of social organization,
then this unobservable trait will bias our estimates of interest. In this case, we would observe a
relationship between segmentary lineage systems and conflict even if they do not, in fact, have
a causal effect on conflict. These unobservable traits may originate from a range of different
sources, including the natural environment, historical shocks, or purely idiosyncratic or random
reasons, including cultural drift.
Given this possibility, we also undertake an alternative analysis. Since unobservable factors
are, by definition, unobservable, the strategy we undertake is to examine and compare units of
observation that are close spatially. In particular, we will examine locations, that are geographi-
cally close, but one location is inhabited by a segmentary lineage society and the other by society
that does not have a segmentary lineage system. For this analysis, our units of observation are
10km-by-10km grid-cells. The sample consists of all pairs of contiguous ethnic groups where
36
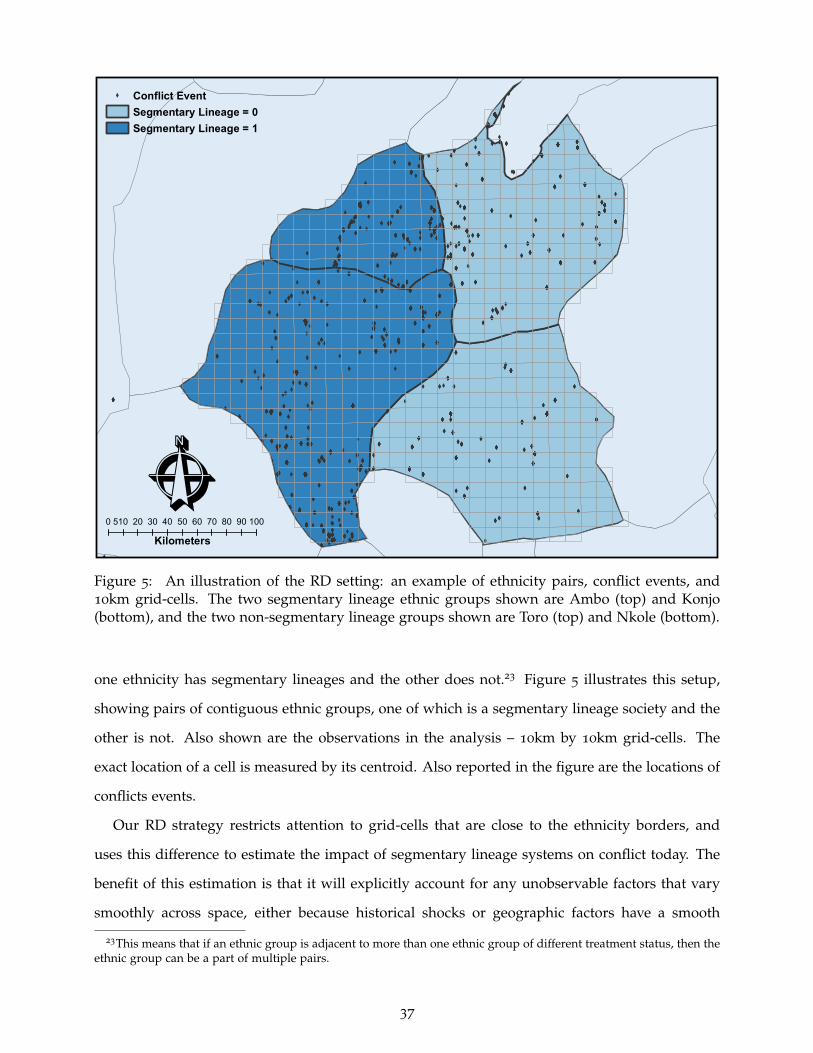
XXXX
XX
X
X
X
X
X
X
X
X
X
X
X
X
X
X
XXX
X
X
X
X
XXXX
X
X
X
X
XX
X
X
XX
X
X
X
XX
XX
X
X
X
X
X
X
X
X
X
XXXX
XX
XX
X
X
X
XXXXXXXXXXXXXXXXXXXXXXXXXXXXXX
X
X
X
X
X
X
X
X
X
XXXX
X
XX
X
X
X
X
X
X
XX
X
X
X
X
XX
X
X
X
X
X
X
X
X
X
X
X
X
XXXXX
X
XXX
X
X
X
X
X
X
X
X
X
X
X
XX
XXXX
XXXXXX
X
X
XX
XXXXX
XXXX
X
X
X
X
X
XXX
X
X
XXXX
X
XXXXX
X
X
XX
X
X
X
X
X
X
X
XXX
X
X
X
X
XXXXXXX
X
X
X
X
XXXXXX
X
X
X
X
X
X
X
XXXXXXXX
XXXXXXXXXXXXXXXXXX
X
X
X
X
XX
X
XX
X
XX
XXXXXXXXXXXXX
X
XX
X
XX
X
XX
X
XXXXXXX
X
X
XXXX
X
X
X
X
X
X
XXXXXX
XXXX
XXXX
XXXX
XX
XXXXXXXXX
XXXXXXXXXXXXXX
XXXXXXXX
XXXX
X
X
X
X
XX
X
X
X
X
XX
XXXX
X
X
X
X
X
XX
X
X
X
X
X
XXXX
XX
X
X
XX
XXX
X
X
X
XX
X
XX
XXX
X
X
X
X
X
XX
X
X
X
X
XX XX
X
X
X
X XX
X
X
XXX
X
X
XX
X
XX
XX
X
X
X
X
X
XXXXXXXXXX
X
XXXX
X
X
X
X
X
X
X
X
X
X
X
X
XX
X
XX
X
XX
X
X
X
X
X
X
X
X
X
X
X
X
X
X
X
X
X
XXX
X
X
X
X
X
XX
X
X
X
X
XX
X
XX
X
X
X
X
X
X
X
X
XX
X
XX
X
X
X
XX
X
X
X
X
X
X
X
XX
XX
XXXXX
X
XX
X
X
X
X
X
X
XX
XX
X
X
X
X
X
XX
X
X
X
X
X
X
X
XX
X
XX
X
X
X
X
X
X
X
X
X
XX
X
X
X
X
X
X
X
XXXXXXXXXX
X
XXXX
X
X
X
X
XXX
XX
X
XXXXXX
X
X
X
XX
XXXX
X
X
XX
X
X
XX
XX
X
XX
XXXXX
X
X
XX
X
XXXX
X
XX
X
XX
X
X
XXX
X
X
XX
X
X
XXXX
X
X
X
X
X
X
X
X
X
X
XX
X
X
X
X
X
X
X
X
X
X
X
X
X
X
X
XXX
X
X
X
X
XXXXXX
X
X
X
X
X
X
X
X
X
X
XXX
X
X
XXX
X
X
XX
XX
X
X
X
X
X
X
X
X
X
XXXXXXXXXXXXXX
X
X
XXX X
X
X
XXXXXXXX
X
X
X
X
X
X
X
X
XXXXX
X
X
X
XXXXXXX
X
XXXXXXX
X
X
X
XX
X
X
X
X
XX
X
X
X
XX
X
X
X
XX
XX
XXXX
XX
XX
X
X
XXXXX
XX
X
XX
X
XXXX
X
XXX
XX
X XX
X
XX
X
X
X
X
X
XXX
X
X
X
X
X
X
X
X
X
X
X
X
X
X
X
X
X
X
X
X
X
X
X
XX
X
XX
X
X
XX
X
X
X
XXX
X
X
X
X
X
X
X
X
X
X
X
X
X
X
X
X
X
X
X
XX
X
X
X
X
X
X
X
XX
XXX
X
XXXX
X
X
XX
X
X
X
X
XX
X
X
XX
X
X
X
X
XX
XXX
X
XX
XX
XX
XX
X
XX
X
XX
X
XX
X
X
X
X
X
XXX
X
X
X
XX
XX
XX
X
X
XX
XX
XXX
X
XX
X
X
X
X
XXXXXX
X
X
X
X
X
XX
X
X
X
X
X
XXXXXX
XX
X
XX
X
X
X
XX
X
X
X
X
XX
X
X
X
X
X X
XX
X
XX
X
XX
X
XXXX
X
X
X
X
XXX
X
X
XX
XX
X
X
X
X
X
X
X
XX
XX
X
X
X
XX
X
X
X
XX
XXX
X
X
X
X
XXX
XX
X
X
XX
X
X
X
X
X
XX
X
X
XXX
X
XXXXX
X
X
X
XX
X
X
X
XXX
XX
X
X
XX
X
XX
X
X
X
X
XX
X
X
X
XX
X
X
X
XX
X
X
X
X
XXX
X
X
X
X
X
X
X
XX
X
X
X
XX
X
X
XX
X
X
X
X
X
X
X
X
XX
XX
XX
X
X
XX
XXX
X
XX
X X
X
X
XXX
X
X
XX
XXX
X
X
XX
X
X
XX
X
X
X
X
X
X
X
X
X
XX
X
X
X
X
X
X
X
X
X
X
X
X
X
X
X
X
X
X
X
X
X
X
X
X
XXX
X
X
X
XX
X
X
X
X
X
X
X
X
X
X
X
X
X
X
X
X
X
XX
X
X
X
X
XXX
X
XX
XXXX
X
XXX
X
X
X
X
X
X
XXXXXXXXXXXX
X
X
XX
XX
X
X
X
X
X
XX
X
X
XXXX
X
XX
X
XX
X
X
XX
X
XX
X
X
XXXX
X X
X
X
XX
XXX
X
XX
X
X
X
XX
X
X
X
X
X
X
XX
X
XXXX
X
X
X
XX
X
X
XXXX
X
X
X
X
XX
X
XX
X
X
X
X
X
XX
X
X
X
X
XX
X
XX
X
X
X
X
X
X
X
X
X
X
X
XX
XX
XX
X
X
X
XX
X
X
X
XX
X
X
X
X
X
X
X
X
XX
X
X
XX
XX
X
X
X
X
XX
X
X
X
X
X
X
XX
X
X
X
X
X
XXXXXX
XX
X
X
X
XXX
X
X
X
XXXXXXX
X
X
XX
X
X
X
XX
X
X
X
X
X
XX
XX
XX
X
X
X
X
X
X
X
X
XXX
X
X
XXX
XXX
X
X
X
X
X
XXXX
XX
X
X
X
X
X
X
X
X
X
XXX
X
XXX
X
X
X
XXXX
X
X
X
X
X
XXX
XXXX
XX
XXX
X
X
X
X
X
X
X
X
X
X
X
XXXX
X
X
X
X
X
X
X
XXXXXX
XX
XX
X
X
XX
XXX
XX
XXXX
X
XXXX
X
XX
XX
X
X
X
X
XXX
X
X
XX
XXX
X
X
XXX
XX
X
X
X
X
X
X
X
XXX
XX
XXX
X
X
X
X
XX
X
XXXXX
X
X
XX
XXX
X
XXX
XX
XXX
X
XXXX
XX
X
X
X
XX
X
XX
X
X
X
X
XXX
X
X
X
XX
X
XX
X
X
X
XX
X
X
X
XX
X
X
X
X
X
X
X
X
XXX
XX
X
X
X
X
X
X
X
X
X X
X
X
XXX
X
XX
X
XXX
XX
X
X
XXX
X
X
X
X
X
XX
X
X
X
X
X
XX
X
X
X
XXXXX
XX
X
X
X
X
X
X
X
XX
X
X
X
X
X
X
X
X
X
X
X
XX
X
X
X
X
X
XXXX
X
X
X
X
X
XX
XXX
X
X
X
XXXX
X
X
X
XX
X
X
X
X
XX
X
X
XX
X
X
X
X
X
XX
X
X
X
X
X
XXX
XXX
X
X
XXX
X
X
X
X
X
X
X
X
XX
X
X
X
X X
X
X
X
X
X
X
X
X
X
X
X
X
XX
XX
X
X
X
X
X
X
X
X
X
X
X
X
X
X
X
X
X
X
X
X
X
X
X
X
X
X
X
XX
X
X
X
X
X
X
X
X
X
X
X
X
XX
X
X
X
X
X
XXX
X
X
X
X
X
XX
X
X
XX
X
X
XX
X
X
X
XX
XX
X
XX
X
X
X
X
X
X
X
X
X
X
X
X
X
X
X
X
X
X
X
X
XX
X
X
X
X
X
X
X
X
X
X
X
X
X
X
X
X
X
X
X
X
X
X
X
X
X
X
X
X
X
XX
X
X
X
X
X
X
X
X
X
XX
X
X
X
X
X
X
X
X
X
X
X
X
X
XX
X
X
X
X
X
XX
X
X
X
X
X
X
X
X
X
X
X
X
X
X
X
X
X
X XXXX
X
X
X
XX
XX
X
XX
X
X
X
X
XX
X
X
X
X
X
X
X
X
X
X
X
X
X
X
X
X
X
XX
X
X
X
X
X
X
XX
X
X
X
X
X
XXXXXXXXXXXX
XXXX
XX
X
X
XXXX
XX
X
X
X
XX
X
X
XXXXXX
XX
X
XX
XX
XXXX
X
XX
XX
XX
X
XX
X
XX
X
X
X
XXX
X
X
X
XXXXXXX
XXX XX
XX
XXX
X
X
XX
X
X
X X
X
X
X
XX
XX
XXXXX
XX
X
X
XXX XX
XXX
XX
XX
X
X
XX
X
X
X
X
X
X
X
XX
XX
X
X
X
X
XX
X
X
XX
XX
X
X
XX
X
X
XX
X
X
X
X
XX
XXX
X
XXXXX
XXX
X
X
XX
XX
XX
X
X
XXX
X
X
X
XX
XXXXXXX
X
X
X
XX
X
X
X
XXX
XX
XX
X
XXXXX
X
X
XXXX
XXX
X
X
XX
X
XXX
X
X
XXXXX
X
XXXXX
X
XXX
X
X
X
X
X
XX
XX
XXX
X
XXXXXXX
X
X
X
X
X
XX
X
X
XXXXXXXXXX
X
X
X
X
X
X
XX
X
XXXXX
X
X
X
X
XX
X
X
XX
X
XX
X
X
X
X
X
XX
X
X
XX
X
XX
XXXX
X
X
XXXXXX
X
X
X
XX
X
XXX
XX
XX
X
X
X
XX
X
XXXXXX
X
X
X
XXXXX
X
X
X
X
X
X
X
X
X
XX
X
X
X
X
X
X
X
XXX
X
XX
X
X X
X
XX
X
XX
X
X
X
X
XXX
X
X
XX
XX
X
X
X
X
XX
X
XX
X
X
X
X
X
X
X
X
X
X
XXX
XX
X
X
X
X
X
XX
X
XXXXXXXXXX
XX
XXX
X
XXXX
X
X
X
X
X
XX
X
X
X
XX
X
XX
XX
X
X
X
X
X
XXX
X
X
XX
XX
X
X
X
XX
X
X
X
X
XX
X
X
X
XX
XX
X
X
XX
X
XXXXX
X
X
X
X
XX
X
X
X
X
X
X
X
X
XX
X
X
X
X
X
XX
X
X
X
XXXX
X
X
X
X
X
X
X
X
X
X
XXXX
X
X
X
X
X
XXXXXX
X
X
X
X
X
X
XX
XX
XX
XX
X
X
X
X
X
X
X
X
X
X
X
X
X
X
X
XX
XXX
X
X
X
X
X
X
X
X
X
X
X
X
XXX
X
X
X
XX
XX
XX
XX
X
X
X
X
XX
X
X
X
X
X
X
XX
XX
X
XXXX
XX
X
X
X
X
X
X
X
X
X
X
X
X
X
X
XXX
X
X
X
X
XXXX
X
X
X
X
XX
X
X
XX
X
X
X
XX
XX
X
X
X
X
X
X
X
X
X
XXXX
XX
XX
X
X
X
XXXXXXXXXXXXXXXXXXXXXXXXXXXXXX
X
X
X
X
X
X
X
X
X
XXXX
X
XX
X
X
X
X
X
X
XX
X
X
X
X
X
X
X
X
X
X
X
X
X
X
X
X
XXXXX
X
XXX
X
X
X
X
X
X
X
X
X
X
X
XX
XXXX
XXXXXX
X
X
XX
XXXXX
XXXX
X
X
X
X
X
XXX
X
X
XXXX
X
XXXXX
X
X
XX
X
X
X
X
X
X
X
XXX
X
X
X
X
XXXXXXX
X
X
X
X
XXXXXX
X
X
X
X
X
X
X
XXXXXXXX
XXXXXXXXXXXXXXXXXX
X
X
X
X
XX
X
XX
X
XX
XXXXXXXXXXXXX
X
XX
X
XX
X
XX
X
XXXXXXX
X
X
XXXX
X
X
X
X
X
X
XXXXXX
XXXX
XXXX
XXXX
XX
XXXXXXXXX
XXXXXXXXXXXXXX
XXXXXXXX
XXXX
X
X
X
X
XX
X
X
X
X
XX
XXXX
X
X
X
X
X
XX
X
X
X
X
X
XXXX
XX
X
X
XX
XXX
X
X
X
XX
X
XX
XXX
X
X
X
X
X
XX
X
X
X
X
XX XX
X
X
X
X XX
X
X
XXX
X
X
XX
X
XX
XX
X
X
X
X
X
XXXXXXXXXX
X
XXXX
X
X
X
X
X
X
X
X
X
X
X
X
XX
X
XX
X
XX
X
X
X
X
X
X
X
X
X
X
X
X
X
X
X
XXX
XX
X
X
X
X
XX
X
XX
X
X
X
X
X
X
X
X
XX
X
XX
X
X
X
XX
X
X
X
X
X
X
X
XX
XX
XXXXX
X
XX
X
X
X
X
X
X
XX
XX
X
X
X
X
X
XX
X
X
X
X
X
X
X
XX
X
XX
X
X
X
X
X
X
X
X
X
XX
X
X
X
X
X
X
X
XXXXXXXXXX
X
XXXX
X
X
X
X
XXX
XX
X
XXXXXX
X
X
X
XX
XXXX
X
X
XX
X
X
XX
XX
X
XX
XXXXX
X
X
XX
X
XXXX
X
XX
X
XX
X
X
XXX
X
X
XX
X
X
XXXX
X
X
X
X
X
X
X
X
X
X
XX
X
X
X
X
X
X
X
X
X
X
X
X
X
X
X
XXX
X
X
X
X
XXXXXX
X
X
X
X
X
X
X
X
X
X
XXX
X
X
XXX
X
X
XX
XX
X
X
X
X
X
X
X
X
X
XXXXXXXXXXXXXX
X
X
XXX X
X
X
XXXXXXXX
X
X
X
X
X
X
X
X
XXXXX
X
X
X
XXXXXXX
X
XXXXXXX
X
X
X
XX
X
X
X
X
XX
X
X
X
XX
X
X
X
XX
XX
XXXX
XX
XX
X
X
XXXXX
XX
X
XX
X
XXXX
X
XXX
XX
X XX
X
XX
X
X
X
X
X
XXX
X
X
X
X
X
X
X
X
X
X
X
X
X
X
X
X
X
X
X
X
X
X
X
XX
X
XX
X
X
XX
X
X
X
XXX
X
X
X
X
X
X
X
X
X
X
X
X
X
X
X
X
X
X
X
XX
X
X
X
X
X
X
X
XX
XXX
X
XXXX
X
X
XX
X
X
X
X
XX
X
X
XX
X
X
X
X
XX
XXX
X
XX
XX
XX
XX
X
XX
X
XX
X
XX
X
X
X
X
X
XXX
X
X
X
XX
XX
XX
X
X
XX
XX
XXX
X
XX
X
X
X
X
XXXXXX
X
X
X
X
X
XX
X
X
X
X
X
XXXXXX
XX
X
XX
X
X
X
XX
X
X
X
X
XX
X
X
X
X
X X
XX
X
XX
X
XX
X
XXXX
X
X
X
X
XXX
X
X
XX
XX
X
X
X
X
X
X
X
XX
XX
X
X
X
XX
X
X
X
XX
XXX
X
X
X
X
XXX
XX
X
X
XX
X
X
X
X
X
XX
X
X
XXX
X
XXXXX
X
X
X
XX
X
X
X
XXX
XX
X
X
XX
X
XX
X
X
X
X
XX
X
X
X
XX
X
X
X
XX
X
X
X
X
XXX
X
X
X
X
X
X
X
XX
X
X
X
XX
X
X
XX
X
X
X
X
X
X
X
X
XX
XX
XX
X
X
XX
XXX
X
XX
X X
X
X
XXX
X
X
XX
XXX
X
X
XX
X
X
XX
X
X
X
X
X
X
X
X
X
XX
X
X
X
X
X
X
X
X
X
X
X
X
X
X
X
X
X
X
X
X
X
X
X
X
XXX
X
X
X
XX
X
X
X
X
X
X
X
X
X
X
X
X
X
X
X
X
X
XX
X
X
X
X
XXX
X
XX
XXXX
X
XXX
X
X
X
X
X
X
XXXXXXXXXXXX
X
X
XX
XX
X
X
X
X
X
XX
X
X
XXXX
X
XX
X
XX
X
X
XX
X
XX
X
X
XXXX
X X
X
X
XX
XXX
X
XX
X
X
X
XX
X
X
X
X
X
X
XX
X
XXXX
X
X
X
XX
X
X
XXXX
X
X
X
X
XX
X
XX
X
X
X
X
X
XX
X
X
X
X
XX
X
XX
X
X
X
X
X
X
X
X
X
X
X
XX
XX
XX
X
X
X
XX
X
X
X
XX
X
X
X
X
X
X
X
X
XX
X
X
XX
XX
X
X
X
X
XX
X
X
X
X
X
X
XX
X
X
X
X
X
XXXXXX
XX
X
X
X
XXX
X
X
X
XXXXXXX
X
X
XX
X
X
X
XX
X
X
X
X
X
XX
XX
XX
X
X
X
X
X
X
X
X
XXX
X
X
XXX
XXX
X
X
X
X
X
XXXX
XX
X
X
X
X
X
X
X
X
X
XXX
X
XXX
X
X
X
XXXX
X
X
X
X
X
XXX
XXXX
XX
XXX
X
X
X
X
X
X
X
X
X
X
X
XXXX
X
X
X
X
X
X
X
XXXXXX
XX
XX
X
X
XX
XXX
XX
XXXX
X
XXXX
X
XX
XX
X
X
X
X
XXX
X
X
XX
XXX
X
X
XXX
XX
X
X
X
X
X
X
X
XXX
XX
XXX
X
X
X
X
XX
X
XXXXX
X
X
XX
XXX
X
XXX
XX
XXX
X
XXXX
XX
X
X
X
XX
X
XX
X
X
X
X
XXX
X
X
X
XX
X
XX
X
X
X
XX
X
X
X
XX
X
X
X
X
X
X
X
X
XXX
XX
X
X
X
X
X
X
X
X
X X
X
X
XXX
X
XX
X
XXX
XX
X
X
XXX
X
X
X
X
X
XX
X
X
X
X
XX
X
X
X
XXXXX
XX
X
X
X
X
X
X
X
XX
X
X
X
X
X
X
X
X
X
X
X
XX
X
X
X
X
X
XXXX
X
X
X
X
X
XX
XXX
X
X
X
XXXX
X
X
X
XX
X
X
X
X
XX
X
X
XX
X
X
X
X
X
XX
X
X
X
X
X
XXX
XXX
X
X
XXX
X
X
X
X
X
X
X
X
XX
X
X
X
X X
X
X
X
X
X
X
X
X
X
X
X
X
XX
XX
X
X
X
X
X
X
X
X
X
X
X
X
X
X
X
X
X
X
X
X
X
X
X
X
X
X
X
XX
X
X
X
X
X
X
X
X
X
X
X
X
XX
X
X
X
X
X
XXX
X
X
X
X
X
XX
X
X
XX
X
X
X
X
X
X
XX
XX
X
XX
X
X
X
X
X
X
X
X
X
X
X
X
X
X
X
X
X
X
X
X
XX
X
X
X
X
X
X
X
X
X
X
X
X
X
X
X
X
X
X
X
X
X
X
X
X
X
X
X
X
X
XX
X
X
X
X
X
X
X
X
X
XX
X
X
X
X
X
X
X
X
X
X
X
X
X
XX
X
X
X
X
X
XX
X
X
X
X
X
X
X
X
X
X
X
X
X
X
X
X
X
X XXXX
X
X
X
XX
XX
X
XX
X
X
X
X
XX
X
X
X
X
X
X
X
X
X
X
X
X
X
X
X
X
X
XX
X
X
X
X
X
X
XX
X
X
X
X
X
XXXXXXXXXXXX
XXXX
XX
X
X
XXXX
XX
X
X
X
XX
X
X
XXXXXX
XX
X
XX
XX
XXXX
X
XX
XX
XX
X
XX
X
XX
X
X
X
XXX
X
X
X
XXXXXXX
XXX XX
XX
XXX
X
X
XX
X
X
X X
X
X
X
XX
XX
XXXXX
XX
X
X
XXX XX
XXX
XX
XX
X
X
XX
X
X
X
X
X
X
X
XX
XX
X
X
X
X
XX
X
X
XX
XX
X
X
XX
X
X
XX
X
X
X
X
XX
XXX
X
XXXXX
X
X
XX
XX
XX
X
X
XXX
X
X
X
XX
XXXXXXX
X
X
X
XX
X
X
X
XXX
XX
XX
X
XXXXX
X
X
XXXX
XXX
X
X
XX
X
XXX
X
X
XXXXX
X
XXXXX
X
XXX
X
X
X
X
X
XX
XX
XXX
X
XXXXXXX
X
X
X
X
X
XX
X
X
XXXXXXXXXX
X
X
X
X
X
X
XXXXXXX
X
X
X
X
XX
X
X
XX
X
XX
X
X
X
X
X
XX
X
X
XX
X
XX
XXXX
X
XXXXXX
X
X
X
XX
X
XXX
XX
XX
X
X
X
XX
X
XXXXXX
X
X
X
XXXXX
X
X
X
X
X
X
X
X
X
XX
X
X
X
X
X
X
X
XXX
X
XX
X
X X
X
XX
X
XX
X
X
X
X
XXX
X
X
XX
XX
X
X
X
X
XX
X
XX
X
X
X
X
X
X
X
X
X
X
XXX
XX
X
X
X
X
X
XX
X
XXXXXXXXXX
XX
XXX
X
XXXX
X
X
X
X
XX
X
X
X
XX
X
XX
XX
X
X
X
X
X
XXX
X
X
XX
XX
X
X
X
XX
X
X
X
X
XX
X
X
X
XX
XX
X
X
XX
X
XXXXX
X
X
X
X
XX
X
X
X
X
X
X
X
X
XX
X
X
X
X
XX
X
X
X
XXXX
X
X
X
X
X
X
X
X
X
X
XXXX
X
X
X
X
X
XXXXXX
X
X
X
X
X
X
XX
XX
XX
XX
X
X
X
X
X
X
X
X
X
X
X
X
X
X
X
XX
XXX
X
X
X
X
X
X
X
X
X
X
X
X
XXX
X
X
X
XX
XX
XX
XX
X
X
X
X
XX
X
X
X
X
X
X
XX
XX
X
X
XX
X
X
X
X
XXXX
X
X
X
X
X
X
X
X
XXXXX
X
X
X
X
X
X
X
X
X
XXX
X
XXX
X
X
XXXXXXXXXXXXXXXXXXXXXXX
X
XX
XXXXXXXXXXX
X
X
X
X
X
XX
X
XXX
X
XXXXX
X
X
X
XX
X
XX
XX
X
XXXXX
XX
XX
X
X
X
XX
X
XXXXXX
X
XX
X
X
X
X
X
XX
X
X
X
X
XX
X
XXXX
XX
X
X
X
X
XX
XX
X
X
X
X
XX
X
XXX
X
X
XXXXX
XXXX
X
XX
X
X
XX
XXXXX
X
XX
X
X
X
X
X
XX
X
XX
X
X
X
XXXXXXXX
XXXXXXXXXXXXXXX
XXX
X
X
X
X
X
X
X
XX
X
XXXXXXXXXX
X
XXXXXX
X
X
X
X
X
X
X
XXX
XXX
X
X
XX
X
XXXXXX
XXX
XX
X
X
X
X
X
X
X
X
X
X
X
X
X
X
X
X
X
X
X
X
X
XX
X
X
X
X
X
XXX
X
X
X
X
X
X
X
X
X
X
X
X
X
XX
X
X
XX
X
X
X
X
XX
X
X
XX
XXX
X
X
X
X
X
X
X
X
X
X
X
X
X
X
X
X
X
X
X
X
X
X
X
X
X X
X
X
XX
X
X
X
X
XX
X
XXX
X
X
X
X
X
X
X
X
XX
XX
X
X
X
X
X
X
XX
X
X
X
X
X
X
XX
XXXX
X
X
XX
XXXXXXXXXXX
X
X
XXXX
XX
XXXXXXXXXXXXXXXXXXX
X
XXX
XX
XXXXXXXXXXXXXX
XXXX
X
XXXXX
XX XXXX
X
XXXXX
XXX
XXXXX
XX
XX
X
XXX
X
X
X
XXXXXXXX
X
XXX
XX
X
X
XXXXXXXXX
XXXXXX
XX
X
X
X
X
X
X
XX
XX
X
XXX
X
X
XXX
X
X
XXXX
X
XX
X
XXXX
X
X
X
XX
X
XX
X
X
X
X
X
X
X
X
X
X
XXXXXXXX
XXX
X
X
XXXXXXXX
X
XXXX
X
X
X
X
X
X
X
X
X
X
X
X
X
X
X
X
X
XXX
X
X
X
X
X
X
X
X
X
X
X
X
X
X
X
X
XXXX
X
X
X
X
X
X
X
X
XX
X
X
X
X
X
X
X
X
X
X
X
X
X
X
XX
X
X
X
X
X
X
X
XXX
X
X
X
X
X
X
X
X
X
X
X
X
X
X
X
XX
X
XX
X
X
X
X
X
X
X
X
X
X
X
X
XX
X
X
X
X
XX
X
X
X
X
X
X
X
X
X
X
X
X
X
XX
X
X
X
X
X
X
X
X
X
X
X
X
X
X
X
X
XXX
X
X
X
X
XX
XX
X
X
X
XX
X
X
X
X
XX
X
X XX
X
X
X
X
X
XX
X
X
X
X
X
X
X
X
X
X
XX
X
XXX
X
XX
X
X
X
X
XX
X
X
X
XX
X
X
X
X
XX
X
X
XX
X
X
X
X
X
X
X
X
XX
X
XX
X
XX
X
X
X
X
XXX
X
X
XX
X
X
XXX
X
X
X
X
X
X
X
X
X
X
X
XXX
XX
XX
X
X
XX
X
X
XXX
X
XX
X
XX
XX
XXX
XXXXX
XXX
X
X
X
X
X
X
X
X
X
X
X
X
X
XX
X
X
XX
X
X
X
X
X
X
XX
X
X
X
X
X
X
X
X
X
X
X
X
X
X
X X
X
X
X
X
X
X
X
X
X
X
X
X
X
X
XXX X
X
X
X
X
X
X
X
X
X
X
X
XX
X
X
X
X
X
X
X
X
X
X
X
X
X
X
X
X
X
X
X
X
X
X
X
X
X
X
X
X
X
X
X
X
X
X
X
X
X
X
X
X
X
X
X
X
X
X
X
X
X
X
X
X
X
XX
X
X
X
X
X
X
X
X
X
X
X
X
X
X X
X
X
X
XX
X
X
X
X
X
X
X
X
X
X
X
X
X
X
X
X
X
X
X
X
X
X
X
X
X
X
X
X
X
X
X
X
X
X
XX
X
X
X
X
X
X
X
X
X
X
X
X
X
X
X
X
X
X
X
X
X
X
X
X
X
X
XX
X
X
X
X
X
X
X
X
X
X
X
X
X
X
X
XX
X
X
X
X
X
X
X
X
X
X
X
X
X
X
X
X
X
X
X
X
X
X
X
X
X
X
X
X
X
X
X
X
X
X
X
X
X
X
X
X
X
X
X
X
X
X
XX
X
X
X
X
XXX
X
X
X
X
X
XX
X
X
X
X
X
X
X
X
X
X
X
X
X
X
X
X
X
X
X
X
X
X
X
X
X X
X
X
X
X
X
X
X
X
X
X
X
X
X
X
X
X
X
X
X
X
X
X
X
XXX
X
X
X
X
X
X
X
X
XX
X
X
X
X
X
X
X
X
X
XX
XX
X
X
X
X
X
X
X
X
X
X
X
X
X
X
X
X
X X
X
X
X
X
X
X
X
X
X
X
X
X
X
X
X
X
X
X
X
X
X
X
X
X
X
X
X
X
X
XX
X
X
XX
X
X
X
X
X
X
X
X
X
X
X
X
X
X
X
X
X
X
X
X
X
X
X
X XX
X
X
X
X
X
X
X
X
X
X
X
X
X
X
X
X
X
X
X
X
X
X
X
X
XX
X
X
X
X
X
XX
XX
X
X
X
X X
X
X
X
X
X
XXX
X
X
X
X
X
X
X
XXX
X
X
X
X
X
X
X
X
X
X
X
X
X
X
XX
X
X
X
X
X
X
X
X
X
X
X
X
XX
X
X
XX
X
XX
X
XX
X
X
X
X
X
X
X
X
X
X
X
X
X
X
X
XX
X
X
X
X
X
X
X
X
XX
X
X
X
X
X
X
X
XX
X
X
X
X
X
X
X
X
X
X
X
X
X
X
X
X
X
X
X
XX
X
X
X
X
X
X
X
X
X
X
X
X
XX
X
X
X
X
X
X
X
X
X
X
X
X
X
X
X X
XX
X
X
X
X X
X
X
X
X
X
X
X
X
X
X
X
X
X
X
X
X
X
X
XX
X
X
XX
X
XX
X
XX
X
X
X
X
X
X
X
X
X
X
X
X
X
X
X
X
X
X
X
X
X
X
X
X
X
X
X
X
X
X
X
X
X
X
X
XX
X
XX
X
X
X
X
X
X
X
X
X
X
Ê
X Conflict EventSegmentary Lineage = 0Segmentary Lineage = 1
0 10 20 30 40 50 60 70 80 90 1005Kilometers
Figure 5: An illustration of the RD setting: an example of ethnicity pairs, conflict events, and10km grid-cells. The two segmentary lineage ethnic groups shown are Ambo (top) and Konjo(bottom), and the two non-segmentary lineage groups shown are Toro (top) and Nkole (bottom).
one ethnicity has segmentary lineages and the other does not.23 Figure 5 illustrates this setup,
showing pairs of contiguous ethnic groups, one of which is a segmentary lineage society and the
other is not. Also shown are the observations in the analysis – 10km by 10km grid-cells. The
exact location of a cell is measured by its centroid. Also reported in the figure are the locations of
conflicts events.
Our RD strategy restricts attention to grid-cells that are close to the ethnicity borders, and
uses this difference to estimate the impact of segmentary lineage systems on conflict today. The
benefit of this estimation is that it will explicitly account for any unobservable factors that vary
smoothly across space, either because historical shocks or geographic factors have a smooth
23This means that if an ethnic group is adjacent to more than one ethnic group of different treatment status, then theethnic group can be a part of multiple pairs.
37
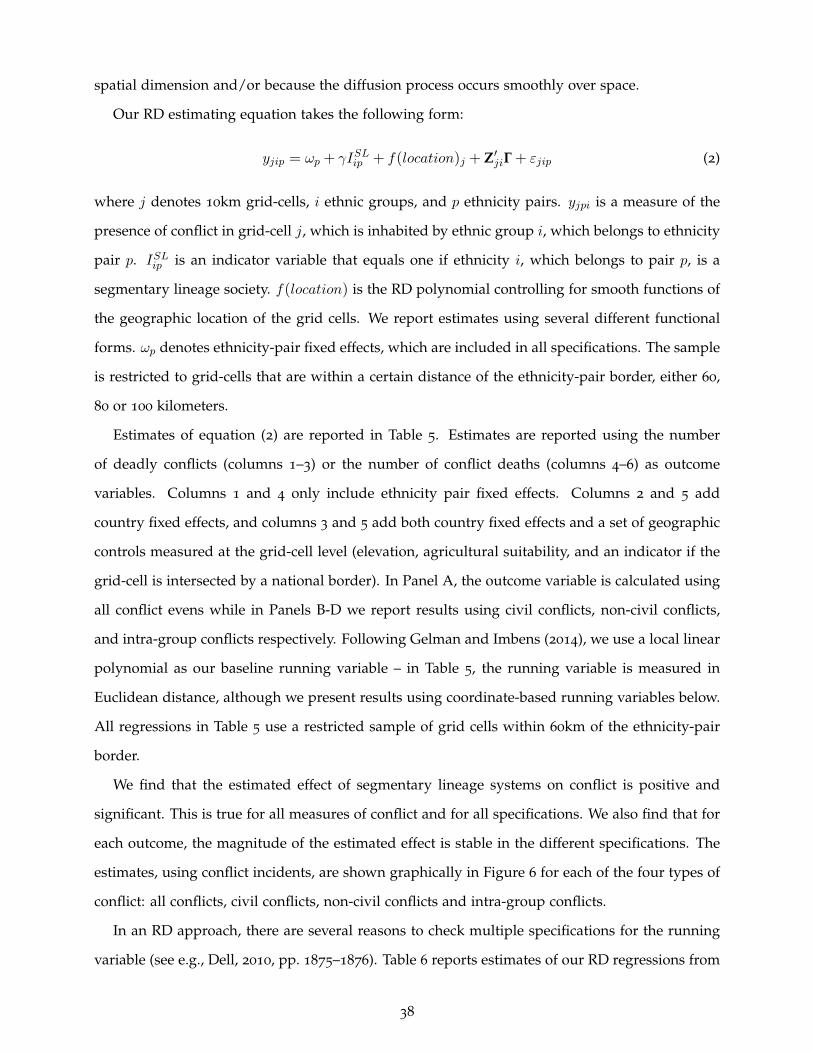
spatial dimension and/or because the diffusion process occurs smoothly over space.
Our RD estimating equation takes the following form:
yjip = ωp + γISLip + f(location)j + Z′jiΓ + εjip (2)
where j denotes 10km grid-cells, i ethnic groups, and p ethnicity pairs. yjpi is a measure of the
presence of conflict in grid-cell j, which is inhabited by ethnic group i, which belongs to ethnicity
pair p. ISLip is an indicator variable that equals one if ethnicity i, which belongs to pair p, is a
segmentary lineage society. f(location) is the RD polynomial controlling for smooth functions of
the geographic location of the grid cells. We report estimates using several different functional
forms. ωp denotes ethnicity-pair fixed effects, which are included in all specifications. The sample
is restricted to grid-cells that are within a certain distance of the ethnicity-pair border, either 60,
80 or 100 kilometers.
Estimates of equation (2) are reported in Table 5. Estimates are reported using the number
of deadly conflicts (columns 1–3) or the number of conflict deaths (columns 4–6) as outcome
variables. Columns 1 and 4 only include ethnicity pair fixed effects. Columns 2 and 5 add
country fixed effects, and columns 3 and 5 add both country fixed effects and a set of geographic
controls measured at the grid-cell level (elevation, agricultural suitability, and an indicator if the
grid-cell is intersected by a national border). In Panel A, the outcome variable is calculated using
all conflict evens while in Panels B-D we report results using civil conflicts, non-civil conflicts,
and intra-group conflicts respectively. Following Gelman and Imbens (2014), we use a local linear
polynomial as our baseline running variable – in Table 5, the running variable is measured in
Euclidean distance, although we present results using coordinate-based running variables below.
All regressions in Table 5 use a restricted sample of grid cells within 60km of the ethnicity-pair
border.
We find that the estimated effect of segmentary lineage systems on conflict is positive and
significant. This is true for all measures of conflict and for all specifications. We also find that for
each outcome, the magnitude of the estimated effect is stable in the different specifications. The
estimates, using conflict incidents, are shown graphically in Figure 6 for each of the four types of
conflict: all conflicts, civil conflicts, non-civil conflicts and intra-group conflicts.
In an RD approach, there are several reasons to check multiple specifications for the running
variable (see e.g., Dell, 2010, pp. 1875–1876). Table 6 reports estimates of our RD regressions from
38
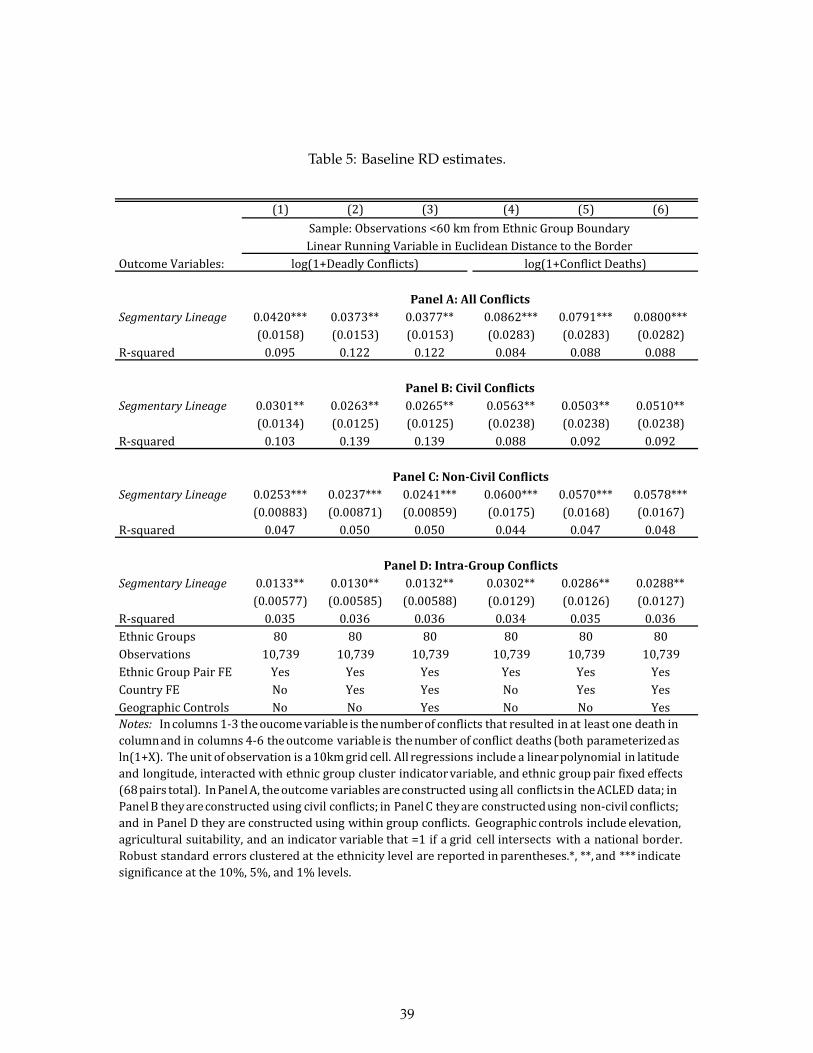
Table 5: Baseline RD estimates.
(1) (2) (3) (4) (5) (6)
LinearRunningVariableinEuclideanDistancetotheBorderOutcomeVariables:
PanelA:AllConflictsSegmentaryLineage 0.0420*** 0.0373** 0.0377** 0.0862*** 0.0791*** 0.0800***
(0.0158) (0.0153) (0.0153) (0.0283) (0.0283) (0.0282)R-squared 0.095 0.122 0.122 0.084 0.088 0.088
PanelB:CivilConflictsSegmentaryLineage 0.0301** 0.0263** 0.0265** 0.0563** 0.0503** 0.0510**
(0.0134) (0.0125) (0.0125) (0.0238) (0.0238) (0.0238)R-squared 0.103 0.139 0.139 0.088 0.092 0.092
PanelC:Non-CivilConflictsSegmentaryLineage 0.0253*** 0.0237*** 0.0241*** 0.0600*** 0.0570*** 0.0578***
(0.00883) (0.00871) (0.00859) (0.0175) (0.0168) (0.0167)R-squared 0.047 0.050 0.050 0.044 0.047 0.048
PanelD:Intra-GroupConflictsSegmentaryLineage 0.0133** 0.0130** 0.0132** 0.0302** 0.0286** 0.0288**
(0.00577) (0.00585) (0.00588) (0.0129) (0.0126) (0.0127)R-squared 0.035 0.036 0.036 0.034 0.035 0.036EthnicGroups 80 80 80 80 80 80Observations 10,739 10,739 10,739 10,739 10,739 10,739EthnicGroupPairFE Yes Yes Yes Yes Yes YesCountryFE No Yes Yes No Yes YesGeographicControls No No Yes No No YesNotes: Incolumns 1-3 theoucomevariable is thenumberof conflicts that resulted in at least one death incolumnand in columns 4-6 theoutcome variable is thenumber of conflict deaths (both parameterizedasln(1+X). The unit of observation is a10kmgrid cell. All regressions include a linearpolynomial in latitudeand longitude, interacted with ethnic group cluster indicatorvariable, and ethnic grouppair fixed effects(68pairs total). InPanelA, theoutcome variables areconstructed using all conflicts in theACLED data; inPanelB theyareconstructed using civil conflicts; in PanelC theyare constructedusing non-civil conflicts;and in Panel D they are constructed using within group conflicts. Geographic controls include elevation,agricultural suitability, and an indicator variable that =1 if a grid cell intersects with a national border.Robust standard errors clustered at the ethnicity level are reported in parentheses.*, **, and *** indicatesignificanceatthe10%,5%,and1%levels.
Sample:Observations<60kmfromEthnicGroupBoundary
log(1+DeadlyConflicts) log(1+ConflictDeaths)
39

.04
.06
.08
.1.1
2.1
4lo
g(1+
Dea
dly
Con
flict
Inci
dent
s)
-150 -100 -50 0 50 100 150Distance to Border (km)
(a) All conflicts.
.02
.04
.06
.08
.1.1
2lo
g(1+
Dea
dly
Civ
il C
onfli
ct In
cide
nts)
-150 -100 -50 0 50 100 150Distance to Border (km)
(b) Civil conflicts.
.02
.03
.04
.05
.06
.07
log(
1+D
eadl
y N
on-C
ivil
Con
flict
Inci
dent
s)
-150 -100 -50 0 50 100 150Distance to Border (km)
(c) Non-civil conflicts.
.005
.01
.015
.02
.025
.03
log(
1+D
eadl
y In
tra-G
roup
Con
flict
)
-150 -100 -50 0 50 100 150Distance to Border (km)
(d) Intra-group conflict.
Figure 6: This figure presents the main RD results graphically. The y-axis reports (log of) deadlyconflict incidents for the four different types of conflict. The x-axis is measured in kilometers andreports geographic distance from the borders between segmentary lineage and non-segmentarylineage societies. The border is at kilometer 0, and positive values indicate kilometers in theterritories of segmentary lineage societies.
40
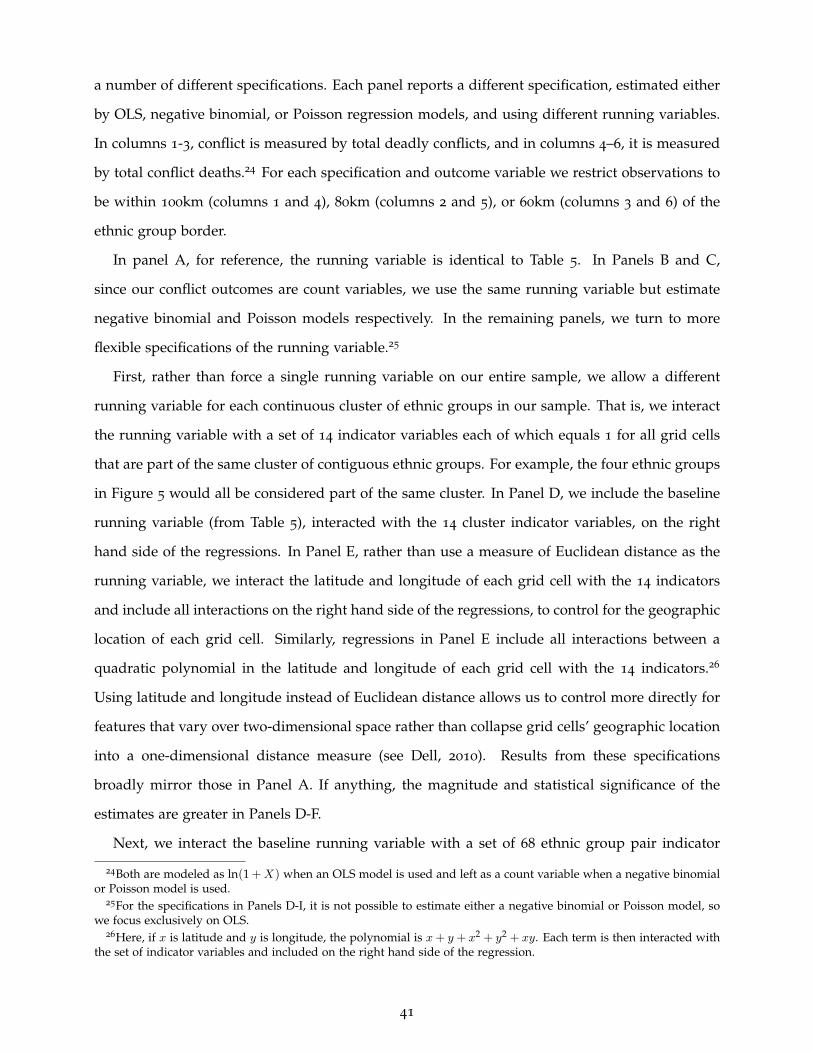
a number of different specifications. Each panel reports a different specification, estimated either
by OLS, negative binomial, or Poisson regression models, and using different running variables.
In columns 1-3, conflict is measured by total deadly conflicts, and in columns 4–6, it is measured
by total conflict deaths.24 For each specification and outcome variable we restrict observations to
be within 100km (columns 1 and 4), 80km (columns 2 and 5), or 60km (columns 3 and 6) of the
ethnic group border.
In panel A, for reference, the running variable is identical to Table 5. In Panels B and C,
since our conflict outcomes are count variables, we use the same running variable but estimate
negative binomial and Poisson models respectively. In the remaining panels, we turn to more
flexible specifications of the running variable.25
First, rather than force a single running variable on our entire sample, we allow a different
running variable for each continuous cluster of ethnic groups in our sample. That is, we interact
the running variable with a set of 14 indicator variables each of which equals 1 for all grid cells
that are part of the same cluster of contiguous ethnic groups. For example, the four ethnic groups
in Figure 5 would all be considered part of the same cluster. In Panel D, we include the baseline
running variable (from Table 5), interacted with the 14 cluster indicator variables, on the right
hand side of the regressions. In Panel E, rather than use a measure of Euclidean distance as the
running variable, we interact the latitude and longitude of each grid cell with the 14 indicators
and include all interactions on the right hand side of the regressions, to control for the geographic
location of each grid cell. Similarly, regressions in Panel E include all interactions between a
quadratic polynomial in the latitude and longitude of each grid cell with the 14 indicators.26
Using latitude and longitude instead of Euclidean distance allows us to control more directly for
features that vary over two-dimensional space rather than collapse grid cells’ geographic location
into a one-dimensional distance measure (see Dell, 2010). Results from these specifications
broadly mirror those in Panel A. If anything, the magnitude and statistical significance of the
estimates are greater in Panels D-F.
Next, we interact the baseline running variable with a set of 68 ethnic group pair indicator
24Both are modeled as ln(1 +X) when an OLS model is used and left as a count variable when a negative binomialor Poisson model is used.
25For the specifications in Panels D-I, it is not possible to estimate either a negative binomial or Poisson model, sowe focus exclusively on OLS.
26Here, if x is latitude and y is longitude, the polynomial is x+ y + x2 + y2 + xy. Each term is then interacted withthe set of indicator variables and included on the right hand side of the regression.
41
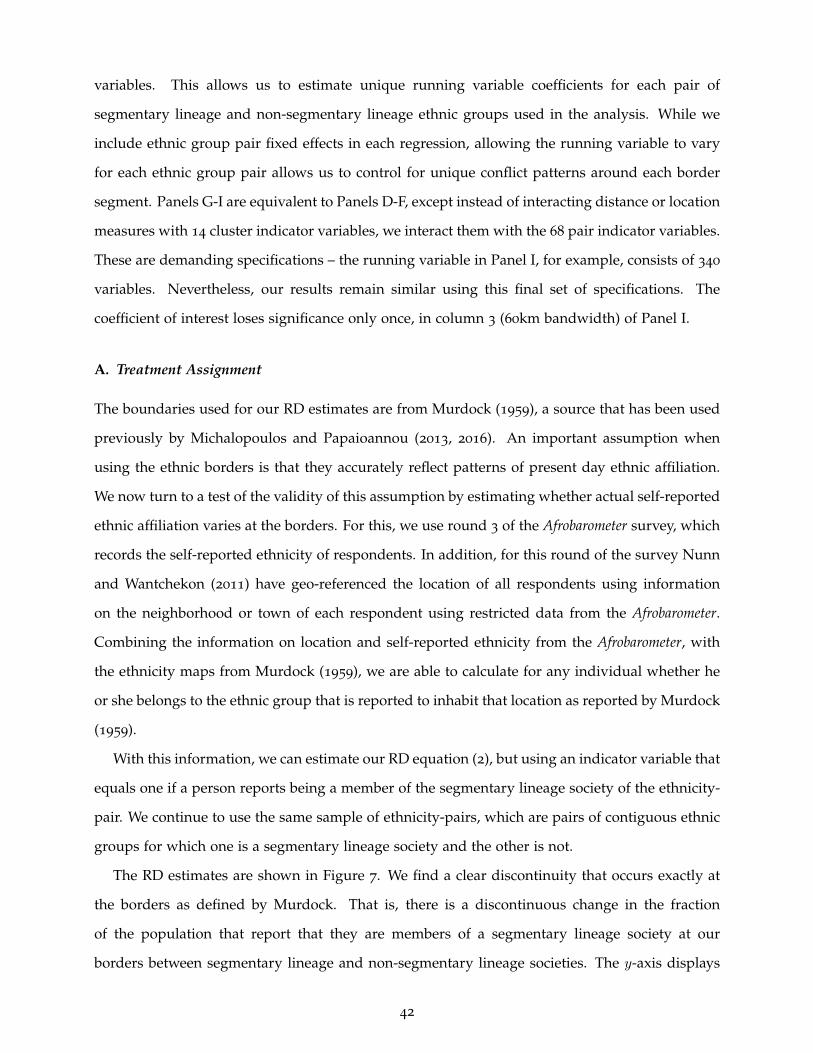
variables. This allows us to estimate unique running variable coefficients for each pair of
segmentary lineage and non-segmentary lineage ethnic groups used in the analysis. While we
include ethnic group pair fixed effects in each regression, allowing the running variable to vary
for each ethnic group pair allows us to control for unique conflict patterns around each border
segment. Panels G-I are equivalent to Panels D-F, except instead of interacting distance or location
measures with 14 cluster indicator variables, we interact them with the 68 pair indicator variables.
These are demanding specifications – the running variable in Panel I, for example, consists of 340
variables. Nevertheless, our results remain similar using this final set of specifications. The
coefficient of interest loses significance only once, in column 3 (60km bandwidth) of Panel I.
A. Treatment Assignment
The boundaries used for our RD estimates are from Murdock (1959), a source that has been used
previously by Michalopoulos and Papaioannou (2013, 2016). An important assumption when
using the ethnic borders is that they accurately reflect patterns of present day ethnic affiliation.
We now turn to a test of the validity of this assumption by estimating whether actual self-reported
ethnic affiliation varies at the borders. For this, we use round 3 of the Afrobarometer survey, which
records the self-reported ethnicity of respondents. In addition, for this round of the survey Nunn
and Wantchekon (2011) have geo-referenced the location of all respondents using information
on the neighborhood or town of each respondent using restricted data from the Afrobarometer.
Combining the information on location and self-reported ethnicity from the Afrobarometer, with
the ethnicity maps from Murdock (1959), we are able to calculate for any individual whether he
or she belongs to the ethnic group that is reported to inhabit that location as reported by Murdock
(1959).
With this information, we can estimate our RD equation (2), but using an indicator variable that
equals one if a person reports being a member of the segmentary lineage society of the ethnicity-
pair. We continue to use the same sample of ethnicity-pairs, which are pairs of contiguous ethnic
groups for which one is a segmentary lineage society and the other is not.
The RD estimates are shown in Figure 7. We find a clear discontinuity that occurs exactly at
the borders as defined by Murdock. That is, there is a discontinuous change in the fraction
of the population that report that they are members of a segmentary lineage society at our
borders between segmentary lineage and non-segmentary lineage societies. The y-axis displays
42
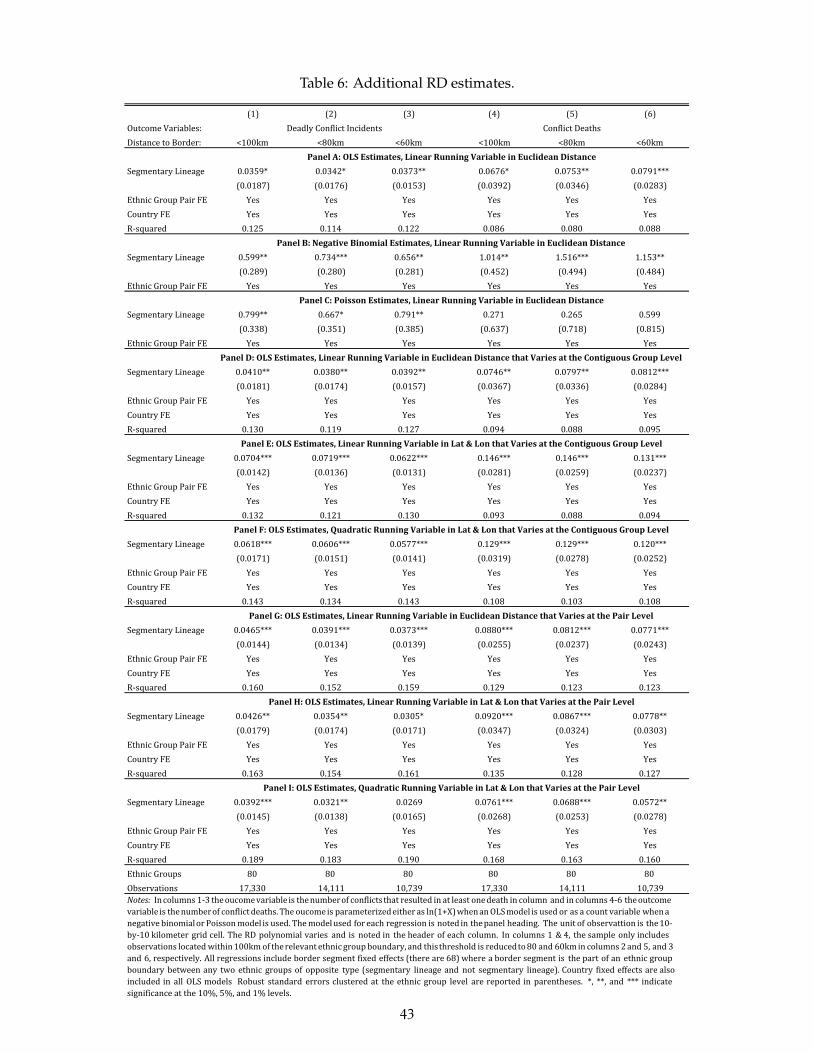
Table 6: Additional RD estimates.
(1) (2) (3) (4) (5) (6)OutcomeVariables: DeadlyConflictIncidents ConflictDeathsDistancetoBorder: <100km <80km <60km <100km <80km <60km
PanelA:OLSEstimates,LinearRunningVariableinEuclideanDistanceSegmentaryLineage 0.0359* 0.0342* 0.0373** 0.0676* 0.0753** 0.0791***
(0.0187) (0.0176) (0.0153) (0.0392) (0.0346) (0.0283)EthnicGroupPairFE Yes Yes Yes Yes Yes YesCountryFE Yes Yes Yes Yes Yes YesR-squared 0.125 0.114 0.122 0.086 0.080 0.088
PanelB:NegativeBinomialEstimates,LinearRunningVariableinEuclideanDistanceSegmentaryLineage 0.599** 0.734*** 0.656** 1.014** 1.516*** 1.153**
(0.289) (0.280) (0.281) (0.452) (0.494) (0.484)EthnicGroupPairFE Yes Yes Yes Yes Yes Yes
PanelC:PoissonEstimates,LinearRunningVariableinEuclideanDistanceSegmentaryLineage 0.799** 0.667* 0.791** 0.271 0.265 0.599
(0.338) (0.351) (0.385) (0.637) (0.718) (0.815)EthnicGroupPairFE Yes Yes Yes Yes Yes Yes
PanelD:OLSEstimates,LinearRunningVariableinEuclideanDistancethatVariesattheContiguousGroupLevelSegmentaryLineage 0.0410** 0.0380** 0.0392** 0.0746** 0.0797** 0.0812***
(0.0181) (0.0174) (0.0157) (0.0367) (0.0336) (0.0284)EthnicGroupPairFE Yes Yes Yes Yes Yes YesCountryFE Yes Yes Yes Yes Yes YesR-squared 0.130 0.119 0.127 0.094 0.088 0.095
PanelE:OLSEstimates,LinearRunningVariableinLat&LonthatVariesattheContiguousGroupLevelSegmentaryLineage 0.0704*** 0.0719*** 0.0622*** 0.146*** 0.146*** 0.131***
(0.0142) (0.0136) (0.0131) (0.0281) (0.0259) (0.0237)EthnicGroupPairFE Yes Yes Yes Yes Yes YesCountryFE Yes Yes Yes Yes Yes YesR-squared 0.132 0.121 0.130 0.093 0.088 0.094
PanelF:OLSEstimates,QuadraticRunningVariableinLat&LonthatVariesattheContiguousGroupLevelSegmentaryLineage 0.0618*** 0.0606*** 0.0577*** 0.129*** 0.129*** 0.120***
(0.0171) (0.0151) (0.0141) (0.0319) (0.0278) (0.0252)EthnicGroupPairFE Yes Yes Yes Yes Yes YesCountryFE Yes Yes Yes Yes Yes YesR-squared 0.143 0.134 0.143 0.108 0.103 0.108
PanelG:OLSEstimates,LinearRunningVariableinEuclideanDistancethatVariesatthePairLevelSegmentaryLineage 0.0465*** 0.0391*** 0.0373*** 0.0880*** 0.0812*** 0.0771***
(0.0144) (0.0134) (0.0139) (0.0255) (0.0237) (0.0243)EthnicGroupPairFE Yes Yes Yes Yes Yes YesCountryFE Yes Yes Yes Yes Yes YesR-squared 0.160 0.152 0.159 0.129 0.123 0.123
PanelH:OLSEstimates,LinearRunningVariableinLat&LonthatVariesatthePairLevelSegmentaryLineage 0.0426** 0.0354** 0.0305* 0.0920*** 0.0867*** 0.0778**
(0.0179) (0.0174) (0.0171) (0.0347) (0.0324) (0.0303)EthnicGroupPairFE Yes Yes Yes Yes Yes YesCountryFE Yes Yes Yes Yes Yes YesR-squared 0.163 0.154 0.161 0.135 0.128 0.127
PanelI:OLSEstimates,QuadraticRunningVariableinLat&LonthatVariesatthePairLevelSegmentaryLineage 0.0392*** 0.0321** 0.0269 0.0761*** 0.0688*** 0.0572**
(0.0145) (0.0138) (0.0165) (0.0268) (0.0253) (0.0278)EthnicGroupPairFE Yes Yes Yes Yes Yes YesCountryFE Yes Yes Yes Yes Yes YesR-squared 0.189 0.183 0.190 0.168 0.163 0.160EthnicGroups 80 80 80 80 80 80Observations 17,330 14,111 10,739 17,330 14,111 10,739Notes: Incolumns 1-3 theoucomevariable is thenumberof conflictsthat resulted in at least onedeath in column and in columns 4-6 theoutcomevariable is thenumberof conflict deaths. The oucomeis parameterizedeither as ln(1+X)whenanOLSmodel is used or as a count variable whenanegative binomialor Poissonmodel is used. Themodelused for each regression is noted in thepanel heading. The unit of observattion is the10-by-10 kilometer grid cell. The RD polynomial varies and is noted in the header of each column. In columns 1 & 4, the sample only includesobservations locatedwithin100km of therelevant ethnic groupboundary, and thisthreshold is reducedto80 and 60kmin columns 2and 5, and 3and 6, respectively. All regressions include border segment fixed effects (there are 68) where a border segment is the part of an ethnic groupboundary between any two ethnic groups of opposite type (segmentary lineage and not segmentary lineage). Country fixed effects are alsoincluded in all OLS models Robust standard errors clustered at the ethnic group level are reported in parentheses. *, **, and *** indicatesignificanceatthe10%,5%,and1%levels.
43
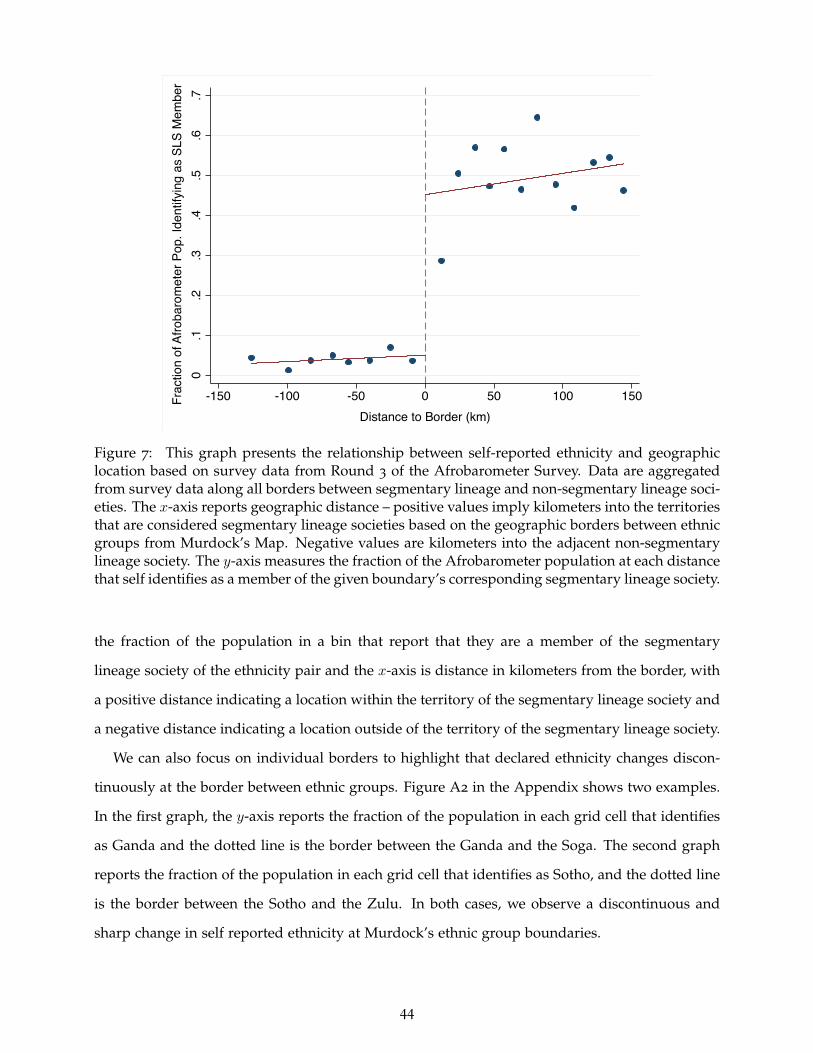
0.1
.2.3
.4.5
.6.7
Frac
tion
of A
froba
rom
eter
Pop
. Ide
ntify
ing
as S
LS M
embe
r
-150 -100 -50 0 50 100 150Distance to Border (km)
Figure 7: This graph presents the relationship between self-reported ethnicity and geographiclocation based on survey data from Round 3 of the Afrobarometer Survey. Data are aggregatedfrom survey data along all borders between segmentary lineage and non-segmentary lineage soci-eties. The x-axis reports geographic distance – positive values imply kilometers into the territoriesthat are considered segmentary lineage societies based on the geographic borders between ethnicgroups from Murdock’s Map. Negative values are kilometers into the adjacent non-segmentarylineage society. The y-axis measures the fraction of the Afrobarometer population at each distancethat self identifies as a member of the given boundary’s corresponding segmentary lineage society.
the fraction of the population in a bin that report that they are a member of the segmentary
lineage society of the ethnicity pair and the x-axis is distance in kilometers from the border, with
a positive distance indicating a location within the territory of the segmentary lineage society and
a negative distance indicating a location outside of the territory of the segmentary lineage society.
We can also focus on individual borders to highlight that declared ethnicity changes discon-
tinuously at the border between ethnic groups. Figure A2 in the Appendix shows two examples.
In the first graph, the y-axis reports the fraction of the population in each grid cell that identifies
as Ganda and the dotted line is the border between the Ganda and the Soga. The second graph
reports the fraction of the population in each grid cell that identifies as Sotho, and the dotted line
is the border between the Sotho and the Zulu. In both cases, we observe a discontinuous and
sharp change in self reported ethnicity at Murdock’s ethnic group boundaries.
44
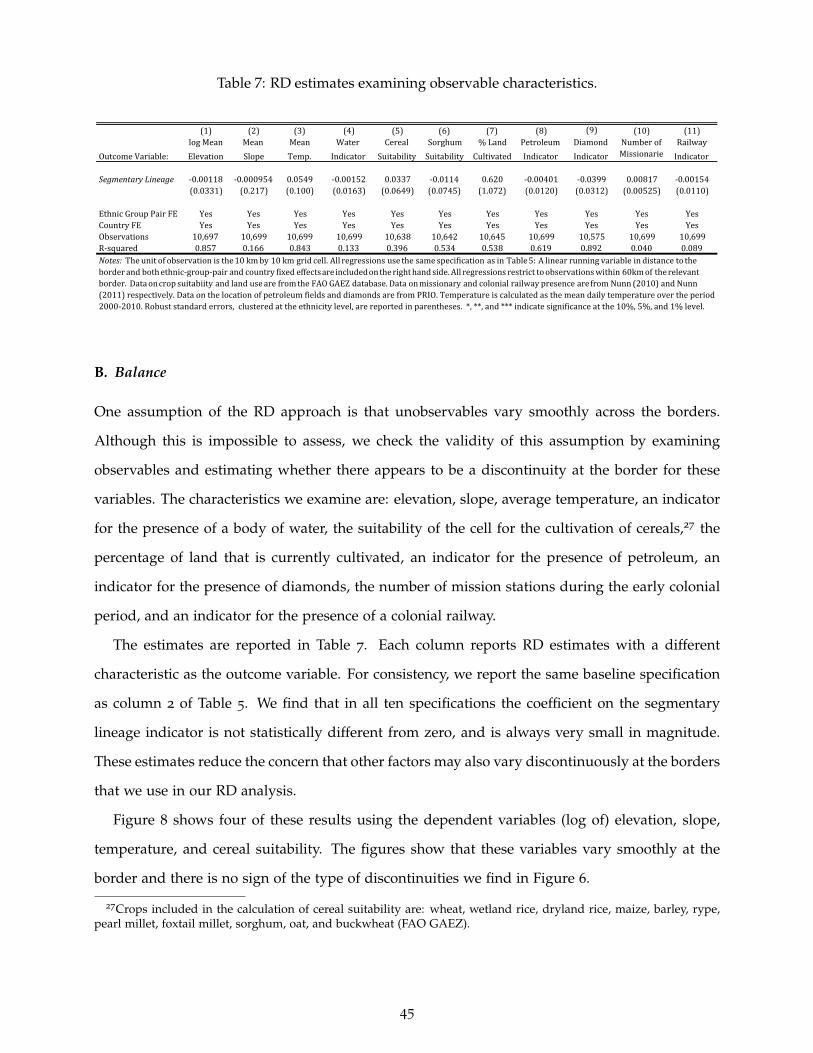
Table 7: RD estimates examining observable characteristics.
(1) (2) (3) (4) (5) (6) (7) (8) (9) (10) (11)
OutcomeVariable:logMeanElevation
MeanSlope
MeanTemp.
WaterIndicator
CerealSuitability
SorghumSuitability
%LandCultivated
PetroleumIndicator
DiamondIndicator
NumberofMissionarie
s
RailwayIndicator
SegmentaryLineage -0.00118 -0.000954 0.0549 -0.00152 0.0337 -0.0114 0.620 -0.00401 -0.0399 0.00817 -0.00154(0.0331) (0.217) (0.100) (0.0163) (0.0649) (0.0745) (1.072) (0.0120) (0.0312) (0.00525) (0.0110)
EthnicGroupPairFE Yes Yes Yes Yes Yes Yes Yes Yes Yes Yes YesCountryFE Yes Yes Yes Yes Yes Yes Yes Yes Yes Yes YesObservations 10,697 10,699 10,699 10,699 10,638 10,642 10,645 10,699 10,575 10,699 10,699R-squared 0.857 0.166 0.843 0.133 0.396 0.534 0.538 0.619 0.892 0.040 0.089Notes: The unit of observation is the10 kmby 10 km grid cell. All regressions use the same specification as in Table5: A linear running variable in distance to theborder and bothethnic-group-pair and country fixed effectsareincludedontherighthand side. All regressions restrict toobservationswithin 60kmof therelevantborder. Dataoncrop suitabiity and land useare fromthe FAO GAEZ database. Data onmissionary and colonial railway presence arefrom Nunn (2010) and Nunn(2011)respectively.DataonthelocationofpetroleumfieldsanddiamondsarefromPRIO.Temperatureiscalculatedasthemeandailytemperatureovertheperiod2000-2010.Robuststandarderrors,clusteredattheethnicitylevel,arereportedinparentheses.*,**,and***indicatesignificanceatthe10%,5%,and1%level.
B. Balance
One assumption of the RD approach is that unobservables vary smoothly across the borders.
Although this is impossible to assess, we check the validity of this assumption by examining
observables and estimating whether there appears to be a discontinuity at the border for these
variables. The characteristics we examine are: elevation, slope, average temperature, an indicator
for the presence of a body of water, the suitability of the cell for the cultivation of cereals,27 the
percentage of land that is currently cultivated, an indicator for the presence of petroleum, an
indicator for the presence of diamonds, the number of mission stations during the early colonial
period, and an indicator for the presence of a colonial railway.
The estimates are reported in Table 7. Each column reports RD estimates with a different
characteristic as the outcome variable. For consistency, we report the same baseline specification
as column 2 of Table 5. We find that in all ten specifications the coefficient on the segmentary
lineage indicator is not statistically different from zero, and is always very small in magnitude.
These estimates reduce the concern that other factors may also vary discontinuously at the borders
that we use in our RD analysis.
Figure 8 shows four of these results using the dependent variables (log of) elevation, slope,
temperature, and cereal suitability. The figures show that these variables vary smoothly at the
border and there is no sign of the type of discontinuities we find in Figure 6.
27Crops included in the calculation of cereal suitability are: wheat, wetland rice, dryland rice, maize, barley, rype,pearl millet, foxtail millet, sorghum, oat, and buckwheat (FAO GAEZ).
45
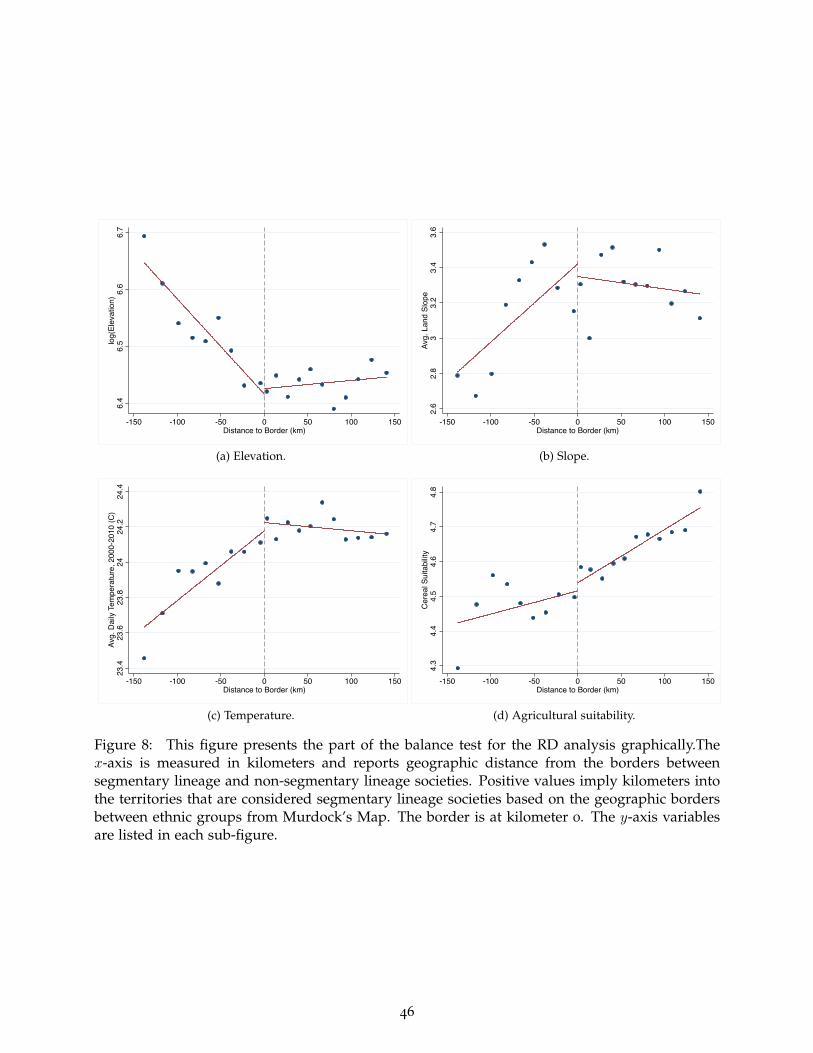
6.4
6.5
6.6
6.7
log(
Elev
atio
n)
-150 -100 -50 0 50 100 150Distance to Border (km)
(a) Elevation.
2.6
2.8
33.
23.
43.
6Av
g. L
and
Slop
e-150 -100 -50 0 50 100 150
Distance to Border (km)
(b) Slope.
23.4
23.6
23.8
2424
.224
.4Av
g. D
aily
Tem
pera
ture
, 200
0-20
10 (C
)
-150 -100 -50 0 50 100 150Distance to Border (km)
(c) Temperature.
4.3
4.4
4.5
4.6
4.7
4.8
Cer
eal S
uita
bilit
y
-150 -100 -50 0 50 100 150Distance to Border (km)
(d) Agricultural suitability.
Figure 8: This figure presents the part of the balance test for the RD analysis graphically.Thex-axis is measured in kilometers and reports geographic distance from the borders betweensegmentary lineage and non-segmentary lineage societies. Positive values imply kilometers intothe territories that are considered segmentary lineage societies based on the geographic bordersbetween ethnic groups from Murdock’s Map. The border is at kilometer 0. The y-axis variablesare listed in each sub-figure.
46
C. Placebo Tests
One concern with our RD estimates is that the estimated differences that we find are due to seg-
mentary lineage being correlated with other ethnicity-level traits that also vary discontinuously
at the border. Thus, the effects we are finding are not really a segmentary lineage effect, but are
really due to some other social or cultural trait.
To check for this possibility by conducting a series of ‘placebo’ estimates. We do this by
defining ethnicities as belonging to treatment and control groups using a range of characteristics
other than segmentary lineage organization. Using this new categorization, we then re-estimate
our RD equation (2). To ensure that the characteristics we are examining are orthogonal to
segmentary lineage, and thus they serve as a true placebo, our sample only includes ethnicity
pairs for which both ethnicities within the pair have the same classification of segmentary lineage
organization.
The result of these placebo RD estimates are reported in Table 8. All specifications are
equivalent to the baseline specification in the main RD (column 2 of Table 5). In columns 1–3,
the outcome variable is the natural log of deadly conflict incidents and in columns 4–6 it is the
natural log of the number of conflict deaths. For both outcomes, we report RD estimates for
grid-cells within 100km, 80km and 60km of the border. Each panel reports estimates with a
different treatment characteristics. In Panel A, we compare adjacent ethnic pairs with the same
segmentary organization coding, but with different levels of jurisdictional hierarchy beyond the
local community. We define the treated ethnicity to be the ethnicity of the pair with more levels
of political authority. We find no estimated effect of this characteristic on conflict. In all six
specifications, the point estimates are small in magnitude and statistically insignificant.
Panel B of Table 8 reports estimates from the exact same procedure as Panel A, except that
we us the measure of an ethnic group’s historical settlement complexity, which is measured on
a 1-8 scale. In the Panel C, we use the first principal component from a factor analysis that
uses the jurisdictional hierarchy measure and the settlement patterns measure. In Panel D, we
use the first principal component from a factor analysis that uses a broader range of historical
variables: levels of jurisdictional hierarchy, settlement patterns, presence of a major city in 1800,
slave exports, population density in 1960, Muslim majority indicator, and ethnic group split by
border indicator.
All estimates from the additional panels are small in magnitude and statistically insignificant.
47
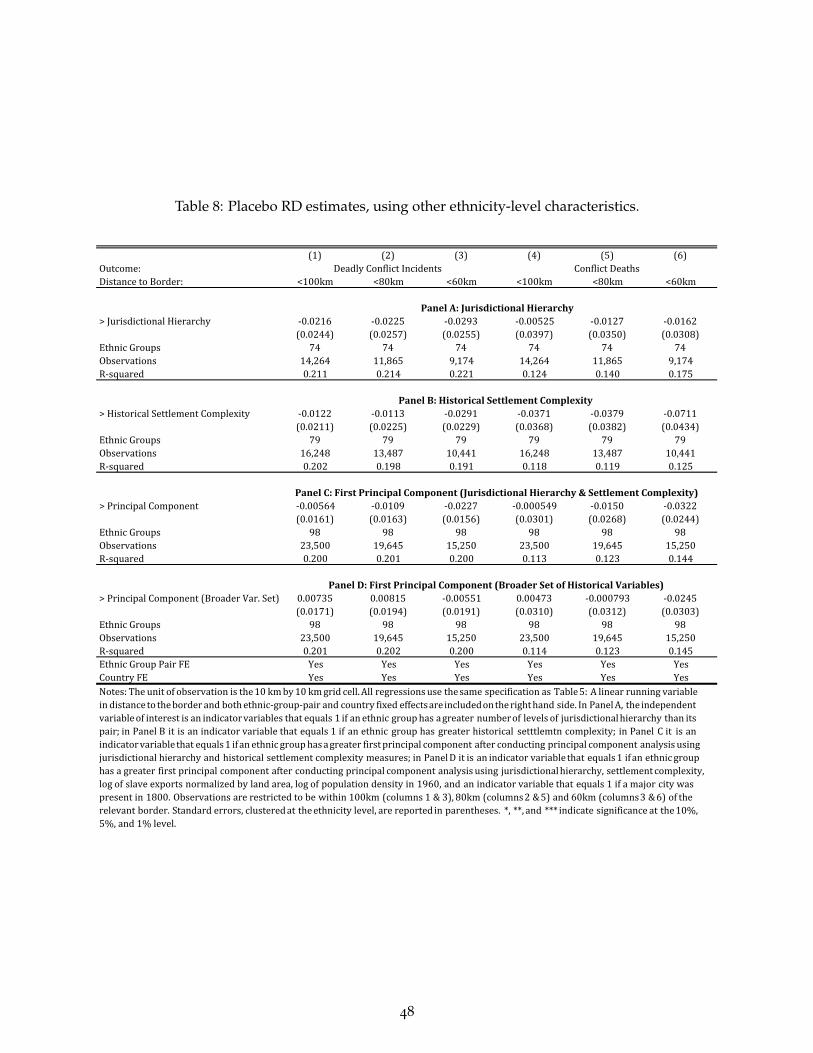
Table 8: Placebo RD estimates, using other ethnicity-level characteristics.
(1) (2) (3) (4) (5) (6)Outcome: DeadlyConflictIncidents ConflictDeathsDistancetoBorder: <100km <80km <60km <100km <80km <60km
PanelA:JurisdictionalHierarchy>JurisdictionalHierarchy -0.0216 -0.0225 -0.0293 -0.00525 -0.0127 -0.0162
(0.0244) (0.0257) (0.0255) (0.0397) (0.0350) (0.0308)EthnicGroups 74 74 74 74 74 74Observations 14,264 11,865 9,174 14,264 11,865 9,174R-squared 0.211 0.214 0.221 0.124 0.140 0.175
PanelB:HistoricalSettlementComplexity>HistoricalSettlementComplexity -0.0122 -0.0113 -0.0291 -0.0371 -0.0379 -0.0711
(0.0211) (0.0225) (0.0229) (0.0368) (0.0382) (0.0434)EthnicGroups 79 79 79 79 79 79Observations 16,248 13,487 10,441 16,248 13,487 10,441R-squared 0.202 0.198 0.191 0.118 0.119 0.125
PanelC:FirstPrincipalComponent(JurisdictionalHierarchy&SettlementComplexity)>PrincipalComponent -0.00564 -0.0109 -0.0227 -0.000549 -0.0150 -0.0322
(0.0161) (0.0163) (0.0156) (0.0301) (0.0268) (0.0244)EthnicGroups 98 98 98 98 98 98Observations 23,500 19,645 15,250 23,500 19,645 15,250R-squared 0.200 0.201 0.200 0.113 0.123 0.144
PanelD:FirstPrincipalComponent(BroaderSetofHistoricalVariables)>PrincipalComponent(BroaderVar.Set) 0.00735 0.00815 -0.00551 0.00473 -0.000793 -0.0245
(0.0171) (0.0194) (0.0191) (0.0310) (0.0312) (0.0303)EthnicGroups 98 98 98 98 98 98Observations 23,500 19,645 15,250 23,500 19,645 15,250R-squared 0.201 0.202 0.200 0.114 0.123 0.145EthnicGroupPairFE Yes Yes Yes Yes Yes YesCountryFE Yes Yes Yes Yes Yes YesNotes: The unit of observation is the10 kmby10 kmgrid cell.All regressionsuse thesame specification as Table5: A linear running variablein distance to theborder and bothethnic-group-pair and country fixed effectsareincludedontherighthand side. In PanelA, the independentvariableof interest is an indicatorvariables that equals 1 if an ethnic grouphas agreater numberof levels of jurisdictionalhierarchy than itspair; in Panel B it is an indicator variable that equals 1 if an ethnic group has greater historical setttlemtn complexity; in Panel C it is anindicatorvariable that equals1 ifan ethnic grouphasagreater firstprincipal component after conducting principal component analysis usingjurisdictional hierarchy and historical settlement complexity measures; in PanelD it is an indicator variable that equals1 ifan ethnic grouphas a greater first principal component after conducting principal component analysis using jurisdictionalhierarchy, settlementcomplexity,log of slave exports normalized by land area, log of population density in 1960, and an indicator variable that equals 1 if a major city waspresent in 1800. Observations are restricted to be within 100km (columns 1 & 3), 80km (columns2 &5) and 60km (columns3 &6) of therelevant border. Standard errors, clusteredat theethnicity level, are reported in parentheses. *, **, and *** indicate significance at the10%,5%,and1%level.
48
Thus, we find no evidence that other historical factors also have impacts on conflict that are
similar to segmentary lineage organization.
6. Mechanisms
A. Onset and Duration
To this point, our findings suggest that segmentary lineage organization causes ethnic groups to
experience greater conflict. This could be either because there are more new conflicts (onsets),
because any conflict that starts last longer (duration), or both. To better understand the reason
behind greater conflict, we estimate hazard models that condition on time invariant covariates.
The estimating equation for conflict onset is:
IOnsete,i,t = βISLe + γ1PeaceDuri,t + γ2PeaceDur2
i,t + γ3PeaceDur3i,t + XeΓ + εe,i,t (3)
e indexes ethnic groups, i episodes of peace, and t years into the episode of peace. IOnsete,i,t equals
one if year t is the onset of conflict (i.e., end of peace). The sample includes all observations (i.e.,
years and ethnic groups) that are ‘at risk’ of conflict onset. In other words, these are observations
for which the last period was one without conflict.
The estimating equation for conflict offset is:
IOffsete,i,t = βISLe + γ1ConflictDuri,t + γ2ConflictDur2
i,t + γ3ConflictDur3i,t + XeΩ + εe,i,t (4)
e indexes ethnic groups, i episodes of conflict, and t years into the conflict episode. IOffsete,i,t equals
one if year t is the end of a conflict episode (i.e., end of conflict). The sample includes all
observations (i.e., years and ethnic groups) that are ‘at risk’ of the offset of conflict. In other
words, these are observations for which the last period was one with conflict.
The estimation uses the conditional hazard, λit = limh→0Pr(t≤Ti<t+h|Ti≥t,X)
h , where Ti denotes
the length, in years, of continued peace or conflict, depending on the specification. We assume
that λit follows a logistic distribution.
Estimates of equations (3) and (4) are reported in Table 9. Column 1–3 report estimates of
equation (3), while columns 4–6 report estimates of equation (4). In all specifications we include
a third degree polynomial in duration, allowing the effect of duration to vary flexibly. The
specification reported in columns 1 and 4 only include the duration polynomial. In columns
49
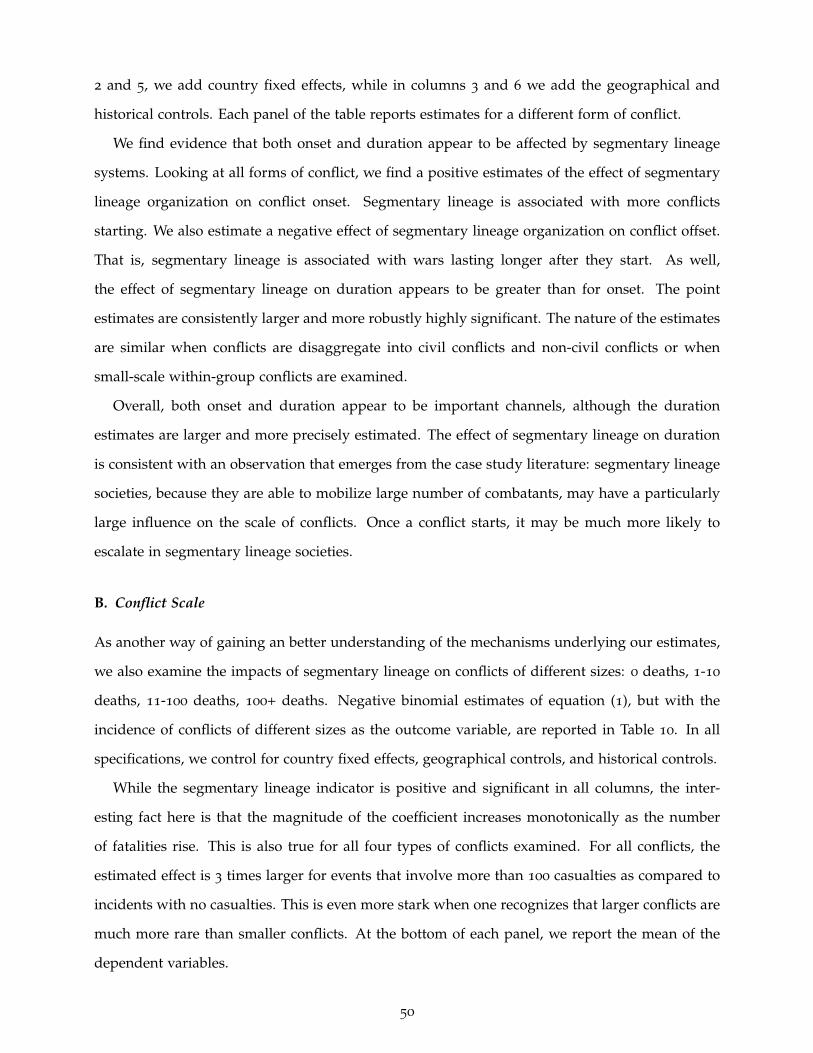
2 and 5, we add country fixed effects, while in columns 3 and 6 we add the geographical and
historical controls. Each panel of the table reports estimates for a different form of conflict.
We find evidence that both onset and duration appear to be affected by segmentary lineage
systems. Looking at all forms of conflict, we find a positive estimates of the effect of segmentary
lineage organization on conflict onset. Segmentary lineage is associated with more conflicts
starting. We also estimate a negative effect of segmentary lineage organization on conflict offset.
That is, segmentary lineage is associated with wars lasting longer after they start. As well,
the effect of segmentary lineage on duration appears to be greater than for onset. The point
estimates are consistently larger and more robustly highly significant. The nature of the estimates
are similar when conflicts are disaggregate into civil conflicts and non-civil conflicts or when
small-scale within-group conflicts are examined.
Overall, both onset and duration appear to be important channels, although the duration
estimates are larger and more precisely estimated. The effect of segmentary lineage on duration
is consistent with an observation that emerges from the case study literature: segmentary lineage
societies, because they are able to mobilize large number of combatants, may have a particularly
large influence on the scale of conflicts. Once a conflict starts, it may be much more likely to
escalate in segmentary lineage societies.
B. Conflict Scale
As another way of gaining an better understanding of the mechanisms underlying our estimates,
we also examine the impacts of segmentary lineage on conflicts of different sizes: 0 deaths, 1-10
deaths, 11-100 deaths, 100+ deaths. Negative binomial estimates of equation (1), but with the
incidence of conflicts of different sizes as the outcome variable, are reported in Table 10. In all
specifications, we control for country fixed effects, geographical controls, and historical controls.
While the segmentary lineage indicator is positive and significant in all columns, the inter-
esting fact here is that the magnitude of the coefficient increases monotonically as the number
of fatalities rise. This is also true for all four types of conflicts examined. For all conflicts, the
estimated effect is 3 times larger for events that involve more than 100 casualties as compared to
incidents with no casualties. This is even more stark when one recognizes that larger conflicts are
much more rare than smaller conflicts. At the bottom of each panel, we report the mean of the
dependent variables.
50
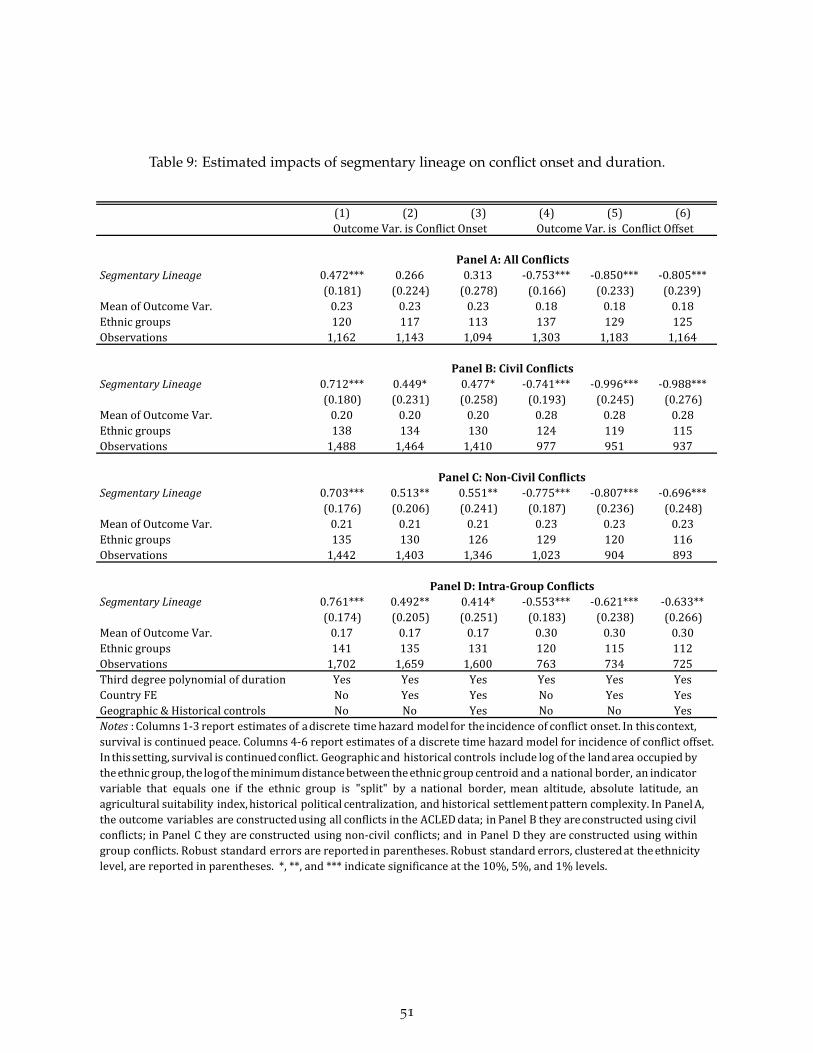
Table 9: Estimated impacts of segmentary lineage on conflict onset and duration.
(1) (2) (3) (4) (5) (6)OutcomeVar.isConflictOnset OutcomeVar.isConflictOffset
PanelA:AllConflictsSegmentaryLineage 0.472*** 0.266 0.313 -0.753*** -0.850*** -0.805***
(0.181) (0.224) (0.278) (0.166) (0.233) (0.239)MeanofOutcomeVar. 0.23 0.23 0.23 0.18 0.18 0.18Ethnicgroups 120 117 113 137 129 125Observations 1,162 1,143 1,094 1,303 1,183 1,164
PanelB:CivilConflictsSegmentaryLineage 0.712*** 0.449* 0.477* -0.741*** -0.996*** -0.988***
(0.180) (0.231) (0.258) (0.193) (0.245) (0.276)MeanofOutcomeVar. 0.20 0.20 0.20 0.28 0.28 0.28Ethnicgroups 138 134 130 124 119 115Observations 1,488 1,464 1,410 977 951 937
PanelC:Non-CivilConflictsSegmentaryLineage 0.703*** 0.513** 0.551** -0.775*** -0.807*** -0.696***
(0.176) (0.206) (0.241) (0.187) (0.236) (0.248)MeanofOutcomeVar. 0.21 0.21 0.21 0.23 0.23 0.23Ethnicgroups 135 130 126 129 120 116Observations 1,442 1,403 1,346 1,023 904 893
PanelD:Intra-GroupConflictsSegmentaryLineage 0.761*** 0.492** 0.414* -0.553*** -0.621*** -0.633**
(0.174) (0.205) (0.251) (0.183) (0.238) (0.266)MeanofOutcomeVar. 0.17 0.17 0.17 0.30 0.30 0.30Ethnicgroups 141 135 131 120 115 112Observations 1,702 1,659 1,600 763 734 725Thirddegreepolynomialofduration Yes Yes Yes Yes Yes YesCountryFE No Yes Yes No Yes YesGeographic&Historicalcontrols No No Yes No No YesNotes : Columns 1-3 report estimates of adiscrete time hazard model for the incidence of conflict onset. In thiscontext,survivaliscontinuedpeace.Columns4-6reportestimatesofadiscretetimehazardmodelforincidenceofconflictoffset.In thissetting, survival is continuedconflict. Geographic and historical controls include log of the landarea occupied bytheethnic group, the logof theminimumdistancebetweentheethnic group centroid and a national border, an indicatorvariable that equals one if the ethnic group is "split" by a national border, mean altitude, absolute latitude, anagricultural suitability index,historical political centralization, and historical settlementpattern complexity. In PanelA,the outcome variables are constructedusing all conflicts in the ACLEDdata; in Panel B they areconstructed using civilconflicts; in Panel C they are constructed using non-civil conflicts; and in Panel D they are constructed using withingroup conflicts. Robust standard errors are reported in parentheses. Robust standard errors, clusteredat theethnicitylevel,arereportedinparentheses.*,**,and***indicatesignificanceatthe10%,5%,and1%levels.
51
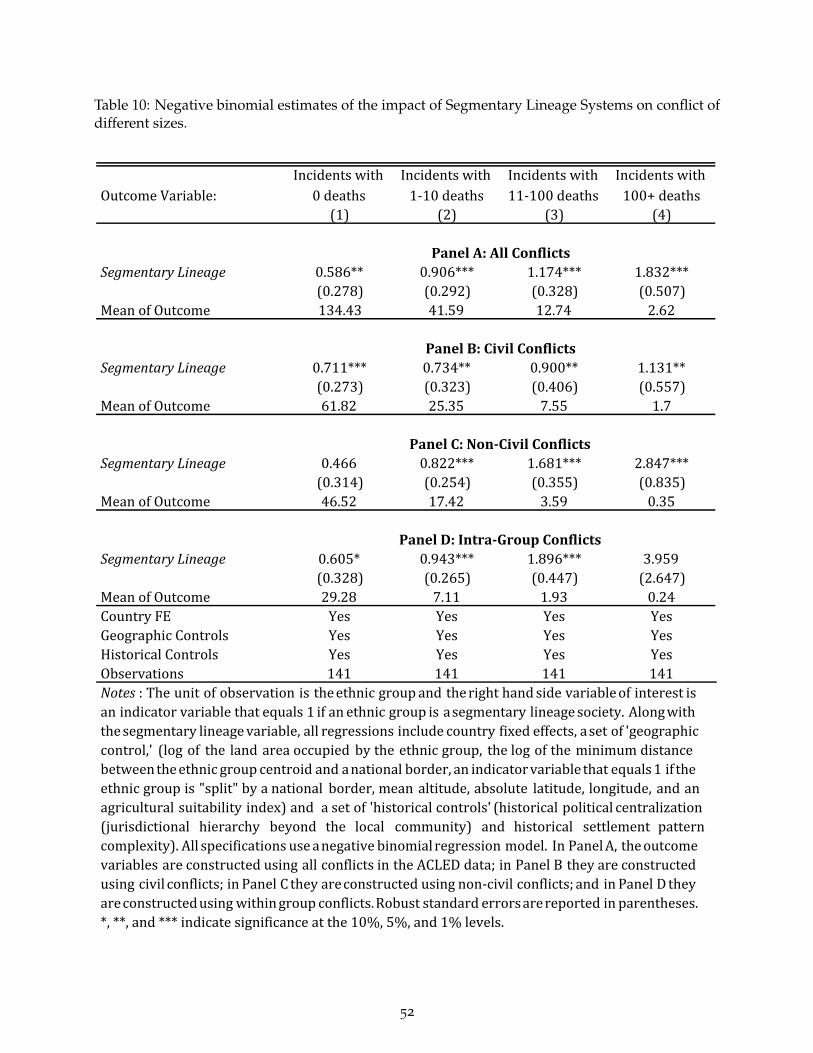
Table 10: Negative binomial estimates of the impact of Segmentary Lineage Systems on conflict ofdifferent sizes.
OutcomeVariable:Incidentswith0deaths
Incidentswith1-10deaths
Incidentswith11-100deaths
Incidentswith100+deaths
(1) (2) (3) (4)
PanelA:AllConflictsSegmentaryLineage 0.586** 0.906*** 1.174*** 1.832***
(0.278) (0.292) (0.328) (0.507)MeanofOutcome 134.43 41.59 12.74 2.62
PanelB:CivilConflictsSegmentaryLineage 0.711*** 0.734** 0.900** 1.131**
(0.273) (0.323) (0.406) (0.557)MeanofOutcome 61.82 25.35 7.55 1.7
PanelC:Non-CivilConflictsSegmentaryLineage 0.466 0.822*** 1.681*** 2.847***
(0.314) (0.254) (0.355) (0.835)MeanofOutcome 46.52 17.42 3.59 0.35
PanelD:Intra-GroupConflictsSegmentaryLineage 0.605* 0.943*** 1.896*** 3.959
(0.328) (0.265) (0.447) (2.647)MeanofOutcome 29.28 7.11 1.93 0.24CountryFE Yes Yes Yes YesGeographicControls Yes Yes Yes YesHistoricalControls Yes Yes Yes YesObservations 141 141 141 141Notes : The unit of observation is theethnic groupand theright hand side variableof interest isan indicator variable that equals 1 if an ethnic group is asegmentary lineagesociety. Alongwiththesegmentary lineagevariable, all regressions include country fixed effects, aset of 'geographiccontrol,' (log of the land area occupied by the ethnic group, the log of the minimum distancebetweentheethnic group centroid and anational border, an indicatorvariable that equals1 if theethnic group is "split" by a national border, mean altitude, absolute latitude, longitude, and anagricultural suitability index) and a set of 'historical controls' (historical political centralization(jurisdictional hierarchy beyond the local community) and historical settlement patterncomplexity). All specifications useanegative binomialregression model. In PanelA, theoutcomevariables are constructed using all conflicts in the ACLED data; in Panel B they are constructedusing civil conflicts; in Panel C they areconstructed using non-civil conflicts; and in Panel D theyareconstructedusingwithingroup conflicts.Robust standard errorsarereported in parentheses.*,**,and***indicatesignificanceatthe10%,5%,and1%levels.
52
These findings are consistent with the large and robust estimates of the impact of segmentary
lineage on duration. Taken together, the estimates suggest that segmentary lineage is associated
with the presence of larger wars that also last longer.
7. Conclusions
In this paper we have proposed and tested an original theory about the incidence and intensity
of conflict. Though existing theories have emphasized various types of factors which influence
the intensity of ‘greed’ and ‘grievance’ and factors like state capacity or ‘rough terrain,’ which
influence the probability of success once a civil war is launched, many unresolved puzzles remain.
Perhaps the most obvious is why some groups, once they decide to launch an armed conflict, are
much more successful at recruiting armed men and mobilizing forces than others. It is hard
to imagine, for example, that the success of Boko Haram in Northern Nigeria can simply be
attributed to the extent of greed and grievances. Certainly the Nigerian state lacks capacity, but it
does so everywhere, not just in the North. Indubitably there is greed in Nigeria and perhaps the
incentive to mobilize is due to the prospect of grabbing oil rents. But the oil is in the South, not
in the North. No doubt also the North has legitimate grievances, but one can imagine that such
grievances are widespread in Nigeria. Why then has the rebellion in the North attracted so many
followers?
We have argued that one missing element in such a puzzle may be the social structure of the
societies involved. Boko Haram has recruited primarily from the Kanuri people who historically
constituted what anthropologists call a segmentary lineage society. An ethnographic literature
suggests that such societies were able to organize large numbers of men for warfare, against other
segments in the same society and also against other societies. Though the idea that such societies
are prone to conflict and violence for this reason could be dated to the work of Evans-Pritchard
in the 1930s, and particularly to Sahlins (1961), to our knowledge it has never been systematically
investigated before econometrically.
That there is a connection between segmentary lineage societies and Boko Haram has been ar-
gued by Akbar Ahmed who argues that they actively recruit where segmentary lineage structures
are most prominent. Ahmed avers:
“Over the previous three years, the group popularly known as Boko Haram had
53
struck fear into Nigerians with its ferocious attacks on both government and civilian
targets. . . The group was dominated by the historically segmentary lineage Kanuri
people, who previously had their own independent kingdom until British colonial-
ism. . . [Later], the group began to recruit other ethnic groups, such as the Fulani,
another segmentary lineage people in northern Nigeria. The first suicide bomber in
Nigerian history, who Boko Haram announced was Fulani, blew himself up in the
national police headquarters in Abuja in June 2011” (2014, p. 129).
To investigate these ideas, we coded from ethnographic sources for 145 African societies
whether or not segmentary lineage organization was present historically. These data come
primarily from ethnographic accounts recorded during the first half of the 20th century. Thus,
to believe that this is important for conflict today it must be that such historical social structures
still shape African society. Though this is our working hypothesis and consistent with a great
deal of recent research, it is a topic that clearly needs to be further studied. Our results show that
indeed segmentary lineage societies are significantly more conflict prone: They have more conflict
incidence, more conflict deaths, and longer conflict duration than societies that are not organized
in this way. These patterns hold if we restrict the analysis to only civil conflict, non-civil conflict,
or conflicts that are more localized in nature.
First, we demonstrate that there is a robust cross-ethnicity relationship between the historical
presence of a segmentary lineage system and measures of conflict today. Second, we restrict our
analysis to pairs of ethnic groups that share a common border, in which one ethnic group was
traditionally organized based on segmentary lineages while the other was not, and estimate the
effect of segmentary lineage organization on conflict using a regression discontinuity approach.
This approach allows us to better control for unobservable factors that change continuously
over space, including geographic and ecological characteristics, historical shocks, or idiosyncratic
trends. Results from the RD approach are qualitatively very similar to results from cross-ethnicity
results.
Case study and historical evidence suggest that a primary mechanism linking segmentary
lineage organization to conflict is that segmentary lineage organization exacerbates existing
conflict, facilitating conflict scale-up and broadening a conflict’s reach. Dovetailing with this
observation, our more subtle empirical results suggest once a conflict starts, if it starts in the
territory of a segmentary lineage society it is much more likely to persist. The relationship
54
between segmentary lineage organization and conflict onset, however, is smaller and less robust.
Separating conflicts based on scale, we find the strongest association between segmentary lineage
organization and conflicts with a a high number of casualties.
All in all our results suggest that social structure may be an important key which can provide
more explanatory power to theories of conflict and civil war.
Though we have conducted our analysis within Africa because of the rich geocoded sub-
national conflict data, the applicability of the ideas we present is not restricted to that continent.
Osama bin Laden and many individuals recruited to Al Qaeda were and are Yemeni, and “Yemeni
tribes in Asir are organized around a segmentary lineage system, with elders and councils, a
spirit of egalitarianism, and a code of honor guiding society that emphasizes courage, loyalty,
hospitality, and revenge” (Ahmed, 2013, p. 110). The same logic of conflict and revenge among
segmentary groups in Somalia and Sudan applies to the Yemeni. According to Dresch, “If a
man from a village in Khamis Abu Dhaybah or Kharif kills someone from Arhab. . . a debt exists
between the two tribes. . . a man’s immediate kin are involved (those who Islamic law recognizes
as always al-dam), but men much further from the particular antagonist may also be drawn in. If
a man from section A of our tribe kills someone from another tribe, that other tribe might perhaps
kill someone in a quite different section of ours, section B ” (Dresch, 1989, pp. 84–85). This group
response to and group responsibility for conflict can cause conflict to persist. The more “distant”
the two individuals who initiate the conflict (by homicide, etc.), the more people are likely to
ultimately be involved.
Understanding segmentary lineage systems is not merely an intellectual exercise or new way
to understand violence in several African countries. It may also shed important light and new
understanding on key international security issues. It is associated not only with local-level
warfare but also with patterns of international conflict, violence, and terrorism. Ahmed points
out a broad correlation between areas of high-intensity Islamist violence and areas where society
is structured based on segmentary lineage organization. In a speech, Ahmed (2013) claimed,
“Here is a correlation for you. Ask yourselves: where are [US] drones most used?
They are really segmentary lineage systems: the Pashtuns in Afghanistan and Pakistan
tribal areas, mainly in Waziristan; among the Somali segmentary lineage system;
the Yemenis’ segmentary lineage system; the Kurds in eastern Turkey, segmentary
lineage system; the Tuareg in West Africa, segmentary lineage system. An immediate
55
correlation. So there is some connection that we can identify. . . Take a look at these
mutant militant groups that are emerging: the TTP (Tehrik-i-Taliban Pakistan), for
example. Where is it coming out of? It’s coming out of a specific tribe, a specific
clan. Al Shabaab: tribal. Tribal: Boko Haram in West Africa. Again, because we tend
to jump on Islam as the explanation for what’s going on, we are missing this whole
tribal basis of the discussion. All of these are coming out of straight segmentary
lineage system backgrounds.”
Salzman extends this reasoning and argues that Islam, at its inception, was structured as an
amalgamation of segmentary lineage societies and was designed to unite these tribes against
outsiders. Salzman argues that the unification of these segmentary societies “was only possible
by extending the basic tribal principle of balanced opposition. This Muhammad did by opposing
the Muslim to the infidel, and the dar al-Islam, the land of Islam and peace, to the dar al-harb,
the land of the infidels and conflict. Balanced opposition was raised to a higher structural level
and the newly Muslim tribes were unified in the face of the infidel enemy” (2007, pp. 137–138).
In this conceptualization, the entire Islamic world comprises the largest tribal segment that is
compelled to unite against any non-Muslim – infidels, the West, or the dar al-harb. For Salzman,
an understanding of segmentary organization becomes crucial to understanding all Islam-fueled
violence.28 The relationship between social structure and violence, which has received little
attention in empirical work, may be a crucial driver of global conflict.
28This logic is moreover not confined to the writing of academic anthropologists. Philip Zeman, a strategist withthe U.S. Marine Corps, has argued that there is a strong relationship between segmentary organization and “terror.”He writes not only that “members of Islamist extremist groups commonly come from societies with strong tribal[segmentary] traditions” but also that there are explicit links between tribal organization and violent extremism(Zeman, 2009, p. 682). For Zeman, there is a national security “need for in-depth understanding of tribal systemsand influences” (ibid.).
56
References
Ahmed, Akbar, The Thistle and the Drone: How America’s War on Terror Became a Global War on TribalIslam, Brookings Institution Press, 2013.
Allen, Tim and Koen Vlassenroot, The Lord’s Resistance Army: Myth and Reality, London: ZedBooks, 2010.
Altonji, Joseph G., Todd E. Elder, and Christopher R. Taber, ““An Evaluation of InstrumentalVariable Strategies for Estimating the Effects of Catholic Schooling,” Journal of Human Resource,2005, 40 (4), 791–821.
Angrist, Joshua D. and Jorn-Steffen Pischke, Mostly Harmless Econometrics, Princeton: PrincetonUniversity Press, 2008.
Ansell, Christopher K. and John F. Padgett, “Robust Action and the Rise of Medici, 1400-1434,”American Journal of Sociology, May 1993, 98 (6), 1259–1319.
Ardener, Edwin, Coastal Bantu of the Cameroons (the Kpe-Mboko, Duala-Limba and Tanga-Yasa groupsof the British and French trusteeship territories of the Cameroons), London: International AfricanInstitute, 1956.
Banfield, Edward C., The Moral Basis of a Backward Society, Glencoe IL: The Free Press, 1958.
Barth, Fredrik, “Descent and Marriage Reconsidered,” in Jack Goody, ed., The Character of Kinship,Cambridge: Cambridge University Press, 1973, pp. 3–19.
Becker, Gary, A Treatise on the Family, Cambridge, MA: Harvard University Press, 1981.
Blattman, Christopher and Edward Miguel, “Civil War,” Journal of Economic Literature, 2010, 48(1), 3–57.
Bo, Ernesto Dal, Pedro Dal Bo, and Jason Snyder, “Political Dynasties,” Review of EconomicStudies, 2009, 76 (1), 115–142.
Bohannon, Laura, “Political Aspects of Tiv Social Organization,” in John Middleton and DavidTait, eds., Tribes Without Rulers, London: Routledge Keegan & Paul, 1958, pp. 33–67.
Butt, Audrey J., The Nilotes of the Anglo-Egyptian Sudan and Uganda, London: International AfricanInstitute, 1952.
Carsten, Janet, After Kinship, New York: Cambridge University Press, 2003.
Cederman, Lars-Erik, Kristian Skrede Gleditsch, and Halvard Buhaug, Inequality, Grievances,and Civil War, New York: Cambridge University Press, 2013.
Ciccone, Antonio, “Estimating the Effects of Transitory Income Shocks on Civil Conflict,” Reviewof Economics and Institutions, 2013, 4 (2), 1–14.
Collier, Paul and Nicholas Sambanis, Understanding Civil War: Evidence andAnalysis, Vol. 1-Africa,Washington:, Washington: World Bank Publications, 2005.
and , Understanding Civil War: Evidence andAnalysis, Vol. 1-Africa, Washington:, Washington:World Bank Publications, 2005.
57
Colson, Elizabeth, “The Plateau Tonga of Northern Rhodesia,” in Elizabeth Colson and MaxGluckman, eds., Seven Tribes of British Central Africa, New York: Oxford University Press, 1951,pp. 94–102.
Combs-Schilling, M. Elaine, “Family and Friend in a Moroccan Boom Town: The SegmentaryDebate Reconsidered,” American Ethnologist, 1985, 12 (4), 659–675.
Crost, Benjamin, Joseph Felter, and Patrick Johnston, “Aid under Fire: Development Projectsand Civil Conflict,” American Economic Review, 2014, 104 (6), 1833–1856.
Cruz, Cesi, Julien Labonne, and Pablo Querubin, “Politician family networks and electoraloutcomes: Evidence from the Philippines,” 2015. Mimeo.
Debos, Mariella, “Living by the Gun in Chad: Armed Violence as a Practical Occupation,” Journalof Modern African Studies, 2011, 49 (3), 409–428.
Debos, Marielle, Living by the Gun in Chad, London: Zed Books, 2016.
Dell, Melissa, “The Persistent Effect of Peru’s Mining Mita,” Econometrica, 2010, 78 (6), 1863–1903.
Depetris-Chauvin, Emilio, “State History and Contemporary Conflict: Evidence from Sub-Saharan Africa,” 2014. Mimeo, Brown University 2679594.
Djankov, Simeon and Marta Reynal-Querol, “Poverty and Civil Wars: Revisiting the Evidence,”Review of Economics and Statistics, 2010, 92 (4), 1035–1041.
Douglas, Mary, The Lele of Kasai, London: International African Institute, 1963.
Dresch, Paul, Tribes, Government and History in Yemen, New York: Oxford University Press, 1989.
Dube, Oeindrila and Juan F. Vargas, “Commodity Price Shocks and Civil Conflict: Evidencefrom Colombia,” Review of Economic Studies, 2013, 80 (4), 1384–1421.
Dunning, Thad and Lauren Harrison, “Cross-Cutting Cleavages and Ethnic Voting: An Experi-mental Study of Cousinage in Mali,” American Political Science Review, 2010, 104 (1), 21–39.
Eldredge, Elizabeth A., Creation of the Zulu Kingdom, 1815-1828: War, Shaka, and the Consolidationof Power, New York: Cambridge University Press, 2014.
Esteban, Joan, Laura Mayoral, and Debraj Ray, “Ethnicity and Conflict: An Empirical Study,”American Economic Review, 2012, 102 (4), 1310–1342.
Evans-Pritchard, E. E., The Nuer, Oxford: Clarendon, 1940.
, “The Nuer of Southern Sudan,” in E. E. Evans-Pritchard and Meyer Fortes, eds., AfricanPolitical Systems, New York: Oxford University Press, 1940, pp. 272–297.
and Meyer Fortes, “Introduction,” in E. E. Evans-Pritchard and Meyer Fortes, eds., AfricanPolitical Systems, New York: Oxford University Press, 1940, pp. 1–25.
Fearon, James D. and David D. Laitin, “Ethinicity, Insurgency, and Civil War,” American PoliticalScience Review, 2003, 97 (1), 75–90.
Ferrara, Eliana La, “Descent Rules and Strategic Transfers. Evidence from Matrilineal Groups inGhana,” Journal of Development Economics, 2007, 83 (2), 280–301.
58
Forde, Daryll, “The Conditions of Social Development in West Africa: Retrospect and Prospect,”Civilisations, 1953, 3 (4), 471–489.
, “Ecology and Social Structure,” Proceedings of the Royal Anthropological Institute of Great Britainand Ireland, 1970, pp. 15–29.
Fortes, Meyer, “The Structure of Unilineal Descent Groups,” American Anthropologist, 1953, 55 (1),17–41.
Gelman, A. and G. Imbens, “Why High-order Polynomials Should not be Used in RegressionDiscontinuity Designs,” 2014. Working Paper No. 20405, National Bureau of Economic Re-search.
Gennaioli, Nicola and Ilia Rainer, “The Modern Impact of Precolonial Centralization in Africa,”Journal of Economic Growth, 2007, 12 (3), 185–234.
Gleditsch, Kristian Skrede and Andrea Ruggeri, “Political Opportunity Structures, Democracy,and Civil War,” Journal of Peace Research, 2010, 47 (3), 299–310.
Gluckman, Max, “The Kingdom of the Zulu in South Africa,” in E. E. Evans-Pritchard and MeyerForter, eds., African Political Systems, New York: Oxford University Press, 1940, pp. 25–55.
, “Kinship and Marriage among the Lozi of Northern Rhodesia and the Zulu of Natal,” inA. R. Radcliffe-Brown and Daryll Forde, eds., African Systems of Kinship, New York: OxfordUniversity Press, 1950, pp. 166–206.
, “The Lozi of Barotseland in North-Western Rhodesia,” in Elizabeth Colson and Max Gluck-man, eds., Seven Tribes of British Central Africa, New York: Oxford University Press, 1951,pp. 1–93.
Gneezy, Uri, Kenneth L. Leonard, and John A. List, “Gender Differences in Competition:Evidence from a Matrilineal and a Patriarchichal Society,” Econometrica, 2009, 77 (5), 1637–1664.
Greif, Avner, “Cultural Beliefs and the Organization of Society: A Historical and TheoreticalReflection on Collectivist and Individualist Societies,” Journal of Political Economy, 1994, 102 (5),912–950.
and Guido Tabellini, “Cultural and Institutional Bifurcation: China and Europe Compared,”American Economic Review, 2010, 100 (2), 135–140.
Hamilton, W.D., “The Evolution of Altruistic Behavior,” American Naturalist, 1963, 97 (896), 354–356.
Henderson, J. Vernon, Adam Storeygard, and David N. Weil, “Measuring Economic Growthfrom Outer Space,” American Economic Review, 2012, 102 (2), 994–1028.
Henrich, Natalie and Joseph Henrich, Why Humans Cooperate, New York: Oxford UniversityPress, 2007.
Hoehne, Markus V., Between Somaliland and Puntland: Marginalization, Militarization and ConflictingPolitical Visions, London: Rift Valley Institute, 2015.
Hoffman, Danny, The War Machines: Young Men and Violence in Sierra Leone and Liberia, Durham,NC: Duke University Press, 2011.
59
Humphries, Macartan and Jeremy Weinstein, “Who Fights? The Determinants of Participationin Civil War,” American Journal of Political Science, 2008, 52 (2), 436–455.
Kelly, Raymond C., “A Note on Nuer Segmentary Organization,” American Anthropologist, 1983,85 (4), 905–906.
, The Nuer Conquest: The Structure and Development of an Expansionist System, Ann Arbor:University of Michigan Press, 1985.
Kuper, Adam, “Lineage Theory: A Critical Retrospect,” Annual Review of Anthropology, 1982, 11,71–95.
, Anthropology and Anthropologists: The British School in the Twentieth Century 4th Edition, NewYork: Routledge, 2014.
Kurimoto, Eisei and Simon Simonse, Conflict, Age and Power in North East Africa: Age Systems inTransition, Oxford: James Currey, 1998.
Lewis, Ioan M., “The Ogaden and the Fragility of Somali Segmentary Nationalism,” AfricanAffairs, 1989, 88 (353), 573–579.
, Blood and Bone: The Call of Kinship in Somali Society, Trenton: The Red Sea Press, 1994.
Lienhardt, Godfrey, “The Western Dinka,” in John Middleton and David Tait, eds., Tribes WithoutRulers, London: Routledge Keegan & Paul, 1958, pp. 97–136.
Lowes, Sara, “Kinship Systems, Gender Norms, and Household Bargaining: Evidence from theMatrilineal Belt,” 2016. Working paper, Harvard University.
Lowie, Robert H., Primitive Society, New York: Liveright, 1921.
Massing, Andreas, The Economic Anthropology of the Kru, Frankfurt: Studien zur Kulturkunde,1980.
McGovern, Michael, Making War in the Cote d’Ivoire, Chicago: University of Chicago Press, 2011.
Michalopoulos, Stelios and Elias Papaioannou, “Precolonial Ethnic Institutions and Contempo-rary African Development,” Econometrica, 2013, 81 (1), 113–152.
and , “The Long-Run Effects of the Scramble for Africa,” American Economic Review, 2016,106 (7), 1802–48.
Middleton, John and David Tait, “Introduction,” in John Middleton and David Tait, eds., TribesWithout Rulers, London: Routledge Keegan & Paul, 1958, pp. 1–32.
Miguel, Edward, Shanker Satyanath, and Sebastian Saiegh, “Economic Shocks and Civil Con-flict: An Instrumental Variables Approach,” Journal of Political Economy, 2004, 112 (4), 725–753.
Montalvo, Jose and Marta Reynal-Querol, “Ethnic Polarization, Potential Conflict, and CivilWars,” American Economic Review, 2005, 95 (3), 796–816.
Murdock, George Peter, Africa: Its Peoples and Their Cultural History, New York: McGraw-HillBook Company, 1959.
Naidu, Suresh, James A. Robinson, and Lauren Young, “Social Origins of Dictatorship: Theoryand Application to Haiti,” 2015. Mimeo, Columbia University.
60
Nunn, Nathan, “The Long-Term Effects of Africa’s Slave Trades,” Quarterly Journal of Economics,2008, 123 (1), 139–176.
and Leonard Wantchekon, “The Slave Trade and Origins of Mistrust in Africa,” AmericanEconomic Review, 2011, 101 (7), 3221–3252.
and Nancy Qian, “US Food Aid and Civil Conflict,” American Economic Review, 2014, 104 (6),1630–1666.
Oster, Emily, “Unobservable Selection and Coefficient Stability: Theory and Evidence,” 2014.Mimeo, University of Chicago Booth School of Business.
Querubín, Pablo, “Family and Politics: Dynastic Persistence in the Philippines,” Quarterly Journalof Political Science, 2016, 11 (2), 151–181.
Radcliffe-Brown, A. R., “Introduction,” in A. R. Radcliffe-Brown and Daryll Forde, eds., AfricanSystems of Kinship and Marriage, 1950: Oxford University Press, 1950, pp. 1–60.
Ree, Joppe De and Eleonora Nillesen, “The Impact of Foreign Aid on the Risk of Civil Conflictin Sub-Saharan Africa,” Journal of Development Economics, 2009, 88 (2), 301–313.
Richards, Audrey I., “Some Types of Family Structure amongs the Central Bantu,” in A.R.Radcliffe and Daryll Forde, eds., African Systems of Kinship and Marriage, New York: OxfordUniversity Press, 1950.
Richards, Paul, Fighting for the Rain Forest: War Youth and Resources in Sierra Leone, New York:Heinemann, 1996.
Robinson, James A., “Social Identity, Inequality and Conflict,” Economics of Governance, 2001, 2,85–99.
Ross, Michael L., “What Do We Know About Natural Resources and Civil War?,” Journal of PeaceResearch, 2004, 41 (3), 337–356.
, “A Closer Look at Oil, Diamonds and Civil War,” Annual Review of Political Science, 2006, 9,265–300.
Rouch, Jean, Les Songhay, Paris: L’Harmattan, 1954.
Sahlins, Marshall D., “The Segmentary Lineage: An Organization of Predatory Expansion,”American Anthropologist, 1961, 63 (2), 322–345.
, What kinship is–And is Not, Chicago: University of Chicago Press, 2013.
Salzman, Philip C., “Ideoogy and Change in Middle Eastern Tribal Societies,” Man, 1978, 13 (4),618–637.
, Culture and Conflict in the Middle East, New York: Prometheus Books, 2007.
Schneider, David M., A Critique of the Study of Kinship, Ann Arbor: University of Michigan Press,1984.
Southall, Aidan, Alur Society: A Study in Processes and Types of Domination, Cambridge: W. Hefferand Sons Ltd., 1956.
Stearns, Jason, Raia Mutomboki: The Flawed Peace Process in the DRC and the Birth of an ArmedFranchise, London: Rift Valley Institute, 2013.
61

Terretta, Meredith, Nation of Outlaws, State of Violence: Nationalism, Grassfields Tradition, and StateBuilding in Cameroon, Athens: Ohio University Press, 2013.
Verdon, Michel, “Where Have All Their Lineages Gone?,” American Anthropologist, 1982, 84 (3),566–579.
Weinstein, Jeremy M., Inside Rebellion: The Politics of Insurgent Violence, New York: CambridgeUniversity Press, 2006.
Wolf, Jan J. De, “Ecology and Conquest: Critical Notes on Kelly’s Model of Nuer Expansion,”Ethnology, 1990, 29 (4), 341–363.
Wood, Elizabeth, Insurgent Collective Action and Civil War in El Salvador, New York: CambridgeUniversity Press, 2003.
Zeman, Phillip M., “Tribalism and Terror: Report from the Field,” Small Wars & Insurgencies,2009, 20 (3–4), 681–709.
62