Social Simulations for Border Security - Krasnow...
6
Social Simulations for Border Security Maciej M. Łatek, Seyed M. Mussavi Rizi, and Andrew Crooks Department of Computational Social Science George Mason University Fairfax, VA 22030 Email: {mlatek, smussavi, acrooks2}@gmu.edu Mark Fraser EADS North America 2550 Wasser Terrace, Suite 9000 Herndon, VA 20171 Email: [email protected] Abstract—EADS North America and George Mason University have partnered to build analytical tools for border security that incorporate social, cultural, behavioral and organizational as- pects of interactions among border security forces, smugglers and the population and represent integrated technology architectures made up of fixed and mobile sensor and surveillance networks. These tools provide critical capabilities that influence border security operations, planning, analysis and training. We present the results of the first sprint of our effort, demonstrating the feasibility of social simulation for the security of the Southwestern U.S. border. First, we recount how we used open-source data on border security forces and smuggling organizations, replicating for 2009 the landscape of gateway organizations and cartels in Sonora along with the border security architecture for the Tuscon sector of Customs and Border Patrol (CBP). We then describe the architecture of the model that connects a disaggregated view of these organizations to a high-fidelity representation of the physical environment and sensor networks. Finally, we conclude with a short discussion of model dynamics, validity and generalizability of our approach. Index Terms—border security, social simulation, open-source intelligence, adaptive adversaries, geospatial analysis I. I NTRODUCTION A. Research objectives Legitimate commerce, organized crime, migration and demo- graphic change meet in borderlands. The U.S. experience with border security initiatives indicates that providing sufficient risk mitigation guarantees faces considerable cost and techno- logical challenges, especially when addressing rapidly adapt- ing and increasingly sophisticated opponents like the Mexican drug cartels and their U.S. counterparts [1]–[3]. EADS North America and George Mason University have partnered to respond to this challenge by building the next generation of tools to support border security analytics. These tools incor- porate social, cultural, behavioral and organizational aspects of interactions among border security forces, smugglers and the population into an integrated technology architecture made up of fixed and mobile sensor and surveillance networks. They provide capabilities that influence operations, planning, analysis and training: 1 1 The materials contained herein represent the opinions and views of the authors and should not be construed to be the opinions or views of George Mason University or EADS North America. ECO# 2012–ENA–0508–02–DG. Uncontrolled Unclassified Information (UUI): This documentation does not contain ITAR–controlled data within the definition of ITAR and has been reviewed and approved for release to non-US persons. 1) Creating a unified representation of the border security architectures with organizational, social and policy con- texts. 2) Addressing budgetary challenges by emphasizing cost– benefit and economic spillovers at all levels. 3) Presenting anticipated interactions and reactions of ad- versaries and stakeholders. The tool enables decision makers to derive tactical courses of action that are robust to intelligence failures, forces of nature and adversary disruption and find portfolios of long- term policies, plans, procedures and programs that perform well in uncertain and dynamic environments. B. Challenges to the security of the Southwestern U.S. borders When designing the architecture of the model that serves as the core of our tool, we needed to distinguish challenges that are common to most border security problems from those specific to the U.S.–Mexico border. Firstly, the model should account for regulatory and budgetary realities of securing borders that shape the performance of border security programs to a large extent. Secondly, the model should incorporate local, state and federal law enforcement agencies and other government bodies, businesses and local populations that differ in how they perceive the current situation of the borderland; what it should be, and whether it is converging to what they desire or not. Doing so amounts to turning model building into a process of eliciting and shaping stakeholders’ framing of the problem. Lastly, the model should represent border security organizations in the U.S. and across the border that do not fall under a unified command structure and pursue their own independent ends. The ability to model interagency and international coordination is particularly necessary when building institutions to engender an environment hostile to criminal elements across the border. Issues specific to the U.S.–Mexico border go beyond the enormous geographic, organizational and environmental diver- sity of the border. Narcoinsurgency in Mexico has nurtured an ecosystem of adaptive and increasingly sophisticated adver- saries. Cartels engage in modern influence and psychological operations [4]. They not only seek silence and impunity, but also manage perceptions by various means [5], [6]. Some of these means are designed to shock and intimidate: Beheadings, kidnappings, assassinations and bombings. Others subvert and
Transcript of Social Simulations for Border Security - Krasnow...
Social Simulations for Border Security
Maciej M. Łatek, Seyed M. Mussavi Rizi, and Andrew CrooksDepartment of Computational Social Science
George Mason University
Fairfax, VA 22030
Email: {mlatek, smussavi, acrooks2}@gmu.edu
Mark FraserEADS North America
2550 Wasser Terrace, Suite 9000
Herndon, VA 20171
Email: [email protected]
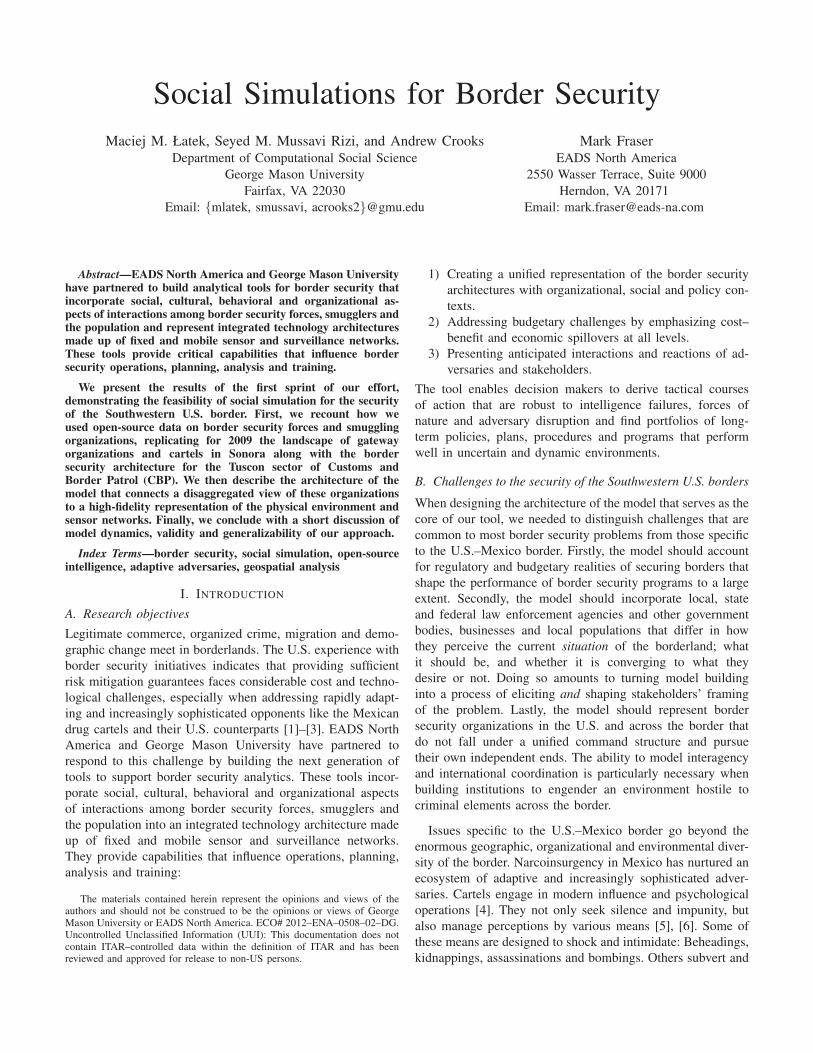
Abstract—EADS North America and George Mason Universityhave partnered to build analytical tools for border security thatincorporate social, cultural, behavioral and organizational as-pects of interactions among border security forces, smugglers andthe population and represent integrated technology architecturesmade up of fixed and mobile sensor and surveillance networks.These tools provide critical capabilities that influence bordersecurity operations, planning, analysis and training.
We present the results of the first sprint of our effort,demonstrating the feasibility of social simulation for the securityof the Southwestern U.S. border. First, we recount how weused open-source data on border security forces and smugglingorganizations, replicating for 2009 the landscape of gatewayorganizations and cartels in Sonora along with the bordersecurity architecture for the Tuscon sector of Customs andBorder Patrol (CBP). We then describe the architecture of themodel that connects a disaggregated view of these organizationsto a high-fidelity representation of the physical environment andsensor networks. Finally, we conclude with a short discussion ofmodel dynamics, validity and generalizability of our approach.
Index Terms—border security, social simulation, open-sourceintelligence, adaptive adversaries, geospatial analysis
I. INTRODUCTION
A. Research objectives
Legitimate commerce, organized crime, migration and demo-
graphic change meet in borderlands. The U.S. experience with
border security initiatives indicates that providing sufficient
risk mitigation guarantees faces considerable cost and techno-
logical challenges, especially when addressing rapidly adapt-
ing and increasingly sophisticated opponents like the Mexican
drug cartels and their U.S. counterparts [1]–[3]. EADS North
America and George Mason University have partnered to
respond to this challenge by building the next generation of
tools to support border security analytics. These tools incor-
porate social, cultural, behavioral and organizational aspects
of interactions among border security forces, smugglers and
the population into an integrated technology architecture made
up of fixed and mobile sensor and surveillance networks.
They provide capabilities that influence operations, planning,
analysis and training:1
1The materials contained herein represent the opinions and views of theauthors and should not be construed to be the opinions or views of GeorgeMason University or EADS North America. ECO# 2012–ENA–0508–02–DG.Uncontrolled Unclassified Information (UUI): This documentation does notcontain ITAR–controlled data within the definition of ITAR and has beenreviewed and approved for release to non-US persons.
1) Creating a unified representation of the border security
architectures with organizational, social and policy con-
texts.
2) Addressing budgetary challenges by emphasizing cost–
benefit and economic spillovers at all levels.
3) Presenting anticipated interactions and reactions of ad-
versaries and stakeholders.
The tool enables decision makers to derive tactical courses
of action that are robust to intelligence failures, forces of
nature and adversary disruption and find portfolios of long-
term policies, plans, procedures and programs that perform
well in uncertain and dynamic environments.
B. Challenges to the security of the Southwestern U.S. borders
When designing the architecture of the model that serves as the
core of our tool, we needed to distinguish challenges that are
common to most border security problems from those specific
to the U.S.–Mexico border. Firstly, the model should account
for regulatory and budgetary realities of securing borders that
shape the performance of border security programs to a large
extent. Secondly, the model should incorporate local, state
and federal law enforcement agencies and other government
bodies, businesses and local populations that differ in how
they perceive the current situation of the borderland; what
it should be, and whether it is converging to what they
desire or not. Doing so amounts to turning model building
into a process of eliciting and shaping stakeholders’ framing
of the problem. Lastly, the model should represent border
security organizations in the U.S. and across the border that
do not fall under a unified command structure and pursue
their own independent ends. The ability to model interagency
and international coordination is particularly necessary when
building institutions to engender an environment hostile to
criminal elements across the border.
Issues specific to the U.S.–Mexico border go beyond the
enormous geographic, organizational and environmental diver-
sity of the border. Narcoinsurgency in Mexico has nurtured an
ecosystem of adaptive and increasingly sophisticated adver-
saries. Cartels engage in modern influence and psychological
operations [4]. They not only seek silence and impunity, but
also manage perceptions by various means [5], [6]. Some of
these means are designed to shock and intimidate: Beheadings,
kidnappings, assassinations and bombings. Others subvert and
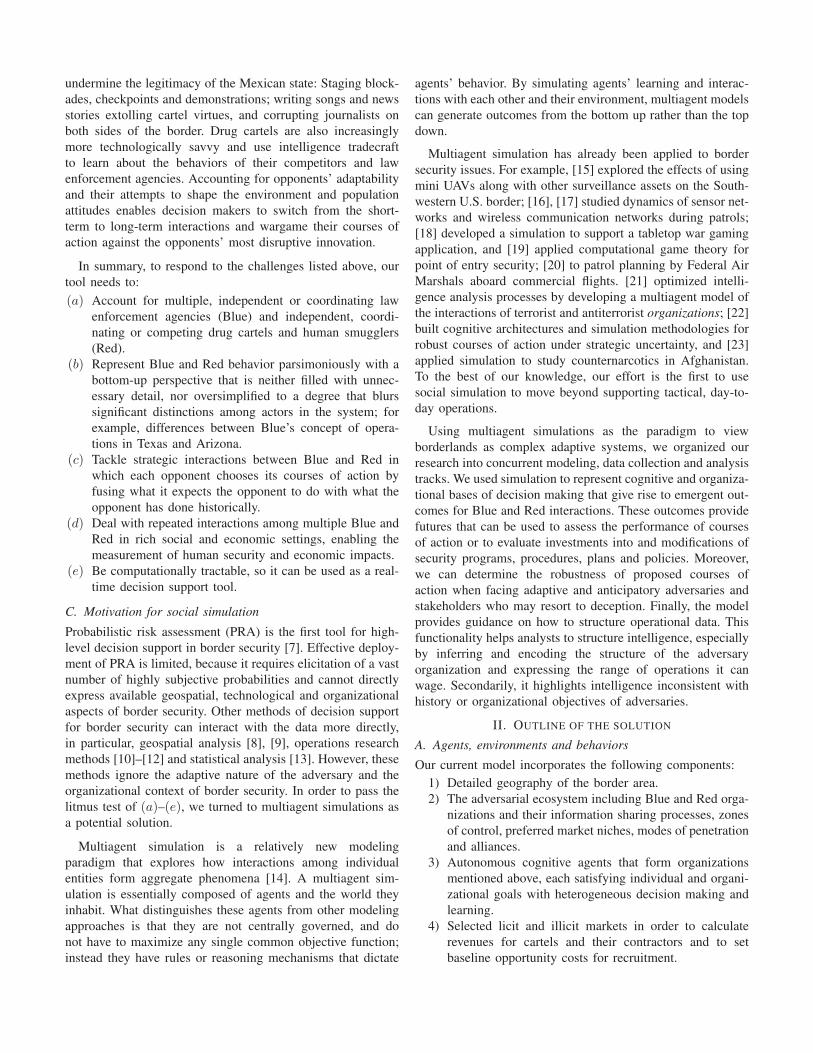
undermine the legitimacy of the Mexican state: Staging block-
ades, checkpoints and demonstrations; writing songs and news
stories extolling cartel virtues, and corrupting journalists on
both sides of the border. Drug cartels are also increasingly
more technologically savvy and use intelligence tradecraft
to learn about the behaviors of their competitors and law
enforcement agencies. Accounting for opponents’ adaptability
and their attempts to shape the environment and population
attitudes enables decision makers to switch from the short-
term to long-term interactions and wargame their courses of
action against the opponents’ most disruptive innovation.
In summary, to respond to the challenges listed above, our
tool needs to:
(a) Account for multiple, independent or coordinating law
enforcement agencies (Blue) and independent, coordi-
nating or competing drug cartels and human smugglers
(Red).
(b) Represent Blue and Red behavior parsimoniously with a
bottom-up perspective that is neither filled with unnec-
essary detail, nor oversimplified to a degree that blurs
significant distinctions among actors in the system; for
example, differences between Blue’s concept of opera-
tions in Texas and Arizona.
(c) Tackle strategic interactions between Blue and Red in
which each opponent chooses its courses of action by
fusing what it expects the opponent to do with what the
opponent has done historically.
(d) Deal with repeated interactions among multiple Blue and
Red in rich social and economic settings, enabling the
measurement of human security and economic impacts.
(e) Be computationally tractable, so it can be used as a real-
time decision support tool.
C. Motivation for social simulation
Probabilistic risk assessment (PRA) is the first tool for high-
level decision support in border security [7]. Effective deploy-
ment of PRA is limited, because it requires elicitation of a vast
number of highly subjective probabilities and cannot directly
express available geospatial, technological and organizational
aspects of border security. Other methods of decision support
for border security can interact with the data more directly,
in particular, geospatial analysis [8], [9], operations research
methods [10]–[12] and statistical analysis [13]. However, these
methods ignore the adaptive nature of the adversary and the
organizational context of border security. In order to pass the
litmus test of (a)–(e), we turned to multiagent simulations as
a potential solution.
Multiagent simulation is a relatively new modeling
paradigm that explores how interactions among individual
entities form aggregate phenomena [14]. A multiagent sim-
ulation is essentially composed of agents and the world they
inhabit. What distinguishes these agents from other modeling
approaches is that they are not centrally governed, and do
not have to maximize any single common objective function;
instead they have rules or reasoning mechanisms that dictate
agents’ behavior. By simulating agents’ learning and interac-
tions with each other and their environment, multiagent models
can generate outcomes from the bottom up rather than the top
down.
Multiagent simulation has already been applied to border
security issues. For example, [15] explored the effects of using
mini UAVs along with other surveillance assets on the South-
western U.S. border; [16], [17] studied dynamics of sensor net-
works and wireless communication networks during patrols;
[18] developed a simulation to support a tabletop war gaming
application, and [19] applied computational game theory for
point of entry security; [20] to patrol planning by Federal Air
Marshals aboard commercial flights. [21] optimized intelli-
gence analysis processes by developing a multiagent model of
the interactions of terrorist and antiterrorist organizations; [22]
built cognitive architectures and simulation methodologies for
robust courses of action under strategic uncertainty, and [23]
applied simulation to study counternarcotics in Afghanistan.
To the best of our knowledge, our effort is the first to use
social simulation to move beyond supporting tactical, day-to-
day operations.
Using multiagent simulations as the paradigm to view
borderlands as complex adaptive systems, we organized our
research into concurrent modeling, data collection and analysis
tracks. We used simulation to represent cognitive and organiza-
tional bases of decision making that give rise to emergent out-
comes for Blue and Red interactions. These outcomes provide
futures that can be used to assess the performance of courses
of action or to evaluate investments into and modifications of
security programs, procedures, plans and policies. Moreover,
we can determine the robustness of proposed courses of
action when facing adaptive and anticipatory adversaries and
stakeholders who may resort to deception. Finally, the model
provides guidance on how to structure operational data. This
functionality helps analysts to structure intelligence, especially
by inferring and encoding the structure of the adversary
organization and expressing the range of operations it can
wage. Secondarily, it highlights intelligence inconsistent with
history or organizational objectives of adversaries.
II. OUTLINE OF THE SOLUTION
A. Agents, environments and behaviors
Our current model incorporates the following components:
1) Detailed geography of the border area.
2) The adversarial ecosystem including Blue and Red orga-
nizations and their information sharing processes, zones
of control, preferred market niches, modes of penetration
and alliances.
3) Autonomous cognitive agents that form organizations
mentioned above, each satisfying individual and organi-
zational goals with heterogeneous decision making and
learning.
4) Selected licit and illicit markets in order to calculate
revenues for cartels and their contractors and to set
baseline opportunity costs for recruitment.

For example, in our simulation Red is divided into cartels,
gateway organizations and individual smugglers. A cartel sup-
plies cargo only to the gateway organizations willing to take
it across the border with the lowest expected cost. A gateway
organization is more complex: It is composed of individuals
driven by greed, fear and personal loyalties; pursues several
goals concurrently; has some idea of who its opponents, com-
petitors, suppliers and buyers are; can share information with
other gateway organizations, and is responsible for recruiting
individual smugglers.
Gateway organizations give smugglers a cargo at a certain
location and provide them with the location of a pick-up point.
Smugglers are free to choose any route that matches their
endurance and time constraints, minimizing their perceived
risk of being detected and intercepted. This risk is a mix
of historical knowledge of areas in which other smugglers
have been caught, the prevalence of Blue patrols observed
by smugglers from the same or allied organizations and
knowledge of fixed sensors and their viewsheds.
B. Data requirements and collection
The key enabler in our model is the data collection process
we designed to support modeling. We collected and collated
past and present patterns of illegal border activities and border
security architectures, and information on the environment
and human terrain and sought to understand individual and
group decision making for the players involved from various
narrative sources.
Environmental data layers came first. Figure 1 outlines the
key input layers for the Arizona–Sonora scenario, covering
both sides of the border: Landcover information, roads and
tracts and terrain roughness derived from terrain relief. We
used these layers to calculate possible routes and time, costs of
traversing each route on foot and on vehicle, and viewsheds for
various sensors. We used information on population density,
night-time lights and land ownership to provide additional in-
puts for the initial phases of the routing problem by smugglers,
and to limit and delay access by Blue patrols. Information
on water sources, intermediary resupply points and potential
shelters is used by smugglers and human traffickers traveling
on foot.
All geospatial layers are subject to significant preprocessing.
A “gluing” process links layers from various sources. For
example, road network and population data layers can be
merged from national geospatial sources such as the Census
Bureau, the U.S. Geological Survey, the Mexican Geogra-
phy and Census Bureau and the International Boundary and
Water Commission, or taken from a unified data source like
OpenStreetMap. Landcover data can be taken from low-
resolution sources with global coverage such as Moderate
Resolution Imaging Spectroradiometer and Advanced Very
High Resolution Radiometer [24] or stitched together from
higher-resolution, but differently encoded national sources.
We gave special treatment to landcover and relief data that
(a) Landcover (b) Terrain relief
(c) Roads and tracts (d) Terrain roughness
(e) Population density (f) Night-time lights
(g) Land ownership (h) Points of interest
Fig. 1. Environmental data layers for Arizona-Sonora scenario.
make modeling perceptions of individuals and mobile sensor
platforms computationally tractable.
Another dataset describes Blue concept of operations. Fig-
ure 2 presents a sample initial border security architecture. The
simulation requires locations, force allocations and rotation
schedules of CBP stations and forward operating bases along
with locations of mobile platforms, integrated fixed towers and
unmanned ground sensors. For the Arizona–Sonora border, we
used openly available information by the CBP Tuscon sector
[25] and environmental impact studies [26]. Collaboration
between Border Patrol and other federal land owners like
the U.S. National Park Service is reportedly far from perfect.
For example, roads and vehicles are not allowed on certain
federal lands alongside the Arizona–Sonora border, keeping
the Border Patrol out while illegal border crossers can use
vehicles, horses and bikes in areas restricted to licit and
governmental traffic [27], [28]. That is why users of our tool
can outline boundaries of responsibility for Blue organizations
and rules for crossing these boundaries on the land ownership
layer.
Fig. 2. Sample Arizona–Sonora border security architecture.
The Red side is described by outlining the initial population
of cartels, gateway organizations and their human and tech-
nical resources. Figure 3 outlines the competitive landscape
of the Arizona–Sonora borderland around 2009. South and
Central American cartels have long used analytical and surveil-
lance technologies for intelligence and counterintelligence. As
reported in [29], in 1996 the Cali cartel used link analysis
on a database of phone records of Cali residents to cross-
reference phone calls among its members and American and
Columbian counternarcotics officials. It managed to detect,
capture and kill at least 12 informants. More recently, [30]
reported that the Mexican cartels have deployed an encrypted
distributed radio network across almost all Mexican states.
At the tactical level, radio traffic monitoring, coordination of
movement and opportunistic use of small UAVs is reportedly
widespread among smugglers [31]. We also included data on
the operational and tactical sophistication of gateway organi-
zations, along with their locations, preference for smuggling
drugs or trafficking humans and border penetration mode2.
Fig. 3. Competitive landscape of cartels and gateway organization of Arizona-Sonora borderland around year 2009. We used this data to initialize cartels andgateway organizations and to set information sharing and contracting limitsamong them.
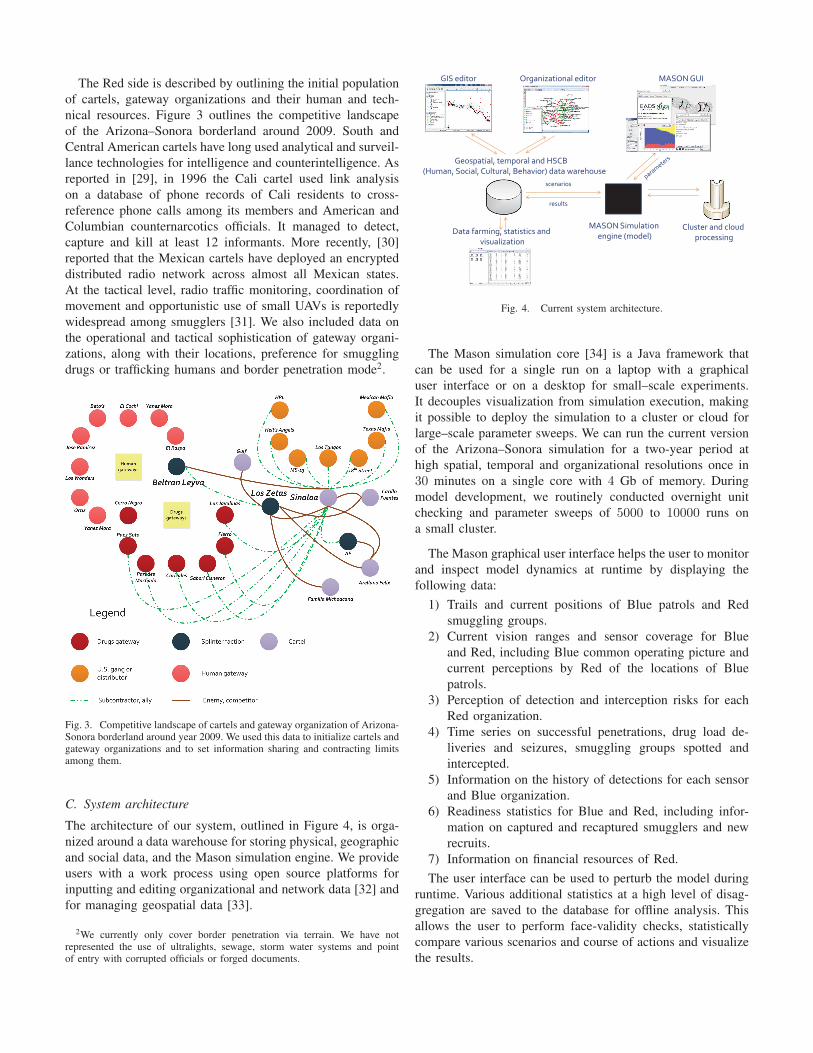
C. System architecture
The architecture of our system, outlined in Figure 4, is orga-
nized around a data warehouse for storing physical, geographic
and social data, and the Mason simulation engine. We provide
users with a work process using open source platforms for
inputting and editing organizational and network data [32] and
for managing geospatial data [33].
2We currently only cover border penetration via terrain. We have notrepresented the use of ultralights, sewage, storm water systems and pointof entry with corrupted officials or forged documents.
GIS editor Organizational editor MASONGUI
Data farming, statistics andvisualization
Cluster and cloudprocessing
Geospatial, temporal and HSCB(Human, Social, Cultural, Behavior) data warehouse
MASONSimulationengine (model)
scenarios
results
Fig. 4. Current system architecture.
The Mason simulation core [34] is a Java framework that
can be used for a single run on a laptop with a graphical
user interface or on a desktop for small–scale experiments.
It decouples visualization from simulation execution, making
it possible to deploy the simulation to a cluster or cloud for
large–scale parameter sweeps. We can run the current version
of the Arizona–Sonora simulation for a two-year period at
high spatial, temporal and organizational resolutions once in
30 minutes on a single core with 4 Gb of memory. During
model development, we routinely conducted overnight unit
checking and parameter sweeps of 5000 to 10000 runs on
a small cluster.
The Mason graphical user interface helps the user to monitor
and inspect model dynamics at runtime by displaying the
following data:
1) Trails and current positions of Blue patrols and Red
smuggling groups.
2) Current vision ranges and sensor coverage for Blue
and Red, including Blue common operating picture and
current perceptions by Red of the locations of Blue
patrols.
3) Perception of detection and interception risks for each
Red organization.
4) Time series on successful penetrations, drug load de-
liveries and seizures, smuggling groups spotted and
intercepted.
5) Information on the history of detections for each sensor
and Blue organization.
6) Readiness statistics for Blue and Red, including infor-
mation on captured and recaptured smugglers and new
recruits.
7) Information on financial resources of Red.
The user interface can be used to perturb the model during
runtime. Various additional statistics at a high level of disag-
gregation are saved to the database for offline analysis. This
allows the user to perform face-validity checks, statistically
compare various scenarios and course of actions and visualize
the results.

III. VALIDITY OF THE SOCIAL SIMULATION APPROACH
We are currently performing initial validation of model out-
puts, investigating qualitative properties of the model and
preparing for quantitative validation. The validation plan fol-
lows the pattern set forth by [35] and includes both verification
or face validation by subject matter expert to determine
conceptual validity, comparisons with reimplementation of
operations research and statistical models and the external
validation against real-world observations at micro and macro
levels. For example, macro-level pattern matching may include
comparing simulated smuggling corridors to ones reported in
the real life. Such a comparison is presented in Figure 5. The
outlines of the real-life corridors have been created by collating
newspaper articles and narratives of routes taken by smugglers
and illegal immigrants that mention geographic features. The
simulated view on Figure 5(b) presents an “ant trail” of recent
smuggling traces after 6 months of simulated interactions.
(a) Approximation of real-life smuggling corridors
(b) Snapshots of the traces of simulated smugglers
Fig. 5. Real-life smuggling corridors and a sample of simulated movementtrails used for face validity and qualitative model checking.
Sparse data exists in open sources on exact routes, their
spatiotemporal variability and results of Red interactions with
Blue. In Figure 6, we present two samples of high-resolution
event data that could constitute desired targets for quantitative
validation: Locations in which bodies of deceased immigrants
were found [36] and locations of seizures of marijuana and
cocaine loads [37]. Unfortunately, neither dataset includes
additional data such as date, amount of drug seized and route
taken. Nevertheless, this and other data we already collected
is sufficient to start the validation process.
IV. FUTURE OUTLOOK
We are working on code hardening and documentation, em-
pirical validation and mechanisms for scenario analysis. We
have expanded data farming and large-scale computational
(a) Deaths
(b) Drug seizures
Fig. 6. Sample data layers for quantitative validation.
experimentation to test assumptions on border security ar-
chitectures, and Blue organizational behavior, force levels
and patrol posture. Large-scale computational experimenta-
tion in our effort is key to capture the uncertainty of the
system; design corresponding robust courses of actions and
portfolios of policies, plans, procedures and programs that
perform well in this uncertain environment, and to estimate
“known unknowns”3 [38]. We are also working on exposing
the simulation the the subject matter experts to obtain better
face validity and follow the validation steps outlined in the
previous section.
In the current version of the model, we do not have
a disaggregated view of the population of the borderland,
representation of points of entry or of the logistics and
economic layers. We will therefore work on representing and
synthesizing the underlying rural and urban population of the
borderland at the individual resolution. We can then develop
a module where the population can perceive the economic
and security effects of interactions between the CBP border
architecture and the activities of the transnational criminal
organizations and local gangs.
Finally, we are working on extending the common ontology
of subsystems and actors, and their objectives, capabilities and
constraints by collecting data on the organizational features
and technological properties of joint border security arrange-
ments. This includes adding new environments like the Carrizo
Cane forests alongside the Rio Grande in Texas, allowing for
riverine operations by Blue and Red. These steps continue
the move our effort toward a comprehensive computational
framework that connects security, economics, and politics
of border security with current and future border security
technologies.
3For example, unobservable or hard-to-collect quantities such as the tonnageof drugs and the number of immigrants that go through the border withoutbeing intercepted or observed at any point.

REFERENCES
[1] D. A. Shirk, “Transnational Crime, U.S. Border Security, and theWar on Drugs in Mexico,” Trans-Border Institute, University of SanDiego, Tech. Rep., March 2011, testimony delivered to the Houseof Representatives Sub-Committee on Oversight, Investigations, andManagement, Chairman: Hon. Michael McCaul.
[2] R. M. Stana, “Preliminary Observations on Border Control Measuresfor the Southwest Border,” United States Government AccountabilityOffice, Tech. Rep., 2011, testimony before the Subcommittee on Borderand Maritime Security, Committee on Homeland Security, House ofRepresentatives.
[3] ——, “DHS Progress and Challenges in Securing the U.S. Southwestand Northern Borders,” United States Government Accountability Of-fice, Tech. Rep., 2011, testimony before the Committee on HomelandSecurity and Governmental Affairs, U.S. Senate.
[4] T. Payan, The Three U.S.-Mexico Border Wars: Drugs, Immigration, andHomeland Security. Praeger Security International, 2006.
[5] M. O’Connor, “Analysis: A PR Department for Mexico’s Narcos,”Global Post, 2010. [Online]. Available: http://www.globalpost.com/dispatch/worldview/101026/mexico-drug-war-cartels-newspapers
[6] J. P. Sullivan. (2010) Cartel Info Ops: Power and Counter-powerin Mexicos Drug War. Center for Advanced Studies on Terrorism.[Online]. Available: http://mountainrunner.us/2010/11/cartel info opspower and counter-power in mexico drug war/#.T568T6tYvOU
[7] Committee to Review the Department of Homeland Security’s Approachto Risk Analysis, Review of the Department of Homeland SecuritysApproach to Risk Analysis. National Research Council of the NationalAcademies, 2010.
[8] N. Stephenne and G. Zeug, “Border Permeability Modelling: TechnicalSpecifications at Global and Local Scale,” European Commission, JointResearch Centre, Institute for the Protection and Security of the Citizen,Tech. Rep., 2010.
[9] D. K. Rossmo, Q. C. Thurman, J. Jamieson, and K. Egan, “GeographicPatterns and Profiling of Illegal Crossings of the Southern U.S. Border,”Security Journal, vol. 21, pp. 29–57, 2008.
[10] G. C. Peter Reuter and J. Cave, “Sealing the Borders: the Effectsof Increased Military Participation in Drug Interdiction,” The RANDCor,,oration, Tech. Rep., 1988.
[11] K. J. Ordez, “Modeling the U.S. Border Patrol Tucson Sector for theDeployment and Operations of Border Security Forces,” Master’s thesis,Naval Postgraduate School, 2006.
[12] Y. Liu, “Mathematical Models in Homeland Security,” Ph.D. disserta-tion, Stanford University, 2006.
[13] B. Roberts, G. Hanson, D. Cornwell, and S. Borger, “An Analysisof Migrant Smuggling Costs along the Southwest Border,” Office ofImmigration Statistics, Department of Homeland Security, Tech. Rep.,2010.
[14] R. L. Axtell, “Why Agents? On the Varied Motivations for AgentComputing in the Social Sciences,” Center on Social Dynamics, TheBrookings Institution, Tech. Rep., 2000.
[15] B. Yildiz, “Exploration of the Use of Unmanned Aerial Vehicles alongwith other Assets to Enhance Border Protection,” Master’s thesis, NavalPostgraduate School, 2009.
[16] E. R. Beeker and E. H. Page, “A Case Study of the Development andUse of a Mana-based Federation for Studying U.S. Border Operations,”in Proceedings of the 2006 Winter Simulation Conference, 2007.
[17] Z. Sun, P. Wang, M. C. Vuran, M. A. Al-Rodhaan, A. M. Al-Dhelaan,and I. F. Akyildiz, “BorderSense: Border Patrol through AdvancedWireless Sensor Networks,” Ad Hoc Networks, vol. 9, pp. 468–477,2011.
[18] D. Djordjevich, “Sandia Researchers Merge Gaming, Sim-ulation Tools to Create Models for Border Security,”Physorg.com News, 2011. [Online]. Available: http://phys.org/news/2011-04-sandia-merge-gaming-simulation-tools.html
[19] M. E. Taylor, C. Kiekintveld, C. Western, and M. Tambe, “A Frameworkfor Evaluating Deployed Security Systems: Is There a Chink in yourARMOR?” Informatica, vol. 29, pp. 129–139, 2010.
[20] J. Tsai, S. Rathi, C. Kiekintveld, F. Ordonez, and M. Tambe, “IRIS -A Tool for Strategic Security Allocation in Transportation Networks,”in Eighth International Joint Conference on Autonomous Agents andMultiagent Systems (Industry Track), 2009.
[21] M. Latek, S. M. M. Rizi, and T. A. Alsheddi, “Optimal Blends of Historyand Intelligence for Robust Antiterrorism Policy,” Journal of HomelandSecurity and Emergency Management, vol. 8, 2011.
[22] M. Latek and S. M. M. Rizi, “Robust Decision Making under StrategicUncertainty in Multiagent Environments,” in Proceedings of AppliedAdversarial Reasoning and Risk Modeling: Papers from the 2011 AAAIWorkshop (WS-11-06), 2011.
[23] A. Geller, S. M. M. Rizi, and M. Latek, “How Corruption BluntsCounternarcotic Policies in Afghanistan: A Multiagent Investigation,”in Proceedings of International Conference on Social Computing,Behavioral-Cultural Modeling and Prediction, 2011.
[24] M. Hansen, R. DeFries, J. Townshend, and R. Sohlberg, “GlobalLand Cover Classification at 1km Resolution Using a Decision TreeClassifier,” International Journal of Remote Sensing, vol. 21, pp. 1331–1365, 2001.
[25] U.S. Border Patrol, Tucson Sector, “Due DiligenceSite Visit Information for Private Industry,” 2007. [On-line]. Available: http://www.findthatfile.com/search-260757-hPDF/download-documents-20060825-25sbinet-tucson.pdf.htm
[26] ——, “Environmental Assessment for the Proposed SBInetTucson West Project: Ajo, Tucson, Casa Grande, Nogales,and Sonoita Stations and Areas Of Operation,” 2009.[Online]. Available: http://azmemory.lib.az.us/cdm4/item viewer.php?CISOROOT=/feddocs&CISOPTR=869&CISOBOX=1&REC=1
[27] M. Shaw, “Arizonas Protected Federal Lands – The Gateway forIllegals,” The Arizonian, 2012.
[28] “Federal Agents Say Environmental Laws Hamper Work,” USA Today,October 2011.
[29] P. Kaihla. (2002) The Technology Secrets of Cocaine Inc. Business2.0. [Online]. Available: http://www.cocaine.org/cokecrime/index.html
[30] S. Ackerman. (2011, December) Radio Zeta: How Mexicos DrugCartels Stay Networked. Wired. [Online]. Available: http://www.wired.com/dangerroom/2011/12/cartel-radio-mexico/
[31] R. Bunker. (2010-2012) Mexican Cartel Tactical, Operational andStrategic Notes. Small Wars Journal. [Online]. Available: http://smallwarsjournal.com/author/robert-bunker?page=1
[32] K. M. Carley, J. Reminga, J. Storrick, and D. Columbus, ORAUsers Guide 2011, Center for the Computational Analysis ofSocial and Organization Systems, 2011. [Online]. Available: http://www.casos.cs.cmu.edu/projects/ora/
[33] Quantum GIS Development Team, Quantum GIS GeographicInformation System, Open Source Geospatial Foundation, 2009.[Online]. Available: http://qgis.osgeo.org
[34] S. Luke, C. Cioffi-Revilla, L. Panait, K. Sullivan, and G. C. Balan,“MASON: A Multiagent Simulation Environment,” Simulation, vol. 81,no. 7, pp. 517–527, 2005.
[35] G. K. Bharathy and B. Silverman, “Validating Agent Based Social Sys-tems Models,” in Proceedings of the 2010 Winter Simulation Conference,2010.
[36] (2010) Migrants Deaths, Rescue Beacons, Water Stations 2000-2010.Humane Borders. [Online]. Available: http://www.humaneborders.org/index-2.html
[37] “The Arizona-Mexico Border: An Update,” Rocky Mountain Informa-tion Network, Tech. Rep., 2010, a special report prepared for Gov. JanBrewer by Rocky Mountain Information Network.
[38] S. C. Bankes, “Tools and Techniques for Developing Policies forComplex and Uncertain Systems,” Proceedings of the National Academyof Sciences, vol. 99, pp. 7263–7266, 2002.