Social Security Administration FY 2016 Strategic Sustainability ... · The Social Security...
57
i Social Security Administration FY 2016 Strategic Sustainability Performance Plan June 30, 2016 Updated 25 August 2016 Point of Contact: Leslie Ford [email protected] 410.594.0111
-
Upload
nguyenkhuong -
Category
Documents
-
view
218 -
download
0
Transcript of Social Security Administration FY 2016 Strategic Sustainability ... · The Social Security...
i
Social Security Administration
FY 2016 Strategic Sustainability Performance Plan
June 30, 2016 Updated 25 August 2016
Point of Contact:
Leslie Ford [email protected]
410.594.0111
ii
Table of Contents
Policy Statement ....................................................................................................................................................... iii
Executive Summary ............................................................................................................................................. ES-1
Size & Scope of Agency Operations .................................................................................................................... ES-6
Agency Progress and Strategies to Meet Federal Sustainability Goals ..................................................................... 1
Goal 1: Greenhouse Gas (GHG) Reduction .......................................................................................................... 1
Goal 2: Sustainable Buildings ............................................................................................................................... 5
Goal 3: Clean & Renewable Energy .................................................................................................................... 10
Goal 4: Water Use Efficiency & Management .................................................................................................... 13
Goal 5: Fleet Management .................................................................................................................................. 15
Goal 6: Sustainable Acquisition .......................................................................................................................... 20
Goal 7: Pollution Prevention & Waste Reduction ............................................................................................... 23
Goal 8: Energy Performance Contracts ............................................................................................................... 25
Goal 9: Electronics Stewardship & Data Centers ................................................................................................ 28
Goal 10: Climate Change Resilience ................................................................................................................... 32
Appendix 1: Fleet Management Plan and VAM Report ......................................................................................... 34
Appendix 2. Multimodal Access Plan for Commuters ........................................................................................... 44
Appendix 3. Climate Change Adaptation Update ................................................................................................... 47
Appendix 4. Acronyms and Units ........................................................................................................................... 48
iii
Policy Statement
The Social Security Administration (SSA) touches the lives of virtually every person in America.
We run one of the nation’s largest entitlement programs and the Supplemental Security Income
program, providing financial support for aged, blind, and disabled adults and children with limited
resources. While fulfilling our mission to provide economic security to many individuals, we will
continue our history of promoting a clean energy economy, environmental leadership, and
sustainability. We will work cooperatively with other Federal, State, county, and local governments
to promote sound environmental management practices while providing a safe and healthy work
environment for our employees.
We are pleased to publish this Strategic Sustainability Performance Plan, which provides our agency
with a structured, systematic approach for managing environmental and regulatory responsibilities to
continuously improve overall environmental stewardship.
To promote environmental stewardship, our officials will:
Comply with all environmental and energy-related statutes, Executive Orders, and any
applicable Federal, State, and local regulations.
Consider environmental aspects when making planning, purchasing, operating, and budgetary
decisions.
Continue our employee awareness campaign to educate and encourage employees to reduce
energy consumption and water usage, reduce the amount of waste produced, and promote
re-use and recycling whenever possible.
Continue improving environmental stewardship by setting environmental goals, measuring
progress, taking corrective action when necessary, and communicating the results.
Incorporate climate change and adaptation considerations in our agency operations.
Communicate and reinforce this policy throughout the agency.
We are pleased to promote environmental leadership and sustainability at SSA.
Chris Molander Chief Sustainability Officer
ES-1
Executive Summary
Vision With our mission to provide economic security to many individuals, sustainability is an integral part
of our success. It enables us to do our job more cost-effectively and be responsible stewards of the
health of our employees, the public we serve, and the environment in which we all live. We have
already made great strides integrating sustainability into the day-to-day implementation of our
mission, but there is much more we can do. We are committed to further improvement through a
range of approaches such as increasing the efficiency with which we use energy and water in our
buildings, reducing solid waste disposal through recycling, and decreasing the combustion of
petroleum-based fuels in our vehicles while increasing the percentage of electric and hybrid vehicles
in the agency’s fleet. In addition, the choices we make in acquiring products and services play a
critical role in promoting sustainability, and we are committed to conducting acquisition
sustainability. Our stewardship for electronics goes beyond acquisition. We will continue to ensure
our computers and monitors use minimal energy and are disposed of in an environmentally sound
manner. Finally, sustainability goes hand-in-hand with building resilience to the impacts of climate
change. We will work to identify our vulnerabilities to climate change and address them proactively.
Leadership The Associate Commissioner, Office of Facilities and Supply Management is the Chief Sustainability
Officer (CSO) and the Climate Change Adaptation contact for the agency. The CSO reports directly
to the SSA Commissioner. The performance plans for appropriate senior staff include specific
measures related to sustainability.
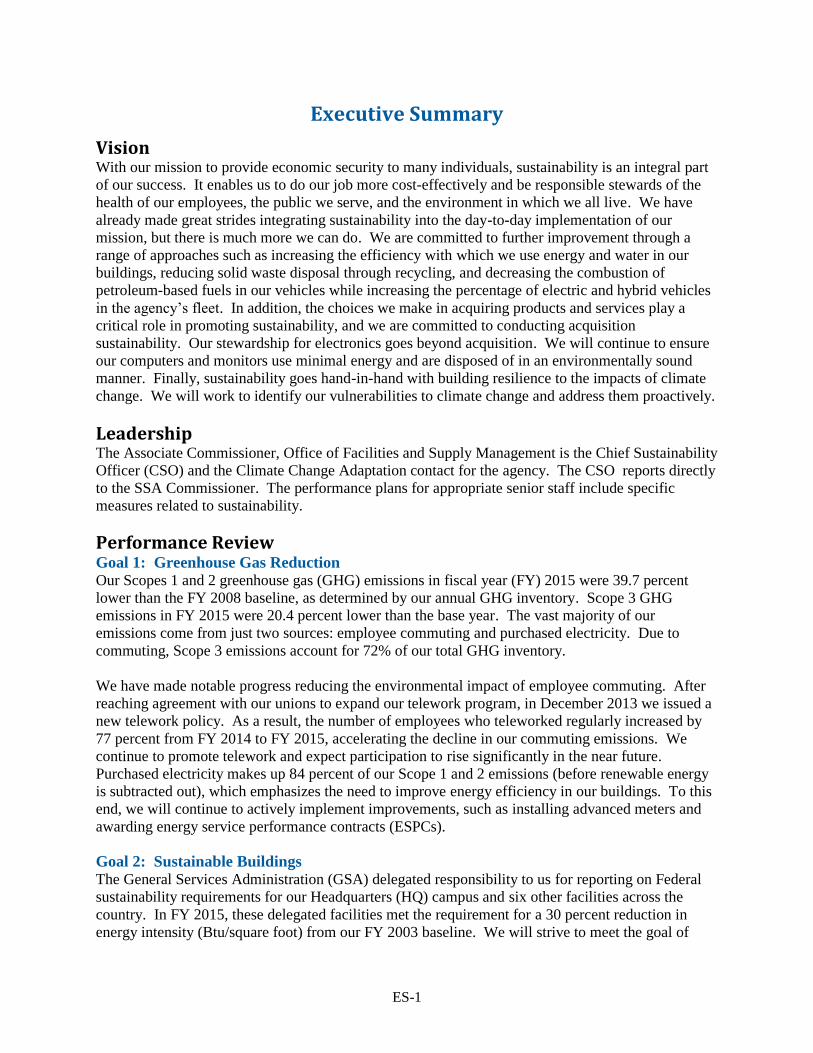
Performance Review Goal 1: Greenhouse Gas Reduction Our Scopes 1 and 2 greenhouse gas (GHG) emissions in fiscal year (FY) 2015 were 39.7 percent
lower than the FY 2008 baseline, as determined by our annual GHG inventory. Scope 3 GHG
emissions in FY 2015 were 20.4 percent lower than the base year. The vast majority of our
emissions come from just two sources: employee commuting and purchased electricity. Due to
commuting, Scope 3 emissions account for 72% of our total GHG inventory.
We have made notable progress reducing the environmental impact of employee commuting. After
reaching agreement with our unions to expand our telework program, in December 2013 we issued a
new telework policy. As a result, the number of employees who teleworked regularly increased by
77 percent from FY 2014 to FY 2015, accelerating the decline in our commuting emissions. We
continue to promote telework and expect participation to rise significantly in the near future.
Purchased electricity makes up 84 percent of our Scope 1 and 2 emissions (before renewable energy
is subtracted out), which emphasizes the need to improve energy efficiency in our buildings. To this
end, we will continue to actively implement improvements, such as installing advanced meters and
awarding energy service performance contracts (ESPCs).
Goal 2: Sustainable Buildings The General Services Administration (GSA) delegated responsibility to us for reporting on Federal
sustainability requirements for our Headquarters (HQ) campus and six other facilities across the
country. In FY 2015, these delegated facilities met the requirement for a 30 percent reduction in
energy intensity (Btu/square foot) from our FY 2003 baseline. We will strive to meet the goal of
ES-2
Executive Order (EO) 13693 for energy intensity in FY 2025 to be 25 percent lower than in FY 2015,
through efforts such as light-emitting diode (LED) testbeds, energy audits, ESPCs, and using
building data to improve energy performance. In accordance with EO 13693, we aim for 15 percent
of our delegated gross square footage to comply with the Guiding Principles for Sustainable Federal
Buildings by FY 2025.
Our new data center, the National Support Center in Urbana, MD, is replacing the National
Computer Center, which is slated to be offline by the end of FY 2016. Based on discussions with the
Department of Energy (DOE), the data centers are excluded from the energy efficiency requirements
of the Energy Security and Independence Act of 2007.
Goal 3: Clean and Renewable Energy Renewable energy sources supplied 19.5 percent of our total electricity in FY 2015, exceeding the
goal of 10 percent. Most of this comes from renewable energy certificates (RECs), although we also
generate renewable energy on-site in four locations. Three are photovoltaic (PV) arrays that
accounted for more than 672 megawatt-hours (MWh) of electricity, and one is a small wind turbine
that generates less than 1 MWh per year. RECs will remain the primary strategy in achieving our
goals for clean and renewable energy.
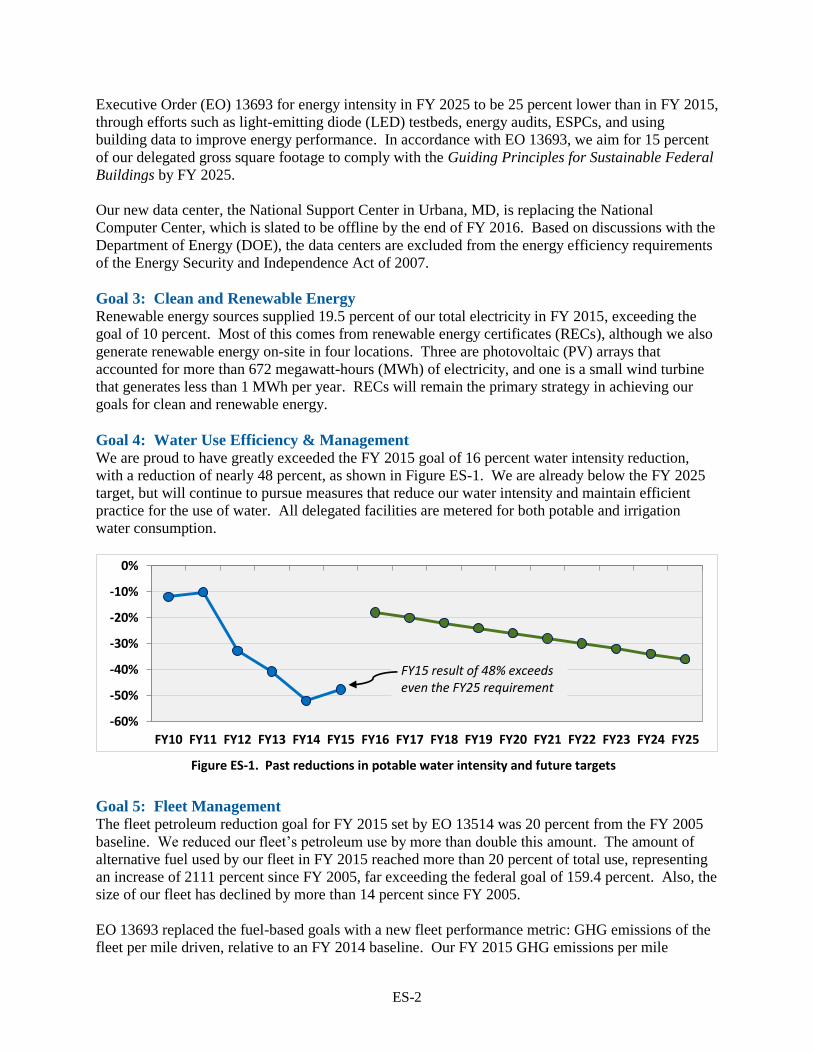
Goal 4: Water Use Efficiency & Management We are proud to have greatly exceeded the FY 2015 goal of 16 percent water intensity reduction,
with a reduction of nearly 48 percent, as shown in Figure ES-1. We are already below the FY 2025
target, but will continue to pursue measures that reduce our water intensity and maintain efficient
practice for the use of water. All delegated facilities are metered for both potable and irrigation
water consumption.
Goal 5: Fleet Management The fleet petroleum reduction goal for FY 2015 set by EO 13514 was 20 percent from the FY 2005
baseline. We reduced our fleet’s petroleum use by more than double this amount. The amount of
alternative fuel used by our fleet in FY 2015 reached more than 20 percent of total use, representing
an increase of 2111 percent since FY 2005, far exceeding the federal goal of 159.4 percent. Also, the
size of our fleet has declined by more than 14 percent since FY 2005.
EO 13693 replaced the fuel-based goals with a new fleet performance metric: GHG emissions of the
fleet per mile driven, relative to an FY 2014 baseline. Our FY 2015 GHG emissions per mile
-60%
-50%
-40%
-30%
-20%
-10%
0%
FY10 FY11 FY12 FY13 FY14 FY15 FY16 FY17 FY18 FY19 FY20 FY21 FY22 FY23 FY24 FY25
FY15 result of 48% exceeds even the FY25 requirement
Figure ES-1. Past reductions in potable water intensity and future targets
ES-3
travelled were 1.2 percent lower than in FY 2014. Our main path to reaching the FY 2017 goal of a 4
percent reduction is to increase the number of electric and plug-in hybrid vehicles in the fleet.
However, we will also install Category II telematics in agency vehicles, continue right-sizing and
optimizing our fleet, and continue using the GSA Fleet Drive-Thru management system.
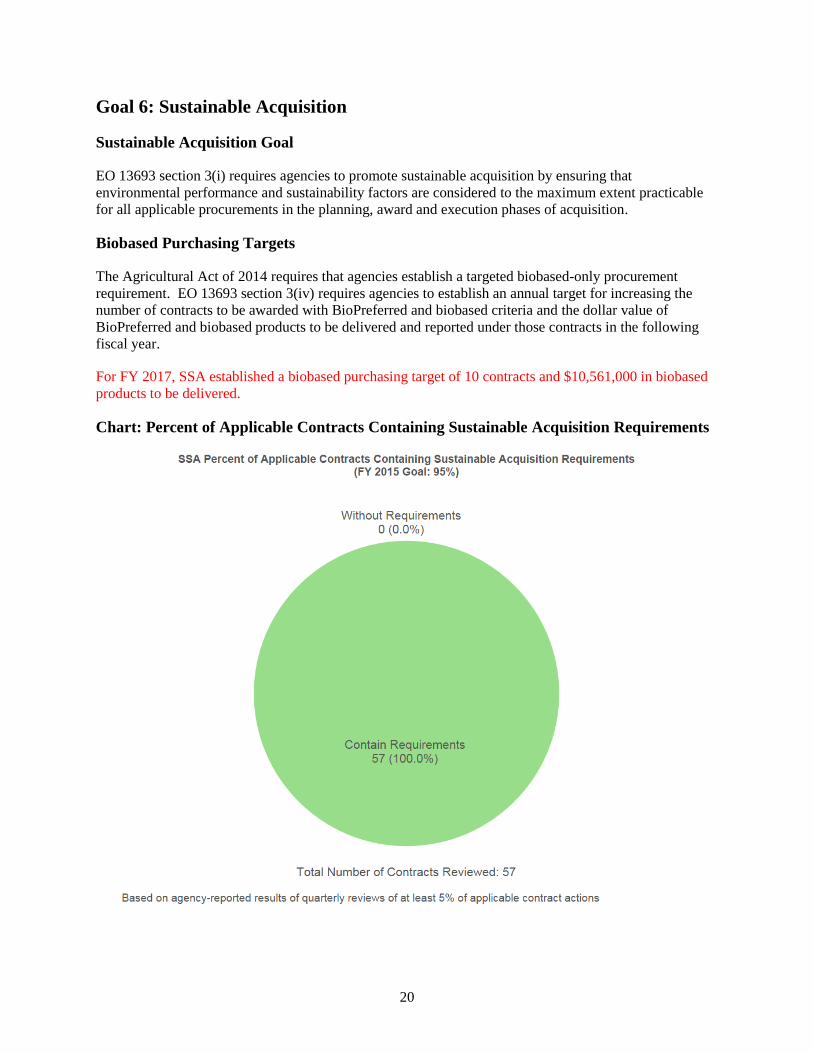
Goal 6: Sustainable Acquisition We conducted 100 percent of our acquisitions sustainably in FY 2015, as determined from our
quarterly reviews of 5 percent of applicable new contract actions (57 actions). All applicable new
contract actions reviewed met Federal mandates for acquiring products that are energy efficient,
water efficient, biobased, environmentally preferable, non-ozone depleting, recycled content, or
non-toxic or less toxic alternatives, where these products meet performance requirements. This
success was possible due to the rigorous system we have in place to assure sustainable acquisition
and ongoing efforts at continuous improvement. Our efforts resulted in recognition from the EPA’s
Safer Choice Program as a 2016 Partner of the Year. As required by EO 13693 to set an FY 2017
target for biobased purchasing, our target is 10 contracts and $10,561,000 in biobased products to be
delivered.
Moving forward, we will continue to hold quarterly sustainable acquisition reviews and semi-annual
acquisition management reviews. We will update our Green Purchasing Plan by December 2016,
and reintroduce the plan to staff through training by March 2017. We will also ensure that the
appropriate Federal Acquisition Regulation (FAR) clauses are included during our regular quarterly
contract reviews and biannual acquisition management reviews. We will continue to report
sustainability compliance in the Contractor Performance Assessment Reporting System (CPARS),
and will update our CPARS guidance for contracts-related staff to include sustainability compliance
as an assessment factor, where applicable.
Goal 7: Pollution Prevention & Waste Reduction In FY 2015, we used recycling to divert more than 55 percent of our solid waste away from the waste
stream, exceeding the goal of 50 percent. In FY 2015, we established a waste minimization and
chemical storage plan which will work on an ongoing basis to reduce the quantity of chemicals at the
main campus. We will ensure that all new contracts involving hydrofluorcarbons (HFCs) include a
requirement for the contractor to document quantities, and we train all personnel who work with
heating, ventilation and cooling (HVAC) equipment on the use of HFC recycling equipment.
Goal 8: Energy Performance Contracts Under the President’s Performance Contracting Challenge, we committed to award $20 million in
performance-based contracts by the end of calendar year (CY) 2016, and we have awarded $20.4
million. Our targets for FY 2017 and FY 2018 are $5 million and $9 million, respectively. We
initiated an ESPC to enhance the efficiency of the electrical, plumbing, and HVAC systems at our
Harold Washington Social Security Center (HWSSC) in Chicago, Illinois, in addition to the ESPC
already underway at our main HQ campus. We will continue to use ESPCs to improve energy
efficiency across our delegated facilities, when determined to be cost-effective.
Goal 9: Electronic Stewardship We scored green in all categories of electronic stewardship, with 100 percent compliance on all
required goals. We will continue to ensure that 100 percent of purchased desktop computers,
laptops, and monitors are Energy Star or EPEAT-registered, ensuring compliance via quarterly
compliance reviews. To ensure our continued use of power management features on all desktop and
ES-4
laptop computers, we will continue to use our comprehensive reporting and auditing compliance
system. We ensure the environmentally sound disposal of all excess or surplus electronic products
on an ongoing basis through our policies and procedures, which allow disposition only through GSA
Xcess, CFL, Unicor, or a certified recycler. As the first Federal agency to volunteer for the Better
Buildings Challenge of DOE and the White House Council on Environmental Quality (CEQ), we are
committed to metering 100 percent of our data centers and ensuring that power usage effectiveness
(PUE) is less than 1.4, server utilization and automated monitoring are at least 65 percent, and
facility utilization is more than 80 percent.
Goal 10: Climate Change Resilience While the scope, severity, and pace of future climate change are difficult to predict, it is clear that
potential changes could have important effects on our operations and programs. Through climate
adaptation planning, we are identifying how climate change is likely to affect our ability to achieve
our mission, operate our facilities, and meet our policy and program objectives. We are working to
improve our resiliency by tapping into inter-agency Federal government initiatives to improve the
accessibility and coordination of climate change science for decision-making, and we will continue
to coordinate with the GSA’s climate change adaptation efforts. We will build resiliency into our
policies and procedures by reviewing, on an ongoing basis, existing emergency contingency plans
and workforce protocols and policies, and incorporating climate change considerations into them as
needed.
Progress on Administration Priorities President's Performance Contracting Challenge We committed to $20 million in contracts awarded by the end of CY 2016 under the President’s
Performance Contracting Challenge. To date, we have awarded $20.4 million. Our targets for FY
2017 and FY 2018 are $5 million and $9 million, respectively. We initiated an ESPC to modernize
and enhance the efficiency of the electrical, plumbing, and HVAC systems in the HWSSC in
Chicago, Illinois. We expect to have reductions in our water and energy consumption, reducing
utility cost significantly. This project brings natural gas to the building and includes installing a new,
highly efficient central plant that uses condensing gas boilers, replacing air handlers, installing LED
lighting, lighting controls, and much more. The Preliminary Assessment phase is complete, and we
are currently conducting the Investment Grade Audit. We expect to award the ESPC in late FY 2016
or early FY 2017.
Electric and Zero Emission Vehicles At all of our delegated facilities, we will assess the level of interest in charging stations for employee
vehicles, and whether interest is for unmetered level-one charging or faster electric vehicle (EV)
charging. We will assess the staffing time required to enforce parking restrictions at the charging
stations, and we will determine if the stations will be installed and operated by SSA or an outside
contractor. Following the early installations, and based on demand assessments, we will periodically
assess locations for new infrastructure.
We have some existing charging infrastructure in place and planned. The HQ campus has two EV
charging stations, however, until a policy is in place for employees to use them, they are available
only to fleet vehicles at this time. At our main data center, the National Support Center, the wiring
has been completed for charging stations that will allow us to travel in EVs from our HQ in
Baltimore to the data center, charge the vehicles while doing business, and have enough charge to
return to HQ. The charging stations, once completed, can be used for employee vehicles once a
ES-5
policy is in place for employees to use SSA EV charging stations. Our Frank Hagel Federal Building
in Richmond, California has charging stations powered by PV on carports. It plans to request
permission from the San Francisco Regional Commissioner for employees to use the stations.
Climate Change Adaptation Plan To address the potential need to strengthen our programs, policies, and operations for resilience to
climate change, in 2014 we conducted a survey of our delegated facilities regarding local weather-
related problems facilities have already experienced, concerns facilities have for the future (including
due to climate change), and facility contingency planning to address potential hazards. The
responses identified a number of issues, including flooding, wildfire, and power outages. However,
we also determined from the survey that the formal contingency processes in place in these facilities
have them well prepared for weather-related problems, fire emergencies, and diseases that are
pandemic, infectious, and/or communicable. To ensure that this continues to be true in the face of
climate change, we will review all contingency plans, such as Continuity of Operations Plans
(COOPs), during their regular review cycle to keep them current as changes to the operational
environment occur, or are anticipated to occur. Examples of adjustments due to climate change
include human health and safety impacts , such as unsafe air quality, unsafe heat index conditions,
dangerous conditions from severe storms, and new disease threats due to an expanded range of vector
borne diseases into the U.S. We have provisions in place to ensure the continuity of web-based
services in the event of disruptions to the electrical grid, which is essential to make our services
available online for customers with mobility or health issues.
We will prepare our next Climate Change Adaptation Plan once the next quadrennial National
Climate Assessment is issued in 2018 or 2019. Meanwhile, to further improve our understanding of
site-specific vulnerabilities, we will conduct climate change vulnerability and risk assessments on
each of the delegated facilities.
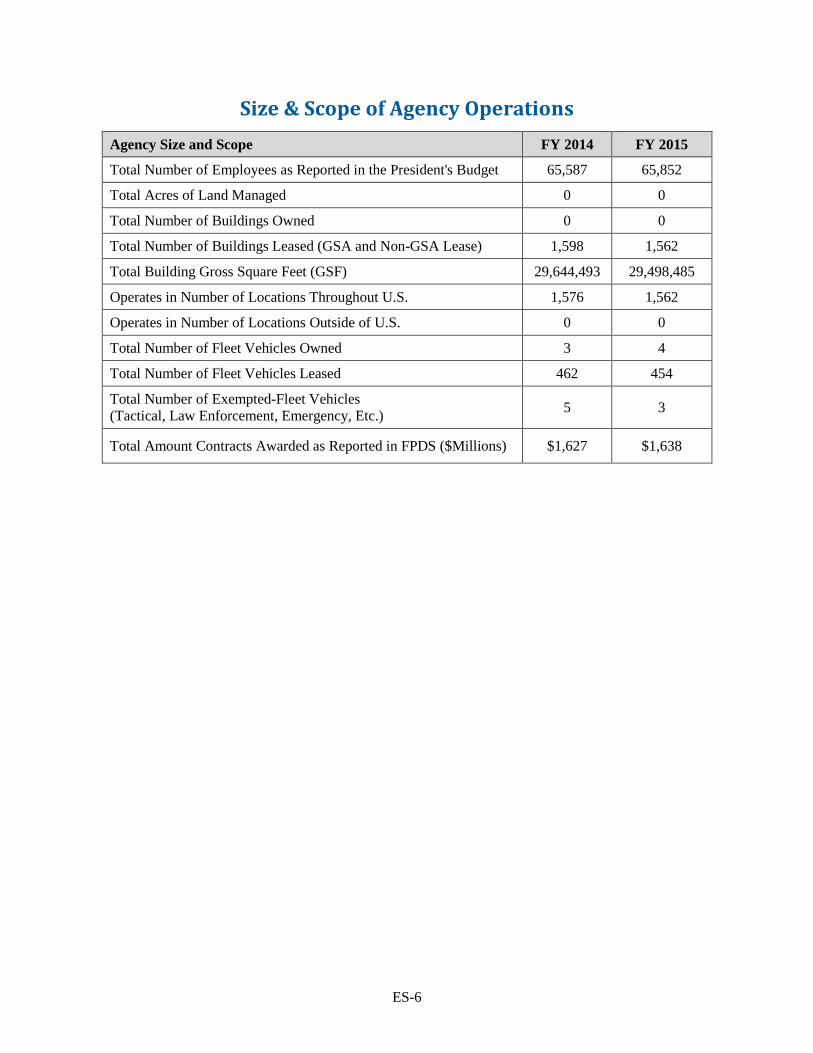
The size and scope of our operations are conveyed in Table 1.
ES-6
Size & Scope of Agency Operations
Agency Size and Scope FY 2014 FY 2015
Total Number of Employees as Reported in the President's Budget 65,587 65,852
Total Acres of Land Managed 0 0
Total Number of Buildings Owned 0 0
Total Number of Buildings Leased (GSA and Non-GSA Lease) 1,598 1,562
Total Building Gross Square Feet (GSF) 29,644,493 29,498,485
Operates in Number of Locations Throughout U.S. 1,576 1,562
Operates in Number of Locations Outside of U.S. 0 0
Total Number of Fleet Vehicles Owned 3 4
Total Number of Fleet Vehicles Leased 462 454
Total Number of Exempted-Fleet Vehicles
(Tactical, Law Enforcement, Emergency, Etc.) 5 3
Total Amount Contracts Awarded as Reported in FPDS ($Millions) $1,627 $1,638
1
Agency Progress and Strategies to Meet Federal Sustainability Goals
This section provides an overview of progress through FY 2015 on sustainability goals contained in
Executive Order 13514, Federal Leadership in Environmental, Energy, and Economic Performance, and
agency strategies to meet the new and updated goals established by Executive Order 13693, Planning for
Federal Sustainability in the Next Decade.
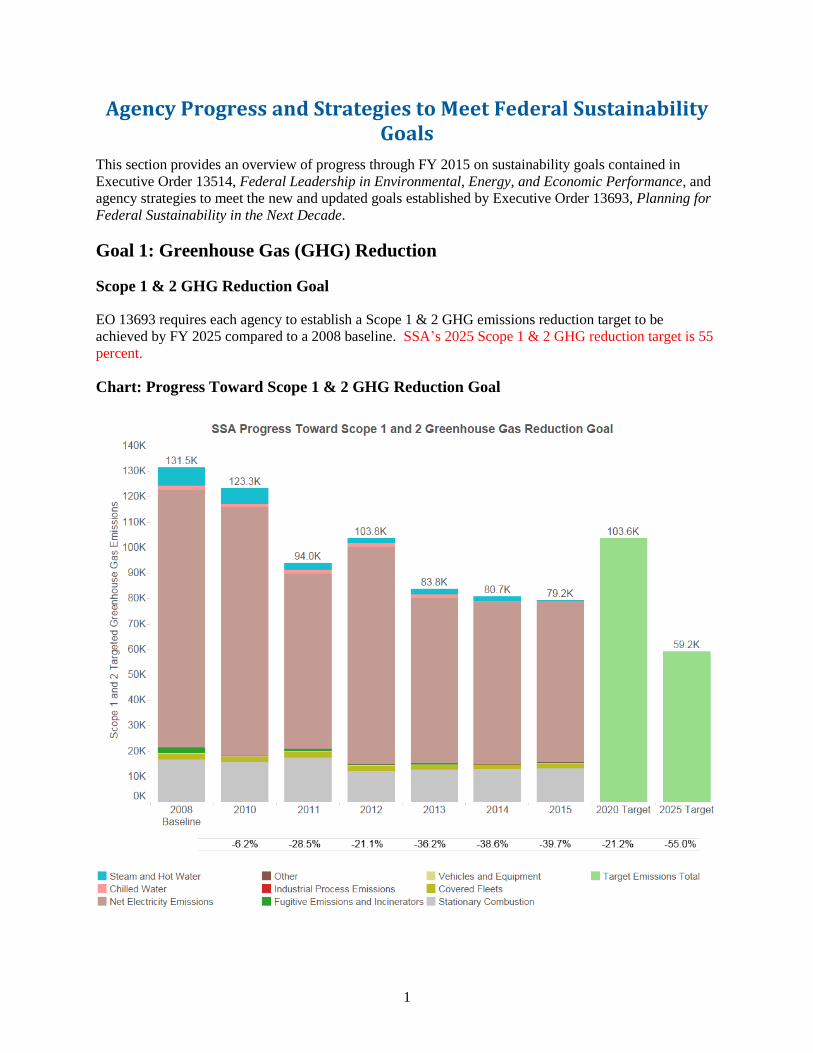
Goal 1: Greenhouse Gas (GHG) Reduction
Scope 1 & 2 GHG Reduction Goal
EO 13693 requires each agency to establish a Scope 1 & 2 GHG emissions reduction target to be
achieved by FY 2025 compared to a 2008 baseline. SSA’s 2025 Scope 1 & 2 GHG reduction target is 55
percent.
Chart: Progress Toward Scope 1 & 2 GHG Reduction Goal
2
We are proud to have received all green for the 2015 Scorecard. We will continue implementing
improvements to our facilities and fleet, and increasing the renewable energy we use, to achieve our goal
of reducing Scope 1 and 2 emissions by 55 percent by FY 2025.
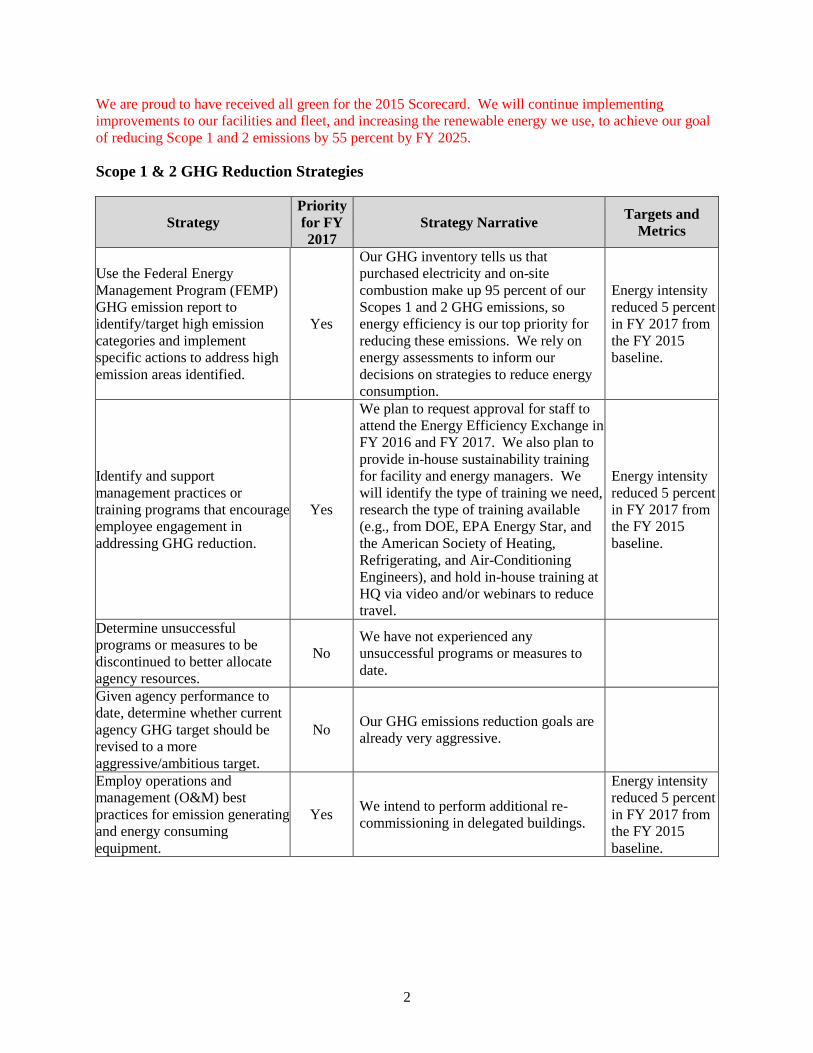
Scope 1 & 2 GHG Reduction Strategies
Strategy
Priority
for FY
2017
Strategy Narrative Targets and
Metrics
Use the Federal Energy
Management Program (FEMP)
GHG emission report to
identify/target high emission
categories and implement
specific actions to address high
emission areas identified.
Yes
Our GHG inventory tells us that
purchased electricity and on-site
combustion make up 95 percent of our
Scopes 1 and 2 GHG emissions, so
energy efficiency is our top priority for
reducing these emissions. We rely on
energy assessments to inform our
decisions on strategies to reduce energy
consumption.
Energy intensity
reduced 5 percent
in FY 2017 from
the FY 2015
baseline.
Identify and support
management practices or
training programs that encourage
employee engagement in
addressing GHG reduction.
Yes
We plan to request approval for staff to
attend the Energy Efficiency Exchange in
FY 2016 and FY 2017. We also plan to
provide in-house sustainability training
for facility and energy managers. We
will identify the type of training we need,
research the type of training available
(e.g., from DOE, EPA Energy Star, and
the American Society of Heating,
Refrigerating, and Air-Conditioning
Engineers), and hold in-house training at
HQ via video and/or webinars to reduce
travel.
Energy intensity
reduced 5 percent
in FY 2017 from
the FY 2015
baseline.
Determine unsuccessful
programs or measures to be
discontinued to better allocate
agency resources.
No
We have not experienced any
unsuccessful programs or measures to
date.
Given agency performance to
date, determine whether current
agency GHG target should be
revised to a more
aggressive/ambitious target.
No Our GHG emissions reduction goals are
already very aggressive.
Employ operations and
management (O&M) best
practices for emission generating
and energy consuming
equipment.
Yes We intend to perform additional re-
commissioning in delegated buildings.
Energy intensity
reduced 5 percent
in FY 2017 from
the FY 2015
baseline.
3
Strategy
Priority
for FY
2017
Strategy Narrative Targets and
Metrics
Identify additional sources of
data or analysis with the
potential to support GHG
reduction goals.
Yes
We will continue to add smart meters to
identify areas where we can reduce our
energy and water usage, and we are
performing additional studies on smart
metering to help us identify the best areas
to install additional smart meters.
Energy intensity
reduced 5 percent
in FY 2017 from
the FY 2015
baseline.
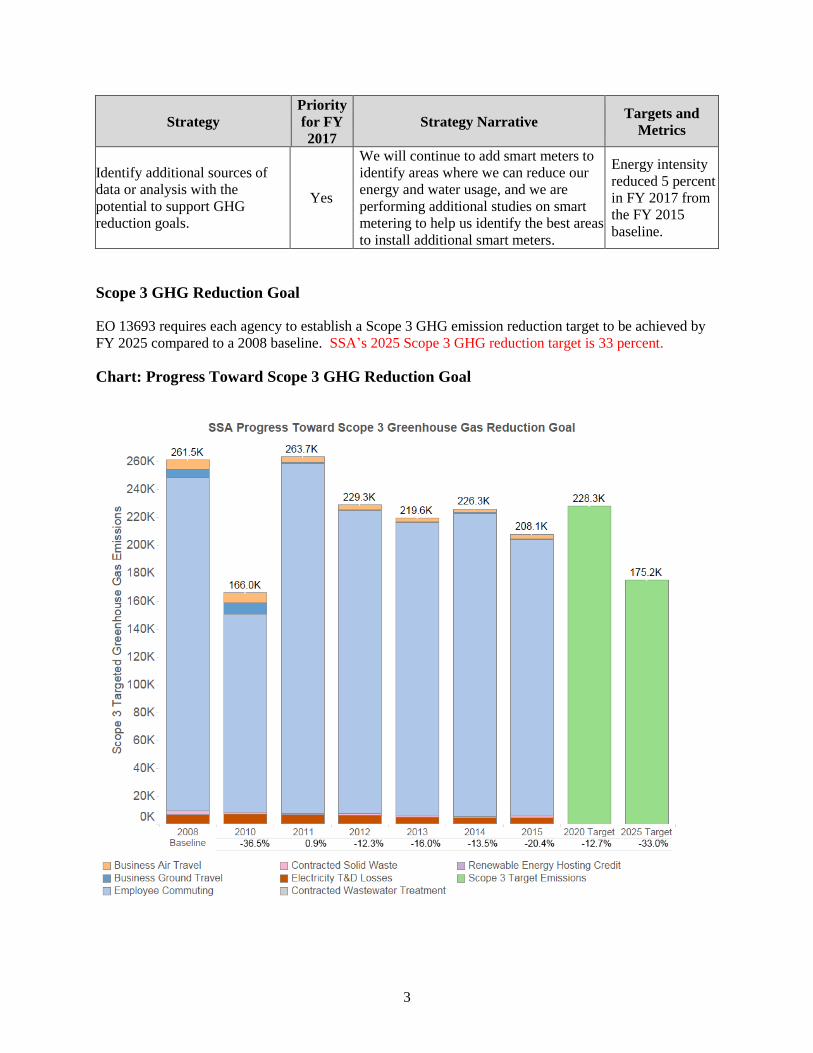
Scope 3 GHG Reduction Goal
EO 13693 requires each agency to establish a Scope 3 GHG emission reduction target to be achieved by
FY 2025 compared to a 2008 baseline. SSA’s 2025 Scope 3 GHG reduction target is 33 percent.
Chart: Progress Toward Scope 3 GHG Reduction Goal
4
Scope 3 GHG Reduction Strategies
Strategy
Priority
for FY
2017
Strategy Narrative Targets and Metrics
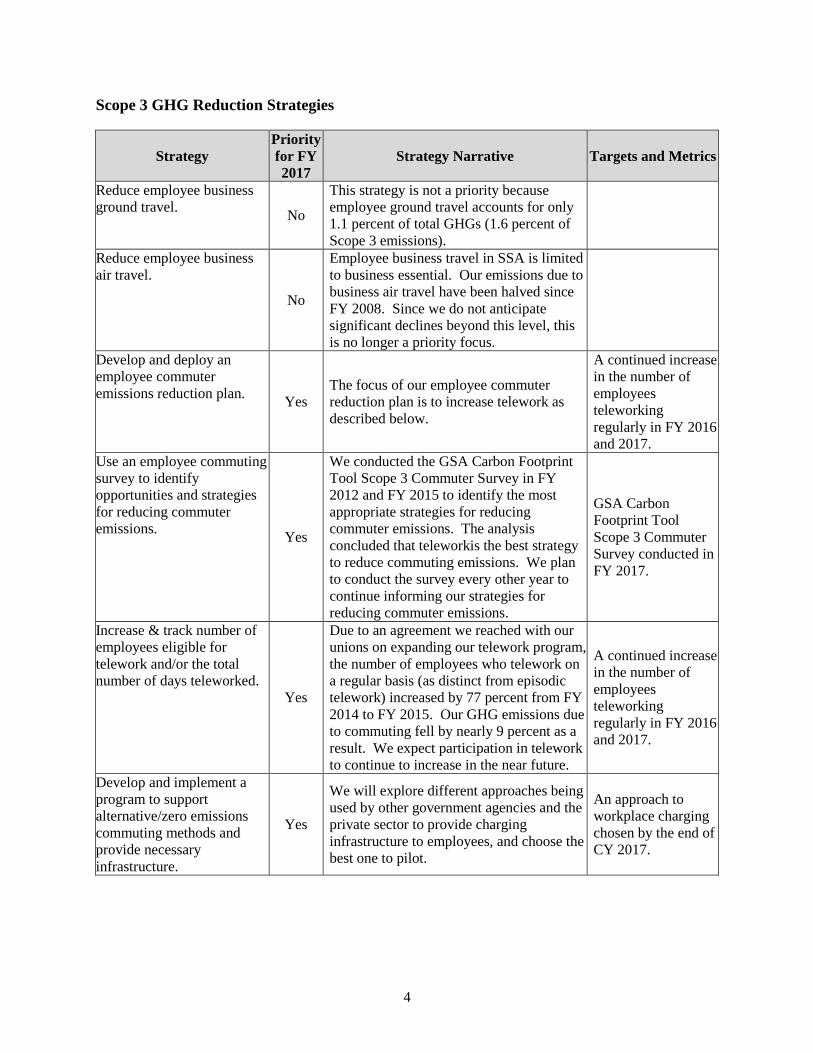
Reduce employee business
ground travel. No
This strategy is not a priority because
employee ground travel accounts for only
1.1 percent of total GHGs (1.6 percent of
Scope 3 emissions).
Reduce employee business
air travel.
No
Employee business travel in SSA is limited
to business essential. Our emissions due to
business air travel have been halved since
FY 2008. Since we do not anticipate
significant declines beyond this level, this
is no longer a priority focus.
Develop and deploy an
employee commuter
emissions reduction plan. Yes
The focus of our employee commuter
reduction plan is to increase telework as
described below.
A continued increase
in the number of
employees
teleworking
regularly in FY 2016
and 2017.
Use an employee commuting
survey to identify
opportunities and strategies
for reducing commuter
emissions. Yes
We conducted the GSA Carbon Footprint
Tool Scope 3 Commuter Survey in FY
2012 and FY 2015 to identify the most
appropriate strategies for reducing
commuter emissions. The analysis
concluded that teleworkis the best strategy
to reduce commuting emissions. We plan
to conduct the survey every other year to
continue informing our strategies for
reducing commuter emissions.
GSA Carbon
Footprint Tool
Scope 3 Commuter
Survey conducted in
FY 2017.
Increase & track number of
employees eligible for
telework and/or the total
number of days teleworked.
Yes
Due to an agreement we reached with our
unions on expanding our telework program,
the number of employees who telework on
a regular basis (as distinct from episodic
telework) increased by 77 percent from FY
2014 to FY 2015. Our GHG emissions due
to commuting fell by nearly 9 percent as a
result. We expect participation in telework
to continue to increase in the near future.
A continued increase
in the number of
employees
teleworking
regularly in FY 2016
and 2017.
Develop and implement a
program to support
alternative/zero emissions
commuting methods and
provide necessary
infrastructure.
Yes
We will explore different approaches being
used by other government agencies and the
private sector to provide charging
infrastructure to employees, and choose the
best one to pilot.
An approach to
workplace charging
chosen by the end of
CY 2017.
5
Strategy
Priority
for FY
2017
Strategy Narrative Targets and Metrics
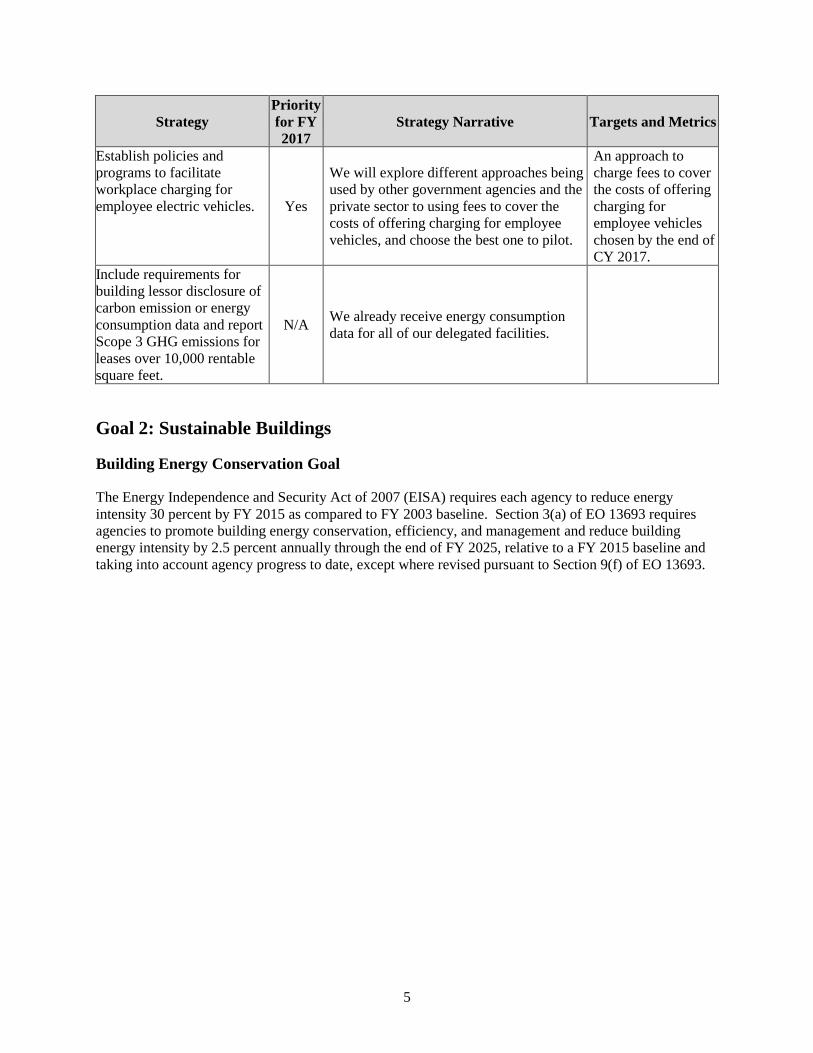
Establish policies and
programs to facilitate
workplace charging for
employee electric vehicles. Yes
We will explore different approaches being
used by other government agencies and the
private sector to using fees to cover the
costs of offering charging for employee
vehicles, and choose the best one to pilot.
An approach to
charge fees to cover
the costs of offering
charging for
employee vehicles
chosen by the end of
CY 2017.
Include requirements for
building lessor disclosure of
carbon emission or energy
consumption data and report
Scope 3 GHG emissions for
leases over 10,000 rentable
square feet.
N/A We already receive energy consumption
data for all of our delegated facilities.
Goal 2: Sustainable Buildings
Building Energy Conservation Goal
The Energy Independence and Security Act of 2007 (EISA) requires each agency to reduce energy
intensity 30 percent by FY 2015 as compared to FY 2003 baseline. Section 3(a) of EO 13693 requires
agencies to promote building energy conservation, efficiency, and management and reduce building
energy intensity by 2.5 percent annually through the end of FY 2025, relative to a FY 2015 baseline and
taking into account agency progress to date, except where revised pursuant to Section 9(f) of EO 13693.
6
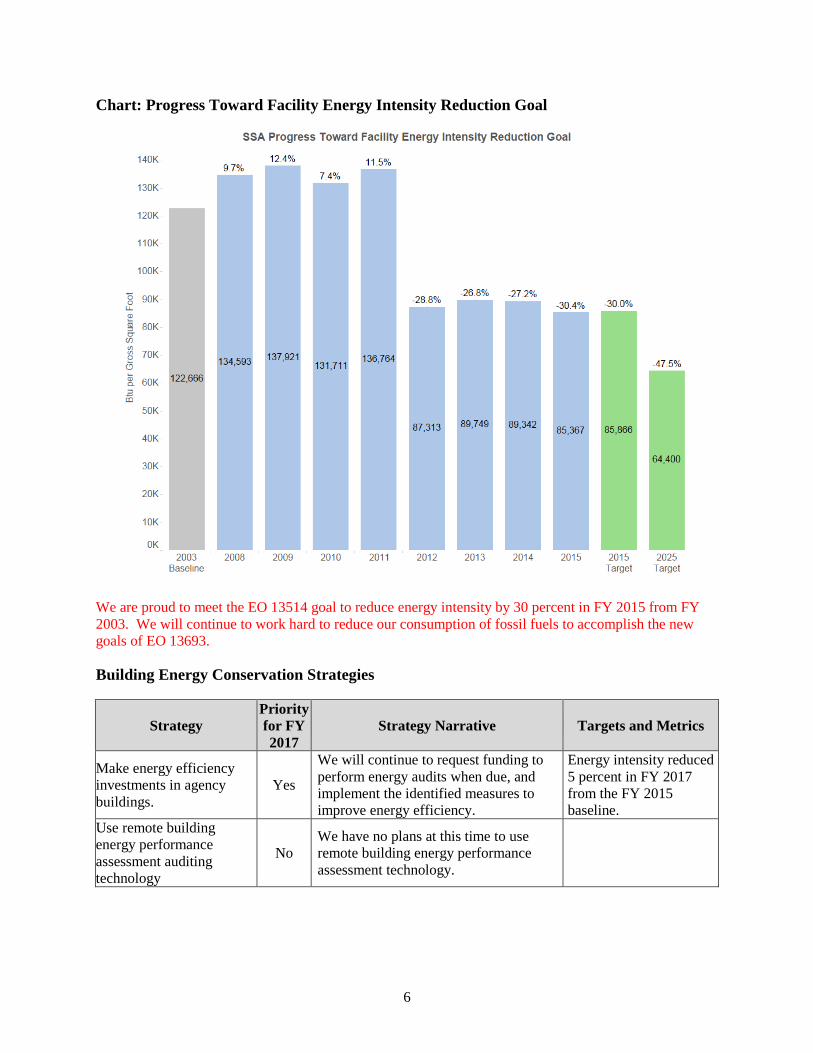
Chart: Progress Toward Facility Energy Intensity Reduction Goal
We are proud to meet the EO 13514 goal to reduce energy intensity by 30 percent in FY 2015 from FY
2003. We will continue to work hard to reduce our consumption of fossil fuels to accomplish the new
goals of EO 13693.
Building Energy Conservation Strategies
Strategy
Priority
for FY
2017
Strategy Narrative Targets and Metrics
Make energy efficiency
investments in agency
buildings.
Yes
We will continue to request funding to
perform energy audits when due, and
implement the identified measures to
improve energy efficiency.
Energy intensity reduced
5 percent in FY 2017
from the FY 2015
baseline.
Use remote building
energy performance
assessment auditing
technology
No
We have no plans at this time to use
remote building energy performance
assessment technology.
7
Strategy
Priority
for FY
2017
Strategy Narrative Targets and Metrics
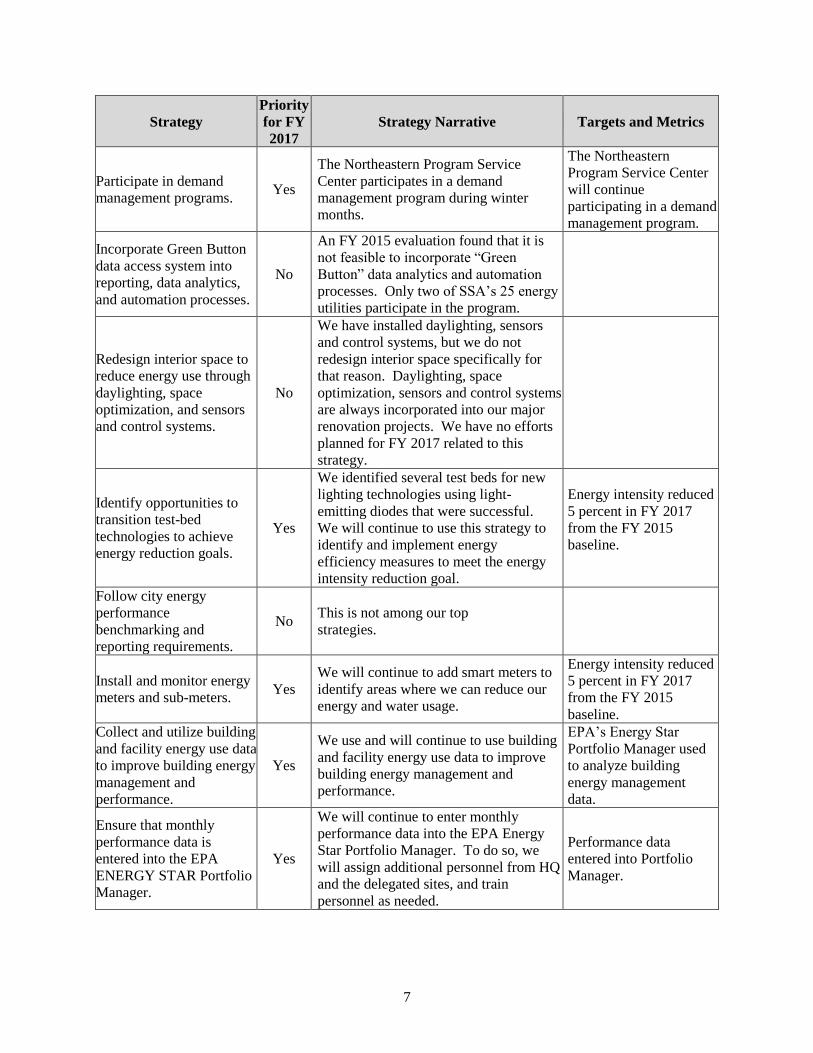
Participate in demand
management programs. Yes
The Northeastern Program Service
Center participates in a demand
management program during winter
months.
The Northeastern
Program Service Center
will continue
participating in a demand
management program.
Incorporate Green Button
data access system into
reporting, data analytics,
and automation processes.
No
An FY 2015 evaluation found that it is
not feasible to incorporate “Green
Button” data analytics and automation
processes. Only two of SSA’s 25 energy
utilities participate in the program.
Redesign interior space to
reduce energy use through
daylighting, space
optimization, and sensors
and control systems.
No
We have installed daylighting, sensors
and control systems, but we do not
redesign interior space specifically for
that reason. Daylighting, space
optimization, sensors and control systems
are always incorporated into our major
renovation projects. We have no efforts
planned for FY 2017 related to this
strategy.
Identify opportunities to
transition test-bed
technologies to achieve
energy reduction goals.
Yes
We identified several test beds for new
lighting technologies using light-
emitting diodes that were successful.
We will continue to use this strategy to
identify and implement energy
efficiency measures to meet the energy
intensity reduction goal.
Energy intensity reduced
5 percent in FY 2017
from the FY 2015
baseline.
Follow city energy
performance
benchmarking and
reporting requirements.
No This is not among our top
strategies.
Install and monitor energy
meters and sub-meters. Yes
We will continue to add smart meters to
identify areas where we can reduce our
energy and water usage.
Energy intensity reduced
5 percent in FY 2017
from the FY 2015
baseline.
Collect and utilize building
and facility energy use data
to improve building energy
management and
performance.
Yes
We use and will continue to use building
and facility energy use data to improve
building energy management and
performance.
EPA’s Energy Star
Portfolio Manager used
to analyze building
energy management
data.
Ensure that monthly
performance data is
entered into the EPA
ENERGY STAR Portfolio
Manager.
Yes
We will continue to enter monthly
performance data into the EPA Energy
Star Portfolio Manager. To do so, we
will assign additional personnel from HQ
and the delegated sites, and train
personnel as needed.
Performance data
entered into Portfolio
Manager.
8
Building Efficiency, Performance, and Management Goal
Section 3(h) of EO 13693 states that agencies will improve building efficiency, performance, and
management and requires that agencies identify a percentage of the agency's existing buildings above
5,000 gross square feet intended to be energy, waste, or water net-zero buildings by FY 2025 and
implementing actions that will allow those buildings to meet that target.
The Social Security Administration’s 2025 target is 54 percent (HQ buildings) of SSA delegated gross
square foot of buildings for net-zero waste by using Baltimore’s Waste to Energy Facility.
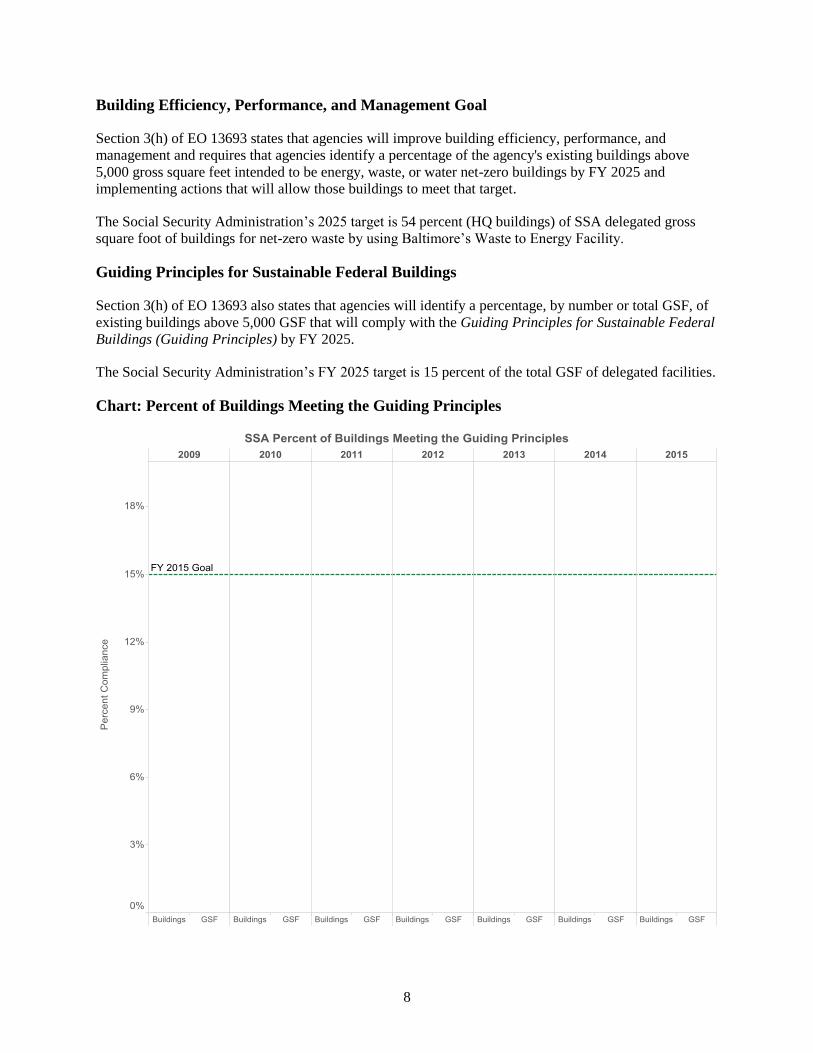
Guiding Principles for Sustainable Federal Buildings
Section 3(h) of EO 13693 also states that agencies will identify a percentage, by number or total GSF, of
existing buildings above 5,000 GSF that will comply with the Guiding Principles for Sustainable Federal
Buildings (Guiding Principles) by FY 2025.
The Social Security Administration’s FY 2025 target is 15 percent of the total GSF of delegated facilities.
Chart: Percent of Buildings Meeting the Guiding Principles
9
Our delegated facilities comply with almost all of the Guiding Principles criteria for existing buildings.
We will continue to evaluate ways to meet additional criteria.
Sustainable Buildings Strategies
Strategy
Priority
for FY
2017
Strategy Narrative Targets and Metrics
Include climate resilient design
and management into the
operation, repair, and renovation
of existing agency buildings and
the design of new buildings.
Yes
We are currently including climate
resilient design as part of asset
planning at our facility in California
(seismic retrofit) that will conform to
GSA’s Seismic Requirements for
Leased Buildings. GSA began the
procurement process in May 2016.
Seismic retrofit
included in the
construction contract
awarded in July 2016.
In planning new facilities or
leases, include cost-effective
strategies to optimize sustainable
space utilization and
consideration of existing
community transportation
planning and infrastructure,
including access to public
transit.
N/A
This does not apply since all of our
delegated facilities are GSA leases
and we do not construct new
buildings.
Ensure all new construction of
Federal buildings greater than
5,000 GSF that enters the
planning process be designed to
achieve energy net-zero and,
where feasible, water or waste
net-zero by FY 2030.
N/A
This does not apply since all of our
delegated facilities are GSA leases
and we do not construct new
buildings.
Include criteria for energy
efficiency as a performance
specification or source selection
evaluation factor in all new
agency lease solicitations over
10,000 rentable square feet.
N/A
This does not apply since all SSA
delegated facilities are GSA leases,
and no more leases for delegated
facilities are planned.
Incorporate green building
specifications into all new
construction, modernization, and
major renovation projects.
Yes
Any new construction,
modernization, and major renovation
projects performed on behalf of SSA
is handled by GSA. Should any such
activities occur in the future, we will
work with GSA to incorporate green
building specifications.
Green building
specifications
incorporated into any
new construction and
major renovation
projects done for SSA
by GSA, if GSA
concurs.
10
Strategy
Priority
for FY
2017
Strategy Narrative Targets and Metrics
Implement space utilization and
optimization practices and
policies.
Yes
We are working with GSA on
feasibility studies in three of our
regional delegated facilities to
identify opportunities for optimizing
space and improving utilization and
costs associated with
implementation. We will have a
better understanding when the studies
conclude in FY 2017. We will work
closely with GSA on activities and
funding in support of the
recommendations.
Higher occupancy
density in three
buildings, if the
needed funding is
obtained.
Implement programs on
occupant health and well-being
in accordance with the Guiding
Principles.
Yes
We have installed bottle-filling
stations in buildings on the HQ
campus to promote easier access to
potable water and to reduce water
waste and bottle recycling.
We will continue to
assess the needs for
additional bottle filling
stations throughout the
campus.
Goal 3: Clean & Renewable Energy
Clean Energy Goal
EO 13693 Section 3(b) requires that, at a minimum, the percentage of an agency's total electric and
thermal energy accounted for by renewable and alternative energy shall be not less than: 10 percent in
FY 2016-17; 13 percent in FY 2018-19; 16 percent in FY 2020-21; 20 percent in FY 2022-23; and 25
percent by FY 2025.
Renewable Electric Energy Goal
EO 13693 Section 3(c) requires that renewable energy account for not less than 10 percent of total electric
energy consumed by an agency in FY 2016-17; 15 percent in FY 2018-19; 20 percent in FY 2020-21; 25
percent in FY 2022-23; and 30 percent by 2025.
11
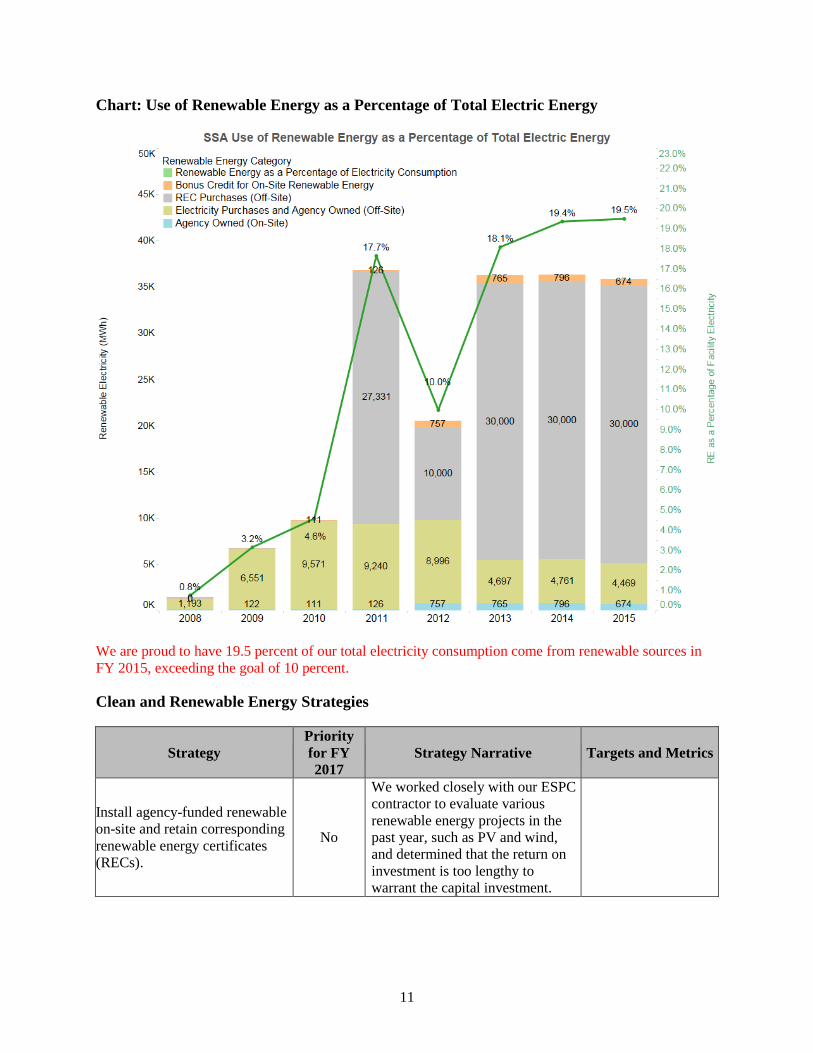
Chart: Use of Renewable Energy as a Percentage of Total Electric Energy
We are proud to have 19.5 percent of our total electricity consumption come from renewable sources in
FY 2015, exceeding the goal of 10 percent.
Clean and Renewable Energy Strategies
Strategy
Priority
for FY
2017
Strategy Narrative Targets and Metrics
Install agency-funded renewable
on-site and retain corresponding
renewable energy certificates
(RECs).
No
We worked closely with our ESPC
contractor to evaluate various
renewable energy projects in the
past year, such as PV and wind,
and determined that the return on
investment is too lengthy to
warrant the capital investment.
12
Strategy
Priority
for FY
2017
Strategy Narrative Targets and Metrics
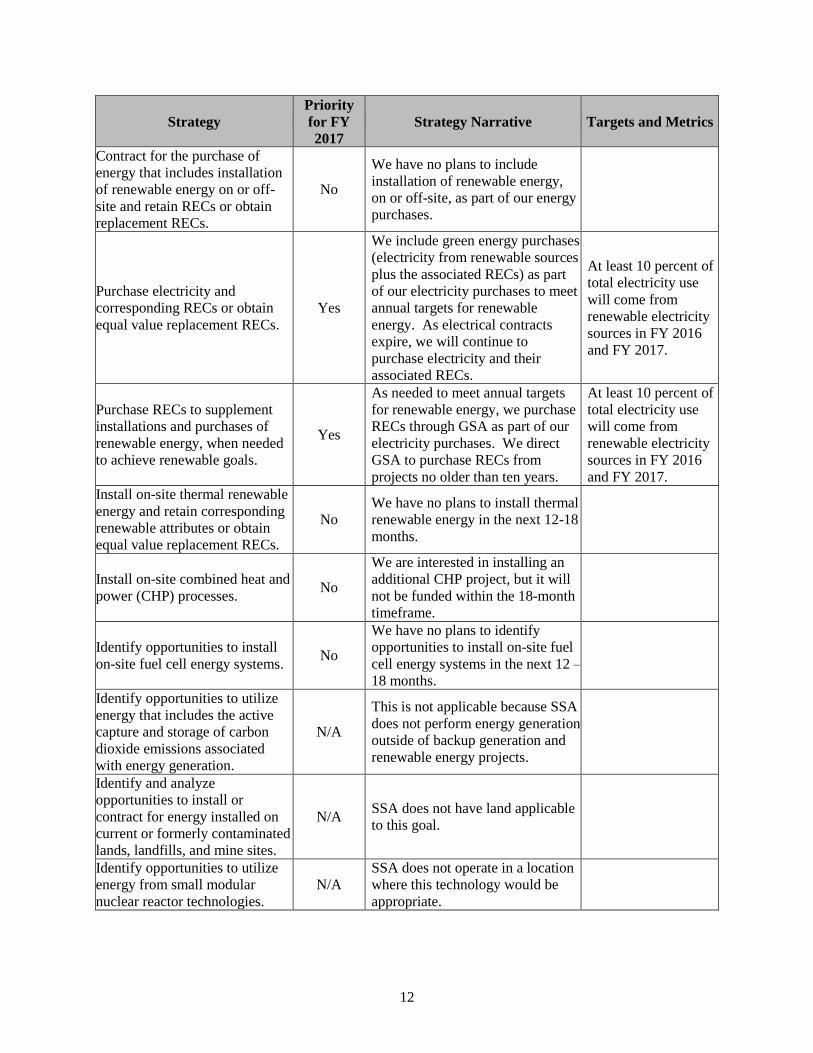
Contract for the purchase of
energy that includes installation
of renewable energy on or off-
site and retain RECs or obtain
replacement RECs.
No
We have no plans to include
installation of renewable energy,
on or off-site, as part of our energy
purchases.
Purchase electricity and
corresponding RECs or obtain
equal value replacement RECs.
Yes
We include green energy purchases
(electricity from renewable sources
plus the associated RECs) as part
of our electricity purchases to meet
annual targets for renewable
energy. As electrical contracts
expire, we will continue to
purchase electricity and their
associated RECs.
At least 10 percent of
total electricity use
will come from
renewable electricity
sources in FY 2016
and FY 2017.
Purchase RECs to supplement
installations and purchases of
renewable energy, when needed
to achieve renewable goals.
Yes
As needed to meet annual targets
for renewable energy, we purchase
RECs through GSA as part of our
electricity purchases. We direct
GSA to purchase RECs from
projects no older than ten years.
At least 10 percent of
total electricity use
will come from
renewable electricity
sources in FY 2016
and FY 2017.
Install on-site thermal renewable
energy and retain corresponding
renewable attributes or obtain
equal value replacement RECs.
No
We have no plans to install thermal
renewable energy in the next 12-18
months.
Install on-site combined heat and
power (CHP) processes. No
We are interested in installing an
additional CHP project, but it will
not be funded within the 18-month
timeframe.
Identify opportunities to install
on-site fuel cell energy systems. No
We have no plans to identify
opportunities to install on-site fuel
cell energy systems in the next 12 –
18 months.
Identify opportunities to utilize
energy that includes the active
capture and storage of carbon
dioxide emissions associated
with energy generation.
N/A
This is not applicable because SSA
does not perform energy generation
outside of backup generation and
renewable energy projects.
Identify and analyze
opportunities to install or
contract for energy installed on
current or formerly contaminated
lands, landfills, and mine sites.
N/A SSA does not have land applicable
to this goal.
Identify opportunities to utilize
energy from small modular
nuclear reactor technologies.
N/A
SSA does not operate in a location
where this technology would be
appropriate.
13
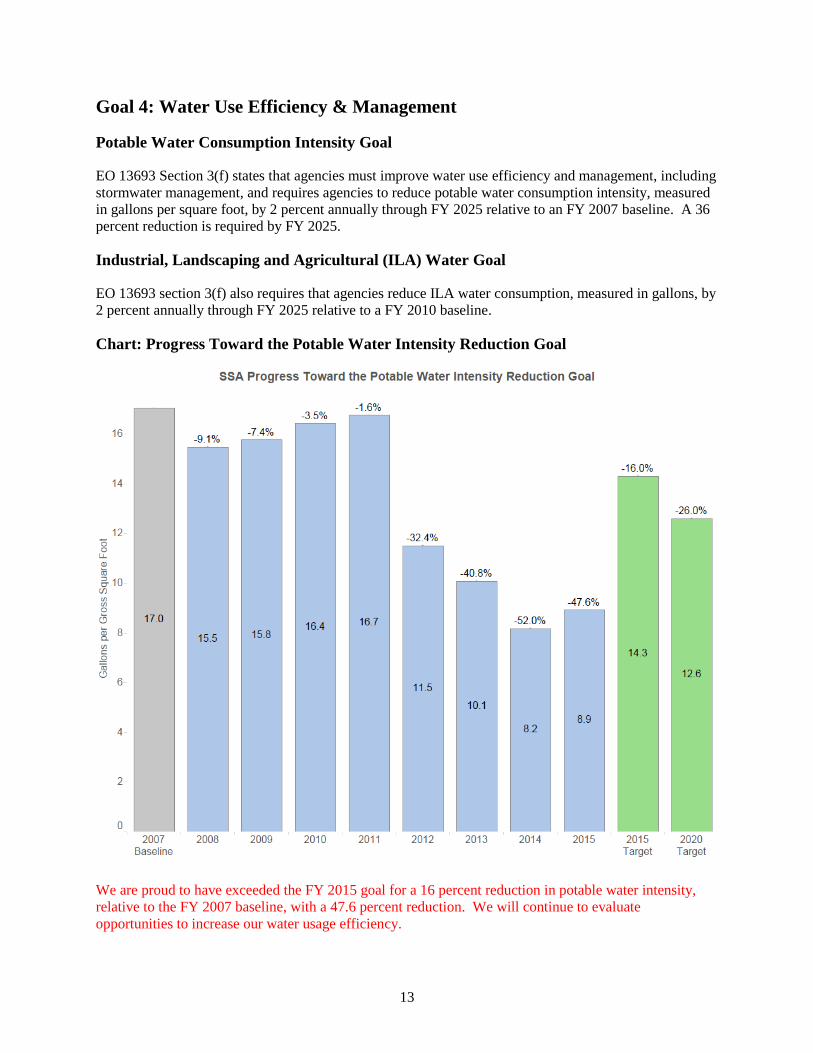
Goal 4: Water Use Efficiency & Management
Potable Water Consumption Intensity Goal
EO 13693 Section 3(f) states that agencies must improve water use efficiency and management, including
stormwater management, and requires agencies to reduce potable water consumption intensity, measured
in gallons per square foot, by 2 percent annually through FY 2025 relative to an FY 2007 baseline. A 36
percent reduction is required by FY 2025.
Industrial, Landscaping and Agricultural (ILA) Water Goal
EO 13693 section 3(f) also requires that agencies reduce ILA water consumption, measured in gallons, by
2 percent annually through FY 2025 relative to a FY 2010 baseline.
Chart: Progress Toward the Potable Water Intensity Reduction Goal
We are proud to have exceeded the FY 2015 goal for a 16 percent reduction in potable water intensity,
relative to the FY 2007 baseline, with a 47.6 percent reduction. We will continue to evaluate
opportunities to increase our water usage efficiency.
14
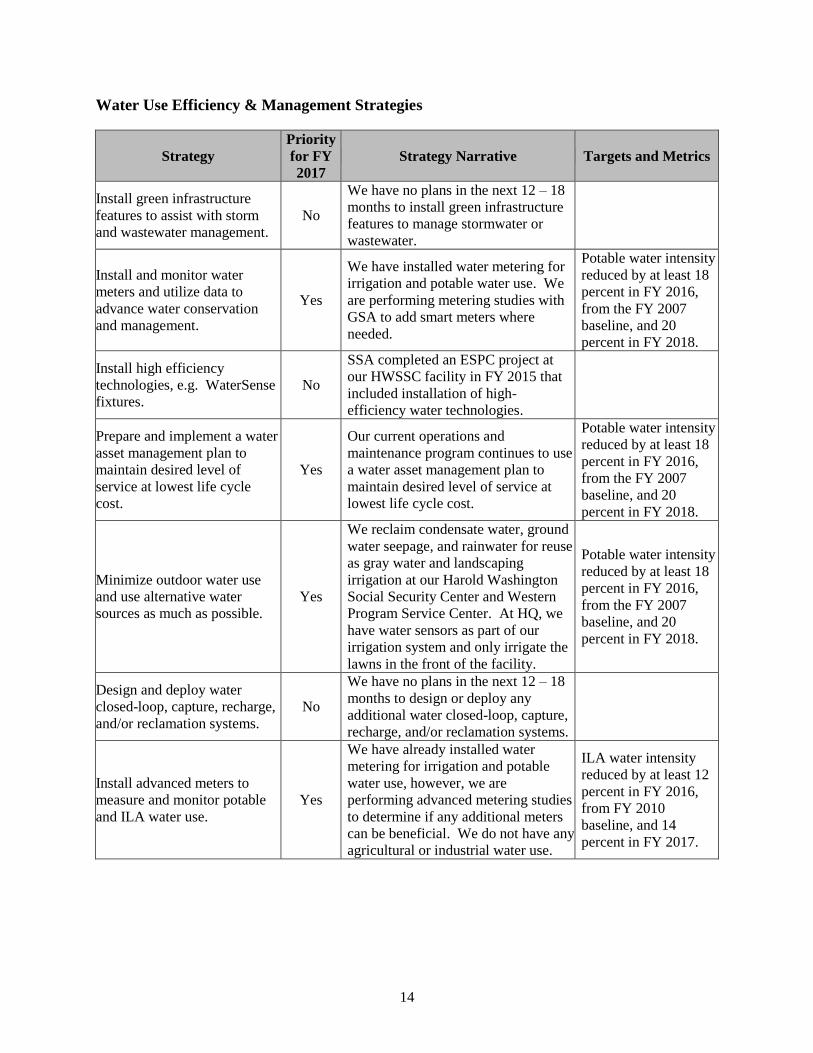
Water Use Efficiency & Management Strategies
Strategy
Priority
for FY
2017
Strategy Narrative Targets and Metrics
Install green infrastructure
features to assist with storm
and wastewater management.
No
We have no plans in the next 12 – 18
months to install green infrastructure
features to manage stormwater or
wastewater.
Install and monitor water
meters and utilize data to
advance water conservation
and management.
Yes
We have installed water metering for
irrigation and potable water use. We
are performing metering studies with
GSA to add smart meters where
needed.
Potable water intensity
reduced by at least 18
percent in FY 2016,
from the FY 2007
baseline, and 20
percent in FY 2018.
Install high efficiency
technologies, e.g. WaterSense
fixtures.
No
SSA completed an ESPC project at
our HWSSC facility in FY 2015 that
included installation of high-
efficiency water technologies.
Prepare and implement a water
asset management plan to
maintain desired level of
service at lowest life cycle
cost.
Yes
Our current operations and
maintenance program continues to use
a water asset management plan to
maintain desired level of service at
lowest life cycle cost.
Potable water intensity
reduced by at least 18
percent in FY 2016,
from the FY 2007
baseline, and 20
percent in FY 2018.
Minimize outdoor water use
and use alternative water
sources as much as possible.
Yes
We reclaim condensate water, ground
water seepage, and rainwater for reuse
as gray water and landscaping
irrigation at our Harold Washington
Social Security Center and Western
Program Service Center. At HQ, we
have water sensors as part of our
irrigation system and only irrigate the
lawns in the front of the facility.
Potable water intensity
reduced by at least 18
percent in FY 2016,
from the FY 2007
baseline, and 20
percent in FY 2018.
Design and deploy water
closed-loop, capture, recharge,
and/or reclamation systems.
No
We have no plans in the next 12 – 18
months to design or deploy any
additional water closed-loop, capture,
recharge, and/or reclamation systems.
Install advanced meters to
measure and monitor potable
and ILA water use.
Yes
We have already installed water
metering for irrigation and potable
water use, however, we are
performing advanced metering studies
to determine if any additional meters
can be beneficial. We do not have any
agricultural or industrial water use.
ILA water intensity
reduced by at least 12
percent in FY 2016,
from FY 2010
baseline, and 14
percent in FY 2017.
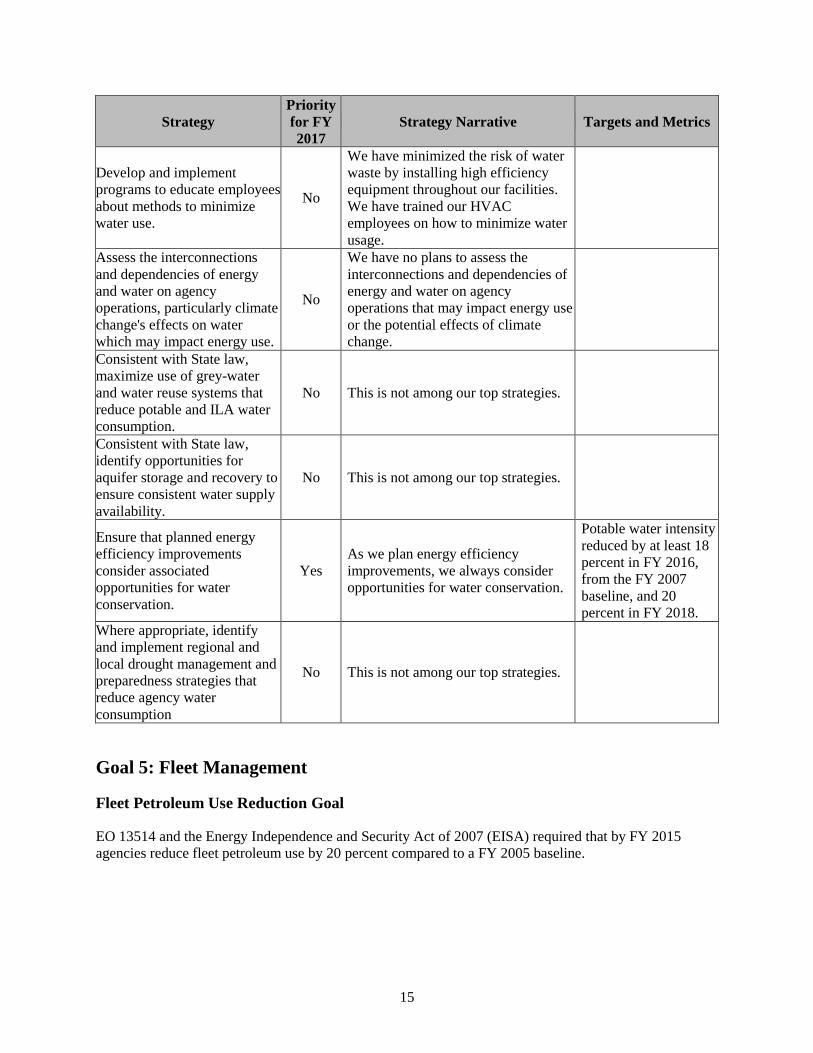
15
Strategy
Priority
for FY
2017
Strategy Narrative Targets and Metrics
Develop and implement
programs to educate employees
about methods to minimize
water use.
No
We have minimized the risk of water
waste by installing high efficiency
equipment throughout our facilities.
We have trained our HVAC
employees on how to minimize water
usage.
Assess the interconnections
and dependencies of energy
and water on agency
operations, particularly climate
change's effects on water
which may impact energy use.
No
We have no plans to assess the
interconnections and dependencies of
energy and water on agency
operations that may impact energy use
or the potential effects of climate
change.
Consistent with State law,
maximize use of grey-water
and water reuse systems that
reduce potable and ILA water
consumption.
No This is not among our top strategies.
Consistent with State law,
identify opportunities for
aquifer storage and recovery to
ensure consistent water supply
availability.
No This is not among our top strategies.
Ensure that planned energy
efficiency improvements
consider associated
opportunities for water
conservation.
Yes
As we plan energy efficiency
improvements, we always consider
opportunities for water conservation.
Potable water intensity
reduced by at least 18
percent in FY 2016,
from the FY 2007
baseline, and 20
percent in FY 2018.
Where appropriate, identify
and implement regional and
local drought management and
preparedness strategies that
reduce agency water
consumption
No This is not among our top strategies.
Goal 5: Fleet Management
Fleet Petroleum Use Reduction Goal
EO 13514 and the Energy Independence and Security Act of 2007 (EISA) required that by FY 2015
agencies reduce fleet petroleum use by 20 percent compared to a FY 2005 baseline.
16
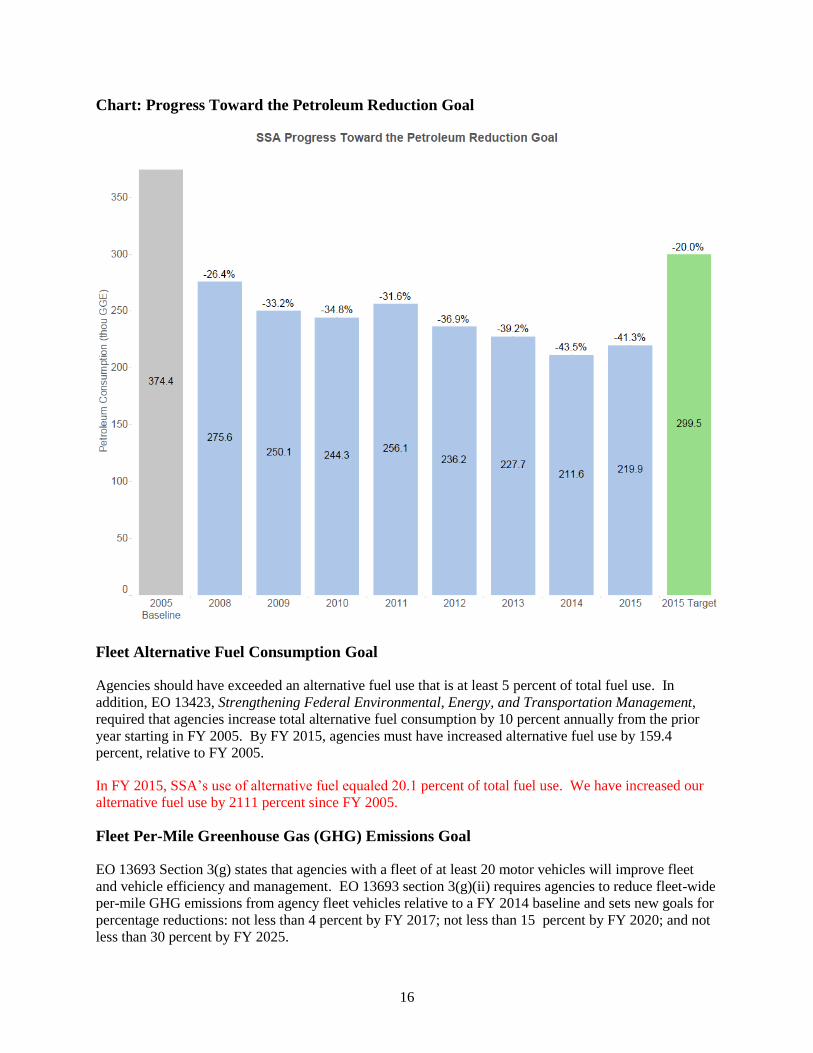
Chart: Progress Toward the Petroleum Reduction Goal
Fleet Alternative Fuel Consumption Goal
Agencies should have exceeded an alternative fuel use that is at least 5 percent of total fuel use. In
addition, EO 13423, Strengthening Federal Environmental, Energy, and Transportation Management,
required that agencies increase total alternative fuel consumption by 10 percent annually from the prior
year starting in FY 2005. By FY 2015, agencies must have increased alternative fuel use by 159.4
percent, relative to FY 2005.
In FY 2015, SSA’s use of alternative fuel equaled 20.1 percent of total fuel use. We have increased our
alternative fuel use by 2111 percent since FY 2005.
Fleet Per-Mile Greenhouse Gas (GHG) Emissions Goal
EO 13693 Section 3(g) states that agencies with a fleet of at least 20 motor vehicles will improve fleet
and vehicle efficiency and management. EO 13693 section 3(g)(ii) requires agencies to reduce fleet-wide
per-mile GHG emissions from agency fleet vehicles relative to a FY 2014 baseline and sets new goals for
percentage reductions: not less than 4 percent by FY 2017; not less than 15 percent by FY 2020; and not
less than 30 percent by FY 2025.
17
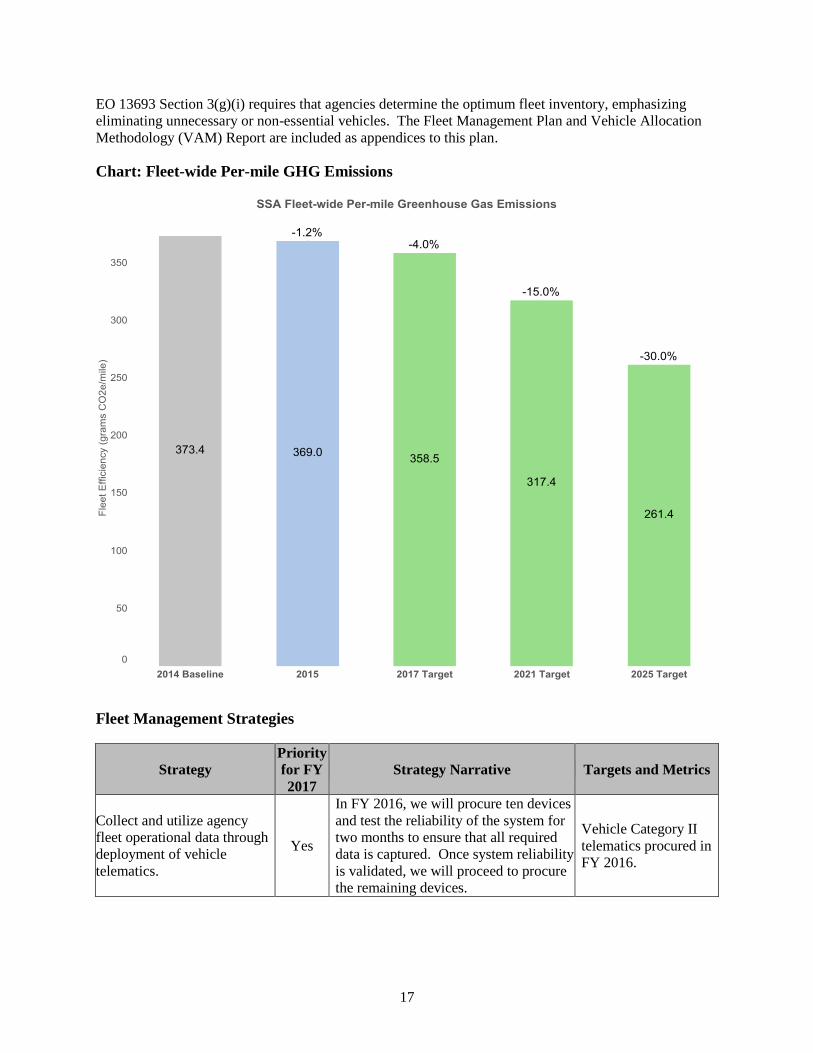
EO 13693 Section 3(g)(i) requires that agencies determine the optimum fleet inventory, emphasizing
eliminating unnecessary or non-essential vehicles. The Fleet Management Plan and Vehicle Allocation
Methodology (VAM) Report are included as appendices to this plan.
Chart: Fleet-wide Per-mile GHG Emissions
Fleet Management Strategies
Strategy
Priority
for FY
2017
Strategy Narrative Targets and Metrics
Collect and utilize agency
fleet operational data through
deployment of vehicle
telematics.
Yes
In FY 2016, we will procure ten devices
and test the reliability of the system for
two months to ensure that all required
data is captured. Once system reliability
is validated, we will proceed to procure
the remaining devices.
Vehicle Category II
telematics procured in
FY 2016.
18
Strategy
Priority
for FY
2017
Strategy Narrative Targets and Metrics
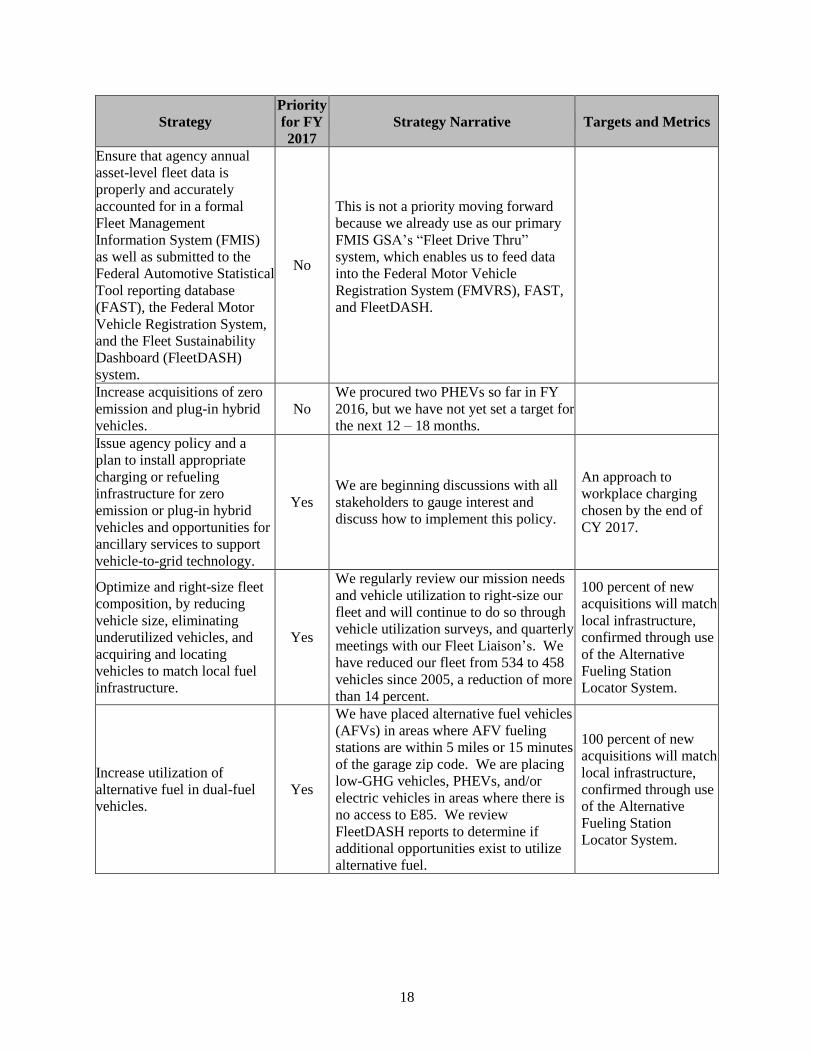
Ensure that agency annual
asset-level fleet data is
properly and accurately
accounted for in a formal
Fleet Management
Information System (FMIS)
as well as submitted to the
Federal Automotive Statistical
Tool reporting database
(FAST), the Federal Motor
Vehicle Registration System,
and the Fleet Sustainability
Dashboard (FleetDASH)
system.
No
This is not a priority moving forward
because we already use as our primary
FMIS GSA’s “Fleet Drive Thru”
system, which enables us to feed data
into the Federal Motor Vehicle
Registration System (FMVRS), FAST,
and FleetDASH.
Increase acquisitions of zero
emission and plug-in hybrid
vehicles.
No
We procured two PHEVs so far in FY
2016, but we have not yet set a target for
the next 12 – 18 months.
Issue agency policy and a
plan to install appropriate
charging or refueling
infrastructure for zero
emission or plug-in hybrid
vehicles and opportunities for
ancillary services to support
vehicle-to-grid technology.
Yes
We are beginning discussions with all
stakeholders to gauge interest and
discuss how to implement this policy.
An approach to
workplace charging
chosen by the end of
CY 2017.
Optimize and right-size fleet
composition, by reducing
vehicle size, eliminating
underutilized vehicles, and
acquiring and locating
vehicles to match local fuel
infrastructure.
Yes
We regularly review our mission needs
and vehicle utilization to right-size our
fleet and will continue to do so through
vehicle utilization surveys, and quarterly
meetings with our Fleet Liaison’s. We
have reduced our fleet from 534 to 458
vehicles since 2005, a reduction of more
than 14 percent.
100 percent of new
acquisitions will match
local infrastructure,
confirmed through use
of the Alternative
Fueling Station
Locator System.
Increase utilization of
alternative fuel in dual-fuel
vehicles.
Yes
We have placed alternative fuel vehicles
(AFVs) in areas where AFV fueling
stations are within 5 miles or 15 minutes
of the garage zip code. We are placing
low-GHG vehicles, PHEVs, and/or
electric vehicles in areas where there is
no access to E85. We review
FleetDASH reports to determine if
additional opportunities exist to utilize
alternative fuel.
100 percent of new
acquisitions will match
local infrastructure,
confirmed through use
of the Alternative
Fueling Station
Locator System.
19
Strategy
Priority
for FY
2017
Strategy Narrative Targets and Metrics
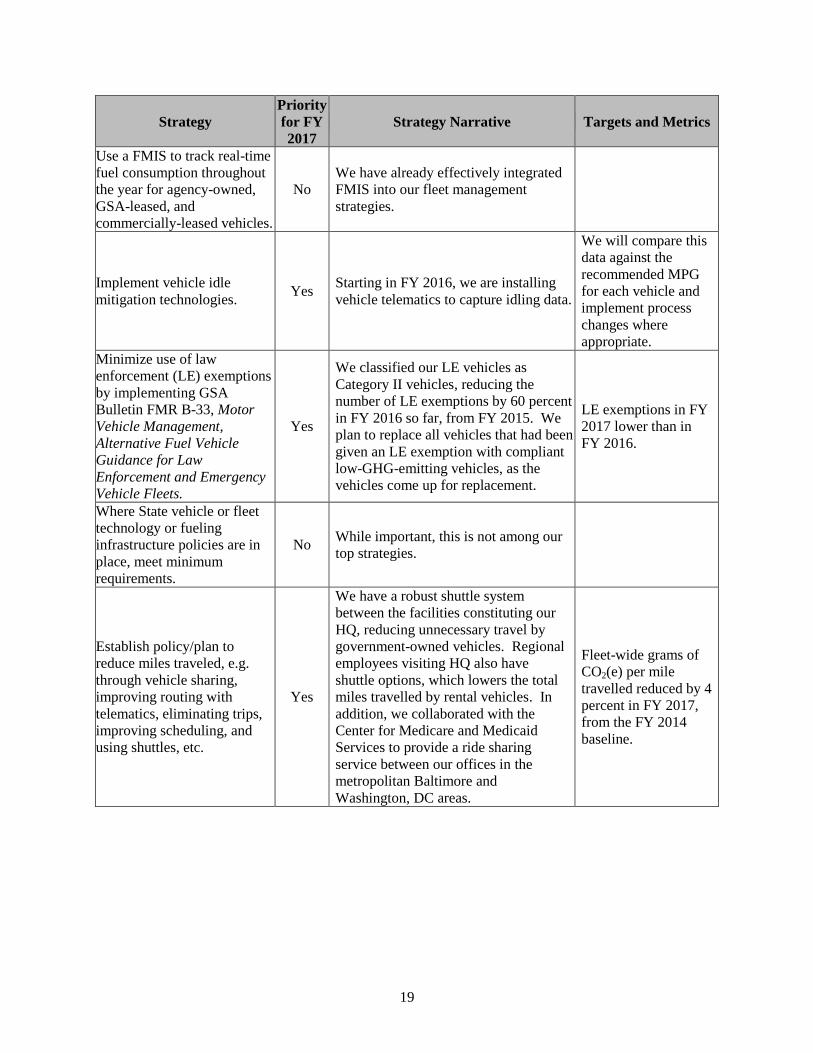
Use a FMIS to track real-time
fuel consumption throughout
the year for agency-owned,
GSA-leased, and
commercially-leased vehicles.
No
We have already effectively integrated
FMIS into our fleet management
strategies.
Implement vehicle idle
mitigation technologies. Yes
Starting in FY 2016, we are installing
vehicle telematics to capture idling data.
We will compare this
data against the
recommended MPG
for each vehicle and
implement process
changes where
appropriate.
Minimize use of law
enforcement (LE) exemptions
by implementing GSA
Bulletin FMR B-33, Motor
Vehicle Management,
Alternative Fuel Vehicle
Guidance for Law
Enforcement and Emergency
Vehicle Fleets.
Yes
We classified our LE vehicles as
Category II vehicles, reducing the
number of LE exemptions by 60 percent
in FY 2016 so far, from FY 2015. We
plan to replace all vehicles that had been
given an LE exemption with compliant
low-GHG-emitting vehicles, as the
vehicles come up for replacement.
LE exemptions in FY
2017 lower than in
FY 2016.
Where State vehicle or fleet
technology or fueling
infrastructure policies are in
place, meet minimum
requirements.
No While important, this is not among our
top strategies.
Establish policy/plan to
reduce miles traveled, e.g.
through vehicle sharing,
improving routing with
telematics, eliminating trips,
improving scheduling, and
using shuttles, etc.
Yes
We have a robust shuttle system
between the facilities constituting our
HQ, reducing unnecessary travel by
government-owned vehicles. Regional
employees visiting HQ also have
shuttle options, which lowers the total
miles travelled by rental vehicles. In
addition, we collaborated with the
Center for Medicare and Medicaid
Services to provide a ride sharing
service between our offices in the
metropolitan Baltimore and
Washington, DC areas.
Fleet-wide grams of
CO2(e) per mile
travelled reduced by 4
percent in FY 2017,
from the FY 2014
baseline.
20
Goal 6: Sustainable Acquisition
Sustainable Acquisition Goal
EO 13693 section 3(i) requires agencies to promote sustainable acquisition by ensuring that
environmental performance and sustainability factors are considered to the maximum extent practicable
for all applicable procurements in the planning, award and execution phases of acquisition.
Biobased Purchasing Targets
The Agricultural Act of 2014 requires that agencies establish a targeted biobased-only procurement
requirement. EO 13693 section 3(iv) requires agencies to establish an annual target for increasing the
number of contracts to be awarded with BioPreferred and biobased criteria and the dollar value of
BioPreferred and biobased products to be delivered and reported under those contracts in the following
fiscal year.
For FY 2017, SSA established a biobased purchasing target of 10 contracts and $10,561,000 in biobased
products to be delivered.
Chart: Percent of Applicable Contracts Containing Sustainable Acquisition Requirements
21
Sustainable Acquisition Strategies
Strategy
Priority
for FY
2017
Strategy Narrative Targets and Metrics
Establish and implement
policies to meet statutory
mandates requiring
purchasing preference
for recycled content
products, ENERGY
STAR qualified and
FEMP-designated
products, and
Biopreferred and
biobased products
designated by USDA.
Yes
We currently meet statutory mandates
requiring purchase preference for
recycled content products, Energy Star®
qualified and FEMP-designated products,
and Biopreferred and biobased products
designated by USDA and will continue to
do so. We include the applicable Federal
Acquisition Regulation (FAR) policy and
clause prescriptions in our Green
Purchasing Plan (Plan). We ensure
appropriate FAR clause inclusion during
quarterly sustainable acquisition reviews
and semi-annual acquisition management
reviews.
Quarterly sustainable
acquisition reviews and
semi-annual acquisition
management reviews
conducted through June
2017.
Establish and implement
policies to purchase
sustainable products and
services identified by
EPA programs,
including Significant
New Alternative Policy
(SNAP), WaterSense,
Safer Choice, and Smart
Way.
Yes
We were recognized by the EPA’s Safer
Choice Program as a 2016 Partner of the
Year. We currently require purchasing
preference for sustainable products and
services identified by EPA programs,
including SNAP, and WaterSense and we
will continue to do so. We include
applicable FAR policy and clause
prescriptions in our Plan. We ensure
appropriate FAR clause inclusion during
quarterly sustainable acquisition reviews
and semi-annual acquisition management
reviews. We will update our Plan to
include Safer Choice labeled and Smart
Way transport partners in sustainable
products and services.
1. Quarterly sustainable
acquisition reviews and
semi-annual acquisition
management reviews
conducted through June
2017.
2. SSA Green Purchasing
Plan updated by
December 30, 2016.
3. Updates to the Plan
announced, and the Plan
re-introduced through
targeted training by
February 28, 2017.
Establish and implement
policies to purchase
environmentally
preferable products and
services that meet or
exceed specifications,
standards, or labels
recommended by EPA.
No
We will continue to focus on improving
the procurement of environmentally
preferable products and services that
meet or exceed specifications, standards,
or labels recommended by EPA. We will
refer to EPA’s interim recommendations
until EPA’s Draft Guidelines for
Environmental Performance Standards
for Ecolabels for Voluntary Use in
Federal Procurement are finalized.
By December 30, 2016,
analyze and consider
updating the Plan to
incorporate EPA’s interim
environmentally
preferable products and
services that meet or
exceed specifications,
standards, or label
recommendations.
22
Strategy
Priority
for FY
2017
Strategy Narrative Targets and Metrics
Use Category
Management Initiatives
and government-wide
acquisition vehicles that
already include
sustainable acquisition
criteria.
No
We require contracting staff and
micropurchasers to first consider
procuring sustainable office supplies
from indefinite-delivery indefinite-
quantity contracts with the Federal
Strategic Sourcing Initiatives before
procuring items from any other source,
and we will continue to do so. We will
also encourage the use of category
management initiatives that already
include sustainable acquisition criteria.
During FYs 2016 and 2017, we will work
with SSA category management officials
to determine sustainable acquisition
criteria category management and
strategic sourcing policy, concentrating
on delivery services, maintenance, repair
and operations services, and janitorial
and sanitation services.
Sustainable acquisition
criteria category
management and strategic
sourcing policy
determined in FYs 2016
and 2017.
Ensure contractors
submit timely annual
reports of their
BioPreferred and
biobased purchases.
No
Not a priority focus because we already
verify contractor annual Biopreferred
product reports in the System for Award
Management (SAM) and will continue to
ensure that applicable contractors submit
their annual Biopreferred product reports
in SAM.
Reduce copier and
printing paper use and
acquiring uncoated
printing and writing
paper containing at least
30 percent postconsumer
recycled content or
higher.
Yes
Our Plan requires the acquisition of
paper containing at least 30 percent
postconsumer recycled content. Our
Electronics Stewardship Plan requires
that all printers contain and enable
duplex printing functions.
Quarterly sustainable
acquisition reviews and
semi-annual acquisition
management reviews
conducted through
December 2017.
Identify and implement
corrective actions to
address barriers to
increasing sustainable
acquisitions.
Yes
We will continue to address barriers to
increasing sustainable acquisition by
training agency contracting staff and
discussing corrective actions found
during quarterly sustainable acquisition
reviews and semi-annual acquisition
management reviews.
Training conducted and
corrective actions
discussed through
December 2017 during:
(1) quarterly sustainable
acquisition reviews, (2)
semi-annual acquisition
management reviews, and
(3) targeted sustainable
acquisition training.
23
Strategy
Priority
for FY
2017
Strategy Narrative Targets and Metrics
Improve quality of data
and tracking of
sustainable acquisition
through the Federal
Procurement Data
System (FPDS).
Yes
We monitor FPDS data quality,
including sustainable acquisition data,
through quarterly sustainable acquisition
reviews, semi-annual acquisition
management reviews, and annual FPDS
data quality reviews and will continue to
do so. We will continue to direct
contracting staff to take corrective
actions when we find inaccurate FPDS
data.
Training conducted and
corrective actions
discussed through
December 2017 during:
(1) quarterly sustainable
acquisition reviews, (2)
semi-annual acquisition
management reviews, (3)
annual FPDS data quality
reviews, and (4) targeted
sustainable acquisition
training.
Incorporate compliance
with contract
sustainability
requirements into
procedures for
monitoring contractor
past performance and
report on contractor
compliance in
performance reviews.
Yes
We issue regular Contractor
Performance Assessment Reporting
System (CPARS) reminders to
contracting staff. FAR Case 2014-010,
effective June 8, 2015, employed the
evaluation of sustainability compliance
in contractor performance reviews. We
follow the FAR guidance and will
continue to report sustainability
compliance with CPARS. We will
further supplement the FAR guidance
by updating agency-specific CCPARS,
acquisition policy Handbook, and Plan
guidance to include sustainability
compliance as an assessment factor by
December 31, 2016.
CPARS, acquisition
policy Handbook, and
Plan guidance updated to
include sustainability
compliance as an
assessment factor by
December 31, 2016.
Review and update
agency specifications to
include and encourage
products that meet
sustainable acquisition
criteria.
NA We do not develop or maintain any
agency-specific specifications.
Identify opportunities to
reduce supply chain
emissions and
incorporate criteria or
contractor requirements
into procurements.
Yes
We will investigate how to locate
opportunities to reduce supply chain
emissions and incorporate criteria or
contractor requirements into
procurements.
A plan developed to
introduce supply chain
emission reduction
criteria into agency
procurements with the
Office of Facilities and
Supply Management.
Goal 7: Pollution Prevention & Waste Reduction
24
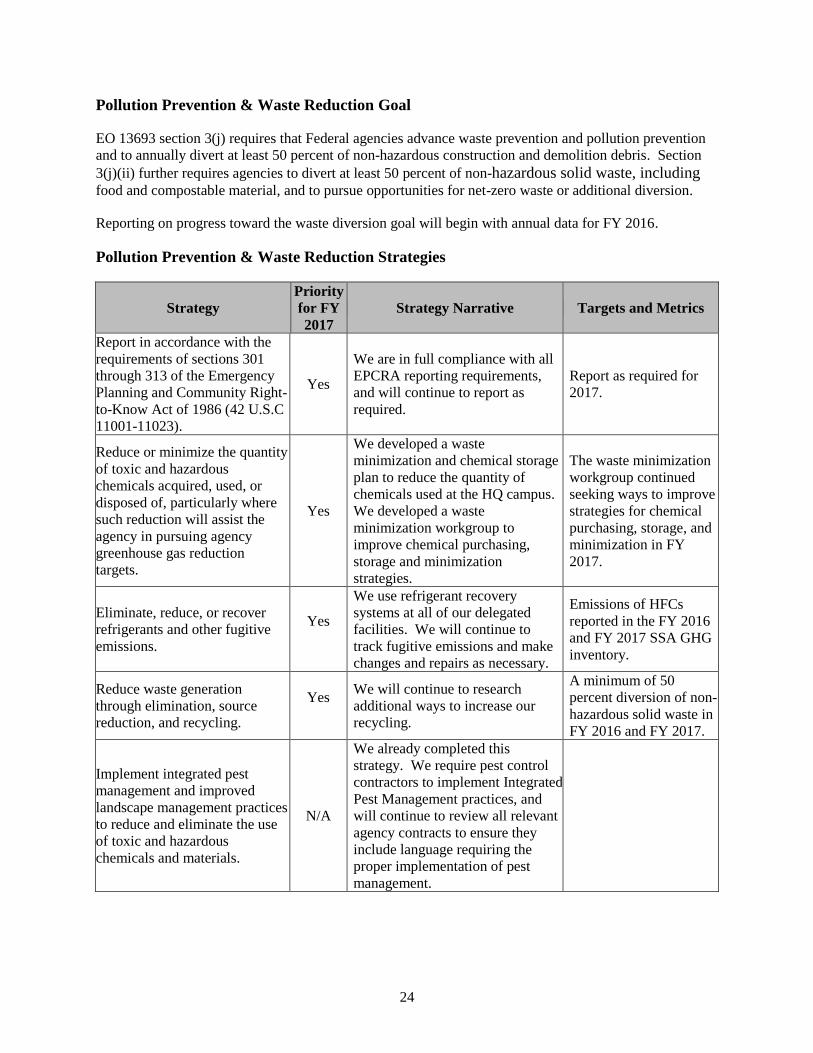
Pollution Prevention & Waste Reduction Goal
EO 13693 section 3(j) requires that Federal agencies advance waste prevention and pollution prevention
and to annually divert at least 50 percent of non-hazardous construction and demolition debris. Section
3(j)(ii) further requires agencies to divert at least 50 percent of non-hazardous solid waste, including food and compostable material, and to pursue opportunities for net-zero waste or additional diversion.
Reporting on progress toward the waste diversion goal will begin with annual data for FY 2016.
Pollution Prevention & Waste Reduction Strategies
Strategy
Priority
for FY
2017
Strategy Narrative Targets and Metrics
Report in accordance with the
requirements of sections 301
through 313 of the Emergency
Planning and Community Right-
to-Know Act of 1986 (42 U.S.C
11001-11023).
Yes
We are in full compliance with all
EPCRA reporting requirements,
and will continue to report as
required.
Report as required for
2017.
Reduce or minimize the quantity
of toxic and hazardous
chemicals acquired, used, or
disposed of, particularly where
such reduction will assist the
agency in pursuing agency
greenhouse gas reduction
targets.
Yes
We developed a waste
minimization and chemical storage
plan to reduce the quantity of
chemicals used at the HQ campus.
We developed a waste
minimization workgroup to
improve chemical purchasing,
storage and minimization
strategies.
The waste minimization
workgroup continued
seeking ways to improve
strategies for chemical
purchasing, storage, and
minimization in FY
2017.
Eliminate, reduce, or recover
refrigerants and other fugitive
emissions.
Yes
We use refrigerant recovery
systems at all of our delegated
facilities. We will continue to
track fugitive emissions and make
changes and repairs as necessary.
Emissions of HFCs
reported in the FY 2016
and FY 2017 SSA GHG
inventory.
Reduce waste generation
through elimination, source
reduction, and recycling.
Yes
We will continue to research
additional ways to increase our
recycling.
A minimum of 50
percent diversion of non-
hazardous solid waste in
FY 2016 and FY 2017.
Implement integrated pest
management and improved
landscape management practices
to reduce and eliminate the use
of toxic and hazardous
chemicals and materials.
N/A
We already completed this
strategy. We require pest control
contractors to implement Integrated
Pest Management practices, and
will continue to review all relevant
agency contracts to ensure they
include language requiring the
proper implementation of pest
management.
25
Strategy
Priority
for FY
2017
Strategy Narrative Targets and Metrics
Develop or revise Agency
Chemicals Inventory Plans and
identify and deploy chemical
elimination, substitution, and/or
management opportunities.
Yes
We developed a waste
minimization and chemical storage
plan to reduce the quantity of
chemicals used at the HQ campus.
We also formed a chemical safety
committee to identify redundant
chemicals, reduce hazardous
chemicals, and improve purchasing
practices.
The chemical safety
committee continued
working through FY
2017.
Inventory current HFC use and
purchases.
Yes
We will continue to inventory HFC
use and purchases, and all new
contracts that involve HFCs will
include a requirement for the
contractor to provide quantities of
HFCs used.
HFC use and purchases
inventoried annually.
Require high-level waiver or
contract approval for any agency
use of HFCs.
No
This is not among our top
strategies.
Ensure HFC management
training and recycling
equipment are available.
Yes
Training on the use of recycling
equipment is mandatory for all
HVAC personal and contract
personal, both in house and
contractors, and we will ensure that
such training is part of any new
contracts that involve HFCs.
All new HVAC
employees provided with
training on the use of
recycling equipment.
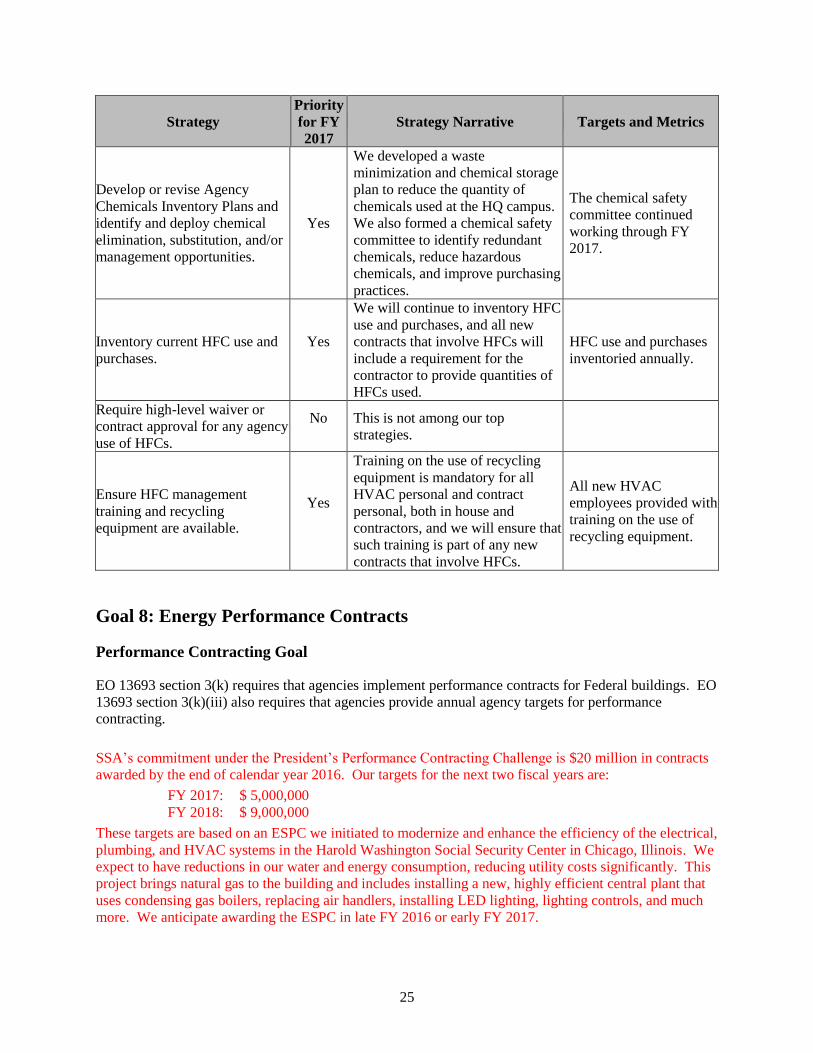
Goal 8: Energy Performance Contracts
Performance Contracting Goal
EO 13693 section 3(k) requires that agencies implement performance contracts for Federal buildings. EO
13693 section 3(k)(iii) also requires that agencies provide annual agency targets for performance
contracting.
SSA’s commitment under the President’s Performance Contracting Challenge is $20 million in contracts
awarded by the end of calendar year 2016. Our targets for the next two fiscal years are:
FY 2017: $ 5,000,000
FY 2018: $ 9,000,000
These targets are based on an ESPC we initiated to modernize and enhance the efficiency of the electrical,
plumbing, and HVAC systems in the Harold Washington Social Security Center in Chicago, Illinois. We
expect to have reductions in our water and energy consumption, reducing utility costs significantly. This
project brings natural gas to the building and includes installing a new, highly efficient central plant that
uses condensing gas boilers, replacing air handlers, installing LED lighting, lighting controls, and much
more. We anticipate awarding the ESPC in late FY 2016 or early FY 2017.
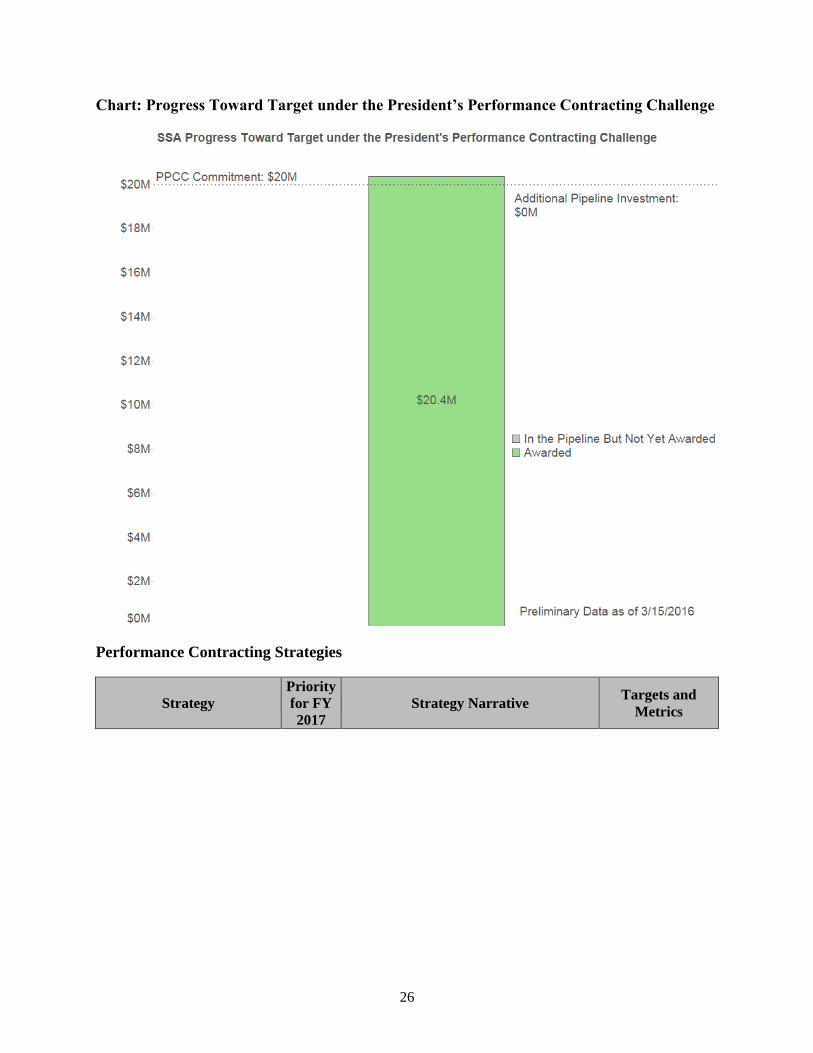
26
Chart: Progress Toward Target under the President’s Performance Contracting Challenge
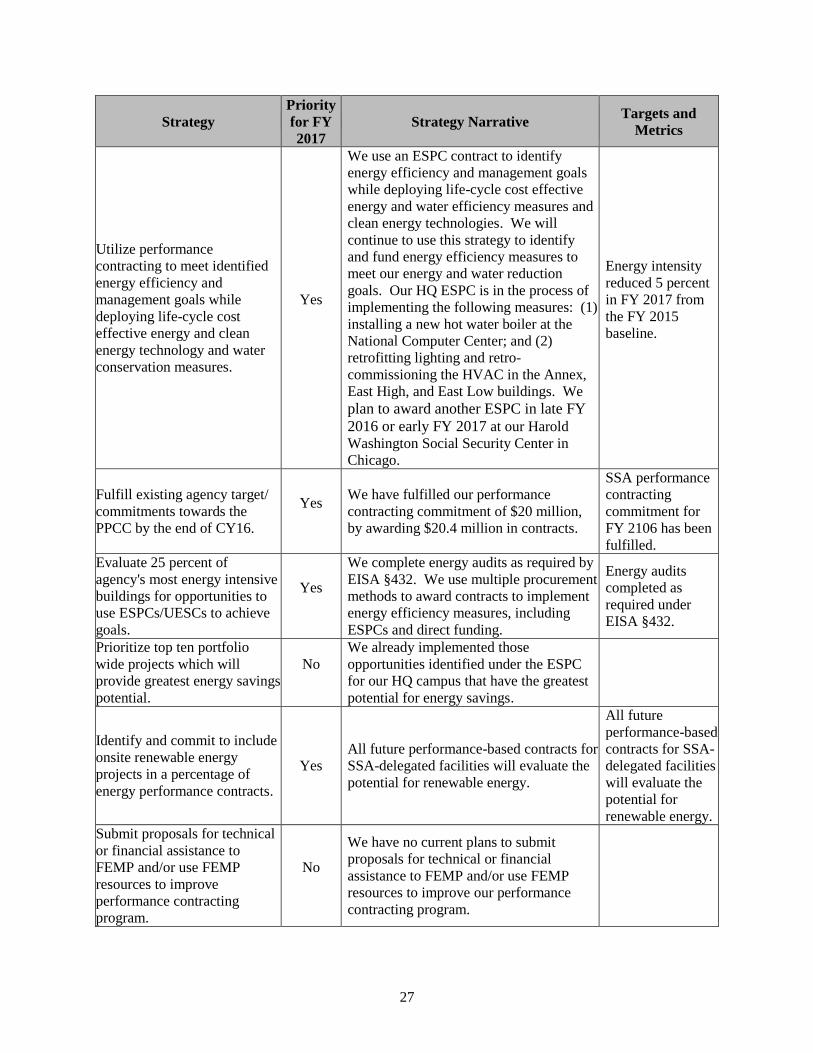
Performance Contracting Strategies
Strategy
Priority
for FY
2017
Strategy Narrative Targets and
Metrics
27
Strategy
Priority
for FY
2017
Strategy Narrative Targets and
Metrics
Utilize performance
contracting to meet identified
energy efficiency and
management goals while
deploying life-cycle cost
effective energy and clean
energy technology and water
conservation measures.
Yes
We use an ESPC contract to identify
energy efficiency and management goals
while deploying life-cycle cost effective
energy and water efficiency measures and
clean energy technologies. We will
continue to use this strategy to identify
and fund energy efficiency measures to
meet our energy and water reduction
goals. Our HQ ESPC is in the process of
implementing the following measures: (1)
installing a new hot water boiler at the
National Computer Center; and (2)
retrofitting lighting and retro-
commissioning the HVAC in the Annex,
East High, and East Low buildings. We
plan to award another ESPC in late FY
2016 or early FY 2017 at our Harold
Washington Social Security Center in
Chicago.
Energy intensity
reduced 5 percent
in FY 2017 from
the FY 2015
baseline.
Fulfill existing agency target/
commitments towards the
PPCC by the end of CY16.
Yes
We have fulfilled our performance
contracting commitment of $20 million,
by awarding $20.4 million in contracts.
SSA performance
contracting
commitment for
FY 2106 has been
fulfilled.
Evaluate 25 percent of
agency's most energy intensive
buildings for opportunities to
use ESPCs/UESCs to achieve
goals.
Yes
We complete energy audits as required by
EISA §432. We use multiple procurement
methods to award contracts to implement
energy efficiency measures, including
ESPCs and direct funding.
Energy audits
completed as
required under
EISA §432.
Prioritize top ten portfolio
wide projects which will
provide greatest energy savings
potential.
No
We already implemented those
opportunities identified under the ESPC
for our HQ campus that have the greatest
potential for energy savings.
Identify and commit to include
onsite renewable energy
projects in a percentage of
energy performance contracts.
Yes
All future performance-based contracts for
SSA-delegated facilities will evaluate the
potential for renewable energy.
All future
performance-based
contracts for SSA-
delegated facilities
will evaluate the
potential for
renewable energy.
Submit proposals for technical
or financial assistance to
FEMP and/or use FEMP
resources to improve
performance contracting
program.
No
We have no current plans to submit
proposals for technical or financial
assistance to FEMP and/or use FEMP
resources to improve our performance
contracting program.
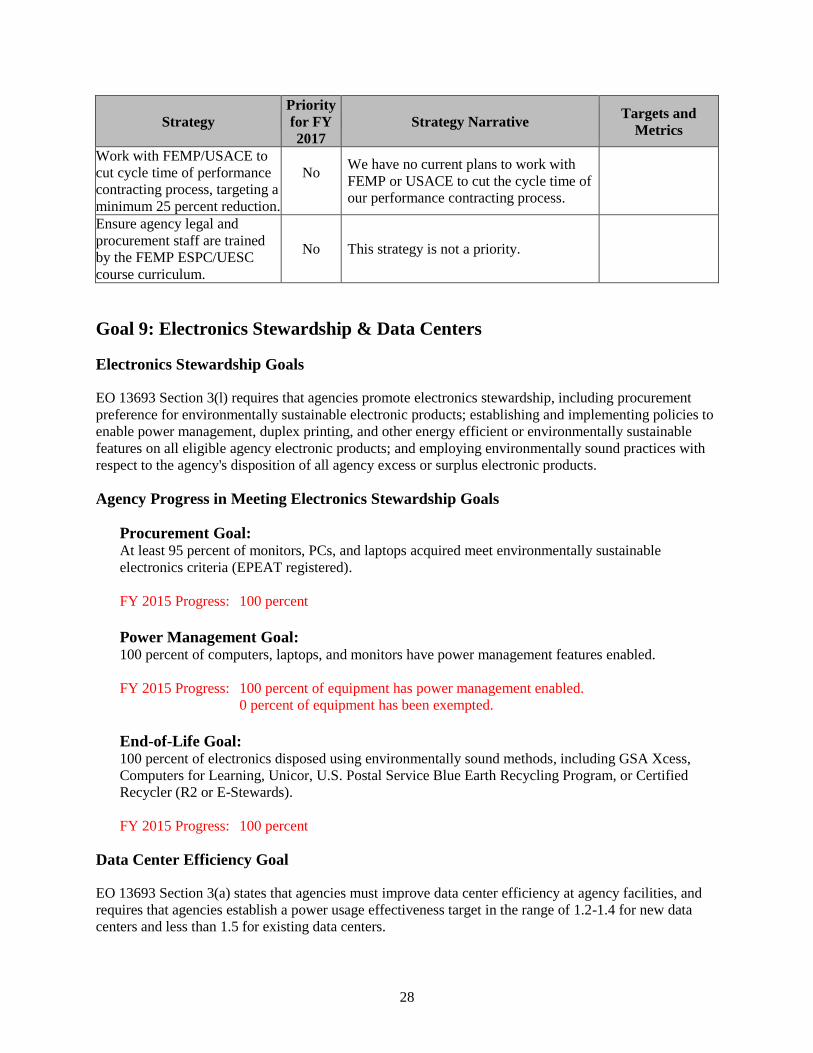
28
Strategy
Priority
for FY
2017
Strategy Narrative Targets and
Metrics
Work with FEMP/USACE to
cut cycle time of performance
contracting process, targeting a
minimum 25 percent reduction.
No
We have no current plans to work with
FEMP or USACE to cut the cycle time of
our performance contracting process.
Ensure agency legal and
procurement staff are trained
by the FEMP ESPC/UESC
course curriculum.
No This strategy is not a priority.
Goal 9: Electronics Stewardship & Data Centers
Electronics Stewardship Goals
EO 13693 Section 3(l) requires that agencies promote electronics stewardship, including procurement
preference for environmentally sustainable electronic products; establishing and implementing policies to
enable power management, duplex printing, and other energy efficient or environmentally sustainable
features on all eligible agency electronic products; and employing environmentally sound practices with
respect to the agency's disposition of all agency excess or surplus electronic products.
Agency Progress in Meeting Electronics Stewardship Goals
Procurement Goal: At least 95 percent of monitors, PCs, and laptops acquired meet environmentally sustainable
electronics criteria (EPEAT registered).
FY 2015 Progress: 100 percent
Power Management Goal: 100 percent of computers, laptops, and monitors have power management features enabled.
FY 2015 Progress: 100 percent of equipment has power management enabled.
0 percent of equipment has been exempted.
End-of-Life Goal: 100 percent of electronics disposed using environmentally sound methods, including GSA Xcess,
Computers for Learning, Unicor, U.S. Postal Service Blue Earth Recycling Program, or Certified
Recycler (R2 or E-Stewards).
FY 2015 Progress: 100 percent
Data Center Efficiency Goal
EO 13693 Section 3(a) states that agencies must improve data center efficiency at agency facilities, and
requires that agencies establish a power usage effectiveness target in the range of 1.2-1.4 for new data
centers and less than 1.5 for existing data centers.
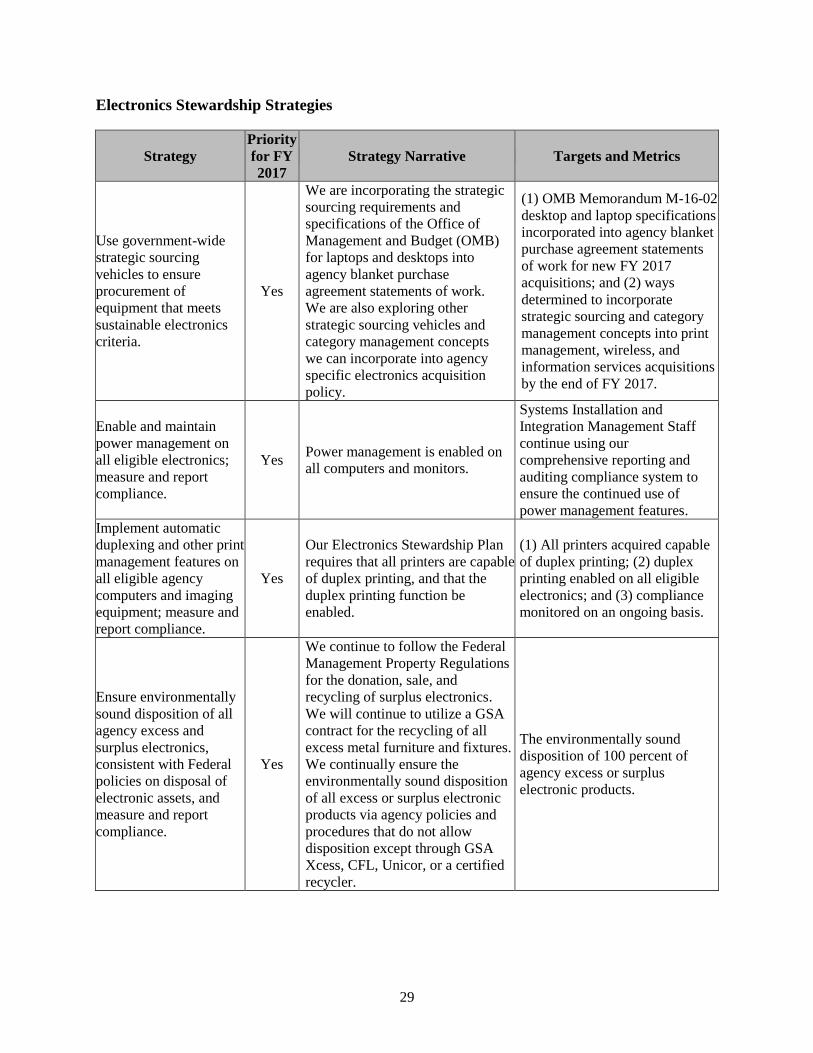
29
Electronics Stewardship Strategies
Strategy
Priority
for FY
2017
Strategy Narrative Targets and Metrics
Use government-wide
strategic sourcing
vehicles to ensure
procurement of
equipment that meets
sustainable electronics
criteria.
Yes
We are incorporating the strategic
sourcing requirements and
specifications of the Office of
Management and Budget (OMB)
for laptops and desktops into
agency blanket purchase
agreement statements of work.
We are also exploring other
strategic sourcing vehicles and
category management concepts
we can incorporate into agency
specific electronics acquisition
policy.
(1) OMB Memorandum M-16-02
desktop and laptop specifications
incorporated into agency blanket
purchase agreement statements
of work for new FY 2017
acquisitions; and (2) ways
determined to incorporate
strategic sourcing and category
management concepts into print
management, wireless, and
information services acquisitions
by the end of FY 2017.
Enable and maintain
power management on
all eligible electronics;
measure and report
compliance.
Yes Power management is enabled on
all computers and monitors.
Systems Installation and
Integration Management Staff
continue using our
comprehensive reporting and
auditing compliance system to
ensure the continued use of
power management features.
Implement automatic
duplexing and other print
management features on
all eligible agency
computers and imaging
equipment; measure and
report compliance.
Yes
Our Electronics Stewardship Plan
requires that all printers are capable
of duplex printing, and that the
duplex printing function be
enabled.
(1) All printers acquired capable
of duplex printing; (2) duplex
printing enabled on all eligible
electronics; and (3) compliance
monitored on an ongoing basis.
Ensure environmentally
sound disposition of all
agency excess and
surplus electronics,
consistent with Federal
policies on disposal of
electronic assets, and
measure and report
compliance.
Yes
We continue to follow the Federal
Management Property Regulations
for the donation, sale, and
recycling of surplus electronics.
We will continue to utilize a GSA
contract for the recycling of all
excess metal furniture and fixtures.
We continually ensure the
environmentally sound disposition
of all excess or surplus electronic
products via agency policies and
procedures that do not allow
disposition except through GSA
Xcess, CFL, Unicor, or a certified
recycler.
The environmentally sound
disposition of 100 percent of
agency excess or surplus
electronic products.
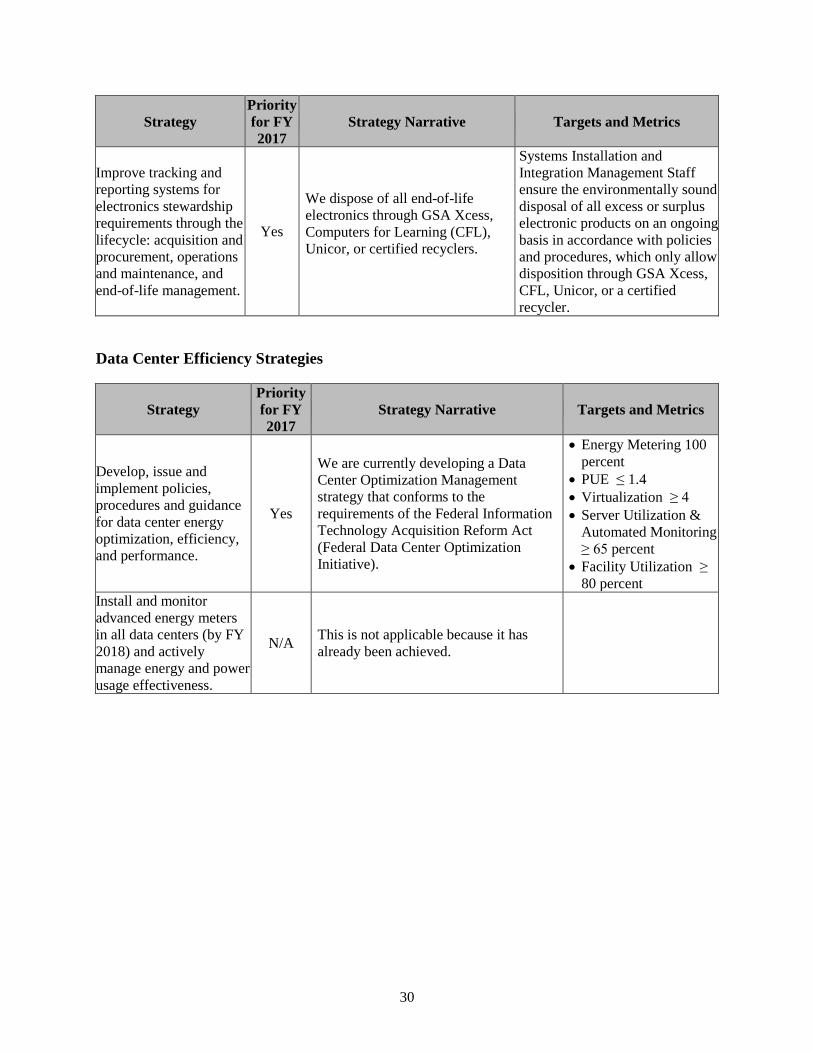
30
Strategy
Priority
for FY
2017
Strategy Narrative Targets and Metrics
Improve tracking and
reporting systems for
electronics stewardship
requirements through the
lifecycle: acquisition and
procurement, operations
and maintenance, and
end-of-life management.
Yes
We dispose of all end-of-life
electronics through GSA Xcess,
Computers for Learning (CFL),
Unicor, or certified recyclers.
Systems Installation and
Integration Management Staff
ensure the environmentally sound
disposal of all excess or surplus
electronic products on an ongoing
basis in accordance with policies
and procedures, which only allow
disposition through GSA Xcess,
CFL, Unicor, or a certified
recycler.
Data Center Efficiency Strategies
Strategy
Priority
for FY
2017
Strategy Narrative Targets and Metrics
Develop, issue and
implement policies,
procedures and guidance
for data center energy
optimization, efficiency,
and performance.
Yes
We are currently developing a Data
Center Optimization Management
strategy that conforms to the
requirements of the Federal Information
Technology Acquisition Reform Act
(Federal Data Center Optimization
Initiative).
Energy Metering 100
percent
PUE ≤ 1.4
Virtualization ≥ 4
Server Utilization &
Automated Monitoring
≥ 65 percent
Facility Utilization ≥
80 percent
Install and monitor
advanced energy meters
in all data centers (by FY
2018) and actively
manage energy and power
usage effectiveness.
N/A This is not applicable because it has
already been achieved.
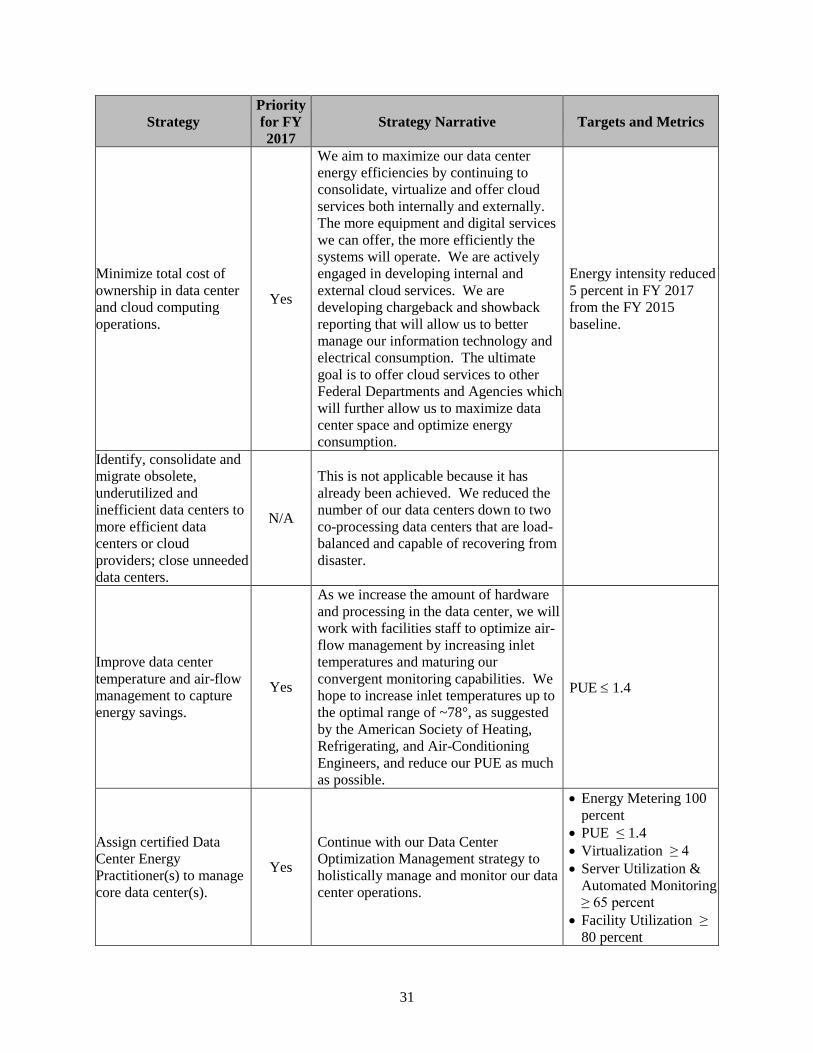
31
Strategy
Priority
for FY
2017
Strategy Narrative Targets and Metrics
Minimize total cost of
ownership in data center
and cloud computing
operations.
Yes
We aim to maximize our data center
energy efficiencies by continuing to
consolidate, virtualize and offer cloud
services both internally and externally.
The more equipment and digital services
we can offer, the more efficiently the
systems will operate. We are actively
engaged in developing internal and
external cloud services. We are
developing chargeback and showback
reporting that will allow us to better
manage our information technology and
electrical consumption. The ultimate
goal is to offer cloud services to other
Federal Departments and Agencies which
will further allow us to maximize data
center space and optimize energy
consumption.
Energy intensity reduced
5 percent in FY 2017
from the FY 2015
baseline.
Identify, consolidate and
migrate obsolete,
underutilized and
inefficient data centers to
more efficient data
centers or cloud
providers; close unneeded
data centers.
N/A
This is not applicable because it has
already been achieved. We reduced the
number of our data centers down to two
co-processing data centers that are load-
balanced and capable of recovering from
disaster.
Improve data center
temperature and air-flow
management to capture
energy savings.
Yes
As we increase the amount of hardware
and processing in the data center, we will
work with facilities staff to optimize air-
flow management by increasing inlet
temperatures and maturing our
convergent monitoring capabilities. We
hope to increase inlet temperatures up to
the optimal range of ~78°, as suggested
by the American Society of Heating,
Refrigerating, and Air-Conditioning
Engineers, and reduce our PUE as much
as possible.
PUE 1.4
Assign certified Data
Center Energy
Practitioner(s) to manage
core data center(s).
Yes
Continue with our Data Center
Optimization Management strategy to
holistically manage and monitor our data
center operations.
Energy Metering 100
percent
PUE ≤ 1.4
Virtualization ≥ 4
Server Utilization &
Automated Monitoring
≥ 65 percent
Facility Utilization ≥
80 percent
32
Goal 10: Climate Change Resilience
EO 13653, Preparing the United States for the Impacts of Climate Change, outlines Federal agency
responsibilities in the areas of supporting climate resilient investment; managing lands and waters for
climate preparedness and resilience; providing information, data and tools for climate change
preparedness and resilience; and planning.
EO 13693 Section 3(h)(viii) states that as part of building efficiency, performance, and management,
agencies should incorporate climate-resilient design and management elements into the operation, repair,
and renovation of existing agency buildings and the design of new agency buildings. In addition, Section
13(a) requires agencies to identify and address projected impacts of climate change on mission critical
water, energy, communication, and transportation demands and consider those climate impacts in
operational preparedness planning for major agency facilities and operations. Section 13(b) requires
agencies to calculate the potential cost and risk to mission associated with agency operations that do not
take into account such information and consider that cost in agency decision-making.
Climate Change Resilience Strategies
Strategy
Priority
for FY
2017
Strategy Narrative Targets and
Metrics
Strengthen agency external
mission, programs, policies
and operations (including
grants, loans, technical
assistance, etc.) to
incentivize planning for, and
addressing the impacts of,
climate change.
N/A
We have no such external programs relevant
for incentivizing, planning for, and
addressing the impacts of climate change.
Update and strengthen
agency internal mission,
programs, policies, and
operations to align with the
Guiding Principles, including
facility acquisition, planning,
design, training, and asset
management processes, to
incentivize planning for and
addressing the impacts of
climate change.
Yes
To address the potential need to strengthen
our programs, policies, and operations for
resilience to climate change, in 2014 we
conducted a survey of our delegated facilities
regarding local weather-related problems
facilities have already experienced, concerns
facilities have for the future (including due to
climate change), and facility contingency
planning to address potential hazards. The
responses identified a number of issues,
including flooding, wildfire, and power
outages. However, we also determined that
our facilities are well prepared for weather-
related problems, fire emergencies, and
pandemic/infectious/communicable disease
because of formal contingency processes.
We do not anticipate new construction in the
foreseeable future.
All COOPs and
other relevant
contingency plans
reviewed
according to their
review cycle and
updated as
needed.
33
Strategy
Priority
for FY
2017
Strategy Narrative Targets and
Metrics
Update emergency response,
health, and safety procedures
and protocols to account for
projected climate change,
including extreme weather
events.
Yes
We will ensure that all of our contingency
plans, such as Continuity of Operations Plans
(COOPs), are reviewed during their regular
review cycle to ensure they remain current as
changes to the operational environment
occur, or are anticipated to occur, including
due to climate change. This will include
human health and safety impacts due to
climate change, such as unsafe air quality,
unsafe heat index conditions, dangerous
conditions from severe storms, and new
disease threats due to an expanded range of
vector borne diseases into the United States.
All COOPs and
other relevant
contingency plans
reviewed
according to their
review cycle and
updated as
needed.
Ensure climate change
adaptation is integrated into
both agency-wide and
regional planning efforts, in
coordination with other
Federal agencies as well as
state and local partners,
Tribal governments, and
private stakeholders.
N/A We do not participate in agency-wide or
regional planning efforts.
Ensure that vulnerable
populations potentially
impacted by climate change
are engaged in agency
processes to identify
measures addressing relevant
climate change impacts.
Yes
We already make our services available
online so customers with mobility or health
issues can obtain the assistance they need
without visiting one of our field offices. We
have provisions in place to ensure the
continuity of web-based services in the event
of disruptions to the electricity grid.
Continuity of
web-based
services assured
on an ongoing
basis, in the event
of disruptions to
the electricity
grid.
Identify interagency climate
tools and platforms used in
updating agency programs
and policies to encourage or
require planning for, and
addressing the impacts of,
climate change.
Yes
We have used and will continue using (if it is
kept up to date) the adaptation planning
module of the GSA Sustainable Facilities
Tool (https://sftool.gov/), titled “How Federal
Agency Adaptation Plans Address
Vulnerabilities.” We will continue to watch
for additional interagency planning tools
relevant to SSA that become available in the
future.
Interagency tools
used to develop
our next climate
change adaptation
plan, due after the
next quadrennial
National Climate
Assessment is
issued (in 2018 or
2019).
34
Appendix 1: Fleet Management Plan and VAM Report
Developing a Fleet Management Plan is critical to an agency in defining and describing how the motor
vehicle fleet serves its mission needs. A Fleet Management Plan is multi-year map of a systematic
approach to vehicle acquisition, use, maintenance, refueling, and replacement. The plan should anticipate
and account for changes in mission, organization, and resulting vehicle demand. The plan must establish a
strategy for achieving full compliance with mandates to lower greenhouse gas (GHG) emissions, acquire
alternative fueled vehicles, utilize alternative fuels including bio-based fuels, acquire low greenhouse gas
emitting vehicles, incorporate telematics, acquire zero emission vehicles, convert to asset level data
reporting, and reduce petroleum. The plan must also define how vehicle selection will advance
sustainable acquisition, achieve maximum fuel efficiency, and limit motor vehicle body size, engine size
and optional equipment to what is essential to meet the agency’s mission. The plan should guide the
programming of funds necessary to continue fleet operations.
This document provides the template for Executive Branch agencies to prepare and update Fleet
Management Plans to obtain an optimal fleet inventory and document the steps being taken to operate
those fleets most effectively and efficiently. Agency adherence to this guidance will ensure compliance
with the Executive Order 13693 requirement to prepare a Fleet Management Plan and incorporate it into
the agency Annual Strategic Sustainability Performance Plan. It will also satisfy the instructions in OMB
Circular A-11 entitled “Fleet Data Reporting in FAST” for a narrative section to explain and support
inventory and cost data.
Instructions: Address each of the 11 areas listed below clearly and completely. Take as much space as
needed. Please view this as your opportunity to tell your agency’s story, to profile your agency’s fleet
operations, to explain its unique challenges, and to present its successes and failures. Read the
introductory material carefully and address all of the questions. If something does not apply to your
agency, say so; if the question misses something important that sheds light on your agency’s fleet, add it.
Be aware that not everyone reading your document may be a fleet expert so communicate clearly as if
writing for the layman. Please leave the questions in place along with your response.
FY 2015 FLEET MANAGEMENT PLAN AND BUDGET NARRATIVE
FOR
(Social Security Administration)
(A) Introduction that describes the agency mission, organization, and overview of the role of the
fleet in serving agency missions.
(1) Briefly describe your agency’s primary/core mission and how your fleet is configured to support it.
(2) Please describe the organizational structure and geographic dispersion of your fleet.
(3) Describe your agency’s ancillary missions, such as administrative functions, and how your fleet
supports them.
(4) Describe how vehicles are primarily used, and how do mission requirements translate into the need for
particular vehicle quantities and types.
35
Our mission is to deliver Social Security services that meet the changing needs of the public. Few
government agencies touch the lives of as many people as we do. The programs we administer provide a
financial safety net for millions of Americans, and many people consider them the most successful large-
scale Federal programs in our Nation’s history. Social Security initially covered retired workers. Later
program expansions added dependent and Survivor benefits, as well as Disability Insurance (DI). We also
administer the Supplemental Security Income (SSI) program, a Federal needs-based program financed
through the general revenue funds. In fiscal year (FY) 2015, we provided, on average each month,
benefits to approximately 47 million OASI beneficiaries, 11 million DI beneficiaries, and
8 million recipients of Federal SSI benefits, of whom approximately 2.6 million were also beneficiaries of
OASI or DI benefits. Total benefit payments during FY 2015 were approximately $734 billion for OASI,
$143 billion for DI, and $55 billion for Federal SSI benefits.
We have over 65,000 employees and deliver services through a nationwide network of about 1,500
offices. We also have a presence in several United States embassies around the globe. Our field offices
and card centers are the primary points of contact for in-person interaction with the public. Our tele
service centers primarily handle telephone calls to our national 800 number. Employees in our processing
centers primarily handle Social Security retirement, survivors, and disability payments, but also perform a
wide range of other functions, which include answering calls to our National 800 Number. We depend on
State employees in 54 State and Territorial Disability Determination Services to make disability
determinations. The administrative law judges in our hearing offices and administrative appeals judges in
our Appeals Council make decisions on appeals of denied Social Security and SSI claims.
Geographically, we are divided into 10 regional offices and a Headquarters.
Our fleet is comprised of 27 heavy-duty vehicles and buses, 18 medium-duty vehicles, 142 light-duty
vehicles (minivans, pickup, etc.), and 273 sedans for 460 vehicles. We use these vehicles throughout the
10 regions and at Headquarters. Employees use passenger vehicles for official business when conducting
investigations or retirement, survivors, and disability interviews with the American public. The large
passenger vehicles operate as shuttles to carry employees to central locations for meetings and training.
The agency utilizes trucks and trailers to transport mail, supplies, equipment, and furniture throughout the
regions, Headquarters, and between offices in the Baltimore and Washington D.C. metropolitan areas.
(B) Description of vehicle acquisition/replacement strategies.
(1) Describe your agency’s vehicle sourcing strategy and decision(s) for purchasing/owning vehicles
compared with leasing vehicles through GSA Fleet or commercially. When comparing the cost of owned
vehicles to leased vehicles, you should compare all direct and indirect costs projected for the lifecycle of
owned vehicles to the total lease costs over an identical lifecycle. Include a rationale for acquiring
vehicles from other than the most cost effective source. Note: Information on calculating indirect cost is
contained in FMR Bulletin B-38, Indirect Costs of Motor Vehicle Fleet Operations.
(2) Describe your agency’s plans and schedules for locating AFVs in proximity to AFV fueling stations.
(3) Describe your agency’s approach to areas where alternative fuels are not available and whether
qualifying low greenhouse gas (LGHG) vehicles or ZEVs are being placed in such areas.
(4) EO13693 requires agencies to reduce greenhouse gas (GHG) emissions as compared to a 2014
baseline. Describe your agency’s plans to meet this goal. If funding is required to comply with this
mandate, do you have documentation that it has been requested?
36
(5) EO13693 requires agencies to acquire zero emission vehicles (ZEVs) as an increasing percentage of
passenger vehicle acquisitions. Describe your agency’s plans to meet this goal. If funding is required to
comply with this mandate, do you have documentation that it has been requested?
(Note: Do not attach or provide funding documentation unless requested)
The agency’s primary sourcing strategy for acquiring vehicles is through GSA Fleet. When comparing the
cost of owned vehicles to the cost of leased vehicles, we have found that it is beneficial and more cost
effective to lease vehicles through GSA Fleet versus owning vehicles. Leasing vehicles through GSA
Fleet, allows us to maintain a newer fleet without the maintenance costs. However, we do acquire
commercial leases when necessary for executive personnel when no suitable executive vehicle is offered
through GSA Fleet.
Our 2014 GHG baseline was 373.7. Our intermediary 2015 GHG score was 369.04. We have already
started showing a reduction in GHG emissions. Our plan will be in phases, starting in FY16, we plan to
meet the requirements of EO 13693 by acquiring all low GHG vehicles to the maximum extent possible.
We have strategically placed all newly acquired vehicles in areas with supporting fuel type
infrastructures. All vehicles located within 5 miles or 15 minutes of an E85 fueling station will receive an
E85 capable flex fuel vehicle. Vehicles outside of an E85 radius will receive a low GHG dedicated
gasoline vehicle. The HQ Fleet Manager monitors all vehicle acquisitions and will not approve any non-
compliant, non-Low GHG vehicle without strong justification supporting a functional need exception.
This process will continue until all vehicles are in locations with supporting fuel infrastructures as
identified by the DOE Alternative fuel locator.
Our plan to meet the requirements of 20% ZEVs started in FY15. In December of FY16, we have
procured two plug-in Hybrid vehicles. As a part of our VAM survey, we intentionally added new
questions pertaining to how the vehicles are being used. This data will help us identify vehicles not used
to perform investigative work while simultaneously identifying potential locations for a PHEV’s or EV’s.
All subcomponents within the agency have been informed to identify potential places for ZEVs and to
budget for appropriate funding. SSA’s fleet budget is not centralized. Each component has and controls
their own budget. Office of Supply Warehouse Management(OSWM) has informed the other components
of the new requirements and advised them to budget accordingly. OSWM can produce documentation for
the vehicles that OSWM utilizes and maintains at HQ.
(C) Description of Telematics related acquisition strategies.
(1) EO13693 requires agencies to incorporate telematics into the fleet. Describe your agency’s plans to
meet this goal.
(2) If funding is required to comply with this mandate, do you have documentation that it has been
requested? (Do not attach or provide funding documentation unless requested).
(3) Has the agency acquired the telematics system through GSA or directly from a vendor/company? If
so, provide the name of the vendor/company. Did the costs of telematics systems acquired directly from
the vendor/company exceed those provided through GSA? If so, please provide rationale for the decision.
(4) Describe the type of telematics technology installed (satellite, cellular or radio frequency identification
(RFID)).
37
(5) What type of telematics features are installed in your vehicles. Check all that apply from the list
below: (Note – When the form is finalized, there will be check boxes or drop down box included on the
template)
GPS tracking - Fleet managers can monitor the location of their vehicles in real-time by logging on to a
user accessible website.
Engine diagnostics - Fleet managers can have engine diagnostics reports delivered to their email
showing the current condition of the vehicle, odometer readings, idle time, emissions information and
speed data.
Vehicle monitoring and driver identification - Fleet managers can track a driver of every vehicle via
the usage of key fobs for the drivers or in-vehicle devices and can track who is, or was, driving any given
vehicle at any particular time, as well as limit who can operate which vehicles.
In-vehicle recording – This solution uses inward and outward facing cameras to record the driver’s
behavior as well as the vehicle’s surroundings. The device saves the footage from several seconds before
and after a sudden movement occurs, such as sudden stop or hard turn.
Instant driver feedback – This system provides an immediate, private, in cabin indication via light
activation within the driver’s line of sight. The feedback device is designed to track and report harsh
breaking, sudden acceleration, cornering/high speed turns, unsafe lane changes and speeding (with a pre-
determined speeding threshold).
Other – Describe other service
Fuel Usage - Information on gallons of fuel and subsequent MPG calculations.
(6) Describe the obstacles encountered, lessons learned, and any experiences or other information that
may benefit other agencies. Consideration should be given to the impact that aftermarket telematics may
have on vehicle warranties.
We plan to meet the telematics requirements of EO 13693 in three phases, starting in May of FY16, HQ
will test 10 Category II devices procured through GSA contract GS-#F-CA051 provided by AT&T. If
testing is successful, and the devices are reliable and provide us the data that we require, we will direct all
sub components of SSA to procure the appropriate number of devices for their sub fleet. 50% of the
devices will be procured in FY16 and the remaining 50% of the devices will be procured in early FY17.
We have decided that this was the best course of action in order to keep the data consistent. All sub
components have been advised to budget for this additional requirement and to provide us confirmation
from the component’s Fleet Liaison. According to the General Services Administration, the Category II
devices provided under this contract meet the requirements of EO 13693 and can provide us vehicle data
that will assist us in obtaining an optimum fleet. The category II telematics devices acquired through this
contract use cellular technology with the following features:
GPS Tracking
Engine Diagnostics
Idling
Utilization
38
Emissions
Vehicle monitoring and driver ID
Fuel usage
One obstacle we encountered in FY16, which contributed to us making this decision, was that telematics
was not offered in all vehicles and each manufacturer offered a different website to access data, which
would complicate the telematics management process.
(D) Description of efforts to control fleet size and cost.
(1) Provide an explanation for any measurable change in your agency’s fleet size, composition, and/or
cost or if you are not meeting optimal fleet goals (based on agency VAM study results).
(2) Describe the factors that hinder attainment of your optimal fleet (e.g., budgetary, other resource issues,
mission changes, etc.).
(3) Discuss any trends toward larger, less fuel-efficient vehicles and the justifications for such moves.
(4) Are you aware of and do you consider alternatives (short term rental, pooling, public transportation,
etc.) to adding a vehicle to the agency’s fleet?
(5) Discuss the basis used for your future cost projections (published inflation estimates, historical trends,
flat across-the-board percentage increases, mission changes, etc.)
Our fleet has under taken a small change in Fleet Size, with a considerable change in fleet composition.
Our overall vehicle size is decreasing across the agency. Our vehicle of choice for FY16 was compact
sedans or compact SUV’s. This is a substantial difference from previous years when midsize sedans were
the vehicle of choice. By reducing the vehicle size, we also gained a financial benefit of lower lease costs.
Our VAM goal was 479 vehicles, and we are currently below our VAM goal. We have no intention and
have seen no trends that indicate we will need to move toward larger, less fuel-efficient vehicles of any
kind in the future. One of the factors that must be considered, that will not hinder attainment of our
optimum fleet but will delay it, is that we have a large amount of vehicles being used for investigative
work. Sixty percent of our fleet is used by the Office of Inspector General (OIG) or Cooperative
Disability Investigative (CDI)components of SSA.
In past years, we have added a flat 3 percent growth into our cost projections and did the same for FY15
through FY18 projections. We have found this increase to be suitable while giving us the flexibility to
cover unexpected requirements.
We are aware of the alternatives to adding to our fleet. We use GSA’s Short Term Rental program to fill
short term vehicle requirements when necessary.
(E) Description of Vehicle Assignments and Vehicle Sharing.
(1) Describe how vehicles are assigned at your agency (i.e., individuals, offices, job classifications, motor
pools).
(2) Describe your agency’s efforts to reduce vehicles assigned to a single person wherever possible.
39
(3) Describe pooling, car sharing, and shuttle bus consolidation initiatives as well as efforts to share
vehicles internally or with other Federal activities.
(4) Describe how home-to-work (HTW) vehicles are justified, assigned, and reported, as well as what
steps are taken by your agency to limit HTW use.
(5) Does your agency document/monitor the additional cost of HTW use of Federal vehicles? If so, please
describe how.
We assign vehicles to regional offices and the Headquarters motor pool based on the frequency of official
travel performed by full time personnel, required travel for the position, and the location of employees’
duty stations. The employees use the vehicles for official business, such as, attending meetings or
conducting investigative, retirement, survivors, disability, and supplemental income interviews with the
public. We assign vehicles both to individuals and offices based on the type of work they are performing.
We assign individual vehicles to investigative employees in our OIG component due to their unique
official duties.
We determine the number of medium and heavy-duty vehicles based on the requirements for delivering
equipment, supplies, and furniture to facilities in the Baltimore/Washington D.C. metropolitan areas and
offices located throughout the 10 regions.
To minimize the number of vehicles assigned to a single person we:
Encourage employees to seek mass or public transportation for official travel when it is more
advantageous for the Government
Provide shuttle services for employees on official business requiring movement in and around the
Baltimore and Washington D.C. metropolitan areas; and
Consolidate transportation request and encourage car sharing when traveling to the same
destination at the same time.
Provide a Headquarters motor pool for U-drive it vehicles or motor vehicle operator-driven
vehicles for larger groups of employees.
In accordance with the GSA Bulletin FMR B-35, we limit home-to-work authorizations to the
Commissioner and the Deputy Commissioner as well as approved OIG special agents stationed in the
regions. We require a Home to Work authorization letter that is maintained within each component’s
Headquarters for all HTW use of vehicles. We do not monitor the HTW usage and cost for the OIG
agents at this time but will consider doing so in the future.
(F) Evidence of Vehicle Allocation Methodology (VAM) Planning.
Provide information on the methods used to determine your agency’s VAM targets/optimal inventory.
(Recommendation #2 from GAO report: GAO-13-659. See FMR Bulletin B-30 for guidance on
conducting a VAM study and developing VAM targets).
(1) What is the date of your agency’s most recent VAM study? Please describe the results
(Add/Reduce/Change vehicle types, sizes, etc.). Have all bureaus been studied?
40
(2) From your most recent VAM study, please describe/provide the specific utilization criteria (miles,
hours, vehicle age, or other measures) used to determine whether to retain or dispose of a vehicle? If
different criteria were used in different bureaus or program areas, provide the criteria for each.
(3) From your most recent VAM study, what were the questions used to conduct the VAM survey (see
FMR Bulletin B-30(6)(C)) (if lengthy, provide as an attachment)? If different questions were used by
different bureaus or program areas, provide the questions for each. If a VAM survey was not conducted,
please describe the methods used to apply utilization criteria to each vehicle in your agency’s fleet and
collect subjective information about each vehicle that potentially could provide valuable
insights/explanations into the objective criteria.
We set our initial VAM target based on specific individual vehicle usage data we received by utilizing the
sample VAM survey questions provided in the initial VAM guidance release. Subsequently in March
2013, we conducted a review and validation of all agency vehicles that averaged less than 200 miles a
month for six consecutive months. After completing this review, we turned in 11 underutilized vehicles.
In April 2015, we again reutilized the VAM survey questions to validate the continued need for all
assigned vehicles.
In FY 2015, we increased our fleet from 458 to 460 vehicles, and today we are at 460 vehicles, which is
below our VAM target of 479 vehicles for FY 2015. Upon evaluating the survey responses and taking the
information below into consideration, we are maintaining our VAM target at 479 for FY 2015.
We meet with our internal fleet liaisons to inquire about future fleet requirements, such as, increasing our
partnership with Local and State Law Enforcement agencies and standing up seven additional CDI units.
Each unit typically has at least two vehicles used in combatting disability fraud at the lowest level. We are
committed to our anti-fraud efforts, and we partnership with the OIG to root out and prevent disability
fraud wherever it may occur.
In our most recent VAM survey, we used all the questions from our old VAM survey and a couple new
questions that were added this year. These additional questions will be helpful in assisting us in meeting
the requirements of EO 13693. The New questions are geared to the way the vehicles are being used to
help identify potential locations where Zero Emission Vehicles can be placed. The new questions were:
1. Do you use your vehicle for administrative purposes?
2. Do you use your vehicle for investigative purposes?
Based on this information, vehicles used to perform administrative work could be considered potential
locations for EV’s or PHEV’s.
(G) Description of the agency-wide Vehicle Management Information System (See FMR 102-
34.340)
Federal agencies are to begin collecting asset level data (ALD) beginning October 1, 2016 in order to be
able to report ALD in the October-December 2017 FAST data call. To comply, your agency will need a
management information system (MIS) capable of reporting inventory, cost, usage, and other information
on a “per vehicle” basis.
(1) Does your agency have a vehicle management information system (MIS) at the Department or Agency
level that identifies and collects accurate inventory, cost, and use data that cover the complete lifecycle of
41
each motor vehicle (acquisition, operation, maintenance, and disposal), as well as provides the
information necessary to satisfy both internal and external reporting requirements?
(2) Your agency was provided a draft list of 70 VLD data elements. How many of the 70 data elements is
your current system able to report on a “per vehicle” basis right now?
(3) Describe your agency’s plan for reporting all required ALD elements. What is the timeline?
(4) If your agency does not currently have a system capable of reporting ALD, describe the steps
(documented) that are being taken or have been taken to comply with Executive Orders, regulations, and
laws that require such a system.
(5) If your agency currently uses telematics systems, does your MIS capture and report all of the data
from those devices?
We utilize GSA’s “Fleet Drive-Thru” Fleet Management Information System (FMIS)as our primary fleet
management tool. We utilize the system’s “reports carryout” tool to produce a Microsoft Excel
spreadsheet listing our GSA-leased vehicles. We also enter the data for our four agency-owned and one
commercially-leased vehicle to produce a comprehensive listing of all assigned vehicles. The current
system does not report vehicles at the “vehicle level”, It reports vehicles by the vehicle class. We
currently report the vehicle type, fuel type, and location.
We have consulted with the General Services Administration about Asset Level Data, and they have
informed us that starting in 2017, GSA Fleet Drive Thru FMIS will be able to provide data at the asset
level for all data elements as required by EO 13693.
(H) Justification for restricted vehicles.
(1) If your agency uses vehicles larger than class III (midsize), is the justification for each one
documented?
(2) Does your agency use the law enforcement (LE) vehicle classification system described in GSA
Bulletin FMR B-33? If not, why not?
(3) If your agency reports limousines in its inventory, do they comply with the definition in GSA Bulletin
FMR B-29?
(4) For armored vehicles, do you use the ballistic resistance classification system of National Institute of
Justice (NIJ) Standard 0108.01, and restrict armor to the defined types?
(5) Are armored vehicles authorized by appropriation?
In accordance with the implementation guidance for the Energy Independence and Security Act of 2007,
Section 141, we have an approved agency exception letter on file and maintain exception data for all
vehicles within our fleet that are larger than a class III (midsize) vehicle. We have two Law Enforcement
(LE) vehicles used for investigative purposes, which is classified as LE 1. However, we have elected not
to exempt any vehicles from the Energy Policy Act of 2005 or VAM reporting.
We post the executive fleet vehicle on the agency’s website as required by the Presidential Memorandum
of May 2011. SSA has no limousines or armored vehicles.
42
(I) Impediments to optimal fleet management.
(1) Please describe the obstacles your agency faces in optimizing its fleet.
(2) Please describe the ways in which your agency finds it hard to make the fleet what it should be,
operating at maximum efficiency.
(3) If additional resources are needed, (such as to fund management information system implementation
or upgrades, or to acquire ZEVs, or LGHG vehicles, or install alternative fuel infrastructure) have they
been documented and requested? Do you have a copy of this documentation? (Do not attach or furnish
unless requested).
(4) Describe what specific laws, Executive Orders, GSA’s government-wide regulations or internal
agency regulations, budget issues, or organizational obstacles you feel constrain your ability to manage
your fleet. Be specific and include examples. If you have a solution, describe it and indicate whether we
can share the solution with other agencies as a potential best practice.
We do not foresee any obstacles in maintaining our optimal fleet size. Note, based on projected mission
essential vehicle requirements in FY 2015 and FY 2016, our VAM target will remain at 479 vehicles.
(J) Anomalies and possible errors.
(1) Explain any real or apparent problems with agency data reported in FAST.
(2) Discuss any data fields highlighted by FAST as possible errors that you chose to override rather than
correct. Examples would be extremely high annual operating costs or an abnormal change in inventory
that FAST considers outside the normal range, or erroneous data in prior years causing an apparent
discrepancy in the current year.
(3) Explain any unresolved flagged, highlighted, or unusual-appearing data within FAST.
We have two data fields highlighted by FAST. One field highlighted indicates the age of two agency
owned Heavy Duty vehicles within our inventory that has exceeded the life expectancy. Due to the
limited and specific use of these vehicles, it would not be cost effective for us to replace those vehicles.
This concern is resolved.
We have two GSA leased Law Enforcement vehicles that are highlighted in FAST. These two LE
vehicles are showing an unusually high annual operating cost for years 2015 through 2018. This
unusually high cost is attributed to the previous year’s number of LE Light Duty vehicles that were
incorrectly identified, adding $11,553 to the 2015 LE operating cost and a similar amount for years 2016
through 2018. We retrieved this data from GSA’s FAST Data Center and have consulted GSA for
guidance on how to correct it. We have informed Michelle Kirby (FAST Administrator) about this cost.
(K) Summary and contact information.
(1) Who should be contacted with questions about this agency fleet plan? (Provide the name and contact
information for the agency headquarters fleet manager and the person preparing this report if different)
(2) Indicate whether the budget officer participated in the VAM and A-11 processes. (Provide the name
and contact information for the budget office reviewing official).
43
(3) Indicate whether the Chief Sustainability Officer participated in the VAM, vehicle planning, and
vehicle approval processes. (Provide the name and contact information for the CSO reviewing official).
Direct fleet questions to:
Jerome Walker, Transportation Officer
410-965-4082
Direct budget questions to:
Stephanie Hedgespeth
Budget Analyst
410-965-8280
Chief Sustainability Officer:
Chris Molander, Associate Commissioner,
Office of Facilities and Supply Management (OFSM)
410-965-7401
The Budget Office POC reviewed the inputs prior to our submission.
44
Appendix 2. Multimodal Access Plan for Commuters
I. Agency Workplace Charging Plan
A. Summary of Strategy
At all of our delegated facilities, we will assess the level of interest in charging stations for employee
vehicles, and whether employees are interested in unmetered level-one charging or faster EV
charging. We will assess the staffing time required to enforce parking restrictions at the charging
stations, and we will determine if the stations will be installed and operated by SSA or an outside
contractor. Following the early installations, and based on demand assessments, we will periodically
assess locations for new infrastructure.
B. Details of Strategy
1. Actions and Projected Timeframes
We have received several suggestions from employees for charging their EVs at HQ in Baltimore,
and we will inquire whether there is any interest at our other delegated sites. In doing so, we will
determine if the interest is for unmetered level-one charging or faster EV charging, and we will
provide an estimated cost to employees to use the service and an estimated cost for SSA to install
the infrastructure. Based on feedback, we will determine the type and number of stations needed.
Regarding the enforcement of parking restrictions at the charging stations, we will use our current
facilities team to assess the staffing time required. We will also determine if the stations will be
installed and operated by SSA or an outside contractor.
We do have some existing charging infrastructure in place and planned. The HQ campus has two
electric vehicle charging stations, but until a policy is in place for employees to use them, they are
available only to fleet vehicles at this time. At our main data center, the National Support Center,
the wiring has been completed for charging stations that will allow us to travel in electric vehicles
from our HQ in Baltimore to the data center, charge the vehicles while doing business, and have
enough charge to return to HQ. The charging stations, once completed, can be used for employee
vehicles once a policy is in place for employees to use SSA EV charging stations. Our facility in
California has charging stations powered by PV on carports. It plans to request permission from
the San Francisco Regional Commissioner for employees to use the stations.
2. Roles and Responsibilities of Key Agency Personnel
The Office of Buildings Management will be responsible for overseeing workplace charging.
3. Outreach to Agency Employees and Visitors
For all charging infrastructure available for use by employees, our outreach to employees will
include details on the technology, and the location and operation of the EV charging stations. We
will keep employees informed as new infrastructure is planned. For the foreseeable future, SSA
charging infrastructure will be reserved for SSA employees only, not visitors.
4. Incentivizing EV Usage
The best way to incentivize EV usage is to provide charging infrastructure at the workplace,
especially at facilities where some employees have longer commutes, as some will need to charge at the office as well as at home.
5. Assessing Demand for Charging Infrastructure
45
We will reach out to all delegated facilities to assess the level of interest in charging stations for
employee vehicles. Following outreach on existing systems, any feedback and interest garnered
will be taken into consideration as well.
6. Ensuring Continued Success
Continued success of EV charging infrastructure hinges on the frequency of its use. Following the
early projects and based on demand assessments, we will periodically assess locations for new
infrastructure.
II. Agency Bicycling and Active Commuter Program
A. Summary of Strategy
Our main HQ campus and the nearby Security West facility, located in the suburbs of Baltimore, do
not have practical bicycle access for the vast majority of our employees. SSA employees commute
from all over the region, and active commuting is not an option for most because of distance and a
lack of safe bicycle or walking paths.
III. Agency Telecommuting and Teleconferencing Expansion Plan
A. Summary of Strategy
Teleworking will continue to be our primary strategy to reduce our Scope 3 greenhouse gas
emissions. The number of employees teleworking regularly in FY 2015 increased 77 percent from
FY 2014, to a total of 13,514. Since the FY 2015 commuter survey deployed through the GSA
Carbon Footprint Tool indicated widespread employee desire for increased teleworking opportunities,
our strategy moving forward will focus on increasing the number of employees determined to be
eligible for telework.
B. Details of Strategy
1. Actions and Projected Timeframes
In the FY 2015 GSA Scope 3 Commuter Survey, 60 percent of employees responded that they are
not allowed to telework even though they feel that their duties are compatible with teleworking.
The Office of Human Resources will continue looking into issues impeding the implementation of
the existing telework policy, and it will ensure that managers understand how to determine which
employees should be deemed eligible for telework.
2. Roles and Responsibilities of Key Agency Personnel
The Office of Human Resources is responsible for our telework program. Dot Smallwood, the
Acting Assistant Deputy Commissioner for Human Resources, is the Telework Managing Official
for SSA. Carole Nathan, Human Resources Specialist, Office of Personnel is the Telework
Coordinator. In addition, the Telework Oversight Committee oversees SSA’s telework program.
This committee consists of the Executive Staff or their designees.
3. Outreach to Agency Employees and Visitors
SSA components distribute notices to all their employees every February and August to notify
them that they may request participation in the telework program.
4. Incentivizing Increased Telecommuting and Teleconferencing
Employees are incentivized through reduced commuting costs, more flexible work/life
arrangements, and flexible scheduling to take advantage of telework options. SSA is also in the
process of replacing employees’ existing desktops and laptops with single device laptop and
46
docking station. This effort reduces the agency’s IT inventory and software costs, but has the side
benefit of ensuring that all employees will be telework ready.
5. Assessing Demand for Telecommuting and Teleconferencing
Demand for teleworking is clear, based on the fast uptake in teleworking over the past few years
and the desire for more access to teleworking indicated in the FY 2015 commuter survey. Also,
we survey teleworking employees, non-teleworking employees, and managers once per year to
gain feedback. The results of the surveys are reviewed by the Telework Oversight Committee to
determine next steps. We will continue to deploy the GSA Scope 3 Commuter Survey every two
years to gauge interest and participation in telework; the next one is scheduled for FY 2017.
6. Ensuring Continued Success
The Telework Oversight Committee continues to assess desired policy changes, technology
improvements, and best practices to ensure access and satisfaction with the program. To ensure
our success, we are in the processing of implementing soft-phone technology that will allow
seamless routing of incoming telephone calls through employees’ single device laptops. This
process will ensure the security of telecommunications and a seamless experience for members of
the public who call our national 800 number or their local field office. By implementing
technology solutions and continuing to adjust our policy approaches, we are preparing for success
today and in the future.
IV. Agency Carpooling and Transit Plan
A. Summary of Strategy
For reasons similar to those cited under Active Commuting Strategies, carpooling and public
transit are not the focus of our Multimodal Access Plan. SSA’s main HQ campus and the nearby
Security West facility, where a significant percentage of employees work, are located in an area
such that employee residences are scattered over a large area, often far from the facilities, making
carpooling difficult to coordinate and implement. According to the FY 2015 GSA Scope 3
Commuter Survey, less than four percent of employees across the agency use ride sharing as their
primary means of commuting.
SSA offers a Mass Transit Subsidy Program to eligible employees to facilitate the use of mass
transit where available. Our facilities outside of major urban areas, however, are not well served
by mass transit options. Employees use mass transit when they are located in areas supporting it,
such as New York City, Philadelphia, Cincinnati, Chicago, and Denver.
47
Appendix 3. Climate Change Adaptation Update
We have over 1,500 offices that include regional offices, field offices, teleservice centers, processing
centers, hearing offices, the Appeals Council, and our HQ in Woodlawn, Maryland. Our operations
consist of activities conducted in office space, and transportation to and from that space, and they
frequently involve the provision of face-to-face services to the public. Therefore, the reliability of
computing and transportation infrastructure is key to our operational resilience. GSA leases all real
property we use has the lead in making real property investment decisions on these leases. GSA
delegated us the responsibility for managing and operating seven major facilities around the United
States. In addition to our HQ campus in Woodlawn, Maryland, the facilities are:
1. Frank Hagel Federal Building (Richmond, CA)
2. Harold Washington Social Security Building (Chicago, IL)
3. Mid-Atlantic Social Security Center (Philadelphia, PA)
4. Addabo Federal Building (Jamaica, NY)
5. Wilkes-Barre Data Operations Center (Wilkes-Barre, PA)
6. National Support Center (Frederick, MD).
In terms of built infrastructure, our climate change adaptation planning is confined to these delegated
facilities.
To understand the risks climate change poses to our operational resilience, in FY 2013 we conducted
high-level assessments of the vulnerabilities and risks posed by climate change to our mission as a whole.
We based our FY 2014 Climate Change Adaptation Plan on these high-level assessments, and did not
consider specific agency locations. To begin the process of understanding site-specific vulnerabilities and
risks, in keeping with our FY 2014 Plan, in October 2014 we conducted a survey of our delegated
facilities. The survey asked facilities about local weather-related problems they have already
experienced, issues currently causing concern, and contingency planning the facilities have in place to
address threats and hazards. The survey provided valuable insights into past, current, and potential future
vulnerabilities. We will incorporate this information into future planning. Another action in the FY 2014
Plan was to review the existing HQ Continuity of Operations Plan (COOP) to identify revisions necessary
to incorporate climate change considerations. We completed the review and determined our COOP
already addresses all threats and hazards.
Moving forward, we will prepare our next Climate Change Adaptation Plan once the next quadrennial
National Climate Assessment is issued in 2018 or 2019. Meanwhile, to further improve our
understanding of site-specific vulnerabilities, we will conduct climate change vulnerability and risk
assessments on each of the delegated facilities. We will also direct all delegated facilities to review their
COOPs and assess the need for updates in light of the potential impacts of climate change.
48
Appendix 4. Acronyms and Units
Btu British thermal unit(s)
CEQ Council on Environmental Quality
CFL Computers for Learning
COOP Continuity of Operations Plan
CPARS Contractor Performance Assessment Reporting System
DOE Department of Energy
EISA Energy Independence and Security Act of 2007
EPA Environmental Protection Agency
EO Executive Order
EPEAT Electronic Product Environmental Assessment Tool
ESPC energy saving performance contract
FAR Federal Acquisition Regulation
FEMP Federal Energy Management Program
FSSI Federal Strategic Sourcing Initiatives
FY fiscal year
GHG greenhouse gas
GSA General Services Administration
HFC hydrofluorcarbon
HQ Headquarters
HVAC heating, ventilation, and cooling
MWh megawatt-hour(s)
N/A not applicable
PPCC President's Performance Contracting Challenge
PUE power usage effectiveness
REC renewable energy certificate
SNAP Significant New Alternative Policy
SSA Social Security Administration
UESC utility energy service contract
WPSC Western Program Service Center


![Social Security Administration Act 1992€¦ · SOCIAL SECURITY ADMINISTRATION ACT 1992 (c. 5) Supplement No. 91 [June 2010] 1.1801 Social Security Administration Act 1992 CHAPTER](https://static.fdocuments.net/doc/165x107/5f71b1d52098be0b614d54ef/social-security-administration-act-social-security-administration-act-1992-c-5.jpg)