
Social Network Analysis - Lecture 4 in Introduction to Computational Social Science
57
SOCIAL NETWORK ANALYSIS LECTURE 4, 14.9.2015 INTRODUCTION TO COMPUTATIONAL SOCIAL SCIENCE (CSS01) LAURI ELORANTA
-
Upload
lauri-eloranta -
Category
Data & Analytics
-
view
477 -
download
3
Transcript of Social Network Analysis - Lecture 4 in Introduction to Computational Social Science

SOCIAL NETWORK ANALYSIS
LECTURE 4, 14.9.2015
INTRODUCTION TO COMPUTATIONAL SOCIAL SCIENCE (CSS01)
LAURI ELORANTA

• LECTURE 1: Introduction to Computational Social Science [DONE]
• Tuesday 01.09. 16:00 – 18:00, U35, Seminar room114
• LECTURE 2: Basics of Computation and Modeling [DONE]
• Wednesday 02.09. 16:00 – 18:00, U35, Seminar room 113
• LECTURE 3: Big Data and Information Extraction [DONE]
• Monday 07.09. 16:00 – 18:00, U35, Seminar room 114
• LECTURE 4: Network Analysis [TODAY]
• Monday 14.09. 16:00 – 18:00, U35, Seminar room 114
• LECTURE 5: Complex Systems
• Tuesday 15.09. 16:00 – 18:00, U35, Seminar room 114
• LECTURE 6: Simulation in Social Science
• Wednesday 16.09. 16:00 – 18:00, U35, Seminar room 113
• LECTURE 7: Ethical and Legal issues in CSS
• Monday 21.09. 16:00 – 18:00, U35, Seminar room 114
• LECTURE 8: Summary
• Tuesday 22.09. 17:00 – 19:00, U35, Seminar room 114
LECTURESSCHEDULE

• PART 1: SOCIAL NETWORK ANALYSIS DEFINED
• PART 2: NETWORK & GRAPH THEORY BASICS
• PART 3: MATRIX REPRESENTATION
• PART 4: KEY MEASURES
• PART 5: SOCIAL NETWORK ANALYSIS SOFTWARE
• PART 6: SOCIAL NETWORK ANALYSIS EXAMPLES
LECTURE 4OVERVIEW
SOCIAL NETWORK ANALYSIS DEFINED

• “Social network analysis (SNA) is a strategy for investigating social structures through the use of network and graph theories. It characterizes networked structures in terms of nodes (individual actors, people, or things within the network) and the ties or edges (relationships or interactions) that connect them. Examples of social structures commonly visualized through social network analysis include social media networks, friendship and acquaintance networks, kinship, disease transmission,and sexual relationships.” (Wikipedia 2015).
• “Social Network analysis is inherently an interdisciplinary endeavor. The concept of social network analysis developed out of propitious meeting of social theory and application with formal mathematical, statistical, and computing methodology.” Stanley Wasserman and Katherine Fuast 1994
• “Social network analysis is neither a theory nor methodology. Rather, it is a perspective or paradigm. It takes as its starting point the premise that social life is created primarily and most importantly by relations and the patterns they form.” Alexandra Marin and Barry Wellman 2011
DEFINITIONSSOCIAL NETWORK ANALYSIS = SNA
(Cioffi-Revilla 2014.)

• Characteristics of social networks and social networks as analogy of
some parts of the society are quite common in all major social science
fields (economics, sociology, anthropology, political science,
psychology).
• Social Network Analysis is a paradigmatic viewpoint of society: it
contains the belief, that social universe is formed of and can be modeled
with networks.
• Not just a collection of methods, but also a strong theoretical
perspective: rooted in network and graph theory (in mathematics and in
computer science) and in discrete mathematics.
SOCIAL NETWORK AS A VIEWPOINT
(Cioffi-Revilla 2014.)

• Euler and Könisberg bridge –problem already in 1736. Provided the first
principles of graph theory.
• Most active developments in early and mid 1900s.
• Sociogram – a mathematical model of social group in the 1930s
(Jakob.L. Moreno)
• Social structure – based on network model in the 1940s (Alfred
Radcliffe-Brown)
• Matrix calculus introduced to social networks in 1940s and 1950s
• Small world –phenomena presented and demonstrated in the 1950s
and 1960s
• Dynamic networks – 1970s
• First SNA software – 1980s
LONG TRADITIONS IN NETWORK ANALYSIS
(Cioffi-Revilla 2014.)

7 BRIDGES OF KÖNIGSBERG
The city of Königsberg in Prussia was set on both sides of the Pregel River, and included two large islands which were connected to each other and the mainland by seven bridges.The problem was to find a walk through the city that would cross each bridge once and only once.
(Wikipedia 2015.)

NETWORK AND GRAPH THEORY
BASICS

• Nodes/Vertices = the nodes of the network, can also be viewed as entities, actors, values, sentiments, ideas, locations, attributes etc. depending on the network at hand
• Edges between the nodes = can also be viewed as connections, links, associations, relations, affiliations, interactions etc. Depending on the network at hand
• Graph is a set (aggregation) of nodes and edges forming a social networks. Thas graph is a network.
• Formally, a a graph G is an ordered pair G = (V, E) comprising a set V of vertices or nodes together with a set E of edges or lines, which are 2-element subsets of V (i.e. e={u,v})
COMPONENTS OF A NETWORK
(Cioffi-Revilla 2014.)

VERTICES & EDGES
a
bc
d
• Graph G =(V,E)
• V = {a, b, c, d}
• E = {{a,b},{a,c},{b,c},{c,d}}


HELSINKI METRO MAP AS A NETWORK• Each station is a node
• Each connection is an edge

• Directed edges, , from a to b, but not from b to a
• Undirected edges, meaning, that the edge connects both ways
• Graphs (networks) containing directed edges is called directed graph
• Graphs (networks) containing undirected edges is called undirected
graph
• e.g. a graph describing a process is typically a directed graph
• e.g. a graph modeling metro map is undirected graph
DIFFERENT TYPES OF NETWORK EDGES
(Cioffi-Revilla 2014.)

DIRECTED VS. UNDIRECTED
a
bc
d
a
bc
d

MIXED GRAPHS
a
bc
d

• Edges of a graph can have weights
• Typically these model some attribute of intensity, such as probability,
distance, time, etc.
• E.g. distance between cities
• E.g. time between metro stops
• A graph with edge weights is called a weighted graph
WEIGHTED GRAPHS
tampere
turku helsinki
178 km
166 km
162 km

• In a signed graph the edges of the graph contain either plus (+) or minus
(-) sign (or in some applications also 0).
• e.g. signed graphs can be used in modeling political allies/adversaries
• e.g. signed graphs can be used in modeling belief systems
SIGNED GRAPHS
party1
party2 party3
+
+
-

• In multigraphs two nodes maybe be connected with multiple and usually
different types of edges
• Thus, all edges are not the same, and different edges between the
nodes model different types of relationships
• Multigraphs may also contain loops depending on the application
• Many “real world” networks are multigraph networks in essence, though
typically modeled as regular graphs
• e.g. Four types of relationships between a,b & c
• e.g. Loop from a to a
MULTIGRAPHS
a
b c
(Cioffi-Revilla 2014.)

• “In graph theory, a path in a graph is a finite or infinite sequence of
edges which connect a sequence of vertices which, by most definitions,
are all distinct from one another. In a directed graph, a directed path is
again a sequence of edges (or arcs) which connect a sequence of
vertices, but with the added restriction that the edges all be directed in
the same direction.” (Wikipedia 2015)
• Many different types of specially named paths:
• Eulerian path (crosses each edge exactly once, as in Königsberg)
• Hamiltonian path (visits each node exactly once)
PATHS

• Social networks change over time
• A dynamic network N(t) is a social network whose state changes as a
function of time t.
• Dynamic networks may exhibit different kinds of behavior:
• Evolution
• Growth
• Transformation
• Decay
• Termination
• E.g. a family as a network
DYNAMIC NETWORKS
(Cioffi-Revilla 2014.)

• Many specific graph classes have a defined name
• Typically combines a set of features (directed, undirected, weighted) and
a certain structure
• For example
• Tree graph / Forest graph
• Complete graph
• Path graph
• Cycle graph
• Random graph
• Scale-free graph
• Many many others…
SPECIFIC CLASSES OF GRAPHS

• A tree is an undirected graph in which any two vertices are connected by
exactly one path. In other words, any connected graph without simple
cycles is a tree. (Wikipedia 2015, Tree(graph theory).)
TREE GRAPH
a
bc
de
f

• A forest is an undirected graph, all of whose connected components are
trees; in other words, the graph consists of a disjoint union of trees.
Equivalently, a forest is an undirected cycle-free graph. As special cases,
an empty graph, a single tree, and the discrete graph on a set of vertices
(that is, the graph with these vertices that has no edges), all are
examples of forests. (Wikipedia 2015, Tree(graph theory).)
FOREST GRAPH

• In a complete graph, each pair of vertices is joined by an edge; that is,
the graph contains all possible edges.
COMPLETE GRAPH
a
b
c
d
(Wikipedia 2015, Complete_graph.)
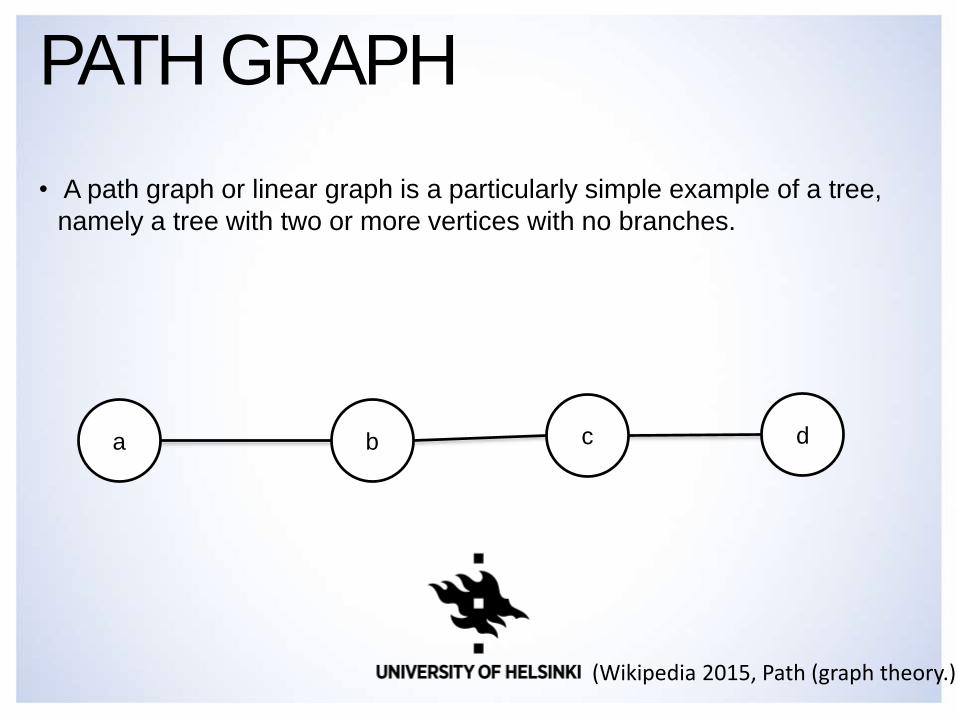
• A path graph or linear graph is a particularly simple example of a tree,
namely a tree with two or more vertices with no branches.
PATH GRAPH
a b c d
(Wikipedia 2015, Path (graph theory.)

• In graph theory, a cycle graph or circular graph is a graph that consists of
a single cycle, or in other words, some number of vertices connected in a
closed chain.
CYCLE GRAPH
a
b
c
d
(Wikipedia 2015, Cycle graph.)

• A graph where the structure of the graphs and in particular the links
between the nodes of the graph is determined by some probability
distribution or some stochastic/random process.
• Can model, for example, how people get to know new people (by
chance)
RANDOM GRAPH
(Wikipedia 2015, Random graph.)

• A scale-free network is a network whose degree distribution follows a
power law, at least asymptotically. That is, the fraction P(k) of nodes in
the network having k connections to other nodes goes for large values
of k as
• P(k) ~ k-γ where γ 2 < γ < 3
• Contains hub-nodes that are highly more connected than an average
node
• Examples where scale free networks can be applied
• Social networks
• Internet and WWW
• Airline networks
SCALE-FREE NETWORK
(Wikipedia 2015, Scale-free network.)

1. Sampling units: which are the nodes/actors of your research
2. Relational form and content: which types of interactions and which
attributes of interaction is researched/modeled
3. Levels of analysis: at which level of the network the research is
focused on
RESEARCH DESIGN ELEMENTS
(Knoke & Yang 2008.)
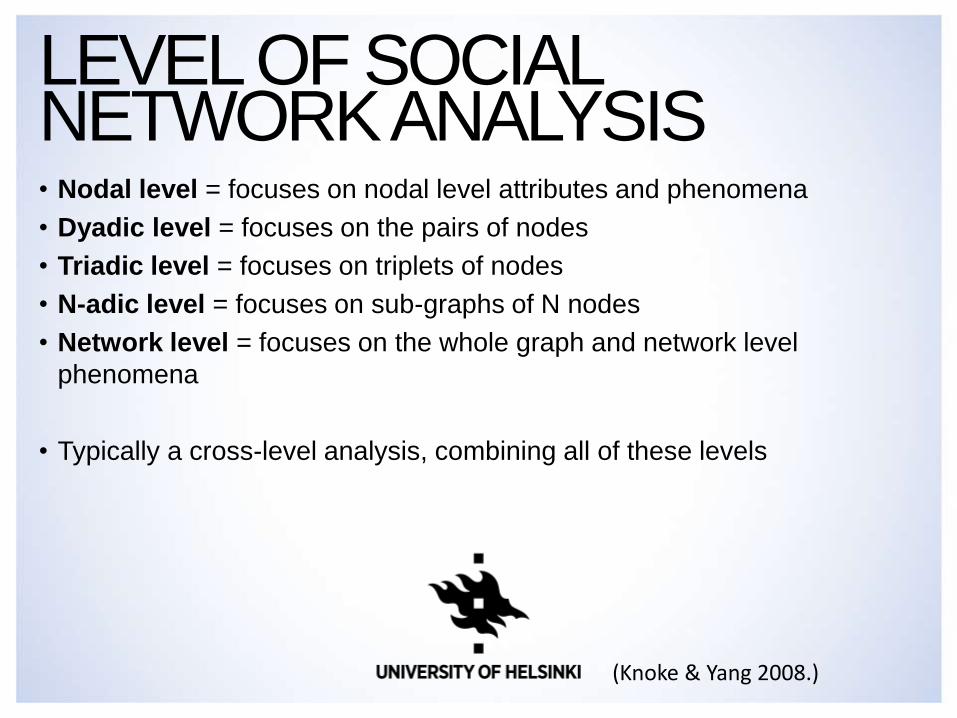
• Nodal level = focuses on nodal level attributes and phenomena
• Dyadic level = focuses on the pairs of nodes
• Triadic level = focuses on triplets of nodes
• N-adic level = focuses on sub-graphs of N nodes
• Network level = focuses on the whole graph and network level
phenomena
• Typically a cross-level analysis, combining all of these levels
LEVEL OF SOCIAL NETWORK ANALYSIS
(Knoke & Yang 2008.)

MATRIX REPRESENTATION
OF GRAPHS

• In addition to visual notation, graphs can be represented as matrices,
which are more handy for calculus
• A matrix is a rectangular array formed of rows and columns
• The items that the matrix contains are called elements and they can
contain numbers, symbols or expressions
• A matrix is defined by its size: i.e. 3x2 matrix has 3 rows and 2 columns
• An excel spread sheet is a good example of an matrix with its rows and
columns
GRAPH AS A MATRIX

MATRIX NOTATION
(Wikipedia 2015, Matrix.)

2X3 MATRIX
(Wikipedia 2015, Matrix.)
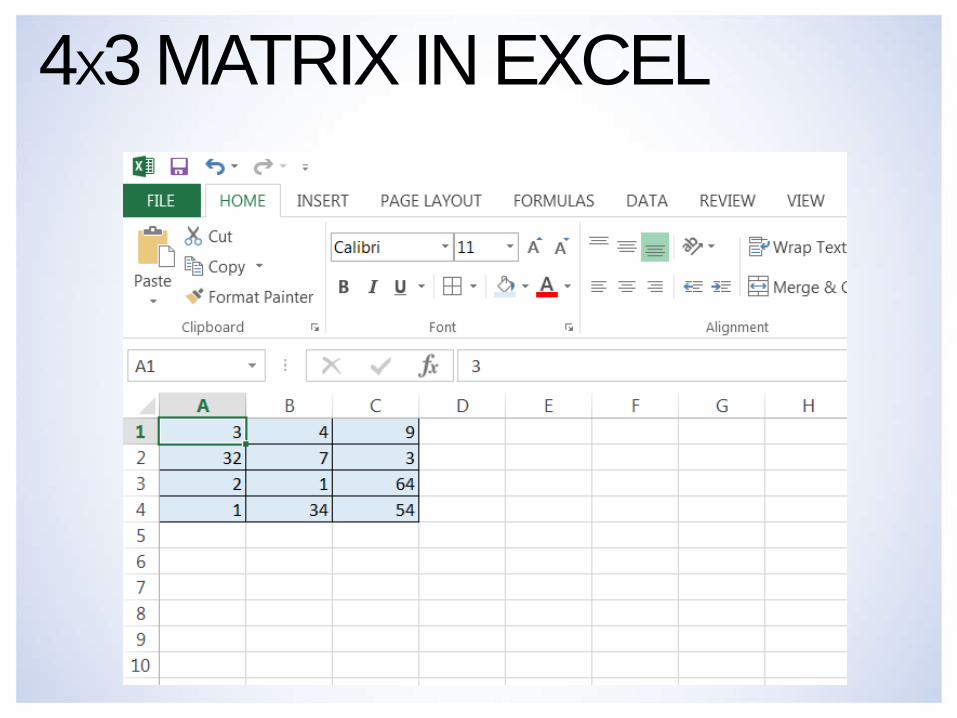
4X3 MATRIX IN EXCEL

• Matrix can be used to represent all the connections (edges) in the social
network
• Thus, it is a node to node mapping of the whole graph
• Typically a connection is denoted by 1 and no connection is denoted by
0
• When social networks are mapped as adjacency matrix it can also be
called as sociomatrix
• Adjacency matrix is always a square matrix (n x n), because it has all the
nodes of the graph mapped identically to its rows and columns
• Typical way of storing, exporting and importing social network graphs (for
example in .csv files)
ADJACENCY MATRIX & SOCIOMATRIX
(Prell 2012.)

ADJACENCY MATRIX REPRESENTATION
Anna
Jack
Jane
EllenAnna Ellen Jack Jane
Anna 0 0 1 1
Ellen 0 0 0 1
Jack 1 0 0 1
Jane 1 1 1 0

• Here is an adjacency matrix representing the social network of an
organization of eight people. Draw the graph representation of the
network, based on the adjacency matrix.
ASSIGNMENT
Anna Ellen Jack Jane Harry Philip Rosa William
Anna 0 1 1 1 0 1 0 0
Ellen 1 0 1 0 0 0 0 0
Jack 1 1 0 0 0 1 0 1
Jane 1 0 0 0 1 0 1 0
Harry 0 0 0 1 0 1 1 1
Philip 1 0 1 0 1 0 0 1
Rosa 0 0 0 1 1 0 0 0
William 0 0 1 0 1 1 0 0

• You can also represent more information in adjacency matrix than just
binary connections
• For example weights of the connections could be represented directly in
the matrix
• You could also represent different kinds of connections with different
numbers, or just different amounts of connections between the nodes
WEIGHTED ADJACENCY MATRICES

KEY MEASURESFOR GRAPHS

• There are many quantitative measures of graphs which tell something
about the structure of the graph
• Measures can be divided to micro and macro level
1. Node level (micro)
2. Network level (macro)
QUANTITATIVE MEASURES OF GRAPHS
(Cioffi-Revilla 2014.)

• Degree of the node = How many connections does a node have
• Distance between two nodes = the minimal number of connecting edges
between two nodes
• Eccentricity = the maximum distance between a node an any other
node (how far a node is from the farthest away node)
• Eigenvector centrality = Eigenvector centrality is a measure of the
influence of a node in a network. (’~how many connections &
connections to highly connected nodes)
• Betweenness centrality = number of times a node is on the shortest
path between two other nodes.
• And many others…
NODE LEVEL MEASURES
(Cioffi-Revilla 2014.)
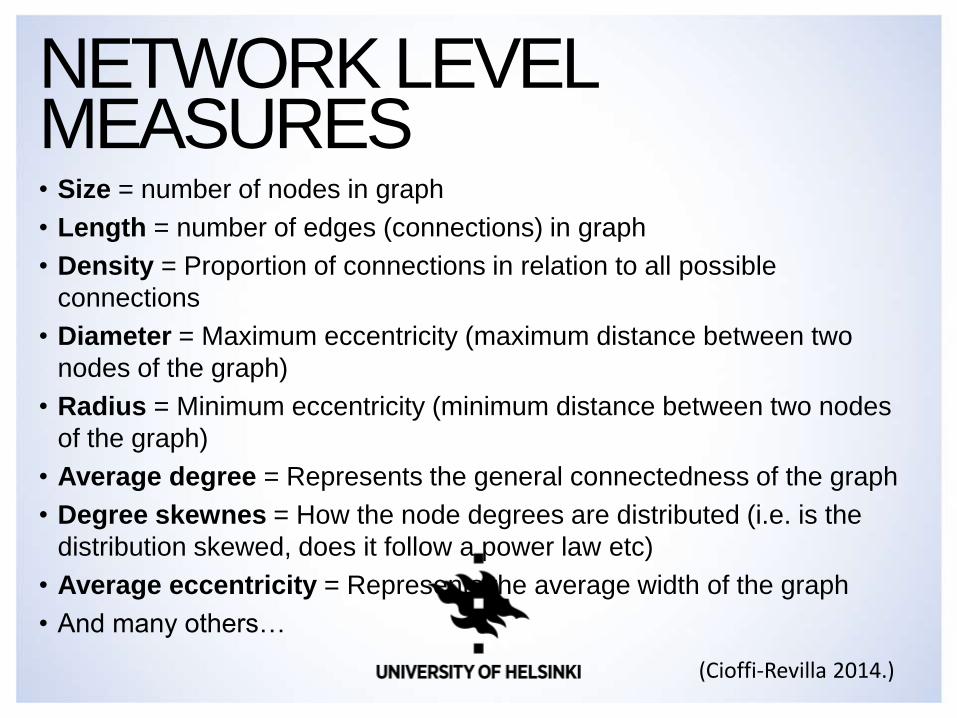
• Size = number of nodes in graph
• Length = number of edges (connections) in graph
• Density = Proportion of connections in relation to all possible
connections
• Diameter = Maximum eccentricity (maximum distance between two
nodes of the graph)
• Radius = Minimum eccentricity (minimum distance between two nodes
of the graph)
• Average degree = Represents the general connectedness of the graph
• Degree skewnes = How the node degrees are distributed (i.e. is the
distribution skewed, does it follow a power law etc)
• Average eccentricity = Represents the average width of the graph
• And many others…
NETWORK LEVEL MEASURES
(Cioffi-Revilla 2014.)

SOCIAL NETWORK ANALYSIS SOFTWARE

• Originally social network analysis used no computers (as there were
none in 1930s)
• First computer based SNA applications from 1960s onwards
• Nowadays there are many ready applications that can be used in social
network analysis: UCINET, Pajek, AutoMap, ORA, NodeXL…
• Many programming languages have also their own graph and network
analysis libraries
• R: igraph, network, sna, Rsiena, statnet
• http://badhessian.org/2012/09/seven-reasons-to-use-r-for-social-
network-analysis-and-three-reasons-against/
• Python: NetworkX,sanp.py, libsna,
COMPUTATIONAL SOCIAL NETWORK ANALYSIS
• Social Network analysis software typically contains features such as
• Representation (import/export) of the social network as adjacency
matrix
• Graphical representation of the matrix
• Automatic key measurement calculus
• Automatic graph functions/transformations
TYPICAL FEATURES

• Each software tool have their own strengths and weaknesses
• There are available comparisons for SNA tools to help your selection (if
the tool is not pre-specified):
• E.g.
• List of available SNA software in Wikipedia:
http://en.wikipedia.org/wiki/Social_network_analysis_software<
• A comparative study of social network analysis tools
http://wic.litislab.fr/2010/slides/Combe_WIVE10_slides.pdf
• SNA software review: http://www.activatenetworks.net/social-network-
analysis-sna-software-review/
COMPARISON OF DIFFERENT SNA SOFTWARE

SOMESOCIAL NETWORK
ANALYSIS EXAMPLES

• There are many different research applications for social network
analysis in many different fields of social sciences (economics,
sociology, anthropology, psychology…)
• Gioffi-Revilla (2014) highlights
• Human cognition and belief systems
• Decision making models
• Models of organisation
• Supply chain and process models
• International relations (diplomatic networks, global organisations)
• Global social structures: i.e. small world problem
• There are many othrer areas of research applications
RESEARCH APPLICATIONS
• Tantipathananandh, C., Berger-Wolf, T., & Kempe, D. (2007). A
framework for community identification in dynamic social
networks. In Proceedings of the 13th ACM SIGKDD international
conference on Knowledge discovery and data mining (pp. 717-726).
ACM.
IDENTIFYING COMMUNITIES

• Fowler, J. H., & Christakis, N. A. (2008). Dynamic spread of happiness
in a large social network: longitudinal analysis over 20 years in the
Framingham Heart Study. Bmj, 337, a2338.
HOW DOES HAPPINESS SPREAD?

• Kempe, D., Kleinberg, J., & Tardos, É. (2003, August). Maximizing the
spread of influence through a social network. In Proceedings of the
ninth ACM SIGKDD international conference on Knowledge discovery
and data mining (pp. 137-146). ACM.
HOW TO INFLUENCE A SOCIAL NETWORK?
• Read the article: “Network Analysis in the Social Sciences”
Borgatti, S. P.; Mehra, A.; Brass, D. J.; Labianca, G. (2009). Network
Analysis in the Social Sciences. Science 13 February 2009: 323 (5916),
892-895.
• What research applications are mentioned in the article?
• What areas of social network theory are highlighted?
• What methods are there for uncovering/modeling a given social
network?
LECTURE ASSIGNMENT

• Borgatti, S. P.; Mehra, A.; Brass, D. J.; Labianca, G. (2009). Network Analysis in the Social Sciences. Science 13 February 2009: 323 (5916), 892-895.
• de Sola Pool, I., & Kochen, M. (1979). Contacts and influence. Social networks, 1(1), 5-51.
• Tantipathananandh, C., Berger-Wolf, T., & Kempe, D. (2007). A framework for community identification in dynamic social networks. In Proceedings of the 13th ACM SIGKDD international conference on Knowledge discovery and data mining (pp. 717-726). ACM.
• Kossinets, G., & Watts, D. J. (2006). Empirical analysis of an evolving social network. Science, 311(5757), 88-90.
• Fowler, J. H., & Christakis, N. A. (2008). Dynamic spread of happiness in a large social network: longitudinal analysis over 20 years in the Framingham Heart Study. Bmj, 337, a2338.
• Tichy, N. M., Tushman, M. L., & Fombrun, C. (1979). Social network analysis for organizations. Academy of management review, 4(4), 507-519.
• Kempe, D., Kleinberg, J., & Tardos, É. (2003, August). Maximizing the spread of influence through a social network. In Proceedings of the ninth ACM SIGKDD international conference on Knowledge discovery and data mining (pp. 137-146). ACM.
LECTURE 4 READING

• Cioffi-Revilla, C. 2014. Introduction to Computational Social Science.
Springer-Verlag, London
• Knoke, D.; Yang, S. 2008. Social Network Analysis. Sage Publications,
London.
• Prell, C. 2012. Social Network Analysis. Sage Publications, London.
REFERENCES

Thank You!
Questions and comments?
twitter: @laurieloranta


