Social Media Brand Positioning Workflow- David Gerson
22
Social Media Brand Positioning: Perceptual Mapping using Twitter Data David Gerson [email protected]
-
Upload
pydata -
Category
Data & Analytics
-
view
228 -
download
1
Transcript of Social Media Brand Positioning Workflow- David Gerson

Social Media Brand Positioning: Perceptual Mapping using Twitter DataDavid [email protected]

Why do this?•It’s a known business standard for enabling stakeholders, clients, and decision makers to easily see and compare like and unalike elements.

Problems•At their most numerical they typically are qualitative in nature.
•Even more are designed using a “scorecard” approach.
•If a scorecard is used it is limited to only a few points and a qualitative assessment to define the numeric measures.
•Distances and positioning are defined using a “human element”.
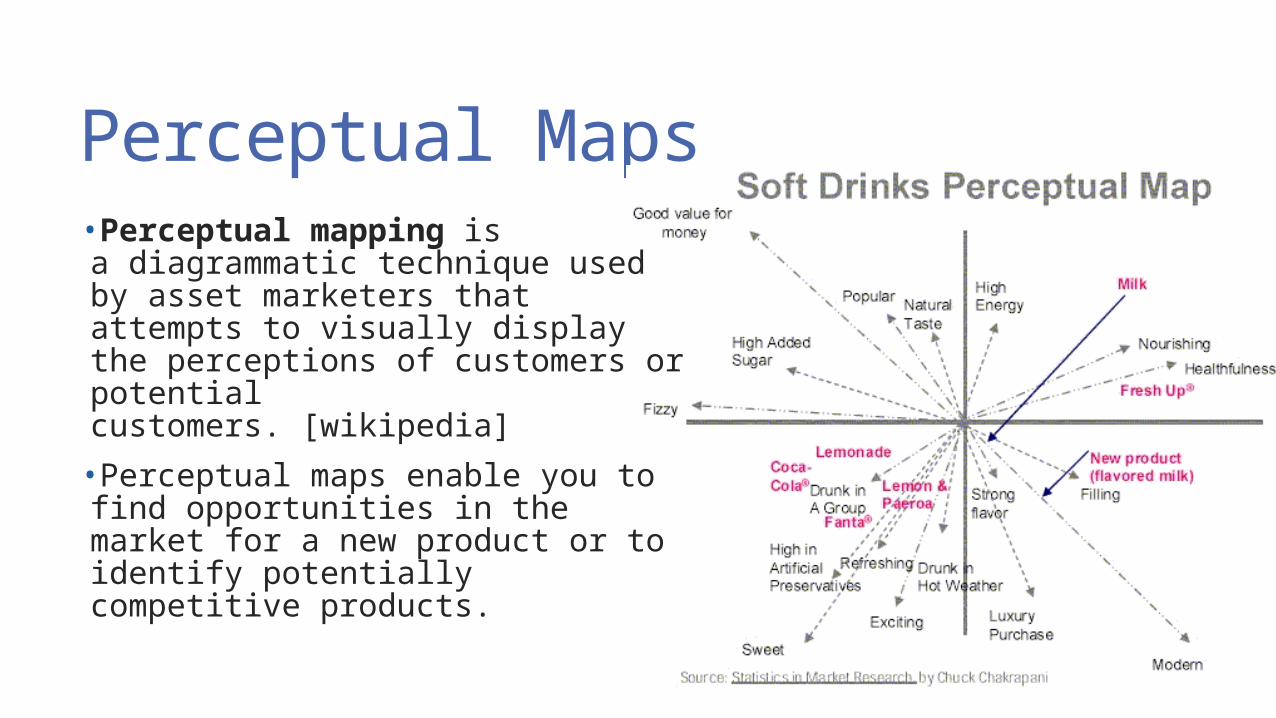
Perceptual Maps•Perceptual mapping is a diagrammatic technique used by asset marketers that attempts to visually display the perceptions of customers or potential customers. [wikipedia]
•Perceptual maps enable you to find opportunities in the market for a new product or to identify potentially competitive products.
Attributed to http://npdbook.com/

Twitter Extraction
Tokenizing
Stemming
TFIDF Stopword
s
Word Count Matrix
MDS Plotting
The Current Process

Twitter Extraction
Tokenizing
Stemming
TFIDF Stopword
s
Word Count Matrix
MDS Plotting
Twitter Extraction•Implementation• Streaming Api was left online for 1 week pulling data a target group of fast food
companies. This twitter data collected will be used to generate our feature set.
• A second set of data, without filters is used to create a control set of data that will help us determine what words are key to food, and which words are most important in the context of fast food

Twitter Extraction
Tokenizing
Stemming
TFIDF Stopword
s
Word Count Matrix
MDS Plotting
Twitter Extraction•Packages:• Twython library provides an easily accessible API wrapper which can be used for
the twitter streaming API. • The Twython API allows a user to plug into twitter and access data
•Limitations• The api didn’t seamlessly handle some necessary parameters to filter twitter data
(ie. language)• The classic unicode/asci conversion problems are rife in the twitter dataset. • The Firehose API was deprecated while this project was being worked on. Without
the ability to parse to the feed based on language and without firehose access I alternatively used the Swiftkey dataset.

Twitter Extraction
Tokenizing
Stemming
TFIDF Stopword
s
Word Count Matrix
MDS Plotting
Tokenizing Dataset•Implementation• Tokenizing is simple, there are a few ways to do it but the easiest is to split the
data. First by column “\n” and then by an empty string.
• At the tokenization stage it was also ideal to filter, and format my tokens.
• Also at this stage I perform deduplication of the data (if a line appears more than once remove it, this is there to help manage spammers.)

Twitter Extraction
Tokenizing
Stemming
TFIDF Stopword
s
Word Count Matrix
MDS Plotting
Stemming Tokens•Value Add of Stemming• Stemming is a technique first proposed in the late 1960’s by Julie Beth Lovins but
was finalized later by Martin Porter whose algorithm has come to be the de-facto standard for stemming.
• Stemming is used to remove roots of words so you only have the root word. (e.g. moved -> move)
• In the context in this analysis you can compare root words of these stores.
•Implementation• The newer version of the algorithm, Porter2 is readily available as a python
package. • In the context of this analysis I stemmed both my core food dataset and then the
general firehose corpus. • For simplicity and kindness to my RAM I stored the stemmed output as a csv.http://www.eecis.udel.edu/~trnka/CISC889-11S/lectures/dan-porters.pdf

Twitter Extraction
Tokenizing
Stemming
TFIDF Stopword
s
Word Count Matrix
MDS Plotting
TFIDF: Term Frequency inverse document frequency
•Value Add of TFIDF• TFIDF simplified allows you to find the relative occurrence of a word in a series of
documents (tweets), and provides a simple way to compare it to the occurrence of other words.
•Implementation• TFIDF is fit to a larger set of firehose data, in this case the firehose data is broken
apart into tweet documents about any and all thoughts a twitter user might be interested in.
• After creating a TFIDF model I then use the TFIDF object from the firehose data and compare it to the set of data I have from the restaurants. The list of words with the highest score are considered the “most important” in the context of food and restaurants.

Twitter Extraction
Tokenizing
Stemming
TFIDF Stopword
s
Word Count Matrix
MDS Plotting
TFIDF: Term Frequency inverse document frequency
•Packages• TFIDF is simple and easy to implement in Scikit Learn. • I simply point my string document objects into this function, create a tokenizer
relevant to my textfiles, and then I simply run the function.• The output is a dictionary of words and their TFIDF scores which need to be read
into a tuple and sorted.• I then create a filter based the sorted list by TFIDF score and use that to remove all
non-relevant terms from the food list which I will use as a feature.

Twitter Extraction
Tokenizing
Stemming
TFIDF Stopword
s
Word Count Matrix
MDS Plotting
Wordcount Matrix•Implementation
1. First I create a dictionary object of all words (a default dict would work just as well.)2. I then create a set of all words and compare that to a separate list of restaurants. 3. Based on the restaurant in the list I run a separate list to increment the word counters
stored for each element. 4. Finally I take the wordcount and save it off as a csv that can be imported as a matrix.

Twitter Extraction
Tokenizing
Stemming
TFIDF Stopword
s
Word Count Matrix
MDS Plotting
MDS/ NMDS / CA (PCA)•What is MDS and why is it used for perceptual mapping.• MDS uses matrix operations to compute the distances between elements and plot
them while maintaining the distance between all elements. • While it is made to handle continuous variables in standard MDS if you have ordinal
or comparison data than going with a non-metric MDS solution is necessary. A nonmetric MDS gives you results as your data elements compare to each other, rather than trying to solve for the total differences between them.
• Where MDS differs from PCA is that they have entirely different goals and are studied separately. While the goal of PCA is dimensionality reduction in support of factor analysis the goal of MDS is to simplify the visual inspection of elements and their relationships to other like elements.
• Another interesting way this analysis can be used is to find similarity between your measurements , for instance if you are using MDS with demographic data you would probably see that minivan owners and families have a very similar vector.

Twitter Extraction
Tokenizing
Stemming
TFIDF Stopword
s
Word Count Matrix
MDS Plotting
MDS/ NMDS / CA (PCA)•What is MDS and why is it used for perceptual mapping. (cont.)• The easiest way to think about this is to use the concept of unidimensional scaling
and apply it to a multidimensional environment.
>

Twitter Extraction
Tokenizing
Stemming
TFIDF Stopword
s
Word Count Matrix
MDS Plotting
Scikit Learn NMDS Plot

Twitter Extraction
Tokenizing
Stemming
TFIDF Stopword
s
Word Count Matrix
MDS Plotting
R MDS Plot
Twitter Extraction
Tokenizing
Stemming
TFIDF Stopword
s
Word Count Matrix
MDS Plotting
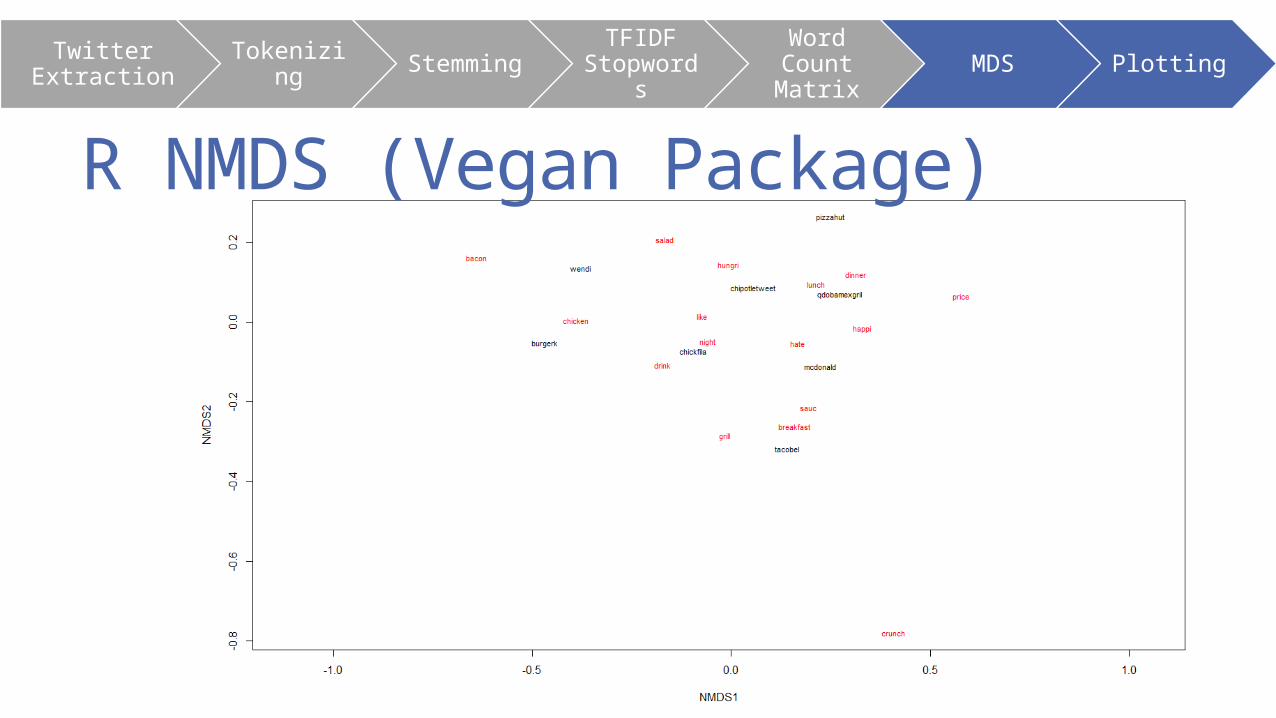
R NMDS (Vegan Package)
Twitter Extraction
Tokenizing
Stemming
TFIDF Stopword
s
Word Count Matrix
MDS Plotting
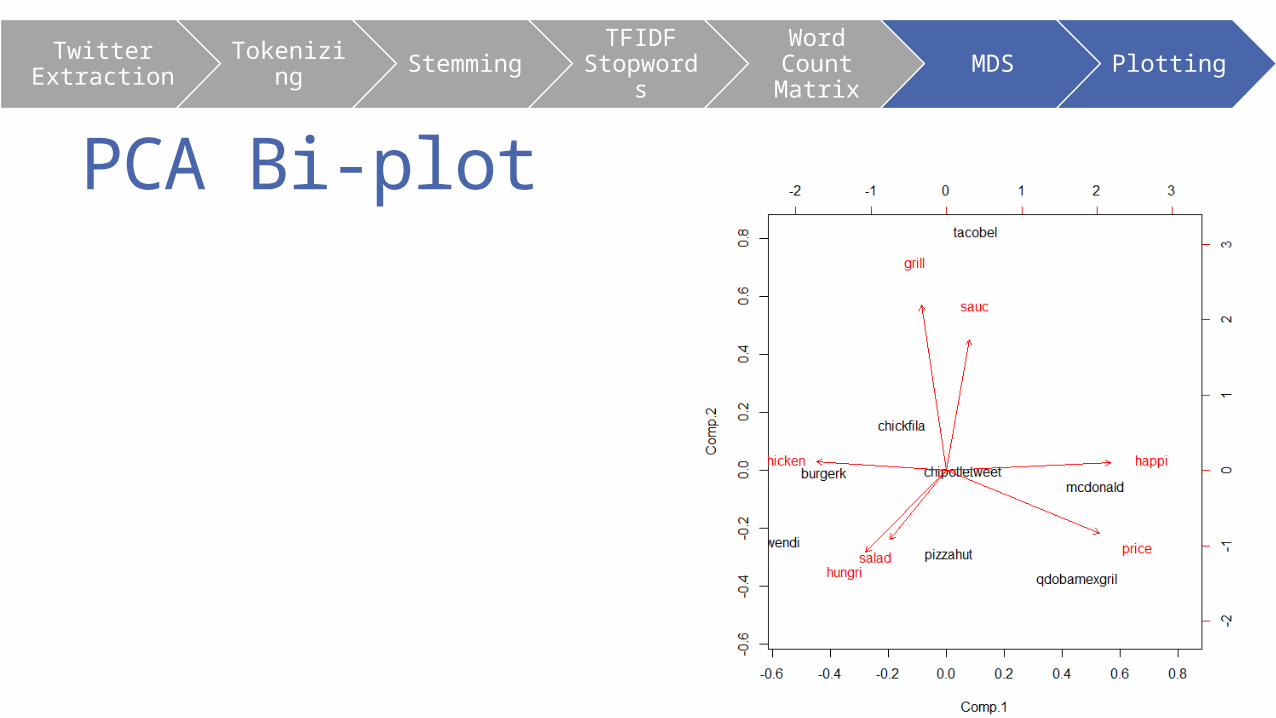
PCA Bi-plot

Twitter Extraction
Tokenizing
Stemming
TFIDF Stopword
s
Word Count Matrix
MDS Plotting
Analysis of the R NMDS•What we can determine with this analysis
1. Wendy’s and Burger King have favorable offerings for chicken and bacon.
2. Taco bell doesn’t have a notable salad offering. McDonalds also has a far distance from that term.
3. Price of Chipotle, Pizzahut, and McDonalds is frequently references.
4. Tacobell owns the term “crunch”
•What to do next
1. Pull in additional data to find the relative profitability of these firms and align them with our terms. If any “blue ocean” space is seen, that could be a potential business opportunity.

Twitter Extraction
Tokenizing StemmingTFIDF
Stopwords
Word Count Matrix
MDS Plotting
Pain Points and Lessons Learned• Ascii and Unicode conversion issues are a constant pain. It’s much easier to be
overaggressive with casting, also make sure that all modules and classes specify the type of text being used.
• For long calculations it is best to use pickle to checkpoint the work done and to make sure you have the processing saved off.
• Sometimes R is the right call, particularly when it comes to plotting.• The Scikit learn has almost all functions needed and it is easier to stay there as opposed to
trying to find other best of breed packages.
• LDA for topic modeling would be a great next step to reduce dimensionality.

Questions?