Social Media and Protest Participation: Evidence from Russia · idence on the association between...
99
Social Media and Protest Participation: Evidence from Russia * Ruben Enikolopov a,b,c,d , Alexey Makarin e , and Maria Petrova a,b,c,d a ICREA-Barcelona Institute of Political Economy and Governance b Universitat Pompeu Fabra c Barcelona Graduate School of Economics d New Economic School, Moscow e Northwestern University October 2018 Abstract Do new communication technologies, such as social media, alleviate the collective action prob- lem? This paper provides evidence that penetration of VK, the dominant Russian online social network, led to more protest activity during a wave of protests in Russia in 2011. As a source of exogenous variation in network penetration, we use information on the city of origin of the students who studied together with the founder of VK, controlling for the city of origin of the students who studied at the same university several years earlier or later. We find that a 10% increase in VK penetration increased the probability of a protest by 4.6%, and the number of protesters by 19%. At the same time, VK penetration increased pro-governmental sup- port, with no evidence of increased polarization. Additional results suggest that social media induced protest activity by reducing the costs of coordination rather than by spreading infor- mation critical of the government. We find that cities with higher fractionalization of network users between VK and Facebook experienced fewer protests, and the effect of VK on protests exhibits threshold behavior. Finally, we provide suggestive evidence that municipalities with higher VK penetration received smaller transfers from the central government after the occur- rence of protests. * We thank the Editor and four anonymous referees for the insightful comments. We are grateful to Sergey Chernov, Nikolai Klemashev, Aleksander Malairev, Natalya Naumenko, and Alexey Romanov for invaluable help with data collection, and to Tatiana Tsygankova and Aniket Panjwani for editorial help in preparing the manuscript. We thank the Center for the Study of New Media and Society for financial and organizational support. Ruben Enikolopov and Maria Petrova acknowledge financial support from the Spanish Ministry of Economy and Competitiveness (Grant BFU2011-12345) and the Ministry of Education and Science of the Russian Federation (Grant No. 14.U04.31.0002). This project has received funding from the European Research Council (ERC) under the European Union’s Horizon 2020 research and innovation programme (grant agreement No 638221). We are indebted to Daron Acemoglu, Sinan Aral, Lori Beaman, Matt Gentzkow, Sam Greene, Kosuke Imai, Kirabo Jackson, Vasily Korovkin, John Londregan, Eliana La Ferrara, Monica Martinez-Bravo, Samuel Norris, Ricardo Perez-Truglia, Gautam Rao, Tom Romer, Jake Shapiro, Jesse Shapiro, Gaurav Sood, Erik Snowberg, David Str¨ omberg, Adam Szeidl, Josh Tucker, Glen Weyl, Noam Yuchtman, Katia Zhuravskaya, and seminar participants at Higher School of Economics, Central European University, Berkeley, Bocconi, CEMFI, CREI, Hebrew, Mannheim, Microsoft Research, Princeton University, Universitat Pompeu Fabra, Northwestern University, New York University, NBER Digitization and Political Economy Meetings, 11th Workshop in Media Economics in Tel Aviv, 6th Workshop in Applied Economics in Petralia, “Social Media and Political Participation” conference in Florence, “Social Media and Social Movements” conference in St Petersburg for, and Political Economy Conference in Vancouver for helpful discussions. 1
Transcript of Social Media and Protest Participation: Evidence from Russia · idence on the association between...

Social Media and Protest Participation:Evidence from Russia∗
Ruben Enikolopova,b,c,d, Alexey Makarine, and Maria Petrovaa,b,c,d
aICREA-Barcelona Institute of Political Economy and GovernancebUniversitat Pompeu Fabra
cBarcelona Graduate School of EconomicsdNew Economic School, Moscow
eNorthwestern University
October 2018
Abstract
Do new communication technologies, such as social media, alleviate the collective action prob-lem? This paper provides evidence that penetration of VK, the dominant Russian online socialnetwork, led to more protest activity during a wave of protests in Russia in 2011. As a sourceof exogenous variation in network penetration, we use information on the city of origin of thestudents who studied together with the founder of VK, controlling for the city of origin of thestudents who studied at the same university several years earlier or later. We find that a 10%increase in VK penetration increased the probability of a protest by 4.6%, and the numberof protesters by 19%. At the same time, VK penetration increased pro-governmental sup-port, with no evidence of increased polarization. Additional results suggest that social mediainduced protest activity by reducing the costs of coordination rather than by spreading infor-mation critical of the government. We find that cities with higher fractionalization of networkusers between VK and Facebook experienced fewer protests, and the effect of VK on protestsexhibits threshold behavior. Finally, we provide suggestive evidence that municipalities withhigher VK penetration received smaller transfers from the central government after the occur-rence of protests.
∗We thank the Editor and four anonymous referees for the insightful comments. We are grateful to Sergey Chernov,Nikolai Klemashev, Aleksander Malairev, Natalya Naumenko, and Alexey Romanov for invaluable help with datacollection, and to Tatiana Tsygankova and Aniket Panjwani for editorial help in preparing the manuscript. We thankthe Center for the Study of New Media and Society for financial and organizational support. Ruben Enikolopov andMaria Petrova acknowledge financial support from the Spanish Ministry of Economy and Competitiveness (GrantBFU2011-12345) and the Ministry of Education and Science of the Russian Federation (Grant No. 14.U04.31.0002).This project has received funding from the European Research Council (ERC) under the European Union’s Horizon2020 research and innovation programme (grant agreement No 638221). We are indebted to Daron Acemoglu, SinanAral, Lori Beaman, Matt Gentzkow, Sam Greene, Kosuke Imai, Kirabo Jackson, Vasily Korovkin, John Londregan,Eliana La Ferrara, Monica Martinez-Bravo, Samuel Norris, Ricardo Perez-Truglia, Gautam Rao, Tom Romer, JakeShapiro, Jesse Shapiro, Gaurav Sood, Erik Snowberg, David Stromberg, Adam Szeidl, Josh Tucker, Glen Weyl, NoamYuchtman, Katia Zhuravskaya, and seminar participants at Higher School of Economics, Central European University,Berkeley, Bocconi, CEMFI, CREI, Hebrew, Mannheim, Microsoft Research, Princeton University, Universitat PompeuFabra, Northwestern University, New York University, NBER Digitization and Political Economy Meetings, 11thWorkshop in Media Economics in Tel Aviv, 6th Workshop in Applied Economics in Petralia, “Social Media andPolitical Participation” conference in Florence, “Social Media and Social Movements” conference in St Petersburg for,and Political Economy Conference in Vancouver for helpful discussions.
1

1 Introduction
The collective action problem has traditionally been seen as one of the major barriers to achiev-ing socially beneficial outcomes (e.g., Olson, 1965; Hardin, 1982; Ostrom, 1990). People’s abilityto overcome the collective action problem depends on their information environment and their abil-ity to communicate with one another. New horizontal information exchange technologies, such asFacebook, Twitter, and other social media platforms, allow users to converse directly without inter-mediaries at a very low cost, thus potentially enhancing the spread of information and weakeningthe obstacles to coordination. However, so far there has been no systematic evidence on whethersocial media indeed improves people’s ability to overcome the collective action problem. Our paperfills this gap in the literature by looking at the effect that the most popular online social network inRussia had on a particular form of collective action — political protests.
The rise of social media in recent years coincided with waves of political protests around theworld. But did social media play any role in inducing political participation, i.e., by inciting theprotests, or did its content just reflect the preferences of the population?1 Recent theoretical workargues that social media may indeed increase the probability of political protests taking place (Ed-mond, 2013; Little, 2016; Barbera and Jackson, 2016). However, testing this hypothesis empir-ically is methodologically challenging since social media usage is endogenous to individual andcommunity characteristics. In addition, protests are typically concentrated in one or a few primarylocations, as was the case for Tahrir Square in Egypt or Maidan in Ukraine. Hence, geographicvariation in protests is often very limited. Temporal variation in protest intensity can provide ev-idence on the association between activity and content of social media and subsequent protests(Acemoglu, Hassan, and Tahoun, 2017)2 but does not provide evidence on the causal effect ofsocial media availability.
To understand whether social media indeed promotes protest participation, we study an un-expected wave of political protests in Russia in December 2011 triggered by electoral fraud inparliamentary elections, coupled with the analysis of the effect of social media on the support ofthe government.3 Our empirical setting allows us to overcome the problems of previous studiesfor two reasons. First, there was substantial geographic and time variation in protest activities and
1While not based on systematic empirical evidence, previous popular and academic literature disagreed even aboutthe direction of the potential effect of social media on protests. Some have argued that the effect must be positive,as social media promotes cooperation (Shirky, 2008), fosters a new generation of people critical of autocratic leaders(Lynch, 2011), and increases the international visibility of protests (Aday et al., 2010, 2012). Others, however, havenoted that social media is either irrelevant or even helps to sustain authoritarian regimes by crowding out offlineactions (Gladwell, 2010), allowing governments to better monitor and control dissent (Morozov, 2011), and spreadmisinformation (Esfandiari, 2010).
2See also Hassanpour (2014) and Tufekci and Wilson (2012) for survey-based evidence on temporal variation inprotests in Egypt.
3Electoral fraud was documented, for instance, in Enikolopov, Korovkin, Petrova, Sonin, and Zakharov (2013) andKlimek, Yegorov, Hanel, and Thurner (2012).
2

in the penetration of major online social networks across Russian cities. E.g., among 625 cities inour sample, 133 witnessed at least one protest demonstration after the elections in December 2011.Second, particularities of the development of VKontakte (VK), the most popular social network inRussia, allow us to exploit quasi-random variation in the penetration of this platform across citiesand, ultimately, identify the causal effect of social media penetration on political protests.
Our identification is based on the information about the early stages of the VK development.VK was launched by Pavel Durov in October 2006, the same year he graduated from Saint Peters-burg State University (SPbSU). Upon VK’s creation, Durov issued an open invitation on an SPbSUonline forum for students to apply for membership on VK. Interested students then requested ac-cess to VK, and Durov personally approved all accounts. Thus, the first users of the network wereprimarily students who studied at Saint Petersburg State University together with Durov. This, inturn, made their friends and relatives at home more likely to open an account, which sped up the de-velopment of VK in these cities. Network externalities magnified these effects and, as a result, thedistribution of the home cities of Durov’s classmates had a long-lasting effect on VK penetration.In particular, we find that the distribution of the home cities of the students who studied at SPbSUat the same time as Durov predicts the penetration of VK across cities in 2011, but the distributionof the home cities of the students who studied at SPbSU several years earlier or later does not.
We exploit this feature of VK development in our empirical analysis by using the origin ofstudents who studied at SPbSU in the same five-year cohort as the VK founder as an instrument forVK penetration in summer 2011, controlling for the origin of the students who studied at SPbSUseveral years earlier and later. Thus, our identification is based on the assumption that temporalfluctuations in the number of students coming to SPbSU from different cities were not related tounobserved city characteristics correlated with political outcomes.
Using this instrument, we estimate the causal impact of VK penetration on the incidence ofprotests and protest participation. In the reduced form analysis, we find that the number of studentsfrom a city in the VK founder’s cohort had a positive and significant effect on protest participation,while there was no such effect for the number of students from older or younger cohorts. Thecorresponding IV estimates indicate that the magnitude of the effect is sizable — a 10% increase inthe number of VK users in a city led to a 4.6 percentage points higher probability of having a protestand a 19% increase in the number of protest participants. These results indicate that VK penetrationindeed had a causal positive impact on protest participation in Russian cities in December 2011.
We also study the impact of VK on support for the government. If the effect of social media onprotest participation is driven by the provision of information critical of the government, we wouldexpect to see a negative effect on government support. However, we do not find any evidenceof overwhelmingly negative content in social media posts weeks before the elections. Moreover,we find that higher VK penetration led to higher, not lower, pro-governmental vote shares in the
3

presidential elections of 2008 and 2012, and in the parliamentary elections of 2011. We find similarresults using data from a large-scale survey conducted weeks before the 2011 elections. At the sametime, we do not find evidence of social media leading to increased political polarization. Whilerespondents in cities with higher VK penetration expressed greater support for the pro-governmentparty, there was no evidence of increased disapproval of the government or of increased supportfor the opposition. Moreover, respondents in cities with higher VK penetration were less likelyto say that they were ready to participate in political protests. Thus, these results indicate thatsocial media did not increase the number of people dissatisfied with the government, at least beforethe 2011 elections, in contrast to a common perception that social media erodes the support ofautocratic leaders and leads to a higher degree of political polarization.
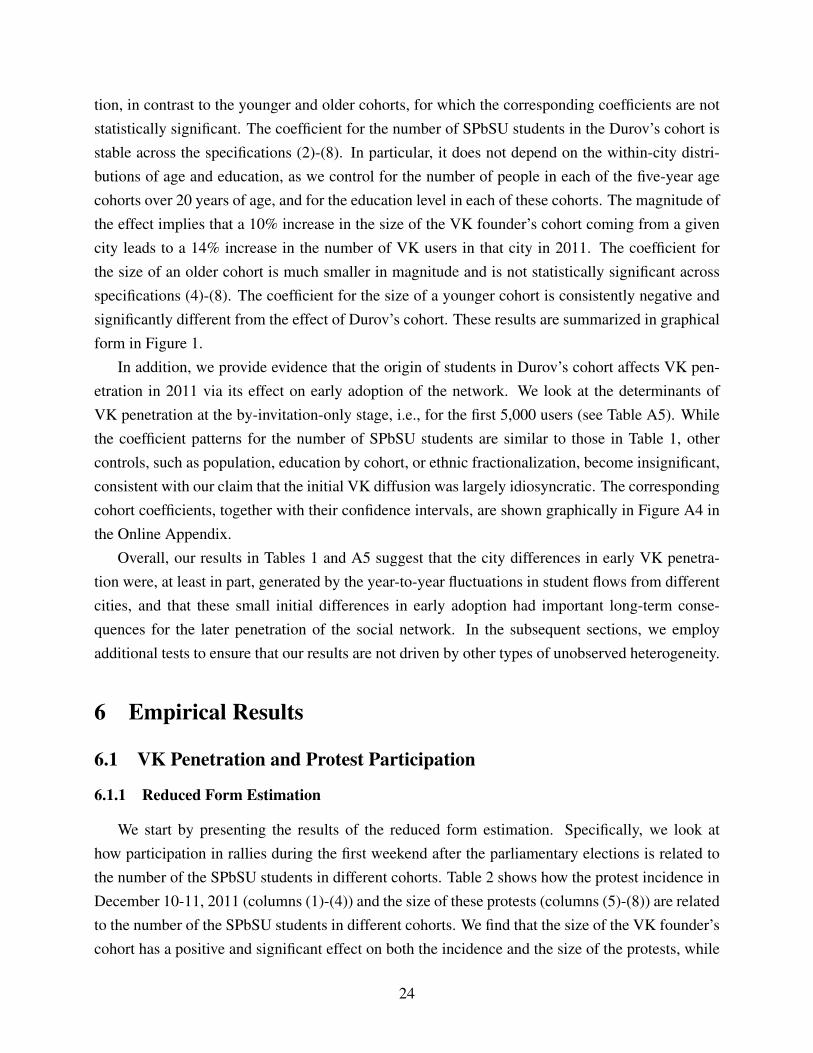
We perform a number of placebo tests to ensure that our results are not driven by unobservedheterogeneity. First, we show that VK penetration in 2011 does not predict protest participation inthe same cities before the creation of VK using three different protest instances: anti-governmentprotests in the end of the Soviet Union (1987-1992), labor protests in 1997-2002, and social protestsin 2005. Second, we show that VK penetration in 2011 was not related to voting outcomes beforethe creation of VK. These findings suggest that our results are not driven by time-invariant un-observed characteristics of the cities that affect protest activity or political preferences. We alsoreplicate our first stage regressions using information on the cities of origin of the students whostudied in more than 60 other major Russian universities. We find that the coefficient for our instru-ment — VK founder’s cohort at SPbSU — lies at the top end of the distribution of the coefficientsfor the same cohort in other universities, while the coefficients for younger and older cohorts lieclose to the medians of the corresponding distributions, which is consistent with our identifying as-sumptions. The tests in the spirit of Altonji, Taber, and Elder (2005) and Oster (2016) also indicatethat unobservables that are positively correlated with observables do not drive our results.
Next, we explore potential mechanisms behind the observed effects. Social media can havean impact on protests through the information channel or the collective action channel. The in-formation channel reflects the fact that online social media can serve as an important source ofinformation on the fundamental issues that cause protests (e.g., the quality of the government).This effect is likely to be especially strong in countries with government-controlled traditional me-dia, such as Russia. The collective action channel relies on the fact that social media users do notonly consume, but also exchange information. In particular, social media not only allows usersto coordinate the logistics of the protests (logistical coordination), but also introduces social moti-vation and strategic considerations if users and their online friends openly announce that they arejoining the protest (peer pressure and strategic coordination, respectively). Thus, the informationchannel increases the number of people dissatisfied with the regime, whereas the collective actionchannel increases the probability that dissatisfied people participate in protests.
4

There is an important difference between the roles social media plays in the two channels. So-cial media affects political outcomes through the information channel to the extent that it allowsfor freer protest-related content provision than in state-controlled media. Thus, in principle, anyfree traditional media could play a similar role. However, the role of social media in the collec-tive action channel reflects an inherent distinction between social media and traditional forms ofmedia, in that social media can facilitate horizontal flows of information between users. In an at-tempt to distinguish impact via the information versus the coordination channel, we first show thatfractionalization of users between VK and Facebook,4 conditional on the total number of users inthe two networks, had a negative impact on protest participation, though this effect becomes sig-nificant only for larger cities. This finding is consistent with the collective action channel, whichrequires users to be in the same network, but not with the information channel, as information aboutelectoral fraud was widely discussed in both networks. Taken together, these results are consistentwith the reduction of the costs of collective action being an important mechanism of social mediainfluence.
To derive other testable predictions, we develop a model of social media, voting, and protestsin an autocracy, extending the work of Little (2016). In this theoretical framework, we show thatthe effect of social media on protest participation should increase with city size if it is relianton collective action channel, but should not increase with city size if the information channel isdriving the results. Empirically, we show that, indeed, the positive impact of social media onprotest incidence and number of protesters increases with city size. At the same time, the positiveeffect of social media on voting in favor of the ruling regime does not grow with city size andstays relatively stable. In addition, there is evidence that the effect of social media on politicalprotests exhibits threshold behavior, with VK penetration affecting both the incidence and the sizeof protests only above a certain critical level. These results support the predictions of the modeland point towards the collective action channel being behind the baseline results.
Overall, our results indicate that social media penetration facilitates participation in politicalprotests, and the reduction in the costs of collective action is the primary mechanism behind thiseffect. The positive impact of social media penetration on collective action has been predictedby theoretical literature (e.g., Edmond, 2013; Little, 2016; Barbera and Jackson, 2016) and widelydiscussed in the popular press (e.g., Shirky, 2011), but so far there has been no systematic empiricalevidence to support this prediction. Our results imply that the availability of social media may haveimportant consequences as political protests can affect within-regime power-sharing agreements,as well as related economic and political outcomes (Madestam, Shoag, Veuger, and Yanagizawa-Drott, 2013; Aidt and Franck, 2015; Battaglini, 2017; Passarelli and Tabellini, 2017). A broader
4We define fractionalization as the probability that two randomly picked social media users belong to differentnetworks. We correct our measure for potential overlap between social media, allowing individuals to be users of bothFacebook and VK, and it does not change our results.
5

implication of our results is that social media has the potential to reduce the costs of collectiveaction in other circumstances.
More generally, our paper speaks to the importance of horizontal information exchange on peo-ple’s ability to overcome the collective action problem. Information technologies affect collectiveaction potential by increasing the opportunities for such exchange. In the past, technologies suchas leaflets, telephones, or even coffeehouses (Pendergrast, 2010) were used to facilitate horizontalinformation flows. Our results imply that social media is a new technology in this line, which pro-motes collective action by dramatically increasing the scale of horizontal information exchange.Development of this new technology can have far-reaching implications since the collective actionproblem have traditionally been seen as one of the major barriers to achieving socially beneficialoutcomes (e.g., Olson, 1965; Hardin, 1982; Ostrom, 1990).
Our paper is closely related to Acemoglu, Hassan, and Tahoun (2017) who study the impact ofTahrir protest participation and Twitter posts on the expected future rents of politically connectedfirms in Egypt. They find that the protests were associated with lower future abnormal returns ofpolitically connected firms. They also show that the protest-related activity on Twitter precededthe actual protest activity on Tahrir Square, but did not have an independent impact on abnormalreturns of connected companies. Our analysis is different from theirs in several respects. First, wefocus on studying the causal impact of social media penetration across cities, rather than lookingat the changes in activity in already existing social media accounts over time. Thus, we considerthe long-term counterfactual effect of not having social media, rather than a short-term effect ofhaving no protest-related content on social media. Second, we look not only at the number ofprotesters but also at the probability of the protests occurring, i.e., at the extensive margin of theeffect. Finally, our results shed some light on the potential mechanisms behind the impact of socialmedia on protest participation and voting in a non-democratic setting.
There are recent papers that study the association between social media usage and collectiveaction outcomes. Qin, Stromberg, and Wu (2017) analyze the content of posts on the Chinesemicroblogging platform Sina Weibo and show that Sina Weibo penetration was associated with theincidence of collective action events, without interpreting these results causally. Steinert-Threlkeld,Mocanu, Vespignani, and Fowler (2015) show that the content of Twitter messages was associatedwith subsequent protests in the Middle East and North Africa countries during the Arab Spring.Hendel, Lach, and Spiegel (2017) provide a detailed case study of a successful consumer boycottorganized on Facebook.5
5Papers that are less directly related to collective action include Bond et al. (2012) who show that that politicalmobilization messages in Facebook increased turnout in the U.S. elections, Qin (2013) who shows that the spreadof Sina Weibo led to improvement in drug quality in China, and Enikolopov, Petrova, and Sonin (2018) who showthat anti-corruption blog posts by a popular Russian civic activist had a negative impact on market returns of targetedcompanies and led to a subsequent improvement in corporate governance.
6

Our paper is also related to the literature on the impact of information and communication tech-nologies and traditional media on political preferences and policy outcomes. A number of recentworks identify the impact of broadband penetration on economic growth (e.g., Czernich, Falck,Kretschmer, and Woessmann, 2011), voting behavior (Falck, Gold, and Heblich, 2014; Campante,Durante, and Sobbrio, 2017), sexual crime rates (Bhuller, Havnes, Leuven, and Mogstad, 2013),and policy outcomes (Gavazza, Nardotto, and Valletti, 2015). However, these papers do not providespecific evidence about whether this effect is due to the accessibility of online newspapers, searchengines, email, Skype communications, or social media.6
Recent works have also shown that traditional media has an impact on voting behavior, violenceand ethnic tensions, and policy outcomes.7 In contrast, our paper studies the impact of social media,which is becoming increasingly important in modern information flows. A number of papers alsostudy ideological segregation online (Gentzkow and Shapiro, 2011; Gentzkow, Shapiro, and Taddy,2015b; Halberstam and Knight, 2016). In contrast to these papers, we study the causal impactof social media rather than patterns of social media consumption. Our paper is also related tothe historical literature on the impact of technology adoption (e.g., Dittmar, 2011; Cantoni andYuchtman, 2014), though we study modern-day information technologies instead of the printingpress or universities.
The rest of the paper is organized as follows. Section 2 provides background information aboutthe environment that we study. Section 3 describes our data and its sources. Section 4 presents atheoretical framework and outlines our main empirical hypotheses. Section 5 discusses our identi-fication strategy. Section 6 shows the empirical results. Section 7 concludes.
2 Background
2.1 Internet and Social Media in Russia
By 2011, approximately half of the Russian population had Internet access at home8 whichmade Russia the largest Internet market in Europe, accounting for about 15% of all EuropeanInternet users.9 Although more than 80 countries enjoyed higher Internet penetration rate at the
6There are also papers that study the impact of cellphone penetration on price arbitrage (Jensen, 2007) and civilconflict (Pierskalla and Hollenbach, 2013). In a similar vein, Manacorda and Tesei (2016) look at the impact ofcellphone penetration on political mobilization and protest activity in Africa.
7These papers include, but are not limited to, Stromberg (2004); DellaVigna and Kaplan (2007); Eisensee andStromberg (2007); Snyder and Stromberg (2010); Chiang and Knight (2011); Enikolopov, Petrova, and Zhuravskaya(2011); Gentzkow, Shapiro, and Sinkinson (2011); DellaVigna, Enikolopov, Mironova, Petrova, and Zhuravskaya(2014); Yanagizawa-Drott (2014); Adena, Enikolopov, Petrova, Santarosa, and Zhuravskaya (2015); Gentzkow, Petek,Shapiro, and Sinkinson (2015a).
8According to Internet Live Stats (http://bit.ly/2pilVDs).9According to comScore data (http://bit.ly/2oTnmfp).
7

time, Russia started catching up rapidly, demonstrating a 23% average yearly growth rate in 2007-2011.
Social media was already popular in Russia by 2011. On average, Russians were spending 9.8hours per month on social media websites in 2010 – more than any other nation in the world.10
Social media penetration in Russia was comparable to that of the most developed European coun-tries, with 88% of Russian Internet users having at least one social media account — compared,for instance, to 93% in Italy and 91% in Germany. Although Russians lost the title of the mostsocial-media-addicted nation to Israel in October 2011, they remained third with 10.4 hours peruser.11
Despite the increasing popularity of social media, Russia remains one of the very few marketswhere Facebook was never dominant. In fact, South Korea is the only other country where Face-book could not secure even the second largest share of the market for reasons other than censorship.Instead, homegrown networks VKontakte (VK) and Odnoklassniki were able to quickly take overthe Russian social media market. As of August 2011, VK had the largest daily audience at 23.4munique visitors (54.2% of the online population in Russia); Odnoklassniki was second with 16.5munique visitors (38.1%), leaving Facebook in third place with 10.7m unique visitors (24.7%).12
This unusual market structure emerged because of relatively late market entry by Facebook.By the time Facebook introduced a Russian language version in mid-2008, both VK and Odnok-lassniki had already accumulated close to 20m registered users.13 Besides, VK and Odnoklassnikicould offer certain services that Facebook could not, either due to legal reasons (e.g., Facebookcould not provide music and video streaming services because of copyright issues) or because of adifferent marketing strategy (e.g., users were attracted by a lower amount of advertising on Russianplatforms).
VK started off as a student- and youth-oriented website. “VKontakte” translates to “in contact”,and the original mission of VK was to help current students stay in touch later in life, with its targetaudience similar to that of Facebook. As a result, VK was more widespread anong younger audi-ence than Odnoklassniki.14 Facebook gained popularity among those who wanted to communicatewith their foreign friends, and thus had a higher market share in the largest cities, especially inMoscow and St. Petersburg.15
As of December 2011, the Internet in general — and social media in particular — enjoyed10According to comScore data (http://bit.ly/2oPqRDP).11According to comScore data, reported by TheNextWeb.com (http://bit.ly/2ofKbZf).12According to TNS data, reported by DreamGrow.com (http://bit.ly/2nRJlif).13According to the official VK blog (https://vk.com/blog?id=92) and BBC data reported by Dni.ru (http:
//bit.ly/2oTDIoi).14The original mission of Odnoklassniki was to help people find their former classmates and friends from the past,
so the targeted audience was, on average, older relative to that of VK. According to a marketing study performed in2010, an average VK user was 3 years older relative to an average Odnoklassniki user (http://bit.ly/2nRL5b1)
15According to a report by Mail.ru Group (http://bit.ly/2oToKi7).
8

relative freedom in Russia, as there were no serious attempts to control online content up until2012. Centralized censorship and content manipulation in social media began after the period wefocus on and, to a large extent, were consequences of the protests examined in this paper. Therelative freedom made social media websites an important channel for transmitting informationand enhancing political debate, taking this role away from Russian TV and major newspapers.16
2.2 History of VK
VK is a social media website very similar to Facebook in its functionality. A VK user cancreate an individual profile, add friends, converse with them, create events, write blog posts, shareinformation (textually, and in audio and video format), etc. It was launched in October 2006. Thecore of the VK development team was more or less stable until 2012, consisting of Pavel Durov(philology major at SPbSU at the time), his brother Nikolai Durov (physics graduate student atSPbSU at the time, winner of the intenational programming and math contests), and their fellowstudents. Upon VK’s creation, Durov issued an open invitation on an SPbSU online forum forstudents to apply for membership on VK. Interested students then requested access to VK, andDurov personally approved all accounts. Registration in VK opened to the general public at theend of November 2006. Shortly after, the number of users skyrocketed from 5 thousand users to 50thousand in January 2007, to 3 million in November 2007, to 100 million in November 2010 (seeFigure A1 in Online Appendix). By early 2008, VK became the most visited website in Russia.
VK creators held a strong position against any form of censorship. During the protests of 2011-2012 Pavel Durov was approached by the Federal Security Service (FSB) and was asked to startblocking the opposition-minded online communities, as well as protest events, some of which hadmore than 30,000 subscribers (Kononov, 2012). Durov refused, arguing that it would lead to alarge number of people switching to VK’s foreign competitors, such as Facebook.17 VK policiesregarding freedom of speech remained unchanged until Durov was forced to sell his share of VKand lost control of the firm in 2014.18 Note that Durov himself, at least before 2013, was not directlyinvolved in any political activity, and, in particular, did not advertise or create any politically relatedcontent in VK (Kononov, 2012).
16Since 2009, Freedom House has ranked mass media as “not free,” and Reporters without Borders has classifiedRussia as a country with a “difficult situation” in terms of freedom of the press.
17It has been documented that VK was very reluctant to block any communities, even when it came to groups thatmay be linked to terrorist activity (Manrique et al., 2016). Thus, this policy was not directly supporting any particularpolitical group, although it was disproportionately favoring groups that were underrepresented in traditional media.
18Durov was dismissed as the VK CEO after a similar incident two years later, in September 2014, when he refusedto block groups and accounts of Ukrainian revolutionaries. He was forced to sell his shares of VK to Mail.ru earlierthat year. He left VK for his new start-up Telegram. He left the country too, after obtaining Saint Kitts and Neviscitizenship.
9
2.3 Protest Movement of 2011-2012
A wave of protest demonstrations in 2011-2012 was triggered by electoral fraud during theparliamentary elections of December 2011. It was the first large-scale political protest movementin Russia since the collapse of the Soviet Union. Similar to other protest events in authoritariancountries (Kuran, 1991), Russian protests of December 2011 surprised everyone, including theirleaders.19 Russian society was politically inactive in the 2000s, with rapid economic growth soft-ening any criticism of Putin’s regime. Moreover, electoral fraud of an allegedly similar magnitudein the 2007 parliamentary elections did not trigger any serious protests (Treisman, 2011). In addi-tion, traditional media had been under heavy government control in 2007-2012 (and beyond), sothere was hardly any chance information on electoral fraud could have been transmitted throughthe main TV channels. The latter served as the primary source of information for nearly 80% ofRussians at the time, ensuring steady control over the information flows.20
Parliamentary elections were held on December 4, 2011. During the course of that day, reportsof electoral fraud were quickly grew in number, being documented both by independent observersand by regular voters. In the vast majority of cases, electoral fraud favored the incumbent party,United Russia. Videos of ballot staffing and ‘carousel’ voting (i.e., the same voter voting multipletimes at different polling stations) started to circulate around the Web and on social media. Startlingdifferences between exit polls and official results began to emerge; some exit polls reported 23.6%of the votes going to United Russia in Moscow, which was 20% lower relative to the official re-sult.21 Using statistical analysis, scholars later confirmed that the amount of fraud was sizable. Forinstance, Enikolopov et al. (2013) showed that the presence of a randomly assigned independentobserver, on average, decreased United Russia’s vote share by 11 percentage points (from 47% to36%). Clear evidence of electoral fraud, together with absence of any reaction from the govern-ment, became a source of outrage for thousands of people and urged some of them to take to thestreets.
On December 5, 2011, five to six thousand people appeared at a rally in the center of Moscow.The rally was followed by minor clashes with the police and the detention of several oppositionleaders. Although the number of protesters was not particularly large, this rally set a precedentfor future, more massive ones. The next anti-fraud rallies were held on December 10 and 24, andhad record attendance, both in Moscow (near 100,000 participants on both dates) and across thecountry (more than 100 cities participated).22 The subsequent waves of protests were less popular
19For instance, a day before the first protest gathered over 5,000 participants its organizers were debating whether athreshold of 500 people would be surpassed.
20For instance, see Levada survey in 2011 (http://bit.ly/2nv4Nyb, p. 135) or VTSIOM study in 2011 (http://bit.ly/2on8h4Z)
21Note that these exit poll results were later deleted from the corresponding polling agency’s websites.22For a map of Russian protests on December 10-11, 2011, see Figure A2 in the Online Appendix. Table A19
10

and involved fewer cities. Moscow and St. Petersburg, however, still hosted major rallies almosteach month. The tipping point of the movement was reached on May 6, 2012, a few days beforeVladimir Putin’s inauguration as President. Whereas all previous demonstrations were peacefuland non-violent, the Moscow rally on May 6 broke out in a number of serious clashes with thepolice. Within a few days, more than 30 activists were charged with allegedly inciting mass riotsand using violence against the police. Many then faced several years in prison. This trial, togetherwith absence of any tangible achievements, marked the decline of the 2011-2012 protest movementin Russia.
2.4 VK and Protest Activity
In December 2011, online social networks, including VK, became an important source of po-litical information in Russia, where traditional media was largely controlled by the state. Reportsof electoral fraud became widely available online, often accompanied by pictures and YouTubevideos. Most traditional media, however, did not cover this topic. Robertson (2015) reports thatVK users were more likely to be aware of the activities of Golos, the most prominent electoralmonitoring organization in Russia at the time, as compared with non-VK users. Reuter and Sza-konyi (2015) show that being a user of one of the online social networks was a strong predictor ofrespondent’s awareness of electoral fraud during the December 2011 elections. Based on an onlinesurvey of protest participants, Dokuka (2014) provides evidence that 67% of them learned aboutthe upcoming protests from VK, while another 22% obtained this information from other onlinesocial media platforms or online newspapers.
VK was also widely used for coordinating protest activities. VK allowed users to join openonline protest communities, share information about protest demonstrations in their cities, andlearn organizational details. As with most user profiles on VK, these communities were open, andanyone with an account on VK could see all content posted. According to our data, out of 133 citiesthat had protests, 87 had VK communities or events created with the purpose of organizing protestdemonstrations after the December 2011 parliamentary elections. Most of these communities werecreated within the first several days after the parliamentary elections.23
presents the names of the cities with protests and the estimates of each protest’s size.23Protest communities were identified by searching for several standard keywords (e.g., “For Fair Elections”) in
the names of these communities, so it is possible that we underestimate the number of cities with online protestcommunities.
11

3 Data
We use several sources of data. Our sample consists of 625 Russian cities with a populationover 20,000 per the 2010 Census. We exclude Moscow and Saint Petersburg from our sample asoutliers.
To measure VK penetration across cities, we collect information about the city of residence forall VK users with public accounts who joined VK before the summer of 2011.24 Only active VKusers were considered, i.e., users were added to the database only if they were seen online at leastonce between June 21 and July 7, 2011. Based on this information, we compute the number ofactive VK users in each city as of early summer of 2011, i.e., before the parliamentary electionswere scheduled and before the electoral campaign began.25 More details about data sources andconstruction of the main variables are available in Table A18 in the Online Appendix.
We use hand-collected data on political protests that occurred between December 2011 and May2012. When the protests began in December 2011, we started monitoring newspaper databases andonline resources to record information about political protests in all the Russian cities mentioned inthis context. The monitoring was repeated every week until the protests subsided in summer 2012.The main sources of information about the protests include an independent business newspaperKommersant, a government-owned news agency RIA Novosti, an opposition-leaning independentonline newspaper Ridus, various regional newspapers. Information was highly consistent acrossthese different sources, which makes it unlikely that it was manipulated and that discrepanciesacross sources would have a significant impact on our results.26
For each protest event, we recorded the number of protesters, as reported by three alternativesources: i) the police; ii) organizers of the protest; ii) a news source that wrote about the protest.27
As a result of this monitoring, we have collected a comprehensive city-level database on politicalprotests in Russia in 2011-2012. We aggregate this information to city-week level by constructing
24Public accounts contain some basic information on VK users, such as their home city, which is then available toanyone on the Internet. The timing of the account creation could be inferred from the account ID. Note that, at the timeof the data collection, more that 90% of the accounts on VK were public.
25In our analysis, we rely on self-reported location of VK users. This approach can potentially introduce a certainmargin of error for people who move to another city and do not update their information or for people who deliberatelylie about their location. However, we believe that the magnitudes of such errors would be quite limited, since Russia isnotorious for its low population mobility (Andrienko and Guriev, 2004; Guriev and Vakulenko, 2015), and since therewas no clear incentives to lie about one’s location on this social media platform. In addition, it is unlikely that theseerrors would be correlated with our main variables of interest, so, even if they are present, they would be causing ameasurement error bias that would be corrected in an instrumental variable specification.
26This is further confirmed by the fact that our numbers highly resemble those reported in an alternative source —the subsequently created Wikipedia entry devoted to the chronology of the political protests in Russia in 2011–2013(https://bit.ly/2oSwS0B). The downside of the Wikipedia page, however, is its limited coverage of smaller cities.
27We have data on all three estimates in 9.5% of the cases. Only one estimate is available in 64% of the cases. Asa result, we primarily use the estimates reported by journalists in various news sources. We report all these estimatesseparately for each city in Table A19 in the Online Appendix.
12

two variables: an indicator for the existence of a protest in a given city in a given week and thenumber of protesters, computed by taking the average number of protesters as reported by thepolice, organizers, and the news source.28 If there were more than one protest event in a city duringthe same week, we take the number of protesters at the biggest event. In this paper, we will useonly data for the first week of major protests: December 10–16, 2011. See Table A19 for thesedata and Figure A2 for a map displaying these protests across Russian territory. We explore thedynamics of protest participation over time in a companion paper (Enikolopov et al., 2017).
We use information on the city of origin of the students who studied at Saint Petersburg StateUniversity and other top Russian universities.29 Since, unfortunately, administrative records on theadmitted students are not available, these data are based on the information on the year of birth, uni-versity attended, and years of study provided in public accounts of Odnoklassniki users. Note that,as of 2014, when these data were collected, 80% of the Russian adult population reported havingan account in Odnoklassniki,30 so the coverage of our data is reasonably large. More specifically,for each university in the sample, we calculate the number of students coming from each city infive-year cohorts. We mostly focus on three cohorts in our analysis: i) those who were born thesame year as the VK founder or within two years of his birthday, either earlier or later; ii) thosewho were born from three to seven years earlier than the VK founder; iii) those who were bornfrom three to seven years later than the VK founder.31 Although using data from social media tomeasure the distribution of students across cities may introduce a measurement bias, the identifyingassumption is that, while controlling for the number of Odnoklassniki users, this bias does not varyacross cohorts in a way that is correlated with the outcomes of interest. Later on, we use varioustests to provide evidence that this assumption holds.
Next, we use data on the number of Facebook users by city in 2011 and 2013. The data onFacebook penetration in 2011 was taken from Nikolai Belousov’s blog.32 The data on Facebookpenetration in 2013 were collected manually for each city in our sample based on the estimates ofthe market size provided by Facebook to potential advertisers.33
We use three different sources of data for protests that occurred prior to the advent of socialmedia. The data on protests in the late Soviet Union come from Beissinger (2002). In the analysis,
28Our estimates remain practically unchanged if we use a median value of the available estimates instead of a mean.29In particular, we take all universities located in Moscow or Saint Petersburg among the top-100 Russian universi-
ties, as well as the top-20 universities from other cities. To identify the elite top-100 schools, we use the 2014 universityranking compiled by the RA Expert agency (http://bit.ly/2ofLYgU).
30According to Levada Center (http://bit.ly/2nv9w2C).31Our results remain very similar if we use students’ years of entrance to the university instead of their year of birth.
For a discussion of this and other alternative ways of constructing the cohorts, see Section 6.5.2.32http://bit.ly/2oWNTpg33To collect this data, we created a trial targeted ad to see what, according to Facebook, is the number of users who
could potentially see it for a given location target. Note that missing numbers for 2011 were imputed using the data onFacebook availability in 2013, VK availability in 2011, and VK availability in 2013 using a linear regression.
13

we look at all Soviet protests as a whole and the pro-democracy protests separately. The dataon participants in the labor protests of 1997-2002 come from Robertson (2011). Finally, we useinformation on the social protests of 2005 from the website of a communist organization,34 thoughwe admit that this source of data is less reliable than the ones mentioned previously. For all threesources, we exploit two different measures of protest intensity: the maximum number of protestersin a city and an indicator for at least one protest in a city.
The data on electoral outcomes come from the Central Election Commission of the RussianFederation. We obtained the public opinion data from the MegaFOM opinion poll conducted bythe Public Opinion Foundation (Fond Obschestvennogo Mneniya, or FOM) in October-November2011.35 This is a regionally representative survey of 56,900 respondents in 79 regions, of which30,669 respondents come from 519 cities in our sample.
City-level data on population, age, education, and ethnic composition come from the RussianCensuses of 2002 and 2010. Data on the average wage and municipal budgets come from themunicipal statistics of RosStat, the Russian Statistical Agency. Additional city characteristics,such as latitude, longitude, year of city foundation, and the location of administrative centers, comefrom the Big Russian Encyclopedia. Summary statistics for each variable employed in the analysisare presented in Table A1 in the Online Appendix. In addition, Table A2 presents the summarystatistics broken down by city’s quartile of VK penetration.
4 Theoretical Framework
In this section, we aim at constructing a common theoretical framework that would incorporatesocial media with both outcomes of our study — voting and protest participation in an autocracy.Building on the work by Little (2016), we examine how, by providing more precise informationabout the quality of the government and protest logistics, social media can affect the number ofpeople choosing to turn out to protest or express support for the regime. We also explore theexistence of threshold behavior in the relationship between VK penetration and protests, and theway the effect of social media depends on city size.
4.1 Voting in Autocracy
First, we study how communication technology can affect the support of the government inan autocracy. Rather than examine the choice between multiple political candidates, we considera citizen deciding whether to support a ruling party or abstain. We believe that this setup better
34http://trudoros.narod.ru/35We are grateful to the president of FOM, Alexander Oslon, for generously sharing the data.
14

matches the reality of quasi-authoritarian elections in Russia.There is a continuum of risk-neutral citizens, i ∈ [0,1]. The nature draws a common prior belief
about the regime quality, ω , which is distributed as N(0,1/α0). Then the public signal about ω
is drawn, sω ∼ N(µs,1/αs). The cost of voting for citizen i is drawn as cvi ∼ N(µvc,σ2vc). Each
citizen then maximizes:uv(vi) = vi[ω +λvV − cvi]
where vi is a voting decision indicator, which equals to one if i votes for an autocrat and zerootherwise; λv ≥ 0 is a taste-for-conformity parameter; and V is the proportion of citizens whovoted for the autocrat. In this version of the model, all citizens update their priors about the regimebased on the same information, so that citizens’ belief about the regime’s popularity, ω , does notvary with i. However, the cost of voting, cvi, is drawn at random for each individual, so theirdecisions to vote for the ruling party or abstain will still differ.
The citizens’ updated belief about the regime’s quality, ω , upon observing the public signal,sω , is:
ω = E[ω + sω ] =sωαs
α0 +αs
Having updated their beliefs about the regime, citizens compare the benefits of voting with theirindividual costs, cvi. Note that citizens with cvi < sωαs/(α0 +αs) will vote for the ruling partyno matter what others do, while citizens with cvi > sωαs/(α0 +αs)+λv will abstain regardless ofthe voting decision of others. In equilibrium, there will be a cut-off value of individual cost, cv,between these two values, such that citizens with realized costs of voting below the cutoff valuewill vote for the incumbent, and all citizens with realized costs above this cutoff will not vote forthe ruling party. To identify the voting cut-off, cv, we need to calculate the expected proportion ofpeople voting for the government given the public signal, sω :
E[V |sω ] = Pr[cvi ≤ cv(sω)|sω ] = Pr[
cvi−µvc
σvc≤ cv(sω)−µvc
σvc
]= Φ
[1
σvc(cv(sω)−µvc)
](1)
Hence, the cut-off level, cv, is determined by the following equation:36
cv(sω) =sωαs
α0 +αs+λvΦ
[1
σvc(cv(sω)−µvc)
](2)
The comparative statics of the costs cut-off w.r.t. sω and αs are as follows:
∂ cv
∂ sω
=
αsα0+αs
1− λvσvc
φ( 1σvc
(cv−µvc))(3)
36Note that in the case of λv = 0 the solution becomes a simple Bayesian updating.
15

∂ cv
∂αs=
sω α0(α0+αs)2
1− λvσvc
φ( 1σvc
(cv−µvc))(4)
We assume that the taste-for-conformity parameter, λv, is sufficiently small so that the denominatorof the above fractions is positive. This is necessary for a meaningful equilibrium in which a positivepublic signal about an autocrat increases the amount of votes in favor of the regime, i.e., ∂ cv/∂ sω >
0.An increase in social media penetration can be interpreted as an increase in the precision of the
public signal, αs. Thus, social media increases support for an autocrat (∂ cv/∂αs > 0) whenever thepublic signal is favorable to the regime (sω > 0) and decreases support (∂ cv/∂αs < 0) wheneverthe public signal is unfavorable (sω < 0). Hence, we draw the following empirical prediction fromthis part of the model:
Prediction 1. Higher social media penetration (i.e., higher αs) leads to higher (lower) vote
share of the ruling party if the content of social media (i.e., public signal sω ) is, on average,
positive (negative).
4.2 Protests in Autocracy
As shown in the previous section, the impact of social media on voting in favor of the rulingparty naturally depends on the information content of the available social media platforms. Inthis section, we examine the potential ramifications of social media for protest participation. Animportant distinction from the case of voting is that social media can facilitate protest participationnot only through the information change, but also through the coordination channel.37
As in the previous case, there is a continuum of risk-neutral citizens, i ∈ [0,1]. First, naturedraws common priors about the regime quality, ω , and protest tactics, θ . The common priors on ω
and θ are distributed as N(0,1/α0) and N(0,1/β0), respectively. The public signals are then drawnas sω ∼ N(ω,1/αs) and sθ ∼ N(θ ,1/βs). A random cost of protesting, which is separate from thecosts of mismatching tactics, is drawn as cpi ∼ N(µpc,σ
2pc). Each citizen then maximizes:
up(pi, ti) = pi[−ω +λpP− k(ti−θ)2− cpi],
where pi is the protest decision indicator which equals to one if i goes out to protest and zero
37In this simple framework, we mostly study the effect of logistical coordination and model strategic coordinationin a rudimentary fashion, by making the utility function depend on the number of participants. We refer the readerto the papers of De Mesquita (2010); Edmond (2013); Passarelli and Tabellini (2017); Barbera and Jackson (2016);Battaglini (2017) for the full-fledged theoretical models with a strategic coordination component. Note that a recentpaper by Cantoni et al. (2017) suggests that individual protest participation actions could be strategic substitutes. Incontrast, the effect of social media on logistical/tactical coordination is unambiguously positive, which allows us tomake clear empirical predictions.
16

otherwise; ti is the tactics decision of an individual; k(ti− θ) represent the costs of mismatchingtactics; P is the proportion of citizens who turn out to protest, and λp≥ 0 is a reduced form strategiccoordination parameter, which reflects the social image parameter as in Enikolopov et al. (2017)and a number of other potential channels (e.g. safety in numbers). The main difference from thecase of voting is the need to coordinate on protest tactics, which includes the decision on when,where, and how to protest against the regime, θ , which introduces an additional level of uncertainty.
Identical to the case of voting in autocracy, citizens update their beliefs about regime quality,ω , upon observing the public signal, sω , as follows:
ω = E[ω + sω ] =sωαs
α0 +αs
Similarly, upon observing signal sθ , citizens update their beliefs about the tactics of the upcomingprotest:
θ = E[θ + sθ ] =sθ βs
β0 +βs
Since citizens would like to match the true θ as closely as possible, in optimum, they set ti = θ . Bydefinition, the expected level of the discrepancy between θ and θ is equal to the variance of θ , i.e.,formally:
E[k(θ −θ)2] =k
β0 +βs
Hence, each citizen decides to participate in a protest whenever the expected benefits outweigh theexpected costs:
− sωαs
α0 +αs+λPE[P|sω ,sθ ]>
kβ0 +βs
+ cpi (5)
As in the case of voting, citizens with cpi < −sωαs/(α0 +αs)− k/(β0 +βs) are going to protestregardless of the protest participation decision of others, while citizens with cpi > λp−sωαs/(α0+
αs)−k/(β0+βs) will not participate regardless. In equilibrium, there will be a cut-off value of theindividual cost of protesting, cp, in between these two values, such that citizens with a realized costbelow the cutoff value will go out to protest, and citizens with a realized cost above the cutoff willabstain. We search for the cut-off level, cp, that would equalize the two sides of the equation (5)and separate participants and non-participants:
− sωαs
α0 +αs+λPΦ
[1
σpc(cp(sω ,sθ )−µpc)
]− k
β0 +βs− cp(sω ,sθ ) = 0 (6)
The comparative statics of the cut-off with respect to the public signal of regime strength (sω ) and
17

social media (i.e., increased precision of public signals, αs and βs) are as follows:
∂ cp
∂ sω
=− αs
α0+αs
1− λpσpc
φ( 1σpc
(cp−µpc))(7)
∂ cp
∂βs=
k(β0+βs)2
1− λpσpc
φ( 1σpc
(cp−µpc))(8)
∂ cp
∂αs=
− sω α0(α0+αs)2
1− λpσpc
φ( 1σpc
(cp−µpc))(9)
As in the case of voting, we assume that λp is sufficiently small so that the denominator of theabove fractions is positive. This is necessary for a meaningful equilibrium in which a positivepublic signal about an autocrat decreases the size of the protest. We conclude that: (i) protest sizedecreases with a more favorable public signal about the regime (i.e., ∂ cp/∂ sω < 0), (ii) protestsize increases when citizens receive a more precise signal about the protest tactics (i.e., ∂ cp/∂βs >
0), and (iii) protest size increases when citizens receive a more precise signal about the regimeconditional on the signal being negative (i.e., ∂ cp/∂αs > 0 if sω < 0) and decreases with signalprecision if the signal provides positive information about the regime (i.e., ∂ cp/∂αs < 0 if sω > 0).We conclude by deriving the following empirical prediction from this analysis:
Prediction 2. Higher social media penetration (higher αs and βs) leads to higher protest par-
ticipation against the ruling regime if the content of social media (public signal sω ) is, on average,
negative. However, even when the content online is positive, social media could increase protest
participation if the gains in coordination (higher βs) are high enough.
Intuitively, higher social media penetration affects protest size through two different channels:by influencing the perceptions of the government quality and by decreasing the costs of coordina-tion. The direction of the first effect depends on the content, but it works in the same direction as inthe case of voting. The second effect always increases protest participation by improving tacticalcoordination. Thus, if the content of social media is, on average, negative, both effects work in thesame direction, so that higher social media penetration unambiguously increases protest participa-tion. If the content of social media is positive, the two forces operate in the opposite direction, andthe overall effect will depend on the relative importance of learning about the regime’s quality andtactical coordination.
18
4.3 City Size and Coordination Channel
In the previous section, we established that social media may affect protest participation alongtwo different channels — by increasing the precision of the public signal about the quality of theregime (information channel) and by increasing the precision of the tactics signal (coordinationchannel). In this section, we provide an extension of the theoretical framework that yields anadditional prediction: the extent to which the effect of social media depends on city size is differentfor these two channels.
Consider N cities of different size. Assume that the larger the city size, the more difficult it islogistically to coordinate protest activities due to the need of coordinating a larger group of people.In terms of our theoretical framework that means that the prior signal about the protest tactics isnoisier in larger cities, β 1
0 > β 20 > ... > β N
0 where cities are ordered monotonically in city size,from the smallest city (i = 1) to the largest one (i = N).38 Importantly, only public signals frompeople from the same city are relevant for coordination, whereas for information about regimequality there is no difference between signals from the same and other cities. Thus, due to thetransmission of information about regime quality across cities, which is not present for protesttactics, the baseline dispersion of the prior signal about regime quality is assumed to be the sameacross cities, α1
0 = ... = αN0 = α0.39 Since there are no other interactions between individuals in
different cities, for each city, calculations in Section 4.2 do apply.Equation (8) implies that, if lambda is small enough, the impact of social media on protest
participation via coordination exhibits diminishing returns, ∂ 2cp/∂β i0∂βs < 0 , ∀i ∈ [1,N].40 An
immediate corollary of this result is that social media should be more important in places wherecoordination is harder to achieve in the absence of public signals, i.e., in cities with lower β i
0.Although the effect of social media on protest participation via information may also exhibit di-minishing returns, we would not expect it to increase in magnitude with city size, since there islittle reason to believe that the ex-ante public signal regarding popularity of the federal regime isnoisier in larger cities. This analysis leads to an additional prediction that the impact of socialmedia should be greater in larger cities due to a stronger marginal effect of social media on coor-dination; in contrast, the impact of social media on voting should not increase with city size, as it
38Intuitively, this prediction can be micro-founded in the following extension of the baseline model. Suppose thatthere are offline word-of-mouth sources of information and online social media. The number of signals that citizensreceive offline via friends and family who live in the same city, F , is independent of the city size, N. However, online,citizens can quickly communicate with an extended circle of friends and acquaintances, who can come either fromthe same or other cities. Suppose that the number of signals citizens receive online from other people from the samecity E(N) is increasing with city size, i.e. ∂E(N)/∂N > 0. In this setting, the baseline precision of the public signalabout the protest tactics would be more precise in smaller cities and, as a result, the importance of social media forcoordination should increase with city size.
39For the public signal about the popularity of the regime, however, the precision of the signal does not depend onthe size of the city (but does depend on the size of the whole social network).
40See the derivation of this result, as well as the precise condition on lambda in Section A.1 of the Online Appendix.
19

relies primarily on the information channel.Prediction 3. The impact of social media on protest participation is larger in areas where
coordination is hard to achieve in the absence of public signals (low initial β0). In particular, the
effect of social media on protest participation increases with city size. In contrast, the impact of
social media on voting in favor of the regime does not increase with city size.
4.4 Social Media Penetration and the Critical Mass
In this section, we explore a natural extension of the model predicting that social media shouldstart to matter for protest participation only after its penetration reaches a certain threshold — aprediction which we then take to the data.
Suppose all citizens fall into two categories — those who adopted social media and those whodid not. The share of those who adopted social media is m. In this section, similar to the reasoningin Section 4.3, we assume that the precision of the public signal about the regime is the same forall citizens, including non-adopters. However, only adopters enjoy higher precision of the tacticssignal from social media, i.e., β a
s > β ns where a denotes a social media adopter while n indicates
that a citizen did not adopt social media. We take the adoption decision as exogenous throughoutthis section.
Following the calculations in Section 4.2, one can show that adopters and non-adopters wouldhave different participation thresholds, ca
p and cnp, defined by the following pair of equations:
− sωαs
α0 +αs+λpP =
kβ0 +β a
s+ ca
p (10)
− sωαs
α0 +αs+λpP =
kβ0 +β n
s+ cn
p (11)
Note that the total share of protesters now consists of two different types of participants — adoptersand non-adopters:
P = mPr[ci ≤ cap|sω , sa
θ ]+ (1−m)Pr[cpi ≤ cnp|sω , sn
θ ]
To understand how protest participation changes with m and whether, other things held constant,higher social media adoption could trigger a protest after reaching a certain critical mass, we studythe comparative statics of the cost thresholds, ca
p, and protest participation, P, with respect to socialmedia penetration, m. Subtracting equation (11) from equation (10), one gets:
cap− cn
p =k(β a
s −β ns )
(β0 +β as )(β0 +β n
s )= K > 0
20

Note that cap > cn
p, meaning that the fraction of adopters who participate in protests is higher thanthe fraction of non-adopters who do, due to the higher precision of their information regardingtactics. Expressing ca
p in terms of K and cnp and plugging in the result in (11), one gets:
− sωαs
α0 +αs+λp
[mΦ
(1σc
(cnp +K−µc)
)+(1−m)Φ
(1σc
(cnp−µc)
)]=
kβ0 +β n
s+ cn
p (12)
For the ease of exposition, denote cnp = (cn
p +K− µpc)/σpc and cnp = (cn
p− µpc)/σpc. Applyingthe implicit function theorem to equation (12), we derive the first derivative of the non-adoptersparticipation, cn
p, with respect to social media penetration, m:
∂ cnp
∂m=
λp[Φ(cn
p)−Φ
(cn
p)]
1− λpσpc
[mφ(cn
p)+(1−m)φ(cnp)] > 0 (13)
Hence, as the take-up of social media in the population grows, non-adopters go out to protest witha higher probability. As a result, the total share of protesters, P, is also monotonically increasingwith m:
∂P∂m
=(Φ(cn
p)−Φ
(cn
p)) ∂ cn
p
∂m1
σpc
(mφ(cn
p)+(1−m)φ
(cn
p))
> 0
Assume now that, after citizens made their participation decisions, a protest gets organized onlyif the total share of citizens who would like to participate exceeds some threshold P∗.41 Since theshare of people willing to participate is monotonically increasing in m, there is a unique thresholdof social media penetration m∗ such that, other parameters held equal, protests are organized incities above this threshold and are not in cities below it.42 Hence, we conclude with the followingempirical prediction:
Prediction 4. Higher rates of social media adoption (higher m) lead to higher protest partic-
ipation (higher P). Moreover, if protests take place after a certain critical mass of potential par-
ticipants is accumulated, we expect protests to occur only after social media penetration reaches a
certain threshold, m∗.41Such threshold behavior naturally arises if political protests are modeled in a more elaborate global game setting
(e.g., as in Edmond, 2013).42Note that, in this model, the location of the threshold for VK penetration depends not only on the critical mass
needed for a successful protest (P∗), but also on the relative importance of strategic and logistical coordination (λp andk, respectively), relative importance of social media signal for believe update (β a
s −β ns ), and the within city deviation
of costs distribution (σpc).
21

5 Identification Strategy
Our main hypothesis is that social media penetration (specifically, VK penetration) has an im-pact on political outcomes, whether it is protest participation, voting, or support of the governmentin the opinion polls. Thus, we estimate the following model:
PoliticalOutcomei = β0 +β1VKpenetrationi +β2Xi + εi (14)
where PoliticalOutcomei is either a measure of protest activity — either an indicator variable forthe occurrence of at least one protest in city i in the first weekend of the protests (December 10thand 11th) or the logarithm of the number of protesters in city i 43— or of the support of the govern-ment — either through voting or support in opinion polls; VKpenetrationi is the logarithm of thenumber of VK users in city i in the summer of 2011; Xi is a vector of control variables that includesa fifth-order polynomial of the population, an indicator for being a regional or a subregional (rayon)administrative center, average wage in the city, the number of city residents of different five-yearage cohorts, the distance to Moscow and Saint Petersburg, an indicator for the presence of a univer-sity in the city, the share of population with higher education in 2010 in each five-year age cohort,the share of the population with higher education in 2002, ethnic fractionalization, and internetpenetration. In some specifications, Xi also includes the outcomes of the pre-2006 parliamentaryelections to control for pre-existing political preferences of the population. Standard errors in allregressions are clustered at the regional level.44
5.1 Identification Strategy
The OLS estimates of the equation (5) are likely to be biased, as the unobserved characteristicsthat make people more (or less) likely to become VK users can also make them more likely toparticipate in political activities. To address this issue, we use fluctuations in the origin of thestudents who have studied at SPbSU as a source of exogenous variation in VK penetration thatdoes not have an independent effect on protest participation. In particular, we exploit the fact thatthe distribution of the home cities of the students who studied at SPbSU at the same time as theVK founder predicts the penetration of VK across cities in 2011, but the distribution of the homecities of the students who studied at SPbSU several years earlier or later does not. Specifically,we compute the number of students from each city in three five-year student cohorts (to match theCensus definition of cohorts): (i) those who have studied at the same year as Durov, as well as oneor two years earlier or later, (ii) those who studied from three to seven years earlier than Durov, and
43We focus on the first protests to avoid a possibility of dynamic effects within and across the cities.44All our baseline results are robust to spatially correlated standard errors calculated as in Konig et al. (2017) (see
Table A6 in the Online Appendix).
22

(iii) those who studied from three to seven years later than Durov.45
The identifying assumption is that, conditional on population, education, and other observables,fluctuations of the student flows from different cities to Saint Petersburg State University in the2000s are orthogonal to the unobserved determinants of protest participation.
Table A3 in the Online Appendix presents a full distribution of the SPbSU student cohorts bytheir home cities. Note that in all but one case the number of students is less than 40 studentsper home city, for all three cohorts. Thus, the numbers are sufficiently small to allow for randomfluctuations in the distribution of students across cities.46
We further check whether there is enough variation in student flows across time by calculatingthe correlation between city rank across the three cohorts. In this analysis, we only take intoaccount cities that sent at least one student to SPbSU in any of the three five-year cohorts. Wecalculate ‘field’ ranks of each city for each cohort by assigning rank 1 to the city with the largestoutflow of students, rank 2 to the city with the second largest outflow, etc. In case of ties, the sameaverage rank is assigned. The results provided in Table A4 in the Online Appendix show that thecorrelations between city ranks across cohorts are less than 0.5, which is indicative of substantialfluctuations in rankings over time. To display the variation visually, we plot the rank variablesagainst each other in Figure A3 in the Online Appendix. The size of the marker reflects the numberof cities with the same combination of ranks. As with the correlation table, these graphs illustrateconsiderable variation in the number of students sent to SPbSU across years. For instance, plentyof cities had more than one student in one cohort and zero in the other. Similarly, cities’ ranks varysignificantly at the high end of the distribution.
Note that students were coming to study at Saint Petersburg State University from all over thecountry. These students arrived from 73 out of 79 Russian regions included in our study. Studentsin the Durov’s cohort came from 237 different cities (more than a third of all Russian cities), whilestudents from an older cohort came from 222 cities and students from a younger cohort came from214 different cities. Thus, we have sufficient variation in the student flows both over time andacross cities, which allows for meaningful comparison.
5.2 Determinants of VK penetration
To show that our instrument is relevant Table 1 provides evidence on the determinants of VKpenetration across Russian cities in 2011, and, in particular, on the effect of the number of SaintPetersburg State University students in different cohorts on VK adoption in their home cities. Theresults indicate that, once population controls are included, the five-year cohort of Pavel Durov, theVK founder, is positively and significantly (at 1% level) correlated with subsequent VK penetra-
45See Section 6.5.2 for the discussion of the robustness of our results to alternative definitions of cohorts.46We also check that our results are robust to exclusion of cities with more than 10 students in the Durov’s cohort.
23
tion, in contrast to the younger and older cohorts, for which the corresponding coefficients are notstatistically significant. The coefficient for the number of SPbSU students in the Durov’s cohort isstable across the specifications (2)-(8). In particular, it does not depend on the within-city distri-butions of age and education, as we control for the number of people in each of the five-year agecohorts over 20 years of age, and for the education level in each of these cohorts. The magnitude ofthe effect implies that a 10% increase in the size of the VK founder’s cohort coming from a givencity leads to a 14% increase in the number of VK users in that city in 2011. The coefficient forthe size of an older cohort is much smaller in magnitude and is not statistically significant acrossspecifications (4)-(8). The coefficient for the size of a younger cohort is consistently negative andsignificantly different from the effect of Durov’s cohort. These results are summarized in graphicalform in Figure 1.
In addition, we provide evidence that the origin of students in Durov’s cohort affects VK pen-etration in 2011 via its effect on early adoption of the network. We look at the determinants ofVK penetration at the by-invitation-only stage, i.e., for the first 5,000 users (see Table A5). Whilethe coefficient patterns for the number of SPbSU students are similar to those in Table 1, othercontrols, such as population, education by cohort, or ethnic fractionalization, become insignificant,consistent with our claim that the initial VK diffusion was largely idiosyncratic. The correspondingcohort coefficients, together with their confidence intervals, are shown graphically in Figure A4 inthe Online Appendix.
Overall, our results in Tables 1 and A5 suggest that the city differences in early VK penetra-tion were, at least in part, generated by the year-to-year fluctuations in student flows from differentcities, and that these small initial differences in early adoption had important long-term conse-quences for the later penetration of the social network. In the subsequent sections, we employadditional tests to ensure that our results are not driven by other types of unobserved heterogeneity.
6 Empirical Results
6.1 VK Penetration and Protest Participation
6.1.1 Reduced Form Estimation
We start by presenting the results of the reduced form estimation. Specifically, we look athow participation in rallies during the first weekend after the parliamentary elections is related tothe number of the SPbSU students in different cohorts. Table 2 shows how the protest incidence inDecember 10-11, 2011 (columns (1)-(4)) and the size of these protests (columns (5)-(8)) are relatedto the number of the SPbSU students in different cohorts. We find that the size of the VK founder’scohort has a positive and significant effect on both the incidence and the size of the protests, while
24

the coefficients for other cohorts are much smaller and are not statistically significant. Moreover,the sign of the coefficient for the older cohort is consistently negative across specifications. 47 Thedifference between coefficients for different cohorts is statistically significant for the incidence ofprotests in all specifications. Figures 2A and 2B report these results graphically.
To assess the possible degree of omitted variable bias, we follow the approach of Oster (2016),which is an extension of the approach of Altonji, Taber, and Elder (2005). In particular, we computehow important, in terms of explanatory power, unobservables should be relative to observables inorder to fully explain the coefficient for the VK founder’s cohort. We find that unobservables shouldbe negatively correlated with observables and that their importance must be more than seven timeshigher to be able to explain the results for the size of the protests and three times higher to explainthe results for the protest incidence. These results stand in sharp contrast to the standard assumptionof equal selection, i.e., that unobservables are positively correlated with observables and are equallyimportant (Altonji, Taber, and Elder, 2005).
Taken together, the results presented in Table 2 and Figures 2A-2B indicate that the SPbSU stu-dent cohort of the VK founder is positively and significantly associated with protest participation,in contrast to the older and younger SPbSU cohorts, and that these results are unlikely to be drivenby omitted variable bias.
6.1.2 IV Results for Protest Participation
Reduced form analysis in Table 2 suggests that the SPbSU student cohort of the VK founder,through its impact on VK penetration, had a positive effect on protest activity in 2011. However,reduced form regressions do not allow us to quantify the magnitude of the effect of social mediapenetration on protests. In this section, we estimate equation (5) using the number of SPbSU stu-dents in the VK founder’s cohort as an instrument for VK penetration in summer 2011, controllingfor the number of SPbSU students in older and younger cohorts.
First, we test the hypothesis that protests are more likely to occur if social media penetration ishigher. The results in columns (1)-(4) of Panel A of Table 3 indicate that social media penetrationhad a quantitatively large and a statistically significant effect on the incidence of protests. To beable to combine IV estimation with clustered standard errors and weak instrument tests, we use alinear probability model.48 The results indicate that VK penetration had a positive and statistically
47Note that, even though we cannot reject the hypothesis that the coefficients for the VK founder and the youngercohorts are the same, that does not invalidate our exclusion restriction. This is because we can expect some spilloversof information about VK to the younger cohorts, who studied at SPbSU after the creation of the network.
48We show that our baseline results are robust to using non-linear models and present these results in Table A7 inthe Online Appendix. In particular, we use an IV probit model for the incidence of protests and a negative binomialIV model for the number of protesters. The results remain very similar to our baseline estimates, both in terms ofmagnitudes and statistical significance.
25

significant effect on the probability that a protest occurs. A 10% increase in the number of VKusers in a city leads to a 4.5-4.8 percentage points higher probability of a protest being organized.
One potentially important concern for our estimation is the weak instruments problem. Lack ofa sufficiently strong first stage could lead to unreliable IV estimates and inference. The traditionalStock and Yogo (2005) thresholds for the F-statistic were derived for the case of homoscedasticerrors, and thus cannot be applied to a model with clustered standard errors. For this reason, weuse a recently developed methodology by Montiel Olea and Pflueger (2013) who derived a test forweak instruments similar to the one in Stock and Yogo (2005), but for the case of clustered stan-dard errors. The corresponding effective F-statistics in our specifications take values around 10-12.Although this value is below the threshold of 23 derived by Montiel Olea and Pflueger (2013) forthe case of 10% potential bias and a 5% significance, it is still above the rule-of-thumb threshold of10 after which the weak instrument problem does not appear to affect the validity of conventionalt-statistics in the case of clustered standard errors (Andrews, Stock, and Sun, 2018).49 To be conser-vative, following recommendations by Andrews et al. (2018), we also report the weak-instrumentrobust confidence intervals for all the main coefficients, calculated without an assumption of astrong instrument. As one can see, the intervals exclude zero in all our specifications.50
For comparison purposes, we display the OLS estimates for the same second-stage specifica-tions in columns (5)-(8) of Panel A of Table 3. The coefficients are still highly significant, but aremuch smaller in magnitude than the corresponding IV estimates. Our explanation for the differencebetween OLS and IV is the negative selection bias. For example, if people with higher unobservedincome are more likely to become VK users, but are less likely to participate in protests, this wouldlead to a downward bias in the OLS estimates of the impact of VK penetration on protest partici-pation.
Next, we examine the effect of VK penetration on the number of protest participants. Accordingto these estimates, a 10% increase in the number of VK users leads to a 19% increase in the numberof protesters. Although this effect appears to be large in relative terms, it is important to have inmind that, while VK users constituted a reasonably large share of city population (the averageVK penetration in 2011 was 15 percent), protest participants in absolute terms formed only a tinyfraction of the population. Our data suggests that for the cities with protests only 0.4% of the citypopulation participated in protests. As the average city size in our sample was 117 thousand (see
49In a first comprehensive overview of the best practices of dealing with weak instruments in the presence of het-eroscedasticity, Andrews et al. (2018) analyzed 230 specifications from publications in the American Economic Review(AER) in 2014-2018 and document that, in contrast to specifications with the effective F-statistics below 10, overrejec-tion problem is not present for the cases with the effective F-statistics above 10. Specifically, the behavior of t-statisticsin simulations with these specifications is very similar to the one under the conventional strong-instrument assumptions.
50These intervals are calculated as Anderson-Rubin intervals using an implementation by Finlay et al. (2009). Forthe intervals calculated using other methods, such as Mikusheva et al. (2006) and Chernozhukov and Hansen (2008),see Table A8 in the Online Appendix. The results are nearly identical across these methods.
26

Table A1 in the Online Appendix), the aforementioned counterfactual of a 10% increase in VKpenetration implies that an increase in the number of VK users by 1,000 leads to an increase in thenumber of protestors by approximately 50.
The results, presented in Table 3, assume a linear relationship between the number of VKusers and political protests. To examine this association non-parametrically, we estimate a locallyweighted regression between VK penetration and the number of protest participants. The downsideof this approach is that it does not account for the endogeneity of VK penetration and does not takeinto account control variables. However, it provides some intuition on the functional form of therelationship. These results are presented in Figure 3. The figure indicates that there is a thresholdlevel of VK penetration, below which there is no relation between VK penetration and protests. Inother words, the effect of VK penetration on protest participation is observed only after this tippingpoint. The graph looks similar if we take both VK penetration and the number of protesters as ashare of city population (see Figure A5 in the Online Appendix). Note, however, that, consistentwith our model, there is no threshold-type dependency between pro-government voting and socialmedia penetration (see Figure A6 in the Online Appendix).
We can also confirm the existence of a threshold level of VK penetration by estimating a non-linear threshold model in which we allow the coefficient for the effect of VK penetration on protestactivity to change at some point.51 The results of this estimation indicate that indeed, there is athreshold level of VK penetration, below which there is no significant relationship between VKpenetration and protest activity and above which there is a strong positive relationship (see Ta-ble A9 in the Online Appendix). The threshold is between 23,000 and 30,000 users or 23-25% as ashare of the city population.
These results are consistent with Prediction 4 of our model, as well as with the predictions ofthe threshold models of collective action (e.g., Granovetter, 1978; Lohmann, 1993, 1994).
6.2 VK Penetration and Pro-Governmental Support
We test whether an increase in VK penetration led to a change in electoral support for pro-governmental candidates in the elections that took place after the creation of VK.52 Table 4 presents
51Note that, in these specifications, we cannot account for the endogeneity of VK penetration as we do not have anadditional instrument for the threshold. Since for protest participation the results of OLS regressions are attenuated tozero compared to IV results (see Table 3) these results are still likely to be indicative of the true effect. However, forthe effect on government support, this approach is not likely to work, since OLS results have a different sign comparedto IV results.
52One may think that our setting is appropriate for mediation analysis, as dislike of the regime is a prerequisite ofprotest participation. Unfortunately, we cannot implement it in our setting. From Dippel et al. (2017), it follows thatthe general mediation IV model is not identified unless one has a separate instrument for the mediator variable whichwe do not have. In addition, Dippel et al. (2017) suggest a set of new assumptions about unobservables such that, ifthey are true, one can separately evaluate the effect of treatment T on outcome Y through and apart from the mediationvariable M. In particular, one could assume that the unobservables that confound the relationship between M (in this
27

the results of the estimation of equation (5) with electoral support for pro-government parties andcandidates after 2006 as the outcome variables. In particular, we look at the share of votes receivedby the government party United Russia in the parliamentary elections of 2007, 2011, and 2016,as well as the share of votes received by Dmitry Medvedev in the presidential elections of 2008and by Vladimir Putin in 2012. The results show that higher VK penetration consistently led tohigher, not lower, electoral support for the government. This effect is not statistically significantfor 2007, but is positive and significant for the remaining four elections. Interestingly, OLS resultsfor the 2007 and 2011 elections show a statistically significant negative relationship between VKpenetration and electoral support for pro-governmental candidates, suggesting that people who aremore likely to join VK are less likely to support the government, but that this relationship is drivenby endogenous self-selection.
One possible explanation for the positive causal effect of VK penetration on electoral supportfor pro-governmental candidates is that, on average, there was more pro-governmental than opposi-tional content in the network, so that higher VK penetration actually decreased the share of peoplewho support the opposition.53 At the same time, reduction in the costs of collective action asso-ciated with higher VK penetration increased the probability that people supporting the oppositionwould go protest, and that the latter effect outweighed the former. An alternative explanation isthat the availability of VK increased political polarization, so that it increased both the number ofpro-government supporters and the number of people strongly opposed to the government.54 It isalso possible that the official electoral results were contaminated by electoral fraud and did not re-flect the actual preferences of the population, although the results in Table 4 could be explained byelectoral fraud only if higher VK penetration was associated with greater extent of electoral fraud,which does not sound plausible.
To address these potential alternative explanations, we complement our analysis of electoraloutcomes with the analysis of a large-scale opinion poll conducted right before the 2011 parlia-mentary elections. Respondents were asked about their support of President Dmitry Medvedev,
case, voting outcomes) and T (social media penetration) can affect Y (protest participation) only through M and T (seeTable 1 on Dippel et al., 2017, p.2, for illustration). We believe that, unfortunately, these assumptions are too strongfor our case. It is very hard to imagine that unobservables affecting voting preferences would not also have an impacton protest participation.
53Note that content analysis of posts on VK before 2011 elections confirms this conjecture, as it suggest that Putin,Medvedev, and the ruling party were mentioned much more often in blog posts than the opposition candidates (seeFigure A7 in the Online Appendix). According to the standard content analysis measures, most of these posts wereneutral, with the majority of posts being jokes and funny stories, sometimes even poems about the ruling candidates(see Figure A8 in the Online Appendix). Very few posts were negative towards the government. Overall, our contentanalysis suggest that, at least on average, information in social media preceding the elections was either neutral or evenpositive towards the regime.
54Note that this alternative explanation goes against the absence of a causal impact of social media on turnout (seeTable A10 in the Online Appendix), which also indicates that the results are unlikely to be driven by increased civicparticipation.
28

Prime Minister Vladimir Putin, and of the government in general on a 6-point scale. They werealso asked about their voting intentions in the upcoming parliamentary elections and about theirreadiness to participate in a hypothetical protest demonstrations.
The IV estimates for the effect of social media on the results of this poll are presented in Table5. They turn out to be fully consistent with the effects on voting outcomes identified in Table 4.Respondents in cities with a higher VK penetration were more likely to give the highest supportto Medvedev, Putin, and the government in general. They were also more likely to report theirintentions to vote for the pro-governmental party United Russia in the upcoming elections. Wefind no evidence of a polarizing effect of social media as there was no increase in the number ofrespondents with the lowest support for the President, Prime Minister, and the government as awhole.
Importantly, higher VK penetration led to a lower number of respondents who reported theirreadiness to participate in protests (the effect is significant at a 10% level).55 Thus, right before theactual protests took place, the penetration of VK had a negative effect on the number of potentialparticipants in the protest. These results suggest that the reduction in the cost of collection action isthe primary channel through which social media affects political protests, despite the fact that theinformation mechanism is pulling in the opposite direction.56
Overall, the results in Tables 4 and 5 indicate that, surprisingly, social media led to more favor-able attitudes towards the regime. This result stands contrary to the claims that social media dif-fusion with free exchange of information would erode the support for autocratic regimes (Shirky,2008). Also, these results do not support the hypothesis that social media increases political polar-ization, contrary to the predictions that echo chambers and filter bubbles lead to a divergence in thepolitical preferences of the population (Sunstein, 2018). Thus, our findings are consistent with theindirect evidence for a lack of internet-driven polarization reported in Boxell et al. (2017). Finally,these results suggest that the collective action channel is likely the primary mechanism throughwhich social media affected protest participation in the context of our study. We provide furthersupport for this claim in Section 6.4.
55This result is supported by the negative effect of VK penetration on the share of invalid ballots in 2011 and 2012elections (see Table A10 in the Online Appendix). At the time of these elections, submitting invalid ballots was acommon strategy of voicing discontent towards the government, and was promoted by a number of opposition leaders.
56It is possible, however, that only the information about the electoral fraud that appeared after the elections matteredfor protest participation, so that the direction of the information effect changed its sign in a matter of days. This is notfully consistent with the nature of the protest, as the protesters were making general political claims that were notlimited to the issues of electoral fraud (Greene, 2014). Moreover, the effect on pro-government vote share remainspositive even for 2016 legislative elections, after the protests took place.
29

6.3 Identifying assumptions checks
6.3.1 Placebo Results for Earlier Protests
Table 6 presents the results of the placebo regressions in which we estimate the same IV spec-ifications as in columns (1)-(4) of Table 3, but with the measures of pre-VK protests as dependentvariables. Specifically, we look at the protests that occurred in the late Soviet Union in 1987-1992 (both total and pro-democracy as a separate category), labor protests in 1997-2002, and socialprotests in 2005. The results indicate that there is no significant ‘causal’ effect of VK penetration in2011 on any of the placebo outcomes. Moreover, the sign of the relationship between VK penetra-tion and protests in post-Soviet Russia is negative in all specifications. These results are consistentwith the assumption that there is no time-invariant unobserved taste-for-protest heterogeneity thatis driving our results. Unfortunately, we cannot reject the hypothesis for the equality of the IVcoefficients for the protests of December 2011 and the pre-VK protests for the results in Panel Bof Table 6 because of large standard errors. However, in Panel A, we can reject the hypothesis forthe equality of the IV coefficients for the protests in December 2011 and similar coefficients forpro-democracy protests in 1987-1992 and the labor protests in 1997-2002.
6.3.2 Placebo Results for Earlier Electoral Outcomes
To ensure that our results for political preferences in Section 6.2 are not driven by unobservedheterogeneity, we replicate the results in Table 4 using various pre-VK electoral outcomes as de-pendent variables. These voting outcomes capture pre-existing political preferences, and the resultsin Table 3 suggest that they are collectively important for predicting the protest activity of 2011.Table 7 summarizes the results of the placebo tests. Each cell in this table represents the coefficientfor VK penetration in an IV regression similar to that in column (1) of Table 4, but with variousvoting outcomes as dependent variables. The specifics of each voting outcome are outlined in thetitle of each column, while the election year is being reported in the row name. Overall, we findthat, out of the 39 corresponding regression coefficients, only one is statistically significant at the5% level and five are significant at the 10% level. These numbers are very close to what couldhave been attributed to pure chance in multiple hypotheses testing and they largely support ourargument. To further ensure that our results are not driven by pre-existing political preferences, weinclude voting outcomes as controls for each set of results in the paper (e.g., see columns (2)-(4) ofTable 4).
30

6.3.3 Placebo Results for Other Universities
We use the distribution of home cities for three different cohorts of the SPbSU students to over-come the problem of unobserved heterogeneity between cities. Nevertheless, it is still possible thatthe cohort that studied during the same years as Durov happened to be an unusual cohort, and thatthese people, for some reason, had a higher commitment to education, a higher demand for socialmedia, and a higher propensity to protest at the same time. To cope with this possibility, we col-lect data on 64 other Russian universities of comparable quality.57 Next, we replicate our baselinefirst-stage regression for each of these 64 universities. We then compare the resulting coefficientswith those of the corresponding SPbSU cohorts. Figures 4A-C show the empirical cumulative dis-tribution functions of the coefficients for Durov’s cohort (Figure 4A), the older cohort (Figure 4B),and the younger cohort (Figure 4C).58 We highlight other universities in Saint Petersburg as theycould have experienced spillovers because of their proximity to SPbSU, i.e., their students couldalso have been more likely to join VK earlier.
Figure 4A indicates that the coefficient for Durov’s cohort at SPbSU lies at the top end of thedistribution and, out of four universities with higher coefficients, two are located in Saint Peters-burg. At the same time, the coefficients for the younger and older cohorts at SPbSU lie close to themedians of the corresponding distributions in Figures 4B and 4C. Thus, the results in Figures 4A-Cindicate that, out of all the cohorts in SPbSU, only Durov’s cohort looks special for the predictionof VK penetration in 2011, relative to those in other Russian universities of similar quality. This isconsistent with the idea that students from the cohort of the VK founder in Saint Petersburg StateUniversity played a special role in the subsequent penetration of the network.
6.3.4 Student Data and Odnoklassniki
One potential concern with our approach is that we do not have administrative records on stu-dent cohorts and instead rely on the information from the profiles of Odnoklassniki users to infer thenumber of students in each university at each point in time. As was noted in Section 3, this concernis partially mitigated by the fact that 80% of adults in Russia had an account in Odnoklassniki at thetime our data collection took place. This proportion was probably even higher for younger cohorts,which further improves the representativeness of our data. Additionally, in order to correct for apossible measurement error bias due to the non-random variation in Odnoklassniki penetration, wecontrol for the number of Odnoklassniki users in each city in all of our specifications. Finally, it isimportant to note that the Odnoklassniki platform had no specific relationship either to this partic-ular age cohort, to SPbSU, or to Saint Petersburg — the founder of Odnoklassniki, Albert Popkov,
57See Section 3 for a discussion of how these universities were selected.58Figure A9 in the Online Appendix provides the corresponding graphs for the reduced form regressions.
31

was born in Yuzno-Sakhalinsk on Sakhalin island, studied in Moscow in a technical college in theearly 90’s, and founded the network while living in London.
Despite these details, a concern may remain that people could be more likely to have an Odnok-lassniki account in cities with higher VK penetration, and potentially even more likely in placeswith a greater number of SPbSU students in Durov’s cohort. To deal with this concern, we conducttwo additional tests. First, we check whether the number of Odnoklassniki users is correlated withthe number of VK users in a city at different stages of VK diffusion. The results in Columns (1)-(3)of Table A11 in the Online Appendix indicate that early VK penetration (the number of users ina city among the first 5,000, 50,000, or 100,000 users of the network) is negatively, though notsignificantly, related to the subsequent penetration of Odnoklassniki. This is consistent with thehypotheses that the initial diffusion of VK was not driven by general preferences for social mediaand that there might have been a substitution effect between different social networks. VK pene-tration in 2011 is, however, positively related to Odnoklassniki penetration at the time of the datacollection in 2014, although this effect is not statistically significant either (see column (4)), whichweakly suggests that, in the long run, penetration of different social networks may be driven by thesame fundamentals.
Second, we test whether Odnoklassniki penetration was related to the student flows from Rus-sian cities to Saint Petersburg State University. The results in columns (5)-(8) indicate that there isno such association, with the standard errors being substantially larger than the coefficients for theVK founder’s cohort in all specifications. We conclude that the potential selection introduced byour data collection process is unlikely to bias our results.
6.3.5 Measurement Error in Protest Data
Another potential concern with our data collection is that the measures of protests, which werecalculated based on media reports, could contain a measurement error that is correlated with VKpenetration. It might have been the case that political protests were less likely to be covered by massmedia, if they had not been discussed in social media in the first place. This concern is likely to bemore relevant for smaller cities as the probability of a non-reporting error should be substantiallysmaller for bigger cities. However, as documented in Section 6.4.2 below, the IV coefficients forthe effect of VK penetration on both the incidence of protests and the number of participants tendto increase with city size. Thus, our results are unlikely to be driven by selective media reportingof protests in small cities.
32

6.4 Additional Evidence on Mechanisms
6.4.1 Protest Participation and Online Protest Communities
Before proceeding with the analysis, we provide suggestive evidence that VK was indeed usedby protest participants to coordinate their activities. Our descriptive measures suggest that 87 outof 133 cities with protest activity had public VK communities directly related to the correspondingprotest events. These communities were accessible to all VK users and were used for informingand coordinating offline protests. To provide evidence that availability of such communities wassystematically related to offline protests, Table A12 shows that the number of VK users in protestcommunities was positively associated with incidence of offline protests. In particular, a 10%increase in the number of people in VK protest communities was associated with a 3% increasein the probability of having a protest demonstration in a city (columns 1-4). Similarly, a 10%increase in the number of people in protest communities was associated with a 1.2% increase in thenumber of protest participants (columns 5-8). Overall, these results provide suggestive evidencethat coordinating activity in VK protest communities was associated with the spread of offlineprotests. These results, however, should be interpreted with caution since they do not have a causalinterpretation and do not take into account the fact that protest communities represent only one ofthe channels through which VK could affect protest participation.
6.4.2 Effect of City Size
According to Prediction 3 in our theoretical framework, it may be possible to disentangle theinformation and coordination channels by looking at how the effect of social media changes withcity size. Specifically, if social media increases protest participation primarily by making coordi-nation easier, one would expect the effect of social media to increase with city size, as the marginalvalue of information from social media on protest tactics is higher in larger cities. Also, the effectcaused by the information channel is not expected to be stronger in bigger cities, so that the impactof social media on voting in favor of the regime should not increase with city size.
Figure 5 presents evidence supporting this prediction. Specifically, it shows that the IV coef-ficients for the effect of VK penetration on both the incidence of protests and the number of par-ticipants tend to increase when we restrict our sample to larger and larger cities. The coefficientsremain largely significant despite a substantial increase in standard errors caused by a reduction insample size. In particular, the IV coefficients for the incidence of protests increases from 0.47 to1.08 and remains significant at the 5% level when we restrict the sample to the cities with above150,000 people.
At the same time, the effect of social media on the vote share of United Russian in 2011 and ofPutin in 2012 remains stable with city size and, if anything, decrease in magnitude (see Figure 6).
33

This further supports the idea that the information channel is unlikely to be responsible for the pos-itive impact of social media on protest participation and that the effect is driven by the coordinationchannel.59
6.4.3 Fractionalization
To provide further evidence on the mechanisms behind the effect of social media on protestparticipation, we take advantage of the fact that Facebook was a close competitor of VK and wasalso used in protest activities. We look at the distribution of social media users between the twonetworks.60 In particular, we compute a fractionalization index, i.e., the probability that two ran-domly picked users of online social media in a city belong to the same network. In the simplestcase of non-overlapping audiences for the two networks, it can be computed as fracti = 1−∑ j si j
2 ,where si j is the share of users in network j in city i among all the users of online social networks incity i. Since we do not have information on the overlap in the audiences of the two social networkswe compute fractionalization using this simplified formula and check that our results are robust toa change in the fractionalization index that allows for partial overlap between users from differentnetworks.61
We examine how the fractionalization of social media users between the two platforms affectedprotest activity, conditional on the total number of social media users in any of the two networks.In particular, we estimate the following specification:62
log(protesters)i = β0 +β1fracti +β2 log(total users)i +β3Xi + εit (15)
The information effect depends on the total number of users in both networks and not on theirsorting into the two networks, since information critical of the government was available on bothplatforms. Thus, if the effect of social media operates through the information channel, this impliesa zero coefficient for fractionalization. The mechanisms associated with a decrease in the costsof collective actions, however, implies that the coefficient for fractionalization is negative, sinceboth coordination and social pressure work within the same network (regardless of which one).
59Our approach allows us to check heterogeneity of the results with respect to the other city characteristics, not onlycity size. Table A15 reports our baseline IV results for various subsamples. We find that the effect comes mostly fromthe cities with higher incomes (columns 1-2), and with higher levels of interpersonal trust (columns 3-4). There is alsoevidence that the effect is observed mostly from the cities with more educated people, but this result is not statisticallysignificant (columns 5-6). Note, however, that these results should be interpreted with caution — as we split the sample,the instrument becomes weaker, with a decreased effective F-statistics, which could lead to an overrejection problem(Andrews et al., 2018).
60In contrast to VK and Facebook, Odnoklassniki was not actively employed in the protest movement (Reuter andSzakonyi, 2015), so we do not include it in the analysis.
61See the derivations in the Section A.2 of the Online Appendix and the results in Table A13 in the Online Appendix.62Note that we are forced to use OLS for this specification, as we do not have a good instrument for fractionalization.
34

Thus, the more divided the users are between the networks, the harder it is for the collective actionchannel to operate.
Table 8 displays the results of the estimation of equation (15). These estimates imply thatfractionalization is negatively associated with both protest participation and the incidence of theprotests. Consistent with the Prediction 3 in our theoretical framework, the negative effect of socialmedia fractionalization on protest participation increases in magnitude with city size, so that thenegative effect is statistically significant only for large cities, e.g., for a subsample of cities with apopulation over 100,000 (see Figure A10 in the Online Appendix for full information on how theeffect depends on city size). Both of these patterns point towards the importance of the coordinationfunction of social media in its effect on protest participation.
The results presented in column (5) of Table 8 indicate that, in larger cities, a one standarddeviation increase in network fractionalization is associated with 48% lower protest participationand a 9.8 percentage points lower probability of protests occurring.63
Overall, these findings are consistent with the hypothesis that social media penetration affectsprotest participation primarily by reducing the costs of collective action and improving coordina-tion. The finding that the effect of fractionalization is driven by the cities with populations above100,000 suggests that in smaller cities other means of interpersonal communication may play agreater role in protest coordination.
6.5 Other Outcomes and Robustness Checks
6.5.1 Policy Outcomes
If social media penetration affects protest participation, this, in turn, can influence policy out-comes. In the context of the Russian political protests of 2011-2012, protesters’ demands weredirected primarily at national-level policies and appealed mainly to the federal government, whichmeans that we do not necessarily expect to see any variation in policy outcomes at the city level.Nevertheless, in an attempt to assess whether any changes in local policy were caused by protestactivity, we looked at the impact of VK penetration on municipal revenues and spending before andafter the protests.64
63One may be concerned that, even controlling for the total number of VK and FB users, higher fractionalizationmay be negatively associated with protest participation only due to a lower relative VK prevalence. To assuage thisconcern, instead of controlling for the total number of VK and Facebook users, we condition on the number of VKand Facebook users separately and provide the corresponding estimates in Table A14 in the Online Appendix. If ourfractionalization index matters only so far as it reflects a lower prevalence of VK, it would make the coefficient on thefractionalization index insignificant in such specification. However, as one can see from Table A14, our results remainrobust to this exercise.
64Note, however, that the municipal data collection in Russia is not consistently implemented, which results in alarge number of missing values.
35

Table 9 presents the corresponding results. In all specifications, we control for the 2008 valuesof the dependent variables, thus effectively focusing on the changes in the policy outcomes asopposed to their levels. Moreover, we condition on the 2007-2008 election results as they mayinfluence the allocation of resources. Panel A tests how federal transfers to municipalities overdifferent years depend on the level of VK penetration. We find that higher VK penetration does nottranslate into any significant changes in transfers before 2012, but it leads to a decrease in federaltransfers in the years of 2012-2014. The magnitudes of these effects are fairly large, with a 10%increase in VK penetration leading to a 31% reduction in federal transfers in 2014. A potentialexplanation for this effect is that the national government punished cities for allowing protests totake place.
Panel B of Table 9 looks at a similar specification with the municipality tax revenue as anoutcome variable. We find that VK penetration has a negative effect on municipal tax revenues in2012-2014, but it becomes statistically significant only in 2014. One potential explanation for thisresult is that a consistent lack of transfers in previous years had reduced the tax collection capacityof the municipalities. Finally, Panel C of Table 9 checks whether a similar pattern holds for totalmunicipal spending. Although the coefficients for VK penetration are consistently negative withrelatively large magnitudes after 2011, they are not statistically significant. Thus, we do not findenough evidence that VK penetration led to lower municipal spending after 2011.
These results are consistent with the existing anecdotal evidence that federal and regional gov-ernment often use municipal transfers as a political tool. A few months prior to the 2011 Parlia-mentary elections, several government officials were spotted arguing that their cities’ municipalfinances would be cut if United Russia did not receive a sufficient number of votes.65 Furthermore,an independent mayor of Yaroslavl, Yevgeny Urlashov, after winning the 2012 elections againsta United Russia candidate, faced a lack of regional funding for teacher wages. In this context, itwould not be entirely surprising if cities indeed received less transfers from the federal governmentas a result of political protests.
A serious limitation of these results, however, is that they do not distinguish between the effectof political protests caused by higher VK penetration and the effect of other channels through whichVK penetration could affect policy outcomes. A potential way to identify the effect of politicalprotests would be to use weather shocks as an instrument for protest participation (as in Madestamet al., 2013). Unfortunately, despite using all the available weather information we were not able tofind a specification with a sufficiently high predictive power in the first-stage regression even using
65“Sarapul received 30 mln on roads and sidewalks this summer. Glazov received only 10 mln. We ourselves,Glazov residents, refused these extra 20 mln in the previous elections. (You) refused the good roads you could havebeen driving on. [. . . ] Because United Russia oversees many various projects across the country. And they determinehow to work with each city.” – said the head of the presidential and government administration of Udmurtia AlexanderGoriyanov on 5 Nov 2011 (http://bit.ly/2ofpOKa).
36

sophisticated machine learning techniques.Overall, the results in Table 9 indicate that higher VK penetration led to lower federal transfers
to municipal budgets starting from 2012, the first year after the onset of the protests, which suggeststhat the national government punished cities for allowing the protests to occur.
6.5.2 Additional Robustness Checks
We perform several additional robustness checks to ensure that our results are not driven by ourchoice of specification. We check that our results are robust to using cohorts of other sizes andshapes instead of 5-year cohorts defined symmetrically around Durov’s age (see Table A16 in theOnline Appendix for these robustness results).66 Note that, independent of the width of the cohortwindow, the main IV coefficient for protest participation is very stable and statistically significantacross the board. Moreover, although we did not select our baseline specification (in bold) this wayon purpose, it happens to maximize the effective F-statistics and, as such, maximizes the power ofour first stage in a set of similar specifications. Our results are also robust to including two olderand two younger cohorts instead of one each. In our benchmark specification, we chose to keeponly one younger and one older cohorts, as our source of data for students is more complete forthose cohorts. The results are also robust to using the years of study instead of the year of birth tocompute different cohorts.67
7 Conclusion
This paper provides evidence that social media penetration had a causal effect on both theincidence and the size of the protest demonstrations in Russia in December 2011. At the sametime, social media increased support of the government. Additional evidence suggests that socialmedia affects protest activity by reducing the costs of collective action, rather than by spreadinginformation critical of the government or by increasing political polarization. Thus, our resultsimply that social media can increase the ability of people to overcome the collective action problem.
66We believe that creating Durov’s exact cohort is not an optimal approach of constructing an instrument, since,although offline connections within the same cohort mattered, VK was also extensively advertised on the SPbSUonline forum, which influenced other cohorts of SPbSU students as well. Therefore, the first users were not only VKfounder’s classmates but also all other students who were studying at SPbSU at the time. However, in the resultsavailable upon request, we show that, when 1-year cohorts are used, the results become noisier but still point in thesame direction.
67See Table A17 in the Online Appendix for the baseline results calculated for cohorts defined based on the years ofstudy. Note that more people don’t report their years of study on Odnoklassniki than their year of birth. Specifically,out of 22,500 people we use for construction of our instrument based on the year of birth, 3,700 (16.4%) did not reporttheir starting year of education and 4,700 (20.8%) did not report year of graduation. Thus, when we construct ourcohorts based on the starting year or graduation year, we lose student observations and increase the number of citieswith zero students sent to SPbSU in different cohorts.
37

Our results should be generalized with caution. First, the Russian protests of 2011-2012 wereunexpected and the government did not have time to prepare for them. If the threat of collective ac-tion is stable over time, governments may use various strategies to counteract social media activism(King et al., 2013, 2014). Second, as our theoretical framework highlights, while social media isexpected to lower the costs of coordination, the information effects of social media could go eitherway, depending on whether the content of social media is, on average, positive to the government.Overwhelmingly critical content can influence political participation by diminishing support for thegovernment and promoting protests at the same time.
We believe that our methodology can be used for studying the impact of social media penetra-tion on other forms of collective action. For example, consumers who would like to lower tariffs ordiscipline companies’ misbehavior through boycotts, also face the same collective action problem.Similarly, collective action is important for the fundraising campaigns of charitable or educationalinstitutions, or for environmental activism. We expect social media to reduce the costs of collec-tive action in all of these circumstances; at least as long as social norms imply that participationin collective action is desirable. More generally, our identification approach, which relies on so-cial distance from the inventor to instrument for the spread of the new technology, is likely to beapplicable to studying the impact of technology adoption in other settings, and can complementidentification strategies based on physical distance (e.g., Dittmar, 2011; Cantoni and Yuchtman,2014). In sum, our paper is an early step in studying how social media can change societies. Moreresearch is needed to understand whether similar results hold for other outcomes and in other con-texts.
References
ACEMOGLU, D., T. A. HASSAN, AND A. TAHOUN (2017): “The power of the street: Evidencefrom Egypt’s Arab Spring,” The Review of Financial Studies, 31, 1–42.
ADAY, S., H. FARRELL, M. LYNCH, J. SIDES, AND D. FREELON (2012): “Blogs and Bullets II:New Media and Conflict after the Arab Spring,” United States Institute of Peace.
ADAY, S., H. FARRELL, M. LYNCH, J. SIDES, J. KELLY, AND E. ZUCKERMAN (2010): “Blogsand Bullets: New Media in Contentious Politics,” United States Institute of Peace.
ADENA, M., R. ENIKOLOPOV, M. PETROVA, V. SANTAROSA, AND E. ZHURAVSKAYA (2015):“Radio and the Rise of Nazis in pre-War Germany,” Quarterly Journal of Economics, 130, 1885–1939.
38

AIDT, T. AND R. FRANCK (2015): “Democratization Under the Threat of Revolution: Evidencefrom the Great Reform Act of 1832,” Econometrica, 83, 505–547.
ALTONJI, J., C. TABER, AND T. ELDER (2005): “Selection on Observed and Unobserved Vari-ables: Assessing the Effectiveness of Catholic Schools,,” Journal of Political Economy, 113,151–184.
ANDREWS, I., J. STOCK, AND L. SUN (2018): “Weak Instruments in IV Regression: Theory andPractice,” .
ANDRIENKO, Y. AND S. GURIEV (2004): “Determinants of interregional mobility in Russia,”Economics of transition, 12, 1–27.
BARBERA, S. AND M. JACKSON (2016): “A Model of Protests, Revolution, and Information,”Working Paper.
BATTAGLINI, M. (2017): “Public Protests and Policy Making,” The Quarterly Journal of Eco-
nomics, 132, 485–549.
BEISSINGER, M. (2002): Nationalist Mobilization and the Collapse of the Soviet State, CambridgeUniversity Press.
BHULLER, M., T. HAVNES, E. LEUVEN, AND M. MOGSTAD (2013): “Broadband Internet: AnInformation Superhighway to Sex Crime?” Review of Economic Studies, 80, 1237–1266.
BOND, R. M., C. J. FARISS, J. J. JONES, A. D. KRAMER, C. MARLOW, J. E. SETTLE, AND
J. H. FOWLER (2012): “A 61-million-person Experiment in Social Influence and Political Mo-bilization,” Nature, 489, 295–298.
BOXELL, L., M. GENTZKOW, AND J. M. SHAPIRO (2017): “Greater Internet use is not associatedwith faster growth in political polarization among US demographic groups,” Proceedings of the
National Academy of Sciences, 201706588.
CAMPANTE, F., R. DURANTE, AND F. SOBBRIO (2017): “Politics 2.0: The multifaceted effect ofbroadband internet on political participation,” Journal of the European Economic Association,16, 1094–1136.
CANTONI, D., D. Y. YANG, N. YUCHTMAN, AND Y. J. ZHANG (2017): “Are Protests Games ofStrategic Complements or Substitutes? Experimental Evidence from Hong Kong’s DemocracyMovement,” Tech. rep., National Bureau of Economic Research.
39

CANTONI, D. AND N. YUCHTMAN (2014): “Medieval Universities, Legal Institutions, and theCommercial Revolution,” Quarterly Journal of Economics, 129, 823–887.
CHERNOZHUKOV, V. AND C. HANSEN (2008): “The reduced form: A simple approach to infer-ence with weak instruments,” Economics Letters, 100, 68–71.
CHIANG, C.-F. AND B. KNIGHT (2011): “Media Bias and Influence: Evidence from NewspaperEndorsements,” Review of Economic Studies, 78, 795–820.
CZERNICH, N., O. FALCK, T. KRETSCHMER, AND L. WOESSMANN (2011): “Broadband Infras-tructure and Economic Growth,” The Economic Journal, 121, 505–532.
DE MESQUITA, E. B. (2010): “Regime change and revolutionary entrepreneurs,” American Polit-
ical Science Review, 104, 446–466.
DELLAVIGNA, S., R. ENIKOLOPOV, V. MIRONOVA, M. PETROVA, AND E. ZHURAVSKAYA
(2014): “Cross-Border Effects of Foreign Media: Serbian Radio and Nationalism In Croatia,”American Economic Journal: Applied Economics, 6, 103–132.
DELLAVIGNA, S. AND E. KAPLAN (2007): “The Fox News Effect: Media Bias and Voting,”Quarterly Journal of Economics, 122, 807–860.
DIPPEL, C., R. GOLD, S. HEBLICH, AND R. PINTO (2017): “Instrumental Variables and CausalMechanisms: Unpacking The Effect of Trade on Workers and Voters,” Working Paper 23209,National Bureau of Economic Research.
DITTMAR, J. (2011): “Information Technology and Economic Change: The Impact of the PrintingPress,” Quarterly Journal of Economics, 126, 1133–1172.
DOKUKA, S. V. (2014): “Practices of Using On-line Social Networks,,” Sociological Studies, 1,137–145.
EDMOND, C. (2013): “Information Manipulation, Coordination, and Regime Change,” Review of
Economic Studies, 80, 1422–1458.
EISENSEE, T. AND D. STROMBERG (2007): “News Droughts, News Floods, and U.S. DisasterRelief,” The Quarterly Journal of Economics, 122, 693–728.
ENIKOLOPOV, R., V. KOROVKIN, M. PETROVA, K. SONIN, AND A. A. ZAKHAROV (2013):“Field Experiment Estimate of Electoral Fraud in Russian Parliamentary Elections,” Proceedings
of the National Academy of Sciences, 110, 448–452.
40

ENIKOLOPOV, R., A. MAKARIN, M. PETROVA, AND L. POLISHCHUK (2017): “Social Image,Networks, and Protest Participation,” Working Paper.
ENIKOLOPOV, R., M. PETROVA, AND K. SONIN (2018): “Social media and corruption,” Ameri-
can Economic Journal: Applied Economics, 10, 150–74.
ENIKOLOPOV, R., M. PETROVA, AND E. ZHURAVSKAYA (2011): “Media and Political Persua-sion: Evidence from Russia,” American Economic Review, 101, 3253–3285.
ESFANDIARI, G. (2010): “The Twitter Devolution,” Foreign Policy.
FALCK, O., R. GOLD, AND S. HEBLICH (2014): “E-Lections: Voting Behavior and the Internet,”American Economic Review, 104, 2238–2265.
FINLAY, K., L. M. MAGNUSSON, ET AL. (2009): “Implementing weak-instrument robust testsfor a general class of instrumental-variables models,” Stata Journal, 9, 398.
GAVAZZA, A., M. NARDOTTO, AND T. VALLETTI (2015): “Internet and Politics: Evidence fromUK Local Elections and Local Government Policies,” Working Paper.
GENTZKOW, M., N. PETEK, J. SHAPIRO, AND M. SINKINSON (2015a): “Do Newspapers Servethe State? Incumbent Party Influence on the US Press, 1869–1928,” Journal of the European
Economic Association, 13, 29–61.
GENTZKOW, M. AND J. SHAPIRO (2011): “Ideological Segregation Online and Offline,” Quarterly
Journal of Economics, 126, 1799–1839.
GENTZKOW, M., J. SHAPIRO, AND M. SINKINSON (2011): “The Effect of Newspaper Entry andExit on Electoral Politics,,” American Economic Review, 101, 2980–3018.
GENTZKOW, M., J. SHAPIRO, AND M. TADDY (2015b): “Measuring Polarization in High-dimensional Data: Method and Application to Congressional Speech,” Working Paper.
GLADWELL, M. (2010): “Small change,” The New Yorker, 4, 42–49.
GRANOVETTER, M. (1978): “Threshold Models of Collective Behavior,” American Journal of
Sociology, 1420–1443.
GREENE, S. (2014): Moscow in Movement: Power and Opposition in Putin’s Russia, StanfordUniversity Press.
GURIEV, S. AND E. VAKULENKO (2015): “Breaking out of poverty traps: Internal migration andinterregional convergence in Russia,” Journal of Comparative Economics, 43, 633–649.
41

HALBERSTAM, Y. AND B. KNIGHT (2016): “Homophily, group size, and the diffusion of politicalinformation in social networks: Evidence from Twitter,” Journal of Public Economics, 143, 73– 88.
HARDIN, R. (1982): Collective Action, Johns Hopkins University Press.
HASSANPOUR, N. (2014): “Media Disruption and Revolutionary Unrest: Evidence FromMubarak’s Quasi-Experiment,” Political Communication, 31, 1–24.
HENDEL, I., S. LACH, AND Y. SPIEGEL (2017): “Consumers’ activism: the cottage cheese boy-cott,” The RAND Journal of Economics, 48, 972–1003.
JENSEN, R. (2007): “The digital provide: Information (technology), market performance, andwelfare in the South Indian fisheries sector,” The Quarterly Journal of Economics, 122, 879–924.
KING, G., J. PAN, AND M. E. ROBERTS (2013): “How Censorship in China Allows GovernmentCriticism but Silences Collective Expression,” American Political Science Review, 107, 326–343.
——— (2014): “Reverse-Engineering Censorship In China: Randomized Experimentation AndParticipant Observation,” Science, 345, 1–10.
KLIMEK, P., Y. YEGOROV, R. HANEL, AND S. THURNER (2012): “Statistical Detection ofSystematic Election Irregularities,” Proceedings of National Academy of Sciences, 109, 16469–16473.
KONIG, M. D., D. ROHNER, M. THOENIG, AND F. ZILIBOTTI (2017): “Networks in conflict:Theory and evidence from the great war of africa,” Econometrica, 85, 1093–1132.
KONONOV, N. (2012): Kod Durova, Mann, Ivanov and Ferber.
KURAN, T. (1991): “Now Out of Never: The Element of Surprise in the East European Revolutionof 1989,” World Politics, 44, 7–48.
LITTLE, A. T. (2016): “Communication technology and protest,” The Journal of Politics, 78, 152–166.
LOHMANN, S. (1993): “A Signaling Model of Informative and Manipulative Political Action,”American Political Science Review, 87, 319–333.
——— (1994): “The Dynamics of Informational Cascades: The Monday Demonstrations inLeipzig, East Germany, 1989–91,” World Politics, 47, 42–101.
42

LYNCH, M. (2011): “After Egypt: The Limits and Promise of Online Challenges to the Authori-tarian Arab State,” Perspectives on Politics, 9, 301–310.
MADESTAM, A., D. SHOAG, S. VEUGER, AND D. YANAGIZAWA-DROTT (2013): “Do PoliticalProtests Matter? Evidence from the Tea Party Movement,” Quarterly Journal of Economics,128, 1633–1685.
MANACORDA, M. AND A. TESEI (2016): “Liberation Technology: Mobile Phones and PoliticalMobilization in Africa,” Working Paper.
MANRIQUE, P., Z. CAO, A. GABRIEL, J. HORGAN, P. GILL, H. QI, E. M. RESTREPO,D. JOHNSON, S. WUCHTY, C. SONG, ET AL. (2016): “Women’s connectivity in extreme net-works,” Science advances, 2, e1501742.
MIKUSHEVA, A., B. P. POI, ET AL. (2006): “Tests and confidence sets with correct size wheninstruments are potentially weak,” Stata Journal, 6, 335–347.
MONTIEL OLEA, J. L. AND C. PFLUEGER (2013): “A Robust Test for Weak Instruments,” Journal
of Business & Economic Statistics, 31, 358–369.
MOROZOV, E. (2011): The Net Delusion: How Not to Liberate the World, Penguin UK.
OLSON, M. (1965): The Logic of Collective Action, Harvard University Press.
OSTER, E. (2016): “Unobservable Selection and Coefficient Stability: Theory and Evidence,”Journal of Business & Economic Statistics.
OSTROM, E. (1990): Governing the Commons: The Evolution of Institutions for Collective Action,Cambridge University Press.
PASSARELLI, F. AND G. TABELLINI (2017): “Emotions and Political Unrest,” Journal of Political
Economy, forthcoming.
PENDERGRAST, M. (2010): Uncommon Grounds: The History of Coffee and How It Transformed
Our World, Basic Books.
PIERSKALLA, J. H. AND F. M. HOLLENBACH (2013): “Technology and collective action: Theeffect of cell phone coverage on political violence in Africa,” American Political Science Review,107, 207–224.
QIN, B. (2013): “Chinese Microblogs and Drug Quality,” Working Paper.
43

QIN, B., D. STROMBERG, AND Y. WU (2017): “Why Does China Allow Freer Social Media?Protests versus Surveillance and Propaganda,” Journal of Economic Perspectives, 31, 117–140.
REUTER, O. J. AND D. SZAKONYI (2015): “Online Social Media and Political Awareness inAuthoritarian Regimes,” British Journal of Political Science, 45, 29–51.
ROBERTSON, G. (2011): The Politics of Protest in Hybrid Regimes, Cambridge University Press.
——— (2015): “Political Orientation, Information and Perceptions of Election Fraud: Evidencefrom Russia,” British Journal of Political Science, 1–20.
SHIRKY, C. (2008): Here Comes Everybody: The Power of Organizing Without Organizations,London, UK: AllenLane: PenguinGroup.
——— (2011): “The political power of social media: Technology, the public sphere, and politicalchange,” Foreign affairs, 28–41.
SNYDER, J. AND D. STROMBERG (2010): “Press Coverage and Political Accountability,” Journal
of Political Economy, 118, 355–408.
STEINERT-THRELKELD, Z., D. MOCANU, A. VESPIGNANI, AND J. FOWLER (2015): “OnlineSocial Networks and Offline Protest,” EPJ Data Science, 4.
STOCK, J. AND M. YOGO (2005): Testing for Weak Instruments in Linear IV Regression, Cam-bridge: Cambridge University Press.
STROMBERG, D. (2004): “Radio’s Impact on Public Spending,” Quarterly Journal of Economics,119, 189–221.
SUNSTEIN, C. R. (2018): # Republic: Divided democracy in the age of social media, PrincetonUniversity Press.
TREISMAN, D. (2011): The Return: Russia’s Journey from Gorbachev to Medvedev, New York:Free Press.
TUFEKCI, Z. AND C. WILSON (2012): “Social Media and the Decision to Participate in PoliticalProtest: Observations from Tahrir Square,” Journal of Communication, 62, 363–379.
YANAGIZAWA-DROTT, D. (2014): “Propaganda and Conflict: Theory and Evidence from theRwandan Genocide,” Quarterly Journal of Economics, 129, 1947–1994.
44

ONLINE APPENDIX
A.1 The Cross Partial Derivative of Protest Participation withRespect to Social Media and Baseline Coordination Signal
The cross partial derivative of the effect of social media on protests via coordination channelwith respect to baseline coordination signal can be obtained by differentiating equation (8) withrespect to the precision of the baseline coordination signal, β0:
∂ 2cp
∂βs∂β0=− 2k
(β0 +βs)3(
1− λpσpc
φ
[1
σpc(cp−µpc)
]) +k2λpφ ′
[1
σpc(cp−µpc)
]σ2 (β0 +βs)
4(
1− λpσpc
φ
[1
σpc(cp−µpc)
])3
We would like to derive the sign of this expression. First, note that, under the assumption thatlambda is small enough to ensure that the denominator in (7)-(9) is positive, — more precisely, ifλ < σpc/φ [(cp−µpc)/σpc]) — the first part of the above expression is negative.
Second, observe that whenever the equilibrium threshold, cp, exceeds the average cost of protestparticipation, µpc, the second part of that expression becomes negative too (since φ ′(x) < 0 whenx > 0). Thus, in this case, the cross partial derivative has a negative sign. However, the conditionthat cp > µpc is fairly restrictive and unlikely to hold in our data, as it means that more than 50%of population decide to take part in a protest.
However, we can show that, even if cp < µpc, the cross partial derivative is negative as long asλp is small enough. To see this, note that, when λp approches zero, the second part of the expressiongoes to zero as well, while the first one survives and remains negative. We search for the conditionon lambda more formally below. Getting rid of common multipliers and using simplified notation,the condition becomes:
kλφ ′
σ2 (β0 +βs)(
1− λ
σφ
)2 −2 < 0
After a few algebraic transformations, one obtains the following inequality:
λ2 [−2(β0 +βs)φ
2]+λ[kφ′+4(β0 +βs)φσ
]−2(β0 +βs)σ
2 < 0
Under the existing restriction on lambda, λ < σ/φ , there remain some values of lambda for whichthe above inequality does not hold. To see this, note that, when inserting λ = σ/φ , the above

expression becomes strictly positive:
−2(β0 +βs)σ2−2(β0 +βs)σ
2 + kσφ ′
φ+4(β0 +βs)σ
2 = kσφ ′
φ> 0
, where φ ′ > 0 comes from the fact that we are considering the case with cp < µpc, and from thefact that φ ′(x)> 0 when x < 0.
Thus, the new condition on lambda is a subset of the existing condition and comes from solvingthe quadratic inequality above. After solving this inequality, one obtains the following condition:
λ <kφ ′+4(β0 +βs)φσ −
√(kφ ′)2 +8(β0 +βs)φφ ′kσ
2(β0 +βs)φ 2 (16)
To conclude, if lambda is small enough, i.e., complies with condition (16), the cross partial deriva-tive of the social media coordination effect on protest participation by precision of the baselinecoordination signal has a negative sign. As a result, our theoretical framework predicts that socialmedia should be more important in places with higher β i
0 where coordination is harder to achievein the absence of public signals, e.g., in larger cities. Thus, if social media increases protest partic-ipation due to coordination channel, one would expect the magnitude of the effect to be increasingwith city size.

A.2 Fractionalization with Arbitrary Overlap
Figure 1: Overlapping groups
In this section, we derive a fractionalization indexformula for the case of overlapping groups. In our par-ticular case, these are VK and Facebook users. Let usdenote the number of VK users as n1, the number ofFacebook users as n2, and their interaction as m (seeFigure 1 for illustration).
The usual fractionalization index measures theprobability that two randomly chosen objects happento be in different groups:
I = 1−n2
1 +n22
(n1 +n2)2
Suppose now that there is a non-zero overlap be-tween the two groups, meaning that mass m now hasaccounts in both VK and Facebook. The probability oftwo randomly chosen people being from distinct social media networks is now equal to the chancethat one person is drawn from n1 but not m and the other one is drawn from n2 but not m:68
I1 =2(n1−m)(n2−m)
(n1 +n2−m)2 (17)
Now that we derived the formula for fractionalization with arbitrary overlap between groups,we can apply it to our analysis. The main issue with applying it directly is that we do not im-mediately observe m. However, since we want to see how a change in m affects the results ofour fractionalization specification, we re-calculate our fractionalization index for 9 cases: m =
0.1n2,m = 0.2n2,m = 0.3n2,m = 0.4n2,m = 0.5n2, etc. That is, we assume that 10% (20%, 30%,
68Similarly, one can derive this formula by computing the inverse of the probability that two randomly selectedpeople are in the same social media platform. There could be such three cases. If one of the people is from m, they willsurely be from the same platform. If the first person is from n1 but not m, they can meet only if the other person is fromn1. Similarly, if the first person belongs to n2 but not m, they can meet only if the other person is from n2. Combiningthe probabilities of these three events, we get:
I2 = 1− mn1 +n2−m
− (n1−m)n1
(n1 +n2−m)2 −(n2−m)n2
(n1 +n2−m)2
One can show that I1 = I2, so we can use either formula.

etc.) of Facebook users have a VKontakte account.69 In Table A13 in the Online Appendix, weprovide the results of the estimation for a subset of cities with large population (above 100,000).Note that the results are robust to a very high degree of overlap between the VK and Facebookusers.
69In a survey from Enikolopov et al. (2017), we find that around 47% of regular Facebook users also use VKregularly. However, these estimates should be interpreted with caution as it heavily oversamples Moscow residentsand, as such, is not representative at the city level.

FIGURES AND TABLES
Figure 1. VK Penetration in 2011 and SPbSU student cohorts.
Notes: This figure presents the coefficients from column (4) of Table 1, reflecting the association between the log of the number of VK users in each city in June 2011 and the log of the number of SPbSU students who are one 5-year cohort older, of the same cohort, or one cohort younger than VK founder, respectively. Standard errors are clustered at the region level. Unit of observation is a city. Logarithm of any variable is calculated with 1 added inside. For further details about this specification, see notes to Table 1.

Figure 2. Protest activity and SPbSU student cohortsA. SPbSU Cohorts from Different Cities and The Incidence of Protests
B. SPbSU Cohorts from Different Cities and Protest Participation
Notes: Figure A and Figure B present the coefficients from columns (1) and (5) of Table 2, respectively. These reflect the association between the incidence of protests (Figure A) or the log of the number of protest participants (Figure B) in each city during the first week of protests in December 2011 and the number of SPbSU students who are one 5-year cohort older, of the same cohort, or one cohort younger than VK founder, respectively. Standard errors are clustered at the region level. Unit of observation is a city. Logarithm of any variable is calculated with 1 added inside. For further details about this specification, see notes to Table 2.

Figures 3. Nonparametric Relationship Between VK Penetration and Number of Protesters.
Notes: This figure displays the association between the log of the number of protesters in each city during the first week of protests in December 2011 and the log of the number of VK users in these cities as of June 2011. Logarithm of any variable is calculated with 1 added inside. Blue dots illustrate raw city-level data. Red line represents a non-parametric relationship between the two variables.
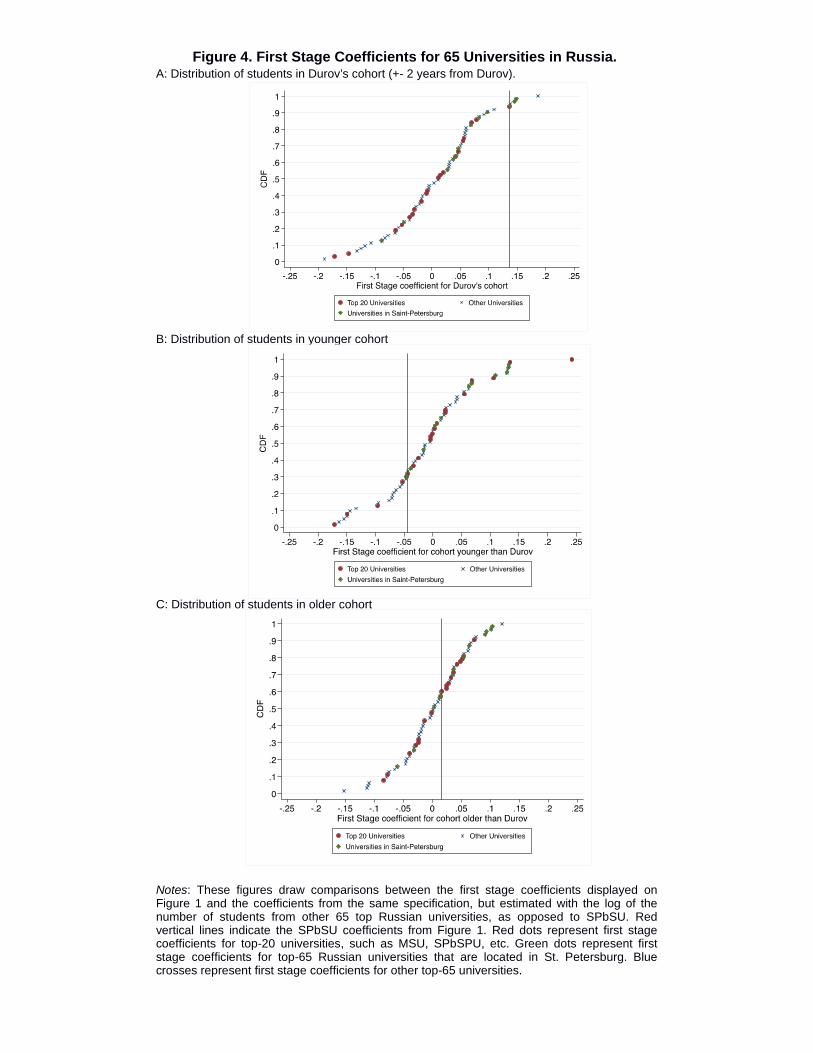
Figure 4. First Stage Coefficients for 65 Universities in Russia. A: Distribution of students in Durov’s cohort (+- 2 years from Durov).
B: Distribution of students in younger cohort
C: Distribution of students in older cohort
Notes: These figures draw comparisons between the first stage coefficients displayed on Figure 1 and the coefficients from the same specification, but estimated with the log of the number of students from other 65 top Russian universities, as opposed to SPbSU. Red vertical lines indicate the SPbSU coefficients from Figure 1. Red dots represent first stage coefficients for top-20 universities, such as MSU, SPbSPU, etc. Green dots represent first stage coefficients for top-65 Russian universities that are located in St. Petersburg. Blue crosses represent first stage coefficients for other top-65 universities.

Figure 5. Magnitude of the Effect of Social Media on Protest Participation as a Function of Population Threshold.
Notes: The graphs show the magnitude of the coefficients for the causal effect of VK penetration on Protest Incidence and Log (protesters in December 2011) for cities to the right of a given population threshold (in thousands). Grey areas show the 10% confidence intervals. Dashed lines display the 95% confidence intervals.

Figure 6. Magnitude of the Effect of Social Media on Voting Outcomes as a Function of Population Threshold.
Notes: The graphs show the magnitude of the coefficients for the causal effect of VK penetration on Vote Share for United Russia in 2011 and Vote Share for Putin in 2012 for cities to the right of the given population threshold (in thousands). Grey areas show the 10% confidence intervals. Dashed lines display the 95% confidence intervals.

Table 1. Determinants of VK penetration in 2011 (first stage regression).
Log (number of VK users), June 2011(1) (2) (3) (4) (5) (6) (7) (8)
Log (SPbSU students), same 5-year cohort as VK founder 0.5006*** 0.1715*** 0.1749*** 0.1332*** 0.1323** 0.1369** 0.1392*** 0.1371***[0.1381] [0.0441] [0.0442] [0.0503] [0.0517] [0.0526] [0.0505] [0.0517]
Log (SPbSU students), one cohort younger than VK founder 0.5612*** -0.0267 -0.0323 -0.0195 -0.0333 -0.0331 -0.0419 -0.0354[0.1040] [0.0508] [0.0522] [0.0359] [0.0355] [0.0364] [0.0369] [0.0369]
Log (SPbSU students), one cohort older than VK founder 0.3687** 0.1040** 0.0945** 0.0351 0.0347 0.0292 0.0223 0.0232[0.1726] [0.0459] [0.0448] [0.0476] [0.0482] [0.0487] [0.0451] [0.0460]
Regional center 0.1992* 0.2946** 0.1860 0.1925 0.2102 0.1795[0.1115] [0.1279] [0.1393] [0.1390] [0.1344] [0.1360]
Distance to Saint Petersburg, km -0.0000 -0.0001 -0.0001 -0.0001 -0.0002[0.0002] [0.0002] [0.0002] [0.0002] [0.0001]
Distance to Moscow, km -0.0001 -0.0000 0.0000 -0.0001 0.0001[0.0002] [0.0002] [0.0002] [0.0002] [0.0002]
Rayon center (county seat) -0.0104 -0.0200 -0.0299 -0.0387 -0.0271[0.0735] [0.0683] [0.0665] [0.0715] [0.0647]
Log (average wage), city-level, 2011 0.1604 0.1179 0.1141 0.0369 0.0586[0.1493] [0.1501] [0.1569] [0.1482] [0.1525]
Presence of a university in a city, 2011 0.1229 0.1416 0.1265 0.1585[0.0963] [0.0966] [0.0948] [0.0982]
Internet penetration, region-level, 2011 0.1958 0.2025 0.1615 0.2012[0.2254] [0.2153] [0.2351] [0.2212]
Log (number of Odnoklassniki users), 2014 0.0887 0.1024 0.1096 0.1360*[0.0851] [0.0829] [0.0818] [0.0807]
Ethnic fractionalization, 2010 0.3894* 0.3449 0.5086** 0.3901*[0.2205] [0.2342] [0.2323] [0.1966]
Observations 625 625 625 625 625 625 625 625R-squared 0.4428 0.8606 0.8614 0.9031 0.9063 0.9098 0.9094 0.9110Mean of the dependent variable 9.536 9.536 9.536 9.536 9.536 9.536 9.536 9.536SD of the dependent variable 1.334 1.334 1.334 1.334 1.334 1.334 1.334 1.334Population controls Yes*** Yes*** Yes* Yes** Yes** Yes* Yes*Age cohort controls Yes*** Yes*** Yes*** Yes*** Yes***Education controls Yes*** Yes*** Yes*** Yes*** Yes***Electoral controls, 1995 Yes**Electoral controls, 1999 Yes*Electoral controls, 2003 Yes**p-value for equality of coefficients for three cohorts 0.706 0.044** 0.038** 0.033** 0.025** 0.026** 0.019** 0.028**p-value for equality of coefficients of Durov's and younger cohort 0.762 0.014** 0.011** 0.011** 0.009*** 0.008*** 0.006*** 0.009***p-value for equality of coefficients of Durov's and older cohort 0.583 0.367 0.279 0.229 0.231 0.201 0.144 0.160*** p<0.01, ** p<0.05, * p<0.1. Robust standard errors in brackets are adjusted by clusters within regions. Unit of observation is a city. Logarithm of any variable is calculated with 1 added inside. When "Yes" is added to indicate inclusion of a group of controls, a significance level is reported immediately after for this group of controls. Flexible controls for population (5th polynomial) are included in all specifications. Age cohort controls include the number of people aged 20-24, 25-29, 30-34, 35-39, 40-44, 45-49, 50 and older years, in each city according to 2010 Russian Census. Education controls include the share of population with higher education overall according to 2002 Russian Census and separately in each of the age cohorts according to 2010 Russian Census, to account for both the levels and the change in education. Electoral controls include vote for Yabloko party, Communist Party (KPRF), LDPR party, the ruling party (Our Home is Russia in 1995, Unity in 1999, United Russia in 2003), and electoral turnout for a corresponding year.

Table 2. Student cohorts and protest participation in 2011. Reduced form estimation.Incidence of protests, dummy, Dec 2011 Log (number of protesters), Dec 2011
(1) (2) (3) (4) (5) (6) (7) (8)
Log (SPbSU students), same 5-year cohort as VK founder 0.062*** 0.062*** 0.064*** 0.066*** 0.253** 0.256** 0.264** 0.276**
[0.020] [0.020] [0.020] [0.020] [0.114] [0.113] [0.115] [0.115]
Log (SPbSU students), one cohort younger than VK founder 0.012 0.011 0.009 0.013 0.152 0.147 0.134 0.159
[0.020] [0.020] [0.020] [0.020] [0.105] [0.104] [0.105] [0.106]
Log (SPbSU students), one cohort older than VK founder -0.017 -0.016 -0.018 -0.014 -0.075 -0.072 -0.082 -0.068[0.020] [0.020] [0.020] [0.020] [0.113] [0.113] [0.112] [0.114]
Regional center -0.015 -0.011 -0.007 -0.013 0.287 0.304 0.333 0.291[0.099] [0.097] [0.096] [0.098] [0.488] [0.480] [0.480] [0.490]
Distance to Saint Petersburg, km 0.000 0.000 0.000 0.000 -0.000 0.000 -0.000 0.000[0.000] [0.000] [0.000] [0.000] [0.000] [0.000] [0.000] [0.000]
Distance to Moscow, km -0.000 -0.000 -0.000 -0.000 -0.000 -0.000 -0.000 -0.000[0.000] [0.000] [0.000] [0.000] [0.000] [0.000] [0.000] [0.000]
Rayon center (county seat) -0.001 0.001 -0.007 -0.010 0.003 0.007 -0.031 -0.045[0.009] [0.009] [0.010] [0.011] [0.044] [0.046] [0.048] [0.054]
Log (average wage), city-level, 2011 0.021 0.041 0.009 -0.013 0.100 0.171 0.009 -0.066[0.034] [0.037] [0.036] [0.034] [0.176] [0.186] [0.193] [0.182]
Presence of a university in a city, 2011 0.196** 0.194* 0.193** 0.198** 0.870** 0.869** 0.852** 0.892**[0.098] [0.098] [0.097] [0.098] [0.423] [0.424] [0.420] [0.430]
Internet penetration, region-level, 2011 -0.013 0.007 -0.003 -0.011 0.138 0.204 0.172 0.132[0.045] [0.046] [0.054] [0.049] [0.243] [0.237] [0.276] [0.256]
Log (number of Odnoklassniki users), 2014 0.032* 0.024 0.039* 0.031 0.104 0.078 0.147 0.124[0.017] [0.019] [0.020] [0.019] [0.109] [0.119] [0.120] [0.117]
Ethnic fractionalization, 2010 -0.089 -0.084 -0.079 -0.088 -0.580* -0.549 -0.511 -0.583*[0.059] [0.061] [0.063] [0.062] [0.321] [0.331] [0.342] [0.346]
Observations 625 625 625 625 625 625 625 625R-squared 0.776 0.780 0.781 0.781 0.823 0.826 0.828 0.826Mean of the dependent variable 0.134 0.134 0.134 0.134 0.773 0.773 0.773 0.773SD of the dependent variable 0.341 0.341 0.341 0.341 2.024 2.024 2.024 2.024Population controls Yes*** Yes*** Yes*** Yes*** Yes*** Yes*** Yes*** Yes***Age cohort controls Yes** Yes*** Yes*** Yes*** Yes* Yes** Yes** Yes**Education controls Yes* Yes Yes* Yes* Yes* Yes* Yes** Yes*Electoral controls, 1995 Yes** Yes**Electoral controls, 1999 Yes* Yes**Electoral controls, 2003 Yes** Yes**p-value for equality of coefficients for three cohorts 0.078* 0.071* 0.058* 0.068* 0.271 0.277 0.250 0.246p-value for equality of coefficients of Durov's and younger cohort 0.089* 0.072* 0.064* 0.076* 0.528 0.488 0.416 0.474p-value for equality of coefficients of Durov's and older cohort 0.031** 0.032** 0.025** 0.028** 0.115 0.114 0.099* 0.100*** p<0.01, ** p<0.05, * p<0.1. Robust standard errors in brackets are adjusted by clusters within regions. Unit of observation is a city. Logarithm of any variable is calculated with 1 added inside. When "Yes" is added to indicate inclusion of a group of controls, a significance level is reported immediately after for this group of controls. Flexible controls for population (5th polynomial) are included in all specifications. Age cohort controls include the number of people aged 20-24, 25-29, 30-34, 35-39, 40-44, 45-49, 50 and older years, in each city according to 2010 Russian Census. Education controls include the share of population with higher education overall according to 2002 Russian Census and separately in each of the age cohorts according to 2010 Russian Census, to account for both the levels and the change in education. Electoral controls include vote for Yabloko party, Communist Party (KPRF), LDPR party, the ruling party (Our Home is Russia in 1995, Unity in 1999, United Russia in 2003), and electoral turnout for a corresponding year.

Table 3. VK penetration and protest participation in 2011.Panel A. Probability of protests
Incidence of protests, dummy, Dec 2011IV IV IV IV OLS OLS OLS OLS
(1) (2) (3) (4) (5) (6) (7) (8)
Log (number of VK users), June 2011 0.466** 0.451** 0.458*** 0.479*** 0.060*** 0.057*** 0.055*** 0.065***[0.189] [0.177] [0.175] [0.181] [0.018] [0.018] [0.019] [0.018]
Weak IV Robust 95% Confidence Interval (0.20; 1.77) (0.20; 1.56) (0.20; 1.44) (0.20; 1.53)Log (SPbSU students), one cohort younger than VK founder 0.027 0.026 0.028 0.030 0.029 0.028 0.026 0.030
[0.024] [0.024] [0.025] [0.025] [0.021] [0.020] [0.021] [0.020]Log (SPbSU students), one cohort older than VK founder -0.033 -0.029 -0.028 -0.026 0.003 0.005 0.003 0.007
[0.031] [0.029] [0.027] [0.029] [0.018] [0.017] [0.017] [0.018]Observations 625 625 625 625 625 625 625 625Mean of the dependent variable 0.134 0.134 0.134 0.134 0.134 0.134 0.134 0.134SD of the dependent variable 0.341 0.341 0.341 0.341 0.341 0.341 0.341 0.341Population controls Yes*** Yes*** Yes*** Yes*** Yes*** Yes*** Yes*** Yes***Age cohort controls Yes Yes Yes Yes Yes** Yes** Yes** Yes***Education controls Yes Yes* Yes Yes Yes Yes Yes YesOther controls Yes*** Yes*** Yes*** Yes*** Yes*** Yes*** Yes*** Yes***Electoral controls, 1995 Yes Yes*Electoral controls, 1999 Yes YesElectoral controls, 2003 Yes Yes**Kleibergen-Paap F-stat 6.554 6.779 7.591 7.031Effective F-stat (Montiel Olea and Pflueger 2013) 10.97 12.03 12.30 12.17
Panel B. Number of protestersLog (number of protesters), Dec 2011
IV IV IV IV OLS OLS OLS OLS(1) (2) (3) (4) (5) (6) (7) (8)
Log (number of VK users), June 2011 1.911** 1.872** 1.894** 2.013** 0.377*** 0.359*** 0.351*** 0.393***[0.924] [0.872] [0.872] [0.889] [0.098] [0.102] [0.104] [0.103]
Weak IV Robust 95% Confidence Interval (0.23; 7.31) (0.29; 6.56) (0.29; 6.10) (0.41; 6.46)Log (SPbSU students), one cohort younger than VK founder 0.216* 0.209* 0.213* 0.230* 0.221** 0.217** 0.207* 0.233**
[0.117] [0.115] [0.119] [0.119] [0.107] [0.106] [0.108] [0.107]Log (SPbSU students), one cohort older than VK founder -0.141 -0.127 -0.124 -0.115 -0.004 0.004 -0.002 0.013
[0.151] [0.145] [0.135] [0.144] [0.093] [0.092] [0.090] [0.094]Observations 625 625 625 625 625 625 625 625Mean of the dependent variable 0.773 0.773 0.773 0.773 0.773 0.773 0.773 0.773SD of the dependent variable 2.024 2.024 2.024 2.024 2.024 2.024 2.024 2.024Population controls Yes*** Yes*** Yes*** Yes*** Yes*** Yes*** Yes*** Yes***Age cohort controls Yes Yes Yes Yes Yes* Yes** Yes** Yes**Education controls Yes Yes Yes Yes Yes Yes Yes* YesOther controls Yes*** Yes*** Yes*** Yes*** Yes*** Yes*** Yes*** Yes***Electoral controls, 1995 Yes YesElectoral controls, 1999 Yes YesElectoral controls, 2003 Yes* Yes*
Kleibergen-Paap F-stat 6.554 6.779 7.591 7.031Effective F-statistics (Olea Montiel and Pflueger 2013) 10.97 12.03 12.30 12.17 *** p<0.01, ** p<0.05, * p<0.1. Robust standard errors in brackets are adjusted by clusters within regions. Unit of observation is a city. Logarithm of any variable is calculated with 1 added inside. When "Yes" is added to indicate inclusion of a group of controls, a significance level is reported immediately after for this group of controls. Flexible controls for population (5th polynomial) are included in all specifications. Age cohort controls include the number of people aged 20-24, 25-29, 30-34, 35-39, 40-44, 45-49, 50 and older years, in each city according to 2010 Russian Census. Education controls include the share of population with higher education overall according to 2002 Russian Census and separately in each of the age cohorts according to 2010 Russian Census, to account for both the levels and the change in education. Electoral controls include vote for Yabloko party, Communist Party (KPRF), LDPR party, the ruling party (Our Home is Russia in 1995, Unity in 1999, United Russia in 2003), and electoral turnout for a corresponding year. Other controls include dummy for regional and county centers, distances to Moscow and St Petersburg, log (average wage), share of people with higher education in 2002, internet penetration in 2011, log (Odnoklassniki users in 2014). Weak IV robust 95% confidence intervals are Anderson-Rubin confidence sets calculated using software in Finlay and Magnusson (2009), which accommodates heteroskedasticity.

Table 4. VK penetration and Voting Outcomes.Voting share for United Russia, 2007
IV IV IV IV OLS OLS OLS OLS
(1) (2) (3) (4) (5) (6) (7) (8)
Log (number of VK users), June 2011 0.055 0.048 0.064 0.022 -0.020 -0.025** -0.019 -0.030***[0.057] [0.053] [0.055] [0.045] [0.013] [0.011] [0.012] [0.010]
Weak IV Robust 95% Confidence Interval (-0.04; 0.36) (-0.04; 0.32) (-0.02; 0.34) (-0.06; 0.24)
Log (SPbSU students), one cohort younger than VK founder -0.008 -0.005 -0.007 -0.007 -0.008 -0.004 -0.007 -0.007[0.008] [0.007] [0.008] [0.007] [0.008] [0.007] [0.007] [0.007]
Log (SPbSU students), one cohort older than VK founder 0.001 0.001 -0.001 -0.003 0.009 0.008 0.006 0.001[0.009] [0.008] [0.009] [0.007] [0.007] [0.006] [0.007] [0.005]
Voting share for Medvedev, 2008
IV IV IV IV OLS OLS OLS OLS
Log (number of VK users), June 2011 0.143* 0.140* 0.156* 0.118* -0.003 -0.009 -0.005 -0.014[0.079] [0.077] [0.080] [0.068] [0.011] [0.010] [0.011] [0.009]
Weak IV Robust 95% Confidence Interval (0.02; 0.68) (0.04; 0.64) (0.04; 0.64) (0.02; 0.52)
Log (SPbSU students), one cohort younger than VK founder -0.006 -0.004 -0.006 -0.005 -0.005 -0.003 -0.005 -0.004[0.010] [0.009] [0.010] [0.008] [0.007] [0.006] [0.007] [0.006]
Log (SPbSU students), one cohort older than VK founder -0.002 -0.002 -0.005 -0.005 0.012* 0.011* 0.008 0.006[0.011] [0.010] [0.011] [0.010] [0.007] [0.006] [0.007] [0.006]
Voting share for United Russia, 2011IV IV IV IV OLS OLS OLS OLS
Log (number of VK users), June 2011 0.257* 0.217* 0.259* 0.198 -0.035* -0.039** -0.031* -0.045***[0.152] [0.131] [0.147] [0.128] [0.018] [0.017] [0.017] [0.014]
Weak IV Robust 95% Confidence Interval (0.04; 1.40) (0.04; 1.12) (0.06; 1.20) (0.02; 1.00)
Log (SPbSU students), one cohort younger than VK founder -0.006 -0.000 -0.004 -0.003 -0.003 0.002 -0.003 -0.001[0.015] [0.014] [0.016] [0.013] [0.012] [0.010] [0.012] [0.011]
Log (SPbSU students), one cohort older than VK founder -0.003 0.003 -0.003 -0.005 0.024** 0.026** 0.020* 0.016[0.020] [0.017] [0.018] [0.016] [0.012] [0.011] [0.011] [0.011]
Voting Share for Putin, 2012IV IV IV IV OLS OLS OLS OLS
Log (number of VK users), June 2011 0.152* 0.144* 0.155* 0.114 -0.011 -0.013 -0.010 -0.020**[0.088] [0.085] [0.084] [0.073] [0.011] [0.010] [0.011] [0.008]
Weak IV Robust 95% Confidence Interval (0.04; 0.80) (0.04; 0.72) (0.04; 0.68) (0.02; 0.58)
Log (SPbSU students), one cohort younger than VK founder -0.001 0.001 0.000 -0.001 0.000 0.002 0.001 0.000[0.010] [0.009] [0.010] [0.008] [0.008] [0.007] [0.007] [0.007]
Log (SPbSU students), one cohort older than VK founder 0.003 0.004 0.001 0.000 0.018** 0.018** 0.015** 0.011*[0.013] [0.012] [0.012] [0.010] [0.007] [0.007] [0.007] [0.006]
Voting share for United Russia, 2016IV IV IV IV OLS OLS OLS OLS
Log (number of VK users), June 2011 0.214** 0.171* 0.205** 0.134* 0.007 0.009 0.017 0.002[0.108] [0.098] [0.097] [0.072] [0.019] [0.017] [0.018] [0.012]
Weak IV Robust 95% Confidence Interval (0.04; 0.92) (0.00; 0.72) (0.06; 0.74) (0.02; 0.52)
Log (SPbSU students), one cohort younger than VK founder -0.002 0.004 0.000 0.001 0.000 0.006 0.001 0.001[0.012] [0.011] [0.012] [0.009] [0.011] [0.010] [0.010] [0.009]
Log (SPbSU students), one cohort older than VK founder 0.004 0.010 0.003 0.004 0.024** 0.024** 0.019* 0.015*[0.016] [0.015] [0.015] [0.011] [0.011] [0.011] [0.010] [0.009]
Population, Age cohorts, Education, and Other controls Yes Yes Yes Yes Yes Yes Yes YesElectoral controls, 1995 Yes YesElectoral controls, 1999 Yes YesElectoral controls, 2003 Yes YesObservations 625 625 625 625 625 625 625 625Kleibergen-Paap F-stat 6.554 6.779 7.591 7.031Effective F-statistics (Olea Montiel and Pflueger 2013) 10.97 12.03 12.30 12.17*** p<0.01, ** p<0.05, * p<0.1. Robust standard errors in brackets are adjusted by clusters within regions. Unit of observation is a city. Since the outcomes are shares of population, population weights are applied. Logarithm of any variable is calculated with 1 added inside. When "Yes" is added to indicate inclusion of a group of controls, a significance level is reported immediately after for this group of controls. Flexible controls for population (5th polynomial) are included in all specifications. Age cohort controls include the number of people aged 20-24, 25-29, 30-34, 35-39, 40-44, 45-49, 50 and older years, in each city according to 2010 Russian Census. Education controls include the share of population with higher education overall according to 2002 Russian Census and separately in each of the age cohorts according to 2010 Russian Census, to account for both the levels and the change in education. Electoral controls include vote for Yabloko party, Communist Party (KPRF), LDPR party, the ruling party (Our Home is Russia in 1995, Unity in 1999, United Russia in 2003), and electoral turnout for a corresponding year. Other controls include dummy for regional and county centers, distances to Moscow and St Petersburg, log (average wage), share of people with higher education in 2002, internet penetration in 2011, log (Odnoklassniki users in 2014). Weak IV robust 95% confidence intervals are Anderson-Rubin confidence sets calculated using software in Finlay and Magnusson (2009), which accommodates heteroskedasticity.

Table 5. VK Penetration and Political Attitudes.How do you assess the work of president Dmitry Medvedev
(1) (2) (3) (4) (5) (6)Log (number of VK users), June 2011 0.255** -0.069 -0.060 -0.094 -0.026 0.026
[0.127] [0.130] [0.062] [0.059] [0.076] [0.061]Log (SPbSU students), one cohort younger than VK founder -0.013 0.010 0.001 0.013** 0.003 0.005
[0.016] [0.009] [0.007] [0.005] [0.009] [0.008]Log (SPbSU students), one cohort older than VK founder -0.016 -0.017 -0.001 0.006 -0.011 -0.006
[0.019] [0.014] [0.010] [0.008] [0.009] [0.008]How do you assess the work of prime minister Vladimir Putin
Log (number of VK users), June 2011 0.205* -0.072 0.004 -0.061 -0.068 -0.016[0.124] [0.124] [0.047] [0.042] [0.075] [0.056]
Log (SPbSU students), one cohort younger than VK founder -0.019 0.012 -0.000 0.008** 0.007 0.004
[0.016] [0.009] [0.006] [0.003] [0.009] [0.007]Log (SPbSU students), one cohort older than VK founder -0.011 -0.021 -0.007 0.005 -0.002 -0.002
[0.018] [0.016] [0.007] [0.006] [0.011] [0.007]How do you assess the work of the government
Log (number of VK users), June 2011 0.313** 0.100 -0.124* -0.078 -0.075 -0.027[0.133] [0.129] [0.074] [0.079] [0.104] [0.091]
Log (SPbSU students), one cohort younger than VK founder -0.017 0.015 0.004 0.013** -0.001 0.001
[0.018] [0.013] [0.008] [0.006] [0.012] [0.009]Log (SPbSU students), one cohort older than VK founder -0.019 -0.026 0.007 0.006 -0.014 0.001
[0.020] [0.018] [0.012] [0.010] [0.012] [0.011]Which party are you planning to vote for in December elections
LDPR KPRF Yabloko
Log (number of VK users), June 2011 0.260* 0.050 -0.056 -0.041 -0.002 -0.005[0.155] [0.055] [0.055] [0.067] [0.009] [0.013]
Log (SPbSU students), one cohort younger than VK founder -0.006 -0.000 0.006 0.003 0.001 0.002
[0.016] [0.005] [0.005] [0.005] [0.001] [0.001]Log (SPbSU students), one cohort older than VK founder -0.043* -0.004 0.005 0.002 0.000 -0.002
[0.023] [0.007] [0.009] [0.008] [0.001] [0.002]
Admit Exclude
Log (number of VK users), June 2011 -0.278* 0.101 0.186[0.164] [0.184] [0.146]
Log (SPbSU students), one cohort younger than VK founder -0.001 -0.002 0.002[0.014] [0.015] [0.012]
Log (SPbSU students), one cohort older than VK founder 0.027 -0.024 -0.005[0.021] [0.025] [0.022]
Good and getting better
Good and remains
the same
Good and getting worse
Bad, but getting better
Bad and remains
the same
Bad and getting worse
Good and getting better
Good and remains
the same
Good and getting worse
Bad, but getting better
Bad and remains
the same
Bad and getting worse
Good and getting better
Good and remains
the same
Good and getting worse
Bad, but getting better
Bad and remains
the same
Bad and getting worse
United Russia
Just Russia
Patriots of Russia
Do you personally admit or exclude a possibility to take part in any protests
Difficult to answer
*** p<0.01, ** p<0.05, * p<0.1. Robust standard errors in brackets are adjusted by clusters within regions. Unit of observation is an individual respondent. Logarithm of any variable is calculated with 1 added inside. The table presents results of 27 separate IV regressions. In all regressions the number of observations is 31,728 and the effective F-statistics (Olea Montiel and Pflueger 2013) is 30,415. All regressions include the following city-level controls:5th polynomial of population, the number of people aged 20-24, 25-29, 30-34, 35-39, 40-44, 45-49, 50 and older years, the share of population with higher education in each of the age cohorts separately, dummy for regional and county centers , distances to Moscow and St Petersburg, log (average wage), share of population with higher education in 2002, internet penetration in 2011, log (Odnoklassniki users in 2014).
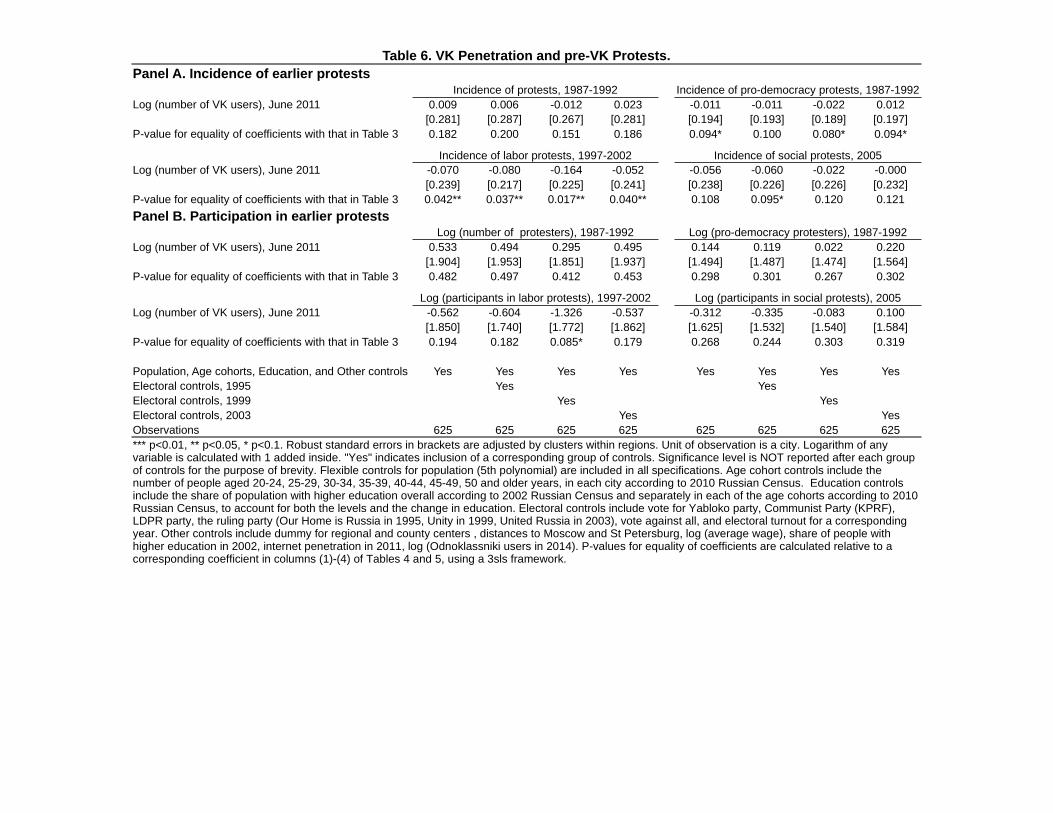
Table 6. VK Penetration and pre-VK Protests.Panel A. Incidence of earlier protests
Incidence of protests, 1987-1992 Incidence of pro-democracy protests, 1987-1992Log (number of VK users), June 2011 0.009 0.006 -0.012 0.023 -0.011 -0.011 -0.022 0.012
[0.281] [0.287] [0.267] [0.281] [0.194] [0.193] [0.189] [0.197]P-value for equality of coefficients with that in Table 3 0.182 0.200 0.151 0.186 0.094* 0.100 0.080* 0.094*
Incidence of labor protests, 1997-2002 Incidence of social protests, 2005Log (number of VK users), June 2011 -0.070 -0.080 -0.164 -0.052 -0.056 -0.060 -0.022 -0.000
[0.239] [0.217] [0.225] [0.241] [0.238] [0.226] [0.226] [0.232]P-value for equality of coefficients with that in Table 3 0.042** 0.037** 0.017** 0.040** 0.108 0.095* 0.120 0.121
Panel B. Participation in earlier protestsLog (number of protesters), 1987-1992 Log (pro-democracy protesters), 1987-1992
Log (number of VK users), June 2011 0.533 0.494 0.295 0.495 0.144 0.119 0.022 0.220[1.904] [1.953] [1.851] [1.937] [1.494] [1.487] [1.474] [1.564]
P-value for equality of coefficients with that in Table 3 0.482 0.497 0.412 0.453 0.298 0.301 0.267 0.302
Log (participants in labor protests), 1997-2002 Log (participants in social protests), 2005Log (number of VK users), June 2011 -0.562 -0.604 -1.326 -0.537 -0.312 -0.335 -0.083 0.100
[1.850] [1.740] [1.772] [1.862] [1.625] [1.532] [1.540] [1.584]P-value for equality of coefficients with that in Table 3 0.194 0.182 0.085* 0.179 0.268 0.244 0.303 0.319
Population, Age cohorts, Education, and Other controls Yes Yes Yes Yes Yes Yes Yes YesElectoral controls, 1995 Yes YesElectoral controls, 1999 Yes YesElectoral controls, 2003 Yes YesObservations 625 625 625 625 625 625 625 625*** p<0.01, ** p<0.05, * p<0.1. Robust standard errors in brackets are adjusted by clusters within regions. Unit of observation is a city. Logarithm of any variable is calculated with 1 added inside. "Yes" indicates inclusion of a corresponding group of controls. Significance level is NOT reported after each group of controls for the purpose of brevity. Flexible controls for population (5th polynomial) are included in all specifications. Age cohort controls include the number of people aged 20-24, 25-29, 30-34, 35-39, 40-44, 45-49, 50 and older years, in each city according to 2010 Russian Census. Education controls include the share of population with higher education overall according to 2002 Russian Census and separately in each of the age cohorts according to 2010 Russian Census, to account for both the levels and the change in education. Electoral controls include vote for Yabloko party, Communist Party (KPRF), LDPR party, the ruling party (Our Home is Russia in 1995, Unity in 1999, United Russia in 2003), vote against all, and electoral turnout for a corresponding year. Other controls include dummy for regional and county centers , distances to Moscow and St Petersburg, log (average wage), share of people with higher education in 2002, internet penetration in 2011, log (Odnoklassniki users in 2014). P-values for equality of coefficients are calculated relative to a corresponding coefficient in columns (1)-(4) of Tables 4 and 5, using a 3sls framework.

Table 7. VK Penetration and Pre-VK Voting Results.
Panel A. Parliamentary electionsDependent variable
Turnout
Voting results in 1995, IV with SPbSU cohorts -0.018 -0.012 0.093 0.034 0.025 -0.010[0.029] [0.022] [0.072] [0.057] [0.039] [0.008]
Voting results in 1999, IV with SPbSU cohorts 0.031 0.006 0.053 -0.008 -0.088 -0.000[0.051] [0.017] [0.049] [0.011] [0.062] [0.007]
Voting results in 2003 IV with SPbSU cohorts 0.088 -0.017 -0.005 -0.002 -0.019 -0.016[0.056] [0.011] [0.024] [0.025] [0.050] [0.012]
Panel B. Presidential electionsYear 1996, 1st round Turnout
Voting results, IV with SPbSU cohorts -0.135 0.014 0.127 -0.007 0.008 -0.002[0.086] [0.018] [0.091] [0.042] [0.025] [0.003]
Year 1996, 2nd round Turnout
Voting results, IV with SPbSU cohorts -0.122 - 0.136 - 0.004 -0.006[0.092] - [0.095] - [0.031] [0.009]
Year 2000 Turnout
Voting results, IV with SPbSU cohorts 0.125 -0.028* -0.042 -0.006 0.005 -0.012**[0.081] [0.015] [0.055] [0.031] [0.031] [0.005]
Year 2004 Turnout
Voting results, IV with SPbSU cohorts 0.109* -0.025* 0.000 -0.034* -0.027[0.063] [0.014] [0.034] [0.019] [0.053]
Pro-government vote share
Yabloko vote share
Communists vote share
LDPR vote share
Against all share
Yeltsin vote share
Yavlinsky vote share
Zyuganov vote share
Lebedev vote share
Against all share
Yeltsin vote share
Zyuganov vote share
Against all share
Putin vote share
Yavlinsky vote
Zyuganov vote
Tuleev vote share
Against all share
Putin vote share
Hakamada vote
Haritonov vote
Glaziev vote share

Table 8. Fractionalization of Networks and Protest Participation.Panel A. Network fractionalization and the incidence of protest
Incidence of protests, dummy, Dec 2011Whole sample Cities with more than 100 000 inhabitants
Fractionalization of social media networks (Facebook+Vkontakte) -0.135 -0.153 -0.155 -0.133 -0.983** -0.883** -0.910** -1.046**[0.143] [0.148] [0.141] [0.146] [0.435] [0.424] [0.430] [0.417]
Log (number of users in both networks) 0.265*** 0.262*** 0.252*** 0.265*** 0.072 0.099 0.108 0.140[0.074] [0.072] [0.073] [0.073] [0.122] [0.122] [0.125] [0.124]
Observations 625 625 625 625 158 158 158 158Mean of the dependent variable 0.134 0.134 0.134 0.134 0.500 0.500 0.500 0.500SD of the dependent variable 0.341 0.341 0.341 0.341 0.502 0.502 0.502 0.502Population, Age cohorts, Education, and Other controls Yes*** Yes*** Yes*** Yes*** Yes*** Yes*** Yes*** Yes***Electoral controls, 1995 Yes** YesElectoral controls, 1999 Yes Yes*Electoral controls, 2003 Yes** YesR-squared 0.783 0.787 0.786 0.786 0.768 0.789 0.786 0.799
Panel B. Network fractionalization and protest participation.Log (number of protesters), Dec 2011
Whole sample Cities with more than 100 000 inhabitants
(1) (2) (3) (4) (5) (6) (7) (8)
Fractionalization of social media networks (Facebook+Vkontakte) -0.894 -1.007 -1.010 -0.922 -4.797** -4.731** -4.453** -5.311**[0.744] [0.771] [0.741] [0.754] [2.140] [2.238] [2.195] [2.044]
Log (number of users in both networks) 1.896*** 1.874*** 1.823*** 1.889*** 1.233** 1.269* 1.497** 1.490**[0.373] [0.367] [0.373] [0.370] [0.618] [0.665] [0.639] [0.649]
Observations 625 625 625 625 158 158 158 158Mean of the dependent variable 0.773 0.773 0.773 0.773 2.926 2.926 2.926 2.926SD of the dependent variable 2.024 2.024 2.024 2.024 3.065 3.065 3.065 3.065Population, Age cohorts, Education, and Other controls Yes*** Yes*** Yes*** Yes*** Yes*** Yes*** Yes*** Yes***Electoral controls, 1995 Yes** YesElectoral controls, 1999 Yes* Yes**Electoral controls, 2003 Yes* YesR-squared 0.838 0.841 0.842 0.841 0.821 0.836 0.838 0.840*** p<0.01, ** p<0.05, * p<0.1. Robust standard errors in brackets are adjusted by clusters within regions. Unit of observation is a city. Logarithm of any variable is calculated with 1 added inside. When "Yes" is added to indicate inclusion of a group of controls, a significance level is reported immediately after for this group of controls. Flexible controls for population (5th polynomial) are included in all specifications. Age cohort controls include the number of people aged 20-24, 25-29, 30-34, 35-39, 40-44, 45-49, 50 and older years, in each city according to 2010 Russian Census. Education controls include the share of population with higher education overall according to 2002 Russian Census and separately in each of the age cohorts according to 2010 Russian Census, to account for both the levels and the change in education. Electoral controls include vote for Yabloko party, Communist Party (KPRF), LDPR party, the ruling party (Our Home is Russia in 1995, Unity in 1999, United Russia in 2003), and electoral turnout for a corresponding year. Other controls include dummy for regional and county centers, distances to Moscow and St Petersburg, log (average wage), share of people with higher education in 2002, internet penetration in 2011, log (Odnoklassniki users in 2014).

Table 9. VK Penetration and Municipal Budgets.Panel A. VK penetration and federal transfers to municipalities
2009 2010 2011 2012 2013 2014
Log (transfers to municipality)Log (number of VK users), June 2011 -0.190 -0.903 -1.275 -3.458** -2.826** -3.161**
[0.865] [0.942] [1.026] [1.495] [1.431] [1.473]Population controls Yes Yes Yes Yes Yes** Yes**Age cohort controls Yes Yes Yes Yes* Yes*** YesEducation controls Yes*** Yes Yes Yes Yes YesObservations 325 347 347 351 352 323Effective F-statistics (Olea Montiel and Pflueger 2013) 12.53 13.48 13.88 12.92 11.23 11.03
Panel B. VK penetration and municipality's tax revenuesLog (municipal tax revenues)
Log (number of VK users), June 2011 -0.157 -0.105 0.040 -0.382 -0.498 -0.677**[0.198] [0.269] [0.233] [0.287] [0.303] [0.341]
Population controls Yes Yes Yes Yes Yes YesAge cohort controls Yes** Yes* Yes Yes Yes YesEducation controls Yes* Yes* Yes Yes** Yes YesObservations 496 513 502 501 499 483Effective F-statistics (Olea Montiel and Pflueger 2013) 12.65 14.17 14.27 13.92 12.26 11.97
Panel C. VK penetration and municipal spendingLog (municipal total spending)
Log (number of VK users), June 2011 -0.094 0.138 -0.030 -0.306 -0.304 -0.365[0.186] [0.203] [0.167] [0.267] [0.273] [0.283]
Population controls Yes Yes Yes Yes Yes YesAge cohort controls Yes** Yes Yes Yes Yes YesEducation controls Yes* Yes Yes Yes Yes YesObservations 436 448 467 458 477 456Effective F-statistics (Olea Montiel and Pflueger 2013) 17.27 19.63 22.99 21.62 17.07 16.22*** p<0.01, ** p<0.05, * p<0.1. Robust standard errors in brackets are adjusted by clusters within regions. Unit of observation is a city. IV estimates are reported. Logarithm of any variable is calculated with 1 added inside. When "Yes" is added to indicate inclusion of a group of controls, a significance level is reported immediately after for this group of controls. Flexible controls for population (5th polynomial) are included in all specifications. Age cohort controls include the number of people aged 20-24, 25-29, 30-34, 35-39, 40-44, 45-49, 50 and older years, in each city according to 2010 Russian Census. Education controls include the share of population with higher education overall according to 2002 Russian Census and separately in each of the age cohorts according to 2010 Russian Census, to account for both the levels and the change in education. Other controls include dummy for regional and county centers, distances to Moscow and St Petersburg, log (average wage), share of people with higher education in 2002, internet penetration in 2011, log (Odnoklassniki users in 2014). All specifications control for the initial 2008 values of the corresponding dependent variable and election results of 2007 parliamentary elections.

ONLINE APPENDIX
A.1 The Cross Partial Derivative of Protest Participation withRespect to Social Media and Baseline Coordination Signal
The cross partial derivative of the effect of social media on protests via coordination channel withrespect to baseline coordination signal can be obtained by differentiating equation (8) with respectto the precision of the baseline coordination signal, β0:
∂ 2cp
∂βs∂β0=− 2k
(β0 +βs)3(
1− λpσpc
φ
[1
σpc(cp−µpc)
]) +k2λpφ ′
[1
σpc(cp−µpc)
]σ2 (β0 +βs)
4(
1− λpσpc
φ
[1
σpc(cp−µpc)
])3
We would like to derive the sign of this expression. First, note that, under the assumption thatlambda is small enough to ensure that the denominator in (7)-(9) is positive, — more precisely, ifλ < σpc/φ [(cp−µpc)/σpc]) — the first part of the above expression is negative.
Second, observe that whenever the equilibrium threshold, cp, exceeds the average cost of protestparticipation, µpc, the second part of that expression becomes negative too (since φ ′(x) < 0 whenx > 0). Thus, in this case, the cross partial derivative has a negative sign. However, the conditionthat cp > µpc is fairly restrictive and unlikely to hold in our data, as it means that more than 50%of population decide to take part in a protest.
However, we can show that, even if cp < µpc, the cross partial derivative is negative as long asλp is small enough. To see this, note that, when λp approches zero, the second part of the expressiongoes to zero as well, while the first one survives and remains negative. We search for the conditionon lambda more formally below. Getting rid of common multipliers and using simplified notation,the condition becomes:
kλφ ′
σ2 (β0 +βs)(
1− λ
σφ
)2 −2 < 0
After a few algebraic transformations, one obtains the following inequality:
λ2 [−2(β0 +βs)φ
2]+λ[kφ′+4(β0 +βs)φσ
]−2(β0 +βs)σ
2 < 0
Under the existing restriction on lambda, λ < σ/φ , there remain some values of lambda for whichthe above inequality does not hold. To see this, note that, when inserting λ = σ/φ , the above

expression becomes strictly positive:
−2(β0 +βs)σ2−2(β0 +βs)σ
2 + kσφ ′
φ+4(β0 +βs)σ
2 = kσφ ′
φ> 0
, where φ ′ > 0 comes from the fact that we are considering the case with cp < µpc, and from thefact that φ ′(x)> 0 when x < 0.
Thus, the new condition on lambda is a subset of the existing condition and comes from solvingthe quadratic inequality above. After solving this inequality, one obtains the following condition:
λ <kφ ′+4(β0 +βs)φσ −
√(kφ ′)2 +8(β0 +βs)φφ ′kσ
2(β0 +βs)φ 2 (16)
To conclude, if lambda is small enough, i.e., complies with condition (16), the cross partial deriva-tive of the social media coordination effect on protest participation by precision of the baselinecoordination signal has a negative sign. As a result, our theoretical framework predicts that socialmedia should be more important in places with higher β i
0 where coordination is harder to achievein the absence of public signals, e.g., in larger cities. Thus, if social media increases protest partic-ipation due to coordination channel, one would expect the magnitude of the effect to be increasingwith city size.

A.2 Fractionalization with Arbitrary Overlap
Figure 1: Overlapping groups
In this section, we derive a fractionalization index for-mula for the case of overlapping groups. In our par-ticular case, these are VK and Facebook users. Let usdenote the number of VK users as n1, the number ofFacebook users as n2, and their interaction as m (seeFigure 1 for illustration).
The usual fractionalization index measures theprobability that two randomly chosen objects happento be in different groups:
I = 1−n2
1 +n22
(n1 +n2)2
Suppose now that there is a non-zero overlap be-tween the two groups, meaning that mass m now hasaccounts in both VK and Facebook. The probability oftwo randomly chosen people being from distinct social media networks is now equal to the chancethat one person is drawn from n1 but not m and the other one is drawn from n2 but not m:68
I1 =2(n1−m)(n2−m)
(n1 +n2−m)2 (17)
Now that we derived the formula for fractionalization with arbitrary overlap between groups,we can apply it to our analysis. The main issue with applying it directly is that we do not im-mediately observe m. However, since we want to see how a change in m affects the results ofour fractionalization specification, we re-calculate our fractionalization index for 9 cases: m =
0.1n2,m = 0.2n2,m = 0.3n2,m = 0.4n2,m = 0.5n2, etc. That is, we assume that 10% (20%, 30%,
68Similarly, one can derive this formula by computing the inverse of the probability that two randomly selectedpeople are in the same social media platform. There could be such three cases. If one of the people is from m, they willsurely be from the same platform. If the first person is from n1 but not m, they can meet only if the other person is fromn1. Similarly, if the first person belongs to n2 but not m, they can meet only if the other person is from n2. Combiningthe probabilities of these three events, we get:
I2 = 1− mn1 +n2−m
− (n1−m)n1
(n1 +n2−m)2 −(n2−m)n2
(n1 +n2−m)2
One can show that I1 = I2, so we can use either formula.

etc.) of Facebook users have a VKontakte account.69 In Table A13 in the Online Appendix, weprovide the results of the estimation for a subset of cities with large population (above 100,000).Note that the results are robust to a very high degree of overlap between the VK and Facebookusers.
69In a survey from Enikolopov et al. (2017), we find that around 47% of regular Facebook users also use VKregularly. However, these estimates should be interpreted with caution as it heavily oversamples Moscow residentsand, as such, is not representative at the city level.

ONLINE APPENDIX
Figure A1. VK penetration over time. Number of users (vertical axis, in 100 mln accounts) and the date of the first post (horizontal axis) are shown.
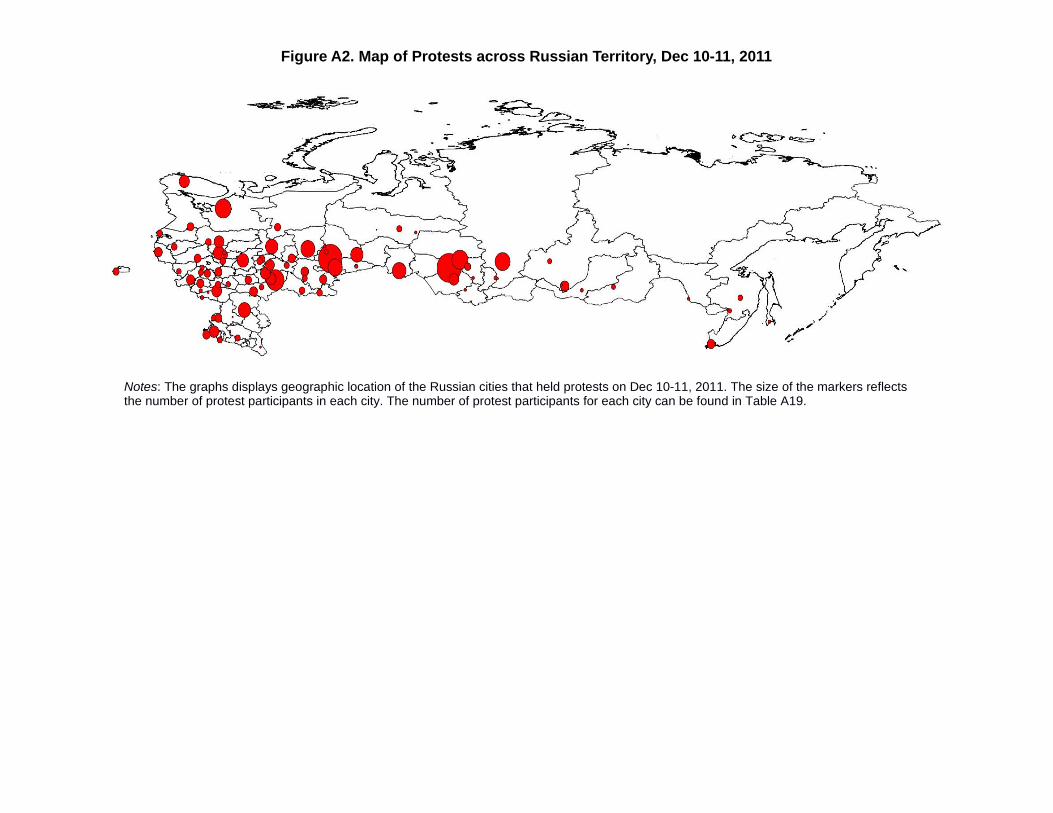
Figure A2. Map of Protests across Russian Territory, Dec 10-11, 2011
Notes: The graphs displays geographic location of the Russian cities that held protests on Dec 10-11, 2011. The size of the markers reflects the number of protest participants in each city. The number of protest participants for each city can be found in Table A19.

Figure A3. Fluctuations of City Ranks Across Cohorts.Panel A: VK founder’s (Durov’s) cohort and one cohort older
Panel B: VK founder’s (Durov’s) cohort and one cohort younger
Notes: City rank is calculated with the highest value ranked 1 and assigning the same average rank in case of ties. The size of the dots reflects the number of cities with a given combination of ranks across cohorts.

Figure A4. VK Penetration in November 2006 and SPbSU student cohorts.
Notes: This figure presents the coefficients from column (4) of Table A5, reflecting the association between the log of the number of VK users in each city in November 2006 and the log of the number of SPbSU students who are one 5-year cohort older, of the same cohort, or one cohort younger than VK founder, respectively. Standard errors are clustered at the region level. Unit of observation is a city. Logarithm of any variable is calculated with 1 added inside. For further details about this specification, see notes to Table A5.

Figure A5. Nonparametric Relationship between VK Penetration and Number of Protesters (in shares).
Notes: This figure displays the association between the average number of protesters in each city during the first week of protests in December 2011 and the number of VK users in these cities as of June 2011, both variables are per capita. Logarithm of any variable is calculated with 1 added inside. Blue dots illustrate raw city-level data. Red line represents a non-parametric relationship between the two variables.

Panel A: Vote Share for United Russia on December 4, 2011
Panel B: Vote Share for Vladimir Putin on March 4, 2012
Figure A6. Nonparametric Relationship between VK Penetration and Pro-Government Vote
Notes: This figure displays the association between the pro-government vote share in each city in 2011 and 2012 and VK penetration in these cities as of June 2011. Blue dots illustrate raw city-level data. Red line represents a non-parametric relationship between the two variables.

Figure A7. Mentions of Politicians and Parties on VK in November 2011
Notes: The graph displays the raw number of politician mentions in the universe of posts on VK in November 2011, the month before the protests. Vladimir Putin, Dmitry Medvedev, and Political Party “Edinaya Rossia” (“United Russia”) represented the status quo government. Alexey Navalny, Political Party “Parnas” with its leaders Boris Nemtsov and Mikhail Kasyanov, and Political Party “Yabloko” with its leader Grigory Yavlinskiy were in strong opposition to the government and were one of the most important figures during the protests. KPRF (Communist Party of Russia) with its leader Zuganov, LDPR with its leader Zhirinovskiy, Spravedlivaya Rossia with its leader Mironov, and a few others were the official opposition parties and candidates during the December 2011 Parliamentary elections but had limited importance during the protests. Data were retrieved on March 2017.

Figure A8. Mentions of Putin and Protests on VK in 2011
Notes: The graph analyzes the universe of all posts on VK mentioning Vladimir Putin, grouping them by date and topic. Blue bars (to the left) present data for all posts written in 2011 before the legislative elections on December 4, 2011; red bars (center) display data for all posts written a week before December 4, 2011; and green bars (to the right) represent all posts written a week after December 4, 2011. The bar height represents the percentages of all posts devoted to a given topic. “Putin+Emelyanenko” topic refers to an incident on November 20, 2011, when Putin was booed during an award ceremony of the MMA fighter Fedor Emelyanenko. “Putin’s Address” refers to the Putin’s pre-election address on Dec 1, 2011, in which he calls to vote for United Russia. “Putin+Elections” category refers to all posts that include words “Putin” and “elections” but which are not anecdotes/poems, are not about Putin’s address, and do not include mentions of Emelyanenko. Finally, the “Rally” category includes posts that mention both Putin and protest demonstrations. Data were retrieved on March 2017.

Figure A9. Reduced Form Coefficients for 65 Universities in Russia. Panel A: Distribution of students in Durov’s cohort (+- 2 years from Durov).
Panel B: Distribution of students in younger cohort
Panel C: Distribution of students in older cohort
Notes: These figures draw comparisons between the reduce form coefficients displayed on Figure 2B and the coefficients from the same specification, but estimated with the log of the number of students from other 65 top Russian universities, as opposed to SPbSU. Red vertical lines indicate the SPbSU coefficients from Figure 2B. Red dots represent first stage coefficients for top-20 universities, such as MSU, SPbSPU, etc. Green dots represent first stage coefficients for top-65 Russian universities that are located in St. Petersburg. Blue crosses represent first stage coefficients for other top-65 universities.

Figure A9. Magnitude of the Association between Social Media Fractionalization and Protest Participation as a Function of
Population Threshold.
Notes: The graphs show the magnitude of the coefficients for the association between social media fractionalization and protest participation for cities to the right of the given population threshold (in thousands). Grey areas show the 10% confidence intervals. Dashed lines display the 95% confidence intervals.

Table A1. Summary statistics.Observations Mean Median Min Max
Incidence of protests, Dec 2011 625 0.13 0.34 0 0 1Incidence of protests, USSR, 1987-1992 625 0.22 0.41 0 0 1Incidence of pro-democratic protests, USSR, 1987-1992 625 0.18 0.38 0 0 1Incidence of anti-monetization protests, 2005 625 0.19 0.39 0 0 1Incidence of labor protests, 1997-2000 625 0.61 0.49 1 0 1Log (number of protest participants), Dec 2011 625 0.77 2.02 0 0 8.66Log (number of protest participants), USSR, 1987-1992 625 1.41 2.77 0 0 12.99Log (number of participants in pro-democratic protests), USSR, 1987-1992 625 1.38 3.08 0 0 13.93Log (number of participants in anti-monetization protests), 2005 625 1.28 2.7 0 0 9.21Log (number of participants in labor protests), 1997-2000 625 3.8 3.42 4.39 0 11.76Log (number of VK users), June 2011 625 9.54 1.33 9.31 6.61 13.84Log (number of early VK users), Nov 2006 625 0.08 0.3 0 0 3.5Log (number of VK users), 2013 625 10.13 1.27 9.84 7.65 14.3Log (number of Odnoklassniki users), 2014 625 10.72 1.12 10.45 7.94 14.36Log (number of Facebook users), 2013 625 6.9 2.06 6.76 0 12.3Log (SPbSU students, same 5-year cohort as VK founder) 625 0.49 0.75 0 0 4.64Log (SPbSU students, one cohort younger than VK founder) 625 0.4 0.63 0 0 2.77Log (SPbSU students, one cohort older than VK founder) 625 0.44 0.7 0 0 3.53Internet penetration, region-level, 2011 625 0.27 0.17 0.22 0.01 0.63Population, in thousands, 2010 625 117.68 189.63 52.7 20 1393.5Regional center 625 0.12 0.32 0 0 1Rayon center (county seat) 625 0.79 0.41 1 0 1Distance to Saint Petersburg, km 625 1481.62 839.41 1419 21.7 4646Distance to Moscow, km 625 1152.76 875.97 1014 15.75 4174Log (average wage), 2011 625 9.89 0.35 9.83 9.08 11.19Log (number of people with age 20-24), 2010 625 8.46 1.07 8.19 6.79 11.83Log (number of people with age 25-29), 2010 625 8.53 1.02 8.28 6.83 11.84Log (number of people with age 30-34), 2010 625 8.47 1 8.21 6.8 11.69Log (number of people with age 35-39), 2010 625 8.41 0.99 8.16 6.84 11.59Log (number of people with age 40-44), 2010 625 8.27 0.99 8.03 6.78 11.41Log (number of people with age 45-49), 2010 625 8.42 0.97 8.21 6.79 11.52Log (number of people with age 50 and older), 2010 625 9.93 0.97 9.71 8.27 13.08% with higher education, 2002 625 0.15 0.06 0.13 0.05 0.45% with higher education among age 20-24, 2010 625 0.18 0.06 0.17 0.05 0.37% with higher education among age 25-29, 2010 625 0.34 0.1 0.33 0.11 0.67% with higher education among age 30-34, 2010 625 0.31 0.1 0.3 0.12 0.67% with higher education among age 35-39, 2010 625 0.28 0.08 0.26 0.13 0.58% with higher education among age 40-44, 2010 625 0.25 0.08 0.23 0.12 0.6% with higher education among age 45-49, 2010 625 0.23 0.08 0.21 0.09 0.62% with higher education among age 50-54, 2010 625 0.17 0.07 0.15 0.07 0.55Presence of a university in a city, 2011 625 0.15 0.35 0 0 1Ethnic fractionalization, 2010 625 0.2 0.17 0.14 0.01 0.85
Standard deviation

Table A1 (cont’d). Summary statistics. Voting outcomes.Vote share for “Our Home – Russia” party, 1995 625 0.09 0.05 0.08 0.02 0.46Vote share for “Unity” party, 1999 625 0.25 0.1 0.25 0 0.56Vote share for “United Russia” party, 2003 625 0.36 0.1 0.34 0.16 0.92Vote share for “United Russia” party, 2007 625 0.63 0.1 0.61 0.42 1Vote share for “United Russia” party, 2011 625 0.45 0.17 0.4 0.18 0.99Vote share for “United Russia” party, 2016 625 0.49 0.15 0.44 0.26 0.97Vote share for Eltsin, 1996 625 0.33 0.12 0.31 0.1 0.7Vote share for Eltsin, 1996 (2nd round) 625 0.53 0.14 0.52 0.21 0.89Vote share for Putin, 2000 625 0.53 0.12 0.52 0.17 0.95Vote share for Putin, 2004 625 0.69 0.09 0.68 0.42 0.99Vote share for Medvedev, 2008 625 0.68 0.09 0.67 0.49 0.99Vote share for Putin, 2012 625 0.63 0.1 0.61 0.44 0.99Vote share for “Yabloko” party, 1995 625 0.06 0.04 0.05 0 0.23Vote share for “Yabloko” party, 1999 625 0.06 0.03 0.05 0 0.19Vote share for “Yabloko” party, 2003 625 0.04 0.02 0.04 0 0.14Vote share for Communist party, 1995 625 0.23 0.11 0.21 0.03 0.72Vote share for Communist party, 1999 625 0.25 0.08 0.24 0 0.51Vote share for Communist party, 2003 625 0.13 0.05 0.12 0 0.31Vote share for “LDPR” party, 1995 625 0.13 0.06 0.12 0 0.37Vote share for “LDPR” party, 1999 625 0.07 0.02 0.06 0 0.16Vote share for “LDPR” party, 2003 625 0.13 0.04 0.13 0 0.26Vote share for Yavlinsky, 1996 625 0.07 0.03 0.07 0.01 0.21Vote share for Yavlinsky, 2000 625 0.05 0.03 0.04 0 0.17Vote share for Hakamada, 2004 625 0.03 0.02 0.03 0 0.14Vote share for Zyuganov, 1996 625 0.32 0.14 0.31 0.05 0.83Vote share for Zyuganov, 1996 (2nd round) 625 0.41 0.14 0.42 0.06 0.76Vote share for Zyuganov, 2000 625 0.3 0.1 0.3 0.02 0.58Vote share for Haritonov, 2004 625 0.15 0.07 0.14 0 0.38Vote share for Lebed, 1996 625 0.16 0.06 0.15 0 0.39Vote share for Tuleev, 2000 625 0.04 0.09 0.02 0 0.6Vote share for Glaziev, 2004 625 0.04 0.03 0.04 0 0.28Vote share against all parties/candidates, 1995 625 0.03 0.01 0.03 0 0.07Vote share against all parties/candidates, 1996 625 0.02 0 0.02 0 0.04Vote share against all parties/candidates, 1996 (2nd round) 625 0.05 0.02 0.05 0 0.1Vote share against all parties/candidates, 1999 625 0.03 0.01 0.03 0 0.13Vote share against all parties/candidates, 2000 625 0.02 0.01 0.02 0 0.06Vote share against all parties/candidates, 2003 625 0.05 0.02 0.05 0 0.12Turnout, 1995 625 0.63 0.07 0.63 0.41 0.98Turnout, 1996 625 0.69 0.06 0.7 0.5 0.96
625 0.68 0.06 0.68 0.49 0.99Turnout, 1999 625 0.6 0.07 0.6 0.28 0.93Turnout, 2000 625 0.68 0.06 0.67 0.54 0.97Turnout, 2003 625 0.54 0.1 0.52 0.33 0.95Turnout, 2004 625 0.54 0.1 0.52 0.33 0.95
Turnout, 1996 (2nd round)

Table A2. Variable Means by Quartile of VK Penetration.VK users, share of population, Aug 2011
Q1 (lowest) Q2 Q3 Q4 (highest)Incidence of protests, Dec 2011 0.01 0.01 0.06 0.45Incidence of protests, USSR, 1987-1992 0.1 0.12 0.16 0.48Incidence of pro-democratic protests, USSR, 1987-1992 0.07 0.1 0.12 0.41Incidence of anti-monetization protests, 2005 0.06 0.12 0.16 0.42Incidence of labor protests, 1997-2000 0.63 0.56 0.51 0.73Log (number of protest participants), Dec 2011 0.06 0.04 0.32 2.66Log (number of protest participants), USSR, 1987-1992 0.77 0.78 1.01 3.08Log (number of participants in pro-democratic protests), USSR, 1987-1992 0.57 0.76 0.84 3.34Log (number of participants in anti-monetization protests), 2005 0.38 0.76 1.07 2.89Log (number of participants in labor protests), 1997-2000 3.98 3.23 3.1 4.91Log (number of VK users), June 2011 8.29 9.19 9.65 11.01Log (number of early VK users), Nov 2006 0 0.02 0.06 0.23Log (number of VK users), 2013 9.04 9.77 10.19 11.49Log (number of Odnoklassniki users), 2014 10.22 10.49 10.61 11.54Log (number of Facebook users), 2013 5.8 6.4 6.81 8.59Log (SPbSU students, same 5-year cohort as VK founder) 0.18 0.2 0.43 1.13Log (SPbSU students, one cohort younger than VK founder) 0.2 0.22 0.3 0.89Log (SPbSU students, one cohort older than VK founder) 0.16 0.2 0.36 1.01Internet penetration, region-level, 2011 0.23 0.29 0.28 0.26Population, in thousands, 2010 46.67 66.41 87.79 268.87Regional center 0.02 0.03 0.03 0.38Rayon center (county seat) 0.74 0.72 0.8 0.92Distance to Saint Petersburg, km 1711.24 1493.21 1435.87 1287.41Distance to Moscow, km 1423.68 1057.1 1081.88 1049.04Log (average wage), 2011 9.79 9.8 9.9 10.06Log (number of people with age 20-24), 2010 7.89 8.19 8.4 9.37Log (number of people with age 25-29), 2010 7.97 8.27 8.48 9.4Log (number of people with age 30-34), 2010 7.92 8.23 8.42 9.31Log (number of people with age 35-39), 2010 7.86 8.17 8.36 9.22Log (number of people with age 40-44), 2010 7.72 8.03 8.23 9.09Log (number of people with age 45-49), 2010 7.86 8.18 8.4 9.25Log (number of people with age 50 and older), 2010 9.38 9.76 9.9 10.69% with higher education, 2002 0.13 0.14 0.14 0.18% with higher education among age 20-24, 2010 0.16 0.17 0.18 0.2% with higher education among age 25-29, 2010 0.29 0.33 0.34 0.4% with higher education among age 30-34, 2010 0.26 0.3 0.31 0.38% with higher education among age 35-39, 2010 0.23 0.27 0.28 0.33% with higher education among age 40-44, 2010 0.22 0.24 0.25 0.3% with higher education among age 45-49, 2010 0.2 0.22 0.23 0.27% with higher education among age 50-54, 2010 0.15 0.16 0.17 0.21Presence of a university in a city, 2011 0.02 0.06 0.06 0.45Ethnic fractionalization, 2010 0.18 0.15 0.21 0.27

Table A2 (cont’d). Variable Means by Quartile of VK Penetration. Voting Outcomes.VK users, share of population, Aug 2011
Q1 (lowest) Q2 Q3 Q4 (highest)Vote share for “Our Home – Russia” party, 1995 0.08 0.08 0.1 0.12Vote share for “Unity” party, 1999 0.27 0.24 0.25 0.24Vote share for “United Russia” party, 2003 0.37 0.35 0.36 0.37Vote share for “United Russia” party, 2007 0.66 0.63 0.62 0.62Vote share for “United Russia” party, 2011 0.49 0.45 0.42 0.43Vote share for “United Russia” party, 2016 0.49 0.5 0.48 0.48Vote share for Eltsin, 1996 0.29 0.32 0.34 0.37Vote share for Eltsin, 1996 (2nd round) 0.48 0.51 0.53 0.58Vote share for Putin, 2000 0.52 0.51 0.53 0.55Vote share for Putin, 2004 0.68 0.67 0.68 0.71Vote share for Medvedev, 2008 0.68 0.67 0.68 0.69Vote share for Putin, 2012 0.65 0.64 0.62 0.62Vote share for “Yabloko” party, 1995 0.05 0.06 0.07 0.07Vote share for “Yabloko” party, 1999 0.05 0.06 0.06 0.07Vote share for “Yabloko” party, 2003 0.03 0.04 0.04 0.05Vote share for Communist party, 1995 0.26 0.24 0.22 0.19Vote share for Communist party, 1999 0.28 0.26 0.24 0.21Vote share for Communist party, 2003 0.15 0.14 0.13 0.11Vote share for “LDPR” party, 1995 0.14 0.13 0.12 0.1Vote share for “LDPR” party, 1999 0.07 0.06 0.07 0.06Vote share for “LDPR” party, 2003 0.14 0.13 0.13 0.12Vote share for Yavlinsky, 1996 0.06 0.06 0.07 0.09Vote share for Yavlinsky, 2000 0.04 0.05 0.05 0.06Vote share for Hakamada, 2004 0.03 0.03 0.03 0.04Vote share for Zyuganov, 1996 0.37 0.34 0.32 0.27Vote share for Zyuganov, 1996 (2nd round) 0.46 0.43 0.41 0.35Vote share for Zyuganov, 2000 0.33 0.31 0.29 0.27Vote share for Haritonov, 2004 0.16 0.16 0.14 0.12Vote share for Lebed, 1996 0.15 0.17 0.16 0.16Vote share for Tuleev, 2000 0.03 0.05 0.04 0.03Vote share for Glaziev, 2004 0.04 0.04 0.05 0.04Vote share against all parties/candidates, 1995 0.03 0.03 0.03 0.03Vote share against all parties/candidates, 1996 0.02 0.01 0.02 0.02Vote share against all parties/candidates, 1996 (2nd round) 0.05 0.05 0.05 0.06Vote share against all parties/candidates, 1999 0.03 0.03 0.03 0.03Vote share against all parties/candidates, 2000 0.01 0.02 0.02 0.02Vote share against all parties/candidates, 2003 0.04 0.05 0.05 0.05Turnout, 1995 0.63 0.64 0.64 0.62Turnout, 1996 0.69 0.69 0.7 0.69
0.68 0.68 0.69 0.68Turnout, 1999 0.6 0.59 0.61 0.61Turnout, 2000 0.68 0.67 0.68 0.68Turnout, 2003 0.53 0.52 0.54 0.56Turnout, 2004 0.53 0.52 0.54 0.56
Turnout, 1996 (2nd round)

Table A3. Distribution of size of SPbSU student cohorts
Frequency Frequency Frequency
0 389 0 404 0 4121 96 1 106 1 852 50 2 32 2 483 19 3 16 3 314 15 4 19 4 145 12 5 7 5 136 9 6 11 6 67 1 7 8 7 78 5 8 5 8 29 10 9 1 9 210 3 10 3 10 111 4 11 2 12 112 2 12 2 13 113 2 13 4 14 214 1 14 1 15 115 1 20 216 1 21 117 1 29 120 1 33 123 125 129 1
103 1
Table A4. Correlation Between City Ranks across CohortsCity Rank in # of SPbSU Students
In Durov's Cohort
One Cohort After Durov 1In Durov's Cohort 0.4217 1One Cohort Before Durov 0.3860 0.4645 1
Number of SPbSU students from a city
in VK founder's cohort
Number of SPbSU students from a city
one cohort older than VK founder
Number of SPbSU students from a city one cohort younger
than VK founder
Note: all the results in the paper are robust to exclusion of a city with 103 people in VK founder cohorts (if anything, results get stronger without this outlier).
One Cohort After Durov
One Cohort Before Durov
City Rank in # of SPbSU Students
Note: City rank is calculated with the highest value ranked 1 and no correction for ties.

Table A5. Determinants of Early VK Penetration.
Log (number of early VK users), Nov 2006
(1) (2) (3) (4) (5) (6) (7) (8)
Log (SPbSU students), same 5-year cohort as VK founder 0.0925*** 0.0523*** 0.0510*** 0.0517*** 0.0495** 0.0512*** 0.0485** 0.0504***[0.0206] [0.0191] [0.0190] [0.0182] [0.0193] [0.0186] [0.0193] [0.0189]
Log (SPbSU students), one cohort younger than VK founder 0.0756** 0.0147 0.0170 0.0194 0.0244 0.0275 0.0216 0.0246[0.0378] [0.0246] [0.0247] [0.0228] [0.0244] [0.0247] [0.0242] [0.0242]
Log (SPbSU students), one cohort older than VK founder 0.0343 -0.0152 -0.0113 -0.0071 -0.0116 -0.0142 -0.0134 -0.0148[0.0324] [0.0211] [0.0223] [0.0276] [0.0275] [0.0272] [0.0279] [0.0278]
Regional center -0.0806 -0.1068 -0.1348 -0.1195 -0.1285 -0.1431[0.0619] [0.0706] [0.0874] [0.0887] [0.0867] [0.0865]
Distance to Saint Petersburg, km 0.0001 0.0001 0.0001 0.0001 0.0000[0.0000] [0.0001] [0.0001] [0.0001] [0.0001]
Distance to Moscow, km -0.0000 -0.0000 -0.0000 -0.0000 -0.0000[0.0000] [0.0000] [0.0000] [0.0001] [0.0000]
Rayon center (county seat) -0.0132 -0.0088 -0.0146 -0.0170 -0.0076[0.0131] [0.0120] [0.0138] [0.0124] [0.0131]
Log (average wage), city-level, 2011 0.0523 0.0365 0.0036 0.0183 0.0503[0.0323] [0.0315] [0.0309] [0.0302] [0.0341]
Presence of a university in a city, 2011 0.0951 0.1034 0.0959 0.1009[0.0631] [0.0635] [0.0615] [0.0630]
Internet penetration, region-level, 2011 0.0341 0.0241 0.0201 0.0243[0.0456] [0.0440] [0.0473] [0.0468]
Log (number of Odnoklassniki users), 2014 -0.0194 -0.0051 -0.0102 -0.0093[0.0200] [0.0181] [0.0213] [0.0198]
Ethnic fractionalization, 2010 -0.0862 -0.0740 -0.0814 -0.0841[0.0816] [0.0880] [0.0806] [0.0784]
Observations 625 625 625 625 625 625 625 625R-squared 0.1805 0.5159 0.5185 0.5333 0.5387 0.5470 0.5427 0.5452Mean of the dependent variable 0.076 0.076 0.076 0.076 0.076 0.076 0.076 0.076SD of the dependent variable 0.301 0.301 0.301 0.301 0.301 0.301 0.301 0.301Population controls Yes Yes Yes Yes Yes Yes YesAge cohort controls Yes Yes Yes Yes YesEducation controls Yes Yes Yes Yes Yes*Electoral controls, 1995 Yes Electoral controls, 1999 YesElectoral controls, 2003 Yes*p-value for equality of coefficients for three cohorts 0.298 0.113 0.175 0.288 0.220 0.163 0.215 0.178p-value for equality of coefficients of Durov's and younger cohort 0.726 0.313 0.364 0.354 0.495 0.508 0.460 0.478p-value for equality of coefficients of Durov's and older cohort 0.122 0.050* 0.080* 0.117 0.099* 0.068* 0.093* 0.077**** p<0.01, ** p<0.05, * p<0.1. Robust standard errors in brackets are adjusted by clusters within regions. Unit of observation is a city. Logarithm of any variable is calculated with 1 added inside. When "Yes" is added to indicate inclusion of a group of controls, a significance level is reported immediately after for this group of controls. Flexible controls for population (5th polynomial) are included in all specifications. Age cohort controls include the number of people aged 20-24, 25-29, 30-34, 35-39, 40-44, 45-49, 50 and older years, in each city according to 2010 Russian Census. Education controls include the share of population with higher education overall according to 2002 Russian Census and separately in each of the age cohorts according to 2010 Russian Census, to account for both the levels and the change in education. Electoral controls include vote for Yabloko party, Communist Party (KPRF), LDPR party, the ruling party (Our Home is Russia in 1995, Unity in 1999, United Russia in 2003), and electoral turnout for a corresponding year.

Table A6. VK penetration and protest participation in 2011 (spatial standard errors).
Incidence of protests, dummy, Dec 2011 Log (number of protesters), Dec 2011IV IV IV IV IV IV IV IV(1) (2) (3) (4) (1) (2) (3) (4)
Log (number of VK users), June 2011 0.466** 0.451** 0.458** 0.479** 1.911** 1.872** 1.894** 2.013**[0.200] [0.190] [0.190] [0.202] [0.924] [0.872] [0.872] [0.889]
Log (SPbSU students), one cohort younger than VK founder 0.027 0.026 0.028 0.030 0.216* 0.209* 0.213* 0.230*[0.023] [0.022] [0.022] [0.022] [0.117] [0.115] [0.119] [0.119]
Log (SPbSU students), one cohort older than VK founder -0.033 -0.029 -0.028 -0.026 -0.141 -0.127 -0.124 -0.115[0.025] [0.025] [0.024] [0.025] [0.151] [0.145] [0.135] [0.144]
Population controls Yes*** Yes*** Yes*** Yes*** Yes*** Yes*** Yes*** Yes***Age cohort controls Yes Yes Yes* Yes*** Yes*** Yes Yes YesEducation controls Yes Yes** Yes* Yes** Yes*** Yes*** Yes Yes***Other controls Yes*** Yes*** Yes*** Yes*** Yes*** Yes*** Yes*** Yes***Electoral controls, 1995 Yes YesElectoral controls, 1999 Yes*** YesElectoral controls, 2003 Yes*** Yes**Observations 625 625 625 625 625 625 625 625Kleibergen-Paap F-stat 9.597 9.730 11.604 9.843 9.597 9.730 11.604 9.843*** p<0.01, ** p<0.05, * p<0.1. Standard errors in brackets are adjusted for spatial correlations as in Konig, Rohner, Thoenig, and Zilibotti (2017). Unit of observation is a city. Logarithm of any variable is calculated with 1 added inside. When "Yes" is added to indicate inclusion of a group of controls, a significance level is reported immediately after for this group of controls. Flexible controls for population (5th polynomial) are included in all specifications. Age cohort controls include the number of people aged 20-24, 25-29, 30-34, 35-39, 40-44, 45-49, 50 and older years, in each city according to 2010 Russian Census. Education controls include the share of population with higher education overall according to 2002 Russian Census and separately in each of the age cohorts according to 2010 Russian Census, to account for both the levels and the change in education. Electoral controls include vote for Yabloko party, Communist Party (KPRF), LDPR party, the ruling party (Our Home is Russia in 1995, Unity in 1999, United Russia in 2003), and electoral turnout for a corresponding year. Other controls include dummy for regional and county centers, distances to Moscow and St Petersburg, log (average wage), share of people with higher education in 2002, internet penetration in 2011, log (Odnoklassniki users in 2014).

Table A7. IV Probit and Negative Binomial Models.Incidence of protests, dummy, Dec 2011 Number of protesters in ‘000s, Dec 2011
IV Probit IV Probit IV Probit IV Probit IV Neg Bin IV Neg Bin IV Neg Bin IV Neg Bin(1) (2) (3) (4) (5) (6) (7) (8)
Log (number of VK users), June 2011 0.055* 0.063** 0.062** 0.171** 2.343** 2.580*** 2.899*** 2.729**[0.030] [0.025] [0.026] [0.077] [0.975] [0.959] [0.918] [1.112]
Log (SPbSU students), one cohort younger than VK founder 0.008 0.005 0.009 0.066*** 0.356*** 0.369*** 0.509*** 0.392***[0.007] [0.009] [0.009] [0.023] [0.101] [0.104] [0.124] [0.118]
Log (SPbSU students), one cohort older than VK founder -0.020* -0.024** -0.035*** -0.038*** -0.310 -0.369* -0.564*** -0.365[0.011] [0.010] [0.011] [0.012] [0.224] [0.218] [0.186] [0.223]
Population controls Yes Yes Yes Yes Yes Yes Yes YesAge cohort controls Yes Yes Yes Yes Yes Yes Yes YesEducation controls Yes Yes Yes Yes Yes Yes Yes YesOther controls Yes Yes Yes Yes Yes Yes Yes YesElectoral controls, 1995 Yes YesElectoral controls, 1999 Yes YesElectoral controls, 2003 Yes YesObservations 625 625 625 625 625 625 625 625*** p<0.01, ** p<0.05, * p<0.1. Standard errors in Columns (1)-(4) are clustered at the region level. Standard errors in Columns (5)-(8) are obtained with a bootstrap procedure. The IV negative binomial model in Columns (5)-(8) is estimated using a control function approach. Unit of observation is a city. Logarithm of any variable is calculated with 1 added inside. "Yes" indicates inclusion of a group of controls. Flexible controls for population (5th polynomial) are included in all specifications. Age cohort controls include the number of people aged 20-24, 25-29, 30-34, 35-39, 40-44, 45-49, 50 and older years, in each city according to 2010 Russian Census. Education controls include the share of population with higher education overall according to 2002 Russian Census and separately in each of the age cohorts according to 2010 Russian Census, to account for both the levels and the change in education. Electoral controls include vote for Yabloko party, Communist Party (KPRF), LDPR party, the ruling party (Our Home is Russia in 1995, Unity in 1999, United Russia in 2003), and electoral turnout for a corresponding year. Other controls include dummy for regional and county centers, distances to Moscow and St Petersburg, log (average wage), share of people with higher education in 2002, internet penetration in 2011, log (Odnoklassniki users in 2014).

Table A8. Weak IV Robust Confidence Intervals. Panel A. Protest Participation
Incidence of protests, Dec 2011 Log (# of protesters), Dec 2011IV IV IV IV IV IV IV IV(1) (2) (3) (4) (5) (6) (7) (8)
Log (number of VK users), June 2011 0.466** 0.428*** 0.459*** 0.466*** 1.911** 1.787** 1.900** 1.951**[0.189] [0.161] [0.176] [0.174] [0.924] [0.809] [0.872] [0.866]
95% CIs Robust to Weak IV
Chernozhukov and Hansen (2008) (0.19; 1.58) (0.19; 1.45) (0.20; 1.31) (0.22; 1.45) (0.33; 6.61) (0.37; 6.07) (0.38; 5.61) (0.50; 6.18)Finlay and Magnusson (2009) (0.20; 1.77) (0.20; 1.56) (0.20; 1.44) (0.20; 1.53) (0.23; 7.31) (0.29; 6.56) (0.29; 6.10) (0.41; 6.46)
Mikusheva (2010) (0.22; 1.13) (0.22; 1.03) (0.22; 1.04) (0.24; 1.08) (0.70; 4.68) (0.71; 4.37) (0.75; 4.36) (0.84; 4.59)
Baseline controls Yes Yes Yes Yes Yes Yes Yes YesElectoral controls, 1995 Yes YesElectoral controls, 1999 Yes YesElectoral controls, 2003 Yes YesObservations 625 625 625 625 625 625 625 625
Panel B. Pro-Government VotingVoting share for United Russia, 2011 Voting Share for Putin, 2012
IV IV IV IV IV IV IV IV(1) (2) (3) (4) (5) (6) (7) (8)
Log (number of VK users), June 2011 0.257* 0.217* 0.259* 0.198 0.152* 0.144* 0.155* 0.114[0.152] [0.131] [0.147] [0.128] [0.088] [0.085] [0.084] [0.073]
95% CIs Robust to Weak IV
Chernozhukov and Hansen (2008) (0.06; 1.27) (0.04; 1.02) (0.07; 1.11) (0.03; 0.96) (0.04; 0.73) (0.03; 0.67) (0.05; 0.63) (0.02; 0.55)
Finlay and Magnusson (2009) (0.05; 1.41) (0.05; 1.11) (0.05; 1.20) (0.03; 1.02) (0.05; 0.81) (0.02; 0.72) (0.05; 0.69) (0.02; 0.57)Mikusheva (2010) (0.07; 0.74) (0.08; 0.66) (0.08; 0.66) (0.04; 0.56) (0.04; 0.43) (0.04; 0.38) (0.05; 0.39) (0.02; 0.32)
Baseline controls Yes Yes Yes Yes Yes Yes Yes YesElectoral controls, 1995 Yes YesElectoral controls, 1999 Yes YesElectoral controls, 2003 Yes YesObservations 625 625 625 625 625 625 625 625*** p<0.01, ** p<0.05, * p<0.1. Robust standard errors in brackets are adjusted for clusters within regions. Unit of observation is a city. Logarithm of any variable is calculated with 1 added inside. When "Yes" is added to indicate inclusion of a group of controls, a significance level is reported immediately after for this group of controls. Flexible controls for population (5th polynomial) are included in all specifications. Age cohort controls include the number of people aged 20-24, 25-29, 30-34, 35-39, 40-44, 45-49, 50 and older years, in each city according to 2010 Russian Census. Education controls include the share of population with higher education overall according to 2002 Russian Census and separately in each of the age cohorts according to 2010 Russian Census, to account for both the levels and the change in education. Electoral controls include vote for Yabloko party, Communist Party (KPRF), LDPR party, the ruling party (Our Home is Russia in 1995, Unity in 1999, United Russia in 2003), and electoral turnout for a corresponding year. Other controls include dummy for regional and county centers, distances to Moscow and St Petersburg, log (average wage), share of people with higher education in 2002, internet penetration in 2011, log (Odnoklassniki users in 2014).

Table A9. Threshold Model. Protest Participation as a Function of VK Penetration.PANEL A. Threshold model with VK penetration as a share of city population
Incidence of protests, dummy, Dec 2011 Log (number of protesters), Dec 2011NLS NLS NLS NLS NLS NLS NLS NLS(1) (2) (3) (4) (1) (2) (3) (4)
Share of city population with VK accounts, before the threshold -0.027 -0.067 -0.053 0.020 -0.126 -0.534 -0.265 0.029(0.144) (0.152) (0.145) (0.148) (0.713) (0.658) (0.723) (0.770)
Share of city population with VK accounts, extra effect after the threshold 0.549** 0.607** 0.554** 0.510** 3.629*** 4.055*** 3.648*** 3.480***(0.190) (0.203) (0.185) (0.190) (0.975) (0.972) (0.951) (0.983)
Threshold, share of city population with VK accounts 0.233*** 0.233*** 0.233*** 0.231*** 0.251*** 0.239*** 0.251*** 0.250***(0.0446) (0.0425) (0.0460) (0.0466) (0.0358) (0.0279) (0.0356) (0.0363)
PANEL B. Threshold model with VK penetration as a share of city populationIncidence of protests, dummy, Dec 2011 Log (number of protesters), Dec 2011NLS NLS NLS NLS NLS NLS NLS NLS(1) (2) (3) (4) (1) (2) (3) (4)
Share of city population with VK accounts, before the threshold 0.0265* 0.0227 0.0212 0.0293* 0.158* 0.135 0.128 0.171*(0.0126) (0.0134) (0.0126) (0.0131) (0.0761) (0.0817) (0.0783) (0.0801)
Share of city population with VK accounts, extra effect after the threshold 0.227** 0.232** 0.223** 0.233** 1.757*** 1.786*** 1.740*** 1.785***(0.0780) (0.0776) (0.0752) (0.0754) (0.430) (0.427) (0.419) (0.419)
Threshold, share of city population with VK accounts 10.07*** 10.07*** 10.05*** 10.04*** 10.29*** 10.30*** 10.29*** 10.29***(0.176) (0.174) (0.179) (0.162) (0.148) (0.149) (0.151) (0.147)
Population controls Yes Yes Yes Yes Yes Yes Yes YesAge cohort controls Yes Yes Yes Yes Yes Yes Yes YesEducation controls Yes Yes Yes Yes Yes Yes Yes YesOther controls Yes Yes Yes Yes Yes Yes Yes YesElectoral controls, 1995 Yes YesElectoral controls, 1999 Yes YesElectoral controls, 2003 Yes YesObservations 625 625 625 625 625 625 625 625*** p<0.01, ** p<0.05, * p<0.1. Standard errors in brackets are clustered at the region level. Threshold model is estimated using non-linear least squares. Unit of observation is a city. Logarithm of any variable is calculated with 1 added inside. "Yes" indicates inclusion of a group of controls. Flexible controls for population (5th polynomial) are included in all specifications. Age cohort controls include the number of people aged 20-24, 25-29, 30-34, 35-39, 40-44, 45-49, 50 and older years, in each city according to 2010 Russian Census. Education controls include the share of population with higher education overall according to 2002 Russian Census and separately in each of the age cohorts according to 2010 Russian Census, to account for both the levels and the change in education. Electoral controls include vote for Yabloko party, Communist Party (KPRF), LDPR party, the ruling party (Our Home is Russia in 1995, Unity in 1999, United Russia in 2003), and electoral turnout for a corresponding year. Other controls include dummy for regional and county centers, distances to Moscow and St Petersburg, log (average wage), share of people with higher education in 2002, internet penetration in 2011, log (Odnoklassniki users in 2014).

Table A10. VK penetration, Turnout, and Invalid VotesTurnout, % 2007 Invalid Ballots, % 2007
IV IV IV IV IV IV IV IV
(1) (2) (3) (4) (5) (6) (7) (8)
Log (number of VK users), June 2011 -11.390* -11.835** -7.741 -13.133** -0.217 -0.210 -0.225 -0.134[6.190] [5.241] [5.009] [5.480] [0.229] [0.190] [0.199] [0.199]
Log (SPbSU students), one cohort younger than VK founder -1.164 -0.739 -1.172 -0.703 -0.045 -0.044 -0.042 -0.041[0.983] [0.784] [0.828] [0.866] [0.035] [0.032] [0.034] [0.032]
Log (SPbSU students), one cohort older than VK founder 0.878 0.773 0.177 0.444 0.003 0.012 0.011 0.004[1.066] [1.084] [0.929] [0.959] [0.031] [0.028] [0.031] [0.027]
Turnout, % 2008 Invalid Ballots, 2008
IV IV IV IV IV IV IV IV
Log (number of VK users), June 2011 8.121 3.826 9.061 4.994 -1.144 -1.198* -1.266* -1.111
[8.243] [6.749] [7.326] [6.442] [0.706] [0.688] [0.746] [0.708]
Log (SPbSU students), one cohort younger than VK founder 0.030 0.280 0.175 0.305 -0.046-0.013
-0.049 -0.043[1.094] [0.857] [1.069] [0.930] [0.057] [0.058] [0.062] [0.056]
Log (SPbSU students), one cohort older than VK founder -1.606* -1.100 -1.671* -1.585** 0.082 0.097 0.080 0.059
[0.960] [0.759] [0.895] [0.806] [0.096] [0.098] [0.095] [0.084]Turnout, % 2011 Invalid Ballots, 2011
IV IV IV IV IV IV IV IVLog (number of VK users), June 2011 5.581 2.249 6.292 2.920 -0.683** -0.602*** -0.595** -0.588**
[8.282] [6.670] [7.619] [6.775] [0.276] [0.218] [0.254] [0.243]
Log (SPbSU students), one cohort younger than VK founder -0.404 -0.086 -0.494 0.065 -0.023 -0.013 -0.016 -0.022[1.097] [0.941] [1.085] [0.944] [0.047] [0.047] [0.048] [0.044]
Log (SPbSU students), one cohort older than VK founder 0.987 1.231 0.603 0.615 0.024 0.018 0.020 0.015[1.139] [0.982] [1.073] [1.005] [0.052] [0.046] [0.044] [0.044]
Turnout, % 2012 Invalid Ballots, 2012
IV IV IV IV IV IV IV IVLog (number of VK users), June 2011 -1.248 -3.273 -0.832 -2.767 -0.418** -0.358** -0.408** -0.316*
[6.302] [5.506] [5.796] [5.060] [0.211] [0.166] [0.189] [0.165]
Log (SPbSU students), one cohort younger than VK founder -0.747-0.389
-0.774 -0.421 -0.008-0.002
-0.008 -0.004
[0.938] [0.799] [0.884] [0.849] [0.023] [0.021] [0.024] [0.020]
Log (SPbSU students), one cohort older than VK founder 1.034 1.175 0.739 0.690 0.002 0.000 0.002 -0.001[0.974] [0.934] [0.948] [0.851] [0.030] [0.026] [0.028] [0.024]
Turnout, % 2016 Invalid Ballots, 2016
IV IV IV IV IV IV IV IVLog (number of VK users), June 2011 12.608 6.478 13.106 5.595 -0.154 -0.089 -0.161 0.006
[10.785] [8.760] [9.745] [7.182] [0.274] [0.236] [0.245] [0.215]
Log (SPbSU students), one cohort younger than VK founder -0.833 -0.234 -0.560 -0.558 0.011 0.000 0.009 0.010[1.576] [1.203] [1.448] [1.195] [0.034] [0.031] [0.031] [0.028]
Log (SPbSU students), one cohort older than VK founder 1.281 1.759 1.014 0.806 -0.009 -0.005 0.003 0.005[1.360] [1.190] [1.301] [1.034] [0.032] [0.029] [0.032] [0.030]
Other controls Yes Yes Yes Yes Yes Yes Yes YesElectoral controls, 1995 Yes YesElectoral controls, 1999 Yes YesElectoral controls, 2003 Yes YesObservations 625 625 625 625 625 625 625 625Kleibergen-Paap F-stat 6.554 6.779 7.591 7.031 6.554 6.779 7.591 7.031Effective F-statistics (Olea Montiel and Pflueger 2013) 10.97 12.03 12.30 12.17 10.97 12.03 12.30 12.17*** p<0.01, ** p<0.05, * p<0.1. Robust standard errors in brackets are adjusted by clusters within regions. Unit of observation is a city. Logarithm of any variable is calculated with 1 added inside. When "Yes" is added to indicate inclusion of a group of controls, a significance level is reported immediately after for this group of controls. Flexible controls for population (5th polynomial) are included in all specifications. Age cohort controls include the number of people aged 20-24, 25-29, 30-34, 35-39, 40-44, 45-49, 50 and older years, in each city according to 2010 Russian Census. Education controls include the share of population with higher education overall according to 2002 Russian Census and separately in each of the age cohorts according to 2010 Russian Census, to account for both the levels and the change in education. Electoral controls include vote for Yabloko party, Communist Party (KPRF), LDPR party, the ruling party (Our Home is Russia in 1995, Unity in 1999, United Russia in 2003), and electoral turnout for a corresponding year. Other controls include dummy for regional and county centers, distances to Moscow and St Petersburg, log (average wage), share of people with higher education in 2002, internet penetration in 2011, log (Odnoklassniki users in 2014).

Table A11. VK and penetration of OdnoklassnikiLog (number of Odnoklassniki users), 2014
(1) (2) (3) (4) (5) (6) (7) (8)
Log (early VK users, from first 5,000 users) -0.042[0.059]
Log (early VK users, from first 50,000 users) -0.045[0.034]
Log (early VK users, from first 100,000 users) -0.024[0.037]
Log (number of VK users), June 2011 0.074[0.074]
Log (SPbSU students), same 5-year cohort as VK founder 0.028 0.018 0.015 0.017[0.048] [0.045] [0.043] [0.045]
Log (SPbSU students), one cohort younger than VK founder 0.084 0.072 0.073 0.068[0.052] [0.050] [0.052] [0.051]
Log (SPbSU students), one cohort older than VK founder -0.049 -0.032 -0.034 -0.028[0.043] [0.042] [0.042] [0.040]
Regional center 0.259** 0.269** 0.267** 0.252** 0.261** 0.228** 0.256** 0.254**[0.123] [0.119] [0.119] [0.115] [0.116] [0.110] [0.111] [0.110]
Distance to Saint Petersburg, km 0.001*** 0.001*** 0.001*** 0.001*** 0.001*** 0.001*** 0.001*** 0.001***[0.000] [0.000] [0.000] [0.000] [0.000] [0.000] [0.000] [0.000]
Distance to Moscow, km -0.000*** -0.000*** -0.000*** -0.000*** -0.000*** -0.001*** -0.001*** -0.001***[0.000] [0.000] [0.000] [0.000] [0.000] [0.000] [0.000] [0.000]
Rayon center (county seat) 0.053 0.051 0.053 0.054 0.046 0.071 0.073 0.067[0.077] [0.078] [0.078] [0.075] [0.078] [0.083] [0.086] [0.077]
Log (average wage), city-level, 2011 0.111 0.115 0.115 0.104 0.124 0.250** 0.205** 0.181*[0.106] [0.105] [0.106] [0.105] [0.104] [0.097] [0.100] [0.104]
Presence of a university in a city, 2011 0.029 0.042 0.035 0.011 0.026 -0.011 -0.029 -0.015[0.097] [0.098] [0.097] [0.097] [0.095] [0.088] [0.082] [0.087]
Internet penetration, region-level, 2011 -0.479** -0.469** -0.467** -0.492** -0.471** -0.354* -0.287 -0.354*[0.204] [0.204] [0.205] [0.211] [0.203] [0.197] [0.185] [0.197]
Ethnic fractionalization, 2010 -0.231 -0.237 -0.231 -0.261 -0.259 -0.205 -0.247 -0.303**[0.166] [0.167] [0.167] [0.162] [0.168] [0.162] [0.163] [0.151]
Population controls Yes** Yes** Yes** Yes** Yes** Yes** Yes** Yes**Age cohort controls Yes*** Yes*** Yes*** Yes*** Yes*** Yes*** Yes*** Yes***Education controls Yes*** Yes*** Yes*** Yes*** Yes*** Yes*** Yes*** Yes***Observations 625 625 625 625 625 625 625 625R-squared 0.892 0.892 0.892 0.892 0.893 0.899 0.903 0.902*** p<0.01, ** p<0.05, * p<0.1. Robust standard errors in brackets are adjusted by clusters within regions. Unit of observation is a city. Logarithm of any variable is calculated with 1 added inside. When "Yes" is added to indicate inclusion of a group of controls, a significance level is reported immediately after for this group of controls. Flexible controls for population (5th polynomial) are included in all specifications. Age cohort controls include the number of people aged 20-24, 25-29, 30-34, 35-39, 40-44, 45-49, 50 and older years, in each city according to 2010 Russian Census. Education controls include the share of population with higher education overall according to 2002 Russian Census and separately in each of the age cohorts according to 2010 Russian Census, to account for both the levels and the change in education. Results in columns (1)-(4) are robust to inclusion of electoral controls, but corresponding specifications are not shown to save space.

Table A12. Online protest communities and protest participation. OLS estimates.Log (number of protesters), Dec 2011 Incidence of protests, dummy, Dec 2011(1) (2) (3) (4) (5) (6) (7) (8)
Log (# of members in VK protest community in a city) 0.121** 0.120** 0.119** 0.121** 0.030*** 0.030*** 0.030*** 0.030***[0.050] [0.050] [0.050] [0.050] [0.009] [0.009] [0.009] [0.009]
Observations 625 625 625 625 625 625 625 625R-squared 0.824 0.827 0.829 0.826 0.783 0.786 0.787 0.786Population controls Yes*** Yes*** Yes*** Yes*** Yes*** Yes*** Yes*** Yes***Age cohort controls Yes Yes Yes* Yes Yes** Yes** Yes** Yes**Education controls Yes Yes Yes Yes Yes Yes Yes YesElectoral controls, 1995 Yes** Yes*Electoral controls, 1999 Yes** YesElectoral controls, 2003 Yes* Yes***** p<0.01, ** p<0.05, * p<0.1. Robust standard errors in brackets are adjusted by clusters within regions. Unit of observation is a city. Logarithm of any variable is calculated with 1 added inside. When "Yes" is added to indicate inclusion of a group of controls, a significance level is reported immediately after for this group of controls. Flexible controls for population (5th polynomial) are included in all specifications. Age cohort controls include the number of people aged 20-24, 25-29, 30-34, 35-39, 40-44, 45-49, 50 and older years, in each city according to 2010 Russian Census. Education controls include the share of population with higher education overall according to 2002 Russian Census and separately in each of the age cohorts according to 2010 Russian Census, to account for both the levels and the change in education. Electoral controls include vote for Yabloko party, Communist Party (KPRF), LDPR party, the ruling party (Our Home is Russia in 1995, Unity in 1999, United Russia in 2003), and electoral turnout for a corresponding year. Other controls include dummy for regional and county centers , distances to Moscow and St Petersburg, log (average wage), share of people with higher education in 2002, internet penetration in 2011, log (Odnoklassniki users in 2014).

Table A13. Robustness of Fractionalization Results to Partial OverlapPanel A. Network fractionalization and the incidence of protests (in cities with population > 100,000).
Incidence of protests, dummy, Dec 2011% of FB users who have a VK account 0% 10% 20% 30% 40% 50% 60% 70% 80% 90%
(1) (2) (3) (4) (5) (6) (7) (8) (9) (10)Fractionalization of social media networks (Facebook+VK) -0.983** -0.851** -0.703** -0.561** -0.439** -0.341* -0.267* -0.211* -0.172* -0.158*
[0.435] [0.380] [0.322] [0.266] [0.217] [0.174] [0.139] [0.111] [0.090] [0.081]Log (number of users in both networks) 0.072 0.096 0.119 0.137 0.151 0.160 0.166 0.170 0.171 0.171
[0.122] [0.119] [0.117] [0.117] [0.117] [0.117] [0.118] [0.118] [0.118] [0.118]Population, Age cohorts, Education, and Other controls Yes Yes Yes Yes Yes Yes Yes Yes Yes YesObservations 158 158 158 158 158 158 158 158 158 158R-squared 0.768 0.768 0.767 0.766 0.765 0.765 0.764 0.764 0.764 0.763
Panel B. Network fractionalization and protest participation (in cities with population > 100,000).Log (number of protesters), Dec 2011
% of FB users who have a VK account 0% 10% 20% 30% 40% 50% 60% 70% 80% 90%(1) (2) (3) (4) (5) (6) (7) (8) (9) (10)
Fractionalization of social media networks (Facebook+VK) -4.797** -4.209** -3.518** -2.834** -2.233** -1.742* -1.356* -1.062* -0.847* -0.746[2.140] [1.864] [1.589] [1.335] [1.108] [0.910] [0.741] [0.602] [0.497] [0.454]
Log (number of users in both networks) 1.233** 1.348** 1.457** 1.548*** 1.616*** 1.663*** 1.694*** 1.712*** 1.719*** 1.717***[0.618] [0.599] [0.585] [0.578] [0.575] [0.575] [0.576] [0.577] [0.578] [0.578]
Population, Age cohorts, Education, and Other controls Yes Yes Yes Yes Yes Yes Yes Yes Yes YesObservations 158 158 158 158 158 158 158 158 158 158R-squared 0.821 0.821 0.820 0.820 0.820 0.819 0.819 0.819 0.818 0.818*** p<0.01, ** p<0.05, * p<0.1. Standard errors in brackets are adjusted for clusters within regions. Unit of observation is a city. Logarithm of any variable is calculated with 1 added inside. Only cities with population greater than 100,000 are in the sample. "Yes" is added to indicate inclusion of a group of controls. Flexible controls for population (5th polynomial) are included in all specifications. Age cohort controls include the number of people aged 20-24, 25-29, 30-34, 35-39, 40-44, 45-49, 50 and older years, in each city according to 2010 Russian Census. Education controls include the share of population with higher education overall according to 2002 Russian Census and separately in each of the age cohorts according to 2010 Russian Census, to account for both the levels and the change in education. Electoral controls include vote for Yabloko party, Communist Party (KPRF), LDPR party, the ruling party (Our Home is Russia in 1995, Unity in 1999, United Russia in 2003), and electoral turnout for a corresponding year. Other controls include dummy for regional and county centers, distances to Moscow and St Petersburg, log (average wage), share of people with higher education in 2002, internet penetration in 2011, log (Odnoklassniki users in 2014).

Table A14. Fractionalization of Networks and Protest Participation.Panel A. Network fractionalization and the incidence of protest
Incidence of protests, dummy, Dec 2011Whole sample Cities with more than 100 000 inhabitants
Fractionalization of social media networks (Facebook+Vkontakte) -0.727*** -0.726*** -0.712*** -0.742*** -0.992** -0.948** -0.948** -1.079**[0.239] [0.238] [0.233] [0.233] [0.440] [0.416] [0.416] [0.434]
Log (number of FB users), predicted, 2011 -0.037 -0.034 -0.043 -0.065 -0.033 -0.019 -0.038 -0.067[0.052] [0.052] [0.053] [0.050] [0.118] [0.123] [0.121] [0.110]
Log (number of VK users), 2011 0.135*** 0.132*** 0.128*** 0.143*** 0.077 0.083 0.107 0.145*[0.033] [0.032] [0.033] [0.032] [0.077] [0.074] [0.080] [0.083]
Population, Age cohorts, Education, and Other controls Yes*** Yes*** Yes*** Yes*** Yes Yes Yes YesElectoral controls, 1995 Yes* YesElectoral controls, 1999 Yes Yes*Electoral controls, 2003 Yes*** YesObservations 625 625 625 625 158 158 158 158R-squared 0.785 0.788 0.788 0.789 0.769 0.788 0.787 0.794
Panel B. Network fractionalization and protest participation.Log (number of protesters), Dec 2011
Whole sample Cities with more than 100 000 inhabitants(1) (2) (3) (4) (5) (6) (7) (8)
Fractionalization of social media networks (Facebook+Vkontakte) -4.734*** -4.730*** -4.647*** -4.792*** -6.380*** -6.435*** -6.229*** -6.876***[1.183] [1.186] [1.155] [1.168] [2.073] [2.059] [1.980] [2.025]
Log (number of FB users), predicted, 2011 0.293 0.306 0.261 0.177 0.296 0.316 0.247 0.098[0.298] [0.303] [0.309] [0.302] [0.644] [0.731] [0.662] [0.626]
Log (number of VK users), 2011 0.839*** 0.819*** 0.801*** 0.866*** 0.782* 0.762* 1.004** 1.080**[0.160] [0.158] [0.162] [0.160] [0.412] [0.388] [0.412] [0.453]
Population, Age cohorts, Education, and Other controls Yes*** Yes*** Yes*** Yes*** Yes Yes Yes YesElectoral controls, 1995 Yes YesElectoral controls, 1999 Yes Yes***Electoral controls, 2003 Yes* YesObservations 625 625 625 625 158 158 158 158R-squared 0.837 0.839 0.840 0.839 0.822 0.836 0.839 0.838*** p<0.01, ** p<0.05, * p<0.1. Robust standard errors in brackets are adjusted by clusters within regions. Unit of observation is a city. Logarithm of any variable is calculated with 1 added inside. When "Yes" is added to indicate inclusion of a group of controls, a significance level is reported immediately after for this group of controls. Flexible controls for population (5th polynomial) are included in all specifications. Age cohort controls include the number of people aged 20-24, 25-29, 30-34, 35-39, 40-44, 45-49, 50 and older years, in each city according to 2010 Russian Census. Education controls include the share of population with higher education overall according to 2002 Russian Census and separately in each of the age cohorts according to 2010 Russian Census, to account for both the levels and the change in education. Electoral controls include vote for Yabloko party, Communist Party (KPRF), LDPR party, the ruling party (Our Home is Russia in 1995, Unity in 1999, United Russia in 2003), and electoral turnout for a corresponding year. Other controls include dummy for regional and county centers, distances to Moscow and St Petersburg, log (average wage), share of people with higher education in 2002, internet penetration in 2011, log (Odnoklassniki users in 2014).

Table A15. Heterogeneity of the VK penetration effect on protests.Log (number of protesters), Dec 2011
(1) (2) (3) (4) (5) (6)
Log (number of VK users), June 2011 1.252 2.021** 0.144 3.843** 0.139 4.448[1.602] [0.995] [1.830] [1.558] [0.210] [2.789]
Log (SPbSU students), one cohort younger than VK founder 0.031 0.314** 0.152 -0.076 -0.032 0.117[0.159] [0.158] [0.141] [0.335] [0.049] [0.275]
Log (SPbSU students), one cohort older than VK founder -0.094 -0.210 0.213 -0.675* -0.040 -0.348[0.171] [0.210] [0.237] [0.362] [0.045] [0.344]
Population controls Yes** Yes*** Yes*** Yes*** Yes*** Yes***Age cohort controls Yes Yes Yes Yes Yes YesEducation controls Yes Yes Yes*** Yes Yes YesObservations 315 310 231 231 313 312Effective F-statistics (Olea Montiel and Pflueger 2013) 3.753 6.492 1.333 6.918 9.959 2.527
Wage lower than
median
Wage higher than
median
Trust lower than
median
Trust higher than
median
Education lower than
median
Education higher than
median
*** p<0.01, ** p<0.05, * p<0.1. Robust standard errors in brackets are adjusted by clusters within regions. Unit of observation is a city. Logarithm of any variable is calculated with 1 added inside. Specification is the same as Table 4A, column (1) (only baseline controls included). When "Yes" is added to indicate inclusion of a group of controls, a significance level is reported immediately after for this group of controls. Flexible controls for population (5th polynomial) are included in all specifications. Education controls include the share of population with higher education overall according to 2002 Russian Census and separately in each of the age cohorts according to 2010 Russian Census, to account for both the levels and the change in education. Other controls include dummy for regional and county centers, distances to Moscow and St Petersburg, log (average wage), internet penetration in 2011, log (Odnoklassniki users in 2014).

Table A16. Baseline Results with Alternative Cohort Definitions.Incidence of protests, dummy, Dec 2011
IV IV IV IV IV IV IV IV IV IV IV IV IV IV IV(1) (2) (3) (4) (5) (6) (7) (8) (9) (10) (11) (12) (13) (14) (15)
Cohort Definition (-1,+2) (-1,+3) (-1,+4) (-2,+1) (-2,+2) (-2,+3) (-2,+4) (-3,+1) (-3,+2) (-3,+3) (-3,+4) (-4,+1) (-4,+2) (-4,+3) (-4,+4)
Log (number of VK users), June 2011 0.687* 0.385* 0.579* 0.547** 0.466** 0.357** 0.415** 0.562* 0.535** 0.365* 0.381** 0.452* 0.442* 0.269 0.374**[0.383] [0.210] [0.312] [0.241] [0.189] [0.171] [0.173] [0.312] [0.239] [0.201] [0.188] [0.261] [0.229] [0.174] [0.187]
Log (SPbSU students), one cohort younger than VK founder -0.006 0.008 0.015 0.033 0.027 0.023 0.029 0.016 0.023 0.028 0.047** 0.036 0.054** 0.044** 0.054***[0.031] [0.020] [0.025] [0.026] [0.024] [0.021] [0.020] [0.027] [0.023] [0.019] [0.018] [0.024] [0.022] [0.019] [0.019]
Log (SPbSU students), one cohort older than VK founder -0.036 -0.008 -0.063 -0.041 -0.033 -0.024 -0.043 -0.028 -0.042 -0.026 -0.039 -0.025 -0.047 -0.016 -0.042[0.044] [0.030] [0.044] [0.037] [0.031] [0.029] [0.030] [0.040] [0.036] [0.032] [0.032] [0.036] [0.036] [0.028] [0.033]
Observations 625 625 625 625 625 625 625 625 625 625 625 625 625 625 625Mean of the dependent variable 0.134 0.134 0.134 0.134 0.134 0.134 0.134 0.134 0.134 0.134 0.134 0.134 0.134 0.134 0.134SD of the dependent variable 0.341 0.341 0.341 0.341 0.341 0.341 0.341 0.341 0.341 0.341 0.341 0.341 0.341 0.341 0.341Population controls Yes Yes Yes Yes Yes Yes Yes Yes Yes Yes Yes Yes Yes Yes YesAge cohort controls Yes Yes Yes Yes Yes Yes Yes Yes Yes Yes Yes Yes Yes Yes YesEducation controls Yes Yes Yes Yes Yes Yes Yes Yes Yes Yes Yes Yes Yes Yes YesOther controls Yes Yes Yes Yes Yes Yes Yes Yes Yes Yes Yes Yes Yes Yes YesKleibergen-Paap F-stat 2.882 4.838 3.351 5.097 6.554 7.062 8.492 3.211 5.183 5.801 6.960 3.979 4.902 5.806 6.375Effective F-statistics (Olea Montiel and Pflueger 2013) 4.788 7.585 3.720 6.439 10.97 10.18 9.354 4.053 8.045 8.399 7.588 5.365 7.559 9.094 6.817*** p<0.01, ** p<0.05, * p<0.1. Standard errors in brackets are adjusted by clusters within regions. Cohort definition changes across columns according to the following rule: (-x, +y) means that VK founder cohort is defined as all SpbSU graduates who were born x years earlier or y years later than VK founder. A cohort younger and a cohort older are defined with the same length. Unit of observation is a city. Logarithm of any variable is calculated with 1 added inside. When "Yes" is added to indicate inclusion of a group of controls, a significance level is reported immediately after for this group of controls. Flexible controls for population (5th polynomial) are included in all specifications. Age cohort controls include the number of people aged 20-24, 25-29, 30-34, 35-39, 40-44, 45-49, 50 and older years, in each city according to 2010 Russian Census. Education controls include the share of population with higher education overall according to 2002 Russian Census and separately in each of the age cohorts according to 2010 Russian Census, to account for both the levels and the change in education. Electoral controls include vote for Yabloko party, Communist Party (KPRF), LDPR party, the ruling party (Our Home is Russia in 1995, Unity in 1999, United Russia in 2003), and electoral turnout for a corresponding year. Other controls include dummy for regional and county centers, distances to Moscow and St Petersburg, log (average wage), share of people with higher education in 2002, internet penetration in 2011, log (Odnoklassniki users in 2014).

Table A17. Baseline Results with Cohorts Defined Based on Starting Year of Study at SpbSU.Incidence of protests, dummy, Dec 2011 Log (number of protesters), Dec 2011IV IV IV IV IV IV IV IV(1) (2) (3) (4) (5) (6) (7) (8)
Log (number of VK users), June 2011 0.513** 0.496*** 0.494** 0.542*** 2.087** 2.036** 1.970** 2.225**[0.199] [0.188] [0.195] [0.197] [1.017] [0.973] [0.989] [1.008]
Log (SPbSU students), one cohort younger than VK founder 0.054* 0.053* 0.056** 0.055* 0.365*** 0.364*** 0.377*** 0.381***[0.029] [0.029] [0.028] [0.029] [0.140] [0.138] [0.136] [0.138]
Log (SPbSU students), one cohort older than VK founder -0.070* -0.065* -0.064* -0.063* -0.333* -0.318* -0.307* -0.312**[0.036] [0.034] [0.033] [0.034] [0.172] [0.164] [0.157] [0.159]
Population controls Yes*** Yes*** Yes*** Yes*** Yes*** Yes*** Yes*** Yes***Age cohort controls Yes Yes Yes Yes Yes Yes Yes YesEducation controls Yes* Yes** Yes** Yes* Yes Yes Yes YesOther controls Yes Yes Yes Yes Yes Yes Yes YesElectoral controls, 1995 Yes YesElectoral controls, 1999 Yes YesElectoral controls, 2003 Yes* YesObservations 625 625 625 625 625 625 625 625Kleibergen-Paap F-stat 9.819 11.28 10.15 10.25 9.819 11.28 10.15 10.25Effective F-statistics (Olea Montiel and Pflueger 2013) 9.536 10.46 9.559 9.807 9.536 10.46 9.559 9.807*** p<0.01, ** p<0.05, * p<0.1. Standard errors in brackets are adjusted by clusters within regions. The VK founder’s cohort includes all SPbSU students in our sample who started studying at SPbSU at some point from 2000 to 2004. A cohort younger and a cohort older are defined accordingly with the same length. Unit of observation is a city. Logarithm of any variable is calculated with 1 added inside. When "Yes" is added to indicate inclusion of a group of controls, a significance level is reported immediately after for this group of controls. Flexible controls for population (5th polynomial) are included in all specifications. Age cohort controls include the number of people aged 20-24, 25-29, 30-34, 35-39, 40-44, 45-49, 50 and older years, in each city according to 2010 Russian Census. Education controls include the share of population with higher education overall according to 2002 Russian Census and separately in each of the age cohorts according to 2010 Russian Census, to account for both the levels and the change in education. Electoral controls include vote for Yabloko party, Communist Party (KPRF), LDPR party, the ruling party (Our Home is Russia in 1995, Unity in 1999, United Russia in 2003), and electoral turnout for a corresponding year. Other controls include dummy for regional and county centers, distances to Moscow and St Petersburg, log (average wage), share of people with higher education in 2002, internet penetration in 2011, log (Odnoklassniki users in 2014).

Table A18. Data Description and SourcesVariable Description
Number of VK users in 2013
Number of VK users in 2011
Protest participation in December 2011
The number of people in a given city participating in protests against electoral fraud in December 10-16, 2011, i.e., during the first wave of massive protests after the legislative elections of December 4, 2011. Data were gathered manually from open sources on the Internet. Where possible, three estimates of the number of protest participants were collected - an estimate from the Ministry of Internal Affairs, an estimate from the activists themselves, and an estimate from journalists. Whenever more than one estimate was present, an average estimate was used. See Table A19 for all of our collected data.
Incidence of protests in December 2011
1 = at least one protest occurred in a city in December 10-16, 2011; 0 = no protests that week
Protest participation in USSR in 1987-1992
The number of people who participated in protests in the USSR in 1987-1992. Data were obtained from Mark Beissenger's website (http://www.princeton.edu/~mbeissin/research1.htm). This variable does not distinguish between different protest agendas ― e.g., pro-democratic and pro-communist protests are treated equally. For protests with more than one estimate, an average number of participants was taken. For cities with multiple protests during that period, we use median participation.
Incidence of protests in USSR in 1987-1992
1 = at least one protest occurred in the city in 1987-1992, regardless of the protest’s agenda; 0 = no protests occurred in 1987-1992
Participation in pro-democratic protests in USSR in 1987-1992
The number of people who participated in anti-Soviet or pro-democratic protests in the USSR in 1987-1992. Data were obtained from Mark Beissenger's website (http://www.princeton.edu/~mbeissin/research1.htm). We identified 75 various demands in the dataset which we considered either anti-Soviet or pro-democratic. Examples of such demands are "Against Communist Party Privileges", "Decentralize Economic Administration", "Democratization of Political institutions", etc. A full list of anti-Soviet/pro-democratic demands is available upon request. For protests with more than one estimate of participation, an average number of participants was taken. For cities with multiple protests during that period, we use median participation.
Incidence of pro-democratic protests in USSR in 1987-1992
1 = at least one anti-Soviet or pro-democratic protest occurred in the city in 1987-1992; 0 = no anti-Soviet or pro-democratic protests occurred in 1987-1992
The number of registered VK users living in a given city, as of 2013. Manually collected data.
The number of valid and active VK users in 2011, who picked a given city as their hometown. By "valid,” we mean “not blocked.” By "active," we mean that they were seen online at least once between June 21 and July 7, 2011. Data were collected by a professional programmer. Full description of the gathering process can be found at http://habrahabr.ru/post/123856/ (in Russian).
Number of early 5,000 VK users
The number of VK users with id<5,000, who picked a given city as their hometown. In other words, those were the first 5,000 users ever registered in VK. They were registered within less than a month in November 2006.
Number of Odnoklassniki users in 2014
Number of all registered Odnoklassniki users living in a given city, as of 2014. Manually collected data.

Distance to Saint Petersburg Spherical distance from a given city to Saint Petersburg, in km
Distance to Moscow Spherical distance from a given city to Moscow, in km
Administrative center
Average wage in 2011 Data gathered from Russian Federal State Statistics Service.
Presence of university
Number of Facebook users in 2013
Number of all registered Facebook users living in a given city, as of 2013. Manually collected data.
Population in 2001, in thousands
Collected from mojgorod.ru, which in turn stores data collected from Russian Federal State Statistics Service.
1 = city is the administrative center of its region; 0 = not. Data collected from Wikipedia.
Rayon center (county seat, dummy)
1 = city is the administrative center of its district (rayon); 0 = not. Data collected from Wikipedia.
Number of people with age xx-xx in 2010
Data gathered from Russian Federal State Statistics Service. Based on Russian census in 2010.
1 = city has at least one university; 0 = not. Data collected from Wikipedia.
Percentage with higher education in 2010
Percentage of adults with at least one university degree. Data gathered from Russian Federal State Statistics Service. Based on Russian census in 2010.
Internet penetration in 2011, region-level
Number of unique users in a region divided by its population according to the 2010 census. Data collected from liveinternet.com
Number of SPbSU students, same 5-year cohort as VK founder
Number of Odnoklassniki users who studied in Saint Petersburg State University in classes of 2004-2008, i.e. in the same age 5-year cohort together with Pavel Durov, former CEO of VK. Data manually collected from OK.ru.
Number of SPbSU students, one cohort younger than VK founder
Number of Odnoklassniki users who studied in Saint Petersburg State University in classes of 1999-2003, i.e. one 5-year cohort earlier than Pavel Durov, former CEO of VK. Data manually collected from OK.ru.
Number of SPbSU students, one cohort older than VK founder
Number of Odnoklassniki users who studied in Saint Petersburg State University in classes of 2009-2013, i.e. one 5-year cohort after Pavel Durov, former CEO of VK. Data manually collected from OK.ru.

Table A19. Data on Protest Participation across Russian Cities
Date City OKATO
12/10/2011 Barnaul 01401 300 1500 . 900
12/10/2011 Krasnodar 03401 250 1500 1000 917
12/10/2011 Anapa 03403 . 500 . 500
12/10/2011 Sochi 03426 150 300 . 22512/10/2011 Krasnoyarsk 04401 400 4000 . 2,200
12/10/2011 Vladivostok 05401 150 1000 . 575
12/11/2011 Stavropol 07401 . . 30 30
12/10/2011 Pyatigorsk 07427 150 300 300 250
12/10/2011 Khabarovsk 08401 70 150 . 11012/10/2011 Komsomolsk-on-Amur 08409 80 100 430 203
12/10/2011 Blagoveshchensk 10401 . 50 . 50
12/10/2011 Arkhangelsk 11401 . 3000 2000 2,500
12/10/2011 Belgorod 14401 100 . . 100
12/10/2011 Stary Oskol 14440 . . 30 3012/10/2011 Bryansk 15401 300 1000 . 650
12/10/2011 Vladimir 17401 . . 300 300
12/10/2011 Volgograd 18401 1000 2000 . 1,500
12/10/2011 Vologda 19401 500 1300 1000 933
12/11/2011 Cherepovets 19430 . . 300 30012/10/2011 Voronezh 20401 300 1500 1000 933
12/10/2011 Nizhny Novgorod 22401 500 2000 . 1,250
12/10/2011 Ivanovo 24401 250 400 . 325
12/10/2011 Irkutsk 25401 400 1000 . 700
12/10/2011 Angarsk 25405 15 60 30 35
12/10/2011 Bratsk 25414 . . 150 15012/10/2011 Kaliningrad 27401 200 500 . 350
12/10/2011 Tver 28401 400 500 . 450
12/10/2011 Kaluga 29401 . . 250 250
12/10/2011 Obninsk 29415 50 300 . 175
12/10/2011 Kemerovo 32401 200 500 400 36712/10/2011 Novokuznetsk 32431 . 50 . 50
12/10/2011 Kostroma 34401 50 200 . 125
12/10/2011 Samara 36401 900 5000 . 2,950
12/10/2011 Tolyatti 36440 . . 1000 1,000
12/10/2011 Mound 37401 . 100 . 10012/10/2011 Kursk 38401 . . 100 100
12/10/2011 Vyborg 41417 . 300 . 300
12/10/2011 Lipetsk 42401 . 300 . 300
12/10/2011 Murmansk 47401 500 1500 . 1,000
12/10/2011 Velikiy Novgorod 49401 . 400 200 300
12/10/2011 Novosibirsk 50401 3500 8000 . 5,75012/10/2011 Omsk 52401 1000 2500 2000 1,833
12/10/2011 Orenburg 53401 . 300 . 300
12/11/2011 Orsk 53423 . . 300 300
12/10/2011 Orel 54401 300 700 . 500
12/10/2011 Penza 56401 300 500 . 40012/11/2011 Permian 57401 850 3000 . 1,925
12/10/2011 Pskov 58401 . . 600 600
12/10/2011 Rostov-na-Donu 60401 250 700 500 483
12/10/2011 Volgodonsk 60412 . . 10 10
12/10/2011 Taganrog 60437 . . 200 20012/10/2011 Ryazan 61401 . 500 . 500
12/10/2011 Saratov 63401 200 1000 . 600
12/10/2011 Balakovo 63407 200 200 . 200
12/10/2011 Yuzhno-Sakhalinsk 64401 . 70 . 70
12/10/2011 Ekaterinburg 65401 1500 10000 5000 5,50012/10/2011 Kachkanar 65448 . . 50 50
12/10/2011 Nizhny Tagil 65476 . . 150 150
12/10/2011 Smolensk 66401 . . 200 200
12/10/2011 Tambov 68401 150 250 . 200
12/10/2011 Tomsk 69401 1500 4000 2000 2,500
12/10/2011 Tula 70401 250 500 . 37512/10/2011 Khanty-Mansiysk* 71131 . . 3 3
# according to police
# according to organizers
# according to journalists
Average # of protesters

Table A19 (cont’d). Data on Protest Participation across Russian Cities
Date City OKATO
12/10/2011 Nizhnevartovsk 71135 . . 50 50
12/10/2011 Surgut 71136 . . 250 250
12/10/2011 Tyumen 71401 . 1500 . 1,500
12/10/2011 Ulyanovsk 73401 400 1500 1000 96712/10/2011 Chelyabinsk 75401 1000 3000 . 2,000
12/10/2011 Magnitogorsk 75438 . . 500 500
12/10/2011 Chita 76401 100 200 . 150
12/10/2011 Yaroslavl 78401 650 2000 1000 1,217
12/10/2011 Ufa 80401 200 1000 500 56712/10/2011 Sterlitamak 80445 . . 250 250
12/10/2011 Ulan-Ude 81401 50 100 . 75
12/10/2011 Makhachkala 82401 . 25 . 25
12/10/2011 Gorno-Altaisk 84401 . 50 . 50
12/10/2011 Petrozavodsk 86401 300 600 400 43312/10/2011 Syktyvkar 87401 250 500 . 375
12/10/2011 Yoshkar-Ola 88401 . . 400 400
12/10/2011 Kazan 92401 500 1000 . 750
12/10/2011 Naberezhnye Chelny 92430 . 350 150 250
12/10/2011 Izhevsk 94401 . 500 . 50012/10/2011 Abakan 95401 . 100 . 100
12/10/2011 Cheboksary 97401 230 420 300 317
# according to police
# according to organizers
# according to journalists
Average # of protesters
* Removing this small-scale protest from our sample does not change our results. For geographic distribution of protests across Russian territory, see Figure A2. Sources include, but are not limited to, an independent business newspaper Kommersant, a government owned new agency RIA Novosti, and an opposition-leaning independent online newspaper Ridus, various regional newspapers, etc. OKATO is the official all-Russian classifier of cities and other populated localities.