Social Influence Analysis in Large-scale...
9
Social Influence Analysis in Large-scale Networks Jie Tang Dept. of Computer Science Tsinghua University, China [email protected] Jimeng Sun IBM TJ Watson Research Center, USA [email protected] Chi Wang and Zi Yang Dept. of Computer Science Tsinghua University, China [email protected] [email protected] ABSTRACT In large social networks, nodes (users, entities) are influenced by others for various reasons. For example, the colleagues have strong influence on one’s work, while the friends have strong influence on one’s daily life. How to differentiate the social influences from dif- ferent angles(topics)? How to quantify the strength of those social influences? How to estimate the model on real large networks? To address these fundamental questions, we propose Topical Affin- ity Propagation (TAP) to model the topic-level social influence on large networks. In particular, TAP can take results of any topic modeling and the existing network structure to perform topic-level influence propagation. With the help of the influence analysis, we present several important applications on real data sets such as 1) what are the representative nodes on a given topic? 2) how to iden- tify the social influences of neighboring nodes on a particular node? To scale to real large networks, TAP is designed with efficient distributed learning algorithms that is implemented and tested un- der the Map-Reduce framework. We further present the common characteristics of distributed learning algorithms for Map-Reduce. Finally, we demonstrate the effectiveness and efficiency of TAP on real large data sets. Categories and Subject Descriptors H.3.3 [Information Search and Retrieval]: Text Mining; H.2.8 [Database Management]: Database Applications General Terms Algorithms, Experimentation Keywords Social Influence Analysis, Topical Affinity Propagation, Large-scale Network, Social Networks 1. INTRODUCTION With the emergence and rapid proliferation of social applications and media, such as instant messaging (e.g., IRC, AIM, MSN, Jab- ber, Skype), sharing sites (e.g., Flickr, Picassa, YouTube, Plaxo), Permission to make digital or hard copies of all or part of this work for personal or classroom use is granted without fee provided that copies are not made or distributed for profit or commercial advantage and that copies bear this notice and the full citation on the first page. To copy otherwise, to republish, to post on servers or to redistribute to lists, requires prior specific permission and/or a fee. KDD’09, June 28–July 1, 2009, Paris, France. Copyright 2009 ACM 978-1-60558-495-9/09/06 ...$5.00. blogs (e.g., Blogger, WordPress, LiveJournal), wikis (e.g., Wikipedia, PBWiki), microblogs (e.g., Twitter, Jaiku), social networks (e.g., MySpace, Facebook, Ning), collaboration networks (e.g., DBLP) to mention a few, there is little doubt that social influence is becom- ing a prevalent, complex and subtle force that governs the dynamics of all social networks. Therefore, there is a clear need for methods and techniques to analyze and quantify the social influences. Social network analysis often focus on macro-level models such as degree distributions, diameter, clustering coefficient, communi- ties, small world effect, preferential attachment, etc; work in this area includes [1, 11, 19, 23]. Recently, social influence study has started to attract more attention due to many important applications. However, most of the works on this area present qualitative findings about social influences[14, 16]. In this paper, we focus on measur- ing the strength of topic-level social influence quantitatively. With the proposed social influence analysis, many important questions can be answered such as 1) what are the representative nodes on a given topic? 2) how to identify topic-level experts and their so- cial influence to a particular node? 3) how to quickly connect to a particular node through strong social ties? Motivating Application Several theories in sociology [14, 16] show that the effect of the social influence from different angles (topics) may be different. For example, in research community, such influences are well-known. Most researchers are influenced by others in terms of collaboration and citations. The most important information in the research com- munity are 1) co-author networks, which capture the social dynam- ics of the community, 2) their publications, which imply the topic distribution (interests) of the authors. The key question is how to quantify the influence among researchers by leveraging these two pieces. In Figure 1, the left figure illustrates the input: a co-author net- work of 7 researchers, and the topic distribution of each researcher. For example, George has the same probability (.5) on both topics, “data mining” and “database”; The right figure shows the output of our social influence analysis: two social influence graphs, one for each topic, where the arrows indicate the direction and strength. We see, Ada is the key person on “data mining”, while Eve is the key person on “database”. Thus, the goal is how to effectively and effi- ciently obtain the social influence graphs for real large networks. Challenges and Contributions The challenges of computing social influence graphs are the fol- lowing: • Multi-aspect. Social influences are associated with different topics. E.g., A can have high influence to B on a particular topic, but B may have a higher influence to A on another topic. It is important to be able to differentiate those influ- ences from multiple aspects. 807
Transcript of Social Influence Analysis in Large-scale...
Social Influence Analysis in Large-scale Networks
Jie TangDept. of Computer ScienceTsinghua University, China
Jimeng SunIBM TJ Watson Research
Center, [email protected]
Chi Wang and Zi YangDept. of Computer ScienceTsinghua University, [email protected]
ABSTRACTIn large social networks, nodes (users, entities) are influenced byothers for various reasons. For example, the colleagues have stronginfluence on one’s work, while the friends have strong influence onone’s daily life. How to differentiate the social influences from dif-ferent angles(topics)? How to quantify the strength of those socialinfluences? How to estimate the model on real large networks?
To address these fundamental questions, we propose Topical Affin-ity Propagation (TAP) to model the topic-level social influence onlarge networks. In particular, TAP can take results of any topicmodeling and the existing network structure to perform topic-levelinfluence propagation. With the help of the influence analysis, wepresent several important applications on real data sets such as 1)what are the representative nodes on a given topic? 2) how to iden-tify the social influences of neighboring nodes on a particular node?
To scale to real large networks, TAP is designed with efficientdistributed learning algorithms that is implemented and tested un-der the Map-Reduce framework. We further present the commoncharacteristics of distributed learning algorithms for Map-Reduce.Finally, we demonstrate the effectiveness and efficiency of TAP onreal large data sets.
Categories and Subject DescriptorsH.3.3 [Information Search and Retrieval]: Text Mining; H.2.8[Database Management]: Database Applications
General TermsAlgorithms, Experimentation
KeywordsSocial Influence Analysis, Topical Affinity Propagation, Large-scaleNetwork, Social Networks
1. INTRODUCTIONWith the emergence and rapid proliferation of social applications
and media, such as instant messaging (e.g., IRC, AIM, MSN, Jab-ber, Skype), sharing sites (e.g., Flickr, Picassa, YouTube, Plaxo),
Permission to make digital or hard copies of all or part of this work forpersonal or classroom use is granted without fee provided that copies arenot made or distributed for profit or commercial advantage and that copiesbear this notice and the full citation on the first page. To copy otherwise, torepublish, to post on servers or to redistribute to lists, requires prior specificpermission and/or a fee.KDD’09, June 28–July 1, 2009, Paris, France.Copyright 2009 ACM 978-1-60558-495-9/09/06 ...$5.00.
blogs (e.g., Blogger, WordPress, LiveJournal), wikis (e.g., Wikipedia,PBWiki), microblogs (e.g., Twitter, Jaiku), social networks (e.g.,MySpace, Facebook, Ning), collaboration networks (e.g., DBLP)to mention a few, there is little doubt that social influence is becom-ing a prevalent, complex and subtle force that governs the dynamicsof all social networks. Therefore, there is a clear need for methodsand techniques to analyze and quantify the social influences.
Social network analysis often focus on macro-level models suchas degree distributions, diameter, clustering coefficient, communi-ties, small world effect, preferential attachment, etc; work in thisarea includes [1, 11, 19, 23]. Recently, social influence study hasstarted to attract more attention due to many important applications.However, most of the works on this area present qualitative findingsabout social influences[14, 16]. In this paper, we focus on measur-ing the strength of topic-level social influence quantitatively. Withthe proposed social influence analysis, many important questionscan be answered such as 1) what are the representative nodes ona given topic? 2) how to identify topic-level experts and their so-cial influence to a particular node? 3) how to quickly connect to aparticular node through strong social ties?Motivating Application
Several theories in sociology [14, 16] show that the effect of thesocial influence from different angles (topics) may be different. Forexample, in research community, such influences are well-known.Most researchers are influenced by others in terms of collaborationand citations. The most important information in the research com-munity are 1) co-author networks, which capture the social dynam-ics of the community, 2) their publications, which imply the topicdistribution (interests) of the authors. The key question is how toquantify the influence among researchers by leveraging these twopieces.
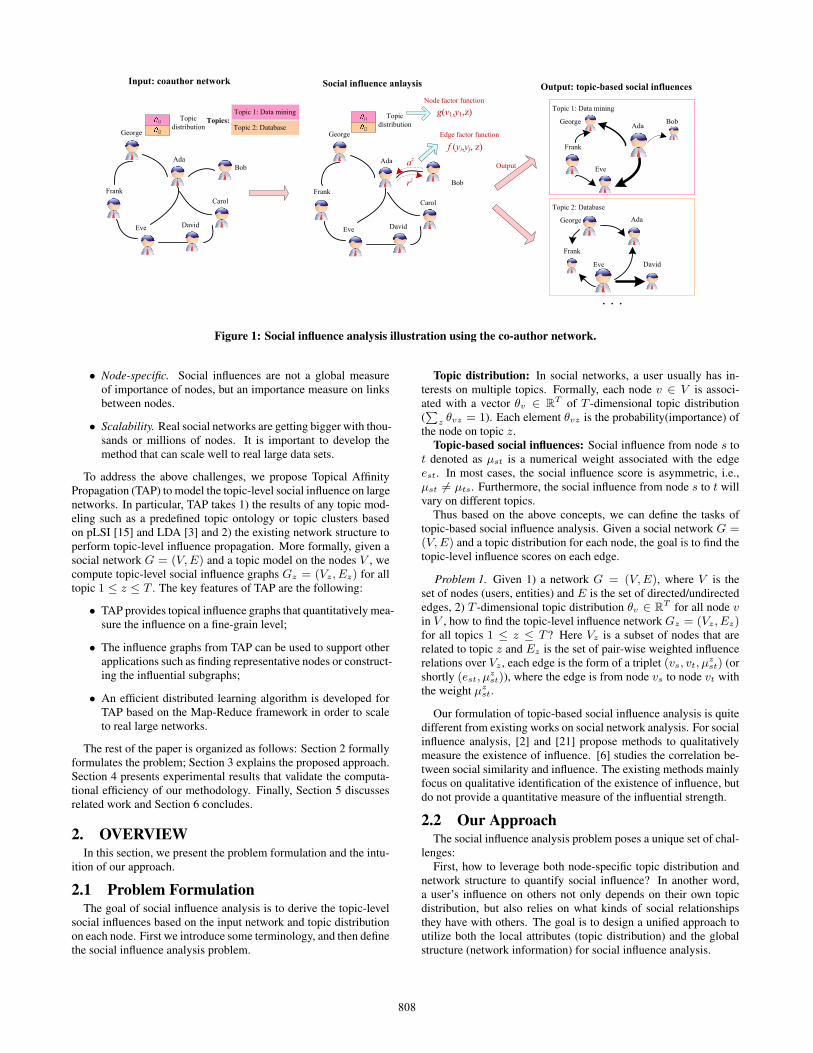
In Figure 1, the left figure illustrates the input: a co-author net-work of 7 researchers, and the topic distribution of each researcher.For example, George has the same probability (.5) on both topics,“data mining” and “database”; The right figure shows the output ofour social influence analysis: two social influence graphs, one foreach topic, where the arrows indicate the direction and strength. Wesee, Ada is the key person on “data mining”, while Eve is the keyperson on “database”. Thus, the goal is how to effectively and effi-ciently obtain the social influence graphs for real large networks.Challenges and Contributions
The challenges of computing social influence graphs are the fol-lowing:
• Multi-aspect. Social influences are associated with differenttopics. E.g., A can have high influence to B on a particulartopic, but B may have a higher influence to A on anothertopic. It is important to be able to differentiate those influ-ences from multiple aspects.
807
Ada
Frank
Eve David
Carol
Bob
George
Input: coauthor network
Ada
Frank
Eve David
Carol
George
Social influence anlaysis�i1�i2
Topic
distribution
g(v1,y1,z)�i1�i2
Topic
distribution
Node factor function
f (yi,yj, z)
Edge factor function
rz
az
Output: topic-based social influences
Topic 1: Data mining
Topic 2: DatabaseTopics:
Bob
Output
Ada
Frank
Eve
BobGeorge
Topic 1: Data mining
Ada
Frank
Eve David
George
Topic 2: Database
. . .
Figure 1: Social influence analysis illustration using the co-author network.
• Node-specific. Social influences are not a global measureof importance of nodes, but an importance measure on linksbetween nodes.
• Scalability. Real social networks are getting bigger with thou-sands or millions of nodes. It is important to develop themethod that can scale well to real large data sets.
To address the above challenges, we propose Topical AffinityPropagation (TAP) to model the topic-level social influence on largenetworks. In particular, TAP takes 1) the results of any topic mod-eling such as a predefined topic ontology or topic clusters basedon pLSI [15] and LDA [3] and 2) the existing network structure toperform topic-level influence propagation. More formally, given asocial network G = (V, E) and a topic model on the nodes V , wecompute topic-level social influence graphs Gz = (Vz, Ez) for alltopic 1 ≤ z ≤ T . The key features of TAP are the following:
• TAP provides topical influence graphs that quantitatively mea-sure the influence on a fine-grain level;
• The influence graphs from TAP can be used to support otherapplications such as finding representative nodes or construct-ing the influential subgraphs;
• An efficient distributed learning algorithm is developed forTAP based on the Map-Reduce framework in order to scaleto real large networks.
The rest of the paper is organized as follows: Section 2 formallyformulates the problem; Section 3 explains the proposed approach.Section 4 presents experimental results that validate the computa-tional efficiency of our methodology. Finally, Section 5 discussesrelated work and Section 6 concludes.
2. OVERVIEWIn this section, we present the problem formulation and the intu-
ition of our approach.
2.1 Problem FormulationThe goal of social influence analysis is to derive the topic-level
social influences based on the input network and topic distributionon each node. First we introduce some terminology, and then definethe social influence analysis problem.
Topic distribution: In social networks, a user usually has in-terests on multiple topics. Formally, each node v ∈ V is associ-ated with a vector θv ∈ RT of T -dimensional topic distribution(∑
z θvz = 1). Each element θvz is the probability(importance) ofthe node on topic z.
Topic-based social influences: Social influence from node s tot denoted as µst is a numerical weight associated with the edgeest. In most cases, the social influence score is asymmetric, i.e.,µst 6= µts. Furthermore, the social influence from node s to t willvary on different topics.
Thus based on the above concepts, we can define the tasks oftopic-based social influence analysis. Given a social network G =(V, E) and a topic distribution for each node, the goal is to find thetopic-level influence scores on each edge.
Problem 1. Given 1) a network G = (V, E), where V is theset of nodes (users, entities) and E is the set of directed/undirectededges, 2) T -dimensional topic distribution θv ∈ RT for all node vin V , how to find the topic-level influence network Gz = (Vz, Ez)for all topics 1 ≤ z ≤ T ? Here Vz is a subset of nodes that arerelated to topic z and Ez is the set of pair-wise weighted influencerelations over Vz , each edge is the form of a triplet (vs, vt, µ
zst) (or
shortly (est, µzst)), where the edge is from node vs to node vt with
the weight µzst.
Our formulation of topic-based social influence analysis is quitedifferent from existing works on social network analysis. For socialinfluence analysis, [2] and [21] propose methods to qualitativelymeasure the existence of influence. [6] studies the correlation be-tween social similarity and influence. The existing methods mainlyfocus on qualitative identification of the existence of influence, butdo not provide a quantitative measure of the influential strength.
2.2 Our ApproachThe social influence analysis problem poses a unique set of chal-
lenges:First, how to leverage both node-specific topic distribution and
network structure to quantify social influence? In another word,a user’s influence on others not only depends on their own topicdistribution, but also relies on what kinds of social relationshipsthey have with others. The goal is to design a unified approach toutilize both the local attributes (topic distribution) and the globalstructure (network information) for social influence analysis.
808
Second, how to scale the proposed analysis to a real large so-cial network? For example, the academic community of ComputerScience has more than 1 million researchers and more than 10 mil-lion coauthor relations; Facebook has more than 50 millions usersand hundreds of millions of different social ties. How to efficientlyidentify the topic-based influential strength for each social tie isreally a challenging problem.
Next we discuss the data input and the main intuition of the pro-posed method.Data Input:
Two inputs are required to our social influence analysis: 1) net-works and 2) topic distribution on all nodes.
The first input is the network backbone obtained by any socialnetworks, such as online social networks like Facebook and MyS-pace.
The second input is the topic distribution for all nodes. In gen-eral, the topic information can be obtained in many different ways.For example, in a social network, one can use the predefined cat-egories as the topic information, or use user-assigned tags as thetopic information. In addition, we can use statistical topic model-ing [3, 15, 18] to automatically extract topics from the social net-working data. In this paper, we use the topic modeling approach toinitialize the topic distribution of each node.Topical Affinity Propagation (TAP):
Based on the input network and topic distribution on the nodes,we formalize the social influence problem in a topical factor graphmodel and propose a topical affinity propagation on the factor graphto automatically identify the topic-specific social influence.
Our main idea is to leverage an affinity propagation at the topic-level for social influence identification. The approach is based onthe theory of factor graph [17], in which the observation data arecohesive on both local attributes and relationships. In our setting,the node corresponds to the observation data in the factor graphand the social relationship corresponds to edge between the obser-vation data in the graph. Finally, we propose two different propaga-tion rules: one based on message passing on graphical models, theother one is a parallel update rule that is suitable for Map-Reduceframework.
3. TOPICAL AFFINITY PROPAGATIONThe goal of topic-based social influence analysis is to capture
the following information: nodes’ topic distributions, similaritybetween nodes, and network structure. In addition, the approachhas to be able to scale up to a large scale network. Following thisthread, we first propose a Topical Factor Graph (TFG) model toincorporate all the information into a unified probabilistic model.Second, we propose Topical Affinity Propagation (TAP) for modellearning. Third, we discuss how to do distributed learning in theMap-Reduce framework. Finally, we illustrate several applicationsbased on the results of social influence analysis.
3.1 Topical Factor Graph (TFG) ModelNow we formally define the proposed TFG model.
Variables The TFG model has the following components: a set ofobserved variables {vi}N
i=1 and a set of hidden vectors {yi}Ni=1,
which corresponds to the N nodes in the input network. Notationsare summarized in table 1.
The hidden vector yi ∈ {1, . . . , N}T models the topic-level in-fluences from other nodes to node vi. Each element yz
i , takingthe value from the set {1, . . . , N}, represents the node that has thehighest probability to influence node vi on topic z.
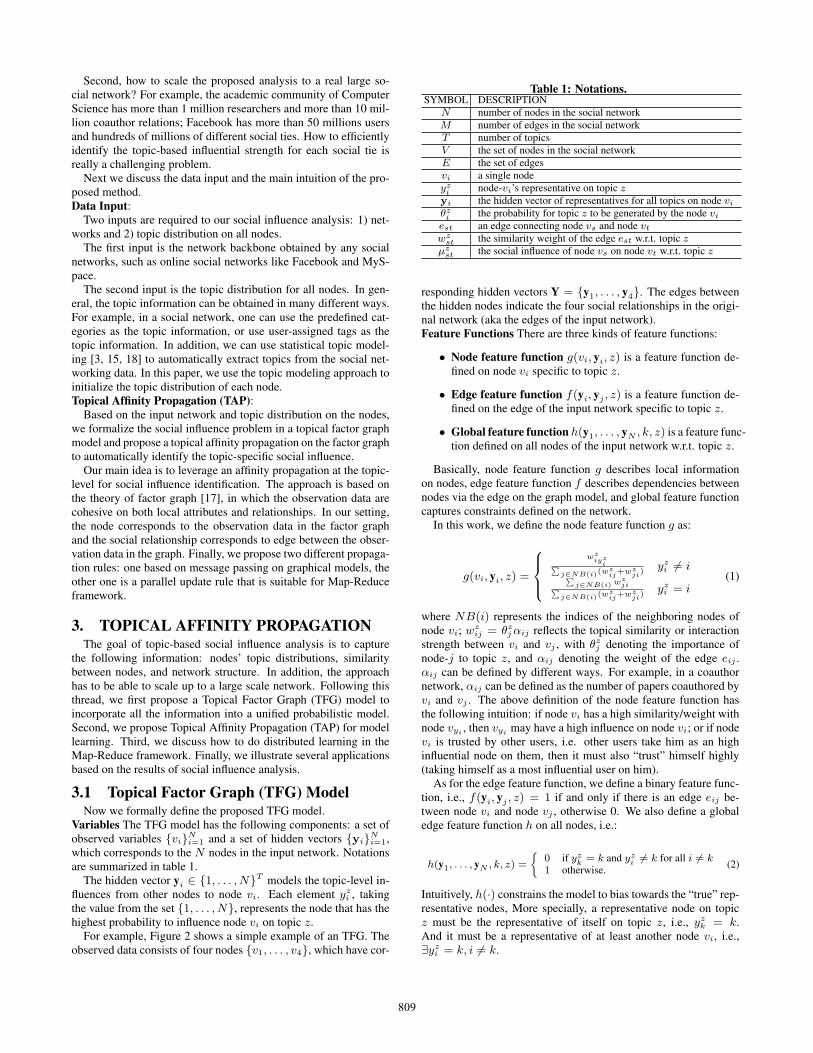
For example, Figure 2 shows a simple example of an TFG. Theobserved data consists of four nodes {v1, . . . , v4}, which have cor-
Table 1: Notations.SYMBOL DESCRIPTION
N number of nodes in the social networkM number of edges in the social networkT number of topicsV the set of nodes in the social networkE the set of edgesvi a single nodeyz
i node-vi’s representative on topic zyi the hidden vector of representatives for all topics on node vi
θzi the probability for topic z to be generated by the node vi
est an edge connecting node vs and node vt
wzst the similarity weight of the edge est w.r.t. topic z
µzst the social influence of node vs on node vt w.r.t. topic z
responding hidden vectors Y = {y1, . . . , y4}. The edges betweenthe hidden nodes indicate the four social relationships in the origi-nal network (aka the edges of the input network).Feature Functions There are three kinds of feature functions:
• Node feature function g(vi, yi, z) is a feature function de-fined on node vi specific to topic z.
• Edge feature function f(yi, yj , z) is a feature function de-fined on the edge of the input network specific to topic z.
• Global feature function h(y1, . . . , yN , k, z) is a feature func-tion defined on all nodes of the input network w.r.t. topic z.
Basically, node feature function g describes local informationon nodes, edge feature function f describes dependencies betweennodes via the edge on the graph model, and global feature functioncaptures constraints defined on the network.
In this work, we define the node feature function g as:
g(vi, yi, z) =
wziyz
i∑j∈NB(i)(w
zij+wz
ji)yz
i 6= i∑
j∈NB(i) wzji∑
j∈NB(i)(wzij+wz
ji)yz
i = i(1)
where NB(i) represents the indices of the neighboring nodes ofnode vi; wz
ij = θzj αij reflects the topical similarity or interaction
strength between vi and vj , with θzj denoting the importance of
node-j to topic z, and αij denoting the weight of the edge eij .αij can be defined by different ways. For example, in a coauthornetwork, αij can be defined as the number of papers coauthored byvi and vj . The above definition of the node feature function hasthe following intuition: if node vi has a high similarity/weight withnode vyi , then vyi may have a high influence on node vi; or if nodevi is trusted by other users, i.e. other users take him as an highinfluential node on them, then it must also “trust” himself highly(taking himself as a most influential user on him).
As for the edge feature function, we define a binary feature func-tion, i.e., f(yi, yj , z) = 1 if and only if there is an edge eij be-tween node vi and node vj , otherwise 0. We also define a globaledge feature function h on all nodes, i.e.:
h(y1, . . . , yN , k, z) =
{0 if yz
k = k and yzi 6= k for all i 6= k
1 otherwise. (2)
Intuitively, h(·) constrains the model to bias towards the “true” rep-resentative nodes, More specially, a representative node on topicz must be the representative of itself on topic z, i.e., yz
k = k.And it must be a representative of at least another node vi, i.e.,∃yz
i = k, i 6= k.
809
y1
v1
g(v1,y1,z)
y2
v2
y3
v3
y4
v4
f (y1,y3,z)
f (y2, y4, z)
y11=2
y12=1
Observation data: nodes
TFG model
f (y1,y2,z)
f (y2,y3,z)
g(v2,y2,z) g(v3,y3,z) g(v4,y4,z)
#Topic: T=2
y21=4
y22=1
y31=2
y32=1
y41=4
y42=2
h (y1, y2, …, yN, k, z)
Figure 2: Graphical representation of the topical factor graphmodel. {v1, . . . , v4} are observable nodes in the social network;{y1, . . . , y4} are hidden vectors defined on all nodes, with eachelement representing which node has the highest probabilityto influence the corresponding node; g(.) represents a featurefunction defined on a node, f(.) represents a feature functiondefined on an edge; and h(.) represents a global feature func-tion defined for each node, i.e. k ∈ {1, . . . , N}.
Joint Distribution Next, a factor graph model is constructed basedon this formulation. Typically, we hope that a model can best fit(reconstruct) the observation data, which is usually represented bymaximizing the likelihood of the observation. Thus we can definethe objective likelihood function as:
P (v, Y) =1
Z
N∏
k=1
T∏
z=1
h(y1, . . . , yN , k, z)
N∏
i=1
T∏
z=1
g(vi, yi, z)∏
ekl∈E
T∏
z=1
f(yk, yl, z) (3)
where v = [v1, . . . , vN ] and Y = [y1, . . . , yN ] corresponds to allobserved and hidden variables, respectively; g and f are the nodeand edge feature functions; h is the global feature function; Z is anormalizing factor.
The factor graph in Figure 2 describes this factorization. Eachblack box corresponds to a term in the factorization, and it is con-nected to the variables on which the term depends.
Based on this formulation, the task of social influence is castas identifying which node has the highest probability to influenceanother node on a specific topic along with the edge. That is, tomaximize the likelihood function P (v, Y). One parameter config-uration is shown in Figure 2. On topic 1, both node v1 and nodev3 are strongly influenced by node v2, while node v2 is mainly in-fluenced by node v4. On topic 2, the situation is different. Almostall nodes are influenced by node v1, where node v4 is indirectlyinfluenced by node v1 via the node v2.
3.2 Basic TAP LearningBaseline: Sum-Product To train the TFG model, we can take Eq.3 as the objective function to find the parameter configuration thatmaximizes the objective function. While it is intractable to find theexact solution to Eq. 3, approximate inference algorithms such assum-product algorithm[17], can be used to infer the variables y.
In sum-product algorithm, messages are passed between nodesand functions. Message passing is initiated at the leaves. Each
node vi remains idle until messages have arrived on all but oneof the edges incident on the node vi. Once these messages havearrived, node vi is able to compute a message to be sent onto theone remaining edge to its neighbor. After sending out a message,node vi returns to the idle state, waiting for a “return message”to arrive from the edge. Once this message has arrived, the node isable to compute and send messages to each of neighborhood nodes.This process runs iteratively until convergence.
However, traditional sum-product algorithm cannot be directlyapplied for multiple topics. We first consider a basic extension ofthe sum-product algorithm: topical sum-product. The algorithmiteratively updates a vector of messages m between variable nodesand factor (i.e. feature function) nodes. Hence, two update rulescan be defined respectively for a topic-specific message sent fromvariable node to factor node and for a topic-specific message sentfrom factor node to variable node.
my→f (y, z) =∏
f′∼y\f
mf′→y(y, z)∏
z′ 6=z
∏
f′∼y\f
mf′→y(y, z′)(τ
z′z)
mf→y(y, z) =∑
∼{y}
f(Y, z)
∏
y′∼f\y
my′→f (y′, z)
+∑
z′ 6=z
τz′z∑
∼{y}
f(Y, z
′)
∏
y′∼f\y
my′→f (y′, z′)
(4)
where
• f ′ ∼ y\f represents f ′ is a neighbor node of variable y onthe factor graph except factor f ;
• Y is a subset of hidden variables that feature function f isdefined on; for example, a feature f(yi, yj) is defined onedge eij , then we have Y = {yi, yj}; ∼ {y} represents allvariables in Y except y;
• the sum∑∼{y} actually corresponds to a marginal function
for y on topic z;
• and coefficient τ represents the correlation between topics,which can be defined in many different ways. In this workwe, for simplicity, assume that topics are independent. Thatis, τzz′ = 1 when z = z′ and τzz′ = 0 when z 6= z′. Inthe following, we will propose two new learning algorithms,which are also based this independent assumption.
New Learning Algorithm However, the sum-product algorithmrequires that each node need wait for all(-but-one) message to ar-rive, thus the algorithm can only run in a sequential mode. Thisresults in a high complexity of O(N4 × T ) in each iteration. Todeal with this problem, we propose an affinity propagation algo-rithm, which converts the message passing rules into equivalentupdate rules passing message directly between nodes rather thanon the factor graph. The algorithm is summarized in Algorithm 1.In the algorithm, we first use logarithm to transform sum-productinto max-sum, and introduce two sets of variables {rz
ij}Tz=1 and
{azij}T
z=1 for each edge eij . The new update rules for the variablesare as follows: (Derivation is omitted for brevity.)
rzij = bz
ij − maxk∈NB(j)
{bzik + az
ik} (5)
azjj = max
k∈NB(j)min {rz
kj , 0} (6)
azij = min(max {rz
jj , 0},−min {rzjj , 0}
− maxk∈NB(j)\{i}
min {rzkj , 0}), i ∈ NB(j) (7)
810
where NB(j) denotes the neighboring nodes of node j, rzij is the
influence message sent from node i to node j and azij is the influ-
ence message sent from node j to node i, initiated by 0, and bzij is
the logarithm of the normalized feature function
bzij = log
g(vi, yi, z)|yzi =j∑
k∈NB(i)∪{i} g(vi, yi, z)|yzi =k
(8)
The introduced variables r and a have the following nice expla-nation. Message az
ij reflects, from the perspective of node vj , howlikely node vj thinks he/she influences on node vi with respect totopic z, while message rz
ij reflects, from the perspective of node vi,how likely node vi agrees that node vj influence on him/her withrespect to topic z. Finally, we can define the social influence scorebased on the two variables r and a using a sigmoid function:
µzst =
1
1 + e−(rzts+az
ts)(9)
The score µzst actually reflects the maximum of P (v,Y, z) for
yzt = s, thus the maximization of P (v,Y, z) can be obtained by
yzt = arg max
s∈NB(t)∪{t}µz
st (10)
Input: G = (V, E) and topic distributions {θv}v∈V
Output: topic-level social influence graphs {Gz = (Vz, Ez)}Tz=1
Calculate the node feature function g(vi, yi, z);1.1Calculate bz
ij according to Eq. 8;1.2Initialize all {rz
ij} ← 0;1.3repeat1.4
foreach edge-topic pair (eij , z) do1.5Update rz
ij according to Eq. 5;1.6end1.7foreach node-topic pair (vj , z) do1.8
Update azjj according to Eq. 6;1.9
end1.10foreach edge-topic pair (eij , z) do1.11
Update azij according to Eq. 7;1.12
end1.13until convergence;1.14foreach node vt do1.15
foreach neighboring node s ∈ NB(t) ∪ {t} do1.16Compute µz
st according to Eq. 9;1.17end1.18
end1.19Generate Gz = (Vz, Ez) for every topic z according to {µz
st};1.20
Algorithm 1: The new TAP learning algorithm.
Finally, according to the obtained influence scores {µzst} and the
topic distribution {θv}, we can easily generate the topic-level so-cial influence graphs. Specifically, for each topic z, we first filterout irrelevant nodes, i.e., nodes that have a lower probability thana predefined threshold. An alternative way is to keep only a fixednumber (e.g., 1,000) of nodes for each topic-based social influencegraph. (This filtering process can be also taken as a preprocessingstep of our approach, which is the way we conducted our experi-ments.) Then, for a pair of nodes (vs, vt) that has an edge in theoriginal network G, we create two directed edges between the twonodes and respectively assign the social influence scores µz
st andµz
ts. Finally, we obtain a directed social influence graph Gz for thetopic z.
The new algorithm reduces the complexity of each iteration fromO(N4 × T ) in the sum-product algorithm to O(M × T ). Moreimportantly, the new update rules can be easily parallelized.
3.3 Distributed TAP LearningAs a social network may contain millions of users and hundreds
of millions of social ties between users, it is impractical to learna TFG from such a huge data using a single machine. To addressthis challenge, we deploy the learning task on a distributed systemunder the map-reduce programming model [9].
Map-Reduce is a programming model for distributed processingof large data sets. In the map stage, each machine (called a processnode) receives a subset of data as input and produces a set of in-termediate key/value pairs. In the reduce stage, each process nodemerges all intermediate values associated with the same interme-diate key and outputs the final computation results. Users specifya map function that processes a key/value pair to generate a set ofintermediate key/value pairs, and a reduce function that merges allintermediate values associated with the same intermediate key.
In our affinity propagation process, we first partition the largesocial network graph into subgraphs and distribute each subgraphto a process node. In each subgraph, there are two kinds of nodes:internal nodes and marginal nodes. Internal nodes are those allof whose neighbors are inside the very subgraph; marginal nodeshave neighbors in other subgraphs. For every subgraph G, all in-ternal nodes and edges between them construct the closed graph G.The marginal nodes can be viewed as “the supporting information”for updating the rules. For easy explanation, we consider the dis-tributed learning algorithm on a single topic and thus the map stageand the reduce stage can be defined as follows.
In the map stage, each process node scans the closed graph Gof the assigned subgraph G. Note that every edge eij has twovalues az
ij and rij . Thus, the map function is defined as for ev-ery key/value pair eij/aij , it issues an intermediate key/value pairei∗/(bij + aij); and for key/value pair eij/rij , it issues an inter-mediate key/value pair e∗j/rij .
In the reduce stage, each process node collects all values associ-ated with an intermediate key ei∗ to generate new ri∗ according toEq. (5), and all intermediate values associated with the same keye∗j to generate new a∗j according to Eqs. (6) and (7). Thus, theone time map-reduce process corresponds to one iteration in ouraffinity propagation algorithm.
3.4 Model ApplicationThe social influence graphs by TAP can help with many appli-
cations. Here we illustrate one application on expert identification,i.e., to identify representative nodes from social networks on a spe-cific topic.
Here we present 3 methods for expert identification: 1) PageR-ank+LanguageModeling (PR), 2) PageRank with global Influence(PRI) and 3) PageRank with topic-based influence (TPRI).Baseline: PR One baseline method is to combine the languagemodel and PageRank [24]. Language model is to estimate the rele-vance of a candidate with the query and PageRank is to estimate theauthority of the candidate. There are different combination meth-ods. The simplest combination method is to multiply or sum thePageRank ranking score and the language model relevance score.Proposed 1: PRI In PRI, we replace the transition probability inPageRank with the influence score. Thus we have
r[v] = β1
|V | + (1− β)∑
v′:v′→v
r[v′]p(v|v′) (11)
In traditional PageRank algorithm, p(v|v′) is simply the value ofone divides the number of outlinks of node v′. Here, we considerthe influence score. Specifically we define
p(v|v′) =
∑z µz
v′v∑vj :v′→vj
∑z µz
v′vj
811
Proposed 2: TPRI In the second extension, we introduce, for eachnode v, a vector of ranking scores r[v, z], each of which is specificto topic z. Random walk is performed along with the coauthorrelationship between authors within the same topic. Thus the topic-based ranking score is defined as:
r[v, z] = β1
|V |p(zk|v) + (1− β)∑
v′:v′→v
r[v′, z]p(v|v′, z) (12)
where p(z|v) is the probability of topic z generated by node v andit is obtained from the topic model; p(v|v′, z) represents the prob-ability of node v′ influencing node v on topic z; we define it as
p(v|v′, z) =µz
v′v∑vj :v′→vj
µzv′vj
4. EXPERIMENTAL RESULTSIn this section, we present various experiments to evaluate the
efficiency and effectiveness of the proposed approach. All datasets, codes, and tools to visualize the generated influence graphsare publicly available at http://arnetminer.org/lab-datasets/soinf/.
4.1 Experimental Setup
4.1.1 Data SetsWe perform our experiments on three real-world data sets: two
homogeneous networks and one heterogeneous network. The ho-mogeneous networks are academic coauthor network (shortly Coau-thor) and paper citation network (shortly Citation). Both are ex-tracted from academic search system Arnetminer1. The coauthordata set consists of 640,134 authors and 1,554,643 coauthor re-lations, while the citation data set contains 2,329,760 papers and12,710,347 citations between these papers. Topic distributions ofauthors and papers are discovered using a statistical topic modelingapproach, Author-Conference-Topic (ACT) model [25]. The ACTapproach automatically extracts 200 topics and assigns an author-specific topic distribution to each author and a paper-specific topicdistribution to each paper.
The other heterogeneous network is a film-director-actor-writernetwork (shortly Film), which is crawled from Wikipedia under thecategory of “English-language films”2. In total, there are 18,518films, 7,211 directors, 10,128 actors, and 9,784 writers. Thereare 142,426 relationships between the heterogeneous nodes in thedataset. The relationship types include: film-director, film-actor,film-writer, and other relationships between actors, directors, andwriters. The first three types of relationships are extracted from the“infobox” on the films’ Wiki pages. All the other types of peo-ple relationships are created as follows: if one people (includingactors, directors, and writers) appears on another people’s page,then a directed relationship is created between them. Topic distri-butions of the heterogeneous network is initialized using the cat-egory information defined on the Wikipedia page. More specif-ically, we take 10 categories with the highest occurring times asthe topics. The 10 categories are: “American film actors”, “Amer-ican television actors”, “Black and white films”, “Drama films”,“Comedy films”, “British films”, “American film directors”, “In-dependent films”, “American screenwriters”, and “American stageactors”. As for the topic distribution of each node in the Film net-work, we first calculate how likely a node vi belong to a category1http://arnetminer.org2http://en.wikipedia.org/wiki/Category:English-language_films
(topic) z, i.e. p(vi|z), according to 1|Vz| , where |Vz| is the num-
ber of nodes in the category (topic) z. Thus, for each node, wewill obtain a set {p(vi|z)}T
z=1 of likelihood for each node. Thenwe calculate the topic distribution {p(z|vi)}T
z=1 according to theBayesian rule p(z|vi) ∝ p(z)p(vi|z), where p(z) is the probabil-ity of the category (topic).
4.1.2 Evaluation MeasuresFor quantitatively evaluate our method, we consider three per-
formance metrics:
• CPU time. It is the execution elapsed time of the computa-tion. This determines how efficient our method is.
• Case study. We use several case studies to demonstrate howeffective our method can identify the topic-based social in-fluence graphs.
• Application improvement. We apply the identified topic-based social influence to help expert finding, an importantapplication in social network. This will demonstrate how thequantitative measurement of the social influence can benefitthe other social networking application.
The basic learning algorithm is implemented using MATLAB2007b and all experiments with it are performed on a Server run-ning Windows 2003 with two Dual-Core Intel Xeon processors (3.0GHz) and 8GB memory. The distributed learning algorithm is im-plemented under the Map-Reduce programming model using theHadoop platform3. We perform the distributed train on 6 computernodes (24 CPU cores) with AMD processors (2.3GHz) and 48GBmemory in total. We set the maximum number of iterations as 100and the threshold for the change of r and a to 1e − 3. The al-gorithm can quickly converge after 7-10 iterations in most of thetimes. In all experiments, for generating each of the topic-basedsocial influence graphs, we only keep 1,000 nodes that have thehighest probabilities p(v|z).
4.2 Scalability PerformanceWe evaluate the efficiency of our approach on the three data sets.
We also compare our approach with the sum-product algorithm.Table 2 lists the CPU time required on the three data sets with
the following observations:Sum-Product vs TAP The new TAP approach is much faster thanthe traditional sum-product algorithm, which even cannot completeon the citation data set.Basic vs Distributed TAP The distributed TAP can typically achievea significant reduction of the CPU time on the large-scale network.For example, on the citation data set, we obtain a speedup 15X.While on a moderate scaled network (the coauthor data set), thespeedup of the distributed TAP is limited, only 3.6. On a relativesmaller network (the Film data set), the distributed learning un-derperforms the basic TAP learning algorithm, which is due to thecommunication overhead of the Map-Reduce framework.Distributed Scalability We further conduct a scalability experi-ment with our distributed TAP. We evaluate the speedup of thedistributed learning algorithm on the 6 computer nodes using thecitation data set with different sizes. It can be seen from Figure 3(a) that when the size of the data set increase to nearly one millionedges, the distributed learning starts to show a good parallel effi-ciency (speedup>3). This confirms that distributed TAP like manydistributed learning algorithms is good on large-scale data sets.
3http://hadoop.apache.org/
812

Table 2: Scalability performance of different methods on realdata sets. >10hr means that the algorithm did not terminatewhen the algorithm runs more than 10 hours.
Methods Citation Coauthor FilmSum-Product N/A >10hr 1.8 hr
Basic TAP Learning >10hr 369s 57sDistributed TAP Learning 39.33m 104s 148s
0 170K 540K 1M 1.7M0
1
2
3
4
5
6
7
1 2 3 4 5 61
1.5
2
2.5
3
3.5
4
4.5
5
5.5
6
Perfect
Our method
(a) Dataset size vs. speedup (b) #Computer nodes vs. speedup
Table 3: Speedup results.
Using our large citation data set, we also perform speedup exper-iments on a Hadoop platform using 1, 2, 4, 6 computer nodes (sincewe did not have access to a large number of computer nodes). Thespeedup, shown in 3 (b), show reasonable parallel efficiency, witha > 4× speedup using 6 computer nodes.
4.3 Qualitative Case StudyNow we demonstrate the effectiveness of TAP of representative
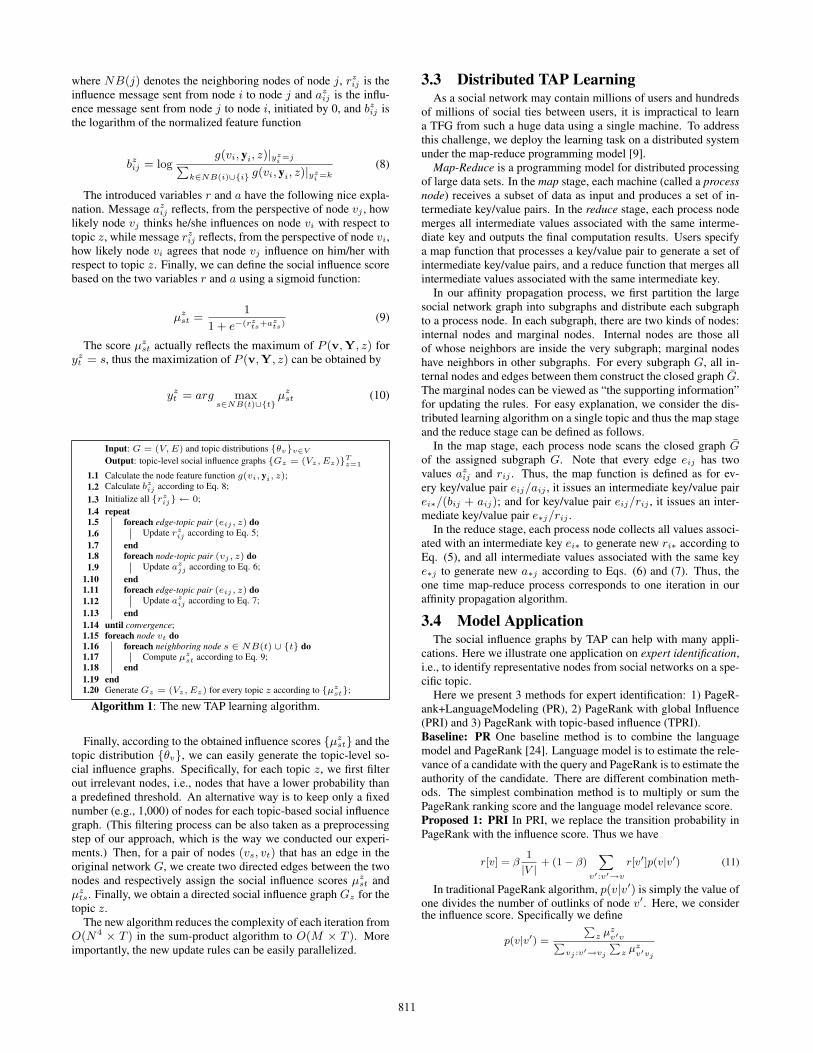
nodes identification on the Coauthor and Citation data sets.Table 4 shows representative nodes (authors and papers) found
by our algorithm on different topics from the coauthor data setand the citation data set. The representative score of each nodeis the probability of the node influencing the other nodes on thistopic. The probability is calculated by
∑j∈NB(i)∪{i} µij∑N
i=1∑
j∈NB(i)∪{j} µij. We
can see some interesting results. For example, some papers (e.g.,“FaCT and iFaCT”) that do have have a high citation number mightbe selected as the representative nodes. This is because our algo-rithm can identify the influences between papers, thus can differen-tiate the citations of the theoretical background of a paper and anodd citation in the reference.
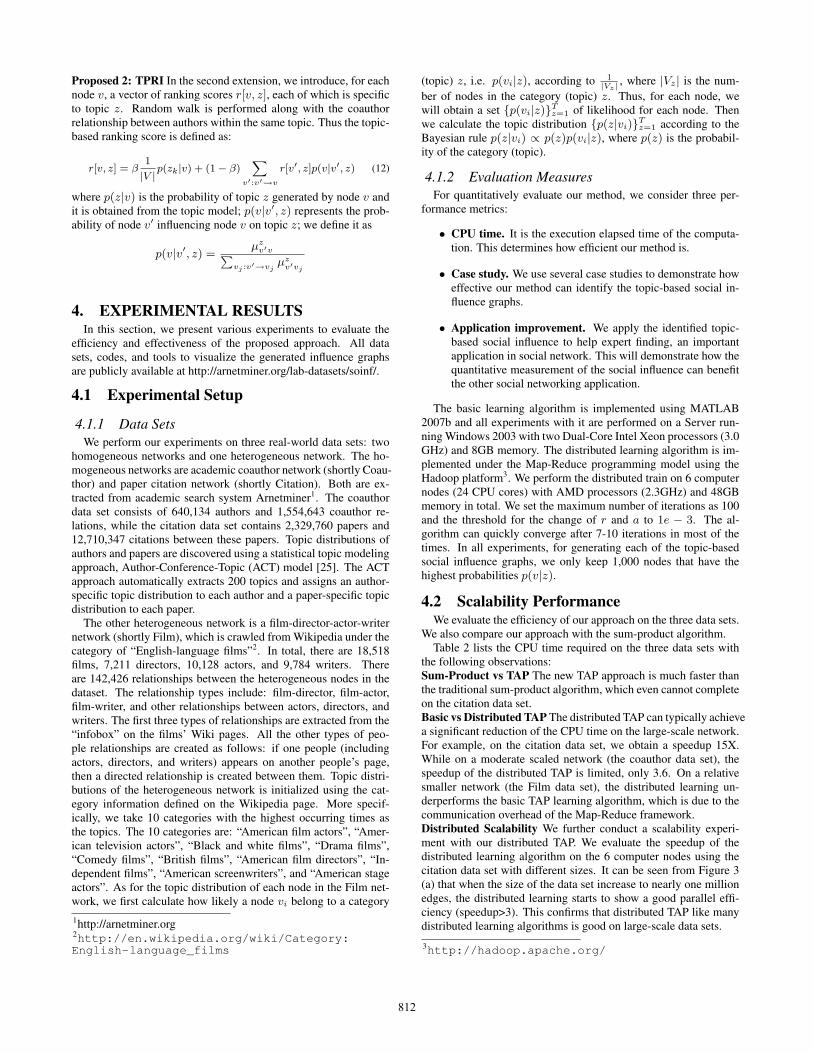
Table 5 shows four representative authors and researchers whoare mostly influenced by them. Table 6 shows two representa-tive papers and papers that are mostly influence by the two papers.Some other method e.g., the similarity-based baseline method us-ing cosine metric, can be also used to estimate the influence ac-cording to the similarity score. Such a method was previously usedfor analyzing the social influence in online communities [6]. Com-paring with the similarity-based baseline method, our method hasseveral distinct advantages: First, such a method can only mea-sure the similarity between nodes, but cannot tell which node has astronger influence on the other one. Second, the method cannot tellwhich nodes have the highest influences in the network, which ourapproach naturally has the capacity to do this. This provides manyimmediate applications, for example, expert finding.
4.4 Quantitative Case StudyNow we conduct quantitatively evaluation of the effectiveness of
the topic-based social influence analysis through case study. Recallthe goal of expert finding is to identify persons with some expertiseor experience on a specific topic (query) q. We define the baseline
P@5 P@10 P@20 R−Pre MAP
PRPRITPRI
(%)
020
4060
8010
0
Table 7: Performance of expert finding with different ap-proaches.
method as the combination [24] of the language model P (q|v) andPageRank r[v].
We use an academic data set used in [24] [25] for the experi-ments. Specifically, the data set contains 14, 134 authors, 10, 716papers, and 1, 434 conferences. Four-grade scores (3, 2, 1, and0) are manually labeled to represent definite expertise, expertise,marginal expertise, and no expertise. Using this data, we createa coauthor network. The topic model for each author is still ob-tained using the statistical topic modeling approach [25]. With thetopic models, we apply the proposed TAP approach to the coauthornetwork to identify the topic-based influences.
With the learned topic-based influence scores, we define two ex-tensions to the PageRank method: PageRank with Influence (PRI)and PageRank with topic-based influence (TPRI). Details of theextension is described in Section 3.4. For expert finding, we canfurther combine the extended PageRank model with the relevancemodel, for example the language model by P (q|v)r[v] or a topic-based relevance model by
∑z p(q|z)p(z|v)r[v, z], where r[v] and
r[v, z] are obtained respectively from PRI and TPRI; p(q|z), p(z|v)can be obtained from the statistical topic model [24].
We evaluate the performance of different methods in terms ofPrecision@5 (P@5), P@10, P@20, R-precision (R-Pre), and meanaverage precision (MAP) [4, 7]. Figure 7 shows the result of expertfinding with different approaches. We see that the topic-based so-cial influences discovered by the TAP approach can indeed improvethe accuracy of expert finding, which confirms the effectiveness ofthe proposed approach for topic-based social influence analysis.
5. RELATED WORK
5.1 Social Network and InfluenceMuch effort has been made for social network analysis and a
large number of work has been done. For example, methods areproposed for identifying cohesive subgraphs within a network wherecohesive subgraphs are defined as “subsets of actors among whomthere are relatively strong, direct, intense, frequent, or positive ties”[26]. Quite a few metrics have been defined to characterize a socialnetwork, such as betweenness, closeness, centrality, centralization,etc. A common application of the social network analysis is Webcommunity discovery. For example, Flake et al. [12] propose amethod based on maximum flow/minmum cut to identify Web com-munities. As for social influence analysis, [2, 21] propose methodsto qualitatively measure the existence of influence. [6] studies thecorrelation between social similarity and influence. Other similar
813
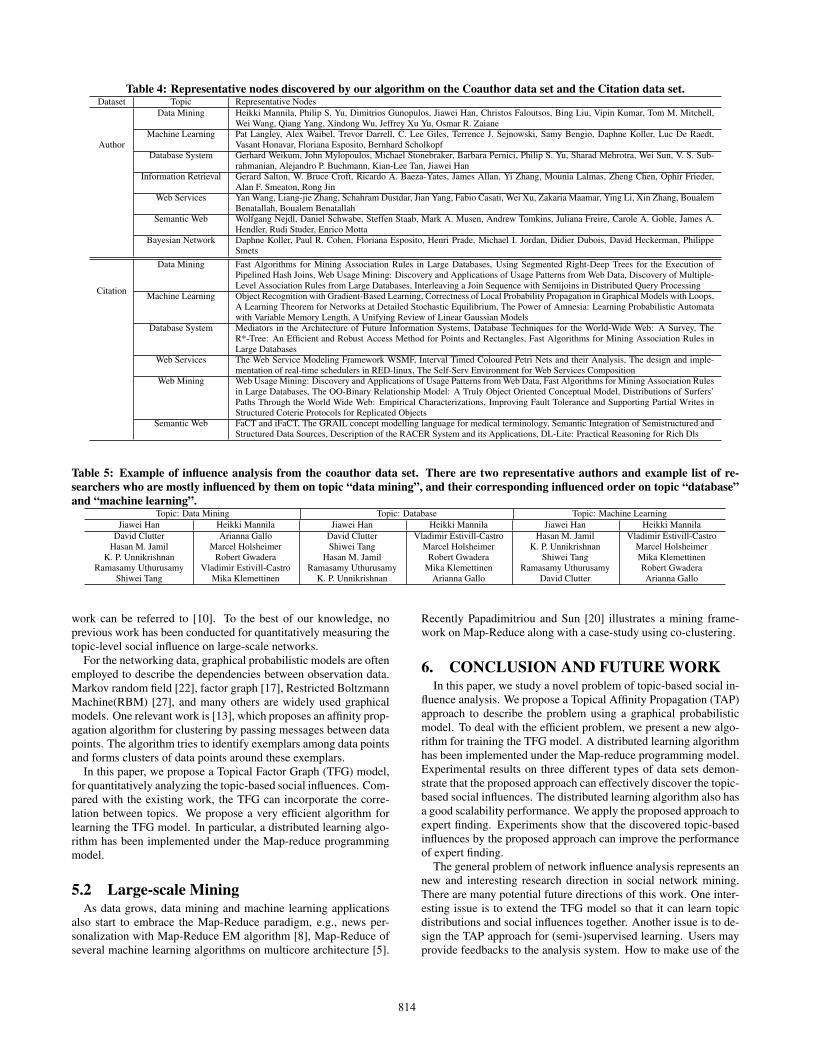
Table 4: Representative nodes discovered by our algorithm on the Coauthor data set and the Citation data set.Dataset Topic Representative Nodes
Author
Data Mining Heikki Mannila, Philip S. Yu, Dimitrios Gunopulos, Jiawei Han, Christos Faloutsos, Bing Liu, Vipin Kumar, Tom M. Mitchell,Wei Wang, Qiang Yang, Xindong Wu, Jeffrey Xu Yu, Osmar R. Zaiane
Machine Learning Pat Langley, Alex Waibel, Trevor Darrell, C. Lee Giles, Terrence J. Sejnowski, Samy Bengio, Daphne Koller, Luc De Raedt,Vasant Honavar, Floriana Esposito, Bernhard Scholkopf
Database System Gerhard Weikum, John Mylopoulos, Michael Stonebraker, Barbara Pernici, Philip S. Yu, Sharad Mehrotra, Wei Sun, V. S. Sub-rahmanian, Alejandro P. Buchmann, Kian-Lee Tan, Jiawei Han
Information Retrieval Gerard Salton, W. Bruce Croft, Ricardo A. Baeza-Yates, James Allan, Yi Zhang, Mounia Lalmas, Zheng Chen, Ophir Frieder,Alan F. Smeaton, Rong Jin
Web Services Yan Wang, Liang-jie Zhang, Schahram Dustdar, Jian Yang, Fabio Casati, Wei Xu, Zakaria Maamar, Ying Li, Xin Zhang, BoualemBenatallah, Boualem Benatallah
Semantic Web Wolfgang Nejdl, Daniel Schwabe, Steffen Staab, Mark A. Musen, Andrew Tomkins, Juliana Freire, Carole A. Goble, James A.Hendler, Rudi Studer, Enrico Motta
Bayesian Network Daphne Koller, Paul R. Cohen, Floriana Esposito, Henri Prade, Michael I. Jordan, Didier Dubois, David Heckerman, PhilippeSmets
Citation
Data Mining Fast Algorithms for Mining Association Rules in Large Databases, Using Segmented Right-Deep Trees for the Execution ofPipelined Hash Joins, Web Usage Mining: Discovery and Applications of Usage Patterns from Web Data, Discovery of Multiple-Level Association Rules from Large Databases, Interleaving a Join Sequence with Semijoins in Distributed Query Processing
Machine Learning Object Recognition with Gradient-Based Learning, Correctness of Local Probability Propagation in Graphical Models with Loops,A Learning Theorem for Networks at Detailed Stochastic Equilibrium, The Power of Amnesia: Learning Probabilistic Automatawith Variable Memory Length, A Unifying Review of Linear Gaussian Models
Database System Mediators in the Architecture of Future Information Systems, Database Techniques for the World-Wide Web: A Survey, TheR*-Tree: An Efficient and Robust Access Method for Points and Rectangles, Fast Algorithms for Mining Association Rules inLarge Databases
Web Services The Web Service Modeling Framework WSMF, Interval Timed Coloured Petri Nets and their Analysis, The design and imple-mentation of real-time schedulers in RED-linux, The Self-Serv Environment for Web Services Composition
Web Mining Web Usage Mining: Discovery and Applications of Usage Patterns from Web Data, Fast Algorithms for Mining Association Rulesin Large Databases, The OO-Binary Relationship Model: A Truly Object Oriented Conceptual Model, Distributions of Surfers’Paths Through the World Wide Web: Empirical Characterizations, Improving Fault Tolerance and Supporting Partial Writes inStructured Coterie Protocols for Replicated Objects
Semantic Web FaCT and iFaCT, The GRAIL concept modelling language for medical terminology, Semantic Integration of Semistructured andStructured Data Sources, Description of the RACER System and its Applications, DL-Lite: Practical Reasoning for Rich Dls
Table 5: Example of influence analysis from the coauthor data set. There are two representative authors and example list of re-searchers who are mostly influenced by them on topic “data mining”, and their corresponding influenced order on topic “database”and “machine learning”.
Topic: Data Mining Topic: Database Topic: Machine LearningJiawei Han Heikki Mannila Jiawei Han Heikki Mannila Jiawei Han Heikki Mannila
David ClutterHasan M. Jamil
K. P. UnnikrishnanRamasamy Uthurusamy
Shiwei Tang
Arianna GalloMarcel Holsheimer
Robert GwaderaVladimir Estivill-Castro
Mika Klemettinen
David ClutterShiwei Tang
Hasan M. JamilRamasamy Uthurusamy
K. P. Unnikrishnan
Vladimir Estivill-CastroMarcel Holsheimer
Robert GwaderaMika Klemettinen
Arianna Gallo
Hasan M. JamilK. P. Unnikrishnan
Shiwei TangRamasamy Uthurusamy
David Clutter
Vladimir Estivill-CastroMarcel HolsheimerMika KlemettinenRobert GwaderaArianna Gallo
work can be referred to [10]. To the best of our knowledge, noprevious work has been conducted for quantitatively measuring thetopic-level social influence on large-scale networks.
For the networking data, graphical probabilistic models are oftenemployed to describe the dependencies between observation data.Markov random field [22], factor graph [17], Restricted BoltzmannMachine(RBM) [27], and many others are widely used graphicalmodels. One relevant work is [13], which proposes an affinity prop-agation algorithm for clustering by passing messages between datapoints. The algorithm tries to identify exemplars among data pointsand forms clusters of data points around these exemplars.
In this paper, we propose a Topical Factor Graph (TFG) model,for quantitatively analyzing the topic-based social influences. Com-pared with the existing work, the TFG can incorporate the corre-lation between topics. We propose a very efficient algorithm forlearning the TFG model. In particular, a distributed learning algo-rithm has been implemented under the Map-reduce programmingmodel.
5.2 Large-scale MiningAs data grows, data mining and machine learning applications
also start to embrace the Map-Reduce paradigm, e.g., news per-sonalization with Map-Reduce EM algorithm [8], Map-Reduce ofseveral machine learning algorithms on multicore architecture [5].
Recently Papadimitriou and Sun [20] illustrates a mining frame-work on Map-Reduce along with a case-study using co-clustering.
6. CONCLUSION AND FUTURE WORKIn this paper, we study a novel problem of topic-based social in-
fluence analysis. We propose a Topical Affinity Propagation (TAP)approach to describe the problem using a graphical probabilisticmodel. To deal with the efficient problem, we present a new algo-rithm for training the TFG model. A distributed learning algorithmhas been implemented under the Map-reduce programming model.Experimental results on three different types of data sets demon-strate that the proposed approach can effectively discover the topic-based social influences. The distributed learning algorithm also hasa good scalability performance. We apply the proposed approach toexpert finding. Experiments show that the discovered topic-basedinfluences by the proposed approach can improve the performanceof expert finding.
The general problem of network influence analysis represents annew and interesting research direction in social network mining.There are many potential future directions of this work. One inter-esting issue is to extend the TFG model so that it can learn topicdistributions and social influences together. Another issue is to de-sign the TAP approach for (semi-)supervised learning. Users mayprovide feedbacks to the analysis system. How to make use of the
814
Table 6: Example of influence analysis results on topic “data mining” from the citation data set. There are two representative papersand example paper lists that are mostly influenced by them.
Fast Algorithms for Mining Association Rules in Large Databases Web Usage Mining: Discovery and Applications of Usage Patterns from Web DataMining Large Itemsets for Association RulesA New Framework For Itemset GenerationEfficient Mining of Partial Periodic Patterns in Time Series DatabaseA New Method for Similarity Indexing of Market Basket DataA General Incremental Technique for Maintaining Discovered Association Rules
Mining Web Site?s Clusters from Link Topology and Site HierarchyPredictive Algorithms for Browser Support of Habitual User Activities on the WebA Fine Grained Heuristic to Capture Web Navigation PatternsA Road Map to More Effective Web Personalization: Integrating Domain Knowledgewith Web Usage Mining
useful supervised information to improve the analysis quality is aninteresting problem. Another potential issue is to apply the pro-posed approach to other applications (e.g., community discovery)to further validate its effectiveness.
7. ACKNOWLEDGMENTSThe work is supported by the Natural Science Foundation of
China (No. 60703059), Chinese National Key Foundation Research(No. 2007CB310803), National High-tech R&D Program(No. 2009AA01Z138), and Chinese Young Faculty Research Fund(No. 20070003093).
8. REFERENCES[1] R. Albert and A. L. Barabasi. Statistical mechanics of
complex networks. Reviews of Modern Physics, 74(1), 2002.[2] A. Anagnostopoulos, R. Kumar, and M. Mahdian. Influence
and correlation in social networks. In Proceeding of the 14thACM SIGKDD international conference on Knowledgediscovery and data mining (KDD’08), pages 7–15, 2008.
[3] D. M. Blei, A. Y. Ng, and M. I. Jordan. Latent dirichletallocation. Journal of Machine Learning Research,3:993–1022, 2003.
[4] C. Buckley and E. M. Voorhees. Retrieval evaluation withincomplete information. In SIGIR’04, pages 25–32, 2004.
[5] C.-T. Chu, S. K. Kim, Y.-A. Lin, Y. Yu, G. R. Bradski, A. Y.Ng, and K. Olukotun. Map-Reduce for machine learning onmulticore. In Proceedings of the 18th Neural InformationProcessing Systems (NIPS’06), 2006.
[6] D. Crandall, D. Cosley, D. Huttenlocher, J. Kleinberg, andS. Suri. Feedback effects between similarity and socialinfluence in online communities. In Proceeding of the 14thACM SIGKDD international conference on Knowledgediscovery and data mining (KDD’08), pages 160–168, 2008.
[7] N. Craswell, A. P. de Vries, and I. Soboroff. Overview of thetrec-2005 enterprise track. In TREC 2005 ConferenceNotebook, pages 199–205, 2005.
[8] A. Das, M. Datar, A. Garg, and S. Rajaram. Google newspersonalization: Scalable online collaborative filtering. InProceeding of the 16th international conference on WorldWide Web (WWW’07), 2007.
[9] J. Dean and S. Ghemawat. Mapreduce: Simplified dataprocessing on large clusters. In Proceedings of the 6thconference on Symposium on Opearting Systems Design &Implementation (OSDI’04), pages 10–10, 2004.
[10] Y. Dourisboure, F. Geraci, and M. Pellegrini. Extraction andclassification of dense communities in the web. In WWW’07,pages 461–470, 2007.
[11] M. Faloutsos, P. Faloutsos, and C. Faloutsos. On power-lawrelationships of the internet topology. In SIGCOMM, pages251–262, New York, NY, USA, 1999. ACM.
[12] G. W. Flake, S. Lawrence, and C. L. Giles. Efficientidentification of web communities. In Proceedings of the
sixth ACM SIGKDD international conference on Knowledgediscovery and data mining (KDD’00), pages 150–160, 2000.
[13] B. J. Frey and D. Dueck. Mixture modeling by affinitypropagation. In Proceedings of the 18th Neural InformationProcessing Systems (NIPS’06), pages 379–386, 2006.
[14] M. Granovetter. The strength of weak ties. American Journalof Sociology, 78(6):1360–1380, 1973.
[15] T. Hofmann. Probabilistic latent semantic indexing. InProceedings of the 22nd International Conference onResearch and Development in Information Retrieval(SIGIR’99), pages 50–57, 1999.
[16] D. Krackhardt. The Strength of Strong ties: the importance ofphilos in networks and organization in Book of Nitin Nohriaand Robert G. Eccles (Ed.), Networks and Organizations.Harvard Business School Press, Boston, MA, 1992.
[17] F. R. Kschischang, S. Member, B. J. Frey, and H. andreaLoeliger. Factor graphs and the sum-product algorithm. IEEETransactions on Information Theory, 47:498–519, 2001.
[18] Q. Mei, D. Cai, D. Zhang, and C. Zhai. Topic modeling withnetwork regularization. In Proceedings of the 17thInternational World Wide Web Conference (WWW’08), pages101–110, 2008.
[19] M. E. J. Newman. The structure and function of complexnetworks. SIAM Reviews, 45, 2003.
[20] S. Papadimitriou and J. Sun. Disco: Distributed co-clusteringwith map-reduce. In Proceedings of IEEE InternationalConference on Data Mining (ICDM’08), 2008.
[21] P. Singla and M. Richardson. Yes, there is a correlation: -from social networks to personal behavior on the web. InProceeding of the 17th international conference on WorldWide Web (WWW’08), pages 655–664, 2008.
[22] P. Smolensky. Information processing in dynamical systems:foundations of harmony theory. pages 194–281, 1986.
[23] S. H. Strogatz. Exploring complex networks. Nature,410:268–276, 2003.
[24] J. Tang, R. Jin, and J. Zhang. A topic modeling approach andits integration into the random walk framework for academicsearch. In Proceedings of IEEE International Conference onData Mining (ICDM’08), pages 1055–1060, 2008.
[25] J. Tang, J. Zhang, L. Yao, J. Li, L. Zhang, and Z. Su.Arnetminer: Extraction and mining of academic socialnetworks. In Proceedings of the 14th ACM SIGKDDInternational Conference on Knowledge Discovery and DataMining (SIGKDD’08), pages 990–998, 2008.
[26] S. Wasserman and K. Faust. Social Network Analysis:Methods and Applications. Cambridge: CambridgeUniversity Press, 1994.
[27] M. Welling and G. E. Hinton. A new learning algorithm formean field boltzmann machines. In Proceedings ofInternational Conference on Artificial Neural Network(ICANN’01), pages 351–357, 2001.
815


![Confluence: Conformity Influence in Large Social Networkskeg.cs.tsinghua.edu.cn/.../KDD13...influence.pdf · General Social Features • Opinion leader[1] – Whether the user is](https://static.fdocuments.net/doc/165x107/5e6080318d158f41b53bc84a/confluence-conformity-influence-in-large-social-general-social-features-a-opinion.jpg)