Social Ecological Influences of WIC Programming Behavior ...
173
Walden University ScholarWorks Walden Dissertations and Doctoral Studies Walden Dissertations and Doctoral Studies Collection 2015 Social Ecological Influences of WIC Programming Behavior Change of Former WIC Participants Joyce L. Terrell Walden University Follow this and additional works at: hps://scholarworks.waldenu.edu/dissertations Part of the Epidemiology Commons , and the Public Health Education and Promotion Commons is Dissertation is brought to you for free and open access by the Walden Dissertations and Doctoral Studies Collection at ScholarWorks. It has been accepted for inclusion in Walden Dissertations and Doctoral Studies by an authorized administrator of ScholarWorks. For more information, please contact [email protected].
Transcript of Social Ecological Influences of WIC Programming Behavior ...

Walden UniversityScholarWorks
Walden Dissertations and Doctoral Studies Walden Dissertations and Doctoral StudiesCollection
2015
Social Ecological Influences of WIC ProgrammingBehavior Change of Former WIC ParticipantsJoyce L. TerrellWalden University
Follow this and additional works at: https://scholarworks.waldenu.edu/dissertations
Part of the Epidemiology Commons, and the Public Health Education and Promotion Commons
This Dissertation is brought to you for free and open access by the Walden Dissertations and Doctoral Studies Collection at ScholarWorks. It has beenaccepted for inclusion in Walden Dissertations and Doctoral Studies by an authorized administrator of ScholarWorks. For more information, pleasecontact [email protected].

Walden University
College of Health Sciences
This is to certify that the doctoral dissertation by
Joyce Terrell
has been found to be complete and satisfactory in all respects,
and that any and all revisions required by
the review committee have been made.
Review Committee
Dr. Carla Riemersma, Committee Chairperson, Public Health Faculty
Dr. Xianbin Li, Committee Member, Public Health Faculty
Dr. Michael Dunn, University Reviewer, Public Health Faculty
Chief Academic Officer
Eric Riedel, Ph.D.
Walden University
2015

Abstract
Social Ecological Influences of WIC Programming
Behavior Change of Former WIC Participants
by
Joyce Lynn Terrell
MPH, Walden University, 2007
MS, United States Sports Academy, 1992
BGS, University of Maryland Eastern Shore, 1989
Dissertation Submitted in Partial Fulfillment
of the Requirements for the Degree of
Doctor of Philosophy
Public Health
Walden University
October 2015

Abstract
The Special Supplemental Women, Infants, and Children (WIC) Program is one of many
United States Department of Agriculture’s (USDA) food subsidy programs that serves
8.6 million participants, deemed nutritionally at risk. WIC is designed to influence
nutritional and health behaviors to a population least capable of functioning. The purpose
of this study was to identify if participation in WIC’s nutrition education activities and
restricted use of food subsidy benefits had a post-factorial effect on their nutritional
behaviors. This study provides data on Bronfenbrenner’s social ecological influences and
how it impacts on long-term behavioral change. A quantitative causal-comparative design
utilizing a convenience sampling method compared responses to a survey on nutritional
habits of women shoppers at a Walmart retailer in an urban southeastern metropolitan
city. The study population included women aged 18-50 years with one or more child who
had or were currently receiving WIC (n = 63) compared with controls (n = 32) who also
met the aforementioned criteria, yet did not receive WIC. Analyses of a Wilcoxon signed
rank test supported an association between participation in WIC and an influence on
participants’ food purchase habits, while evidence from a linear equation for repeated
measures between groups did not support a common variable for what influenced
purchases between cases and controls. This study provides insight for future study
regarding WIC’s effectiveness to promote long-term health for its participants. It may
also lend to discussion by USDA officials to consider programmatic review and change
of other food subsidy programs which conceivably could impact the diets of more than 49
million Americans.

Social Ecological Influences of WIC Programming
Behavior Change of Former WIC Participants
by
Joyce Lynn Terrell
MPH, Walden University, 2007
MS, United States Sports Academy, 1992
BGS, University of Maryland Eastern Shore, 1989
Dissertation Submitted in Partial Fulfillment
of the Requirements for the Degree of
Doctor of Philosophy
Public Health
Walden University
October 2015

Dedication
I dedicate this work to my nieces and nephews; a hearty work ethic is a blueprint
for success. Set the tempo, feel the rhythm and just do it!
To my girls (Ren, Theresa, TMAC, J-Bird, Ann, Jen, Wind, Viv, Pam, Tomeka,
Kimmey, Lisa {R.I.P}) I love, love, love and appreciate your unwavering support. Now
that I have time, meet me on the links or at our favorite watering hole I’ve got some
catching-up to do! Seriously, thanks for getting me through the rough patches; I could not
have done it without you all. To my male friends (Eric, Elbert, Will x 2, Luckie, Enoch,
Randi, Carnell, Martin, Eddie, Forrest, Keith, and Tory), you live life with such passion!
You all really know how to party. Thanks for all of the good times; can’t wait until the
next party! To my Morehouse and Spelman colleagues, you all are the best! Your
sincerity and willingness to help, was phenomenal. In the future, just ask and I will
answer; many, many thanks! To the 3 J’s (Jackie, Joe, & Johnathan) thanks for your
support and allowing me to be me. Oh, Jackie don’t call me for every little thing,
Johnathan let’s talk more, and Joe, “thanks for always calling, to make sure I was alright
(it meant so much to me)!
Most importantly I would like thank my mother, Jean for her expressions of love
and commitment to help me through some of the most trying times during this journey;
there is nothing in the world like a praying mother! I love you mom….
Finally, I dedicate this work to my dad, Pete. I did it, “Partner”; you were one of
my greatest supporters…RIP.

Acknowledgments
I imagined writing Acknowledgments for this document would be rather simple,
as I have worked over the last 7 years researching, writing, and presenting my work, and
yet to no avail this is the 3rd draft of just this paragraph! For those who know me well,
they know, I innately do things over, and over, and over again; perhaps that explains the
7 years…hum. Seven, the Sabbath; a sign of completion, a time to rest! In 7 years I
finally will be able to put this to rest; I guess it was time. I am tired, I need to rest…
“Blessed is the man that walk not in the counsel of the ungodly, nor stands in the
path of sinners, nor sits in the seat of the ungodly, but his delight is in the law of the Lord
and in his law he meditates both day and night. He is like a tree planted by the river of the
waters, that bears fruit in due season, his leaf shall never whither, whatsoever he touches
shall prosper…” (Psalms 1, KJV). Every day for the past 7 months I wrote a line or two
in my composition book(s) before I would begin the days’ work until I had committed it
to memory. And though at the time there was no rhyme or reason for selection of that
chapter, I now realize “I am due to prosper at this time and this moment” (this feels
right)!
I extend gratitude to Drs. Carla Riemersma (Chairperson) and Li for their
guidance, leadership, and most importantly accepting my invitation to steer me along
with this undertaking. You believed in my work before I had an opportunity to prove
myself.

i
Table of Contents
Chapter 1: Introduction to the Study ....................................................................................1
Background of the Problem ...........................................................................................1
Problem Statement .........................................................................................................4
Nature of the Study ........................................................................................................7
Research Questions and Hypotheses .............................................................................8
Purpose of the Study ....................................................................................................10
Theoretical Framework ................................................................................................10
Operational Definitions ................................................................................................11
Assumptions .................................................................................................................14
Limitations ...................................................................................................................15
Delimitations ................................................................................................................15
Significance of the Study ............................................................................................ 15
Summary ......................................................................................................................16
Chapter 2: Review of the Literature ...................................................................................18
Introduction ..................................................................................................................18
Literature Search Strategy............................................................................................20
Let’s Move Campaign..................................................................................................22
Federally Funded Nutrition Programs .........................................................................24
Study Inclusion Criteria ...............................................................................................25
Themes .........................................................................................................................26
Health Policy ................................................................................................................28
ii
History of WIC ............................................................................................................30
History of the Supplemental Nutrition Assistance Program ........................................32
Comparative Analysis of WIC and SNAP Programs..................................................36
Need for the Research ..................................................................................................36
The Social Ecological Model .......................................................................................41
Social Ecological Influences ........................................................................................44
Behavioral Changes and WIC ......................................................................................45
Summary ......................................................................................................................49
Chapter 3: Research Method ..............................................................................................50
Introduction ..................................................................................................................50
Research Design...........................................................................................................53
WIC Eligibility Requirements .....................................................................................55
Categorical ............................................................................................................ 55
Residential............................................................................................................. 55
Income................................................................................................................... 56
Nutrition Risk........................................................................................................ 57
Operational Definition of Non-WIC Participant ..........................................................58
Setting and Population .................................................................................................60
Sampling Method .........................................................................................................60
Sample Size Justification .............................................................................................62
Instrumentation and Materials .....................................................................................63
Reliability and Validity of Likert Scale .......................................................................66

iii
Measures ......................................................................................................................68
Analysis Justification ...................................................................................................70
Descriptive Statistics ............................................................................................. 70
Wilcoxon Signed Rank Test ................................................................................. 71
Chi Square Test of Independence ......................................................................... 71
Analysis of Variance for Repeated Measures ....................................................... 72
Data Analysis Plan .......................................................................................................72
Research Questions and Hypotheses ...........................................................................72
Ethical Protection of Participants………………………………………………….....77
Summary ......................................................................................................................78
Chapter 4: Results ..............................................................................................................81
Introduction ..................................................................................................................80
Participant Demographics and Descriptive Statistics ..................................................80
Cases WIC History……………………………………………………………….......91
Frequency Distribution for Controls………………………………………….…..…96
ANOVA for Repeated Measures……………………………………………….…....96
t Test………………………………………………………………………….....…..97
Threat to Validity .......................................................................................................104
Research Questions and Hypotheses .........................................................................105
Research Question 1 ........................................................................................... 105
Research Question 1 Hypotheses ........................................................................ 108
Research Question 2 ........................................................................................... 108

iv
Multivariate Tests ............................................................................................... 109
Research Question 2 Hypotheses ........................................................................ 110
Research Question 3 ........................................................................................... 110
Research Question 3 Hypotheses ........................................................................ 116
Summary ....................................................................................................................116
Chapter 5: Discussion, Conclusions, and Recommendations ..........................................118
Introduction ................................................................................................................119
Summary and Interpretation of Findings ...................................................................119
Implications for Social Change ..................................................................................122
Limitations and Recommendations for Further Study ...............................................127
Recommendations for Actions ...................................................................................128
Summary ....................................................................................................................130
References ........................................................................................................................132
Appendix A: Letter to Prospective Study Participants ....................................................144
Appendix B: WIC Approved Food List ...........................................................................146
Appendix C: Behavioral Frequency Rating Scale for Controls .......................................148
Appendix D: Behavioral Frequency Rating Scale for Study Group ................................149
Appendix E: Survey Questions ........................................................................................150
Appendix F: State of Georgia Demographics (2010) ......................................................152
Appendix G: Letter to Wal-Mart .....................................................................................155
Appendix H: Comments on the Food and Nutrition Service Rule: Special SNAP for
Women, Infants and Children ..............................................................................157

v
List of Tables
Table 1. Body Mass Index for Adults ..................................................................................4
Table 2. Sample of WIC Food Package………………………………….............…..…..33
Table 3. Comparative Analysis of WIC and SNAP Programs ..........................................37
Table 4. Obesity related Co-morbidities……………………….…………………..….....38
Table 5.Overview of Bromfenbrenner’s SEM Level of Influence ....................................45
Table 6. WIC Income Eligibility Guidelines for the 48 Contigous States,
District of Columbia, Guam, and Other U.S. Territories (July 1, 2012 to June 2013) .....60
Table 7. Zip Codes Considered for Recruitment of Study Participants .............................62
Table 8. Behavioral Frequency Scale for Study Group .....................................................65
Table 9. Behavioral Frequency Scale for Control Group ..................................................66
Table 10. Demorgraphics of Study Sample by WIC Status ...............................................83
Table 11. Bivarate Table of Variables (Collapsed) by WIC Status; N = 95…………......89
Table 12. Answer to the Question “What Year did You Initially Receive WIC
Benefits?”………………………………………….…….…………………….....92
Table 13. Answer to the Question “ What Year Did You Stop Receiving WIC
Benefits……..…………………………………….…………………………..…..92
Table 14. Anwer to the Question “How Many Years Did You Receive WIC
Benefits?”……………………..……….…………………………………….…...93

vi
List of Tables
Table 15. Cross Tabulation Analyese of wicyears*WIC_WheatB2 Variables………..94
Table 16. Cross Tabulation wicyears*WIC_Choice_B2…….………..……...…..…..101
Table 17. Independent t-Test Analyses……………………….……..………...…..…101
Table 18. Independent Samples test …. …………………..……………...…...……..103
Table 19. Group Statistics ………..………...……………………………..…...……..103
Table 20. Independent Samples……………………………………………………….103
Table 21. Descriptive Statistics NEWWIC0 AND NEWWIC2………….…………...107
Table 22. Ranks…………………………………………………………………...…...107
Table 23. Test Statistics…………………………………….……..……………..…....108
Table 24. Descriptive Statistics Choice_2Yr., Choice_1Yr.,Choice_6months……….110
Table 25. Multivariate Tests ……………………………………………….……....…110
Table 26. Descriptive Statistics…………………………………………………..……115
Table 27. Test of Within Subject Effects…………………………………………..….116

vii
List of Figures
Figure 1. CDC Interpretation of BMI for 10- and 15-year-old boys………………….…..40
Figure 2. Bromfenbrenner’s Ecological Theory………………………………….…..……44
Figure 3. Participants’ Primary Areas of Employment…………..............……………..…86
Figure 4. Study Participants enrolled in USDA food Subsidy Programs………….....……87
Figure 5. t-Test………………………………………………………..…………………....99
Figure 6. General Linear Model………………………………….……………………….112
Figure 7. Status and Diet Quality by WIC and SNAP Participation of Discrete Foods from
10 Major Supermarket Aisle Food Group………………………………………..126

1
Chapter 1: Introduction to the Study
Background of the Problem
The purpose of this study was to examine the impact participation in the United
States Department of Agriculture (USDA)’s Women, Infants, and Children (WIC)
program had on the nutritional behaviors of former participants. When food shopping,
consumer behavior is often influenced by several factors: price-point index, marketing,
budget, food availability, culture, nutritional value of food items, convenience, taste,
hunger, family influence, habits, societal influence, and food insecurity concerns (Rani,
2014, p.53). Though these variables may provide an indication of what prompts or steers
consumer behaviors regarding food choice purchases, a WIC participant is met with very
few of these challenges, given program participants are required to purchase food items
from USDA and Institute of Medicine (IOM) approved food packages (USDA, Food
Nutrition Service, 2015, para. 1) and served as an indicator for what truly motivated
purchase habits of WIC program participants for this study.
The mission of WIC is to impose a nutritiously dense diet for “pregnant,
breastfeeding and nonbreastfeeding postpartum women, infants and children up to five
years” (USDA, 2013b, para. 1). This mission is further evidenced in the USDA’s most
recently revised approved food packages; foods should have high fiber content and little
saturated fat. USDA program officials assert, “WIC food packages and nutrition
education are the chief means by which WIC affects the dietary quality and habits of
participants” (USDA, Food and Nutrition Service [FNS], 2012, para. 1).
2
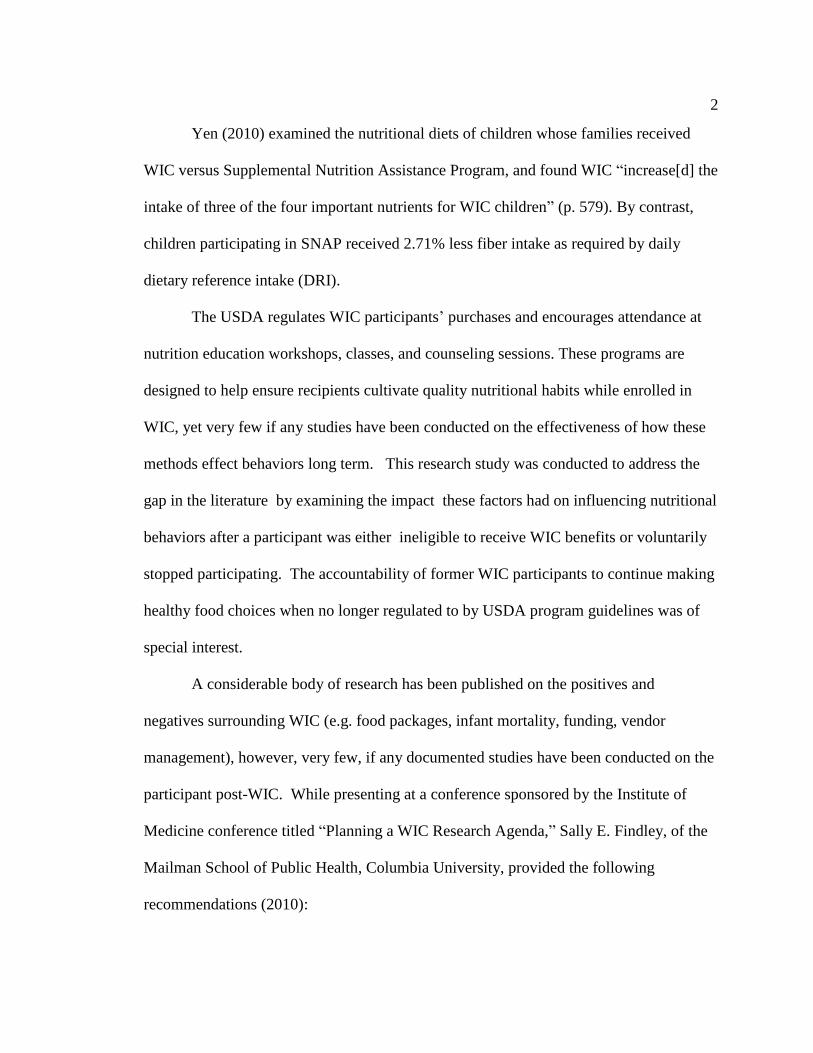
Yen (2010) examined the nutritional diets of children whose families received
WIC versus Supplemental Nutrition Assistance Program, and found WIC “increase[d] the
intake of three of the four important nutrients for WIC children” (p. 579). By contrast,
children participating in SNAP received 2.71% less fiber intake as required by daily
dietary reference intake (DRI).
The USDA regulates WIC participants’ purchases and encourages attendance at
nutrition education workshops, classes, and counseling sessions. These programs are
designed to help ensure recipients cultivate quality nutritional habits while enrolled in
WIC, yet very few if any studies have been conducted on the effectiveness of how these
methods effect behaviors long term. This research study was conducted to address the
gap in the literature by examining the impact these factors had on influencing nutritional
behaviors after a participant was either ineligible to receive WIC benefits or voluntarily
stopped participating. The accountability of former WIC participants to continue making
healthy food choices when no longer regulated to by USDA program guidelines was of
special interest.
A considerable body of research has been published on the positives and
negatives surrounding WIC (e.g. food packages, infant mortality, funding, vendor
management), however, very few, if any documented studies have been conducted on the
participant post-WIC. While presenting at a conference sponsored by the Institute of
Medicine conference titled “Planning a WIC Research Agenda,” Sally E. Findley, of the
Mailman School of Public Health, Columbia University, provided the following
recommendations (2010):

3
If WIC is successful at achieving the goals of behavioral change, balanced
nutrition and weight gain, these changes may be lasting. WIC therefore need
studies which document different time frames of impact: Immediate or co-
terminus with WIC participation, short term (1-5 years post-WIC) and long-term
(5-10 years post WIC).
The mission of WIC is to improve the quality of participants’ diets by monitoring food
purchases of the more than 9.17 million “low-income pregnant, breastfeeding,
nonbreastfeeding postpartum women, infants and children up to five years of age who are
at nutritional risk” (USDA, 2010, para. 1) it serves. It accomplishes its mission by
utilizing WIC Works an online educational and training tool for staff and healthcare
professionals, the Core Nutrition Messages resource, and other educational resources
tailored for women and children audiences.
This study examined the impact participation in WIC had on influencing
nutritional behaviors of current and former WIC recipients. It was designed to determine
if a post-factorial effect exists as a result of the impact of social ecological influences,
specifically, participation in nutrition education sessions, WIC nutritional counseling, and
restricted purchase power impacted nutritional behaviors post-WIC. Results from this
study indicate an association exists between food choices made post-WIC and
participation in WIC. These findings may provide greater insight surrounding the
effectiveness of WIC’s educational programs, counseling, and food purchase restrictions.

4
Problem Statement
Obesity related deaths are preventable, yet five percent and 15.6% of Black men
and White men respectively and 26.8% and 21.9% Black and White women deaths are
attributed to overweight and obesity 1986-2006 (Masters, Reither, Powers, Yang, Burger,
and Link, 2013, pg. 1899) related condition. In a study designed to identify mortality
rates attributable to overweight and obesity, Masters, et al. concluded age, birth cohort
and period of observation are indicators that essential when defining mortality and
population rates (pg.1900). It is projected in the year 2030, 42% of all Americans will be
clinically obese (see Table 1) with a body mass index (BMI) of 30 lbs. /in2 or greater
(O’Grady and Capretta, 2012, pg. 10).
Table 1
Body Mass Index
BMI Weight Status
Below 18.5 lbs./in.2 Underweight
18.5-24.9 Normal Weight
25.0-29.9 Overweight
30.0 and above Obese
Note. Adapted from “How is BMI Interpreted for Adults”, by Centers for Disease Control
and Prevention, 2015, Retrieved from
http://www.cdc.gov/healthyweight/assessing/bmi/adult_bmi/index.html. Copyright 2015
by the CDC.

5
In the National Health and Nutrition Examination Study 2009-2010, 35.7% (i.e.
78 million) of all American adults were identified as obese while 16.9% (i.e. 12.5
million) of children and adolescent ages 6-9 years were identified as overweight or obese
(Ogden, et. al., 2012, p. 3). The prevalence of overweight and obesity in the United States
has tripled since the 1970s, and its impact on the economy has been just as significant.
The Centers for Disease Control and Prevention estimated the cost of obesity and related
co-morbidities (e.g., heart disease, sleep apnea, type II diabetes) cost $147 billion
annually to the American economy (CDC, 2012, para. 6), of which $66 billion was
because of annual losses in productivity (Hammond & Levine, 2010, p. 295).
The significance of this issue is underscored in Healthy People (HP) 2020;
science-based outline of objectives and health goals that if Americans take heed we might
see an improvement in our health by the year 2020. Healthy People 2020, a federal
initiative provides recommendations, information, and tools to assist Americans with
making informed decisions regarding their health and ultimately their quality of life.
Authorities consider nutrition, physical activity, and obesity as critical areas of concern,
particularly since obesity has reached epidemic proportions and why it is identified as
one of 10 leading health indicators targeted in this 2020 initiative. The following are a
few objectives under the Nutrition and Weight Status category, adults should do to
improve their health status; increase muscular strength by 10%; decrease the proportion
of adults, children and adolescents ages 2-19 who are obese by 10% (“Institute of
Medicine, 2011, p. 30); and increase vegetable consumption in diets of children 1.1-cup
equivalents per 1,000 calories (Healthy People, 2013, para. PA-2).

6
The Health and Human Services (HHS) Healthy People 2020 program (Institute
of Health of the National Health Academies, 2011) continues to provide a comprehensive
health agenda platform all Americans should follow to improve their quality of life and to
live long healthy years. A final assessment of objectives defined in Healthy People 2010
found a decline in coronary and stroke related deaths, yet, minimal to no change with
decreasing health disparities and obesity prevalence, yet overall, a 71% success rate in
achieving objectives according to HHS (Health and Human Services, 2011, para 1).
According to U.S. Health and Human Services Assistant Secretary of Health Howard K.
Kor, true change to address the short-fall will occur when there is “health in policies”
(U.S. Department of Health and Human Services, 2011, para. 3).
The obesity epidemic is not limited to a select socioeconomic class, level of
educational attainment, or race. The prevalence of obesity in children and adolescents has
more than tripled over the past three decades. The Economic Research Service the
research arm of the USDA, examined WIC participation and weight status from 1988-
2006, and concluded “boys who received WIC benefits had similar BMI and [were] less
likely to be at risk of overweight [than those who were] income eligible as
nonparticipants” and “girls whose families received WIC had similar BMI [to] income
eligible and higher income nonparticipants” (USDA, 2009, p. 2). Mexican American
boys and girls had a significantly higher BMI and were at greater risk of being
overweight than non-Hispanic White boys and girls; this difference was not statistically
significant during 1999-2006 for either gender. Non-Hispanic Black girls were, however,
at greater risk of being overweight than non-Hispanic White girls during 1999-2006.

7
Obesity is a national epidemic in the United States. This is due in part to a cultural
shift that over the course of 30 years has created an obesogenic environment. An
obesogenic environment is defined as “the sum of influences that the surroundings,
opportunities, or conditions of life have on promoting obesity in individuals or
populations (Lake & Townsend, 2006, p.264). Unhealthy nutritional habits have been
compounded by a robust technology industry that encourages physical inactivity. The
average time spent viewing television per day and using a smartphone by an18+ year old
is 4.2 hours , and 1.33 hours respectively (Nielsen, 2014, para 6). One third of every
American adult is obese, while 12.1% of children aged 2-5 years are overweight or obese
(Ogden, 2012, p.1). As reported by The Pediatric Nutrition Surveillance System the
prevalence of overweight and obese children enrolled in federally funded programs was
14.6% (n = 2,222,410) in 2008, (Centers for Disease Control and Prevention [CDC],
2009b, p. 769).
Nature of the Study
This was a quantitative study that utilized a causal-comparative design to
determine the effect and impact participation in WIC had on nutritional behaviors, long-
term. The study compared responses to a survey regarding food choices made by current
and former WIC recipients with those made by the control group. Controls represented
women who had not participated in WIC and never received benefits (e.g., the nutrition
education, health education counseling, or food subsidy vouchers) [See Operational
Definition of Non-WIC Participant]. Prospective study participants were invited to
participate in the study at a Walmart retail location located in a major southeastern

8
metropolitan urban city. Surveys were collected over a two-week period April 11-13,
2015 and April 17-19, 2015. The research questions and hypotheses were designed to
determine the effect social, cultural, environmental/setting, and personality factors had on
behavioral change that influenced ones’ attitudes and behaviors. The purpose of this
study was designed to address a need to investigate potential WIC post-factorial effects
on promoting positive behavioral change.
Research Questions and Hypotheses
The primary research questions were designed to address a need for literature on
this topic and may contribute additional information about on-going debates and
discussions surrounding modification of guidelines of other USDA food subsidy
programs.
Research Question 1 (RQ1): Are current food choices made by former WIC
participants the result of behaviors learned while participating in WIC-sponsored health
education classes, nutrition counseling, and restrictions to use food benefits/vouchers
only towards purchase of foods on WIC approved food lists?
H01a: There is no relationship between pre-WIC and post-WIC bread purchases
for the study group.
Ha1a: There is a relationship between pre-WIC and post-WIC bread purchases
for the study group.
Rationale 1:
This question is intended to examine USDA’s assertion that the federal nutrition
assistance programs, administered by the Food Nutrition Service, provides an

9
opportunity for program participants and eligible persons to maximize food
resources and make food choices that support and promote good health using
science-based, behavior-focused nutrition education and promotion strategies
(USDA, FNS, Office of Research and Analysis, 2010, p. 14).
Research Question 2 (RQ2): Have food choices made by controls changed over
the last two years?
H02a: There has been no change in what influence bread purchases for the
control group over the last two years.
Ha2a: There has been a change in what influenced bread purchases for the
control group over the last two years.
Rationale 2
A person’s dietary habits my change for various reasons (e.g. health status, price
point of food item, nutrition knowledge/education). The purpose is to identify
which variable had the greatest impact on influencing food choice(s) made by
controls.
Research Question 3 (RQ3): Does the primary variable that influenced food
choices differ between study and control groups?
H03a: There is no relationship between bread purchases by the study group with
bread purchases by the control group.
Ha3a: There is a relationship between post-WIC bread purchases by the study
group and recent bread purchases by the control group.

10
Rationale 3
Identifying similarities and differences in food choices made by the study
group compared with controls’ allows for additional insight for what
motivates purchases made by study participants. Additionally, this
provides evidence of a causation effect as a result of participation in WIC
and its program effectiveness particularly in shaping/influencing long-
term behavior change of program participants
Purpose of the Study
This study examined food purchases of current and former WIC beneficiaries,
with a specific focus on the purchase of wheat bread and buns. A 25 question survey
instrument was used to measure frequency and influence of purchases made by current
and former WIC participants as compared with the responses made by controls who
never participated in WIC. The overall goal of this study was to determine if participating
in WIC had an association on participants’ long-term nutritional behaviors.
Theoretical Framework
The theoretical framework for this study was based upon Urie Bronfenbrenner’s
social ecological model (1994). The theory suggests one’ behavior and attitudes are
influenced by their social ecological environment (e.g. microsystem, exosystem,
macrosystem) further sub-characterized by five additional levels. This model suggests
human development and eventually one’s behavioral patterns are understood and
influenced best, when all aspects of the ecological environment in which one lives are
acknowledged. Greater, five sub-levels of influence (intrapersonal, interpersonal,

11
community, organization, and policy), provide a comprehensive multilevel depiction of
these influences and how behavioral change is affected. The SEM was use by Glanz,
Rimer, and Viswanath (2008) to examine best practices in health care promotion and
health care practice and they assert “experts have explicitly recommended that
interventions on social and behavioral factors related to health should link multiple levels
of influence, including the individual, interpersonal, institutional, community, and policy
levels” (p. 10) for dramatic behavioral change to occur. The WIC program implements
intrapersonal, interpersonal, and policy influences in an attempt to effect long- and short-
term nutritional behavior changes of program participants and thus SEM was the choice
for the theoretical framework. In the section of this study titled SEM, additional
explanation of this framework is provided.
Operational Definitions
Because of the nature of this study, several specific definitions as set forth by the
Center for Effective Government, USDA, and the Department of U.S. Health and Human
Services are provided:
Automatic stabilizer: Economic policies and programs that are designed to offset
fluctuations in a nation's economic activity without intervention by the government or
policymakers (Center for Effective Government, 2011, para. 6).
Body Mass Index: A measure of body fat calculated using a person’s weight and
height. This study uses the BMI delineations from the Centers for Disease Control and
Prevention (see Table 1).

12
Breastfeeding women: “Women up to one year postpartum who are breastfeeding
their infants” (USDA, n.d., § 246.2, p. 353).
Children: “Persons who have had their first birthday but have not yet attained
their fifth birthday” (USDA, n.d., § 246.2, p. 353).
Food Instrument: “A voucher, check, electronic benefits transfer card (EBT),
coupon or other document which is used by a participant to obtain supplemental foods”
(USDA, n.d., § 246.2, p. 355).
Nutrition Education: A state or local agency may provide services (e.g., medical
referral, breastfeeding promotion) and encourage participation in activities (e.g., classes,
counseling) to improve participant’s knowledge of health and nutrition related
information. A participant cannot be denied benefits if she declines to nutrition education
services (USDA, n.d., § 246.10, p. 401).
Nutritional risk: Poor or declining health associated from a nutritional related condition
(e.g., diet, drug/alcohol abuse, biochemical) or environment climate (e.g., homelessness,
migrancy) which impair one’s health (USDA, n.d., § 246.2, p. 357).
Obesogenic environment: “obesogenic environment” refers to “an environment
that promotes gaining weight and one that is not conducive to weight loss” within the
home or workplace (Powers, Spears, & Rebori, 2010, p. 10).
Overweight and Obesity :According to the CDC Divisions of Nutrition,
“overweight” and “obesity” both are labels for ranges of weight that are greater than a
weight that is considered healthy for a given height. Adults 20 years or older are
categorized as overweight if their BMI is 25-30 lbs./in.2 and obese if their BMIs are > 30

13
lbs./in.2. BMIs for children aged 2-19 years are specific to age and sex and are known as
BMI-for-age. No exact measures are defined for this population of people.
Poverty: A state of being extremely poor. U.S. federal guidelines for poverty vary
based upon family size, and determine financial eligibility for certain federal programs.
The poverty threshold is a statistical measure used to estimate the number of people who
are impoverished (U.S. Department of Health and Human Services, n.d.).
Special Supplemental Nutrition Program for Women, Infants, and Children
(WIC): A federally funded health and nutrition program for women, infants, and children.
Supplemental Nutrition Assistance Program (SNAP): A U.S. federal government
program “in which eligible households receive benefits that can be used to purchase food
items from authorized retail stores and farmers’ markets” (USDA, n.d., § 246.2, p. 358);
formerly known as the Food Stamp Program.
WIC Nutrition Counseling: A service in which paraprofessionals and
professionals provide information and assistance on educational subjects (e.g.,
breastfeeding, nutrition, drugs) to participants.
Breakfast cereal: Any cold or hot instant or ready to eat meal which meets Food and
Drug Administration (FDA) nutrient guidelines [refer to the FDA for nutrition
guidelines] (USDA, n.d., § 246.10, p. 398)
Whole wheat bread/Whole grain bread/other whole unprocessed grains: Bread
and buns must contain 51% whole grain and low in saturated fats to be considered whole
wheat, grain or other whole unprocessed grain products [refer to the FDA for nutrition
guidelines] (USDA, n.d., § 246.10, p. 398).

14
Assumptions
Assumptions for this study:
1. WIC is effective at improving the nutritional value of diets of participants or
beneficiaries (e.g., pregnant women, new mothers, infants and children [up to
five years]), particularly if benefits are strictly used towards foods on the WIC
Approved Food list (see Appendix B).
2. All WIC study participants experience equal at best, similar levels of benefit
from counseling services rendered, health literature received and any other
affect had as a result of participating in WIC and adhering to program
guidelines
3. The WIC population within the southeastern metropolitan urban where
surveys were collected was representative of the WIC population within the
state of Georgia and the nation.
4. All Study group participants were enrolled in WIC and received benefits
Limitations
1. I was not granted direct access to Georgia Department of Public Health WIC
database/records for the purposes of contacting former WIC participants.
2. Some study participants may not have met the study criteria of having been
ineligible to receive WIC benefits (based upon program requirements) at time
of data collection.
3. USDA program eligibility of WIC is gender specific for females. Men were
excluded from this study

15
Delimitations
1. Participants will only be selected from the southeastern metropolitan urban
city.
2. Study participants were only asked about wheat bread/buns purchases (i.e. a
WIC approved food) regarding their purchase habits.
Significance of the Study
The purpose of this research study was to identify if participation in WIC had a
causal effect on current and former recipients’ nutritional behaviors. Study results found
an association between purchases made by current and former WIC recipients and
participation in WIC sponsored nutrition education and counseling sessions and
restrictions to purchase foods only on the WIC approved food list. Implications for this
research have the potential to be far-reaching. Study results established that former WIC
participants continue to purchase wheat bread/buns even after participation in WIC and
attribute their participation in WIC various programs that influenced this behavior. It
would be safe to reason that these families’ diets have been improved because of this.
Additionally, one might conclude that since children in these families may eat wheat
bread/buns, it is likely they are forming a behavior or attitude surrounding wheat bread
that if it is a positive attitude, this may become a choice that is lasting and perhaps stem
influence that is generational. Additionally, this research study may provide an
opportunity to provide additional information regarding WIC program effectiveness.

16
Summary
The premier program of USDA’s FNS, WIC, offers women, infants, and children
a means of improving their health and thus their quality of life. WIC assists low-income
families with invaluable resources by providing food subsidy, nutritional education, and
medical and social service referrals; these services may be considered gateways to a
healthier tomorrow.
The mission of WIC is to safeguard the health of those who need it most, yet, are
the least capable due to their circumstances (e.g., socioeconomic status, educational
attainment, health status) that prevent them from functioning at their best physiologically.
Sound nutritional behaviors and practices are essential to good health and why the USDA
is committed to and continues to strive towards providing a nutritional program that is
second to none. Women, Infants, and Children is a “short-term intervention program
designed to influence lifetime nutrition and health behaviors in a targeted, high-risk
population” (National WIC Association, 2013, para. 1).
The USDA has designed the nutritional format of WIC to include health
education materials and nutritional counseling that targets adults and adolescent
audiences and promotes the program’s central themes: increased consumption of fruits,
vegetables, and water; increased physical activity; and concepts of moderation. The
program achieves this goal using all forms of media (e.g., Internet, DVD, pamphlets). In
a second, all-out effort to encourage healthy nutritional practices, program guidelines
mandate that participants use food benefits only towards purchase of foods aligned with

17
the UDSA food pyramid guide that are science based nutritious foods according to the
World Health Organization and USDA.
The aim of this study was to identify the effect if any, participation in WIC had on
food choices; specifically the purchase of wheat bread/buns post-WIC. Interventions that
encompass influences at individual, interpersonal (e.g., family, friends), and policy (i.e.,
organization) levels may be the best approach to influencing behavioral change and
therefore have better success rates. Women, Infants, and Children is an intervention
program for persons whose diets are not nutritiously dense and though behavior
modification is not the focal point of the program’s mission, the foundation of the
program is closely aligned with Bronfenbrenner’s (1994) social ecological model for
behavioral change.
The motivation to conduct this study was to answer the following question:
“Why does SNAP not restrict choices recipients can make when using their benefits as
WIC does?” Americans live in a society where convenience, sedentary lifestyles (e.g.,
television/movie viewing, playing electronics [i.e., video games]), overconsumption of
fast foods, and excessive portion sizes are commonplace; creating an obesogenic
environment. Both WIC and SNAP programs were started in our country during a time
when the prevalence obesity was not at epidemic levels as witnessed present day. This
study was designed to examine if social ecological influences impacted behavioral
choices of WIC participants and results did indicate an association exist between food
choices made post-WIC and participation in WIC programs.

18
Chapter 2: Review of the Literature
Introduction
This chapter is a review of the literature surrounding health education
interventions and the impact they have on long-term nutritional habits. It examines
federally funded nutrition programs that utilized evidenced based approaches to promote
eating a healthy diet as a way of life. This review focuses on Women Infant, and
Children, one of more than 13 food nutrition programs funded by the federal government
that requires recipients participate in nutrition education programs. This program
provides health services for women and children who are at risk of disease and conditions
(e.g., anemia, infant mortality, underweight, overweight/obesity) common in this
population of people. Educating participants about the importance of incorporating
physical activity and sound nutritional habits as a component of their daily habits can
ultimately lead to a better quality of life (UDSA, FNS, 2006, para. 7). Nutrition education
is a central component in the success of WIC participants improving their health
outcome.
This review includes a discussion of landmark U.S. health policy decisions and
initiatives, as well as the significance of policy as a cornerstone of public health in
safeguarding the people it is designed to protect. Additionally, this section includes
details of WIC’s comprehensive nutrition programming including health education
counseling, and guidelines of the policy which requires the WIC food voucher be used
only towards purchase of foods found on the WIC approved food list. Results from this
study of food choices made by former WIC beneficiaries’ food choices indicate

19
participation in WIC program activities (i.e., counseling, nutrition/health literature) has
an association on the food choice post-WIC. Review of and consideration by the USDA
to impose additional restriction to purchase “approved” foods as done in the WIC
program, of other Food Nutrition food subsidy programs particularly the Supplemental
Nutrition Assistant Program (formerly the Food Stamp Program) this may help serve with
improving the diets of recipients of this and other food subsidy programs.
Literature Search Strategy
An extensive search of the literature was conducted 2010 - 2015 to identify what
studies had been conducted that examined the impact participation in WIC had on
attitudes and behaviors (e.g. nutritional, physical activity) post-WIC. The following
outlines the literature review strategy:

20
Item
Name and Host of the Database:
Time period searched:
Patient population:
Intervention:
Outcomes:
Databases searched:
Key Concepts:
Result
Walden University Library
December 2007 - 2012
Former and current WIC
participants
Recipient of USDA WIC benefits
Behavioral changes (e.g.
nutritional, physical activity)
Academic Search Complete
CINAHL Plus with Full Text
Ebsco ebook
Medline with Full Text
ProQuest Nursing and Allied
Health source
Sage Premier
Soc Index with Full Text
WIC, obesity, nutritional
behaviors, physical activity
behaviors, Post-WIC, former
WIC participants, SNAP,
purchase habits, restricting
purchase power, food subsidy
programs, USDA, overweight,
prohibited foods

21
The prevalence of obesity has reached epidemic proportions and the ability to
abate this problem appears to be bleak. The United State is one of the most powerful
industrialized nations in the world, with an annual gross national product of $14.11
trillion dollars, (World Bank, 2011), but ranks last amongst the “19 industrialized nations
evaluated in terms of preventing early deaths from certain chronic diseases, (Arvantes,
2008, para. 4).
Life expectancy at birth in the United States circa 1900 was 47 years, yet today,
average life expectancy is 77.9 years (Xu, Kochanek, Murphy, & Tejada-Vera, 2010,
p.1). The National Health and Nutrition Examination Survey (Ogden & Carroll, 2010,
para 2) reported the prevalence of overweight and obese adolescents aged 6-11 years in
2007-08 was 16.96%, compared with a rate of 4.25% in the years 1963-65. Obesity can
be debilitating to the health of an individual and why health officials project obese
adolescents will become obese adults, and therefore, less likely to reach their full life
expectancy.
According to the Centers for Disease Control and Prevention (CDC), the 10
leading causes of death in the United States in the year 2000 were chronic disease (e.g.
heart disease, cancer, cerebrovascular disease, chronic obstructive lung disease), and
other co-morbidities associated with overweight or obese (Mokdad, Marks, Stroup, &
Gerberding, 2004) conditions. The difference in the etiology between an infectious
disease which was the leading cause of death in 1900 and chronic illness, the leading
cause of death in the 21st century is communicability. Communicable or infectious
diseases are transmitted by contact with another individual. Chronic diseases are not

22
contracted by this means. Taber’s Medical Encyclopedia (Davis, 1985) defined infection
as “the state or condition in which the body or a part of it is invaded by a pathogenic
agent (microorganism or virus) that under favorable conditions, multiplies and produces
effects that are injurious” (p. 840). Conversely, chronic disease is characterized by
residual disability, permanence, nonreversible pathological alteration, and the need for
special training of the patient for rehabilitation or a considerable period of supervision
and observatory care (Turnock, 2004, p. 383).
The life expectancy of approximately 16% of obese children is dismal. In the
words of former U.S. Surgeon General Richard Carmona, “because of the increasing
rates of obesity, unhealthy eating habits and physical inactivity, we may see the first
generation that will be less healthy and have a shorter life expectancy than their parents”
(American Heart Association [AHA], 2010, para. 3). Thus, the projection of a 78-year
life expectancy may be short lived for an unfortunate portion of a vulnerable population;
U.S. children. America’s obesity problem continues to be a growing concern for public
health officials, the medical community, and policymakers, and why U.S. First Lady
Michelle Obama has joined the ranks and taken a stand to adopt childhood obesity as one
of her personal initiatives and started the Let’s Move Campaign.
Let’s Move Campaign
In February 2010, the Let’s Move campaigned launched, with a goal of reversing
childhood obesity in a single generation. This program, a national initiative, takes a
comprehensive approach to addressing this issue, providing four foundational pillars that
aggressively target the chronic disease. The approach is to target the family first;

23
encouraging parents to become involved with their child’s nutritional needs and promote
exercise; provide greater accessibility to more nutritious foods; emphasizes improving the
quality of school lunches; and supports physical activity (Let’s Move, 2010, para. 2).
Greater, to underscore the importance combating this problem, President Barack Obama
has, for the first time in the nation’s history, formed The Task Force on Childhood
Obesity, a task force dedicated to study childhood obesity.
The Task Force on Childhood Obesity formed in 2010 is comprised of senior
cabinet members (e.g. secretaries of: Interior, Agriculture, Education, Health and Human
Services, Director of Office Management and Budget) of the federal government; its
purpose is two-fold. The initial step is to conduct a full-scale review of all policies and
programs associated with nutrition and physical activity and the secondly and perhaps
most importantly, to implement a national model that offers the most effective strategies
to address this massive problem (the White House, 2010, para.4). This model will be
developed using an evidence-based multifaceted approach to mitigate obesity in America.
A multifaceted approach has proven to be beneficial as noted by Stokols (as cited in
Fleury & Lee, 2006) who recommends a shift toward more comprehensive interventions
in order to promote healthy behaviors regarding physical activity among African
American women he studied. The SEM, emphasizes the importance of a cohesive
interdependence of individual, relationship, community, organizational constructs and
policy (Fleury & Lee, 2006, p. 130) and in particular defines the impact policy has on
influencing behavior. In a review of literature, Fleury and Lee (2006) found social norms,
social support, socioeconomic status, motivation, and community resources to impact

24
behavior modification significantly amongst African American women, particularly
regarding their participation in physical activity. A multidimensional approach, as
defined by the SEM framework, may provide the research community with a greater
understanding of variables that influence behavior modification; the “ecological analysis
can sometimes lead to a diffuse and difficult test of explanations of health and illness” (p.
137).
Federally Funded Nutrition Programs
The following section provides the results of a literature review of studies
conducted to examine the effectiveness of interventions designed to increase healthy
behaviors of women enrolled in federally funded nutrition programs. The importance of
highlighting this literature review conducted by Vidourek and King (1998) is to gain
additional insight regarding approaches that may or may not have been found to be
effective with improving nutritional behaviors of this target population. Vidourek et al.
sought to identify approaches that had a significant impact on increasing and or
improving healthy eating behaviors of low-income women. Researchers identified 15
studies that met their study inclusion criteria. Ten of these had common themes and were
quite distinct in its methodology; however, three themes that emphasized how best to
improve nutritional behaviors of this population is discussed for purposes of this study.
The study criteria for inclusion, along with a brief overview of the missions of the
federally funded programs, followed by study results of the three major themes found to
be of significant for improving health behaviors are discussed.

25
The Expanded Food and Nutrition Education Program (EFNEP) is a nutrition
program funded by the USDA under the National Institute of Food and Agriculture. The
program targets audiences with limited resources that often prevent participants from
making the best choice for their individual and or family’s nutritional health. The EFNEP
serves approximately 500,000 families in need of which 80 percent live at or below
poverty.
The second program highlighted in the review is the Special Supplemental
Women, Infants, and Children (WIC). As explained, WIC is a federally funded health
and nutrition program for women, infants, and children who are deemed to be
nutritionally at risk. The program provides nutrition education, medical referral services,
and food subsidy for program participants who are at or below poverty. The WIC
program serves approximately 9,000,000, people.
The Eat Well Live Well Nutrition Education program is a community-based
program funded through the USDA via state Departments of Health and Human Services.
The mission of the program is to provide nutrition education to low income families who
live in rural and urban areas. No data found on participants served.
Study Inclusion Criteria
Publication dates were January 1, 2001 and January 1, 2007. Study population
included low-income females; nutrition and improvement of dietary behaviors;
publication in English; intervention within the United States only. Of the 15 studies
examined by researchers 10 common themes were; “1) WIC and EFNEP-based

26
interventions, 2) collaborative approaches, 3) theoretical framework, 4) learner-centered,
5) skills-based programs, 6) use of produce coupons or vouchers, 7) computer-based
programs, 8) culturally-based interventions, 9) peer teaching, and 10) recommendations
to include social support or physical activity. The following are key words: nutrition, low
income, Women, Infants, and Children (WIC), Stages of Change”(Vidourek & King,
2008, p. 57).
Themes
Of the 10 themes identified by Vidourek & King, the following were discussed
for this research study: learner-centered and individualized approaches; use of skill-
based approaches to enhance knowledge and self-efficacy; social support and increased
physical activity complemented with dietary changes.
Theme 1: Learner-centered and Individualized Approaches to Education
Learner-centered education is an approach of teaching a skill, discipline, or
behavior to a student or individual. This concept began to evolve in the mid-1990s and
continues to gain momentum in the educational community as studies conducted on this
approach have shown it to be highly effective and successful. The ideology; students
must become engaged in the learning process as active learners, unlike a traditional
context of learning, where the teacher has the knowledge or information that is shared
with the student via lecture, assigned reading(s), discussion, or another format. In a
review of literature on pedagogical approaches, Wright (2011) indicates students

27
tend to be more receptive to the centered learned approach than a traditional approach or
style of learning resulting in an improved performance (p. 95). Vidourek and King (2008)
reported that in a study conducted by Carson, Scholl, and Kassab, researchers found
when the learner-centered intervention was implemented in the Emergency Food
Education Program (EFNEP), results indicate improved effectiveness with teaching
nutrition education and healthy behaviors to low income families than interventions that
were group focused. Carson et al. concluded participants in learner-centered or more
individualized intervention programs were more likely to increase their consumption of
meals daily in addition to consuming a greater intake of dairy, fruit, iron, B6, and fiber
(p. 61).
Carson et al. (as cited in Vidourek & King, 2008) recommended the learner-
centered approach be taught to more instructors so that it can be instituted throughout the
EFNEP and other programs that use the group approach.
Theme 2: Use of Skill-based Approaches to Enhance Knowledge and Self-efficacy
The principles of skill-based approaches require the participant practice the skill
taught. In two of the interventions involving WIC recipients, study participants had a
significant propensity to implement or practice the skill taught in everyday life, if the
intervention concentrated on the use of a skill (Vidourek & King, 2008, p. 66). In a study
conducted by Boyd and Windsor (as cited in Vidourek & King, 2008), pregnant women
were taught health knowledge, methods of identifying social support, and how to make
healthy and develop healthy eating behaviors. Boyd and Wilson concluded, significant

28
improvements were made in participants’ behaviors and knowledge. In an intervention
that required WIC study participants read a “how to” recipe book and practice skills
found in a recipe booklet results indicate 70% of the study participants were more apt to
choose quality fresh produce after the intervention than before; 68% increased knowledge
regarding proper ways to store vegetables and fruit; and 74% had a better sense of
confidence about adding fruits and vegetables in meals (Vidourek & King, 2008, p. 62).
Additionally, Birmingham, Shultz, and Edelfsen (as cited in King, 2008) maintained that
family members of study participants were open to try recipes with fruits and vegetables
and reported incorporating fruits and vegetables into meals. Finally, a recommendation
made by Cason, Scholl, and Kassab, researchers who examined the effects of Social
Support and Increased Physical Activity Along with Dietary Changes suggested an
emphasis be placed on relationships and communication (e.g., telephone calls, individual
meetings) between clients and facilitators to promote long-term behavioral change
(Vidourek & King, 2008).
Health Policy
Health policy has long been proven as a proven approach to ensure improvement
for the good of public welfare. In the past, policy mandates (e.g., ban smoking in public
facilities, immunizations, seat belt use) designed to reverse or diminish adverse unfit
work environments, social inequalities, and improve health have been significant to
changing the protecting wellbeing of our nation. The following provides statistics of
major public health policies that have helped to revolutionize the significance of
epidemiological policy interventions:

29
“National Highway Traffic Safety Administration estimates safety belts have
saved 147,246 lives in the period 1975-2001” (Glassbrenner, n.d., p. 1).
Overall mean decrease in acute myocardial infarction of 17%, after ban on
public smoking was imposed (Schroeder, 2009, p. 1257).
After the speed limit was reduced to 55 mph in 1974, there was a 17%
decrease in fatalities (Physics.org, 2009, para. 3).
While these interventions have proven to provide positive change in the lives of
the people they are designed to protect, there have been, however, policy interventions
supported with legislative powers that were less effective with improving the population
is was intend for. An example of this was the Prevention of Youth Access Act of 2006,
which states the following:
Youth under the age of 18 years must not purchase, attempt to purchase, possess,
or attempt to possess a tobacco product, or present or offer proof of age that is
false or fraudulent for the purpose of purchasing or possessing a tobacco product.
A minor who violates this provision may be subject to penalties including a civil
fine up to $25, to include all applicable court costs, assessments, and surcharges.
(South Carolina Department of Health and Environmental Control, n.d.,
para.1)Not always is policy successful at achieving its intended outcome. In a
study conducted by Fichtenberg and Glantz (2002), which examined the
effectiveness of laws restricting the purchase of tobacco products by minors,
researchers investigated the correlation between “merchant compliance with
youth access laws and prevalence (30 day and regular) of youth smoking” and

30
found “there was no detectable relationship between the level of merchant
compliance and 30-day (r = .116; n = 38 communities) or regular (r = .017)
smoking prevalence” (p. 1088).
History of WIC
By an act of the United States Congress in 1972, WIC was formed under the
Child Nutrition Act of 1966. WIC provides supplemental foods, health care referrals, and
nutrition education subsidy to low income pregnant, breast-feeding, nonbreastfeeding
women, post-partum, infants, and children five years or younger who were considered to
be at nutritional risk (i.e., inadequate diet) and predisposed to medical risk (e.g., anemia,
underweight, pregnancy complications, poor pregnancy outcomes). In the year of 2009,
there were approximately 9,122,000 people receiving WIC (USDA, FNS, 2010, para. 4).
The program is not an entitlement program, which provides services to all eligible
applicants, but rather a grant-appropriated program providing designated funding for
annual operating costs. Upon depletion of the grant, no additional appropriations are
made until the next budget year. According to the USDA’s Office of Analysis, Nutrition,
and Evaluation, WIC’s operating budget for fiscal year 2005 was $5 billion, of which
$3.6 billion was spent on food subsidy (USDA, 2007, p. 1). Currently, there are 90 WIC
offices in the 50 United States and its legal territories.
Nutrition education is provided by local and private agencies to educate program
participants on how to make healthy food selections while considering cultural
preferences and other special household situations; “the intent is to help participants
continue healthful dietary practices after leaving the Program” (Federal Register, 2003, p.

31
2). Participants receive food allocations in the form of checks or other food instruments
(e.g., vouchers, electronic benefits transfer cards, coupons, or documents for the purchase
of food) to purchase foods found on the WIC Approved Foods list or food packages.
The food package is a detailed food list of WIC-eligible foods (see Appendix B).
Beneficiaries use this food package or list as a guide while grocery shopping. The food
package includes foods rich in iron, calcium, vitamin A and C, infant formula, and has,
since December 2007, incorporated more whole grains, fruits, vegetables, and cultural
foods to ensure program participants receive a wholesome, nutrient-dense diet. The
following is an example of a food package (see Table 2).
Table 2
Sample of WIC Food Package
Approved foods:
100% fruit and/or vegetable juice.
Hot or cold cereal, requiring not more than 21.2 grams of sucrose and other
sugars per 100 grams of dry cereal (i.e., not more than 6 grams of sucrose and
other sugars per 1 ounce of dry cereal).
Milk: whole, low fat, or nonfat.
Cheese, eggs.
Peanut butter.
Foods not approved:
Fruit drinks.
Fruit-flavored beverages.
Sodas.
Other beverages that are not 100% juice.
Cheese foods or spreads.
Peanut butter with added jelly, marshmallow, or other mixtures.
Adapted from “WIC Food Packages – Regulatory Requirements for WIC-Eligible
Foods”, by USDA Food Nutrition Service, 2015, Retrieved from
http://www.fns.usda.gov/wic/wic-food-packages-regulatory-requirements-wic-eligible-

32
foods#INFANT FOOD FRUITS and VEGETABLES. Copyright 2015 by the USDA
Food Nutrition Service.
In December 2007, the federal government made an interim ruling to revise the
food offerings. The new approved food list includes a variety of foods that accommodate
cultural preferences and affords state agencies the latitude to prescribe food packages that
promotes long-term breastfeeding. The improvements made to the WIC food package
received mixed reviews. The details can be found in Appendix H (see Appendix H).
In addition to its food subsidy, WIC provides counseling to promote breastfeeding
as well as substance use prevention education resources. WIC administrators understand
the importance of educating participants about the harmful effects caused by drug use and
why active participation in substance prevention education classes is strongly
encouraged. Additionally, breastfeeding promotion education is strongly encouraged. If a
women breastfeeds, she will receive an additional allocation in her food package, breast
pumps; and other supplies. Also, they are allowed to participate in the program longer
than the standard length of period.
History of the Supplemental Nutrition Assistance Program
The mission of the USDA food stamp program, established in 1964, is to provide
food subsidy benefits for low-income families, thus increasing their purchasing power
for healthier food selections. The food stamp program had a name change to the
Supplemental Nutrition Assistance Program (SNAP) in 2008 under the Obama
administration. In April 1964, legislation (i.e., The Food Stamp Act of 1964) under
President Johnson was passed; securing permanency of the program that would be
controlled by congress. The following highlights measures created under this legislation:

33
“the requirement that recipients purchase their food stamps, paying an amount
commensurate with their normal expenditures for food and receiving an
amount of food stamps representing an opportunity more nearly to obtain a
low-cost nutritionally adequate diet” (USDA, 2013a, para. 3).
“the eligibility for purchase with food stamps of all items intended for human
consumption except alcoholic beverages and imported foods (the House
version would have prohibited the purchase of soft drinks, luxury foods, and
luxury frozen foods)” (USDA, 2013a, para. 3).
“appropriations for the first year limited to $75 million; for the second year, to
$100 million; and, for the third year, to $200 million” (USDA, 2013a, para.
3).
Major reform of the Food Stamp Act of 1964 occurred in 1977; the Food Stamp
Act of 1977 set the stage for existing program guidelines. Highlights of this legislation
include:
“established statutory income eligibility guidelines at the poverty line”
(USDA, 2013a, para. 5).
“EPR eliminate the purchase requirement because of the barrier to
participation the purchase requirement represented” (USDA, 2013a, para. 5).
Finally, in 2004 the Electronic Benefits Transfer (EBT) card emerged, replacing
the paper food stamp voucher or coupons. Monetary allotments are loaded onto the EBT
card monthly and similar to bankcards. When a participant swipes their card at the check-
out counter, they are authorizing the transfer of government benefits to a retailer for

34
purchase of products (USDA, 2013a, para. 8). Additionally, by utilizing an electronic
tracking system, the EBT card enables effective management of program operations and
moreover, believed to be a useful approach to reduce fraud. Unfortunately, fraud is
rampant throughout the program among participants and store merchants. In a report to
determine the extent of trafficking of food benefits, the Food Nutrition Service, Office of
Policy Support (2013) conducted a study to identify abuse of SNAP benefits by studying
the rate at which benefits are trafficked and the number of stores involved. Key findings
from the report indicate 1.3% of benefits are trafficked, a value totaling $858 million
dollars. Results also found 10.5% of authorized retailers were involved in abuse. These
figures reflect a surge in participation of recipients and merchants over time (USDA,
2013b, p. 1).
To date the Food Nutrition Service (FNS), a division of USDA which administers
its nutrition programs, reports that SNAP provides benefits to an “estimated 11.7 million
households or 26.7 million people, with operating and program costs totaling $31.1
billion” (USDA, 2013a, para. 1). Of the 25.7 million serviced, half are children and of
this number, 66% are school aged. To identify if children were prone to become obese
from participating in the food stamp program, research generated by the Economic
Research Service, (2008) suggested this notion is baseless (p. 1), however, in 2010, the
USDA decided it would steer nutrition education to target obesity prevention as they
appreciate the prevalence of obese children and adults in the population it serves. The
Healthy, Hunger-Free Kids Act of 2010 (Public Law 111-296), section 241, requires
SNAP nutrition education (SNAP-Ed) to focus on three behavioral outcomes delivered in

35
individual and group settings. These are as follows: make half your plate fruits and
vegetables; increase physical activity; and maintain an appropriate calorie balance.
Although USDA understands the importance of impacting behavioral change among its
constituents, participation in SNAP-Ed sessions remains optional for program
participants.
Comparative Analysis of WIC and SNAP Programs
A comparison of WIC and SNAP programs is included to provide the reader with
an overview of differences and similarities of these signature USDA Food Nutrition
Service food subsidy programs. Table 3 shows a comparative analysis of the WIC and
SNAP programs.
Table 3
Comparative Analysis of WIC and SNAP Programs
Variable WIC SNAP
Target Population Pregnant, post-partum women,
infants, children with low
income; nutritional risk
Americans in “need”
Operating Budget $1.8 billion $7.8 billion
Grant/Entitlement Grant/authorized amount
annually
Entitlement/ automatic
stabilizer
meet eligibility = accepted
Population Served 8,907,840 47,000,000
Food Subsidy
Guidelines
Purchase WIC Approved Foods
only
Cannot purchase
“nonfood”, hot/foods that
can be eaten in the store
Education Breastfeeding, drug prevention,
nutrition education; required for
Targets three central
nutrition goals; participation

36
Need for the Research
According to CDC, an estimated 34% of American adults are overweight, which
suggest they are one to 34 pounds over their desired weight for height, while 32% of
adults are categorized as obese, weighing 35 pounds or more over their desired weight
(Hearne, Segal, Unruh, Earls, & Smolarcik, 2004, p. 3). Data from National Health and
Nutrition Examination Surveys (1976-1980 and 2003-2006) indicate the prevalence of
obesity has increased; for children aged 2-5 years, prevalence increased from 5.0% to
12.4%; for those aged 6-11 years, prevalence increased from 6.5% to 17.0%; and for
those aged 12-19 years, prevalence increased from 5.0% to 17.6% (CDC, 2013, p. 1).
Obesity is credited with contributing to numerous co-morbidities (see Table 4), often
leading to mortality. This is reflected in treatment of these diseases, which costs an
estimated $92.6 billion annually (Finkelstein, Fiebelkorn, & Wang, 2003, p. 225).
re-certification optional
Other Referrals to medical, social
services

37
Table 4
Obesity-related Co-morbidities
Obesity-related Co-morbidities
Hypertension
Dyslipidemia (for example, high total cholesterol or high levels of
triglycerides)
Type II diabetes
Coronary heart disease
Stroke
Gallbladder disease
Osteoarthritis
Sleep apnea and respiratory problems
Some cancers (endometrial, breast, and colon)
It is reported that 45 persons per hour die due to an obesity-related illness in the
United States. Obesity is not impervious to socioeconomic, educational, cultural,
religious, gender, or age variables. Statistics from the Surgeon General’s Report, Call to
Action to Prevent and Decrease Overweight and Obesity (United States Department of
Health and Human Services, 2001), indicate the following:
For all racial and ethnic groups, women whose income is < 130% of the
poverty threshold are 50% (estimated) more likely to become obese than
persons of higher socioeconomic status.
The prevalence of obesity increases until age 60 years and then begins to
decline.
More Mexican American men are overweight and obese than non-Hispanic
White and Black men.

38
There is a greater prevalence of overweight non-Hispanic White adolescents
from lower income families than those from higher-income families, while
Mexican American boys tend to have a higher chance of being overweight
than non-Hispanic White or Black boys.
Sadly, obesity is not restricted solely to America’s adult population. One of the
largest groups suffering from obesity today is America’s youth. Statistics confirms
childhood obesity is steadily on the rise, affecting one-third of American children, or
approximately 12,600,000 adolescents and youth. Overweight and obesity in children is
diagnosed by an assessment of BMI or their weight in relation to height for age and sex.
Should the BMI fall at the 85th percentile point on CDC Growth Charts, the child is
considered overweight and if at the 95th percentile then classified as obese (see Figure 1;
CDC, 2009a, para. 5). Table 4 provides body mass index information for adults.

39
Figure 1. CDC growth charts showing the interpretation of BMI for 10- and 15-year-old
boys. Adapted from “2 to 20 years: Boys Body mass index-for-age percentiles”, CDC,
2009, http://www.cdc.gov/growthcharts/data/set1clinical/cj41l023.pdf. Copyright 2009
by the Centers for Disease Control and Prevention.
These trends also are reflected in the federally funded WIC program, a food-
subsidy program designed to ameliorate the health and well-being of its program
participants. Additionally, nutrition education is provided by local and private agencies
to educate program participants about how to make healthy food selections while
considering cultural preferences and other special household situations; “the intent is to

40
help participants continue healthful dietary practices after leaving the Program” (Federal
Register, 2003, p. 2).
Edmunds et al. (2006) examined obesity trends of children enrolled in a New
York district WIC program between 1989 and 2003. They found “the prevalence of
overweight increased from 12.1% to 16.1%, and the prevalence of ‘at risk of overweight’
subjects increased from 13.3% to 16.1%” (p. 114). Edmunds et al. suggested the adoption
of Eat Well Play Hard by New York’s WIC program which encourages engagement in
physical activity and increased consumption of fruits, vegetables, and low-fat milk; foods
representative of WIC food packages. By doing so, this would aid in decreasing the
number of overweight children in this population of people (p. 115). Furthermore, they
recommended “WIC nutrition professionals to examine theories and practices of
behavioral change for adoption into WIC clinics to address the rising prevalence of
overweight” (p. 116).
Edmunds et al. (2006) are not alone in their recommendation to use policy to aid
in mitigating this crisis. It is important to note that nearly 70 years have passed and a
marked change has occurred in the nutritional needs and habits of Americans. However,
federally funded nutrition programs once intended to provide food subsidies to service
malnourished and deficient populations no longer represent the norm; programmatic
changes are warranted to provide services for populations of children who are overweight
or obese (Kennedy, 1999, p. 331). In an effort to examine the effect participation in WIC
has had on nutritional behaviors of its former recipients and the effects of social

41
ecological influences (e.g., individual, interpersonal, policy), the infrastructure of WIC
program was the emphasis of this social epidemiological study.
Social epidemiology is a branch of epidemiology intended to investigate the
impact social influences have on health behavior. The historical origins of this area of
study is a blend of medical, social, and psychiatric sciences designed systematically [to]
examine variations in the incidence of particular diseases among people diversely located
among the social structure and [to] attempt to explore the ways in which their position in
the social structure tended to make them more vulnerable or less, to a particular disease
(Berkman & Kawachi, 2000). Social variables are social phenomena such as
socioeconomic status, work conditions, personal relationships, and education, which
undoubtedly affect an individual’s life and behaviors, directly influencing health.
The Social Ecological Model
The Social Ecological Model (SEM) described by Bronfenbrenner (1994)
suggests that one’s development and eventually one’s behavioral patterns are understood
best when all aspects of the ecological environment in which one operates are
acknowledged. Each fraction of the ecological system (microsystem, mesosystem,
exosystem, and macrosystem), is thought to play a critical or central role in the
developing organism, yet when acting independently of each other, influences in the
ecological system may not be highly effective. When functioning in cohesion, the
ecological systems provide an optimum for impacting behavior. Accordingly, it is
necessary to acknowledge each component for its significance and contribution.

42
In Bronfenbrenner’s (1994) model, the microsystem, also named the interpersonal
influence, is believed to have the greatest influence on the individual. Those closest to the
individual, namely family, friends, co-workers, peers, and the neighborhood, often set the
tone of the individual’s foundational principles (e.g., morals, ethos), and disciplinary
actions. Those from whom life-skills are learned have an immense amount of influence
on the individual’s behaviors. The exosystem is the component of an organism’s
environment that is considered to have an indirect influence on human development and
behavior. The value of the exosystem resides in acknowledging the influences of
workplace, social networks, religious ties, and other facets of this component and their
effects on the organism. Finally, the macrosystem is centered on influences created
beyond the individual’s immediate environment and includes societal stimuli such as
customs, cultures, and laws. The macrosystem provides the platform or stage upon which
an organism lives its life. Figures 2 and Table 5 illustrate Bronfenbrenner’s Ecological
System and its components of influence, respectively.

43
Figure 2
Bronfenbrenner’s Ecological Theory.
Figure 2. Lists three primary levels of social ecological influences and its sub-
systems. Adapted from “Growth and Development Theory: Urie Bronfenbrenner
(1917-2005),” by Schoolworkhelper. Retrieved from
http://schoolworkhelper.net/growth-and-development-theory-urie-
bronfenbrenner-1917-2005/.Copyright 2010-2015 by SchoolWorkhelper.

44
Social Ecological Influences
Table 5
Overview of Bromfenbrenner’s SEM Levels of Influence:
Intrapersonal factors—Characteristics of the individual such as
knowledge, attitudes, behavior, self-concept, skills, and developmental
history. Includes gender, religious identity, racial/ethnic identity, sexual
orientation, economic status, financial resources, values, goals,
expectations, age, genetics, resiliency, coping skills, time management
skills, health literacy and accessing health care skills, stigma of
accessing counseling services.
Interpersonal processes and primary groups—Formal and informal
social networks and social support systems, including family, work
group, and friendship networks. Includes roommates, supervisors,
resident advisors, rituals, customs, traditions, economic forces,
diversity, athletics, recreation, intramural sports, clubs, Greek life.
Institutional factors—Social institutions with organizational
characteristics and formal (and informal) rules and regulations for
operations. Includes campus climate (tolerance/intolerance), class
schedules, financial policies, competitiveness, lighting, unclean
environments, distance to classes and buildings, noise, availability of
study and common lounge spaces, air quality, safety.
Community—Relationships among organizations, institutions, and
informational networks within defined boundaries. Includes location in
the community, built environment, neighborhood associations,
community leaders, on/off-campus housing, businesses (e.g., bars, fast
food restaurants, farmers’ markets), commuting, parking, transportation,
walk ability, parks.
Public policy—Local, state, national, and global laws and policies.
Includes polices that allocate resources to establish and maintain a
coalition that serves a mediating structure connecting individuals and
the larger social environment to create a healthy campus. Other policies
include those that restrict behavior such as tobacco use in public spaces
and alcohol sales and consumption and those that provide behavioral
incentives, both positive and negative, such as increased taxes on
cigarettes and alcohol. Additional policies relate to violence, social
injustice, green policies, foreign affairs, the economy, global warming.

45
Behavioral Changes and WIC
Bell and Gleason (2007) conducted a feasibility study using data from grocery
store point-of-purchase receipts to assess behavioral changes of WIC study participants.
Study participants volunteered to participate in the WIC-sponsored special nutrition
education intervention sessions at WIC agencies in the Washington State area. Baseline
measures were taken of their preferences for milk and cheese prior to the intervention.
Several grocery stores agreed to install scanning equipment that would detect and track
study participants’ purchase transactions using their WIC check identification number
linked to the Universal Purchase Code (UPC) barcode database. A UPC was assigned to
every food item on the grocery store shelf, allowing for accurate tracking of every food
item purchased. Study participants participated in one-on-one nutrition education sessions
at local WIC agencies for six to eight months, where they received a nutrition education
message encouraging the consumption of low-fat milk and cheese as alternatives to
higher-fat products. All study participants received a minimum of two educational
messages. Post-intervention measures were taken of milk and cheese purchases.
Researchers concluded a nutrition intervention designed to encourage the purchase of 1%
milk or skimmed milk and low-fat cheese by WIC participants (n = 296) utilizing point-
of-purchase receipts to track purchase did not have a significant influence on purchase
patterns. Researchers did conclude, however, that using point-of-purchase data is a
feasible way of assessing behavioral changes in WIC participants.
Many studies have been conducted to determine how behavioral habits and
decision making are impacted by social influences (e.g. SES, education, church, family),

46
which have resulted in the formulation of several theories. The trans-theoretical model
and SEM are widely used in the science of social epidemiology; as countless scientific
investigations have modeled study designs based upon these theoretical perspectives:
“The most effective intervention strategies are likely to incorporate both the individual
whose health behavior is in question and the larger community and governmental forces
that influence the life of that individual” (Emmons, 2000, p. 249).
Significant policies instituted by federal and state governments over the past
century have had a considerable impact on improving population health and advancing
our understanding of the importance of public policy and its effect on positively
influencing health outcomes. One example of public health policy that has had a
noteworthy effect on population health is the motor vehicular safety laws. The National
Traffic and Motor Vehicle Safety Act of 1966 was enacted as a result of the federal
government regulating safety standards (Turnock, 2004) which required mandatory use
of a seat belt and thus resulted in a decline in “vehicular rated fatality rates between 13-
46 percent” (p. 165). The USDA has an opportunity to invoke change in the diets of the
more than 4.6 million recipients of SNAP benefits by imposing greater restrictions of
purchase of healthier or a more nutritiously dense food, yet it stands by the fact the
evidence does not support imposing additional restrictions which could potentially make
a difference in the prevalence of overweight and obese SNAP program participants.
In January 2006, the USDA imposed policy requiring the quantity of trans fat in a
serving size of all food products be included on packaging (AHA, n.d., p. 1). The
American Heart Association (AHA) rallied food manufacturers to be more transparent

47
regarding the harmful effect consumption of industrially produced trans-fat has on the
heart and it continues to advocate for limiting the amount of unhealthy fats (e.g.,
cholesterol, trans fat, saturated fat) in restaurant food, snack foods, and school lunches.
The AHA recommends trans-fat should make up less than 1% of the total caloric intake
(p. 1). The benefits of this policy change are yet to be determined, however, any act that
assist in abating this problem is welcomed. Finally, in the spirit of promoting social
epidemiology, McKinley argued that “social system contributions, including
governmental policies, organizational priorities, and behaviors and practices of health
care professionals represent intervention strategies that have considerable potential for
yielding lasting health benefits” (Berkman & Kawachi, 2000, p. 249).
Research conducted by Bowman, Gortmaker, Ebbeling, Pereira and Ludwid
(2004) indicate there has been an 8% increase in the consumption of energy dense fast
food by children during a period of 1970-1990. In a study that examined the affect diets
high in fast foods had on dietary quality and its link to obesity risk, researchers found
study participants (n=6212) who consumed fast food or high-energy diets (e.g. fats,
carbohydrates, sugars, calories) had poorer dietary quality than study participants who
did not consume a diet of fast food. Bowman et al. concluded that dietary quality is
adversely affected by a diet of fast food can lead to a risk for obesity. Learned behaviors
or attitudes that encourage the practice of healthy behaviors consistently (e.g., eating a
nutritious diet, engaging in physical activity, refraining from smoking) are examples of
lifestyle practices that will assist in reversing childhood obesity and its associated co-
morbidities. It is to be expected one may, on occasion, make unhealthy food choices and

48
skip engaging in some form of physical activity daily, however, emphasizing the
importance of practicing sound nutritional and wellness habits to a child during his or her
formative years are essential to positive change whether the child has a problem with
obesity or not (Lobstein, Baur, Uauy, 2004).
Upon leaving the WIC program, participants may enroll in SNAP or discontinue
participation in federally subsidized food programs, at which time they have greater
control regarding decisions about their food choices (e.g., nutritiously dense,
healthy/nutritious, high in caloric content); no longer are they required to select food(s)
from the Approved WIC List. Hence, as a SNAP recipient they are less encumbered by
USDA restrictive guidelines and therefore, more empowered. WIC program guidelines
define the type and quantity of foods program participants are allowed to purchase with
benefits. Comparatively speaking, WIC program guidelines are far more restrictive than
SNAP, which imposes modest restrictions on food purchases and naturally, if one opts
not to or ineligible to participate in federally funded food subsidy programs, naturally
they have an unrestricted purchase power, allowing the purchase of any types and
quantity they desire. As reported by the World Health Organization in the Global
Strategy on Diet, Physical Activity, and Health, children whose parents exhibit positive
attitudes about their health are influenced by these behaviors (WHO, 2003). The purpose
of this study was to examine food selections of former and current WIC participants who
may currently enrolled and receiving both WIC and SNAP or another USDA food
subsidy program benefits; receiving benefits from one of 15 USDA food subsidy

49
programs other than WIC; not receiving and form of government food subsidies benefits
to investigate the following regarding current and former WIC participants:
1) Determine what influences food shopping behaviors
2) Determine if the variable that influence purchase of wheat bread/buns/rolls is
the same for both study and control groups
Summary
Approximately 3.4 million Americans die annually as a result of an obesity-
related illness, (World Health Organization, 2014) and one of many reasons why
innovative scientifically based approaches are needed if we are seeking to reverse the
obesity epidemic our nation faces. Data from National Health and Nutrition Examination
Surveys (1976-1980 and 2003-2006) indicate the prevalence of obesity has increased in
children considerably; the increase is threefold in some age categories (CDC, 2010).
Comprehensive approaches to abate this epidemic are paramount. President Barack
Obama is reviewing all nutritional and physical activity programs to create a
comprehensive national model in an effort to attack this problem with full force. A
multilevel approach (individual, interpersonal, community, organizational, public policy)
is one of the most effective approaches when seeking to affect preventative measures.
The purpose of this study was to investigate if there was a causal link between
participation in WIC and food choice selections post-WIC. This research study provided
a better understanding of WIC’s program effectiveness and contributed to the literature
surrounding to impose additional purchase restrictions of other USDA Food Nutrition
Service programs.

50
Chapter 3: Research Method
Introduction
The purpose of this study was to determine if participation in the Women, Infants,
and Children (WIC) had a causal effect on influencing the nutritional habits of its
recipients. When food shopping, U.S. consumer behavior is often influenced by several
factors, including but not limited to price-point index, marketing, brands, budget, food
availability, the nutritional value, convenience of preparation, taste, hunger, family
influence, and food insecurity concerns. WIC participants are faced have fewer of these
challenges because program participants are required to purchase food items from USDA
and FDA approved food packages (USDA, 2012, para. 1). This study examined how the
three main components of the WIC program; nutrition education; counseling, and
program policy have affected former WIC recipients’ long-term behaviors and decisions
regarding food purchases.
This federally funded program promotes and encourages sound nutritional habits
by imposing purchase of nutritiously dense foods for purchase by program recipients.
This is evident in the USDA’s most recently approved food packages, which are based
upon nutrition science; foods have greater fiber content and modest amounts of saturated
fat (USDA, 2014, p. 12274). Consuming foods that are nutritiously dense is ideal for
achieving immediate short-term goals when a participant is actively enrolled in WIC, and
why these influences were examined to identify if there was residual effect on molding
former participants’ behaviors post-WIC. There is a lack of data regarding an association
or causation between WIC participation and its impact.
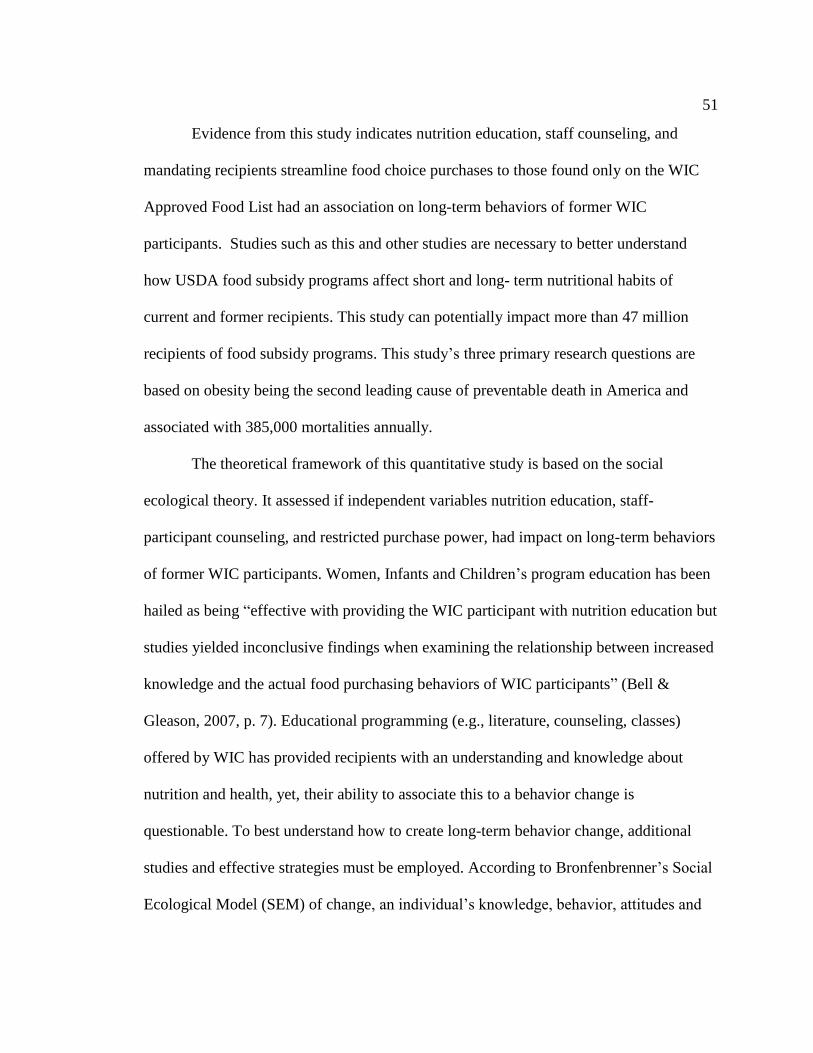
51
Evidence from this study indicates nutrition education, staff counseling, and
mandating recipients streamline food choice purchases to those found only on the WIC
Approved Food List had an association on long-term behaviors of former WIC
participants. Studies such as this and other studies are necessary to better understand
how USDA food subsidy programs affect short and long- term nutritional habits of
current and former recipients. This study can potentially impact more than 47 million
recipients of food subsidy programs. This study’s three primary research questions are
based on obesity being the second leading cause of preventable death in America and
associated with 385,000 mortalities annually.
The theoretical framework of this quantitative study is based on the social
ecological theory. It assessed if independent variables nutrition education, staff-
participant counseling, and restricted purchase power, had impact on long-term behaviors
of former WIC participants. Women, Infants and Children’s program education has been
hailed as being “effective with providing the WIC participant with nutrition education but
studies yielded inconclusive findings when examining the relationship between increased
knowledge and the actual food purchasing behaviors of WIC participants” (Bell &
Gleason, 2007, p. 7). Educational programming (e.g., literature, counseling, classes)
offered by WIC has provided recipients with an understanding and knowledge about
nutrition and health, yet, their ability to associate this to a behavior change is
questionable. To best understand how to create long-term behavior change, additional
studies and effective strategies must be employed. According to Bronfenbrenner’s Social
Ecological Model (SEM) of change, an individual’s knowledge, behavior, attitudes and

52
character are associated with their intrapersonal influences [e.g., educational attainment,
gender, health literacy, economic status], therefore arming an individual these attributes
is necessary.
The social ecological theory formulated by Bronfenbrenner (1994) suggests a
greater likelihood of behavioral change occurs when social ecological influences (e.g.,
intrapersonal, interpersonal, organizational, community, or public policy) are the
foundational principles of a program or treatment, (p. 39). The ultimate goal of WIC is to
increase the ability of pregnant and post-partum women, and children to consume a
nutritious diet. To support the mission of WIC and encourage long-term practice of
healthy behaviors, the USDA has established a multidimensional approach to address
these objectives. This approach is framed by and closely parallels components of the
social ecological model’s individual, organizational, and policy levels of influence. For
the purposes of this research study, individual, organizational, and policy level domains
within the WIC infrastructure specifically pertaining to (a) nutrition education, (b) policy,
and (c) stakeholder (i.e., personnel) involvement were examined.
When WIC participants participate in health education classes or receive literature
that promotes and encourages steps to make wise food choices, these are examples of
intrapersonal influence, (i.e., counseling conducted by WIC staff), while requiring
purchase of foods from a pre-approved food list is an example of policy level of
influence. Both of these are examples of constructs defined in Bronfenbrenner’s (1994)
social ecological theory. These, in addition to the two other influences, are essential when
behavioral change is an expected outcome. Covariates, associated with this study include

53
length of time enrolled in WIC. The time spent in nutrition education and counseling
sessions, and the quality of these educational tools may or may not influence the
dependent variable; purchase of wheat bread/buns a food item on the WIC Approved
Food Lists the dependent variable tested for this study.
A quantitative approach was used in this research study to allow for precision and
clarity of its purpose and to enhance the research ability of the problem. The study used a
causal-comparative experimental design that compared food purchases made by former
WIC participants with food purchases made by study participants who had never received
WIC in efforts. This comparison was made to document any statistical relationship
between participation in WIC and nutritional behaviors post-WIC.
Research Design
This study used an explanatory causal-comparative experimental design to guide
the data collection process. This design was ideal for this study because it provides
information regarding relationships that may exist between independent and dependent
variables, particularly if the event has already occurred (Brewer & Kuhn, 2010, p. 1). The
signature attribute of a causal-comparative design is that it attempts to identify
differences that may be present between two groups to determine cause and effect after a
treatment has occurred. I was is not afforded the opportunity to manipulate the dynamics
of the treatment; thus, a predetermined approach or methodology specific to exposure, be
it quantitative and/or qualitative, is nonexistent, which challenged and threatened the
veracity of the study’s reliability, internal validity, and thus causal conclusion(s).
Contrary to a randomized experiment, where the collective body of study participants’
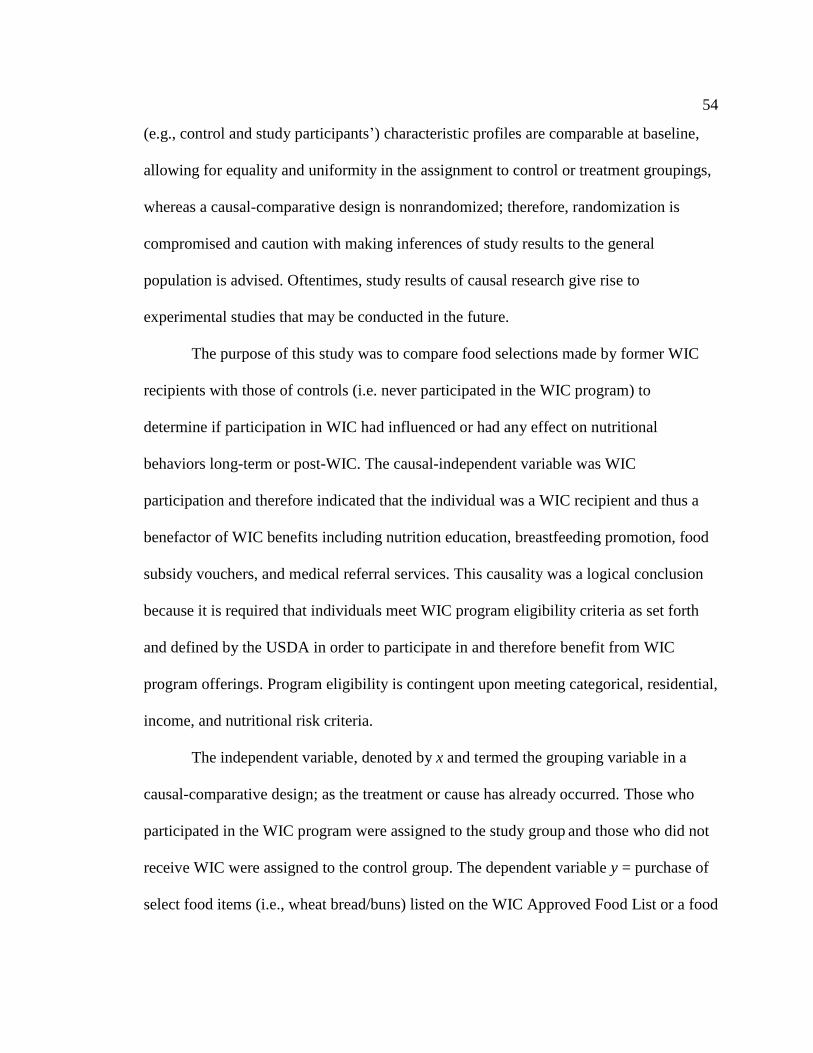
54
(e.g., control and study participants’) characteristic profiles are comparable at baseline,
allowing for equality and uniformity in the assignment to control or treatment groupings,
whereas a causal-comparative design is nonrandomized; therefore, randomization is
compromised and caution with making inferences of study results to the general
population is advised. Oftentimes, study results of causal research give rise to
experimental studies that may be conducted in the future.
The purpose of this study was to compare food selections made by former WIC
recipients with those of controls (i.e. never participated in the WIC program) to
determine if participation in WIC had influenced or had any effect on nutritional
behaviors long-term or post-WIC. The causal-independent variable was WIC
participation and therefore indicated that the individual was a WIC recipient and thus a
benefactor of WIC benefits including nutrition education, breastfeeding promotion, food
subsidy vouchers, and medical referral services. This causality was a logical conclusion
because it is required that individuals meet WIC program eligibility criteria as set forth
and defined by the USDA in order to participate in and therefore benefit from WIC
program offerings. Program eligibility is contingent upon meeting categorical, residential,
income, and nutritional risk criteria.
The independent variable, denoted by x and termed the grouping variable in a
causal-comparative design; as the treatment or cause has already occurred. Those who
participated in the WIC program were assigned to the study group and those who did not
receive WIC were assigned to the control group. The dependent variable y = purchase of
select food items (i.e., wheat bread/buns) listed on the WIC Approved Food List or a food

55
item(s) of the nutritional equivalent. Participation in WIC is qualified as ex-post-facto
meaning it occurred and was established prior to onset of this research study.
I collected data to determine whether participation in the WIC program affected
nutritional behaviors specific to food choices made by former WIC participants, post-
WIC. The operational definition of participation in WIC was as follows: Women between
the ages of 18 and 50 years of age who met the WIC eligibility requirements as defined
by the USDA and were enrolled in the WIC program.
WIC Eligibility Requirements
The following requirements are adapted from the U.S. Government Publishing
Office (2015):
Categorical
Women must be pregnant (during pregnancy and up to 6 weeks after the
birth of an infant or the end of the pregnancy), postpartum (up to six
months after the birth of the infant or the end of the pregnancy), or
breastfeeding [up to the infant’s first birthday] (Government Publishing
Office, 2015, para. §246.2).
Residential
Applicants must live in the State in which they apply. Applicants served in
areas where WIC is administered by an Indian Tribal Organization (ITO)
must meet residency requirements established by the ITO. At State agency
option, applicants may be required to live in a local service area and apply

56
at a WIC clinic that serves that area. Applicants are not required to live in
the State or local service area for a certain amount of time in order to meet
the WIC residency requirement (Government Publishing Office, 2015,
para. §246.2).
Income
To be eligible for WIC, applicants must have income at or below an
income level or standard set by the State agency or be determined
automatically income-eligible based on participation in certain programs.
Income Standard:
The State agency’s income standard must be between 100 percent of the
Federal poverty guidelines (issued each year by the Department of Health
and Human Services), but cannot be more than 185 percent of the Federal
poverty income guidelines.
Automatic Income Eligibility:
Certain applicants can be determined income-eligible for WIC based on
their participation in certain programs. These include:
Eligible to receive SNAP benefits, Medicaid, or Temporary
Assistance for Needy Families (TANF, formerly known as AFDC, Aid to
Families with Dependent Children), in which certain family members are
eligible to receive Medicaid or TANF, or at State agency option,
individuals that are eligible to participate in certain other State-

57
administered programs (Government Publishing Office, 2015, para.
§246.2).
Nutrition Risk
1) Applicants must be seen by a health professional such as a
physician, nurse, or nutritionist who must determine whether the
individual is at nutrition risk. In many cases, this is done in the WIC clinic
at no cost to the applicant. However, this information can be obtained
from another health professional such as the applicant’s physician.
“Nutrition risk” means that an individual has medical-based or dietary-
based conditions. Examples of medical-based conditions include anemia
(low blood iron levels), underweight, or history of poor pregnancy
outcome. A dietary-based condition includes, for example, a poor diet. At
a minimum, the applicant’s height and weight must be measured and
blood work taken to check for anemia. An applicant must have at least one
of the medical or dietary conditions on the State’s list of WIC nutrition
risk criteria (Government Publishing Office, 2015, para. §246.2).
2) Must have been enrolled in WIC a minimum of three months to
one year. Must have completed a minimum of two WIC recertification
cycles, which is equivalent to one (1) of enrollment and participation in
two staff nutrition education counseling sessions.

58
3) The primary grocery shopper in the household must be the person
who shops for groceries ¾ of the time groceries are purchased for the
household in a monthly buying cycle.
Operational Definition of Non-WIC Participant
The following are the criteria for the control group:
1) Must be female between the ages of 18 and 50 years with 1+ child.
2) Income must fall at or below 185% of the U.S. Poverty Income Guidelines
(see Table 6):

59
Table 6
WIC Income Eligibility Guidelines for the 48 Contiguous States, District of Columbia,
Guam, and Other U.S. Territories (July 1, 2014 to June 30, 2015)
Persons in
Family or
Household Size Annual Monthly
Twice-
Monthly Bi-Weekly Weekly
1 $21,590 $1,800 $900 $831 $416
2 29,101 2,426 1,213 1,120 560
3 36,612 3,051 1,526 1,409 705
4 44,123 3,677 1,839 1,698 849
5 51,634 4,303 2,152 1,986 993
6 59,145 4,929 2,465 2,275 1,138
7 66,656 5,555 2,778 2,564 1,282
8 74,167 6,181 3,091 2,853 1,427
For each
additional
member, add
+$7,511 +626 +313 +289 +145
Note. Adapted from WIC Eligibility Guidelines, by U.S. Department of Health and
Human Services, 2015, Retrieved from http://www.fns.usda.gov/wic/wic-income-
eligibility-guidelines. Copyright 2015 by USDA.
3) The primary grocery shopper in the household must be the person who shops
for groceries ¾ of the times groceries are purchased for the household in a
monthly buying cycle
4) Participant has never enrolled in WIC and therefore has not received WIC
benefits as an adult; however, a participant may have received WIC as an
infant and/or child. This may be considered a confounder.
Study participants are not randomly selected in a causal comparative design, therefore,
regression analyses are conducted to minimize this threat or weakness.

60
Setting and Population
The setting for this study was southeastern metropolitan suburban city Fulton
County. According to the Business Chronicle for this city, it is the ninth-largest
population in the country with an estimated population of 5,490,000 people. The state of
Georgia reports 303,875 families participated in WIC for fiscal year 2013 (USDA,
2013b), a 6.6% decrease in families served since February 2013. Greater details of state
population demographics can be found in Appendix F.
Sampling Method
The sampling method selected for this study is nonprobability convenience
sampling. This was the primary method of choice of sampling techniques due to an
inability to obtain access to the WIC participant files of former participants. I contacted
the USDA and spoke with the Director of Special Nutrition Research Analysis in the
Division of Office and Policy Support USDA, FNS. I requested access to data files,
specifically, contact information of former participants and was told “petitioning to be
granted permission to WIC participant records is not only a lengthy process but the IRB
would more than likely be denied.” Convenience sampling is the more practical sampling
approach with respect to this barrier, yet in an effort to identify and recruit former WIC
participants as effectively as possible, potential study participants were recruited
accordingly:
3) Zip codes where the median income ranges from $11,000-$45,000. The
rationale for recruiting in zip codes with a median income of $11,000-$45,000
is that this income reflects the characteristic average median income of WIC

61
participants (i.e., $10,808). Recruiting in these areas increases the likelihood
of recruiting former WIC participants. Potential study participants were
recruited at the Historic West Village Wal-Mart; the zip code is 30314 (see
Appendix I for physical address). Table 7 shows zip codes that were
considered for recruitment areas.
Table 7
Zip Codes Considered for Recruitment of Study Participants
Zip Code Median Income
30337 $28,627
30318 $28,589
30354 $28,155
30314 $19,438
30313 $13,084
30032 $35,084
30312 $20,094
30080 $45,514
30134 $46,580
Table 7. Adapted from Basic Zip Code Search, by ZipWho, 2013, Retrieved from
http://zipwho.com/. Copyright 2014 by ZipWho.
Convenience sampling is a nonprobability sampling technique and therefore does
not have a defined method or approach for isolating a true sample size. The actual size of
the sample is determined by the investigator’s insight and judgment of an appropriate
sample size (Laerd, 2012).
While convenience sampling is not deemed a robust sampling technique because
of nonrandomization, it remains the best choice because of ease of accessibility to the
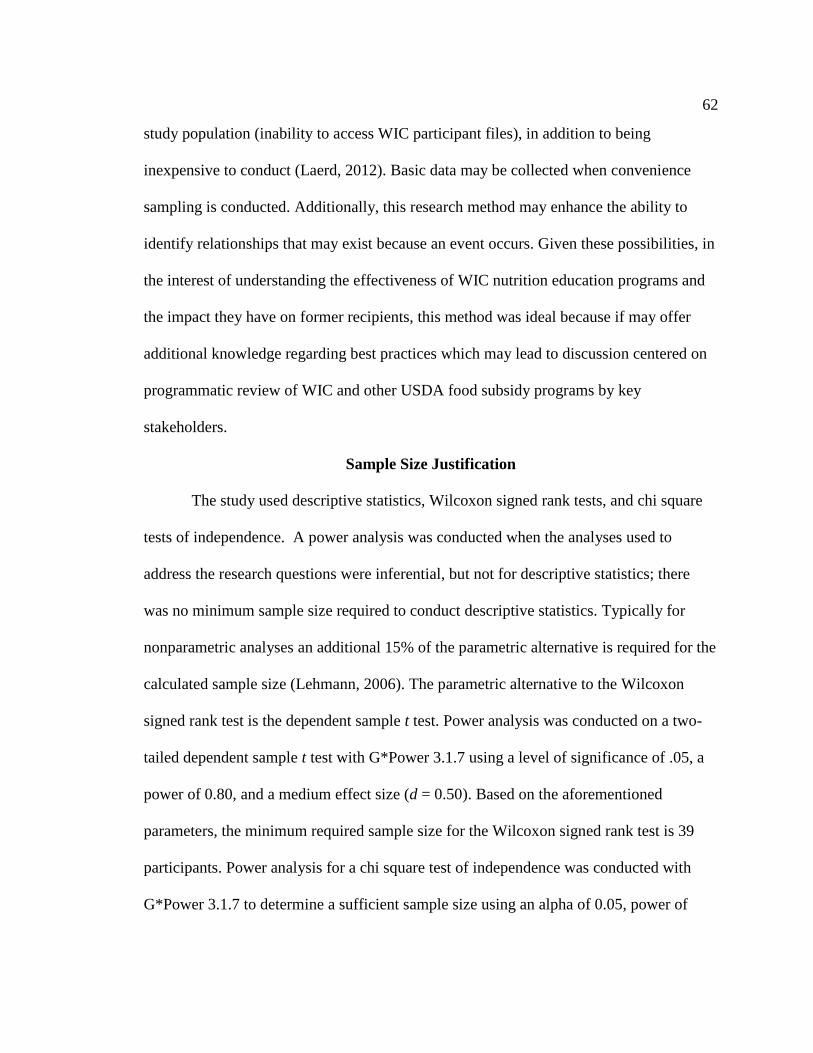
62
study population (inability to access WIC participant files), in addition to being
inexpensive to conduct (Laerd, 2012). Basic data may be collected when convenience
sampling is conducted. Additionally, this research method may enhance the ability to
identify relationships that may exist because an event occurs. Given these possibilities, in
the interest of understanding the effectiveness of WIC nutrition education programs and
the impact they have on former recipients, this method was ideal because if may offer
additional knowledge regarding best practices which may lead to discussion centered on
programmatic review of WIC and other USDA food subsidy programs by key
stakeholders.
Sample Size Justification
The study used descriptive statistics, Wilcoxon signed rank tests, and chi square
tests of independence. A power analysis was conducted when the analyses used to
address the research questions were inferential, but not for descriptive statistics; there
was no minimum sample size required to conduct descriptive statistics. Typically for
nonparametric analyses an additional 15% of the parametric alternative is required for the
calculated sample size (Lehmann, 2006). The parametric alternative to the Wilcoxon
signed rank test is the dependent sample t test. Power analysis was conducted on a two-
tailed dependent sample t test with G*Power 3.1.7 using a level of significance of .05, a
power of 0.80, and a medium effect size (d = 0.50). Based on the aforementioned
parameters, the minimum required sample size for the Wilcoxon signed rank test is 39
participants. Power analysis for a chi square test of independence was conducted with
G*Power 3.1.7 to determine a sufficient sample size using an alpha of 0.05, power of

63
0.80, a medium effect size (w = 0.3) and 25 degrees of freedom. Based on the
aforementioned parameters, the minimum required sample size for the chi square test of
independence is 254 participants, however, only 95 participants participated in this study;
Instrumentation and Materials
The instrument used in this study was a 25-question survey requiring the
respondent to answer questions about weight and its relationship to health and the type,
frequency, and influence of food choices made over a period of time. Although the
purpose of this study was to explore the influence of WIC on food choices, a few survey
questions were designed to determine the respondents’ basic knowledge about excessive
weight status (e.g. overweight, obesity) , and its association to co-morbidities (e.g.,
diabetes, hypertension, cancer). It is my opinion that it is necessary to identify, at
minimal, if respondents associate weight with health; no additional data regarding this
topic will be collected. The remainder of survey questions were dedicated to identifying a
respondent’s food preference for wheat bread/buns and if that preference has changed
over time, and if so what variable influenced this change.
I designed a behavioral frequency rating scale specifically to examine the
frequency of purchase of select foods (i.e., 100% whole wheat bread/buns), temporal
measures, and variables that influenced these choices. A Likert-type scale is the basis of
the frequency component of this instrument.
The Likert-type instrument was used in this study. A 25-question survey queried
respondents regarding their purchase habits pre-, during, and post-WIC. The survey was
designed to evaluate the study and control groups’ likelihood of purchasing 100% whole

64
wheat bread/buns; a food approved by USDA as an approved food (see Tables 8 and 9).
Responses will be measured using a six-point Likert-type frequency scale designed for
this research study.
Table 8
Behavioral Frequency Scale for Study Group
Food
Item
Pre-WIC During WIC Post-WIC
Bread
If you needed bread on six
separate grocery store visits
before you received WIC, how
often would your purchase 100%
whole wheat bread, rolls, or
buns during these visits?
100% of the time/Always 6
90% of the time/Usually 5
80% of the time/Often 4
70% of the time/Sometimes 3
60% of the time/Seldom 2
0% of the time/Never 1
Was your selection based on:
Taste
Nutritional benefits
Cultural influence
Price
other
If you needed bread on six
separate grocery store visits when
you were enrolled in WIC, how
often would your purchase 100%
whole wheat bread rolls, or
buns during these grocery visits?
100% of the time/Always 6
90% of the time/Usually 5
80% of the time/Often 4
70% of the time/Sometimes 3
60% of the time/Seldom 2
0% of the time/Never 1
Was your selection based on:
Taste
Nutritional benefits
Cultural influence
Price
other
If you needed bread when you no
longer received WIC, how often
would your purchase 100%
whole wheat bread, rolls, or
buns during these visits?
100% of the time/Always 6
90% of the time/Usually 5
80% of the time/Often 4
70% of the time/Sometimes 3
60% of the time/Seldom 2
0% of the time/Never 1
Was your selection based on:
Taste
Nutritional benefits
Cultural influence
Price
other

65
Table 9
Behavioral Frequency Scale for Control Group
Food
Item
Purchases made during
the past 2 years
Purchases made during
the past year
Purchases made during
the past 6 months
Bread
If you needed bread during
six separate grocery store
visits five years ago, how
often would you have
purchased 100% whole
wheat bread, rolls, or buns
during these visits?
100% of the time/Always 6
90% of the time/Usually 5
80% of the time/Often 4
70% of the time/Sometimes 3
60% of the time/Seldom 2
0% of the time/Never 1
Was your selection based on:
Taste
Nutritional benefits
Cultural influence
Price
other
If you needed bread during
six separate grocery store
visits three years ago, how
often would you have
purchased 100% whole
wheat bread, rolls, or buns
during these visits?
100% of the time/Always 6
90% of the time/Usually 5
80% of the time/Often 4
70% of the time/Sometimes 3
60% of the time/Seldom 2
0% of the time/Never 1
Was your selection based on:
Taste
Nutritional benefits
Cultural influence
Price
other
If you needed bread during six
separate grocery store visits
during the last year, how often
would you have purchased
100% whole wheat bread,
rolls, or buns during these
visits?
100% of the time/Always 6
90% of the time/Usually 5
80% of the time/Often 4
70% of the time/Sometimes 3
60% of the time/Seldom 2
0% of the time/Never 1
Was your selection based on:
Taste
Nutritional benefits
Cultural influence
Price
other
A Likert item is the statement framed for the respondent to answer for example,
“how often did you purchase 100% total wheat bread/bun,” while the Likert scale is the
total sum of the numerical values associated with each Likert item, it is not to be
confused with the scale itself or the range of values (1-6) associated with the scale. A
good Likert-type scale has a neutral, often positioned between opposing sides making it
equivalent; the numerical value in this example of the two suggests the respondent does
not have a dislike of or an affinity for a food item; rather, the respondent may or may not

66
purchase a food item. Additionally, I made certain all questions were centered on a
common theme (e.g., frequency of purchases) to ensure reliability; “all of the items
would be categorically similar so the summed score becomes a reliable measurement of
the particular behavior or psychological trait you are measuring” (Vanek, 2012, para. 2).
Reliability and Validity of Likert Scale
Numerous schools of thoughts exist regarding the reliability and validity of
Likert-type scales; “reliability is independent of the number of scale points” (Chang,
1994, p. 205) or “reliability is maximized using 7-pt, 5-pt, and 3-pt scales” (p. 205). A
general rule about reliability suggests that the greater the number of test items, the more
accurate the test; yet too many test items may compromise the test reliability.
Additionally, it is important to note that if a respondent relies on guessing, this too
threatens reliability. Other factors that may compromise test reliability include trick
questions, timed tests, and distractions (e.g., pencil lead breaking) (Anonymous, n.d., p.
3). In a study that examined the reliability and validity of 4-point and 6-point Likert-type
scales, it was concluded that “both the reliability and the heterotrait monomethod
correlations were substantially reduced for the 6-point scale. Within the multitrait-
multimethomatrix framework, the 4-point scale had greater reliability than the 6-point
scale” (Chang, 1994, p. 212). “The number of scale points in a Likert-scale affects
internal consistency reliability and HTMM validity but not HTHM validity” (Chang,
1994, p. 212).
The study group was asked to answer questions about purchases made before
enrolling in WIC (i.e., pre-WIC), while enrolled in WIC (i.e., during-WIC), and when

67
they were no longer enrolled in WIC (i.e., post-WIC). The control group will be asked to
answer questions regarding purchases they made two years ago, one year ago and six
months ago. If respondents cannot accurately remember their food preferences as far
back as two years ago, this may result in guessing and create a climate of recall bias
threatening the internal validity of this study.
Recall bias is a form of informational bias and is defined as “intentional or
unintentional differential recall (and thus reporting) of information about the exposure or
outcome of an association by subjects in one group compared to the other” (Hassan,
2013, para. 3). “Research tells us that 20% of critical details of a recognized event are
irretrievable after one year from its occurrence and 50% are irretrievable after 5 years”
(para. 4). Of the various methods recommended to reduce recall bias, suggestions
recommended are:
“Use standardized, closed-ended questionnaires to promote consistency and
specificity” (Dugan, 2013, p. 1).
“Ask subjects about their knowledge of the study hypothesis (at end of
interview), and analyze data accordingly” (Dugan, 2013, p. 1).
Because of this criteria of closed ended questions were used for this study to reduce recall
bias. It is important to note the following: “little to nothing can be done once information
bias has occurred and information bias cannot be “controlled for” in the analysis”
(Dugan, 2013, p. 1).

68
Measures
The dependent variable or the variable of interest for this study was purchase of
whole wheat bread/buns. I examined how frequent and what influenced the purchase of
wheat bread/buns by study participants when grocery shopping. Although food choices
may be influenced by several variables (e.g., price, cost, taste), the aim was to
concentrate on identifying if former WIC participants are influenced by habits adopted as
a result of participating in nutrition education workshops, health nutrition literature
received, and purchasing of food items from the WIC approved food list.
An antecedent variable is defined as a variation of the dependent variable used to
describe the correlation between two other variables that may have a relationship. The
following is an example of an antecedent variable; warm weather typically has a direct
relationship with ice cream sales and the incidence of crime. In this example the
antecedent variable is summer; both sales of ice cream and incidence of crime increase in
the summer time. In another example, given the antecedent variable is pregnancy, the
following may apply. Prior to enrolling in WIC, pregnant women make healthier
nutritional choices out of concern for the health of their unborn child as well as her own
health. Sometimes, pregnancy may create its own health complications (e.g., gestational
diabetes, high blood pressure), again requiring the mother to eat a select diet consisting of
healthy foods, abstaining from alcohol consumption, and smoking which, may negate the
primary objective of WIC, to encourage women to eat a nutritious diet; therefore, this
may serve as an antecedent variable may be problematic.

69
The independent variable is the variable the researcher may control or
manipulate; its designation is signified by the letter x. The independent variable for this
study was participation in WIC and by default requires participation in WIC-sponsored
nutrition education workshops and purchase of foods found on WIC Approved Food
Lists. As noted, the independent variable is one that can be manipulated by the
researcher; however, in some instances the independent variable is fixed and therefore
cannot be manipulated, as in this study. For example, a person’s health belief is a variable
that may not be manipulated, as this belief may have been learned as a child and/or
cultivated from experiences that may have developed over the years. Therefore, the ideas
and attitudes regarding one’s personal health are ingrained and often times un-
manipulative. Another variable that cannot be manipulated is one’s medical/personal
health history; specifically, if a study participant or family member has a documented
food allergy. A food allergy to milk or a religious belief banning the consumption of
select foods are examples of intrinsic or intervening independent variables that cannot be
manipulated. Participation in WIC was not manipulated for this study. Time enrolled in
WIC ranged from one year to as long as 5 years, additionally, the health nutrition
literature received and counseling experience one study participant received may have
been vastly different from another’s experience and cannot be manipulated. Further
discussion regarding time enrolled in WIC is discussed in Chapter 4.
Quantitative variables include income, price of food, years of education, years
enrolled in WIC, age. Qualitative variables include gender, race, cultural influences,
health belief, and medical history.
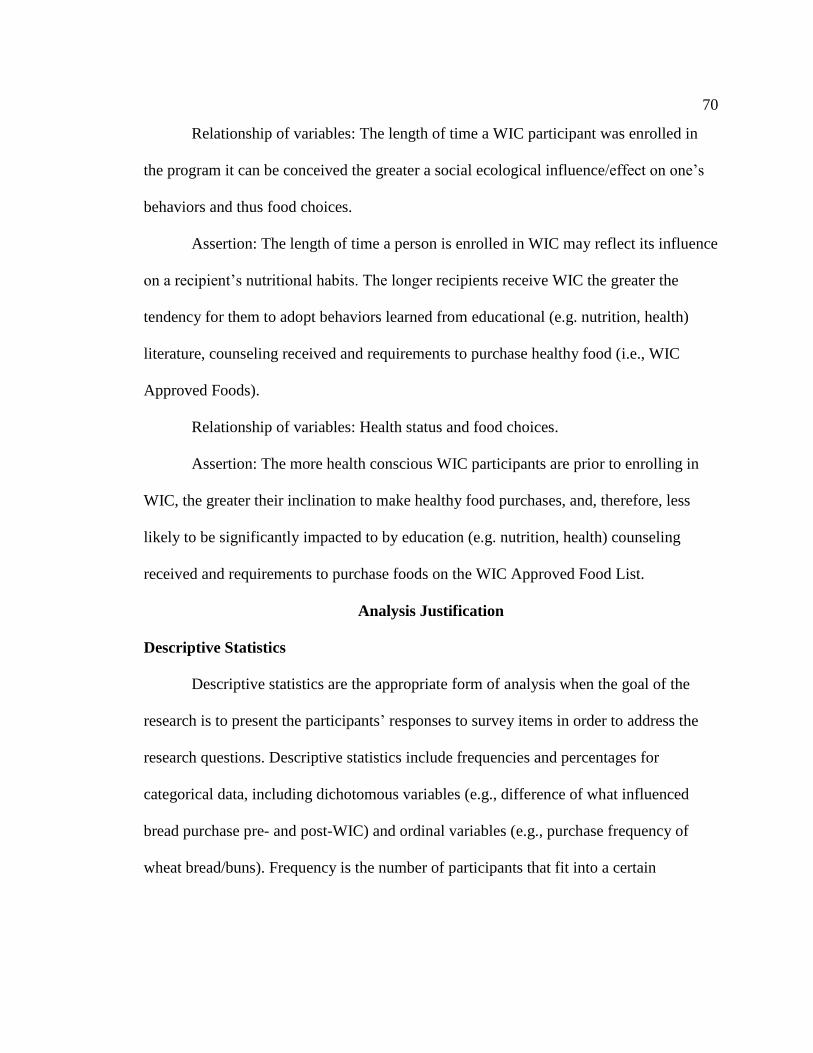
70
Relationship of variables: The length of time a WIC participant was enrolled in
the program it can be conceived the greater a social ecological influence/effect on one’s
behaviors and thus food choices.
Assertion: The length of time a person is enrolled in WIC may reflect its influence
on a recipient’s nutritional habits. The longer recipients receive WIC the greater the
tendency for them to adopt behaviors learned from educational (e.g. nutrition, health)
literature, counseling received and requirements to purchase healthy food (i.e., WIC
Approved Foods).
Relationship of variables: Health status and food choices.
Assertion: The more health conscious WIC participants are prior to enrolling in
WIC, the greater their inclination to make healthy food purchases, and, therefore, less
likely to be significantly impacted to by education (e.g. nutrition, health) counseling
received and requirements to purchase foods on the WIC Approved Food List.
Analysis Justification
Descriptive Statistics
Descriptive statistics are the appropriate form of analysis when the goal of the
research is to present the participants’ responses to survey items in order to address the
research questions. Descriptive statistics include frequencies and percentages for
categorical data, including dichotomous variables (e.g., difference of what influenced
bread purchase pre- and post-WIC) and ordinal variables (e.g., purchase frequency of
wheat bread/buns). Frequency is the number of participants that fit into a certain

71
category. Percentages were calculated to assess the proportion of the sample that
corresponds with the given frequency.
Wilcoxon Signed Rank Test
The Wilcoxon signed rank test is the appropriate form of analysis when the goal
of the research is to determine if a change exists between one group of participants’
responses when measured on the same scale at two different time points or when
participants are matched on some characteristic. The test converts the responses to ranks
and compares the differences between the two time periods (Pallant, 2010). The
Wilcoxon signed rank test uses nonparametric analysis and given the nonparametric
nature of this statistical analysis, there are fewer assumptions to assess. The assumption is
that data is obtained from random samples of populations (Brace, Kemp & Sneglar,
2006).
Chi Square Test of Independence
The chi square test of independence uses nonparametric analysis and is the
appropriate test to determine if there is a significant relationship between two categorical
variables, such as group and purchase frequency. The calculated chi-square coefficient
(2) and the critical value coefficient was compared to determine the significance of the
results. Using an alpha of .05 and given the degrees of freedom, if the calculated value is
larger than the critical value it indicates a significant relationship. The degrees of freedom
for a chi-square test were calculated using the following equation: (r - 1) x (c - l), where c
equals the number of columns and r equals the number of rows (Howell, 2010).

72
Analysis of Variance for Repeated Measures
An analysis of variance (ANOVA) is designed to identify the difference(s)
between two means of a sample for measures taken over three or more time points and
also may be used to identify the difference(s) of means that exist when a sample is
exposed to three or more conditions. The repeated measures ANOVA uses an F-statistic,
a value used to determine the statistical significance of a model. An F-statistic is a ratio
of the variance between group means to project the variance within the group means.
The ANOVA for repeated measures between two groups was used to analyze if a
difference of significance exist between study and control groups.
Data Analysis Plan
Data was collected and entered into SPSS 21.0 for Windows for analysis.
Descriptive statistics was compiled to describe the characteristics of the sample. The
characteristics of the sample came from the demographic portion of the survey and
examined by groups (e.g. study vs. control). Frequencies and percentages are calculated
from categorical data, primary area of employment, and weight description. Means and
standard deviations were calculated from continuous data, including age, current income,
and years of receiving WIC benefits.
Research Questions and Hypotheses
RQ1 Are current food choices made by former WIC participants the result of
behaviors learned while participating in WIC-sponsored health education
classes, nutrition counseling, and restrictions to use food benefits/vouchers
only towards purchase of foods on WIC approved food lists?
73
RQ2 Has the variable which influenced food choice made by the control group
changed over the past two years?
RQ3 Does the primary variable, which influences food choice, differ between
study and control groups?
Research Question One
Are current food choices made by former WIC participants the result of behaviors
learned while participating in WIC-sponsored health education classes, nutrition
counseling, and restrictions to use food benefits/vouchers only towards purchase of foods
on WIC approved food lists?
H01a: There is no relationship between pre-WIC and post-WIC bread purchases
for the study group.
Ha1a: There is a relationship between pre-WIC and post-WIC bread purchases
for the study group.
To address research question one, two sets of analyses were conducted. The first
sets of analyses conducted were frequencies and percentages for wheat bread/bun
purchases using the Behavioral Frequency Rating Scale. Frequency periods examined by
time were pre-WIC, during WIC, and post-WIC. The survey questions pertaining to
bread will ask: If you needed bread on six separate grocery store visits before WIC/when
enrolled in WIC/when you no longer received WIC, how often would you purchase 100%
whole wheat bread, rolls, or buns during these visits. For pre-WIC, during WIC, and
post-WIC, the response options will range from 1 = 0% of the time or never to 6 = 100%
of the time or always; these were treated as ordinal variables.

74
The second set of analyses conducted was the Wilcoxon signed rank tests used to
determine if a statistically significant change exists between pre-WIC and post-WIC
purchase frequencies of bread. To address hypothesis 1a, a Wilcoxon signed rank test
was conducted between pre-WIC bread purchase frequency and post-WIC bread purchase
frequency. Statistical significance will be determined with a level of significance of .05.
Research Question Two
Has what influenced choice made by controls changed over the past two years?
H02a: There has been no change what influenced bread purchases for the control
group over the last two years.
Ha2a: There has been a change in what influenced bread purchases for the
control group over the last two years
To address research question two, two sets of analyses were conducted. The first
sets of analyses conducted examined frequencies and percentages of wheat bread/bun
using the Behavioral Frequency Rating Scale: bread was examined by time periods (two
years ago, one year ago, and six months ago). The survey questions pertaining to bread
asked: If you needed bread on six separate grocery store visits two years ago, one year
ago, and six months ago, how often would you purchase 100% whole wheat bread, rolls,
or buns during these visits. For two years ago, one year ago, and six months ago, the
response options range from 1 = 0% of the time or never to 6 = 100% of the time or
always; they were treated as ordinal variables.
The second set of analyses conducted was an ANOVA test to determine if a
significant change exists between the influence variable to purchase bread over the time

75
periods. To address hypothesis 2a, an ANOVA for repeated measures was conducted
between bread-purchase frequency two years ago, one years ago, and six months ago.
Statistical significance was determined with a level of significance of .05.
Research Question Three
Does the primary variable, which influences food choice, differ between study
and control groups?
H03a: There is no difference between the primary variable that influences food
choice for the study and control groups.
Ha3a: There is a difference between the primary variable that influences food
choice for the study and control groups.
To address research question three, an ANOVA for repeated measures between
two groups was conducted to determine if a significant relationship exists between what
influenced bread choice for the study group compared with the control group. Post-WIC
purchase influence for bread was treated as an ordinal and dichotomous variable where
response were nutritional value and some other variable (e.g. culture, price, taste, WIC).
For hypothesis 3a, an ANOVA for repeated measures between groups was conducted to
determine if a statistically significant relationship exists between the variable that
influenced post-WIC bread choice by the study group and compared with the influence
variable for controls at six months. Statistical significance was determined with a level of
significance of .05.

76
Ethical Protection of Participants
This research study was conducted to examine the impact the Special
Supplemental Nutrition Program for Women, Infants, and Children (WIC) had on
influencing food choice behaviors post-WIC (i.e., former-WIC recipients). The
following provides details of how study participant’s privacy and confidentiality were
protected:
I invited prospective participants who were female, 18 years or older, with one or
more children to participate in this study. The study group included women who met
USDA program guidelines for WIC in addition to having received WIC benefits (x=
study group). Conversely, the control group (y = control group) included women 18 years
or older, yet had never received WIC benefits. Males were not invited to participate in
this study, as USDA WIC program eligibility requirements for do not include males.
A letter was distributed to shoppers at the Historic West Village Wal-Mart retailer
located in a southeaster metropolitan urban city. Invitees were not coerced to participate,
but offered a $5 Walmart gift card as a thank you, for taking part in the study and for any
other research related inconveniences incurred. The willingness to participate by
submitting their survey served as an act of implied consent. Age verification was not
required. Additionally, the initial question of the survey required the study participant to
consent she is of legal age (i.e., 18 years or older) to participate before access is granted
to start of survey:
“By answering yes to this statement you agree to the following: 1) I am 18 years
or older; 2) I will not impersonate any person or entity; 3) I am not participating

77
in this study against my will; 4) I have one or more children; the prospective
participant is automatically directed to the “disqualification page” which reads
“Minors under age 18 are disqualified from participating in the “Social Ecological
Influences of WIC Programming Survey on Behavior Change of Former WIC
Participants”. Thank you.
It is important to note, if participants were disqualified at this stage of the survey
because she did not meet study criteria she still was entitled to receive gift card. If the
participant partially completed the survey and withdraws before completing entirely, she
was still entitled to receive gift card. This was explained in the general information
question and answer period/session prior to procession of survey. Additional details
about the nature of the study (e.g. purpose, sample copy of study questions, risks, data
security) and an opportunity to ask questions were always an option.
The Federal Policy for Protection of Human Subjects defines minimal to no risk
to a human study participant as “the probability and magnitude of harm or discomfort
anticipated in the proposed research are not greater, in and of themselves, than those
ordinarily encountered in daily life or during the performance of routine physical or
psychological examinations or tests [Federal Policy §___.102 (i)]” (Department of Health
and Human Services, 1993, para. 1). Participants were only asked to answer questions
regarding food choices made over various time periods. The following is an example of a
survey question:
“If you needed rice on 6 separate grocery store visits when you were no longer
enrolled in WIC how often would you purchase “wheat bread/buns” during these
grocery store visits”?

78
a. 100% of the time / Always (6 out of the 6 times)
b. 90% of the time / Usually (5 out of the 6 times)
c. 80% of the time / Often (4 out the 6 times)
d. 70% of the time / Sometimes (3 out of the 6 times)
e. 60% of the time / Seldom (2 out of the 6 times)
f. Less than 0% of the time (1 out of the 6 times)
Additionally, the survey required the respondent to provide demographic information
(e.g. age range, income range, educational status). For a complete list of survey
questions see Copy of Survey Questions (see Appendix E).
Protecting the confidentiality of human study participants is the utmost
importance. The survey was conducted through Survey Monkey an online survey
website. To ensure confidentiality, the survey did not contain any information that
allowed me to identify a study participant. Survey Monkey is a self-serve survey tool
utilized by millions of users and is committed to secure data of its users. The following is
a brief synopsis of how data is secured.
Survey Monkey retains data responses as long as the account holder has an active
account, yet once the account is cancelled access and usage is restricted. I will delete
responses two years after completion and confirmation of doctoral studies.
Summary
The study was designed to examine former WIC program participants to
determine if participation in WIC programs (e.g. nutrition counseling, health education
literature, restrictions to use food subsidy benefits only towards purchase of WIC
Approved Foods) influenced food choices post-WIC. The purpose of WIC is to improve
the health of low income families particularly women, infants, and children who are
nutritionally at risk and not a behavior modification intervention program, WIC has

79
garnered a reputation for improving the health of those served by providing health
education courses and literature, counseling, and food subsidy benefits to its recipients.
The research questions for this study were based on the problem statement. The
theoretical framework of this quantitative study is based on the Bromfenbrenner’s social
ecological theory. This study used an explanatory causal-comparative experimental
design to guide the data collection process. This design was selected because it “seeks to
find relationships between independent and dependent variables after an action or event
has already occurred” (Brewer & Kuhn, 2010, p. 1). The sampling method selected for
this study was a nonprobability convenience sampling as this was primarily because of an
inability to obtain access to the WIC participant files of former participants.
The instrument used was a 25-question survey requiring the respondent to answer
questions about weight status (e.g. overweight, obese) its relationship to health, and the
frequency, and influence of food choices made over a period of time. Females between
the ages of 18 and 50 years of age who met the WIC eligibility requirements as defined
by the USDA and enrolled in the WIC program = (x1) served as the study group while
females between the ages of 18 and 50 years of age who never received WIC served as
controls.

80
Chapter 4: Results
Introduction
The aim of this study was to identify the impact participation in the Supplemental
Nutrition Program for Women, Infants, and Children (WIC) had on nutrition behaviors of
current and former recipients. This chapter presents the statistical analyses conducted to
address this study’s research questions. It also includes a discussion of the study
participants’ demographic and descriptive statistics, as well as discussion of Wilcoxon,
ANOVA, and general linear regression statistical tests performed and an interpretation of
findings. This chapter concludes with a summary of results.
I invited potential study participants to complete a questionnaire regarding their
food choice behaviors. I specifically formulated the questionnaire to assess the frequency
of purchase of wheat bread/buns and what influenced this choice. Collections of the
surveys were conducted April 11-13, 2015 and during final visits to the retailer April 17-
19, 2015. The dataset includes 95 (N = 95 observations) participants of whom n = 63
(66.31%) represented WIC cases (i.e., current or former recipients of the USDA WIC
food subsidy program) and n = 32 (33.68%) controls (i.e., people who never received
USDA WIC food subsidy benefits).
Participant Demographics and Descriptive Statistics
Data was collected from N = 95 participants (see Table 10), all of whom were
women ranging in age from 18-42 years. The number of years of education of the sample
included one person (3.13%) who completed grammar school, 41 (44.44%) whose
highest level of education was high school, 17 (20.63%) who completed vocational

81
school, and 31 (43.76%) who held masters, professional, or doctoral degrees. A majority
(58.9%) of the sample worked in a full-time capacity. Variances of income ranged
significantly, with 55 (57.9%) reporting annual earnings of < $30,000 and 18 (8.9%)
reporting an income of > $60,000. Eighty-two (86.3%) participants indicated English as
their primary language and 71 (74.7%) reported having 1-3 children. The participants
worked in all areas of the workforce (See Figure 3) and some received benefits from
other USDA food subsidy programs (See Figure 4).

82
Table 10
Demographic of Study Sample by WIC Status
Variables All
Ever participated in
WIC?
Ever participated in
WIC?
no yes no yes
n n n % %
What is your age?
9 3 6 9.38 9.52 18-25
26-33 27 4 3 12.50 36.51
34-41 22 8 14 25.00 22.22
42 and over 37 17 20 53.13 31.75
What is your current
household income?
22 7 15 21.88 23.81 Under $10,000
10,000-19,900 18 1 17 3.13 26.98
20,000-29,000 15 5 10 15.63 15.87
30,000-39,000 9 1 8 3.13 12.70
40,000-49,000 4 1 3 3.13 4.76
50,000-59,000 9 6 3 18.75 4.76
60,000-69,000 3 0 3 0.00 4.76
70,000-79,000 5 5 0 15.63 0.00
80,000 and over 10 6 4 18.75 6.35
What is your primary
language?
82 29 53 90.63 84.13 English

83
Variables All
Ever participated in
WIC?
Ever participated in
WIC?
no yes no yes
n n n % %
Spanish 7 1 6 3.13 9.52
Other 6 2 4 6.25 6.35
What is your highest level of
education completed?
5 0 5 0.00 7.94 Some high school
High School 41 13 28 40.63 44.44
Vocational school 17 4 13 12.50 20.63
Bachelor's degree 18 7 11 21.88 17.46
Master's degree 7 4 3 12.50 4.76
Professional degree 5 2 3 6.25 4.76
Doctoral degree 1 1 0 3.13 0.00
Grammar school 1 1 0 3.13 0.00
Which describes your
current employment status?
6 3 3 9.38 4.76 Disabled unable to work
Unemployed 9 3 6 9.38 9.52
Student 13 7 6 21.88 9.52
Retired 3 0 3 0.00 4.76
Homemaker 8 0 8 0.00 12.70
Full time employed 56 19 37 59.38 58.73

84
Variables All
Ever participated in
WIC?
Ever participated in
WIC?
no yes no yes
n n n % %
How many children do you
have?
2 0 2 0.00 3.17 Missing = no response
1-3 children 71 29 42 90.63 66.67
3-5 children 16 3 13 9.38 20.63
more than 6 children 6 0 6 0.00 9.52
How many children under 6
years of age live in your
household?
9 4 5 12.50 7.94 Missing = no response
none 39 14 25 43.75 39.68
1-3 children 41 14 27 43.75 42.86
3-5 children 6 0 6 0.00 9.52

85
Figure 3. Note: Study Participants’ primary areas of employment.
1
1
2
1
4
5
1
5
2
17
15
1
2
1
21
1
1
1
1
N = 95
Frequency distribution

86
Figure 4.Note: Study participants enrolled in USDA food subsidy programs at the time
of the study.
CSFP = Commodity Supplemental Food Program;
FDPIR = Food Distribution Program on Indian Reservations;
NSLP = National School Lunch Program;
SBP = School Breakfast Program;
SNAP = Supplemental Nutrition Assistance Program;
SUB WIC = WIC only;
SUB NONE = None of these
The dataset of the variables was collapsed to provide summary statistics of the
original study sample to facilitate interpretation of data. A bivariate table was constructed
via WIC status that compares cases with controls against the following variables:
understanding of health in relation to weight status; age; income; education; employment

87
status; primary language; number of children; number of children age 6 years or younger
living at home. A Pearson Chi-Square test was conducted on the categorical data to
determine the probability of independence of the study sample in efforts to identify if it
was representative of a distribution that was expected. Note, Fisher’s exact test was
appropriate to use when conducting 2 x 2 contingency tables specifically when the
sample size is small (i.e., <5) or when a researcher has defined marginal sums (Sheskin,
p.506, 2003).

88
Table 11
Bivariate Table of Variables (Collapsed) by WIC Status; N = 95
Ever received WIC?
Variable n No Yes χ
2
n (%) n (%) P-value
Being overweight may contribute to
health problems? 0.73
†
No 5 2 (6.5) 3 (4.7)
Yes 89 29 (93.5) 60 (95.2)
Obesity may contribute to health
problems? 0.41
†
No 6 3 (9.4) 3 (4.9)
Yes 87 29 (90.6) 58 (95.1)
Age 0.08
18-25 9 3 (9.4) 6 (9.5)
26-33 27 4 (12.5) 23 (36.5)
42 and over 37 17 (53.1) 20 (31.8)
Income 0.01
Less than $30,000 55 13 (40.6) 42 (66.7)
$30,000 - $59, 000 22 8 (25.0) 14 (22.2)
$60,000 or more 18 11 (34.4) 7 (11.1)
Education 0.30
High school or less 47 14 (43.8) 33 (52.4)
Vocational school 17 4 (12.5) 13 (20.6)
Bachelor's 18 7 (21.9) 11 (17.5)
Master's/professional/doctoral 13 7 (21.9) 6 (9.5)
Employment Status
Full time employed
56
19 (59.4)
37 (58.7) 0.23
†
Other 17 3 (9.4) 14 (22.2)
Primary Language 0.58†
English 82 29 (90.6) 53 (84.1)
Spanish 7 1 (3.1) 6 (9.5)
Other 6 2 (6.3) 4 (6.4)
Children 0.02
1-3 children 71 29 (90.6) 42 (68.9)
4 or more children 22 3 (9.4) 19 (31.2)
Children under 6 years 0.26†
None 39 14 (50.0) 25 (43.1)
1-3 children 41 14 (50.0) 27 (46.6)
4 or more children 6 0 (0.0) 6 (10.3) † Fisher’s exact p-value

89
As shown in Table 11, the variables of age, income, and children across WIC status have
p = 0.08, .01, and 0.02, respectively, signifying marginal significance to significant
between the two groups. Results of the test indicate women who participated or received
WIC were slightly younger than those who never participated or received WIC. A p =
0.08 or a marginal significance of difference for age exists between the two groups.
Twenty-three (36.5%) cases reported age between 26-33 years while 17 (53.1%) controls
reported age as 42 years and older. According to the USDA’s report titled “WIC
Participant and Program Characteristics 2012 Final Report” 865.9% (N=2,300,065) of
women receiving WIC in April 2012 were between the ages of 18 and 34 years (USDA,
pg. 20, 2013); the sample for this study was representative of the national WIC
population for the age variable. It is important to note, WIC eligibility guidelines defined
by the Georgia Department of Public Health (the state in which this study was
conducted), indicate there is no age requirement to receive WIC benefits, only that the
women is pregnant and meet all program eligibility (e.g. income, residence)
requirements.
A p = 0.01 for income is indicated between the two groups. Women who
participated in WIC reported a lower annual income than women who never participated
in WIC. Forty-two cases (66.7%) reported incomes ≤ $30,000 representative of a little
less than half the cases, while 11 (34.4%) controls reported an income of ≥ $60,000
annually. USDA report 66% of WIC recipients nationally reported annual incomes at or
below Federal poverty levels; $15,000 was the median annual income for April 2012
(USDA, 37, 2013). This difference between cases and controls in this study groups may

90
be attributed to the variance in age. Cases who represent the 18-33 year cluster (i.e.
46.03%) of the study population may not have reached their true earning potential versus
more than half of the study population (i.e. 53.1%) representative of the 34-42 or older
who may have reached a point where they have maximized their earning potential or and
earning well beyond federal poverty guidelines.
Cases n=63 reported having more children than controls n=32; 42 (68.9%) and 19
(31.2%) respectively. This difference may be attributed to several factors (e.g. family
planning, educational pursuits, advanced and professional degrees) however, this study
was not designed to test these variables.
The results of the dataset indicate there are no extreme differences between the
cases and control groups with the exception of age, income and children variables.
Cases WIC History
The following section includes analyses using frequency tables to illustrate study
cases’ (n=63) WIC history (e.g. how many years received WIC, first year of WIC, last
year of WIC). The purpose for questioning cases regarding their WIC participation was to
identify if they were former or a current recipient at the time the study was conducted and
to establish how many years or their length of stay in the program. Cross-tabulation
analyses were conducted against these variables (e.g. wicyears, first year /WIC, last
year), to determine if there were any relationships within the data that might not be
apparent. Note extreme caution was exercised with making inferences surrounding
results. The following were questions asked about WIC history:
How many years did you receive WIC benefits? (See Table 12)

91
What year did you initially receive WIC benefits? (See Table 13)
What year did you last receive WIC benefits? (See Table 14)
Table 12
Answers to the Question “What Year Did You Initially Receive WIC Benefits?”
wicyr1 Frequency Percent
Cumulative
Frequency
Cumulative
Percent
prior to 2000 23 37.10 23 37.10
2000-2005 12 19.35 35 56.45
2005-2010 13 20.97 48 77.42
2010-2014 14 22.58 62 100.00
*Frequency missing = 1
Table 13
Answers to the Question “What Year Did You Stop Receiving WIC Benefits?”
wicyr2 Frequency Percent
Cumulative
Frequency
Cumulative
Percent
prior to 2000 21 33.33 21 33.33
2000-2005 13 20.63 34 53.97
2005-2010 9 14.29 43 68.25
2010 to present 20 31.75 63 100.00

92
Table 14
Answers to the Question “How Many Years Did You Receive WIC Benefits?
wicyears Frequency Percent
Cumulative
Frequency
Cumulative
Percent
1-6 months 7 11.29 7 11.29
6-12 months 10 16.13 17 27.42
1-3 years 20 32.26 37 59.68
3-5 years 25 40.32 62 100.00
Results
Twenty-three (37.10%) cases received WIC benefits prior to the year of
2000, 21 (33.33%) received WIC in the year of 2000, and the average length of
participation in the program was 3-5 years representative of 25 (40.32%) responses.
Table 15 below is a cross tabulation table displaying the variables wicyears,
(representative of the number of months to years a case may have participated in WIC)
crossed by the frequency; the likelihood a participant would purchase of wheat bread or
buns when shopping on six separate grocery store visits. A p = .078 of a Chi-square test
examined if a relationship exists between years participated in WIC and the frequency
of purchase of wheat bread/buns. Results indicate there was no evidence of a correlation
between the two variables.

93
Table 15
Cross Tabulation Analyses of wicyears*WIC_WheatB2
WIC_WHEATB2 Total
0 1 2 3 4 5
wicyrs
0
Count 2 0 0 2 1 1 6
Expected Count 1.5 .5 .2 .9 .8 2.2 6.0
% within wicyears 33.3% 0.0% 0.0% 33.3% 16.7% 16.7% 100.0%
% within
WIC_WHEATB2
13.3% 0.0% 0.0% 22.2% 12.5% 4.5% 9.8%
% of Total 3.3% 0.0% 0.0% 3.3% 1.6% 1.6% 9.8%
1
Count 3 0 0 1 1 5 10
Expected Count 2.5 .8 .3 1.5 1.3 3.6 10.0
% within wicyears 30.0% 0.0% 0.0% 10.0% 10.0% 50.0% 100.0%
% within
WIC_WHEATB2
20.0% 0.0% 0.0% 11.1% 12.5% 22.7% 16.4%
% of Total 4.9% 0.0% 0.0% 1.6% 1.6% 8.2% 16.4%
2
Count 3 3 1 3 3 7 20
Expected Count 4.9 1.6 .7 3.0 2.6 7.2 20.0
% within wicyears 15.0% 15.0% 5.0% 15.0% 15.0% 35.0% 100.0%
% within
WIC_WHEATB2
20.0% 60.0% 50.0% 33.3% 37.5% 31.8% 32.8%
% of Total 4.9% 4.9% 1.6% 4.9% 4.9% 11.5% 32.8%
3
Count 7 2 1 3 3 9 25
Expected Count 6.1 2.0 .8 3.7 3.3 9.0 25.0
% within wicyears 28.0% 8.0% 4.0% 12.0% 12.0% 36.0% 100.0%
% within
WIC_WHEATB2
46.7% 40.0% 50.0% 33.3% 37.5% 40.9% 41.0%
% of Total 11.5% 3.3% 1.6% 4.9% 4.9% 14.8% 41.0%
Total
Count 15 5 2 9 8 22 61
Expected Count 15.0 5.0 2.0 9.0 8.0 22.0 61.0
% within wicyears 24.6% 8.2% 3.3% 14.8% 13.1% 36.1% 100.0%
% within
WIC_WHEATB2
100.0% 100.0% 100.0% 100.0% 100.0% 100.0% 100.0%
% of Total 24.6% 8.2% 3.3% 14.8% 13.1% 36.1% 100.0%

94
Table 16 (see below), is a crosstabulation of variables wicyears, (i.e.,
representative of the number of months to years a study case may have participated in
WIC) crossed by the influence variable (e.g., price, taste, participation in WIC, culture)
for purchase of wheat bread/buns when shopping on six separate grocery store visits. Chi-
square results p = .908 indicating there is no evidence of an association for length of time
participated in WIC and influence on choice of wheat bread/buns.
Table 16
Cross Tabulation wicyears*WIC_Choice_B2
wicyears * WIC_CHOICEB2 Crosstabulation
WIC_CHOICEB2 Total
0 1 2 3 4 5
wicyears
0 Count 0 5 1 0 0 0 6
Expected Count .1 3.0 .4 1.1 1.2 .2 6.0
1 Count 0 6 0 2
1.8
2 0 10
Expected Count .2 5.1 .7 2.0 .3 10.0
2 Count 0 9 1 4 5 1 20
Expected Count .3 10.2 1.3 3.6 3.9 .7 20.0
3 Count 1 11 2 5 5 1 25
Expected Count .4 12.7 1.6 4.5 4.9 .8 25.0
Total Count 1 31 4 11 12 2 61
Expected Count 1.0 31.0 4.0 11.0 12.0 2.0 61.0
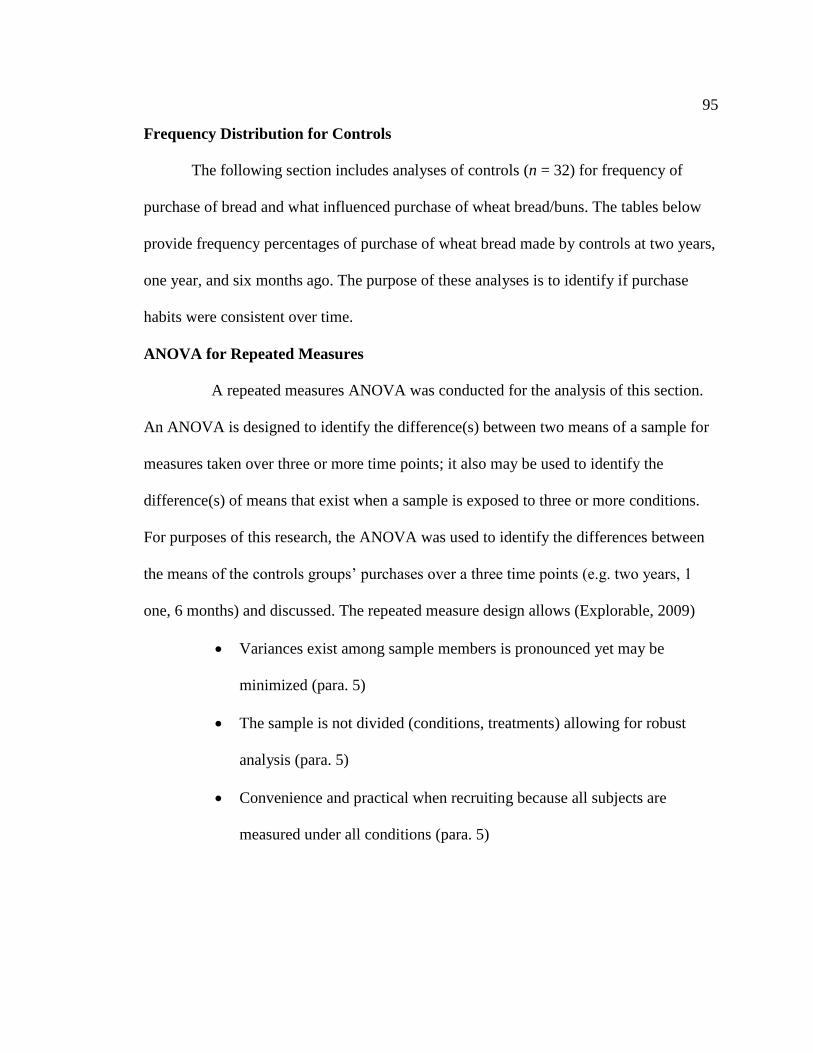
95
Frequency Distribution for Controls
The following section includes analyses of controls (n = 32) for frequency of
purchase of bread and what influenced purchase of wheat bread/buns. The tables below
provide frequency percentages of purchase of wheat bread made by controls at two years,
one year, and six months ago. The purpose of these analyses is to identify if purchase
habits were consistent over time.
ANOVA for Repeated Measures
A repeated measures ANOVA was conducted for the analysis of this section.
An ANOVA is designed to identify the difference(s) between two means of a sample for
measures taken over three or more time points; it also may be used to identify the
difference(s) of means that exist when a sample is exposed to three or more conditions.
For purposes of this research, the ANOVA was used to identify the differences between
the means of the controls groups’ purchases over a three time points (e.g. two years, 1
one, 6 months) and discussed. The repeated measure design allows (Explorable, 2009)
Variances exist among sample members is pronounced yet may be
minimized (para. 5)
The sample is not divided (conditions, treatments) allowing for robust
analysis (para. 5)
Convenience and practical when recruiting because all subjects are
measured under all conditions (para. 5)

96
The repeated measures ANOVA uses an F-statistic, a value used to determine the
statistical significance of a model. An F-statistic is a ratio of the variance between group
mean to the variance within the group mean.
In this research study I wanted to determine if there was a difference in the frequency and
the influence of choice of purchase of wheat bread/buns over three separate time for cases
(n=63) and controls (n=32).
Frequency Measurement:
The variables and corresponding questions asked are as follows:
Time = independent variable
Cases = Before, During, After = levels of time
Controls = 2 years ago, 1 year ago, 6 months ago
Variable of interest = Frequency
“If you needed bread on six separate grocery store visits, how often would you
purchase wheat bread/buns/rolls”?
Analyses of ANOVA for repeated measures indicate “there is no significant effect of
time before, during and after WIC on frequency of wheat bread/buns purchased, Wilks’
Lambda = .937, F (2, 60) = 2, p = .144.”
Analyses of ANOVA for repeated measures indicate “there is no significant effect of
time two years ago, one year ago, or six months ago for controls frequency of wheat
bread/buns purchased, Wilks’ Lambda = .986, F (2, 24) = .172, p = .843”.
Influence Measurement:
The variables and corresponding questions asked are as follows:

97
Time = independent variable
Cases =Before, During, After = levels of time
Controls = 2 years ago, 1 year ago, 6 months ago
Variable of interest = Influence
“If you needed bread on six separate grocery store visits, what influenced
your choice to purchase wheat bread/buns/rolls”?
Analyses of ANOVA for repeated measures indicate “there is no significant effect
of time before, during, and after WIC on influence of choice to purchase wheat
bread/buns, Wilks’ Lambda = .986, F (2, 60) = .414, p. = .663”.
Analyses of ANOVA for repeated measures indicate “there is no significant
effect of time two years ago, one year ago, or six months ago for controls for what
influenced purchase of wheat bread/buns purchased, Wilks’ Lambda = .992, F (2, 24)
= .093, p. = .911”.
t Test
The t test was conducted for analyses in this section. The t test is designed to
measure if the difference that may exist between two groups is reflective of what may
occur in the real population. It is important to understand the difference, rather the
variance if found to be significant, is dependent upon the group size, averages, and
standard deviations of the sample groups (Trochim, 2006, para. 2). The t test is a ratio of
the difference between the group’s means by the variability that exist between the group
(See Figure 5 for t-test formula).

98
t test formula:
Figure 5. Adapted from The T-Test, by Web Center for Social Research
Methods, 2006, Retrieved from
http://www.socialresearchmethods.net/kb/stat_t.php. Copyright 2006 by
The Web Center for Social Research Methods.
Cases and controls were compared for in this section to provide additional
information on how the two groups differ with respect to both variables (frequency,
influence) examined for the research study.
Frequency Variable Analyses
Group: cases (n=63) compared with controls (n=63)
Variable of interest = frequency
Time period = Before WIC Compared with 2 years ago
Results from the Levene’s test, F (94) = 1.41, p = .238, indicate the equal
variances between the two groups are not assumed to be approximately equal. Thus, the
equal variances not assumed independent t test results were not significant for frequency
of how often cases purchased wheat bread/buns before enrolling in WIC compared with
frequency of purchase two years ago. Cases (1 =.564, SD = .499, n = 62) and controls (0
= .6250, SD = .491, n = 32). The confidence intervals for the difference between the

99
means were - 300 to .275, t (94) = .562, p = .576, d = -.154, indicating there is no
significant difference between the scores (See Tables 17 and18).

100
Independent t-Test Analyses:
Table 17
t Test
Group Statistics
WIC n M SD SEM
Pre_Freq2
.00 32 .6250 .49187 .08695
1.00 62 .5645 .49987 .06348
Table 18
Independent Samples Test
Independent Samples Test
Levene's Test
for Equality of
Variances
t test for Equality of Means
F Sig. t df p M
Difference
SE
Difference
95% Confidence
Interval of the
Difference
Lower Upper
Pre_Freq2
Equal
variances
assumed
1.412 .238 .559 92 .578 .06048 .10822 -.15445 .27542
Equal
variances
not
assumed
.562 63.664 .576 .06048 .10766 -.15461 .27558

101
Influence Variable Analyses:
Group: cases (n=63) compared with controls (n=63)
Variable of interest = influence/ middle
Time period = Before WIC compared with 2 years ago
Results from the Levene’s test, F (89) = 4.078, p = .047, indicate the equal
variances between the two groups are not assumed to be approximately equal. Thus, the
equal variances not assumed independent t test results were not significant, t (89) =, p
= .325, d = -.115, indicating there is no significant difference between cases and controls
for what influenced purchases; results for cases (1 = .516, SD = - .503, n = 62) and
controls (0 = .629, SD = .492, n = 27). The confidence interval for the difference between
the means was -.230 and .342; see Tables 19 and Table 20.

102
Table 19
Group Statistics
Group Statistics
WIC N Mean Std. Deviation Std. Error Mean
Mid_Influence .00 27 .6296 .49210 .09471
1.00 62 .5161 .50382 .06399
Table 20
Independent Samples
Independent Samples Test
Levene's Test for
Equality of
Variances
t-test for Equality of Means
F Sig. t df p Mean
Differen
ce
Std. Error
Difference
95% Confidence
Interval of the
Difference
Lower Upper
Mid_Infln.
Equal
variances
assumed
4.078 .047 .98
4
87 .328 .11350 .11537 -.11581 .34281
Equal
variances
not
assumed
.99
3
50.6
55
.325 .11350 .11429 -.11599 .34299

103
Threat to Validity
To address the potential of confounders threatening the validity of study results,
an assessment of the criteria (See questions see below) was done to report any potential
confounding effects. The confounding criteria (McNamee, 2003):
1. must be a proxy measure of a cause, in unexposed people (p.228)
2. must be correlated (positively or negatively) with exposure in the study
population (p.228)
3. must not be an intermediate step in the causal pathway between exposure
and disease (p.228)
4. must not be an effect of the exposure ( p. 228)
Criteria 1: must be a proxy measure of a cause, in unexposed people
Controls were asked the following questions:
Do you have a pre-existing medical condition (yes/no); are you required by your
physician to be on a special diet (yes/no); how would you classify your weight
(don’t know, underweight, normal, overweight, obese, morbidly obese)?
The possibility of frequency and influence variables contributing to a causation to
purchase wheat bread/buns may threaten validity of research, as results indicate a portion
of controls answered yes to pre-existing medical condition (31.75%), 15.87% to special
diet, 44.44% to overweight and 1.59% being obese.
Criteria 2: Must be correlated (positively or negatively) with exposure in the
study population
A Pearson correlation (PC) was conducted on the following variables; pre-

104
existing medical condition (yes/no), are you required by your physician to be on a special
diet (yes/no); how would you classify your weight (don’t know, underweight, normal,
overweight, obese, morbidly obese) crossed by frequency of bread purchase during WIC
for cases.
The following results for pre-existing medical conditions (PC = -.045, p = .726);
special diet (PC = -.018 p = .889); weight status (PC = -.121 p = .347) and though the
criteria indicates there may be a positive or negative correlation, the corresponding p-
values are not equal or close to in 0.05 value, therefore no association of these variables
threaten validity.
3. Must not be an intermediate step in the causal pathway between exposure and
disease
These confounders do not violate this criterion.
4. Must not be an effect of the exposure
These confounders do not violate this criterion
Weight status specifically over-weight and obese, a pre-existing medical
condition, and eating a special diet may all be considered confounders. Additionally,
there is a strong possibility there are variables that were not controlled for. Based upon
this assessment of the criteria however, there were no statistical analyses that indicate
tests for confounder threats were needed. Confounders should not have a tremendous
impact on jeopardizing the validity of this research study.

105
Research Questions and Hypotheses
Research Question 1
Are current wheat bread/bun choices made by former WIC participants the result
of behaviors learned while participating in WIC sponsored health classes, nutrition
counseling, and restrictions to use food benefits/vouchers only towards the purchase of
food on WIC Approved Food lists?
Wilcoxon is the appropriate test of measure, when comparing two scores of a
related group. Scores may occur at different intervals (e.g. first quarter, second quarter)
or due to varying the conditions/treatment (e.g. summer, winter) yet, the group that is
evaluated is related. Additionally, a Z statistic is used to report the Wilcoxon score. A Z
statistic is a standard random distribution representing X values; X is a random variable
selected from a normal distribution. X is located at 0 on the on the X –axis and Z
indicates the number of standard deviations X is away from the mean. The assumptions
for Wilcoxon are as follows (Lund, 2013, para. 5):
Dependent variable must be measured on a ordinal or continuous level (para. 5)
The independent variable should consist of two categorical or related groups
(para. 5)
The distribution of the difference between the related groups should be
symmetrical (para. 5)
Wilcoxon statistical tests were used for the analyses to answer research question one.

106
Measurements:
Time = Before WIC & After WIC
Variable of interest = Influence
Wilcoxon Analysis:
Table 21
Descriptive Statistics NEWWIC0 and NEWWIC2
Descriptive Statistics
N Mean Std. Deviation Minimum Maximum
NEWWIC0 62 .00 .000 0 0
NEWWIC2 62 .06 .248 0 1
Table 22
Ranks
Ranks
N Mean Rank Sum of Ranks
NEWWIC2 -
NEWWIC0
Negative Ranks 0a .00 .00
Positive Ranks 4b 2.50 10.00
Ties 58c
Total 62
a. NEWWIC2 < NEWWIC0
b. NEWWIC2 > NEWWIC0
c. NEWWIC2 = NEWWIC0

107
Table 23
Test Statistics
Test Statisticsa
NEWWIC2 -
NEWWIC0
Z -2.000b
p .046
a. Wilcoxon Signed Ranks Test
b. Based on negative ranks.
In this analysis, 62 cases received WIC sponsored health classes, nutrition
counseling, and were restricted to use food benefits/vouchers only towards the purchase
of food on WIC Approved Food while participating in the WIC program. A questionnaire
was administered to identify what influenced purchase (e.g. price, culture, taste,
nutritional value) of wheat bread/buns prior to prior enrolling in WIC compared with
what influenced purchased (e.g. price, culture, taste, nutritional value, participation in
WIC sponsored programs) [e.g. nutrition counseling classes, participating in a counseling
session where the nutrition/health topic was discussed, or restricted purchase of WIC
Approved Foods]) post-WIC. Time periods evaluated were pre-WIC (i.e. NEWWIC0)
versus post-WIC participating (i.e. NEWWIC 2). The results for Descriptive Statistic are
in Table 21, Ranks in Table 22, and Test Statistics in Table 23. The Ranks results
indicate zero cases had an influence to purchase wheat bread/buns prior to participating
in WIC, there was no change for the influence variable pre-WIC versus post-WIC in 58
of the cases, however, four cases reported WIC participation influenced purchases. The
Ranks Table indicates an increase of influence post WIC (average rank 0.00 vs. 2.50).

108
Wilcoxon signed rank (Z = -2.00, p = .046) provides evidence of an association between
participation in WIC and what influenced purchase post-WIC..
Research Question 1 Hypotheses
H01a: There is no relationship between what influenced bread purchases after
participating in WIC compared with what influenced bread purchase before WIC.
Ha1a There is a relationship between what influenced bread purchases after
participating in WIC compared with what influenced bread purchase before WIC.
SPSS analysis software was utilized for dataset analyses to determine if
participation in WIC sponsored nutrition workshops/counseling, health education
literature received, and restrictions requiring use of food subsidy benefits towards
purchase of foods found on WIC Approved Food List had an association on influencing
purchase of wheat bread/buns after WIC. The Wilcoxon signed-rank test (Z = -2.00, p =
0.046) supports accepting the alternative hypothesis (Ha1a).
Research Question 2
Has the variable for what influence food choice for controls changed over the
past two years?
The rationale for querying controls regarding wheat bread/bun purchases over a
period of two years was to identify if what influenced their choice remained consistent
over time. Examination of controls’ responses is essential as it will allow for elimination
and isolation of variables and moreover enhances discussion and interpretation of results.

109
Measurements:
Controls = Two years ago, One year ago, six months ago
Variable of interest = Influence
Table 24
Descriptive Statistics Choice_2Yr, Choice_1Yr, Choice_6mons
Descriptive Statistics
Mean Std.
Deviation
N
Choice_2Yr .6538 .48516 26
Choice_1Yr .6538 .48516 26
Choice_6mos .6154 .49614 26
Table 25
Multivariate Tests
Analyses of ANOVA for repeated measures indicate “there is no significant effect of
time two years ago, one year ago, or six months ago for what influenced purchase of
Effect Valu
e
F Hypothesis
df
Error df Sig. Partial Eta
Squared
Noncent.
Parameter
Observe
d Powerc
Influnc
Pillai's Trace .038 1.000b 1.000 25.000 .327 .038 1.000 .161
Wilks' Lambda .962 1.000b 1.000 25.000 .327 .038 1.000 .161
Hotelling's
Trace
.040 1.000b 1.000 25.000 .327 .038 1.000 .161
Roy's Largest
Root
.040 1.000b 1.000 25.000 .327 .038 1.000 .161
a. Design: Intercept Within Subjects Design: Influnc
b. Exact statistic
c. Computed using alpha = .05

110
wheat bread/buns by controls; Wilks’ Lambda = .962, F (1, 25) = 1.00, p. = .327”. See
Tables 24 and 25 for descriptive statistics and Table 25 for multivariate results.
Research Question 2 Hypotheses
H02a: There has been no change what influenced bread purchases for the control
group over the last two years.
Ha2a: There has been a change in what influenced bread purchases for the
control group over the last two years
Results:
SPSS analysis software was utilized for dataset analyses to determine what
influenced controls’ choice (e.g. cultural, nutrition, taste, price, other) to purchase wheat
bread compared over a period of two years. It is evident from the analyses of repeated
measures ANOVA, p = .327, there was no difference for what influenced purchase,
therefore, the null hypothesis (H02a) was accepted.
Research Question 3
Does the primary variable, for what influenced food choice, differ between study
and control groups?
The aim of research question three was to identify if the variable that influenced
choice of wheat bread/buns is identical or differs between cases and controls. A general
linear model for repeated measures also known as a repeated measures ANOVA was
conducted for this purpose. A general linear model is a form of a regression model. The
purpose of regression testing in statistics is to measure if a relationship exists between the
dependent and independent variables. The test allows for greater understanding of what
independent variable (s) has the greatest impact on influencing the outcome variable
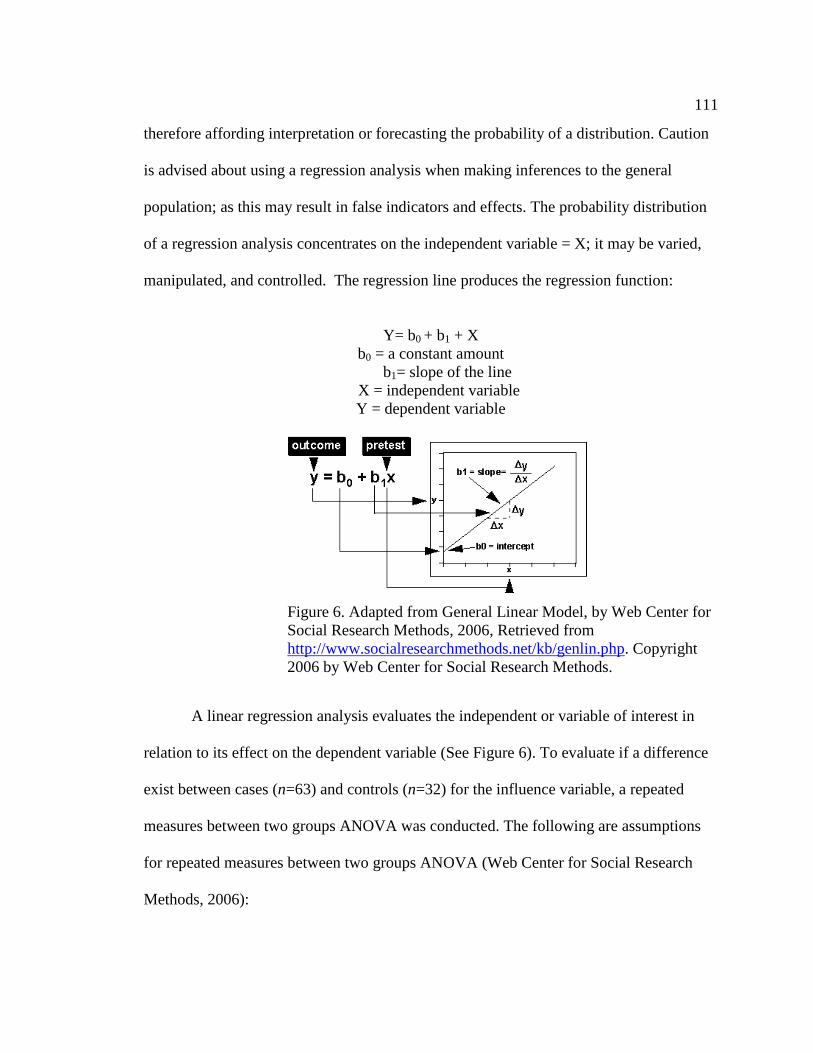
111
therefore affording interpretation or forecasting the probability of a distribution. Caution
is advised about using a regression analysis when making inferences to the general
population; as this may result in false indicators and effects. The probability distribution
of a regression analysis concentrates on the independent variable = X; it may be varied,
manipulated, and controlled. The regression line produces the regression function:
Y= b0 + b1 + X
b0 = a constant amount
b1= slope of the line
X = independent variable
Y = dependent variable
Figure 6. Adapted from General Linear Model, by Web Center for
Social Research Methods, 2006, Retrieved from
http://www.socialresearchmethods.net/kb/genlin.php. Copyright
2006 by Web Center for Social Research Methods.
A linear regression analysis evaluates the independent or variable of interest in
relation to its effect on the dependent variable (See Figure 6). To evaluate if a difference
exist between cases (n=63) and controls (n=32) for the influence variable, a repeated
measures between two groups ANOVA was conducted. The following are assumptions
for repeated measures between two groups ANOVA (Web Center for Social Research
Methods, 2006):

112
Sphericity: The variances between pairings of all groups should
be similar. Mauchly’s W should be very close to =
1; If only measuring two levels/cells no
significance test is warranted (para.8)
Parametricity:
Interval level variables
Normal distribution
Equality of variances
The following is the equation for the repeated measures between two groups ANOVA:
or
MS time = time course experiments or conditions:
MS error = SSw (within subject variation) - SSsubjects (each subject)
MSerror
MStimeF
MSerror
nsMSconditioF

113
General Linear Regression for Repeated Measures between two groups:
Measurements:
Cases compared to Controls
Time periods = Pre-WIC versus 2 years ago
&
Post-WIC versus 6 months ago
Variable of interest = influence
Note: This analysis stopped because there was an unequal number of cases (n =63) to
compare with controls (n =32), therefore, no Sphericity is required or is assumed. Results
are acknowledged of the Sphericity Assumed Test of Within-Subjects Effects in Table 25
below. The Descriptive Statistics are shown in Table 26 and Test Within Subjects Effects
in Table 27.

114
Table 26
Descriptive Statistics
Descriptive Statistics
WIC Mean Std.
Deviation
N
Pre_Infl
uence
.00 .6538 .48516 26
1.00 .5000 .50408 62
Total .5455 .50078 88
Final_Inf
luence
.00
.6154
.49614
26
1.00 .5161 .50382 62
Total .5455 .50078 88

115
o
Tests of Within-Subjects Effects
Measure: MEASURE_1
Source Type III
Sum of
Squares
df Mean
Square
F
Influence
Sphericity
Assumed
.005 1 .005 .099
Greenhouse-
Geisser
.005 1.000 .005 .099
Huynh-Feldt .005 1.000 .005 .099
Lower-bound .005 1.000 .005 .099
Influence
* WIC
Sphericity
Assumed
.027 1 .027 .591
Greenhouse-
Geisser
.027 1.000 .027 .591
Huynh-Feldt .027 1.000 .027 .591
3Lower-bound .027 1.000 .027 .591
Error(Infl
uence)
Sphericity
Assumed
3.973 86 .046
Greenhouse-
Geisser
3.973 86.000 .046
Huynh-Feldt 3.973 86.000 .046
Lower-bound 3.973 86.000 .046
Table 27
Tests of Within-Subjects Effects

116
Results:
Evidence from the general mixed model repeated measures between groups
analysis indicate the variable that influenced purchased of wheat bread/buns is not
significantly different between cases and controls at the pre and post time intervals ” F
(1,86) =.99, p = .754, η2
= .001”.
Research Question 3 Hypotheses
H03a: There is no difference between the primary variable that influences food
choice for the study and control groups.
Ha3a: There is a difference between the primary variable that influences food
choice for the study and control groups.
It is evident from the general linear repeated model for two groups analysis
generated there is no a significant difference in what influenced choice of wheat
bread/buns between cases and controls (p = .754). The null hypothesis (H03a) was
accepted.
Summary
Results and analyses used to test each research question and hypotheses were
presented in this chapter. Results from the analyses indicate there is an association
between what influenced wheat bread/bun choices made by current and former WIC and
participation in WIC sponsored health classes, nutrition counseling, and restrictions to
use food benefits/vouchers only towards the purchase of food on WIC Approved Food
lists; (Z = -2.00, p = 0.046). The alternative hypothesis (Ha1a) is tentatively accepted.
Although results indicate an association between WIC participation and an influence for

117
purchase of wheat bread/buns, extreme caution is taken when making any inferences of
this conclusion to the general WIC population, due to the nature of the causal-
comparative research design used for this research study. Because the causal-comparative
design is a nonrandomized design causal inferences should not be made when there fails
to be a randomization process (SAS as cited in Yu, n.d., para. 10). In research question
two evidence did not indicate there was a change in the variable that influenced purchase
of wheat bread/buns compared at three different time periods (e.g. 2 years ago, 1 year
ago, and 6 months ago), therefore the null hypothesis was accepted. Research question
three asked if there was a difference between cases (n =63) compared with controls (n =
32) for the influence variable during the pre-WIC compared with 2 years ago and the
post-WIC compared with 6 months ago time periods. Results indicated there is no
difference in the influence variable for cases compared with controls for these time
periods, therefore the null hypothesis was accepted. The influence variable was the same
for both cases and controls.
A summary and interpretation of findings, limitations and recommendations for
further study, and implications for positive social change will be presented in Chapter 5.

118
Chapter 5: Discussion, Conclusions, and Recommendations
Introduction
The purpose of this study was to identify the effect participation in USDA’s
Special Supplemental Nutrition Program for Women, Infants, and Children Program
(WIC) had on former participants’ nutritional behaviors, post-WIC. This study queried
current and former recipients regarding their choice of a wheat bread/buns over different
time periods (e.g., pre-WIC, during WIC, post-WIC) to identify how frequent they would
select this item and what influenced their choice (e.g. taste, nutritional value, price,
cultural influence, participation in WIC) for this food item. Their responses (n=63) were
compared with responses of controls (n =32).
The mission of WIC is to improve the diets of low income expectant mothers,
postpartum, breastfeeding women, infants, and children whose health may be comprised
secondary to a nutrient deficient diet. In its efforts to improve birth outcomes (e.g. high
birth weight, increase full term deliveries, decrease infant mortality) of expectant
mothers, and diets of all other program participants, WIC offers a comprehensive
program including but not limited to nutrition/health education, medical service referrals,
substance abuse prevention and food subsidy benefits. In Fiscal Year 2014, WIC
provided benefits to 8.3 million people, of which 4.32 million were children, 1.95 million
were infants and 1.97 million were women (USDA Food Nutrition Service, 2015, para.
3). Women, Infants, and Children program is funded by federal grants which are
disbursed to the 48Contiguous States, District of Columbia, Guam, and other U.S.
Territories. In fiscal year 2010 WIC cost 6.4 billion dollars to operate.

119
The WIC program is intended to serve those who are nutritionally at risk, and is
designed to assist its participants with practicing healthy dietary practices beyond WIC
(Federal Register, 2003, p. 2) by emphasizing nutrition education, counseling, and
restricting use of food subsidy benefits as a means of achieving this goal. According to
Sally Findley the impact participation in WIC’s has on behavioral change of nutritional
habits, particularly long-term, has yet to be studied and thus the impetus for this study;
Findley’s presentation (as cited in Institute of Medicine, 2010).
Summary and Interpretation of Findings
The dataset included N = 95 participants, of whom n = 63 (66.31%) represented
cases (i.e., current or former recipients of the USDA WIC food subsidy program) and n
=32 (33.68%) controls (i.e., never received USDA WIC food subsidy). Research
Question 1 was aimed to identify if wheat bread/bun choices made by former WIC
participants the result of behaviors learned while participating in WIC sponsored health
classes, nutrition counseling, and restrictions to purchase foods on WIC Approved Food
lists. It was hypothesized a causal effect from participation in WIC and the frequency in
which one purchased wheat bread/buns. The Wilcoxon signed-rank test (z = -2.00, p =
0.46) supports there is an association between participation in WIC and an influence on
the purchased of wheat bread/buns. The alternative hypothesis (Ha1a) was tentatively
accepted because the nature of a causal comparative design suggests using caution with
making inferences of study results to the population. The Social Ecological Model (SEM)
as theorized by Bronfenbrenner in 1994 asserts, an individual’s behavior is affect by the
microsystem, ecosystem, and its macrosystem. These levels of the biological community

120
are sub-categorized by five levels of influences. These levels of influence and a few of its
unique qualifiers are provided here:
1. Intrapersonal influence (e.g., knowledge, education, behavior)
2. Interpersonal influence (e.g., family, friends, informal/formal networks)
3. Institutional influence (e.g., social institutions/organizations)
4. Community influence (e.g., relationships among organizations,
businesses
5. Public policy (e.g., local, state, national laws/policies)
The WIC program offers a comprehensive program for its participants that
include nutrition education which may translate to the intrapersonal level of influence as
the purpose of nutrition education. According to the USDA, nutrition education is
designed to “encourage participation in activities (e.g., classes, counseling) to improve
participant’s knowledge of health and nutrition related information” (USDA, n.d., §
246.10, p. 401). This act may be considered an interpersonal level of influence because
the purpose is to educate and increase a recipients’ knowledge on a health or nutrition
topic.
Interpersonal influence is the level of influence that recognizes networks be they
formal or informal that with family, friends, social support systems, and other groups.
The interpersonal influence may translate to the health education counseling a WIC
staffer provides to a recipient during the re-certification period. The USDA defines WIC
Nutrition Counseling as “a service in which paraprofessionals and professionals provide
information and assistance on educational subjects” (USDA, n.d., § 246.10, p. 398).

121
Finally, USDA Food Nutrition guidelines for the WIC program state a recipient
may use monthly allocations to purchase “specific foods each month that are designed to
supplement their diets with specific nutrients that benefit WIC’s target population”
(USDA, Food Nutrition Service, 2015, para. 5). This is an example of Bromfenbrenner’s
institutional influence as it is characterized as an organization’s rules and regulations
imposed for operations.
It was hypothesized there was not a causal effect participation in WIC sponsored
programs (e.g., health literature, counseling session, restricted use of benefits) had on
influencing the purchase of wheat bread/buns post-WIC. Evidence from the Wilcoxon
Signed Rank test (p = .046) conducted to identify if there was a causal effect supports
there was an “association” between participation in WIC and influence on purchase of
wheat bread/buns. Cautioned is taken when stating purchase of wheat bread/buns
purchase by former recipient’s post-WIC is directly related to participation in WIC
programs and restriction on food purchases because a causal comparative study designed
used for this study. This design does not use a randomization method for the population
selection process and therefore making causal inferences is cautioned.
Research question 2 examined purchase of wheat bread/buns made by the control
group to identify what variable affected choice over the two years. The rationale for
querying controls regarding wheat bread/bun purchases over a period of two years was to
identify if their choices changed over time periods or if their choice persisted and at best
may be considered a behavior or habit. It is important to note, this study was not designed
to control for confounding variables such as behavioral habit(s) that might have

122
influenced choice. An examination of controls’ responses to this question was important
as it allowed for a better understanding about what motivates purchases. It also allowed
for an elimination and isolation of variables, and enhanced the discussion and
interpretation of results. It was hypothesized there was no difference existed between
what influenced (e.g., taste, nutritional value, price, cultural influence) purchase of wheat
bread/buns over time periods (e.g., 2 years ago, 1 year ago, 6 months ago). It was evident,
from the analyses of the repeated measures ANOVA, Wilks’ Lambda = .962, F (1, 25) =
1.00, p = .327 that there was no difference for what influenced purchase of wheat
bread/buns over a two year period, therefore, the null hypothesis (H02a) was accepted.
Research question 3 compared the primary variable of influence for the cases with
the controls. It was determined from a linear equation for repeated measures for two
groups (p = .754) that there was no evidence to support a relationship between the
primary variable that influenced choice of wheat bread/buns for cases compared with
controls. The null hypothesis was accepted (Ha3a) and the alternative was (Ha3a) rejected.
Implications for Social Change
Obesity is attributed as being one of the leading causes of preventable death in the
United States, resulting in one in 10 deaths or approximately 385,000 mortalities annually
(Mokdad, 2004, p. 1240). It is projected that by the year 2030, 42% of all Americans will
be clinically obese; indicative of a body mass index (BMI) 30 lbs./in.2 or greater. The
WIC Program achieves its mission of improving birth outcomes and diets of its recipients
by offering a comprehensive program (e.g., nutrition education, medical referrals, food
subsidy benefits). Given this, WIC nutrition education has two goals; to assist

123
participants whose nutrition is compromised with achieving positive nutrition outcomes
and secondly, to promote eating a well-balanced nutritious diet and to engage in physical
activity (USDA, 2015, p. 4). Results from this study indicate there is an association
between participation in WIC and purchase habits of study participants and why this
study has implications for positive social change. From the literature review search done,
I was unable to identify any study conducted on former participants of USDA food
subsidy programs and why I believe this study lends to the literature and discussion
regarding the short and long-term impact federal food subsidy programs have program
participants. The purpose of this study was to gain additional insight regarding health
attitudes and behaviors beyond WIC.
This research study was designed investigate the impact WIC nutrition education
and program restrictions had on health behaviors of former WIC recipients. In fiscal year
2013, program costs were $6.5 billion dollars, of which $4.5 billion (70%) was allocated
for food benefits (USDA, 2013, p. 1). The 2011 Census Report indicated that 49.2% of
Americans received benefits from one or more government programs. This study has the
potential to affect approximately 109,631,000 Americans who participate in one of 13
federally funded food subsidy programs. Additional studies must be conducted to
determine the impact participation in respective USDA Food Nutrition program has on
behaviors of its participants to better understand strengths and weakness of the program
before taking steps to make changes in program guidelines.
Consider the following, preschoolers have a better ability to modify behaviors
than school-aged children, and why it is importance to initiate healthy behaviors early on

124
(USDA, 2005, p. 12). If USDA were to consider using the WIC program as a model for
other food subsidy programs by imposing guidelines for example, that would require
benefits are used towards purchase of foods deemed nutritionally dense. It is plausible to
begin impacting nutritional behaviors of children at an early age and thus begin to offset
poor nutritional habits during a child’s formative years. Figure 7 compares the
consumption percentages of 10 Major Supermarket Aisle Food Groups of a child whose
family receives WIC by child whose family receives the Supplemental Nutrition
Assistance Program (SNAP). It is important to note, SNAP program guidelines do not
require purchase of food items pre-approved by the USDA and the Institute of Medicine
as nutritiously dense or healthy.

125
Figure 7. Percent of children consuming any discrete foods from 10 major supermarket
aisle food groups. Adapted from Diet of American Young Children by WIC Participation
Status & Diet Quality of Americans by SNAP Participation Status, 2015, Retrieved from
http://www.fns.usda.gov/sites/default/files/ops/NHANES-WIC05-08.pdf. Copyright 2015
by USDA.
Comparatively, the child whose family receives SNAP consumes greater amounts
of added fats, oils, and beverages and the WIC child consumes greater amounts of sweets
and desserts and salty snacks; foods that may not the healthiest. The WIC child
consumers greater amounts of fruit, fruit juices, milk/milk products, and grains; foods
that tend to be healthier. Approximately 50 years ago, the House version of the Food
Stamp Act of 1964 would have prohibited the purchase of select foods (e.g., soft drinks,
0% 20% 40% 60% 80% 100% 120%
Beverages
Grains
Milk and Milk Products
Mixed Dishes
Sweets and Desserts
Fruit and 100% Juice
Meat and Meat Alternates
Vegetables
Salty Snacks
Added Fats and Oils
SNAP Children
WIC Children

126
luxury foods, and frozen foods) with benefits (USDA, 2014, para. 6). Consider the
following; the prevalence of obesity was not at epidemic levels then as it is today, and
may explain legislators’ refusal to allow purchase of luxury foods and sugary beverages
with benefits in 1964. The USDA needs to take action and make bold moves and
reconsider implementing additional restrictions to purchase of healthier foods with SNAP
benefits as done with WIC. By doing so, this would impact more than 46 million families
and a significant impact for social change. It is reasonable to believe, additional
restrictions on purchases could potentially positively impact the diets of SNAP and other
recipients of USDA Food Nutrition Service food subsidy programs.
Now more than ever, greater emphasis should be placed on implementing policy
that is evidence based and geared toward health promotion and preservation to enhance
the quality of life. Change in federally funded food subsidy programs guidelines would
bring about tremendous positive social change for its recipients. This study was designed
to examine the WIC culture in efforts to demonstrate that positive nutritional behaviors
cultivated from participating in WIC are long-lasting.
It is critical and necessary that policy makers, the health and medical
communities, and stakeholders dedicated to advocating for the health of all Americans
must remain focused, committed, and act to create change for the greater good. There are
numerous examples of significant health legislation policies (e.g., including seat belt
laws, tobacco control policy) that have been mandated which proved to prevent casualties
and save lives. In June of 2015, the U.S. Food and Drug Administration made a decision
that require food manufacturers to reframe from the use of partially hydrogenated oils in

127
food products found to increase risk of heart diseases. Additionally, campaigns such as
First Lady of the United States, Michelle Obama’s Let’s Move Campaign, the National
School Lunch Program and legislation passed at state and federal levels may contribute to
reversing the obesity epidemic.
Limitations and Recommendations for Further Study
While conducting this study I appealed to the USDA and requested contact
information of former WIC recipients. This information was necessary because the
purpose of this research was to investigate former WIC recipients and this information
was needed to invite them to participate in this study. The request was denied secondary
to confidentiality concerns and the Institutional Review Board (USDA would have
required) would have been extremely extensive and time consuming and would have
prolonged initiation of this study. To adjust for this barrier I used the convenience
sampling procedure, preventing a randomization process however, and had to rely on
potential study participants’ honesty about participating in WIC, in part to receive the
“thank you” gift offered for participating in the study.
Secondly, the study criteria limited participation to females only, as WIC
eligibility guidelines are defined by USDA and is gender specific to females. Males were
excluded from participating in this study. Males play an essential role in managing the
household and may be in many instances the primary person who does the grocery
shopping for a family that receives WIC, therefore, males should be considered for
participation in like studies.

128
The need for further research on all federally funded food subsidy programs
populations is warranted. The Economic Research Service the arm of the USDA Food
and Nutrition Service (FNS) conducts research and provides information used in decision
and policy making issues concerning all matters of the USDA (e.g. food, agriculture,
natural resources). When speaking with the Director of Special Nutrition Research
Analysis in the Division Office of Policy Support USDA FNS, he requested a final copy
of the study manuscript; he stated in his 18 year tenure with the USDA, it has never
studied former recipients of a food subsidy program. A longitudinal study examining
health and wellness habits of former WIC and SNAP beneficiaries encourages an
opportunity for comprehensive evaluation of nutrition education programming, policy
revision, and a reevaluation of missions and goals; these are merely a few areas
importance. As noted earlier by Sally Findlay, Columbia Mailman School of Public
Health, if WIC claims to achieve goals of behavioral change; WIC need studies to
document the different time of impact (e.g. 1-5 years and 5-10 years post WIC).
Recommendations for Actions
The initial step in this process is to appeal to the USDA and specifically to the
Economic Research Service and Food Nutrition department, charged with administering
nutrition assistance programs for WIC, SNAP and 13 other USDA food subsidy
programs to consider conducting research studies in areas surrounding behavior change
of its participants. In March of 2007 the Food and Nutrition Service issued a report titled
“Implication of Restricting the Use of Food Stamps Benefits”. The report lists several
reasons why limiting purchase of select foods with food subsidy benefits by SNAP

129
participants is not sensible. The report cites the following implications of restricting use
of SNAP benefits:
“No clear standards exist for defining foods as good or bad, or unhealthy or
not healthy” (USDA, 2007, p. 1),
“Implementation of food restrictions would increase program complexity and
cost” (USDA, 2007, p. 3),
“Restrictions may be ineffective in changing the purchases of food stamp
participants” (USDA, 2007, p. 5), and
“No evidence exist that food stamp participants contributes to poor diet
quality or obesity” (USDA, 2007, p. 6).
The Food Nutrition Service has stated that it is impossible to define a food as
healthy or unhealthy, and that attempting to do this would 1) increase program
complexity and cost and 2) because approximately 12,000 new food products introduced
to the market annually, attempting to identify if these food items meet federal guidelines
would be next to impossible to accomplish by the USDA yearly. If WIC administrators
and stakeholders are able to identify foods that meet federal eligibility guidelines using a
defined criteria for food categories (e.g. cereal, breads, juice) resulting in WIC Approved
Food lists, the Food Nutrition Service administrators should be able to follow accordingly
for the federally funded food subsidy programs.
Finally, utilizing state and local government agencies to push for pilot studies to
be conducted by the USDA or independent research teams to examine nutritional
behaviors of SNAP recipients would be the second tier of action that should be

130
considered. Every entity and level of government has a responsibility to advance
initiatives that promote the health and the wellbeing of the people it is charged to protect.
Efforts should be devoted to implement health policy when considering effective
approaches to address the obesity epidemic. According to the World Health
Organization’s Adelaide Statement on Health in All Policies report, assistance should be
provided to and encouraged by “leaders and policymakers to integrate considerations of
health, well-being and equity during the development, implementation and evaluation of
policies and services” (WHO, 2013, para. 1). Health in All Policies utilizes a
multidisciplinary paradigm to introduce policy to government entities and others
positioned to encourage policy by the public health community and other advocates and
stakeholders for health.
Summary
Obesity is not relegated to one sector of people it affects all no matter the race,
ethnicity, gender, age, or socioeconomic status. We all know someone who may be
overweight or obese. Approximately 12.7 million children and 78.6 million adult
Americans are overweight or obese. Medical cost associated with this condition was 14.8
billion dollars annually in 2008. Most importantly, overweight and obesity are chronic
diseases that are preventable. If action is taken during the formidable years in life by
encouraging a lifestyle that promotes eating in moderation, engaging in physical activity,
and eating a nutritious well balanced diet the obesity epidemic may begin to abate, while
behaviors that define an enhanced quality of life may prevail.

131
The impact participation in the USDA WIC program had on influencing purchase
of wheat bread/buns and how frequent recipients chose this option was explored. Results,
indicate an association between the participation in WIC and an influence on the
purchase of wheat bread/buns (Z = -2.00, p = 0.46). These results are promising and
lends to future study regarding the impact participating in WIC has on short and long-
term behaviors.
In conclusion, this research study provided an opportunity to justify why
additional study of former program participants of USDA Food Nutrition Service food
subsidy programs is warranted. “Policing unhealthy food purchases may appear as a
truncation or violation of one’s civil liberties; however, the intent is not to insult,
dehumanize, stigmatize, stereotype, or even single out a select population or culture of
people, it is instead, a fresh and innovative way to identify windows of opportunity to
change the course of this epidemic and the physical health of (Terrell, 2009, p. 9) the
57,000,000 million recipients of federally funded food benefits. Change is now. Limiting
the use of SNAP food subsidy benefits to the purchase of healthy foods is possible; WIC
has been practicing this method for 40 years now……as this approach is not innovative
but necessary.
132
References
American Heart Association. (n.d.). Policy position statement on regulatory and
legislative efforts to improve cardiovascular health by decreasing consumption of
industrially produced trans fats. Retrieved from
http://www.americanheart.org/downloadable/heart/1216749580002Trans%20fat%
20policy%20position%20statement.pdf
American Heart Association. (2013). Overweight in children. Retrieved from
http://www.heart.org/HEARTORG/GettingHealthy/WeightManagement/Obesity/
Overweight-in-Children_UCM_304054_Article.jsp#mainContent
Anonymous. (n.d.). Reliability – 09. Retrieved from
http://tigger.uic.edu/~thork/fair/reliability-09.doc
Arvantes, J. (2008). U.S. health care system lags behind on key indicators, researcher
says. Retrieved from
http://www.aafp.org/online/en/home/publications/news/news-now/professional-
issues/20080528schoen-forum.html
Baughcum, A. E., Burklow, K. A., Deeks, C. M., Powers, S. W., & Whitaker, R.C.
(1998). Maternal feeding practices and childhood obesity: A focus group study of
low-income mothers. Archives of Pediatric and Adolescent Medicine, 152(10),
1010-1014. Retrieved from
http://archpedi.jamanetwork.com/article.aspx?articleid=189952

133
Bell, L. & Gleason, S. (February 2006). Evaluating changes in WIC participant food
purchasing behaviors as a result of local nutrition education interventions: A
feasibility study. Washington, DC, Health Systems Research, Inc.
Berkman, L. F., & Kawachi, I. (2000). Health behaviors in a social context. In L. F.
Berkman & I. Kawachi (Eds.), Social epidemiology (pp. 3-12). New York, NY:
Oxford University Press.
Bowman, S. A., Gortmaker, S. L., Ebbeling, C. B., Pereira, M. A., & Ludwig, D. S.
(2004). Effects of fast-food consumption on energy intake and diet quality among
children in a national household. Pediatrics, 113(1), 112-118.
Brace, N., Kemp, R., & Snelgar, R. (2006). SPSS for psychologists (3rd ed.). Mahwah,
NJ: Lawrence Erlbaum Associates, Publisher.
Brewer, W., & Kuhn, J. (2010). Causal-comparative design. Retrieved from
http://knowledge.sagepub.com/view/researchdesign/n42.xml
Bronfenbrenner, U. (1994). Ecological models of human development. In (Ed.),
International encyclopedia of education (vol. 3, pp. 37-43). Oxford, England:
Elsevier.
Center for Effective Government. (2014). Balanced budget amendment would exceed
impede economic recoveries. Retrieved July 24, 2014, from
http://www.foreffectivegov.org/node/11462
Centers for Disease Control and Prevention. (2009a). Healthy weight – It’s not a diet, it’s
a lifestyle! Retrieved from

134
http://www.cdc.gov/healthyweight/assessing/bmi/childrens_bmi/about_childrens_
bmi.html
Centers for Disease Control and Prevention. (2009b, July 24). Obesity prevalence among
low-income, preschool-aged children—United States, 1998-2008. Mortality,
Morbidity, Weekly Reader. Retrieved from
http://www.cdc.gov/mmwr/preview/mmwrhtml/mm5828a1.htm
Centers for Disease Control and Prevention. (2013). Overweight and obesity: Data and
statistics. Obesity and extreme obesity rates decline among low-income preschool
children. Retrieved from http://www.cdc.gov/obesity/adult/causes/index.html
Chang, L. (1994). A psychometric evaluation of 4-point and 6-point Likert-type scales in
relation to reliability and validity. Applied Psychological Measure, 18(3), 205-
212. doi: 10.1177/014662169401800302
Davis, F. A. (1985). Infectious. In C. Thomas (Ed.), Taber’s medical dictionary (pp.
840). Philadelphia, PA: F. A. Davis.
Devaney, B. (2007, December). WIC turns 35 years: Program effectiveness and future
directions. Paper presented at the National Invitational Conference of the Early
Childhood Research Collaborative, Minneapolis, MN. Paper retrieved from
http://citeseerx.ist.psu.edu/viewdoc/download?rep=rep1&type=pdf&doi=10.1.1.2
05.7151
Dugan, C. M. (2013). Class 11 – Bias. Retrieved from http://quizlet.com/17887500/class-
11-bias-flash-cards/

135
Edmunds, L. S., Woolfell, M. L., Dennison, B. A., Stratton, H., Pruzek, R. M., &
Abusabha, R. (2006). Overweight trends among children enrolled in the New
York state special supplemental nutrition program for women, infants, and
children. Journal of the American Dietetic Association, 106 (1), 113-117.
doi: http://dx.doi.org/10.1016/j.jada.2005.09.052
Emmons, K. M. (2000). Health behaviors in a social context. In L. F. Berkman & I.
Kawachi (Eds.), Social epidemiology (pp. 242-266). New York, NY: Oxford
University Press.
Fichtenberg, C. M., & Glantz, S. A. (2002). Youth access interventions do not affect
youth smoking. Pediatrics, 109(6), 1088-1092. doi: 10.1542/peds.109.6.1088
Finkelstein, A., Fiebelkorn, I. C., & Wang, G. (2003). National medical spending
attributable to overweight and obesity: How much, and who’s paying? Health
Affairs, W3, 219-226. doi: 10.1377/hlthaff.w3.219
Fleury, J. & Lee, S.M. (2006). The social ecological model and physical activity in
African American women. American Journal of Clinical Psychology, 37(1), 129-
140. doi: 10.1007/s10464-005-9002-7
Georgia Department of Human Resources. (2012). WIC fact sheet. Retrieved from
http://www.health.state.ga.us/pdfs/wic/wic.faq.pdf
Georgia Head Start. (2012). Head start state collaboration executive summary. Retrieved
from http://www.georgiaheadstart.org/about/pdf/Executive_Summary_Report.pdf
Glanz, K., Rimer, B.K., & Viswanath, K. (2008). Health behavior and health education.
San Francisco, CA: Jossey-Bass Press.

136
Glassbrenner, D. (n.d.). Estimating the lives saved by safety belts and airbags. Retrieved
from http://www-nrd.nhtsa.dot.gov/pdf/nrd-01/esv/esv18/CD/Files/18ESV-
000500.pdf
Hammond, R.A. & Levine, R. (2010). The economic impact of obesity in the United
States. Diabetes, Metabolic Syndrome and Obesity: Targets and Therapy, 3, 285-
295. doi: 10.2147/DMSOTT.S7384
Hassan, E. (2013). Recall bias can be a threat to retrospective and prospective research
designs. Retrieved from http://ispub.com/IJE/3/2/13060
Health and Human Services. (1993). Institutional review board guidebook.
Chapter III basic IRB review. Retrieved from
http://www.hhs.gov/ohrp/archive/irb/irb_chapter3.htm
Healthy People. (2013). Physical activity. Retrieved from
http://www.healthypeople.gov/2020/topicsobjectives2020/objectiveslist.aspx?topi
cId=33
Howell, D. C. (2010). Statistical methods for psychology (7th ed.). Belmont, CA:
Wadsworth Cengage Learning.
Impact of Special Needs. (2013). Bronfenbrenner’s ecological systems theory. Retrieved
from http://impactofspecialneeds.weebly.com/bronfenbrennerrsquos-ecological-
systems-theory.html
Institute of Health of the National Health Academies. (2011). Leading health indicators
for healthy people 2020: Letter report. Retrieved from
http://www.nap.edu/catalog/13088.html

137
Institute of Medicine, (2010). Planning a WIC research agenda: Workshop summary.
Washington (DC): National Academies Press (US); 2008. 8, Health Care and
Systems Costs, Benefits, and Effectiveness. Retrieved from
http://www.ncbi.nlm.nih.gov/books/NBK209702/.
Jamison, S. (2004). Likert scales: How to (ab)use them. Medical Education, 38(12),
1217-1218. doi: 10.1111/j.1365-2929.2004.02012.x
Kennedy, E. (1999). Public policy in nutrition: The US nutrition safety net—past, present
and future. Food Policy, 24(2), 325-333. doi:10.1016/S0306-9192(99)00028-7
Laerd Dissertation, (2012). Nonprobability sampling. Retrieved from
http://dissertation.laerd.com/nonprobability-sampling.php
Lake, A. & Townsend, T. (2006). Obesogenic environments: Exploring the build and
food environments. Journal for Research Sociology Promotion of Health, 126 (6),
262-267.
Lehmann, E.L. (2006). Nonparametrics: Statistical methods based on ranks. New York,
NY: Springer.
Let’s Move. (2010). Learn the facts. Retrieved from http://www.letsmove.gov/about.php
Levi, J., Vinter, S., St. Laurent, R., & Segal, L.M. (2008, August). F as in fat: How
obesity policies are failing in America (Issue Report). Washington, D.C.: Trust
for America’s Health.
Losby, J., & Wetmore, A. (2012). CDC coffee break using Likert scales in evaluation
survey work. Retrieved from
http://www.cdc.gov/dhdsp/pubs/docs/CB_February_14_2012.pdf

138
Mokdad, A. H., Marks, J. S., Stroup, D. F., & Gerberding J. L. (2004). Actual causes of
death in the United States, 2000. Journal of the American Medical Association,
291(10), 1238-1245. doi:10.1001/jama.291.10.123
National WIC Association. (2013). WIC overview program and history. Retrieved from
http://www.nwica.org/overview-and-history
Ogden, C., & Carroll, M. (2010). Prevalence of obesity among children and adolescents:
United States trends 1963-1965 through 2007-2008. Washington, DC: Center for
Disease Control and Prevention, National Center for Health Statistics. Retrieved
from
http://www.cdc.gov/nchs/data/hestat/obesity_child_07_08/obesity_child_07_08.p
df
Ogden, C.L., Carroll, M.D., Kit, B.K., & Flegal, K.M. (2012). Prevalence of obesity in
the United States 2009-2010. Retrieved from
http://www.cdc.gov/nchs/data/databriefs/db82.pdf
Pallant, J. (2010). SPSS Survival Manual (4th ed.). New York, NY: McGraw-Hill.
Physics.org. (2009, July 16). Higher speed limits cost lives (w/ Podcast). Retrieved from
http://www.physorg.com/news166980974.html
Powers, P., Spears, K., & Rebori, M. (2010). What is obesogenic environment?
University of Nevada Cooperative Extension Fact Sheet-10-11. Reno, NV:
University of Nevada,
Rani, P. (2014). Factors influencing consumer behavior. International Journal of Current
Research and Academic Review, 2(9), 52-61.

139
Schroeder, S. A. (2009). Public smoking bans are good for the heart. Journal of the
American College of Cardiology, 54(14), 1256-1257.
doi:10.1016/j.jacc.2009.08.006
South Carolina Department of Health Education and Environmental Control. (n.d.). Youth
access to tobacco prevention act of 2006. Retrieved July 29, 2013 from
http://www.scdhec.gov/health/chcdp/tobacco/access.htm
SurveyMonkey (2013). Security statement. Retrieved February 24, 2014, from
https://www.surveymonkey.com/mp/policy
Terrell, J. L. (2008). WIC and the USDA food stamp program. Walden University,
Laureate University.
Turnock, B. J. (2004). Public health: What it is and how it works. Sudbury, MA: Jones
and Bartlett.
White House. (2010). Presidential memorandum – Establishing a task force on childhood
obesity. Retrieved from https://www.whitehouse.gov/the-press-office/presidential-
memorandum-establishing-a-task-force-childhood-obesity
United States Census Bureau. (2012). State & county quickfacts. Retrieved September 13,
2014 from http://www.quickfacts.census.gov/qfd/states/13/1312.html
United States Department of Agriculture. (2007). WIC food package costs and rebates
summary: Fiscal year 2005. Retrieved from
http://www.fns.usda.gov/ora/WICFoodCosts/FY2005/FY2005.pdf
United States Department of Agriculture. (2010). WIC program: Total participation.
Retrieved from http://www.fns.usda.gov/pd/26wifypart.htm

140
United States Department of Agriculture. (2013a). A short history of SNAP. Retrieved
from http://www.fns.usda.gov/snap/rules/Legislation/about.htm
United States Department of Agriculture. (2013b). WIC’s mission. Retrieved from
http://www.fns.usda.gov/wic/aboutwic/mission.htm
United States Department of Agriculture. (2015). Income eligibility guidelines. Retrieved
September 10, 2015, from
http://www.fns.usda.gov/sites/default/files/wic/FY2014-
2015_WIC_IEGs_WEB.pdf
United States Department of Agriculture. (2015). Women, Infants, and children (WIC):
WIC eligibility requirements. Retrieved, July 15, 2015 from
http://www.fns.usda.gov/wic/wic-eligibility-requirements
United States Department of Agriculture. (n.d.). Part 246—Special supplemental
nutrition program for women, infants and children. Retrieved from
http://www.fns.usda.gov/wic/lawsandregulations/WICRegulations-7CFR246.pdf
United States Department of Agriculture, Economic Research Service. (2008, March).
Food stamps and obesity. What do we know? (Bulletin No. 34). Retrieved from
http://www.ers.usda.gov/media/210659/eib34_1_.pdf
United States Department of Agriculture, Economic Research Service. (April 2009). WIC
and battle against childhood overweight. Economic Brief 13.
United States Department of Agriculture, Food and Nutrition Service. (2006). WIC
program nutrition education guidance. Retrieved July 24, 2014 from
http://www.nal.usda.gov/wicworks/Learning_Center/ntredguidance.pdf

141
United States Department of Agriculture, Food and Nutrition Service. (2012). WIC food
packages. Retrieved from
http://www.fns.usda.gov/wic/benefitsandservices/foodpkg.htm
United States Department of Agriculture, Food Nutrition Service (2014). Special
supplemental nutrition program for women, infants, and children (WIC):
Revisions in the WIC food packages, 42 Fed. Reg.(to be codified at C.F.R. Part
246). Retrieved from http://www.fns.usda.gov/sites/default/files/03-04-14_WIC-
Food-Packages-Final-Rule.pdf
United States Department of Agriculture, Food Nutrition Service. (2015). Women, infants
and children; Background: Revisions to the WIC food packages. Retrieved from
http://www.fns.usda.gov/wic/final-rule-revisions-wic-food-packages
United States Department of Agriculture, Food and Nutrition Service . (2014).
Supplemental nutrition assistance program (SNAP); A short history of SNAP.
Retrieved from http://www.fns.usda.gov/snap/short-history-snap
United States Department of Agriculture, Food and Nutrition Service, Office of Research
and Analysis. (2010, March). Nutrition education and promotion: The role of FNS
in helping low-income families make healthier eating and lifestyle choices. A
Report to Congress. Washington, DC: Author.
United States Department of Agriculture, Food and Nutrition Service, Office of Policy
Support. (2013). The extent of trafficking in the supplemental nutrition assistance
program: 2009-2011 (Summary). Retrieved from
http://www.fns.usda.gov/sites/default/files/Trafficking2009_Summary.pdf

142
United States Department of Statistics.(2013) State and county quick facts. Retrieved
from http://quickfacts.census.gov/qfd/states/13000.html
United States Department of Health and Human Services. (2011, October 2). HHS
Releases assessment of healthy people 2010 objectives: Life expectancy rises, but
health disparities remain. Washington, DC: OASH Press Office.
United States Department of Health and Human Services. (2001).The Surgeon General’s
call to action to prevent and decrease overweight and obesity. Retrieved from
http://www.surgeongeneral.gov/topics/obesity/calltoaction/fact_adolescents.htm
United States Department of Health and Human Services. (n.d.). Frequently asked
questions related to the poverty guidelines and poverty. Retrieved from
http://aspe.hhs.gov/poverty/faq.cfm#differences
United States Department of Housing and Urban Development. (2013). Housing voucher
fact sheet. Retrieved from
http://portal.hud.gov/hudportal/HUD?src=/topics/housing_choice_voucher_progr
am_section_8
United States Government Publishing Office. (2015). Electronic code of federal
regulations. Retrieved September 26, 2015 from http://www.ecfr.gov/cgi-bin/text-
idx?rgn=div5&node=7:4.1.1.1.10#se7.4.246_12
Vanek, K. (2012). Likert scale? What is it? When to use it? How to analyze it? Retrieved
from https://www.surveygizmo.com/survey-blog/likert-scale-what-is-it-how-to-
analyze-it-and-when-to-use-it/

143
Vidourek, R.A., & King, K.A. (2008). Effectiveness of nutrition programs in increasing
healthy eating behaviors among low income women. Californian Journal of
Health Promotion, 6(1), 52-57.
World Bank. (2011). GDP (current US$). Retrieved from
http://data.worldbank.org/indicator/NY.GDP.MKTP.CD?cid=GPD_29
World Health Assembly 57, Res. WHA 55.23(2003).
World Health Organization. (2003).Global strategy on diet, physical activity, and health.
Resolution WHA55.23
World Health Organization. (2014). Obesity and overweight. Retrieved from
http://www.who.int/mediacentre/factsheets/fs311/en/
Wright, G.B. (2011). Student-centered learning in higher education. International
Journal of Teaching and Learning in Higher Education, 23(3), 92-97.
Xu, J., Kochanek, K.D., Murphy, S.L., & Tejada-Vera, B. (2010). Deaths: Final data for
2007. National Vital Statistics Report, 58(19), 1-136 .
Yen, S. T. (2010). The effects of SNAP and WIC programs on the nutrient intake of
children. Food Policy, 35(6), 576-583.
ZipWho. (2013). Basic zip code search. Retrieved from http://zipwho.com/

144
Appendix A: Letter to Prospective Study Participants
Greetings Prospective Study Participant,
My name is Joyce L. Terrell, and this letter is extended to you as an invitation to
participate in a research study I am conducting as partial requirement for fulfillment of
my Ph.D. in Public Health/Epidemiology. I am a student at Walden University,
Minneapolis, MN and the University, along with my committee chairperson Dr. Carla
Riemersma has granted me permission to precede with my research study titled “The
Social Ecological Influences of WIC Programming Survey on Behavior Change of
Former WIC Participants”.
The study I am conducting is designed to determine influences of food choices made by
recipients of Women, Infants, and Children (W.I.C.) benefits, while grocery shopping. If
you are female between the ages of 18-50 years, have received W.I.C. benefits a
minimum of 6 months or never received W.I.C. benefits, have one or more child, the
primary purchaser of groceries for the household, and income at or below %185 of U.S.
Poverty Income Guidelines you are eligible to participate in this study The purpose of
this study is to determine if your decisions to purchase select food items are influenced
because of health concerns or if your choices may be influenced by other factor(s). There
are minimal risks in completing this survey and your participation is strictly voluntary.
This study has the potential to help improve government program(s). To ensure your
identity is protected, no identifying information is requested and only cumulative results
will be reported. Because your participation is anonymous, it will not have any impact on
your ability to continue receiving any government assistance (if you receive benefits) or
affect your ability to participate in any USDA food subsidy program going forward. If
you initially decide to participate, please know that you may discontinue your
participation at any time. In order to protect your privacy, signatures are not being
collected and your completion and submission of completed survey serves as your
implied consent to participate, should you choose to participate. If you would like a copy
of the consent form, please let me know and I will provide you with a paper copy.
The survey will take approximately ten (10) minutes to complete. For your participation
in the study you will receive a Wal-Mart gift card, a $5.00 value. Should you have
additional questions regarding this research study, please contact the principal researcher,
Joyce L. Terrell, at [email protected] or at 6784714615. Should you have
questions regarding your rights as a participant, please contact the Walden University
Institutional Review Board at [email protected].
Sincerely,
Joyce L. Terrell, M.S., ATC., MPH

145
Saludos participantes del estudio prospectivo,
Mi nombre es Joyce L. Terrell, y esta carta se extiende a usted como una invitación para
participar en un estudio de investigación que estoy realizando como requisito parcial para
el cumplimiento de mi doctorado en Salud Pública / Epidemiología. Soy un estudiante de
la Universidad Walden, Minneapolis, MN y la Universidad, junto con mi comité
presidente Dr. Carla Riemersma me ha dado permiso para preceder con mi estudio de
investigación titulado " Las Influencias Ecológicas Sociales de Encuesta Programación
WIC en el cambio de comportamiento de los ex WIC Los participantes”.
El estudio estoy llevando a cabo está diseñado para determinar la influencia de la
elección de alimentos realizadas por los beneficiarios de las Mujeres, Infantes y Niños
(WIC) beneficios, mientras que las compras de comestibles. Si usted es mujer entre las
edades de 18 a 50 años, han recibido WIC beneficia a un mínimo de 6 meses o nunca
recibió WIC beneficios, tienen uno o más hijos, el comprador principal de víveres para el
hogar, y los ingresos en o debajo de 185% de pobreza en Estados Unidos Pautas de
ingresos que son elegibles para participar en este estudio El objetivo de este estudio es
determinar si sus decisiones a la compra Seleccione alimentos están influenciados por
cuestiones de salud o si sus decisiones pueden ser influenciados por otros factores (s).
Hay riesgos mínimos para completar esta encuesta y su participación es estrictamente
voluntaria. Este estudio tiene el potencial de ayudar a mejorar el programa (s) del
gobierno. Para asegurar que su identidad está protegida, no se solicita información de
identificación y se informará sólo los resultados acumulados. Debido a que su
participación es anónima, no tendrá ningún impacto en su capacidad para seguir
recibiendo ninguna ayuda del gobierno (si usted recibe beneficios) o afectar su capacidad
de participar en cualquier programa de subsidio de alimentos del USDA en el futuro. Si
en un inicio se decide participar, por favor sepa que usted puede suspender su
participación en cualquier momento.
Para proteger su privacidad, las firmas no están siendo recogidas y su finalización y
presentación de encuesta completada sirve como su consentimiento tácito a participar, si
decide participar. Si desea una copia del formulario de consentimiento, por favor
hágamelo saber y yo le proporcionará con una copia en papel.
La encuesta tardará aproximadamente diez (10) minutos para completar. Para su
participación en el estudio, usted recibirá una tarjeta de regalo de Wal-Mart, un valor de
$5.00. Si usted tiene preguntas adicionales con respecto a este estudio de investigación,
por favor póngase en contacto con el investigador principal, Joyce L. Terrell, en
[email protected] o al 6784714615. Si tiene preguntas acerca de sus derechos
como participante, por favor póngase en contacto con la Universidad Walden
Institucional Revise Junta en [email protected].
Atentamente,
Joyce L. Terrell, M. S., ATC., MPH

146
Appendix B: WIC Approved Food List

147

148
Appendix C: Behavioral Frequency Rating Scale for Controls
Food
Item
Purchases made past 2
years
Purchases made during
last 1 year
Purchases made 6
months ago
Bread
If you needed bread during
six separate grocery store
visits five years ago, how
often would you have
purchased 100% whole
wheat bread, rolls, or buns
during these visits?
100% of the time/Always 6
90% of the time/Usually 5
80% of the time/Often 4
70% of the time/Sometimes 3
60% of the time/Seldom 2
0% of the time/Never 1
Was your selection based on:
Taste
Nutritional benefits
Cultural influence
Price
other
If you needed bread during six
separate grocery store visits
three years ago, how often
would you have purchased
100% whole wheat bread,
rolls, or buns during these
visits?
100% of the time/Always 6
90% of the time/Usually 5
80% of the time/Often 4
70% of the time/Sometimes 3
60% of the time/Seldom 2
0% of the time/Never 1
Was your selection based on:
Taste
Nutritional benefits
Cultural influence
Price
other
If you needed bread during
six separate grocery store
visits during the last year,
how often would you have
purchased 100% whole
wheat bread, rolls, or buns
during these visits?
100% of the time/Always 6
90% of the time/Usually 5
80% of the time/Often 4
70% of the time/Sometimes 3
60% of the time/Seldom 2
0% of the time/Never 1
Was your selection based on:
Taste
Nutritional benefits
Cultural influence
Price
other
Instructions: This survey is designed to identify how often you purchase select food
items. Please check the box that corresponds to your answer/response.

149
Appendix D: Behavioral Frequency Rating Scale for Study Group
Food
Item
Pre-WIC During WIC Post-WIC
Bread
If you needed bread on six
separate grocery store visits
before you received WIC, how
often would your purchase 100%
whole wheat bread, rolls, or
buns during these visits?
100% of the time/Always 6
90% of the time/Usually 5
80% of the time/Often 4
70% of the time/Sometimes 3
60% of the time/Seldom 2
0% of the time/Never 1
Was your selection based on:
Taste
Nutritional benefits
Cultural influence
Price
other
If you needed bread on six
separate grocery store visits when
you were enrolled in WIC, how
often would your purchase 100%
whole wheat bread rolls, or
buns during these grocery visits?
100% of the time/Always 6
90% of the time/Usually 5
80% of the time/Often 4
70% of the time/Sometimes 3
60% of the time/Seldom 2
0% of the time/Never 1
Was your selection based on:
Taste
Nutritional benefits
Cultural influence
Price
other
If you needed bread when you no
longer received WIC, how often
would your purchase 100%
whole wheat bread, rolls, or
buns during these visits?
100% of the time/Always 6
90% of the time/Usually 5
80% of the time/Often 4
70% of the time/Sometimes 3
60% of the time/Seldom 2
0% of the time/Never 1
Was your selection based on:
Taste
Nutritional benefits
Cultural influence
Price
other
Instructions: This survey is designed to identify how often you purchase select food
items. Please check the box that corresponds to your answer/response.
If your selection was influenced by your participation in WIC, rate which influence had
the greatest impact on your choice: Circle the number next to your choice:
1= greatest amount of influence 2=little amount of influence 3= no influence
Literature 1---------- 2 ------------3
Counseling 1 --------- 2------------ 3
Requirement to use food benefits to purchase from WIC approved food list
1----------- 2-----------3

150
Appendix E: Survey Questions
Being overweight may contribute to health problems? Yes/No
Obesity may contribute to health problems? Yes/No
Which USDA food subsidy (ies) do you currently receive? SNAP/TANF/School
Breakfast-Lunch Program
How many years did you receive WIC benefits?
Which of the following categories best describes your primary area of employment?
Are you currently on a special diet?
How would you describe yourself? Underweight/Normal
weight/Overweight/Obese/Morbidly obese
Do you have any medical/health/dental problems? If yes proceed to the next question
What year did you last receive WIC benefits?
How many children do you have?
How many children 16 years old or younger live in your household?
What is your primary language?
What is your Age?
What is your current income in US dollars?
What is the highest level of education you have completed?
Has a health care provider ever told you that you are overweight?
Has a health care provider ever told you that you are obese?
Bread Category
Do you or a family member have an allergy that prevents you from eating bread? If yes
skip to the next food category
Does a religious belief prevent you from eating bread? If yes proceed to next food
category

151
Please select grain of bread purchased PRE-WIC
Please select grain of bread purchased while enrolled in WIC
Please select grain of bread purchased POST-WIC
If there is a difference in the grain of bread purchased POST-WIC? If yes proceed to next
question?

152
Appendix F: State of Georgia Demographics (2010)
Female ......................................................................................................................... 50.2%
White ........................................................................................................................... 38.4%
Black/African American ................................................................................................ 54%
American Indian/Alaskan Native ..................................................................................... 2%
Asian ............................................................................................................................. 3.1%
Hispanic/Latino ............................................................................................................. 5.2%
White/non-Hispanic or Latino .................................................................................... 36.3%
Language other than English spoken at home aged 5+............................................... 10.5%
High school graduate or higher persons aged 25+ ...................................................... 87.3%
Bachelor’s degree or higher aged 25+ ........................................................................ 46.1%
Median household income ........................................................................................$45,946
Persons below poverty level ....................................................................................... 23.2%
Persons per household.....................................................................................................2.18
Source: Georgia Bureau of Statistics (2010)
Georgia WIC Demographics
Number of WIC participants .....................................................................................303,000
Average number of persons in a WIC family ......................................................................4
Average income ........................................................................................................$10,808
Age of 83% of participants .......................................................................................... 18-34
17 years or younger ........................................................................................................ 10%
White .............................................................................................................................. 40%

153
Hispanic ......................................................................................................................... 31%
Black/African American ................................................................................................ 24%
Average participant has 12 years of education
More than 1/3 do not participate in other federal assistance programs
Source: Georgia Department of Human Resources (2012).
Fulton County, GA
Population .................................................................................................................977,773
Female ......................................................................................................................... 51.2%
White .............................................................................................................................. 47%
Black/African American ............................................................................................. 44.6%
American Indian/Alaska Native .................................................................................... 0.3%
Asian ................................................................................................................................ 6%
Language other than English spoken at home aged 5+............................................... 16.1%
Median household income ........................................................................................$57,582
Persons below poverty level ....................................................................................... 15.9%
Source: United States Census Bureau (2012).
Native Hawaiian/Pacific Islander ................................................................................. 0.1%
Language other than English spoken at home aged 5+............................................... 18.1%
Median household income ........................................................................................$51,712
Persons below poverty level ....................................................................................... 17.1%
Source: United States Census Bureau (2012).

154
These numbers reflect approximately 2.5 million potential study participants from which
the researcher will draw the sample.

155
Appendix G: Letter to Wal-Mart

156

157
Appendix H: Comments on the Food and Nutrition Service Rule: Special SNAP for
Women, Infants and Children
Comment from WIC Participant, Breezewood, PA
“Overall I am pleased with the new WIC food package. However, there are a few items
that concern me. First is the juice sizes and selections. It is extrememly confusing
when purchasing for a child and a pregnant woman, it would be easier if the
selections and sizes were the same for both. Second is the requirements of the
grocery store. Since they are not required to carry ALL WIC items, there are
times when no items in the wholegrain section are purchased because preferred
items are not available. I was also disappointed when cheese was decreased.
Cheese is so versatile and comes in many forms, tastes, and selections. This isn't
necessarily a WIC problem, but since cereal manufacturers changed the sizes of
their boxes, it isn't always easy to get the most for your money. For example, Rice
Chex comes in size 12.6 oz (or something like that) and if you are allowed 36 oz
then you lose close to 11 oz by choosing that particular cereal.
The fresh fruits and vegetables are great, but it is hard to judge how much you
are spending since we are allowed a dollar amount and fruit is sold by the price
per pound and usually the pounds aren't determined until you are at the checkout.
I realize that some stores have places to give you an estimate, but that isn't always
accurate.
Thank you for giving me an opportunity to express my concerns”
Posted: 03/22/2010
Comment from WIC Participant, Port Richey, FL
I was looking forward to the new packages, but in the preliminary articles I'd read, it
said that tofu would be made available. I was looking forward to that. I'm so
happy that FINALLY there's soy milk and fruits/veggies, but I'd really like the tofu
instead of cheese.
Posted: 03/19/2010
Comment from WIC Local Agency, Hutchinson, KS
Thank you for the terrific changes made to the WIC food packages. It may have taken 35
years, but the new packages are dynamite. The clients we serve will meet their nutrition
needs from whole grains, whole fruits and vegetables and lower fat dairy products. The
clients are very excited and so is our staff.
Posted: 03/19/2010
Comment from General Public, Kenmore, WA
To the Washington State Department of Health members,

158
Whoever is making the decision to cut organic milk and cereal from the W.I.C.
program might think they are saving money, but they're not! There's plenty of
research supporting the fact that organic milk, cereal, etc. is healthier for us than
those treated with so many pesticides and antibiotics. In the long run, your
decision to eliminate the organic products will cost us, the taxpayer, more in the
future, with all the medical bills for these W.I.C recepients. Shouldn't we all be
acting proactively to conserve state and federal government spending?
These organic products can be affordable to these W.I.C. recepients with your
assistance. Without them being part of the W.I.C. package, the recepients won't
be able to afford them. Let them have the choice of organic or non.
Posted: Mar 15, 2010
Comment from General Public, Rochester, NY
Suggest other varieties of Honey Bunches of Oats-not just vanilla clusters.
Suggest yogurt and whole grain pasta be added in the future.
Participants have been unable to find 48 oz. plastic containers of juice.
New recommendation is not to give peanut butter until two years old but it is still an
option on the WIC checks. Can a different alternative be offered between 1-2 years old.
Posted: Mar 19, 2010
Comment from General Public, Berkeley, CA
I have spent 25 years working to improve the health of low income pregnant women. In
the last 10 years, I have been alarmed at the increasing rates of obesity and diabetes that
are leading to poor birth outcomes and chronic illness for both the mother and her child.
I have tremendous respect for the WIC program and was delighted to see the new food
package. It will go a long way in promoting more healthy food choices for the recipients:
fresh fruits and vegetables, whole grains and low fat milk. Also, the increased emphasis
on breastfeeding has the potential to improve better health not just for the baby, but also
for the mother.
I urge the adoption of the new WIC final rules.
Posted: Mar 22, 2010
Comment from WIC Participant, Poulsbo, WA
I am unhappy with the new wic food choices. I am only receiving 16oz of a Whole Grain
choice. It says in the brochure i should be able to receive bread but that is not the chase
you can only get Oat Meal in the tubs, brown rice or Tortillas. I dont use any of those. I
am also unhappy with the amount of cheese I use to recive 2 lbs and now only getting
1lbs. My family goes through almost 2 lbs a month. As for the milk please bring back the
organic milk as that is what I drink and go through the most. Over all I am not happy
with the changes to the program as they do not benefit me as much as the old program
did.
Posted: Mar 19, 2010

159
Comment from WIC Participant, Los Angeles, CA
What I like about the new WIC foods:
I appreciate the fact that fresh, high quality, locally grown foods are available for
purchase in WIC only stores in Los Angeles.
What I don’t like about the new WIC foods:
Messages such as “value-first”, buy for quantity and other such messaging to WIC moms
is detrimental and counter to the work that local food activist are doing to increase WIC
moms access to fresh, high quality and locally grown foods. If moms are encouraged to
buy as much as they can with vouchers they may be encouraged to purchase foods based
solely on price and not taste or nutritional value. Local foods are high quality foods
which are fresh and tasty, by offering such products to WIC moms we expose them to
better and tastier foods which will make them want to eat more of such foods.
Thank you for reading my comments.
Posted: Mar 22, 2010
Comment from Health Professional, San Rafael, CA
As a physician I am very concerned about "chunk light" or canned "light tuna" being
included in food packages for women receiving assistance through the Women, Infants
and Children program. Studies have shown that canned "light tuna" contains high levels
of mercury, sometimes as high as canned albacore tuna. I applaud the USDA's decision
to remove albacore tuna from WIC food packages due to mercury concerns and believe
the USDA needs to do more to protect vulnerable women and children by removing all
canned tuna.
Methylmercury is a known neurotoxin, with children being at greatest risks from its
effects. As stated by the U.S. Environmental Protection Agency an estimated 630,000
children born in the US are at risk each year from neurological defects due to mercury
contamination.
I would like to see the USDA take the following actions to reduce low income women and
children's exposure to mercury:
• Eliminate all canned tuna from WIC food packages
• Offer canned fish alternatives such as canned wild salmon, anchovies, sardines and
mackerel
• Embark on a public education effort in order to assist women in deciding which fish are
healthiest for their diet
Sincerely,
Posted: Mar 22, 2010