Social Capital and the Decision to Adopt New Technology ... Capital and the Decision to Adopt New...
13
Social Capital and the Decision to Adopt New Technology Among Rice Farmers in the Philippines ROSEMARIE G. EDILLON 1 ABSTRACT Conventional models predict that a rational farmer, given information of higher profits from a new technology relative to the old, would shift to the new technology. However, evidence abounds to the contrary. In the Philippines, the periods of sustained increase in rice yield have always coincided with government programs, mostly in the form of input subsidies, to encourage adoption of the new technology. This paper utilizes a social capital framework to inform the design of agricultural productivity programs. It emphasizes the need to examine the characteristics of farmer networks, still within the framework of optimizing the risk-adjusted return from the new technology. INTRODUCTION Conventional models predict that a rational farmer, given information of higher profits from a new technology relative to the old, would shift to the new technology. However, evidence abounds to the contrary. The Philippine profile of rice farming is one such example. Even with more than 50 years of programs that promote the use of certified seeds, the hallmark of new technology in agriculture, adoption rate as of 2002 is still at a low 25 percent. Social capital affects economic variables like agricultural productivity. Edillon (2010a) estimates that a farmer with social capital has a higher likelihood 1 The author is a recipient of the La Trobe University Postgraduate Research Scholarship. The comments of Sisira Jayasuriya and David Prentice to an initial draft are appreciated as well as the excellent assistance of the research staff of the Asia-Pacific Policy Center. The views expressed in the paper are the author’s opinions and do not reflect the views of the university. Philippine Journal of Development Number 68, First Semester 2010 Volume XXXVII, No. 1
Transcript of Social Capital and the Decision to Adopt New Technology ... Capital and the Decision to Adopt New...

Social Capital and the Decision to Adopt New Technology Among Rice Farmersin the Philippines
RosemaRie G. edillon1
AbSTRACTConventional models predict that a rational farmer, given information of higher profits from a new technology relative to the old, would shift to the new technology. However, evidence abounds to the contrary. In the Philippines, the periods of sustained increase in rice yield have always coincided with government programs, mostly in the form of input subsidies, to encourage adoption of the new technology. This paper utilizes a social capital framework to inform the design of agricultural productivity programs. It emphasizes the need to examine the characteristics of farmer networks, still within the framework of optimizing the risk-adjusted return from the new technology.
INTRODUCTIONConventional models predict that a rational farmer, given information of higher profits from a new technology relative to the old, would shift to the new technology. However, evidence abounds to the contrary. The Philippine profile of rice farming is one such example. Even with more than 50 years of programs that promote the use of certified seeds, the hallmark of new technology in agriculture, adoption rate as of 2002 is still at a low 25 percent.
Social capital affects economic variables like agricultural productivity. Edillon (2010a) estimates that a farmer with social capital has a higher likelihood
1 The author is a recipient of the La Trobe University Postgraduate Research Scholarship. The comments of Sisira Jayasuriya and David Prentice to an initial draft are appreciated as well as the excellent assistance of the research staff of the Asia-Pacific Policy Center. The views expressed in the paper are the author’s opinions and do not reflect the views of the university.
Philippine Journal of DevelopmentNumber 68, First Semester 2010
Volume XXXVII, No. 1

2 PhiliPPine Journal of DeveloPment 2010
of adopting modern technology than one without by at least 9 percentage points (ppts), ceteris paribus. In turn, it is affected directly and indirectly by various policies and programs, though not deliberately. In fact, the impact on social capital is rarely considered. This is rather unfortunate though not surprising, considering the dearth of both theoretical and empirical studies on social capital and its impact on economic variables like agricultural productivity.
There have been improvements in rice yield in the Philippines as shown in the chart in Appendix 1. From only 1.16 metric tons per hectare in 1960, yield increased to almost 3.9 metric tons in 2008. Moreover, there have been periods of sustained increases in yield. These seem to coincide with government programs—the period 1972–1977 coinciding with the Green Revolution, then in 1979−1985 and 2002–2007 with the implementation of various agricultural development programs. In between these are periods when yields did not improve and sometimes even declined. Is it then the case that farmers use the new technology only when there are government programs that undoubtedly come with a package of extension services and subsidies? How can the efficiency of government programs be improved?
This paper aims to explore the impact of social capital on the decision to adopt modern technology in agriculture. This can inform the design of future agricultural extension programs. The next section discusses the analytical framework and on this basis, a model is developed. The model explicitly includes network characteristics. This is then applied to empirical data and the results discussed. The paper concludes with some remarks and recommendations.
FRAmewORk AND meThODOlOgyA previous study (Edillon 2010a) demonstrates how different factors affect a farmer’s decision to shift to a new technology, namely: (a) control over farming decisions; (b) access to capital; (c) access to risk-mitigation instruments; and (d) cost of learning. This menu, however, is incomplete and implicitly assumes that farmer operators come up with the decision in isolation.
Foster and Rosenzweig (1995), observing the adoption rates during the Indian Green Revolution, find that “poor farmers with wealthy neighbors are slower to adopt [modern technology] than those with poor neighbors.” This results from imperfect knowledge so that there is a lot to be learned from the mistakes of others. It then makes sense to delay adoption when somebody else in the neighborhood is likely to be an early adopter. This finding also demonstrates that farmers interact with other farmers. They observe the decisions made by other farmers and the consequences of those decisions. They update their initial opinions and then decide.

3Edillon
( ) ( ) ( )
LLL
KKKK
r
Xw
YK
K
LGP
YESuXwXLFEP
hh
h
hhh
hh
AA
LhA L
hA
otheAhh
h
AAAA
Aihhh
X hh Xh
hhAhA
≤+
+≤+∗+
=
=−−−
−
−
−−−−
)5(
)
))))
(
( (((
)4(
),
, ,
()3(
,()2( ρ
{ }hh AAh
YYE
E E
−+)(maxarg)1(
F F
rh
Analytical frameworkThe model takes off from a previous study (Edillon 2010a) which simultaneously considers the effects of property rights, social capital, learning costs, and agricultural productivity on the decision to adopt modern technology. The model assumes that the farmer is faced with a discrete choice between the traditional and modern technology. He chooses the technology, indexed by h, that results in the higher total income Y, given by equation (1), which is the aggregate of farm profits, indexed by A, and income from off-farm and nonfarm sources, indexed by –A:
subject to:
Equation (2) is the expected profit from the farm, which is the difference between expected revenue from the farm and the corresponding costs. The agricultural production function is given by Fh specific to technology h. The farmer uses own-labor, and inputs, Xh. Hired labor is included among the inputs, Xh. The expected output is adjusted for the perceived security of the farmer’s right over his produce, given by ρ. Unit price of farm output is PA.
Inputs are priced at wh, and these are financed through capital, Kh with user cost imputed at r. There is a cost of learning, uh that is associated with technology h, but it varies depending on the conditions and aptitude for learning, Si of farmer i.
The farmer’s household also derives income from other sources (Equation 3). The factors of production are given by residual labor, and residual capital, . The unit price of nonfarm output is P-A. If the nonfarm activity simply requires labor input from the farmer, then P-A is simply the nonfarm wage.
Equations (4) and (5) consider the finite resources of the farming household with respect to capital and labor. Ke is the amount that the farmer can mobilize out of his economic wealth (financial and physical assets). Examples are savings and loans that he can avail using his assets as collateral. Koth is some amount that
( ) ( ) ( )
LLL
KKKK
r
Xw
YK
K
LGP
YESuXwXLFEP
hh
h
hhh
hh
AA
LhA L
hA
otheAhh
h
AAAA
Aihhh
X hh Xh
hhAhA
≤+
+≤+∗+
=
=−−−
−
−
−−−−
)5(
)
))))
(
( (((
)4(
),
, ,
()3(
,()2( ρ
{ }hh AAh
YYE
E E
−+)(maxarg)1(
F F
rh
( ) ( ) ( )
LLL
KKKK
r
Xw
YK
K
LGP
YESuXwXLFEP
hh
h
hhh
hh
AA
LhA L
hA
otheAhh
h
AAAA
Aihhh
X hh Xh
hhAhA
≤+
+≤+∗+
=
=−−−
−
−
−−−−
)5(
)
))))
(
( (((
)4(
),
, ,
()3(
,()2( ρ
{ }hh AAh
YYE
E E
−+)(maxarg)1(
F F
rh
( ) ( ) ( )
LLL
KKKK
r
Xw
YK
K
LGP
YESuXwXLFEP
hh
h
hhh
hh
AA
LhA L
hA
otheAhh
h
AAAA
Aihhh
X hh Xh
hhAhA
≤+
+≤+∗+
=
=−−−
−
−
−−−−
)5(
)
))))
(
( (((
)4(
),
, ,
()3(
,()2( ρ
{ }hh AAh
YYE
E E
−+)(maxarg)1(
F F
rh
( ) ( ) ( )
LLL
KKKK
r
Xw
YK
K
LGP
YESuXwXLFEP
hh
h
hhh
hh
AA
LhA L
hA
otheAhh
h
AAAA
Aihhh
X hh Xh
hhAhA
≤+
+≤+∗+
=
=−−−
−
−
−−−−
)5(
)
))))
(
( (((
)4(
),
, ,
()3(
,()2( ρ
{ }hh AAh
YYE
E E
−+)(maxarg)1(
F F
rh

4 PhiliPPine Journal of DeveloPment 2010
can be mobilized outside of his economic wealth, e.g., loans that he can avail of without having to put up collateral. Capital used for farm activities competes in the same pool as capital for nonfarm activities. Similarly, labor used for farm activities is labor that is no longer available for nonfarm (and off-farm) activities.
The social capital of an individual is the resource that is obtained from individuals other than close family based on a trust relationship (Edillon 2010b). There are at least three ways by which social capital can influence the decision to adopt a new technology. Social capital, which is included in Koth in Equation (4), eases the financial constraint and therefore affords the farmer with the higher amount of resources needed to adopt the modern technology. It can also reduce learning costs, uh and it can facilitate the diffusion of information regarding expected output, .
Edillon (2010a) looks at the first of these possible transmission mechanisms of social capital. In the empirical estimation, it is measured as the sum of two indicator variables: if the farmer availed of credit from relatives and friends, and if the farmer is a member of an organization. The results show a positive effect on technology adoption, whether it consists of relatives and friends or membership in an organization.
The last two possible impacts of social capital come about through social learning or what is also referred to as learning from others. Conley and Udry (2010) emphasize the importance of social learning in the adoption of new technology. They find that pineapple farmers in Ghana adjust the levels of fertilizer that they apply after hearing of good or bad news regarding input use of other farmers and their corresponding outputs.
The so-called workhorse model of learning from others is the Bass model cited in Jackson (2008). The model roughly classifies the individuals for whom change is desired into adopters and nonadopters. Adopters are either innovators or imitators. At every point in time, there could be innovators (who most probably adopt because of some outside influence) from among the nonadopters, and imitators of previous adopters from among the nonadopters. The presence of outside influence begins the process of change, but it is the characteristics of the network that determine how fast change would be accepted. What are needed are variables that characterize the influence path and connectedness of the network.
Influence matrix (IM)The influence path of a network is summarized by the influence matrix. The concept of an influence matrix is better understood by referring to the model formulated by DeGroot (1974) on how a consensus is reached.
The influence matrix, say IM, has elements IMij that denote the importance of individual j as perceived by individual i. Now, i, j = 1, 2, …, G where G is the number of individuals in the network. Next, define a vector of opinions or beliefs,
( ) ( ) ( )
LLL
KKKK
r
Xw
YK
K
LGP
YESuXwXLFEP
hh
h
hhh
hh
AA
LhA L
hA
otheAhh
h
AAAA
Aihhh
X hh Xh
hhAhA
≤+
+≤+∗+
=
=−−−
−
−
−−−−
)5(
)
))))
(
( (((
)4(
),
, ,
()3(
,()2( ρ
{ }hh AAh
YYE
E E
−+)(maxarg)1(
F F
rh

5Edillon
Ot where each element, Oti represents how individual i feels about an issue at time
t. This opinion vector is then updated as the individuals interact with each other, according to the following updated equation:
The structure of the influence matrix IM and the opinion vector O determine the speed at which learning may be diffused.2
2 Consider a network with four members and suppose that one member of the network believes the new technology to be good. Suppose further that the four members of the network are egoistic. Then, the IM matrix is the identity matrix, and O is simply the unit vector:
Then, , meaning that no amount of interaction (or iteration) will improve the opinion matrix. The only way to diffuse learning in such a network is to directly convince each member.
Now, consider a network with four members where the relationship is characterized by collegiality, meaning each member equally respects the other. The IM matrix may look something like IM2. Again, starting with a unit vector O0, we find that no amount of interaction (or iteration) will improve the opinion matrix, starting from iteration 1.
What if, on the other hand, there is one member who is egoistic but is regarded more highly by all others? Suppose further that he is the one who believes the new technology to be good. Then, the IM matrix can look something like this:
Simulating the updating process, where O0 is the unit vector as before:
If threshold value that is needed to sway member i to adopt the new technology is 0.5, then the above simulation shows this can happen beginning in period 2.
1)6( −∗= tt OIMIO
=
=
0001
,
1000010000100001
0OIMI
01 OOIMO tt =∗= −
=
25.25.25.25.25.25.25.25.25.25.25.25.25.25.25.25.
2IM
=
2.2.2.4.2.2.2.4.2.2.2.4.0001
3IM
=
=
64.64.64.1
,
4.4.4.1
21 OO
{ } { }!/])1[()(Pr)7( )1( dGedD dG ππ −== −
]1/[)][log()8( −=∗ GGπ
=
=
64.64.64.1
,
4.4.4.1
21 OO
1)()9( −⋅= tt OEMIMO
π
I

6 PhiliPPine Journal of DeveloPment 2010
Connectedness matrixFarmers can update their initial opinions only after they have “exchanged notes” with the other farmers. It is quite logical to think that this interaction is more likely to happen when farmers are more “connected.”
Network analysis usually begins with constructing the adjacency matrix or proximity matrix. Suppose there is a network with G members. The adjacency or proximity matrix, say P, is a GxG matrix that has elements, Pij that takes on the value 1 if i is adjacent to j and 0, otherwise.
Others are more interested in an embeddedness matrix, say EM. Each element, EMij can take on a range of values, say between 0 and 1, where a higher value means that i and j have embedded relations (or are more connected). EM is also a GxG matrix. As a matter of convention, Pii=1 and EMii=1.
A summary statistic needs to be computed to facilitate the analysis involving the proximity and embeddedness matrices. The following is adapted from Jackson (2008):
Suppose that there is a community of G farmers. Let d be the number of links that a farmer has, which can be up to G-1. Also, let π be the probability of a link forming between any two farmers. Then, any farmer would have the expected number of links equal to (G-1)π. For the entire network, the proportion of farmers with degree=d is given by the Poisson distribution:
Moreover, there is a certain level of π that ensures that there is no isolated farmer in the community. This threshold is given by:
Updated opinion vectorThe problem for which this model is being developed is one where the technology is well known, but nonadopters do not have full information about the expected output. The information coming from influential fellow farmers then becomes a critical input.
The opinion vector observed at time t, Ot is the result of an updating process:
In terms of the above model, the information set is , and the perceived cost of learning, uh(Si).
1)6( −∗= tt OIMIO
=
=
0001
,
1000010000100001
0OIMI
01 OOIMO tt =∗= −
=
25.25.25.25.25.25.25.25.25.25.25.25.25.25.25.25.
2IM
=
2.2.2.4.2.2.2.4.2.2.2.4.0001
3IM
=
=
64.64.64.1
,
4.4.4.1
21 OO
{ } { }!/])1[()(Pr)7( )1( dGedD dG ππ −== −
]1/[)][log()8( −=∗ GGπ
=
=
64.64.64.1
,
4.4.4.1
21 OO
1)()9( −⋅= tt OEMIMO
π
I
( ) ( ) ( )
LLL
KKKK
r
Xw
YK
K
LGP
YESuXwXLFEP
hh
h
hhh
hh
AA
LhA L
hA
otheAhh
h
AAAA
Aihhh
X hh Xh
hhAhA
≤+
+≤+∗+
=
=−−−
−
−
−−−−
)5(
)
))))
(
( (((
)4(
),
, ,
()3(
,()2( ρ
{ }hh AAh
YYE
E E
−+)(maxarg)1(
F F
rh

7Edillon
Data and limitations of the studyThe above model is applied to data from the Census of Agriculture (CA) conducted by the Philippine National Statistics Office in 1991. Although dated, it is the only dataset that contains information on the variables social capital, property rights, and adoption of modern technology (use of high-yielding varieties, HYV).
The data available do not contain all the desired variables to be able to apply the model extensively. However, there can be proxy variables. Of particular interest is to find variables that indicate the presence of an outside influence and those that can characterize the influence and embeddedness matrices.
Visits by extension service workers are an indication of outside influence, though it is not the only one.
In searching for variables that can characterize the influence matrix, we need to look at variables that significantly influence the decision to adopt the new technology. It must also monotonically reflect how each farmer regards the others in terms of whether the pattern is collegial or hierarchical. The variable should therefore confer status to some farmers. A wealth variable is an obvious choice, perhaps size of farm owned. This variable, however, is not included in the CA. What the CA contains is information on tenure and size of the farm operated though not necessarily owned.
Another possible variable is the profile of farmers in the village according to highest school grade completed, summarized in terms of mean and skewness. A positively skewed profile can mean the presence of a few innovators who would be regarded as a major influence in the village. A negatively skewed profile can mean the presence of more innovators, although the relationship among farmers is expected to be more collegial.
A village with a high membership rate in organizations can indicate a high degree of embeddedness. The proportion of farmers visited by extension workers is another. Extension workers usually conduct their extension visits before groups of farmers, and these visits or meetings serve as venues whereby farmers gather to discuss about farming matters.
To the above list, the variables used in the previous study are added: property rights (the tenure variable is translated into freedom of use and freedom to transfer3); variables that capture cost of learning (education and experience of farmer); social capital (credit from friends and relatives, organizational membership, and visit by an extension worker); and capital constraint (credit from formal sources, area of form, presence of irrigation).
3 The tenure variable is broken down into freedom of use and freedom to transfer, where each one is an ordinal variable from 0 to 3. Freedom of use pertains to the extent to which the farmer can decide on production issues. Freedom to transfer is adapted from Besley (1995) and is defined as having the freedom to “sell, rent, bequeath, mortgage, and gift.” See Edillon (2010a) for details.

8 PhiliPPine Journal of DeveloPment 2010
ReSUlTS AND DISCUSSIONDescriptive profileLess than 62 percent of all rice farmers used high-yielding varieties in 1991. However, in almost 80 percent of villages, there was at least one adopter.
The aggregate education profile of farmers is positively skewed. More than one-third of farmers only have some elementary education. Less than 20 percent have finished secondary education or higher. Those with a college degree or higher make up less than 5 percent.
In some 16 percent of villages, the education profile of farmers is negatively skewed.
The average membership rate in organizations across villages is about 27 percent. It can be as low as 0 and as high as 100 percent. Less than 18 percent of villages have membership rates that are below the threshold estimated using Equation 8.
The coverage of extension visits within the village is also quite variable, ranging from 0 to 100 percent. Visits by a government extension worker reaches about 38 percent of farmers; those by nongovernment organization (NGO) workers reach only 14 percent of farmers in the village on average.
model estimationThe variables that describe the profile of farmers in the village are added to the previous study (Edillon 2010a). The results are shown in Table 1 where the coefficients of the provincial dummy variables are omitted.
The variable D+ (D-) is equal to 1 when the summary characteristic is greater than (lesser than) the threshold value. The threshold value used for membership rate is computed in Equation (8), which varies for each village; for skewness of education profile, the threshold value is 0.
The variables representing the education of the farmer and the farm tenure (freedom of use and freedom to transfer) are expressed with an ordinal scale.
The new specification results in a higher explanatory and prediction power4 as compared to the model estimated in Edillon (2010a). The signs and significance levels of variables already included in the previous model are the same as before, except for the education variables.
Variables that are a proxy for Ke positively affect the decision to use HYV: credit from formal sources, farm area, and presence of an irrigation facility. Variables that are a proxy for Koth also exert a positive influence: credit from informal sources and membership in organizations.
The effect of the tenure variable appears unexpected, but not if it is taken within the context of the Comprehensive Agrarian Reform Program (CARP)
4 As indicated by the higher area under ROC = 0.804.
1)6( −∗= tt OIMIO
=
=
0001
,
1000010000100001
0OIMI
01 OOIMO tt =∗= −
=
25.25.25.25.25.25.25.25.25.25.25.25.25.25.25.25.
2IM
=
2.2.2.4.2.2.2.4.2.2.2.4.0001
3IM
=
=
64.64.64.1
,
4.4.4.1
21 OO
{ } { }!/])1[()(Pr)7( )1( dGedD dG ππ −== −
]1/[)][log()8( −=∗ GGπ
=
=
64.64.64.1
,
4.4.4.1
21 OO
1)()9( −⋅= tt OEMIMO
π
I

9Edillon
Variable Coefficient Pr>ChiSq Odds RatioIf farmer availed of credit from informal sources 0.4229 <.0001 1.526If farmer is a member of an organization 0.1105 <.0001 1.117If farmer availed of credit from formal sources 0.3588 <.0001 1.432Ln (farm area) 0.2214 <.0001 1.248If farm is irrigated 03.3712 <.0001 1.450Freedom of use>0 0.1319 <.0001 1.141Freedom of use>1 0.2183 <.0001 1.244Freedom of use>2 -0.0408 0.0056 0.960Freedom to transfer>1 -0.1380 <.0001 0.871Freedom to transfer>2 -0.0444 <.0001 0.957If farmer is male 0.0413 <.0001 1.042Age of farmer 0.00487 <.0001 1.005Squared value of age -0.00003 <.0001 1.000If education of farmer is at least some elementary 0.1137 <.0001 1.120If education of farmer is at least elementary 0.1076 <.0001 1.114If education of farmer is at least some high school 0.0296 <.0001 1.030If education of farmer is at least high school 0.0149 <.0001 1.015If education of farmer is at least some postsecondary 0.0306 0.1056 1.031If education of farmer is at least some college 0.0229 0.1339 1.023If education of farmer is at least college -0.0698 0.3135 0.933If farmer was visited by government extension worker 0.2527 <.0001 1.288If farmer was visited by NGO worker 0.0530 <.0001 1.054% of farmers visited by government worker 0.6677 <.0001 1.950% of farmers visited by NGO worker 0.0725 <.0001 1.075% of farmers who are member of org* D- -1.8334 <.0001 0.160% of farmers who are member of org* D+ 0.4411 <.0001 1.554Average education of farmers in village 0.2223 <.0001 1.249Skewness measure of education* D- -0.5943 <.0001 0.552Skewness measure of education* D+ 0.0767 <.0001 1.080
Intercept: -8.5222 pseudo R-square: 0.35 area under ROC: 0.804
Table 1. Estimate of logit model of use of HYV seeds among rice farmers in 1991
Source: Author’s calculations.
10 PhiliPPine Journal of DeveloPment 2010
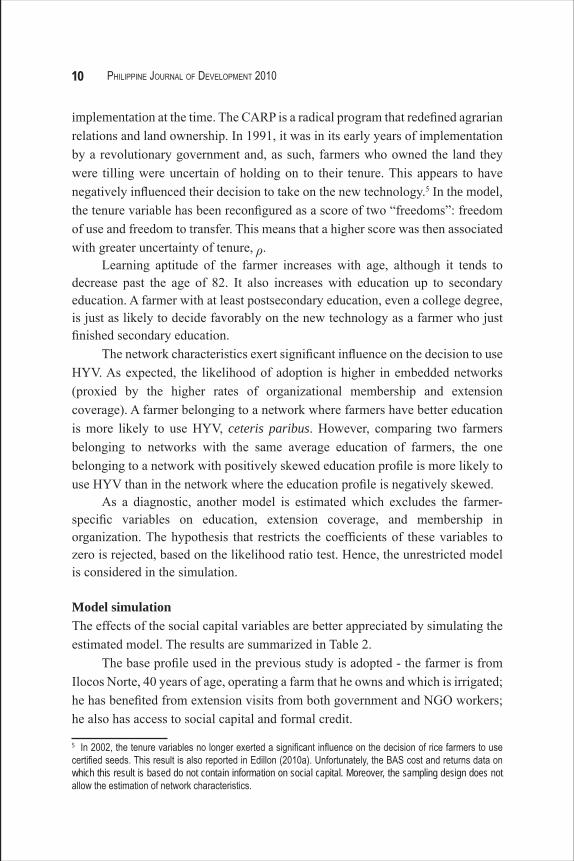
implementation at the time. The CARP is a radical program that redefined agrarian relations and land ownership. In 1991, it was in its early years of implementation by a revolutionary government and, as such, farmers who owned the land they were tilling were uncertain of holding on to their tenure. This appears to have negatively influenced their decision to take on the new technology.5 In the model, the tenure variable has been reconfigured as a score of two “freedoms”: freedom of use and freedom to transfer. This means that a higher score was then associated with greater uncertainty of tenure, ρ.
Learning aptitude of the farmer increases with age, although it tends to decrease past the age of 82. It also increases with education up to secondary education. A farmer with at least postsecondary education, even a college degree, is just as likely to decide favorably on the new technology as a farmer who just finished secondary education.
The network characteristics exert significant influence on the decision to use HYV. As expected, the likelihood of adoption is higher in embedded networks (proxied by the higher rates of organizational membership and extension coverage). A farmer belonging to a network where farmers have better education is more likely to use HYV, ceteris paribus. However, comparing two farmers belonging to networks with the same average education of farmers, the one belonging to a network with positively skewed education profile is more likely to use HYV than in the network where the education profile is negatively skewed.
As a diagnostic, another model is estimated which excludes the farmer-specific variables on education, extension coverage, and membership in organization. The hypothesis that restricts the coefficients of these variables to zero is rejected, based on the likelihood ratio test. Hence, the unrestricted model is considered in the simulation.
model simulationThe effects of the social capital variables are better appreciated by simulating the estimated model. The results are summarized in Table 2.
The base profile used in the previous study is adopted - the farmer is from Ilocos Norte, 40 years of age, operating a farm that he owns and which is irrigated; he has benefited from extension visits from both government and NGO workers; he also has access to social capital and formal credit.
5 In 2002, the tenure variables no longer exerted a significant influence on the decision of rice farmers to use certified seeds. This result is also reported in Edillon (2010a). Unfortunately, the BAS cost and returns data on which this result is based do not contain information on social capital. Moreover, the sampling design does not allow the estimation of network characteristics.

11Edillon
CONClUDINg RemARkSPolicies and programs can affect social capital, either in terms of quantity or quality. Certain policies can trivialize relationships, say between former landowner and tenant (as in the case of a land redistribution program), or between input suppliers and farmers (as when a different technology is being promoted). Needless to say, new relationships can be developed and even introduced by government programs. However, if these are perceived as temporary, then the changes being introduced by a program may not be accepted at all.
Adopting a new technology requires taking on new risks. Not surprisingly, the adoption rate is high if the new technology is being offered with a package to mitigate the risks. Alternatively, social capital can exert a risk-mitigating effect.
Certain types of social capital facilitate learning. The study finds that in 1991, a farmer residing in a village where the average education level of its farmers is high is more likely to adopt modern technology. In terms of the model,
If the farmer lives in a village where 25 percent of farmers have been visited by a government extension worker; 10 percent by an NGO worker; 60 percent belong to an organization; and the education profile is such that the average is 6 years of school and skewness measure is 7; then the likelihood that the farmer uses HYV seeds is 89 percent.
In profile A2, the network is such that a higher proportion of farmers belong to an organization, 75 percent. The likelihood of HYV use increases slightly to 90 percent. But if the membership rate is a low 10 percent (profile A3); then the likelihood decreases to 84 percent. Note that the latter is below the threshold,
which could imply that a higher proportion of farmers are isolated.In profile A4, the network is such that the average education is higher, now
with eight years of schooling, but the distribution remains positively skewed. The likelihood increases to 93 percent. Now, suppose that the distribution of farmers by education is negatively skewed, say -4 (profile A5), the likelihood of HYV use drops to a very low 42 percent.
Table 2. Results of model simulationNetwork Characteristics A1 A2 A3 A4 A5% visited by government worker 0.25 0.25 0.25 0.25 0.25% visited by NGO worker 0.10 0.10 0.10 0.10 0.10Membership rate in organization 0.60 0.75 0.10 0.75 0.75Average education 6 6 6 8 8Skewness measure of education 7 7 7 7 -4Probability of HYV use 0.89 0.90 0.84 0.93 0.42
1)6( −∗= tt OIMIO
=
=
0001
,
1000010000100001
0OIMI
01 OOIMO tt =∗= −
=
25.25.25.25.25.25.25.25.25.25.25.25.25.25.25.25.
2IM
=
2.2.2.4.2.2.2.4.2.2.2.4.0001
3IM
=
=
64.64.64.1
,
4.4.4.1
21 OO
{ } { }!/])1[()(Pr)7( )1( dGedD dG ππ −== −
]1/[)][log()8( −=∗ GGπ
=
=
64.64.64.1
,
4.4.4.1
21 OO
1)()9( −⋅= tt OEMIMO
π
I
Source: Author’s calculations.

12 PhiliPPine Journal of DeveloPment 2010
this is explained as being due to the higher possibility of having innovators in the village. Moreover, a farmer residing in a village where the relationship among farmers is more hierarchical than collegial is more likely to adopt the modern technology. This profile probably facilitates learning diffusion, in particular, learning from others.
Changes in relationships result in changes in the embeddedness and influence matrices. In turn, this affects the rate of adoption to new technology. Embeddedness of farmer groups can be improved by providing more venues for the farmers to get together and at times discuss farming issues, e.g., trade fairs, extension visits, etc. To the extent that education confers a certain status on the individual, the education profile can be used to characterize the influence matrix. A negatively skewed education profile can indicate a higher tendency toward collegiality while the positively skewed profile can indicate some hierarchy of influence. In the case of the former, the options are either to induce a hierarchy or reach out to all those with higher education (up to secondary graduate). In the case of the latter, the extension worker should reach out to the farmers that wield the most influence and reinforce the hierarchy. Needless to say, these remarks assume the existence of a better technology, one that yields higher profits over the old technology.
Finally, it must be said that this study has shown that institutional factors like property rights and social capital affect economic decisions such as the decision to adopt a new technology. More research in these areas should be encouraged, beginning with data availability. Social capital research requires data network-related variables where the sampling design allows for the estimation of group characteristics at the lowest level of disaggregation. The Census of Agriculture is an obvious data source, except that the variables included should be augmented.
ReFeReNCeSBesley, T. 1995. Property rights and investment incentives: theory and evidence
from Ghana. The Journal of Political Economy 103(5):903–937.Conley, T. G. and C. R. Udry. 2010. Learning about a new technology: pineapple
in Ghana. American Economic Review 100(1):35–69.DeGroot, M. 1974. Reaching a consensus. Journal of American Statistical
Association 69(345):118–121.Edillon, R. 2010a. Institutions, social capital, and agricultural productivity in the
Philippines. Paper submitted to the Southeast Asian Center for Research and Graduate Studies in Agriculture.
———. 2010b. Towards an understanding of social capital: a proposed definition and measure. Paper presented before the 2010 PhD Conference on Business and Economics, 18 November, Australian National University, Canberra, Australia.

13EdillonMe
tric To
ns P
er H
ectar
e 3.00
2.50
2.00
1.50
1.00
0.50
0.001960 1962 1964 1966 1968 1970 1972 1974 1976 1978 1980 1982 1984 1986 1988 1990 1992 1994 1996 1998 2000 2002 2004 2006 2008
Foster, A. and M. Rosenzweig. 1995. Learning by doing and learning from others: human capital and technical change in agriculture. The Journal of Political Economy 103(6):1176–1209.
Jackson, M. 2008. Social and economic networks. Princeton and Oxford: Oxford University Press.
Appendix 1. Rice yield in the Philippines, 1960–2009
Source: FAOSTAT (http://faostat.fao.org).
4.50
4.00
3.50