Social Assistance Receipt and its Importance for …ftp.iza.org/dp2758.pdfSocial Assistance Receipt...
31
IZA DP No. 2758 Social Assistance Receipt and its Importance for Combating Poverty in Urban China Bjorn Gustafsson Deng Quheng DISCUSSION PAPER SERIES Forschungsinstitut zur Zukunft der Arbeit Institute for the Study of Labor April 2007
Transcript of Social Assistance Receipt and its Importance for …ftp.iza.org/dp2758.pdfSocial Assistance Receipt...

IZA DP No. 2758
Social Assistance Receipt and its Importance forCombating Poverty in Urban China
Bjorn GustafssonDeng Quheng
DI
SC
US
SI
ON
PA
PE
R S
ER
IE
S
Forschungsinstitutzur Zukunft der ArbeitInstitute for the Studyof Labor
April 2007

Social Assistance Receipt and its
Importance for Combating Poverty in Urban China
Bjorn Gustafsson University of Göteborg
and IZA
Deng Quheng Chinese Academy of Social Sciences
Discussion Paper No. 2758 April 2007
IZA
P.O. Box 7240 53072 Bonn
Germany
Phone: +49-228-3894-0 Fax: +49-228-3894-180
E-mail: [email protected]
Any opinions expressed here are those of the author(s) and not those of the institute. Research disseminated by IZA may include views on policy, but the institute itself takes no institutional policy positions. The Institute for the Study of Labor (IZA) in Bonn is a local and virtual international research center and a place of communication between science, politics and business. IZA is an independent nonprofit company supported by Deutsche Post World Net. The center is associated with the University of Bonn and offers a stimulating research environment through its research networks, research support, and visitors and doctoral programs. IZA engages in (i) original and internationally competitive research in all fields of labor economics, (ii) development of policy concepts, and (iii) dissemination of research results and concepts to the interested public. IZA Discussion Papers often represent preliminary work and are circulated to encourage discussion. Citation of such a paper should account for its provisional character. A revised version may be available directly from the author.

IZA Discussion Paper No. 2758 April 2007
ABSTRACT
Social Assistance Receipt and its Importance for Combating Poverty in Urban China*
Since the second half of the 1990s economic restructuring in urban China has led to widespread joblessness and income insecurity. The rapid expansion of the system of social assistance, Di Bao, can be understood from this perspective. Using a survey covering large parts of urban China in 2002, we investigate factors affecting receipt and how receipt affects urban poverty. Results from estimating probability models indicate that social assistance receipt is strongly linked to joblessness among household members, the household’s expenditure burden, as well as the lack of financial assets. Further, a long education of the household head and membership in the Communist Party reduces the probability of receiving social assistance while having been sent to rural China during the Cultural Revolution increases it. For some types of households, receipt of Di Bao differs greatly across cities in China. The social assistance payments appear strongly targeted to the poor. However, as the Di Bao payments typically are small and many of the urban poor are not receivers, much urban poverty remains. JEL Classification: I32, I38, P36 Keywords: social assistance, poverty, China, cultural revolution Corresponding author: Bjorn Gustafsson Department of Social Work University of Göteborg P.O. Box 720 SE 405 30 Göteborg Sweden E-mail: [email protected]
* We wish to acknowledge grants from the Swedish International Development Cooperation Agency (SIDA) and the Ford Foundation for funding the collection of the data uses for this study. Our work was facilitated by grants from the Swedish School of Advanced Asia Pacific Studies (SSAAPS).

1. Introduction Since the introduction of reform at the end of the 1970s, China’s economy has grown rapidly
and rural poverty has been reduced impressively, although progress has been uneven across
time and space.1 One prevailing characteristic of the People’s Republic of China is that the
urban population is on average much better-off than the larger rural population. During the
planned epoch, urban workers had stable employment at their work unit (danwei) with little
risk of joblessness. The urban registration system (Hukou) efficiently prevented rural persons
from residing in the cities. At that time, urban poverty was not much of a social and political
problem, although foreign visitors quickly perceived that the standard of living in China’s
cities was much lower than in cities in rich countries. This situation has now changed. On the
one hand, the gap in the average living standard between China’s urbanites and their
counterparts in the West has narrowed. On the other hand, a new kind of poverty has emerged
and become a serious problem in China’s cities.
The economic reforms which led to rapid economic growth are also the cause of poverty in
China’s cities; their influence has come through several channels. The lessened restrictions for
rural persons to migrate have enabled people without urban residence permits to live in
China’s cities. This “floating” population is large, perhaps around 100 million, and constitutes
a lower segment of the emerging labour market in urban China. The migrants are typically
young and work many hours on temporary contracts.2 Unlike the registered urbanites, they
cannot benefit from the package of compensation provided by the work unit. This means that
rural residents living in urban China typically have no access to subsidised housing nor the
opportunity to buy housing at a price substantially lower than the market price. Further, they
are not covered by programs of subsidised health care. From this background it is not
surprising that Khan (2007) reports that in 2002, rural migrants have higher poverty rates than
urban residents when an urban poverty line is applied.
A second channel through which economic reform has caused poverty to appear in urban
China is the consequence of establishing markets for goods and services. In this process,
prices paid by people at the bottom of the income distribution have increased more rapidly
than for others. This has occurred as the administrative allocation of necessities was abolished
1 See Yao (2000), Gustafsson and Wei (2000), Khan and Riskin (2001), Gustafsson and Li (2004), Ravallion and Chen (2007), and Khan (2007). 2 See for example Appleton et al (2004), Knight and Song (2005) and Li (2006).

in the reform process and the price for food increased rapidly (Meng et al, 2005). Further, the
fees schools and hospitals charge have risen sharply. Finally, economic reform has led to the
restructuring of work units, leading to bankruptcy, redundancy and job separation (a situation
critical to the emergence of the social assistance program studied here). This process has
gained speed during the second part of the 90s and contributed to unemployment as well as
the involuntary retirement of many workers.3
At the individual level, the consequences of joblessness differ by worker. Some have been re-
employed after a period of unemployment (Giles et al 2006B), although joblessness appears
to negatively affect subsequent earnings (Knight and Li, 2006A). Some have, voluntarily or
not, dropped out of the labour force completely and into early retirement. In such cases, non-
workers can receive a stable income, although at a lower level than the original wages. Others
are eligible for unemployment benefits if they are registered as unemployed and their previous
work unit had paid contributions. While these three alternatives are similar to what can be
observed in mature market economies, along with re-employment centres, China also
introduced in the 1990s a special form of shedding redundant workers. The term Xia gang
means that such workers are off-duty but keep ties with the work unit; if the work unit can
afford it, the workers receive a low wage and some welfare benefits (Wong and Ngok, 2006).
At the household level, economic consequences of job losses can be cushioned by income
from other household members who are still working. However, public and private safety nets
have holes; the expansion of social assistance in urban China since the mid 1990s can best be
understood as the policymaker’s response to the unfilled need for income support, a need
created by the transition towards a market economy. Building on a previous, but much more
limited programme, the number of recipients and sums expanded rapidly as joblessness
spread. While in 1999, 2.66 million persons lived in households receiving Di Bao (sometimes
referred to as the minimum living guarantee, MLG), the number had increased to 22.34
million in 2005 (NBS, various years). The social assistance program in urban China is
focused on urban residents; rural residents who have migrated to the cities are not entitled to
it.
3 According to Giles et al (2006A), who applied definitions in line with recommendations from ILO, the Labour Force Participation Rate in urban China decreased by 8.9 percent between January 1996 and November 2001, and the Employment Rate dropped by as much as 12.2 percent. The unemployment rate increased from 7.1 percent to 12.5 percent.

Similar to the last safety net in other countries, there are several processes at the individual
level that cause people to become recipients of Di Bao. Although old age pensions are
comparatively generous in urban China, coverage is not universal.4 Far from all residents are
covered by sickness insurance and therefore ill health and large health expenditures can lead
to economic problems.5 The expenditure burden of younger dependents can also cause
households to fall into the last income safety net. For example, having a child in school can be
a substantial financial burden as schools typically charge fees. While many Western welfare
states have family allowance payments to support families with children, this is not the case in
urban China, although one should understand that the one-child policy means that families
with two or more children are rare. Further, since reform in China, the transition from
education to working life is a process similar to that of many countries in the West; a period
of joblessness.
Several recent studies of poverty among urban residents in China have been reported6 and
some traits of the Di Bao system have been documented in the literature. In one such recent
contribution, Leung (2006), who also provides detailed references to this literature, notes the
lack of a comprehensive and unified dataset at the national level on the overall profile of the
recipients. This paper aims to fill such a gap. As the first research question we ask: What
affects receipt of Di Bao? We analyse how characteristics of the household as well as of the
city where the household lives affect the probability of receiving social assistance. The second
research question is to investigate the importance of Di Bao for combating urban poverty. For
our study we use a household sample for 2002 covering many cities in urban China. 7
Turning to results, we find that in our sample 3.7 percent of registered urban persons lived in
households receiving social assistance in 2002, meaning a beneficiary population of about 19
million persons. As expected, social assistance receipt is strongly linked to joblessness among
household members, the expenditure burden of the household, as well as a lack of financial
4 For more on poverty and hardship among the aged in urban China see Saunders and Lujun (2006). Palmer and Deng (2007) provide a detailed description of the pension system in China and its recent change. 5 The proportion of urban residents lacking sickness insurance increased from 27.3% in 1993 to 44.8% in 2003 (UNDP, 2005, pp. 66). 6 See for example Fang et al (2002), Zhang and Wan (2005), Meng et al (2005), Knight and Li (2006B), Li and Sato (2006) and Khan (2007). 7 Using China’s Urban Household Survey (UHSS) for 2003/2004 Chen et al (2006) analyse Di Bao receipt and its effects on urban poverty. Our data has greater coverage as it is not restricted to China’s 35 largest cities., while UHSS’sample is larger.

assets. A long education of the household head and membership in the Communist Party
reduces the probability of receiving social assistance. Having been sent down to rural China
during the Cultural Revolution also increases the probability of receipt. The probability of
receiving social assistance is negatively affected by average income in the city where the
household lives as well as its employment rate. The social assistance payments appear
strongly targeted to the poor. However, as the Di Bao payments to a household are most often
small and as many urban poor do not even receive them, much of the poverty among urban
residents remains.
The rest of the paper is laid out as follows: The next section describes the system of Di Bao,
while Section 3 presents the data used for the study. The profile of recipients and results from
estimating probability models explaining receipt are presented in Section 4. Section 5 contains
the analysis of how Di Bao receipt affects urban poverty and finally the study is summed up
in Section 6.
2. The Di Bao system
For many years, China operated only a limited relief program for its urban residents. As is the
case for many reforms in China, the stimulus for change did not come centrally, but rather
from the Shanghai government which decided to restructure its traditional relief programme
in 1993. The reform provided an extension of coverage and increase of benefit levels and in
order to function it required securing funding for the resulting increase in public expenditures.
Once it was in operation, the Ministry of Civil Affairs encouraged other cities to follow and
the reform spread rapidly. This diffusion process was facilitated after the State Council
decided to establish the Di Bao system in all of urban China, as stated in the promulgation of
“Circular on Establishing MLSGS in All Cities by the State Council” in 1997. By 1999, all of
China’s 68 cities and 1638 towns where the local county governments reside had set up the
program (People’s Daily, 1999).
In conjunction with the fiftieth anniversary of PRC on 1 October 1999, the central
government proclaimed the Regulations on Minimum Living Standards for Urban Residents
which codify provision of Di Bao. The number of recipients increased sharply from 1.84
million in 1998 to 2.66 million in 1999 (MCA, 1999; NBS, 2003). In the same year, benefit
levels were increased by 30%. Most (80%) of the increased expenditure was financed by the

state (Tang, 2003). The central government also made funds available to less prosperous local
governments to match increased expenditures due to the desired increases of benefit levels;
this ensured that a larger number of households could gain from the system.
The central government’s policy on expanding Di Bao provision must be considered
successful if one applies the number of recipients as a yardstick. Compared to the previous
year the number of recipients increased by 51 percent in 2000, by as much as 191 percent in
2001 and by 76 percent in 2002 (NBS, various years). By these standards the expansion rate
of 9 percent in 2003 was modest. The number of recipients has remained relatively unchanged
and is currently slightly above 22 million at the end of year 2005 according to the most recent
figures (NBS, various years; MCA, 2006a).
From a legal framework standpoint, China’s local governments (above the county level) are
responsible for providing Di Bao and they also define its operational policy. According to the
Regulations on Minimum Living Standards for Urban Residents, the county Bureau of Civil
Affairs, the local street office and the township government (called administration
departments), are responsible for the administration of the Di Bao system and approval of Di
Bao applicants. The local residential committee may take on daily administration of the Di
Bao system upon request of administration departments (the State Council, 1999). 8 In
practice, the claimants formally apply to their local residential committee, which assesses the
eligibility of the applicants at the preliminary stage. The street office or the local township
government verifies the candidacy of applicants and make the name of the applicant public.9
The final decision is made at the Bureau of Civil Affairs of the local county. This practice
probably reflects the information advantage that grassroots organizations enjoy, that of being
advocated by the central government and supported by means of finance and human resources
(GOSC, 2001; MCA, 2001).
8 A resident committee is a neighbourhood-based mass organisation, supervised by the street office. (Read, 2000) 9 According to the Regulations on Minimum Living Standards for Urban Residents, the final approved list of Di Bao applicants must be publicized to be monitored by the masses. In practice, some provinces publicize in different stages of processing Di Bao application to minimize the targeting error.
The central determinant of eligibility for Di Bao is the income test.10 This is typically
formulated as a single amount, the assistance line (Di Bao Xian), which forms the boundary
between being eligible or not. The amount of assistance is computed to fill the gap up to the
assistance line. For a particular household, eligibility is tested by comparing income from all
sources against an amount calculated as the number of household members multiplied by the
relevant assistance line. Many other circumstances are typically taken into consideration,
however. For example, households with mobile phones, motorcycles, computers or air
conditioners are not eligible for Di Bao in Guizhou province (BCAGZ, 2001). In Hunan
province, households investing in the stock market are not allowed to apply for Di Bao
(HNPG, 2003) while capital gains from stocks are counted as sources of household income in
some other provinces which implicitly permit investing in the stock market.
.
In the second quarter of 2006, the average assistance line in urban China was 158.15 yuan per
month. The highest assistance line was 390 yuan while the lowest was only 12 yuan (MCA,
2006b).11 Compared to the poverty line and the low-income lines for rural China applied by
the National Bureau of Statistics (NBS), this line is not particularly low. However, consumer
prices are higher in urban China than in rural China (Brandt and Holz, 2006).
Comparisons with average wages in urban China are indicative for how the assistance line
balances between need and incentive. The average social assistance line is not higher than
what an average worker brings home if working approximately 43 hours during one full
month.12 In contrast, the average paid worker working full time could maintain not only him
or herself but also an additional 2.5 family members before income would fall below the
assistance line. These comparisons clearly show that giving up work to live on Di Bao would
not be an attractive alternative for most of China’s urban workers. However, the situation is
rather different for low-income earners; according to our data a worker at the first decile earns
only 0.51 yuan per hour meaning that if living alone, he or she has to work at least 310 hours
a month to cross the assistance line.
10 According to the State Council (1999), household income refers to income from all household members, including monetary and in-kind income. Definitions can vary by province but in reality there is little variation. Generally, household income is composed of wage, bonus, subsidy, allowance, pension, unemployment insurance, living allowance for xiagang workers, savings and interest, stocks, bonds, other securities, income from lottery, income from renting out rooms, estovers, alimony, bequest and other income that should be counted. 11 Chen et al. (2006) also reports a similar variation across the 35 largest cities in 2003/04. 12 This comparison is based on the data presented in the next section.

3. Data
This study uses a large survey of urban residents conducted in the spring of 2003 for the
reference year 2002. The survey instruments were designed by the researchers of the project
“Income Distribution, Growth and Public Policy in China”, which involved a group of
researchers at the Institute of Economics, Chinese Academy of Social Sciences, Beijing and
scholars from other countries. The project was assisted by the General Team of Urban
Surveys at the National Bureau of Statistics (NBS) that conducted the fieldwork.
The survey was obtained from larger samples used by NBS to produce official statistics for
China. In much policy making in China there is a division between the eastern, central and
western regions. Economic reform was first introduced in the eastern regions, while more
recent policymaking emphasises the development of the western region which lags behind. At
a first stage of selecting the sample, the municipality of Beijing and the provinces of
Liaoning, Jiangsu and Guangdong were chosen to represent the eastern region, the provinces
Shanxi, Anhui, Henan and Hubei, the central region and the municipality of Chongqing and
the provinces of Gansu, Sichuan and Yunnan the western region.
From these provinces a sample of 6 835 households living in 77 cities was obtained. The
sample frame for the urban sample is based on registers of people possessing a hukou. Thus it
does not cover rural migrants living in urban China. This is not a problem when addressing
our first research question, that of analysing who receives Di Bao, as rural migrants are not
entitled to it For the second research question on the importance of Di Bao for urban poverty,
we have to narrow it to poverty among registered urban residents, a subset of all poor actually
living in urban China.
Two questions were asked in the survey regarding whether the individual receives Di Bao
benefit or not; one in the main part and the other in the appendix of the questionnaire. We
combine the answers to identify households receiving Di Bao. However, we find 37 Di Bao
households have unreasonably high incomes for being receivers of Di Bao. We consider this
misreport and impute zeros for the variable Di Bao. After this adjustment we end up with 235
households receiving Di Bao. We define a recipient as one person living in a household that
received Di Bao at least once in 2002 and find this to be the case for 3.7 percent of urban
residents, or 19 million persons. This is an estimate reasonably close to the numbers of

official statistics as they recorded 20.65 million persons and a rate of receipt of 4.11 percent
in the urban population.
4. Patterns and determinants of receipt
In this section we first study the pattern of Di Bao receipt and thereafter determinants of
receipt by estimating probability models. To put the age structure of recipients into
perspective, we also compute the age structure of persons living in households with at least
one unemployed member and households with at least one elderly person without an old age
pension.
In our data, 7.73 percent of the individuals aged between 16 and 60 were recorded as
unemployed. Typically, unemployed persons live in households of at least one working
member. On the one hand, this means that household members’ earnings act as a powerful
safety net for unemployed individuals. On the other hand, it also means that a fairly large
proportion of China’s households have at least one unemployed member. According to our
data as many as 21.9 percent of the urban population live in households with at least one
unemployed member (where unemployment is defined broadly). They are “touched by
unemployment”.13 The probability of living in a household touched by unemployment is
particularly high if the person is at the age of leaving school, or is at the age of being parent to
a school leaver. See Figure 1. In our data 7.70% of the persons live in a household with at
least one elderly person who lacks an old age pension. However, this relative frequency is as
high as 30 percent among those over 60.
The high frequency of households with an unemployed member, in combination with the rate
of Di Bao receipt reported in the previous section (3.7 percent), illustrates that the
overwhelming proportion of persons who live in households with an unemployed member do
not receive Di Bao. Figure 1 reports some variation between age and receipt of Di Bao, but
the variation is not very pronounced. The highest rates of receipt (6 and 5 percent) are found
among persons aged 16 to 20, and for ages 41 to 45. The lowest rates of receipt (around 3
percent) are for people 21 to 35 and for those 51 and older.
13 As many as 18.6 percent live in a household with one unemployed member, 3.0 in a household with two unemployed members and only 0.3 percent in a household with three or more unemployed members.

/ Figure 1 about here/
Table 1 shows frequencies of receipt for adult individuals and children by characteristics. For
comparison we also report frequencies for people touched by unemployment in their
household, finding that those two frequencies do not always vary in the same way. Di Bao
receipt is clearly related to low education, no membership in the Communist Party, location
and work status. Some examples: While as many as 8.6 percent of adults with a below-
primary level education lived in a household receiving social assistance, the corresponding
number was only 1.3 percent for those with college educations and above. While 2.0 percent
of adults living in the eastern region received Di Bao, the corresponding rate in the western
region was 5.2 percent. Not surprisingly, non-working adults have higher rates of Di Bao
receipt than workers, although the rate of receipt for the first mentioned group is not higher
than 5.1 percent. In Table 1 we also use two variables indicating migration experiences. One
stands for voluntary migration and measures if the adult is rural-born, the other indicates
forced migration to rural areas during the Cultural Revolution followed by return migration to
urban China.14 It turns out that rates of Di Bao receipt differ only marginally between those
with such experiences and those lacking them. The estimated rates of Di Bao receipt among
adults and children for ethnic minorities are very similar to those for the ethnic majority.15
/Table 2 about here/
In Table 2 we report descriptive statistics for households receiving Di Bao, for other
households, and for the combined category all households. The frequency of non-workers is
much higher among Di Bao receivers and average financial wealth among Di Bao receivers is
less than one-third of that of non-receivers. While 15 percent of Di Bao households have one
elderly member not receiving a pension, the corresponding frequency is only half as high
among non-receivers. Among Di Bao receivers, 18 percent have a head reporting poor health,
a percentage three times as high as among non-receivers. The average number of children is 14 As many as 14 million educated young people, for the most part graduates of secondary schools, were sent to the countryside (Beijing Daily, 1998, see also Bernstein, 1977). However, the overwhelming majority of educated youth returned to cities after the end of the Cultural Revolution. 15 This does not mean that generally ethnic minorities in China as a category are on a par with the ethnic majority regarding economic well-being. A disproportionately large proportion of China’s ethnic minority persons live in the rural west where household income is considerably lower than in urban China.

higher among Di Bao receivers than among non-receivers. Still, there are many households
receiving Di Bao that are without children. In Di Bao households the education of the head is
lower than among other households, and a smaller fraction of the heads are members of the
Communist Party. While 38 percent of the Di Bao receivers live in the western region, 27
percent of non-receivers do the same. The average per capita income as well as the
employment rate in the city where Di Bao receivers live is lower than where non-receivers
live.
/Table 3 about here/
In the next step we estimate probability models for receipt of Di Bao using the household as
unit of analysis. Results from four different specifications are reported in Table 3. There are
two examples of the expenditure burden of the household increasing the probability of receipt.
The positive coefficients for the variable “number of children”, and the variable “number of
elderly without pension” are similar in size. On the other hand, the variable “number of adults
working” and the variable “number of elderly receiving a pension” both negatively affect the
probability of receipt. The size of the coefficient for the number of elderly receiving a pension
is particularly large. Further, we find financial wealth to negatively affect receipt, but at a
decreasing rate.16
Several characteristics of the household head affect probability of receipt. Bad health has a
strong positive coefficient estimated with a high t-statistic. A college education of the head
works in the opposite direction. However, coefficients for other levels of education are
estimated with lower t-statistics suggesting that the bivariate relation between education of the
person and Di Bao receipt is due to other circumstances that vary with education and affect
receipt.17 Further, we find that the head’s membership in the Communist Party reduces the
probability of receiving social assistance. CPC party members are often in a better economic
16 While the coefficient for financial wealth is negative, the coefficient for the variable financial wealth squared is positive. The estimated coefficients imply that wealth has a negative effect on Di Bao receipt up until 1.53 million yuan of wealth. In our entire sample there are only four households (0.06 percent) with financial wealth larger than this. 17 Households with a longer educated head possess on average financial wealth about 2.5 times as large as households with the shortest educations. Further, the fraction reporting poor health is only 4 percent among those with the longest educations while 40 percent of them are CPC members. In contrast 16 percent of household heads with the shortest educations report poor health and only 21 percent are CPC members. In the questionnaire there is a question asking about the health status (compared with other people with the same age) with 5 alternatives: answers, excellent, good, so-so, poor, very poor. We combine the first two into “good health”, the last two into “poor health” and the remaining one is labelled “normal”.

situation and have more social capital than non-members with the same characteristics. In
contrast, and consistent with the descriptive results, gender as well as ethnic status of
household head are not found to affect the probability of Di Bao receipt.
In the second specification we include a variable measuring voluntary migration experience
and in the third specification, forced migration experience. When in the fourth specification
both variables are included, the coefficient for voluntary migration is estimated with a low t-
statistic, while the positive coefficient for forced migration is estimated with a high t-statistic
of significant magnitude. This supports the view that being sent down to the countryside
during the Cultural Revolution has produced long-lasting negative effects on the ability to
support oneself in reform China.18
In all specifications we have included several variables measured at the city level. We find
both a negative coefficient for mean city income and a negative coefficient for the
employment ratio estimated with high t-statistics. In contrast, once these variables are
included in the estimated model, variables for city size as well as region are estimated with a
low t-value. This makes sense and means that once we control for the economic situation of
the city, its size and regional location, there is no independent effect on the probability of Di
Bao receipt.
/Table 4 about here/
In order to illustrate the magnitude of the estimated effects we predict the probability of
receipt for households with various characteristics. The predictions, based on the fourth
specification reported in Table 3, are reported in Table 4. For all types of households selected
we show predictions for households with one alternatively two non-elderly members working.
The base household (Household number 1) has an expenditure burden of one child. The head
is male, is not a CPC member, has a primary education, poor health, belongs to the ethnic
majority and the household owns financial wealth at the sample mean. This household lives in
a small city located in the west with city income and working ratio at the sample mean. We
predict that if there are two workers in the household, the probability of social assistance
18 This is consistent with the findings reported by Zhou and Huo (1999) who investigated the consequences of being sent down during various years (1978, 1987 and 1993) While there were little indication of having been sent down affecting personal income negatively during the first follow-up periods, such existed for 1993.

receipt is 10 percent. However, if there is only one worker the probability increases to 16
percent. The importance of financial wealth is illustrated by Households 2 to 4. Stripping the
household completely of financial wealth causes the predicted probability of receipt to go up
to 32 percent in the case of only one worker, while possessing a high amount of financial
wealth pushes it down to as low as 2 percent.
The importance of demographic composition is illustrated in simulations 5 to 9. Increasing the
expenditure burden by one additional child or an elderly person without pension makes the
predicted probability for the two-worker case to go up from 10 to 15 or 16 percent
respectively, and in case of only one worker from 16 to 23 alternatively 25 percent. When
including both a second dependent child and an elderly person without pension and when
stripping the household of financial wealth, the predicted probability of Di Bao receipt is as
high as 57 percent. In contrast, if the base household takes in an elderly person who receives a
pension, the probability of receipt is down to 7 percent even if only one member is working.
Simulations 10 to 14 illustrate the importance of characteristics of the household head. The
experience of being sent down to rural China during the Cultural Revolution makes the
predicted probability for the base household with one working member rise from 16 to 32
percent. On the other hand, being a member of CPC reduces probability of receipt to 8
percent. Such a reduction is even larger if the head has good health (to 5 percent) or a college
education (to 4 percent). Combining these two characteristics causes the probability of receipt
to be lower than one percent.
/Figure 2 about here/
We illustrate the importance of location for receipt by predicting the probability of receipt for
a household with one or two working members living in each of the 77 cities in our data; we
insert the cities’ employment rates and mean household incomes. The predictions are shown
in Figure 2 where cities are sorted by mean income. We choose to illustrate the case of a
household with a high expenditure burden that also lacks financial assets. In low-income
cities, the predicted probability of receipt is already over 50 percent in the case of two earners,
and then increases further when only one adult member is working. In contrast, if living in a
high-income city, the predicted probability of receipt is lower than 20 percent even if only one

adult member is working. A set of favourable economic circumstances in a city can thus
hinder the unfavourable composition of household characteristics to lead to a high probability
of social assistance receipt.
5. How Di Bao affects poverty among urban residents
/Table 5 abut here/
In this section we analyse the importance of Di Bao for combating poverty among urban
residents. Our data makes it possible to show the amounts received and relate them to other
income sources of the households, and to compute total income for receiving households and
other households. Table 5 clearly illustrates that Di Bao on average is not a large income
source among receiving households. We report that Di Bao households generally receive not
more than 310 RMB per capita during a full year, an amount representing only 10 percent of
total income. The annual total income of 3 104 per capita for Di Bao receivers is only 37
percent of the corresponding income for non-receivers.
As among non-receivers, the largest income components for Di Bao households are earnings
followed by pensions; Di Bao income ranks only third. However, Di Bao differs from the
main income sources by having a profile benefiting those worse off. This becomes evident
when inspecting Table 5 which also shows concentration coefficients for various income
components computed for Di Bao households, other households and all households.19 We
report a concentration coefficient for Di Bao computed over all households is as high as -0.74
meaning that the payments are rather strongly targeted to those at the bottom of the income
distribution.20 However, when computed for the category of Di Bao receivers, the
concentration coefficient is as low as +0.05 meaning virtually no relation between total
income and amount of Di Bao.
19 While the Gini coefficient can vary between 0 and 1, the concentration coefficient which expresses the association between total income and the income component can assume values from – 1 to + 1. See Lambert (2001). 20 Our data shows that 54 percent of households receiving Di Bao are located in the first decile of the distribution of income, 20 percent are in the second, 16 percent in the third and 10 percent in the fourth decile. No Di Bao household can be found in the fifth or in any higher decile. Among households in the bottom decile, 15 percent are Di Bao receivers.

The distributional profile of Di Bao also appears very favourable for those worse off when
compared with xiagang benefit (unemployment benefits), as the latter has a concentration
coefficient among all households of - 0.06. While xiagang benefits are found not to be
particularly targeted towards those worse off, the sums transferred to the households through
this channel are larger. Thus, xiagang benefits are not at all unimportant for alleviating
poverty among Chinas urbanites. The point is that xiagang benefits aid persons higher up in
the income distribution to a much larger extent than Di Bao benefits do.
When analysing how Di Bao affects poverty among urban residents in China we work with
the assumption that Di Bao receipt does not affect household behaviour. Given how
stringently applications are processed, this could be a reasonably good first approximation.
Following Khan (2007) we apply two alternative poverty lines, one set to 1 774 RMB per
person and per capita, and the other to 2 534 RMB per person and per capita.
Table 6 (row 7) reports that 2.1 and 6.0 percent respectively of urban residents fall below
these levels.21 Poverty among Di Bao receivers (row 2) is much higher than among non-
receivers (row 4). This applies to all three indices belonging to a family suggested by Foster et
al (1984): The head count ratio, the poverty gap ratio and the severity of poverty index. For
example, while 4.6 percent of non-receivers fall below the higher poverty line, this is the case
for as many as 41.4 percent of Di Bao receivers.
/Table 6 about here/
If we make a thought experiment by setting Di Bao equal to zero, the poverty rate for Di Bao
receivers is 49.4 percent and 6.3 percent in the entire population (row 1 and 6). Di Bao causes
the poverty-rate among all households to decrease by 5 percent, while among Di Bao
households the proportional reduction is 16 percent. Although Di Bao does not help many
households cross the poverty line, it reduces poverty’s severity among the poor. In fact,
measured by the poverty severity index (FGT(2)) and the lowest poverty line, poverty among
the poor reduces by as much as 49 percent (row 3 in Table 6).
21 Khan (2007) report that 5.5 percent and 14.4 percent of rural to urban migrants (not studied in this paper) fell below those two poverty lines in 2002.

6. Conclusions
From 1999 to 2002 the number of Di Bao receivers in urban China expanded enormously;
today China has probably the largest system of social assistance in the world based on number
of recipients. This expansion is due to the policy response aiming to alleviate consequences of
job losses induced by China’s transition towards a market economy. This system is
decentralised in the sense that cities are responsible for carrying out the program, and the
social assistance line used in the income test is set at the city level. Cities fund the system,
although some receive refunding from the central state.
In this paper we have used a large sample survey for the year 2002 to shed new light on Di
Bao receipt and its effects on poverty among urban residents. Results from estimating
probability models indicate that social assistance receipt is strongly linked to joblessness
among the household members, to the household’s expenditure burden as well as to the lack
of financial assets. Further, a long education of the household head and membership in the
Communist Party reduces the probability of receiving social assistance, though being sent
down to rural China during the Cultural Revolution increases the probability of Di Bao
receipt.
We have reported that for some types of households with given characteristics, the probability
of receiving Di Bao varies greatly across China’s cities. A low employment rate and a low
average income signify a high probability of receipt, while a high employment rate and a high
average income signify a low probability of receipt. The first kind of city is more often found
in the western region of China while the second is most often found in the eastern region.
According to our data, Di Bao is typically an income supplement, not the main income source
for households receiving it. Di Bao households have a total per capita income that is as low as
37 percent of the income of non-receivers. However, the absence of Di Bao would make the
gap even larger. Though the system only helps a few of China’s urbanites to cross the poverty
line, poverty is lessened for many remaining in poverty. In this sense the system is rather
successful, and one can conclude that central and local government funds are well spent.
However, seen as a policy for poverty elimination, we find the record of the Di Bao system
less impressive. This is hardly surprising as the total sums transferred to the households

through the system are small. Far from all poor residents receive Di Bao and for many
receivers are the amounts too small to take their household out of poverty. Most importantly,
rural residents living in urban China without a residence permit are not eligible.

References Appleton, S., Knight, J., Song, L. and Xia, O.J. (2004) “Contrasting Paradigms. Segmentation and Competitiveness in the Formation of the Chinese Labour Market”, Journal of Chinese Economics and Business Studies, 2, 185 – 205. BCAGZ (Bureau of Civil Affairs of Guizhou Province), 2004, “Procedures for Implementing Minimum Living Standards Guarantee System for Urban Residents in Guizhou Province”. Beijing Daily (1998) “Educated Youth to the Countryside”, July 26, 1998. Bernstein, Thomas P. (1977) Urban Youth in the Countryside: Problems of Adaptation and Remedies, China Quarterly, No. 69, pp. 75-108. Brandt, L and Holz, C. (2006) “Spatial Price Differences in China: Estimates and Implications”, Economic Development and Cultural Change, 55, 43 – 86. Cai, F., Giles, J., Meng, X. (2006) “How Well Do Children Insure Parents Against Low Retirement Income? An Analysis Using Survey Data from Urban China”, Journal of Public Economics, 90, 2229 – 2255. Chen, S., Ravallion, M. and Wang, Y. (2006) “Di Bao: A Guaranteed Minimum Income in China’s Cities?”, World Bank Policy Research Working Paper 3805. Fang, Cheng, Zhang, Xiaobo and Fan, Shenggen (2002) “Emergence of Urban Poverty and Inequality in China: Evidence from Household Survey”, China Economic Review, 13, 430 – 443. Foster, J. Greer, J. and Thorbecke, E. (1984) “A Class of Decomposable Poverty Measures”, Econometrica, 52, 761 – 66. GOSC (General Office of the State Council), 2001, “Circular on Enhancing Work for Minimum Living Standards for Urban Residents”. Giles, J., Park, A. and Cai, F. (2006a) “How has Economic Restructuring Affected China’s Urban Workers?”, China Quarterly, 165: 61 – 95. March. Giles, J., Park, A. and Cai, F. (2006b) “Reemployment of Dislocated Workers in Urban China: The Roles of Information and Incentives”, Journal of Comparative Economics, 34, 582 – 607. Gustafsson, Björn and Wei, Zhong (2000) “How and Why has Poverty in China Changed? A Study based on Microdata for 1988 and 1995”, China Quarterly, 164, 983 – 1006. Gustafsson, Björn and Li, Shi (2004) “Expenditures on Education and Health Care and Poverty in Rural China”, China Economic Review, 15, 292 – 301. HNPG (Hunan Provincial Government), 2003, “Implementing ‘Regulations on Minimum Living Standards for Urban Residents’ in Hunan province”.

Khan, Azizur. R. (2007) “Growth, Inequality and Poverty. A Comparative Study of Chin’s Experience in the Periods Before and After the Asian Crisis” in Gustafsson, Björn. Li, Shi and Sicular, Terry. (Eds) Inequality and Public Policy in China, Cambridge: Cambridge University Press. (Forthcoming) Khan, Azizur Rahman and Riskin, Carl (2001) Inequality and Poverty in China at the Age of Globalization, Oxford: Oxford University Press. Knight, J. and Song, L. (2005) Towards a Labour Market in China, Oxford: Oxford University Press. Knight, J. and Li, S. (2006A) “Unemployment Duration and Earnings of Re-emloyed Workers in Urban China”, China Economic Review, 17, 103 – 119. Knight, J. and Li, Shi (2006B) “Three Poverties in Urban China”, Review of Development Economics, 10 (3), 367 – 387. Lamberg, Peter (2001) The Distribution and Redistribution of Income, 3rd ed, Manchester: Manchester University Press. Li, Shi and Sato, Hiroshi (Eds) (2006) Unemployment, Inequality and Poverty in Urban China, Routledge Curzon. Li, B. (2006) “Floating Population or Urban Citizens? Status, Social Provision and Circumstances of Rural-Urban Migrants in China”, Social Policy and Administration, 40, 174 – 195. Leung, J. (2006) “The Emergence of Social Assistance in China”, International Journal of Social Welfare, 15, 188 – 198, Meng, X., Gregory, B. and Wang, Y (2005) “Poverty, Inequality and Growth in Urban China 1986 – 2000”, Journal of Comparative Economics, 33 (4), 710 – 729. MCA (Ministry of Civil Affairs), 1999, Statistical Report on the Development of the Work of Civil Affairs in 1998. MCA (Ministry of Civil Affairs), 2001, “Circular on Enhancing Work for Minimum Living Standards for Urban Residents in 2001”. MCA (Ministry of Civil Affairs), 2006a, Statistical Report on the Development of the Work of Civil Affairs in 2005. MCA (Ministry of Civil Affairs), 2006b, Standard for Granting Social Relief for the 2nd Quarter of 2006. NBS (National Bureau of Statistics), China Statistical Yearbook, various years, China Statistical Press.

Palmer, Edward and Deng Quheng, (2007) What Has Economic Transition Meant for the Well-being of the Elderly in China, in Bjorn Gustafsson, Li Shi and Terry Sicular eds., Income Inequality and Public Policy in China, Cambridge University Press, forthcoming. People’s Daily, 1999, Ensuring the Basic Living Standards: Commenting on the Release of Regulations on the Minimal Living Standard for Urban Residents by the Vice President of Ministry of Civil Affairs, October 21. Ravallion, M. and Chen, S. (2007) “China’s (Uneven) Progress Against Poverty”, Journal of Development Economics, 82, 1 – 42. Read, B. (2000) “Revitalizing the State’s Urban ‘Nerve Tips’”, China Quarterly, 163, 806 – 820. State Council, 1999, “Regulations on Minimum Living Standards for Urban Residents ”. Saunders, P. and Lujun, S. (2006) “Poverty and Hardship among the Aged in Urban China”, Social Policy and Administration, 40, 138 – 157. Tang, Jun, 2003, “Report on Minimum Living Standard Guarantee for Urban Residents”, in Cai Fang ed., Urban Poverty in Transitional China, Social Sciences Documentation Publishing House. United Nations Development Program (UNDP) (2005), China Human Development Report, 2005. Wong, L. and Ngok, K. (2006) “Social Policy between Plan and Market: xiagang (Off-duty Employment) and the Policy of the Re-employment Service Centres in China”, Social Policy and Administration, 40, 158 – 173. Yao, S. (2000) “Economic Development and Poverty Reduction in China over 20 Years of Reform”, Economic Development and Cultural Change, 48, 447 – 474. Zhang, Y. and Wan, G. (2005), “Why Do Poverty Rates Differ from Region to Region? The Case of Urban China”, Journal of the Asia Pacific Economy, 10, 446 – 462. Zhou, X and Hou, L. (1999) “Children of the Cultural Revolution: The State and the Life Course in the People’s Republic of China”, American Sociological Review, 64, 12 – 36.

Table 1 Di Bao rates (persons living in household with social assistance as percent of all persons in the cell) and rates of persons touched by unemployment (persons living in household with at least one unemployed member) as percent of all persons in the cell. Urban China 2002 By individual characteristics
Sample size Di Bao rate Percent
Percent ”Touched by unemployment”x
Education(adults) Below primary school 430 8.6 24.7 Primary school 1215 5.6 23.2 Junior high school 4667 5.0 29.6 Senior high school 4740 4.4 24.2 Technical school 1975 2.1 20.5 College and above 4422 1.3 14.1 Political status (adults) CPC 4357 1.4 15.3 Non-CPC 13200 4.4 25.0 Ethnic status (adults) Majority 16750 3.6 22.6 Minority 807 4.2 22.1 Ethnic status (children) Majority 2785 3.9 18.1 Minority 206 5.3 17.5 Region (adults) East 6554 2.0 19.8 Central 6231 4.3 25.4 West 4716 5.2 22.8 Region (children) East 908 1.9 17.0 Central 1198 4.8 21.0 West 832 5.0 15.3 Work status(adults) Work 10194 2.6 14.2 Not work 7363 5.1 34.1 Permanent migrant (adults) Yes 1821 2.7 17.5 No 15736 3.8 23.1 Sent down (adults) Yes 1249 4.6 26.1 No 16308 3.6 22.3 Adults 17641 3.7 22.6 Children 2991 4.1 18.0 Total 20632 3.7 21.9 Persons living in households with at least one member reported as a xiagang worker, ligang (off-duty), internal retired, unemployed, youth waiting for job, waiting for slots or entering a higher school. A person is considered an adult when aged 16 or older.

Table 2.Descriptive statistics, households with and without Di Bao, Mean values Variables Di Bao households Non receivers All households Number of children 0.515 0.435 0.438 Number of elderly with pension 0.153 0.279 0.275 Number of elderly without pension 0.153 0.071 0.073
Number of working adults 1.140 1.504 1.491 Number of non-working adults 0.634 0.219 0.233 Household financial wealth (yuan) 12557 40703 39736
Health status of household head compared with others (percent)
Good 47.23 60.56 60.11 Ordinary 34.89 33.36 33.41 Bad 17.87 6.08 6.48 Education of HH (percent) Primary school and below 14.89 6.98 7.25 Junior high 42.98 28.46 28.96 Senior high and Technical school 35.74 36.94 36.90
College and above 6.38 27.62 26.89 With at least one child (percent) 45.53 41.89 42.02 HH CPC member (percent) 14.47 38.40 37.58 Permanent migrantx (percent) 20.85 26.82 26.61
Sent downtxx
(percent) 24.26 18.06 18.27
Female head (percent) 33.19 32.81 32.82 Ethnic minority head (percent) 4.26 3.86 3.88
Large city (percent) 33.62 40.53 40.30 Eastern region (percent) 19.57 36.48 35.90 Central region (percent) 42.55 36.15 36.37 Western region (percent) 37.87 27.36 27.72 Per capita city income (yuan) 6869.58 7910.68 7874.89 Mean city employment ratio 0.6392 0.6640 0.6632 Number of observations 235 6600 6835 x Based on 0 – 1 variable for each household indicating if at least one member is a permanent migrant. xx Based on 0 – 1 variable for each household indicating if at least one member was sent down during the Cultural Revolution. Note: A person is defined as a child if under 16 years old and elderly if over 60 years old. A person not defined as a child or elderly is defined as an adult.
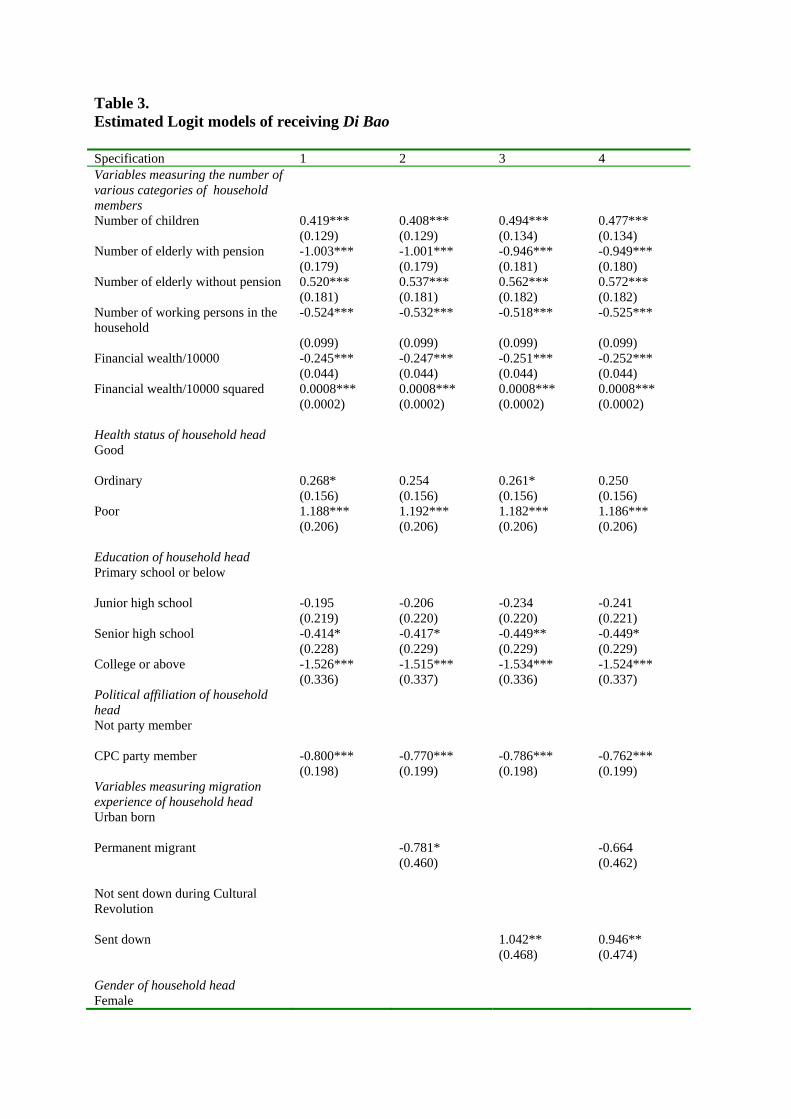
Table 3. Estimated Logit models of receiving Di Bao Specification 1 2 3 4 Variables measuring the number of various categories of household members
Number of children 0.419*** 0.408*** 0.494*** 0.477*** (0.129) (0.129) (0.134) (0.134) Number of elderly with pension -1.003*** -1.001*** -0.946*** -0.949*** (0.179) (0.179) (0.181) (0.180) Number of elderly without pension 0.520*** 0.537*** 0.562*** 0.572*** (0.181) (0.181) (0.182) (0.182) Number of working persons in the household
-0.524*** -0.532*** -0.518*** -0.525***
(0.099) (0.099) (0.099) (0.099) Financial wealth/10000 -0.245*** -0.247*** -0.251*** -0.252*** (0.044) (0.044) (0.044) (0.044) Financial wealth/10000 squared 0.0008*** 0.0008*** 0.0008*** 0.0008*** (0.0002) (0.0002) (0.0002) (0.0002) Health status of household head Good Ordinary 0.268* 0.254 0.261* 0.250 (0.156) (0.156) (0.156) (0.156) Poor 1.188*** 1.192*** 1.182*** 1.186*** (0.206) (0.206) (0.206) (0.206) Education of household head Primary school or below Junior high school -0.195 -0.206 -0.234 -0.241 (0.219) (0.220) (0.220) (0.221) Senior high school -0.414* -0.417* -0.449** -0.449* (0.228) (0.229) (0.229) (0.229) College or above -1.526*** -1.515*** -1.534*** -1.524*** (0.336) (0.337) (0.336) (0.337) Political affiliation of household head
Not party member CPC party member -0.800*** -0.770*** -0.786*** -0.762*** (0.198) (0.199) (0.198) (0.199) Variables measuring migration experience of household head
Urban born Permanent migrant -0.781* -0.664 (0.460) (0.462) Not sent down during Cultural Revolution
Sent down 1.042** 0.946** (0.468) (0.474) Gender of household head Female

Male -0.110 -0.113 -0.106 -0.109 (0.152) (0.152) (0.152) (0.152) Ethnic status of household head Minority Han -0.032 -0.017 -0.037 -0.023 (0.350) (0.351) (0.349) (0.350) Variables measuring the household’s location
Small city Large cities 0.265 0.251 0.254 0.243 (0.178) (0.178) (0.178) (0.179)
Eastern region Middle region -0.066 -0.041 -0.059 -0.040 (0.207) (0.208) (0.207) (0.208) Western region 0.249 0.272 0.257 0.274 (0.206) (0.206) (0.205) (0.206) Mean city income/1000 -0.229*** -0.230*** -0.232*** -0.232*** (0.059) (0.059) (0.059) (0.059) Mean city working ratio -4.006*** -3.823*** -4.038*** -3.884*** (1.045) (1.053) (1.049) (1.057) Constant 2.461** 2.402** 2.405** 2.363** (0.969) (0.970) (0.971) (0.971) Log likelihood -842.46 -840.92 -840.12 -839.03 Pseudo R-squared 0.1761 0.1776 0.1784 0.1795 Number of observations 6824 6824 6824 6824 For variable definitions see the text and notes to Table 2. Households are the unit of analysis.

Table 4 Predicted probabilities of receiving Di Bao for different typical households. Percent Household number Characteristics of household Two non-
elderly working
One non-elderly working
1 Base: The household consists of two non-elderly and one child. The head is male, not a CPC member, is of majority ethnicity, has a primary education, and poor health. The household head has no migration experience and has not been sent down. The household is situated in a small city located in the western region with a city income and employment rate at the sample means (7 875 yuan and 0.6632). Financial wealth is at the sample mean (39 735 yuan)
9.9 15.6
2 Same as 1 but with low financial wealth (at observed mean for Di Bao households: 12 557 yuan)
16.8 25.5
3 Same as 1 but with 0 financial wealth 21.7 31.9 4 Same as 1 but with high financial wealth (mean value plus one
standard deviation = 125 000 yuan) 1.3 2.2
Demographic change
5 Base households but with two, not one child. 15.0 23.0 6 Base household, but with one elderly without pension 16.2 24.7 7 Base household, but with two children and one elderly without
pension 23.8 34.6
8 As 7 but with no financial wealth 44.2 57.3 9 Base household but with one elderly with pension.
4.1 6.7
Changed characteristics of household head or household
10 Experience of being sent down 22.0 32.3 11 The head is member of CPC 4.9 7.9 12 Head has college or longer education 2.3 3.9 13 Health status of head is good 3.2 5.3 14 Head is member of CPC, has college or longer education and
good health status 0.3 0.6
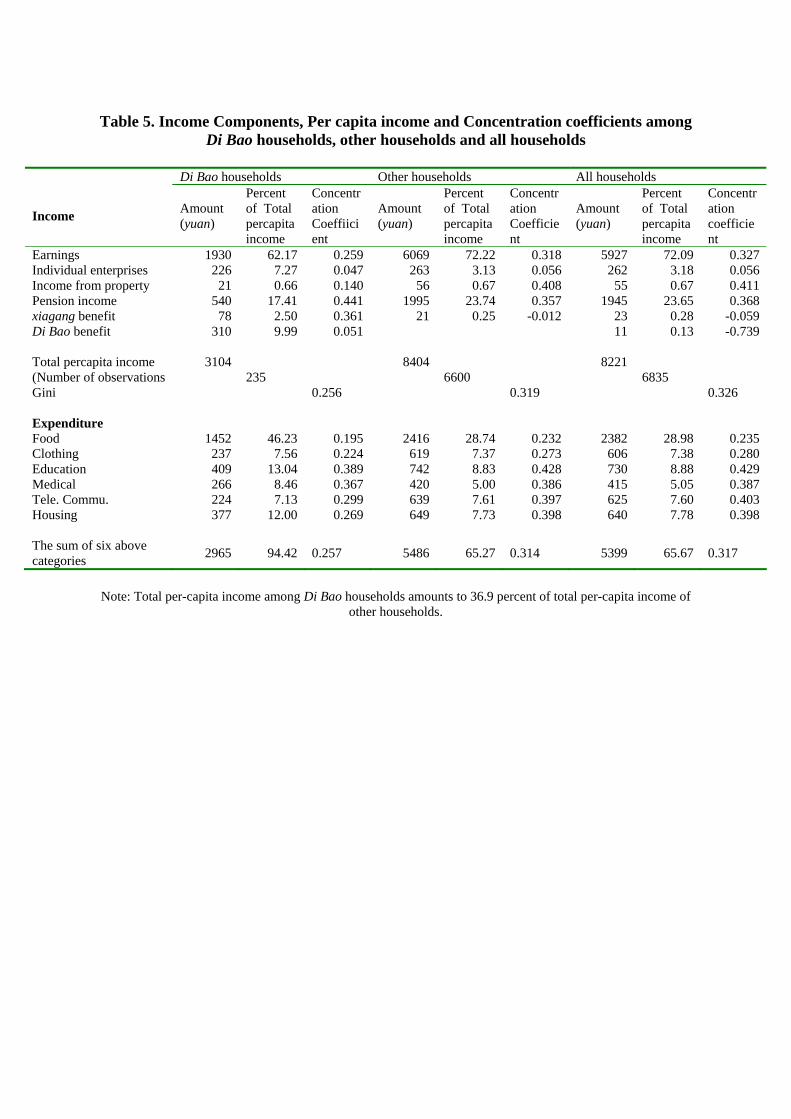
Table 5. Income Components, Per capita income and Concentration coefficients among
Di Bao households, other households and all households
Di Bao households Other households All households
Income Amount (yuan)
Percent of Total percapita income
Concentration Coeffiicient
Amount (yuan)
Percent of Total percapitaincome
Concentration Coefficient
Amount (yuan)
Percent of Total percapita income
Concentration coefficient
Earnings 1930 62.17 0.259 6069 72.22 0.318 5927 72.09 0.327 Individual enterprises 226 7.27 0.047 263 3.13 0.056 262 3.18 0.056 Income from property 21 0.66 0.140 56 0.67 0.408 55 0.67 0.411 Pension income 540 17.41 0.441 1995 23.74 0.357 1945 23.65 0.368 xiagang benefit 78 2.50 0.361 21 0.25 -0.012 23 0.28 -0.059 Di Bao benefit 310 9.99 0.051 11 0.13 -0.739 Total percapita income 3104 8404 8221 (Number of observations 235 6600 6835 Gini 0.256 0.319 0.326 Expenditure Food 1452 46.23 0.195 2416 28.74 0.232 2382 28.98 0.235 Clothing 237 7.56 0.224 619 7.37 0.273 606 7.38 0.280 Education 409 13.04 0.389 742 8.83 0.428 730 8.88 0.429 Medical 266 8.46 0.367 420 5.00 0.386 415 5.05 0.387 Tele. Commu. 224 7.13 0.299 639 7.61 0.397 625 7.60 0.403 Housing 377 12.00 0.269 649 7.73 0.398 640 7.78 0.398 The sum of six above categories 2965 94.42 0.257 5486 65.27 0.314 5399 65.67 0.317
Note: Total per-capita income among Di Bao households amounts to 36.9 percent of total per-capita income of
other households.

Table 6 Poverty among households receiving Di Bao and non-receiving households measured by FGT indices: Row PL=1 PL=2 Poverty index FGT(0) FG FGT(2) FGT(0) FG FGT(2) Di Ba(N =2
29 38 1. Wi i Bao r
0.2708 0.0856 0.0472 0.4935 0.1768 0.0911
2. Aft g Di Bao receipt
0.1745 0.0515 0.0240 0.4141 0.1255 0.0563
3. DecDi
36 40 49 16 29 38
4. H t receiving Di Bao (N =
148 039 018 464 112 045
All lds (N = 5 )
5. Wit out accounting for Di Bao receipt
0.0243 0069 0034 0630 0173 0078
6. Aft ao rec
0.
7. DecDi Ba nt Note: ow 3 is defined as (row 1 – row 2 ) / r 1 *100. Ro 7) is define as (row 5 – w 6 ) / row 5 00.
/ Poverty line 774 T(1)
534 T(1)
o household 35)
thout accounting for Deceipt er considerin
rease in poverty due to Bao receipt, percent
ouseholds no
6600 )
househo
0.0 0.0 0.0 0.0 0.0 0.0
683h 0. 0. 0. 0. 0.
er considering Di Beipt
0207 0.
17 23 31
0056 0.0026 0.0601 0.
5 12 20
0154 0.0065
rease in poverty due to o receipt, perce R ow w d ro *1

Figure 1. Age and economic hardship in urban China 2002
0.00
0.05
0.10
0.15
0.20
0.25
0.30
0.35
0.40
16- 16 21 26 31 36 41 46 51 56 60+
Social assistance receipt Touched by unemploymentLiving with elderly without pension

Figure 2 redictions of Di Bao receipt for a household with given characteristics living in ifferent cities. The prediction refers to household 8 as specified in Table 4 and cities are orted by average household income.
Pds
0.00
0.10
0.20
0.30
0.40
0.50
Dib
ao ra
0.60
te
0.70
0.80
0.90
1 4 7 10 13 16 19 22 25 28 31 34 37 40 43 46 49 52 55 58 61 64 67 70 73 76
Cities1 working adult 2 working adults