Social and Economic Resilience -...
42
Social and Economic Resilience Denis Waters Senior Economist CIPMA Attorney-General’ s Department Business Continuity Institute 19 October 2011
Transcript of Social and Economic Resilience -...

Social and Economic Resilience
Denis Waters Senior Economist
CIPMA Attorney-General’s Department
Business Continuity Institute 19 October 2011

Natural Hazards
Unnatural Disasters
It is people that make a disaster

Overview
• Why worry about resilience?
– A resilient society has benefits to business
– Resilient businesses have benefits to society
• How can resilience be analysed?
• How does it fit into the CIPMA analysis flow?
• Lessons for BCI and application in BCPs?

Focus on resilience
• What is resilience?
• Conceptual paradigm – Personal resilience
– Business resilience
– Community resilience
• Some metrics to facilitate economy
wide assessment of the human
costs of disasters

What is Resilience? • Vulnerability
– Tendency to be damaged
• Resilience
– Ability to resist or recover from damage
• Two sides of one coin

Why are we interested in resilience?
• We live in a world that contains hazards
– Preparedness before the event
– Recovery after the event
• Improved understanding of impact and
consequences ~ valuation of event
• Planning for the future
– Sustainability of communities and economy

CIPMA Analysis
Getting from a disaster to economy wide impact
Where metrics on resilience fit
CIPMA Critical Infrastructure Program for
Modelling and Analysis

Overview of CIPMA • A sophisticated “all hazard” national capability
– Insight into complex network behaviour
– Analyse relationships and interdependencies
• A tool to assist government and business decision makers
– Critical infrastructure , Counter terrorism , Emergency management
– Examine flow-on consequences
– Identify choke points, single points of failure and other vulnerabilities
• A business-government partnership
• High level of support and international recognition

• Simultaneous bomb blasts in CBDs
• Sydney electricity substation outages
• Tsunami hitting the North West Shelf
• Earthquake in the Latrobe Valley
• Support for security planning: APEC Leaders Week and World Youth Day
• Desktop exercises: Broadcast Sector / Emergency Services / Communications sector
• Varanus Island Incident economic impact assessment
• Port disruption from accident or man induced hazard in several states
• North-West Shelf gas outage
• Cyclone impact assessments: Gladstone and Darwin
• Dependency analysis: water / electricity / communications / banking and finance
• Energy disruption: gas and electricity SA / Vic ; CBD; WA; container ports
• Disruptions to internet infrastructure
• Australian Reinsurance Pool Corporation (ARPC) projects
• Climate change hazards and vulnerability analysis for Garnaut and infrastructure owners
• CBD engineering surveys – Melbourne, Sydney, Brisbane and Adelaide
PROJECT EXAMPLES
Risk Analysis
Workflow
x
1. Event
Hazard
Models
Earthquake,
Wind,
Flood,
Blast, Plume,
Man-made etc
Event Propagation
over space and time
3. Vulnerability
Asset/Node
Fragility curves
- Damage states
- Failure modes
Disruption-Recovery Profiles
4. System and Network Models
Electricity
Gas
Liquid fuels
Communications
Banking/Finance
Water
Transport
Spatial &
Temporal
People
Buildings
Business/Industry
5. Impact Footprint
Direct & Indirect Impacts
Business
Residential
Disruption induced
financial costs &
revenue impacts
Economy Wide Impact Winners and Losers
Real GRP,
Consumption,
Employment,
Investment
Casualties
Social Impacts
Injuries
Fatalities
Community & Business profiles
• Age
• Income
• Employment etc
Scenario – Likelihood - Consequence
GIS
0
0.0005
0.001
0.0015
0.002
0.0025
0.003
0.0035
10 100 1000 10000 100000
Return Period considered (years)
Ris
k -
An
nu
al
Da
ma
ge
Pe
rce
nta
ge
Mean+1SD cummulative riskMean cummulative riskMean-1SD cummulative risk
2. Exposure

A Conceptual Paradigm ~ Social
• Personal resilience
• I have …
• I am …
• I can …
• Extend to Community Resilience
– Town/City, Region, LGA, State, Nation
Resources
Skills
Educated
Young and Fit
Self evacuate
Stay and Protect

A Conceptual Paradigm ~ Economic
• Firm resilience
• It has …
• It is …
• It can …
• Extend to Community Resilience
– Town/City, Region, LGA, State, Nation
Inventory
Financial capacity
Above flood level
In soundly built premises
Restart rapidly
Operate without electricity for x
days

What Metrics are Needed? • Social resilience • Age
• Income
• Children and Parent number
• Car ownership
• Housing tenure
• Health status
• Nouse and Education
• Language skills
• Volunteering social capital
• Newness to an area
• Insurance
• Business resilience • Size and Turnover
• Financial status
• Commodity
– Essential or discretionary
• Firm age
• Owner experience
• Staff
• Staff locations
• Business continuity plans
• Supply chain interlinkages
• Insurance

2009 Victorian Bushfire
Fire areas
Social resilience indicators


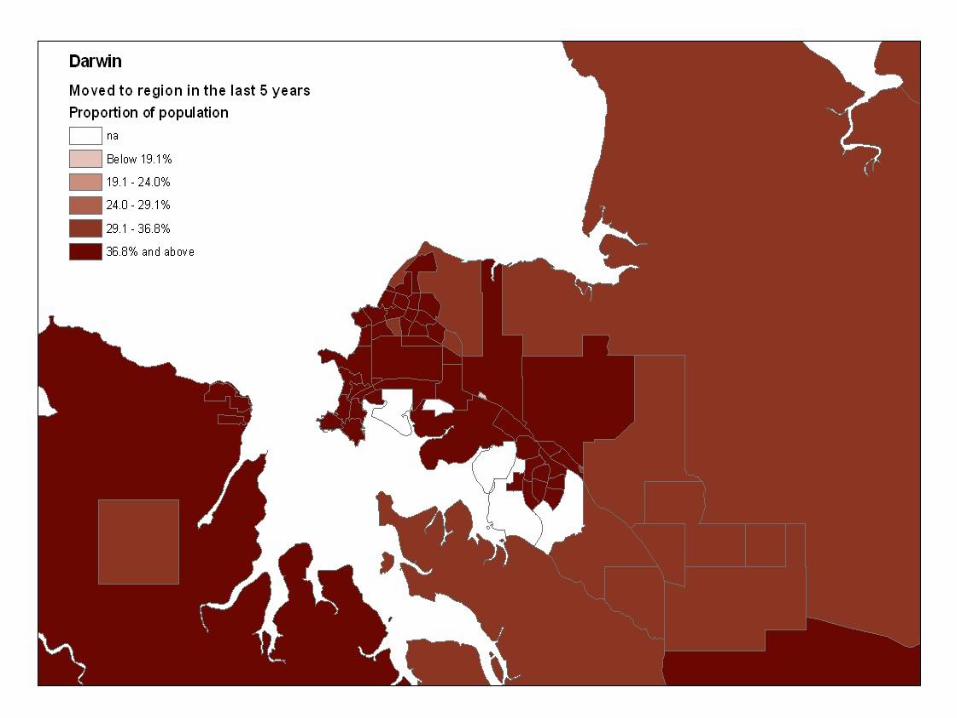
Cyclone Tracy Rerun
Building damage in 2008
Social Indicators visualised spatially
Guides to Resilience


Cyclone Central Queensland
Economic Resilience
Hypothetical Go to Whoa event
Novel wind vulnerability
Novel GIS visualisation
Local and Remote impacts
Economic effects depend on damage to industry and recovery processes

Gladstone Cyclone Task
• Category 3 cyclone impacting on Gladstone
• Examined direct and indirect effects of
damage to electricity system,
telecommunications, industry and the
population
….Gladstone Economic Effects
• Depends on whether the smelter could be
shut down before the cyclone hit
– If not shut down, pot lines freeze and could
result in permanent closure or delay restart
– GDP loss with permanent closure would be
around $10 billion over 7 years
– If restored, GDP loss would be a fifth of the
larger disaster

Impact on Fitzroy region
-5.00
-4.00
-3.00
-2.00
-1.00
0.00
1.00
2.00
2007 2008 2009 2010 2011 2012 2013 2014
% d
ev
iati
on
fro
m r
efe
ren
ce
ca
se
Scenario 1a Scenario 1b Scenario 2
Hard landing and Leave
Hard landing and
Restore
Soft landing

-0.12
-0.10
-0.08
-0.06
-0.04
-0.02
0.00
2007 2008 2009 2010 2011 2012 2013 2014
% d
evia
tio
n f
rom
ref
eren
ce c
ase
Scenario 1a Scenario 1b Scenario 2
Impact on Australia
Hard landing and Leave
Hard landing and
Restore
Soft landing

Tsunami
Hypothetical event
Policy concerns ~ Boxing Day Tsunami
Engineering vulnerability
Flow on Economic Impact

0
200
400
600
800
1,000
1,200
1,400
1,600
1,800
2,000
$ M
illi
on
Nickel
Gold
Manganese
Copper
SaltLN
GIron O
re
15% Reduction in Exports
$2,585 Million Total

Regional Impacts
Gross Regional
Production
Pilbara -12%
Perth -0.09%
Rest of Western
Australia -0.14%
Rest of Australia -0.04%
Computable General
Equilibrium Methods
Resilience of the whole economy
Decision making information
Preparation Response and Recovery

What other elements are important in
identifying resilience?
• Enabling us to answer questions
– How resilient is our society?
– How resilient is our economy?
• Metrics depend on the hazard
– Resilience against what?
– Resilience for what?

What other metrics are important?
• Recovery processes interact with resilience
• Evidence based policies depend on data
– How can we make Australians more resilient, more sustainable in the face of current and future hazards?
• Data for Preparedness, Response and Recovery

Metrics for the CGE modelling
• Personal resilience
– Household tastes
– Consumption patterns
– Capacity to avoid premature death
• Business resilience
– Stock and flow ~ capital and income changes
– Voluntary reductions of input demand
– Trade diversions and supply chain changes

Social and economic resilience
metrics are important in determining
the personal, community and national
cost of disasters
They contribute vitally to the evidence
base for preparedness and resilience
planning

CIPMA analyses have increased
social and economic resilience
through holistic framework which
brings together
Hazard, Exposure, Vulnerability and
Impact and Consequence research
for decision making and resilience
planning before an event

Critical infrastructure is more resilient
- companies are better prepared
Therefore communities are more
resilient
Therefore the cost of disasters is less
than it otherwise would be
CIPMA & Disasters resilience?

BCI and Resilience?
Integral element in BC plans
Resilience ~ an outcome of plans
Understanding resilience
improves BCPs

Thank You
Questions?