SO, YOU WANT TO BUILD A RAILROAD? A CASE STUDY OF TWO PROJECTS UNIVERSITY OF ILLINOIS William W. Hay...
51
SO, YOU WANT TO BUILD SO, YOU WANT TO BUILD A RAILROAD? A RAILROAD? A CASE STUDY OF TWO PROJECTS A CASE STUDY OF TWO PROJECTS UNIVERSITY OF ILLINOIS UNIVERSITY OF ILLINOIS William W. Hay Railroad William W. Hay Railroad Engineering Seminar Series Engineering Seminar Series MAY 11, 2007 MAY 11, 2007 By: Robert H. Leilich, TrainMaster, Inc. The Woodlands, TX 77380 [email protected]
-
Upload
cornelius-webster -
Category
Documents
-
view
215 -
download
0
Transcript of SO, YOU WANT TO BUILD A RAILROAD? A CASE STUDY OF TWO PROJECTS UNIVERSITY OF ILLINOIS William W. Hay...

SO, YOU WANT TO SO, YOU WANT TO BUILD A RAILROAD?BUILD A RAILROAD?
A CASE STUDY OF TWO PROJECTSA CASE STUDY OF TWO PROJECTSUNIVERSITY OF ILLINOISUNIVERSITY OF ILLINOISWilliam W. Hay Railroad William W. Hay Railroad
Engineering Seminar SeriesEngineering Seminar SeriesMAY 11, 2007MAY 11, 2007
By:Robert H. Leilich,TrainMaster, Inc.The Woodlands, TX [email protected]
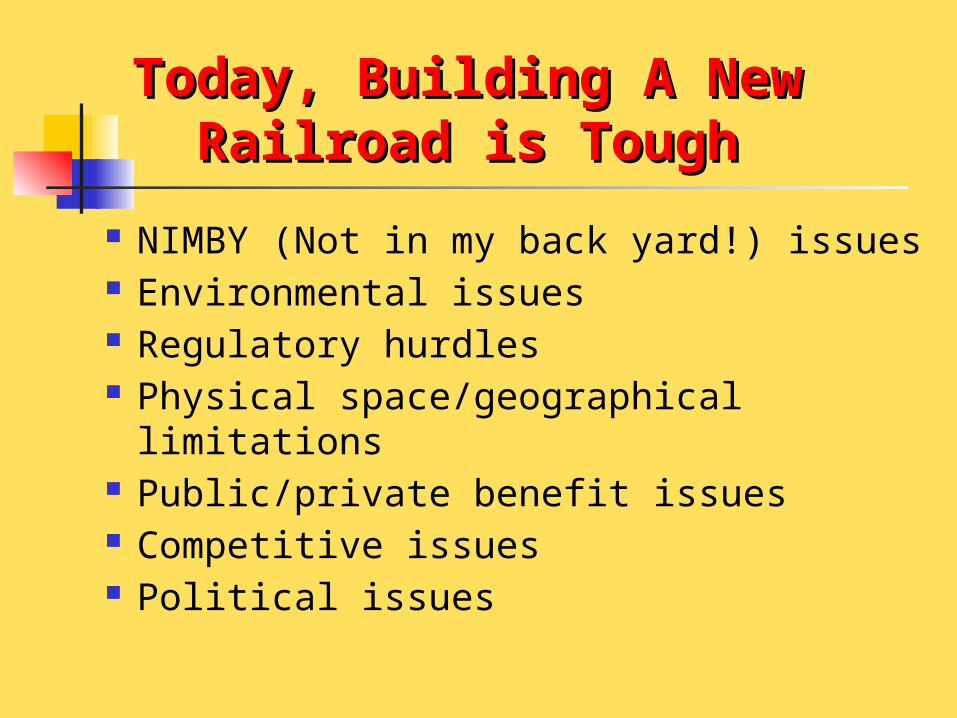
Today, Building A Today, Building A New Railroad is ToughNew Railroad is Tough
NIMBY (Not in my back yard!) issues Environmental issues Regulatory hurdles Physical space/geographical
limitations Public/private benefit issues Competitive issues Political issues
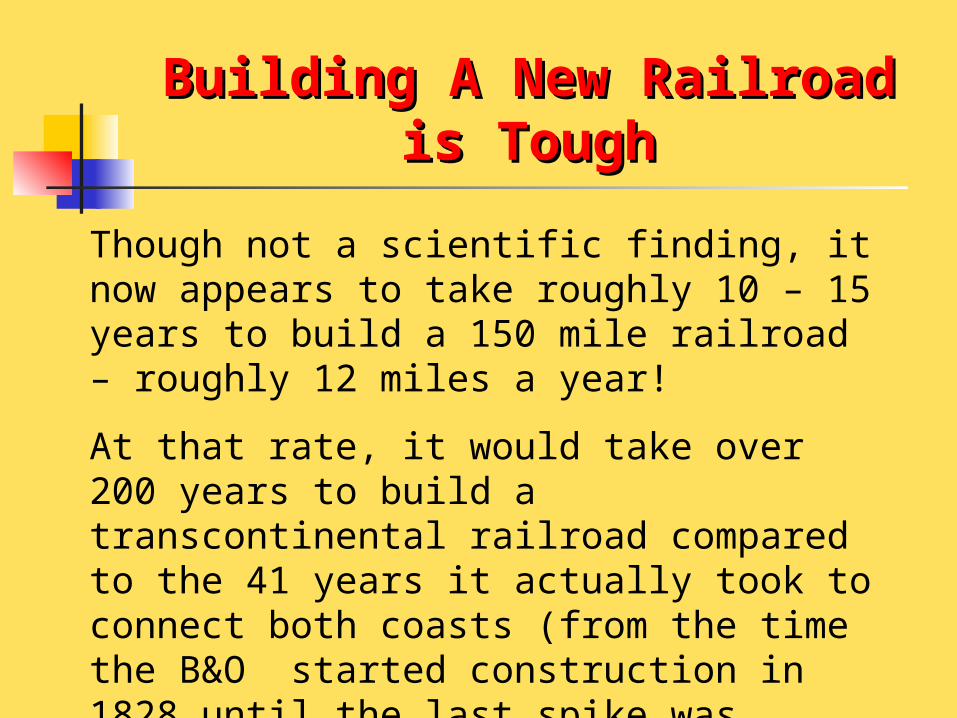
Building A New Railroad is Building A New Railroad is ToughTough
Though not a scientific finding, it now appears to take roughly 10 – 15 years to build a 150 mile railroad – roughly 12 miles a year!
At that rate, it would take over 200 years to build a transcontinental railroad compared to the 41 years it actually took to connect both coasts (from the time the B&O started construction in 1828 until the last spike was driven at Promontory Point in 1869).

A Study of Two A Study of Two ExamplesExamples
Tongue River Railroad Corp. (TRRC) – Montana Shortcut for BNSF coal traffic Open new mines in North Powder River
Coal Basin Studies began in 1978
I-70 Corridor Railroad – Denver Airport to Glenwood Springs Relieve congestion on I-70 Add capacity Studies beginning in 2007

Jones / Moran Junctions
Miles City
Spring Creek / Decker
Dutch
15.9
115
To Donkey Creek
136.1
To Billings 129.9
BNSF
TRR
To Glendive
Ashland
Near Mines
89
25
TRR will save BNSF 268 to 331 round trip miles for each coal train operated
MONTANA
WYOMING
Potential new North Powder River Basin (NPRB) coal mines
The TRRC
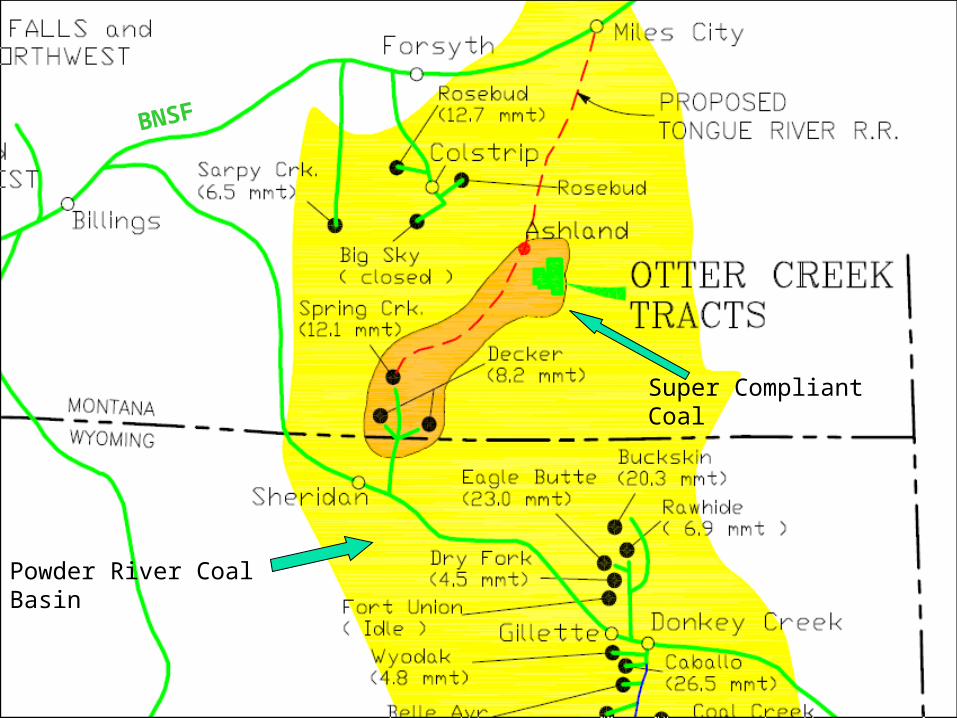
Super Compliant Coal
Powder River Coal Basin
BNSF

29-Years in 29-Years in DevelopmentDevelopment
Many obstacles to overcome BNSF (& former BN) initially not
convinced of economics or benefits Environmental issues Legal issues Cyclical changes in the coal market Aggregating checkerboard coal lease
rights Financing

TRAFFIC VOLUME
CO
STS
TRRC FIXED COSTS
TRRC FULL
COSTS
BNSF AVOIDABLE
COSTS
BREAK EVEN
TRRC AVOIDABLE COSTS
BNSF AND TRRC COST BNSF AND TRRC COST RELATIONSHIPS VERSUS RELATIONSHIPS VERSUS
VOLUME ARE VERY DIFFERENTVOLUME ARE VERY DIFFERENT

}TRR Fixed Costs
Break Even
TRAFFIC VOLUME
CO
ST
0
TRR Full Cost Break Even
TRAFFIC VOLUME
CO
ST
0
Economic Break Even
Where we want to be
TO BE ADVANTAGEOUS TO TRRC TO BE ADVANTAGEOUS TO TRRC AND BNSF, BOTH MUST BENEFITAND BNSF, BOTH MUST BENEFIT
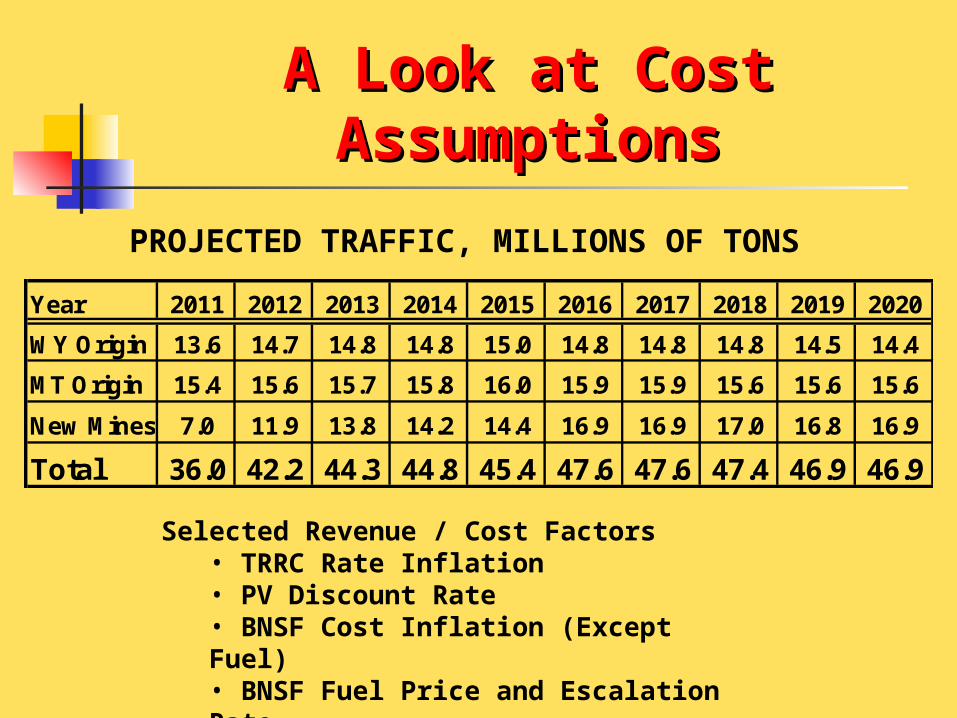
A Look at Cost A Look at Cost AssumptionsAssumptions
PROJECTED TRAFFIC, MILLIONS OF TONS
Selected Revenue / Cost Factors• TRRC Rate Inflation• PV Discount Rate• BNSF Cost Inflation (Except Fuel)• BNSF Fuel Price and Escalation Rate
Year 2011 2012 2013 2014 2015 2016 2017 2018 2019 2020
WY Origin 13.6 14.7 14.8 14.8 15.0 14.8 14.8 14.8 14.5 14.4
MT Origin 15.4 15.6 15.7 15.8 16.0 15.9 15.9 15.6 15.6 15.6
New Mines 7.0 11.9 13.8 14.2 14.4 16.9 16.9 17.0 16.8 16.9
Total 36.0 42.2 44.3 44.8 45.4 47.6 47.6 47.4 46.9 46.9

Cost Assumptions, Cost Assumptions, ContinuedContinued
Operating Factors
Avoidable Cost
Train Performance Calculator
Fuel
Train-Hours, Locomotive Unit-Hours & Car-Days
Labor, Capital, Maintenance
Train Miles, Railroad Owned Car-Miles
Maintenance
Gross Ton-Miles Maintenance
Operating Factors x Avoidable Costs per Unit = Avoidable Costs (Existing Route &
Via TRRC)

TRR CostsTRR Costs
Capital (construction) costs split between capital and equity portion
Debt amortized over 20 years TRRC maintains right of way (track,
signals, road crossings, structures) BNSF dispatches and operates
trains Minimum TRRC admin expense

Findings Findings Net BNSF avoidable cost savings
exceed TRR full costs and debt service for total predicted traffic expectations
TRRC can be justified to serve only BNSF traffic or local NPRB mines – best benefit if both are served
Aggregating coal leases required in order to develop local mines
TRRC and BNSF need to negotiate splitting of savings so both benefit

Benefits to InvestorBenefits to Investor
Highly influenced/affected by: debt/equity ratio Interest rate on debt Traffic volume Inflation rate (TRRC largely fixed
costs, not subject to inflation; all BNSF costs subject to inflation)
BNSF captured share of savings

Maybe, Just MaybeMaybe, Just Maybe
Construction might start in 2007 or 2008!

BUILDING AN I-70 BUILDING AN I-70 CORRIDOR RAILROAD!CORRIDOR RAILROAD!
An Introduction to Operational and
Equipment Issues
Picture Credit: Kara K. Pearson and the Glenwood Springs Post Independent
The ProblemThe Problem Traffic on the already congested I-70
Corridor between Denver Airport – Denver – Glenwood Springs is expected to increase by 50+ percent between 2000 and 2025.
Many severe physical constraints make adding lanes to I-70 prohibitively expensive
Highway expansion poses many negative environmental, safety, construction, and weather reliability concerns
Proposed SolutionsProposed Solutions Rail, in one of several forms
Maglev – a “dream” (naïve?) solution High Speed Rail – á la European TGV Conventional (Heavy) Rail – passenger and
freight (intermodal) Light rail – cheaper but may not meet
demand or all needs Bite the bullet – call in the bulldozers
and concrete mixers Do nothing

I-70 Coalition Faces I-70 Coalition Faces Similar Problems as Similar Problems as
TRRCTRRC NIMBY (Not in my back yard!) issues Environmental issues Regulatory hurdles Physical space/geographical limitations Public/private interests, costs and
benefits Competitive issues (public and private) Political Education

Proposed StudyProposed Study 26 local towns and cities and 10 counties
formed the I-70 Coalition in 2004 in order to identify, evaluate, and select the best capacity improving alternatives
Coalition wants to counter established bias for highway expansion
Federal funding is highway oriented Strong highway lobbies American love of cars and independence Colorado DOT performed a PEIS that appears to favor
highway Educate public on benefits of rail

Background – Background – Commuter / Regional Commuter / Regional
RailRail
One of the fastest-growing segments of the passenger business
Over 213 million trips were recorded in the first six months of 2006 – up over 3.4 percent from the same period in 2005
Growing competition forlimited Federal funding

Difficult Hurdles Difficult Hurdles Ahead Ahead
High capital costs create a lower benefit / cost ratio, making it more difficult to compete for Federal Funding
Consensus has not yet been reached that rail is the best solution
Many competing and independent political interests and government agencies
The proposed railroad is unique and the first of its kind in the U.S.

Political, Marketing, Financial, Political, Marketing, Financial, and Technical Knowledge is and Technical Knowledge is
RequiredRequired
The I-70 Coalition is off to a great start on perhaps the most difficult challenge – the political aspect of building project momentum
This presentation is an introduction to some technical and operational aspects of the proposed railroad.

The Proposed Railroad The Proposed Railroad Must Be Designed As A Must Be Designed As A
SystemSystem
Start with defining the missionStart with defining the mission Long distance passengerLong distance passenger Local passengerLocal passenger CommuterCommuter IntermodalIntermodal FreightFreight A combination of the aboveA combination of the above
Markets servedMarkets served Desired routing(s)Desired routing(s) Stations and other facilitiesStations and other facilities
Defining the Mission Sets Defining the Mission Sets Key Design ParametersKey Design Parameters
Quantify Expected Traffic Passenger Freight
Evaluate Equipment Alternatives Locomotive powered trains Self propelled Multiple Units Tilt or non-tilt Cars and interior and capacity
specifications FRA safety compliance requirements

Key Design ParametersKey Design Parameters Propulsion Selection
Diesel Electric
Select Route Engineering design constraints
Maximum gradient Speed limits Curvature Environmental considerations
Single track with sidings or multiple tracks
Trade-off analysis (initial capital versus long-run operating costs, other)
Select train control system(s) (signaling)
A Few Rules of Thumb…A Few Rules of Thumb… 1 - 1.5 HP per ton per one percent gradient
– freight train 4 - 8+ HP per ton per one percent gradient
– passenger train Maximum comfort speed on curves – 3 inch
imbalance Maximum comfort acceleration and
deceleration rates – 3 feet per second per second.
Maximum superelevation on curves – three inches for freight trains, six inches for passenger trains only

Speed vs Curvature Speed vs Curvature With 3 Inch ImbalanceWith 3 Inch Imbalance
0 0.5 1 1.5 2 2.5 3 3.5 440
50
60
70
80
90
100
110
120
130
140
150
160
Curvature - Degrees
SP
EE
D -
MP
H
Degree (Rate) of Curvature
100 Feet
Superelevation:6 Inches3 Inches
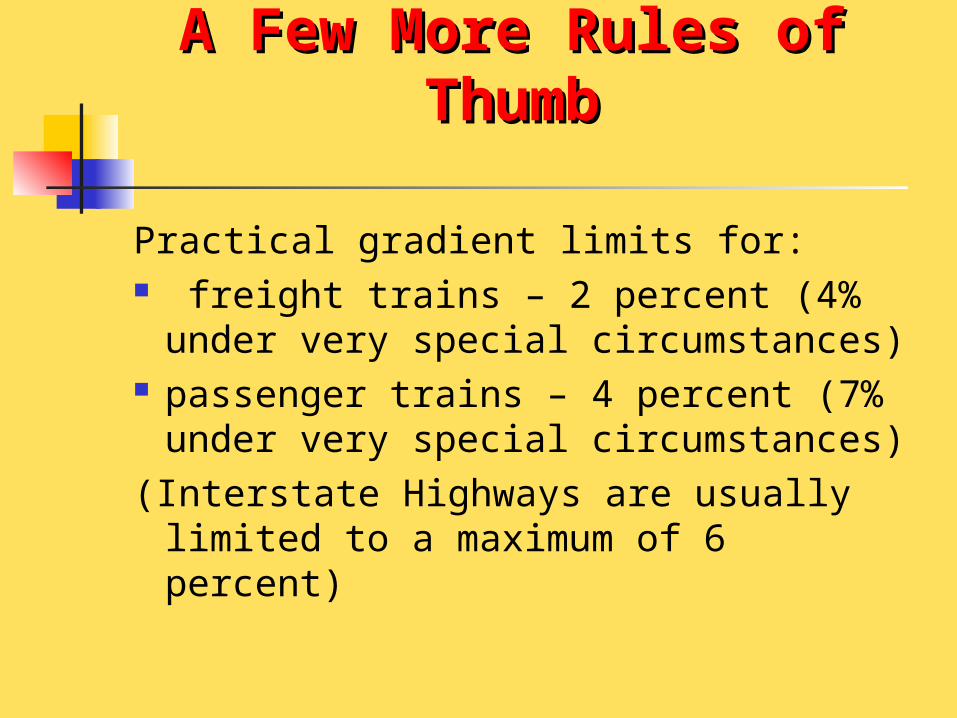
A Few More Rules of A Few More Rules of ThumbThumb
Practical gradient limits for: freight trains – 2 percent (4%
under very special circumstances) passenger trains – 4 percent (7%
under very special circumstances)(Interstate Highways are usually
limited to a maximum of 6 percent)

A Few Safety A Few Safety ConsiderationsConsiderations
Maximum design speed Class 4 track – 80 MPH – most Amtrak
routes Class 5 track – 90 MPH – Automatic
Train Stop or Cab Signals required Class 6 track – 110 MPH – Special
restrictions on grade crossings Class 7 track – 125 MPH – Requires
total right-of-way protection Braking on descending gradients –
requires reduced speeds or external (non-adhesion dependent) braking
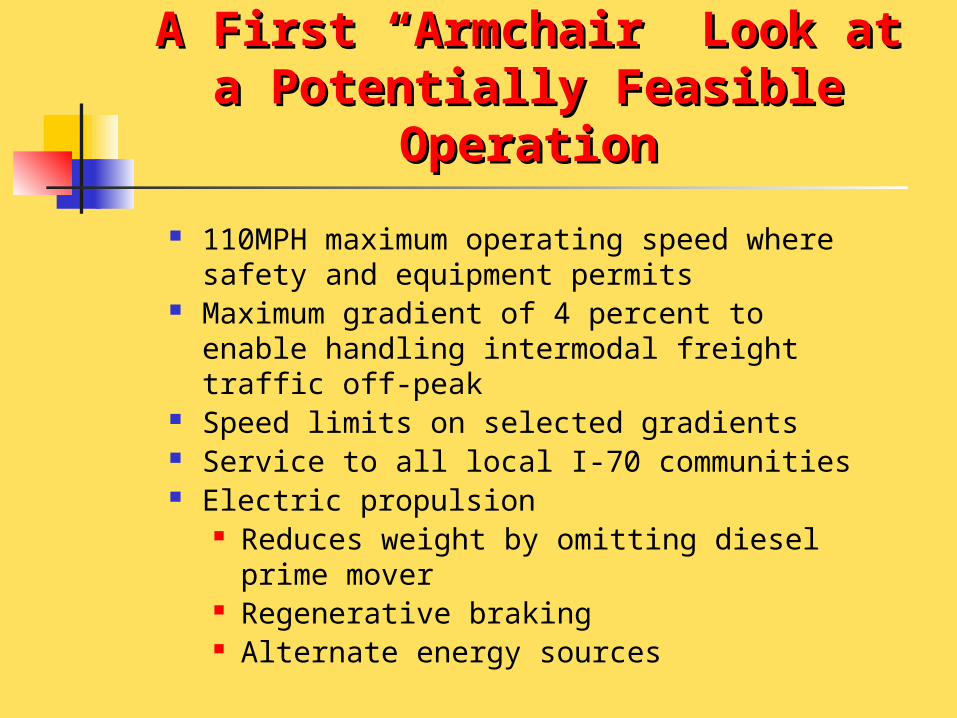
A First “Armchair” Look at a A First “Armchair” Look at a Potentially Feasible Potentially Feasible
OperationOperation
110MPH maximum operating speed where safety and equipment permits
Maximum gradient of 4 percent to enable handling intermodal freight traffic off-peak
Speed limits on selected gradients Service to all local I-70 communities Electric propulsion
Reduces weight by omitting diesel prime mover
Regenerative braking Alternate energy sources

Approxim
ate Route
DIA TO UNION STATION

UNION STATION TO C-470 & I-70
Approximate Route

0 10 20 30 40 50 60 70 80 90 100 110 120 130 140 150 160 170 180 190
4,000
4,500
5,000
5,500
6,000
6,500
7,000
7,500
8,000
8,500
9,000
9,500
10,000
10,500
11,000
11,500
0
10
20
30
40
50
60
70
80
90
100
110
DISTANCE - MILES
EL
EV
AT
ION
- F
EE
T
SP
EE
D L
IMIT
- M
PH
ROUGH I-70 PROFILE AND RAIL SPEED LIMITS
DENVER AIRPORT TO GLENWOOD SPRINGS
DIA
GO
LD
EN
- 3
9
DE
NV
ER
UN
ION
ST
N -
25
IDA
HO
SP
GS
- 5
9
GE
OR
GE
TO
WN
- 7
1
FR
ISC
O -
98
CO
PP
ER
MT
N -
103
VA
IL -
119
.5
GL
EN
WO
OD
SP
GS
- 1
83
EA
GL
E -
152
ED
WA
RD
S -
136
AV
ON
- 1
32
GY
PS
UM
- 1
59
SIL
VE
RT
HO
RN
E -
94

Station StopsStation StopsStation Miles from
DIAStop Duration (Mins)
Denver Airport (DIA)
0 - -
Denver Union Sta 29 3Golden 39 2Idaho Springs 59 1Georgetown 71 2Silverthorne 94 2Frisco 98 2Copper Mountain 103 2Vail 119.5 2Avon 132 1Edwards 136 1Eagle 152 1Gypsum 159 1Glenwood Springs 183 - -

Equipment SimulatedEquipment Simulated
Equipment Type*
PropulsionCars Per
Train
Max Speed, MPH
Seats Per Train
Adtranz Flexliner
Diesel (DMU)
3 75 180
X2000 Electric 3 110 180
AMD103 / Talgo
Diesel Electric
12 103 312
Colorado Railcar
Diesel Electric
DMU3 90 180
Stadler FLIRT
Electric (EMU)
3 100 154
*Bombardier equipment candidates submitted too late for analysis.

FLIRT (Fast, Light, Innovative Trains) – 2 to 6 car trains
Matching floor / platform Height is a must for fast
ingress and egress, especially with luggage,
skis, and bikes

Bombardier Regina – 2 & 3 car EMU’s are sinews of Sweden’s intercity and interregional services at speeds up to 250 km/h (150 mph).
Bombardier Electrostar trains are designed to operate at speeds of up to 160 km/h (100 mph).

Bombardier Merdian family of DMU’s – up
to 200 km/h (120 mph), tilt and non-tilt
versions.
Bombardier Talent DMU’s (2, 3, or 4-car
configurations) operate at speeds up to 140
km/h (85 mph).
0 10 20 30 40 50 60 70 80 90 100 110 120 130 140 150 160 170 180 190
0
10
20
30
40
50
60
70
80
90
100
110
120
0
10
20
30
40
50
60
70
80
90
100
110
120
130
140
150
160
170
180
190
MILES
SP
EE
D &
SP
EE
D L
IMIT
- M
PH
CU
MU
LATI
VE
MIN
UTE
S
X2000 ELECTRIC TRAIN - MAX SPEED 125 MPHDENVER AIRPORT TO GLENWOOD SPRINGS
DIA
GO
LD
EN
- 3
9
DE
NV
ER
UN
ION
ST
N -
25
IDA
HO
SP
GS
- 5
9
GE
OR
GE
TO
WN
- 7
1
FR
ISC
O -
98
CO
PP
ER
MT
N -
103
VA
IL -
119
.5
GL
EN
WO
OD
SP
GS
- 1
83
EA
GL
E -
152
ED
WA
RD
S -
136
AV
ON
- 1
32
GY
PS
UM
- 1
59
SIL
VE
RT
HO
RN
E -
94
Spe ed
Speed Limit
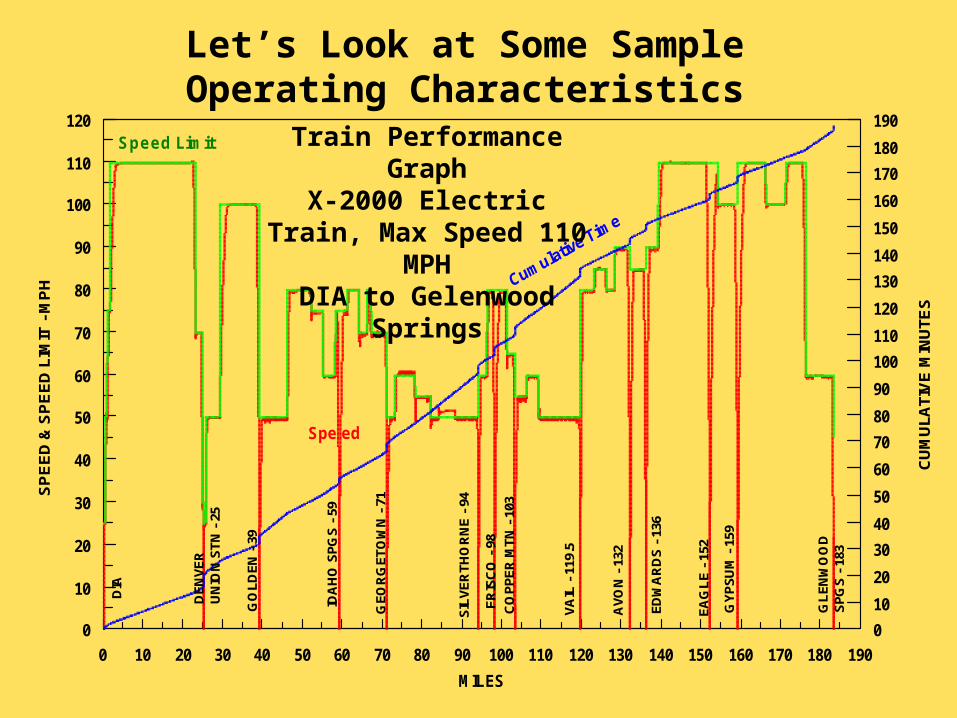
Let’s Look at Some Sample Operating Characteristics
Train Performance GraphX-2000 Electric Train, Max Speed 110 MPHDIA to Gelenwood
Springs

0 10 20 30 40 50 60 70 80 90 100 110 120 130 140 150 160 170 180 190
0
10
20
30
40
50
60
70
80
90
100
010
20
3040
50
6070
80
90
100110
120
130140
150
160170
180
190200
210
MILES
SP
EE
D &
SP
EE
D L
IMIT
- M
PH
CU
MU
LATI
VE
MIN
UTE
S
COLORADO RAILCAR 5-CAR DMUDENVER AIRPORT TO GLENWOOD SPRINGS
Speed Limit
DIA
GO
LD
EN
- 3
9
DE
NV
ER
UN
ION
ST
N -
25
IDA
HO
SP
GS
- 5
9
GE
OR
GE
TO
WN
- 7
1
FR
ISC
O -
98
CO
PP
ER
MT
N -
103
VA
IL -
119
.5
GL
EN
WO
OD
SP
GS
- 1
83
EA
GL
E -
152
ED
WA
RD
S -
136
AV
ON
- 1
32
GY
PS
UM
- 1
59
SIL
VE
RT
HO
RN
E -
94
Spe ed

Simulation Operating Simulation Operating ResultsResults
EQUIPMENT TYPE FLEXLINER X2000 AMD103
Talgo COLORADO
RAILCAR FLIRT 3-CAR
Power Diesel Electric Diesel Diesel Electric Cars in Train 1 3 12 5 3 Seats (Nominal) 60 180 312 300 154 Eqpt Max Spd (As Configured) 75 125 103 90 100 WESTBOUND Running Time (Hours) 3.5 3.1 3.2 3.4 3.1 Energy (Gal/KWH) 252 4302 355 537 3219 Seat Miles per Gal or KWH 44 8 161 102 9 EASTBOUND Running Time (Hours) 3.5 3.1 3.3 3.4 3.1 Energy (Gal/KWH) 269 4519 369 567 3234
Seat Miles per Gal or KWH 41 7 155 97 9

So What Do These Results So What Do These Results Mean?Mean?
Total times in either direction range from 3.1 to 3.5 hours – about a 25 minutes difference
A speed limit of 110 is not as important as maintaining a high average speed
Electric trains, with less weight (no heavy diesel engine) and with short term overload power draw offer superior performance in mountainous territory
Carefully matching equipment, profile (grades, curves, mileage), limiting number of stops and duration suggest that total running time could be designed to be less than three hours
StoppingDistance
0%-4%-7%
StoppingTime
0%-4%-7%
0 1000 2000 3000 4000 5000 6000 70000
10
20
30
40
50
60
70
80
90
100
110
0
10
20
30
40
50
60
70
80
Feet
Sp
eed
, M
PH
Tim
e -
Sec
on
ds
TRAIN EMERGENCY STOPPING DISTANCESpeed & Time Versus Gradient
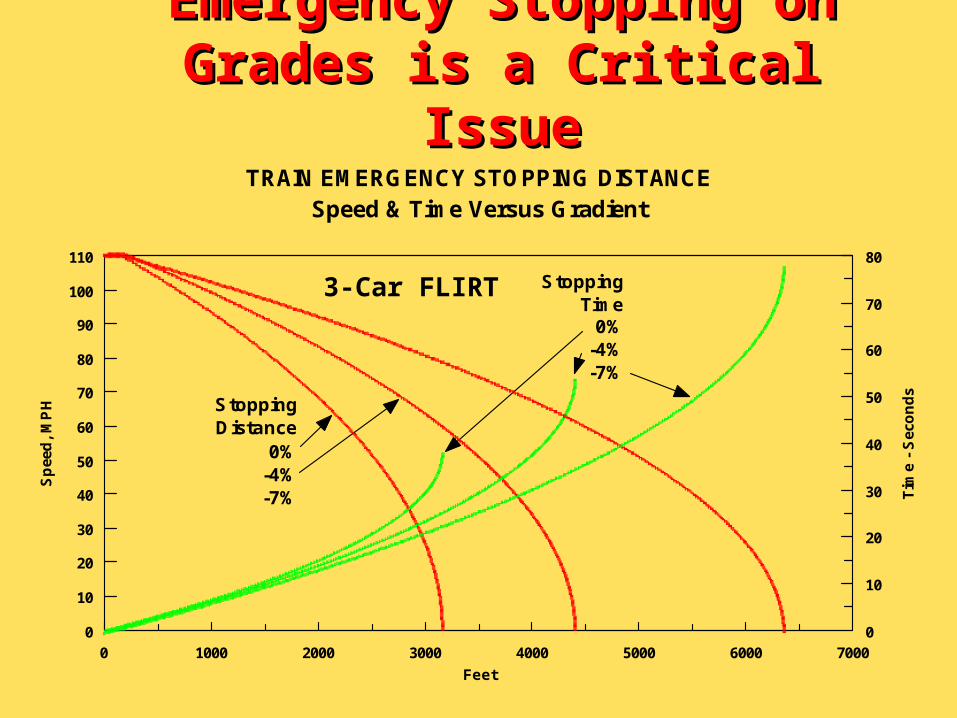
Emergency Stopping Emergency Stopping on Grades is a Critical on Grades is a Critical
IssueIssue
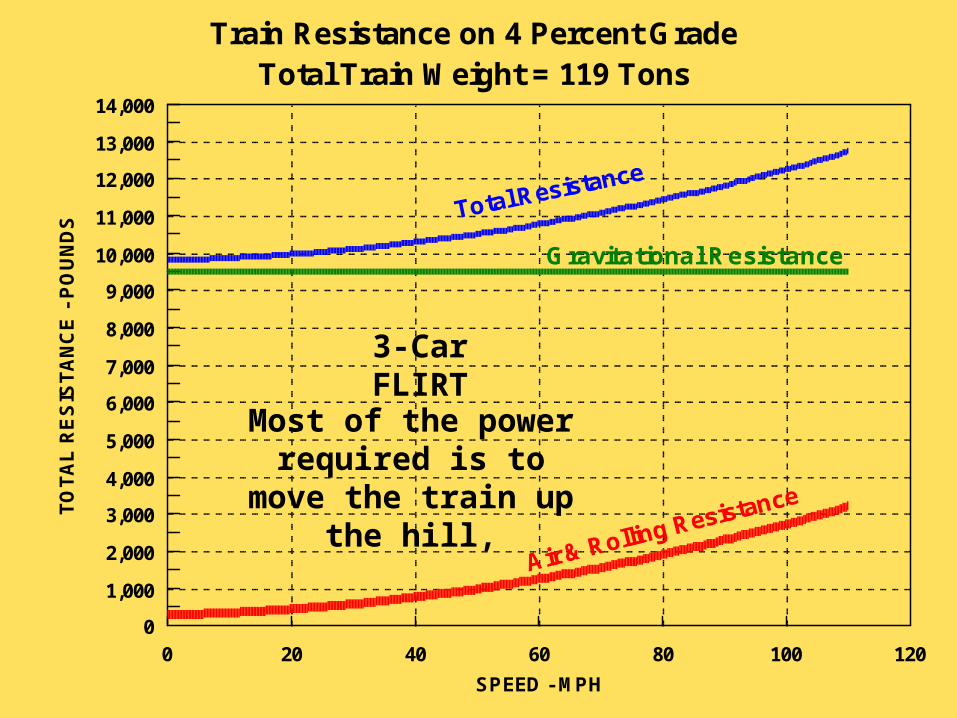
3-Car FLIRT
0 20 40 60 80 100 1200
1,000
2,000
3,000
4,000
5,000
6,000
7,000
8,000
9,000
10,000
11,000
12,000
13,000
14,000
SPEED - MPH
TO
TA
L R
ES
IST
AN
CE
- P
OU
ND
S
Train Resistance on 4 Percent GradeTotal Train Weight = 119 Tons
Air & Rolling Resistance
Gravitational Resistance
Total Resistance
3-Car FLIRT
Most of the power required is to move the
train up the hill,

0 20 40 60 80 100 1200
4
8
12
16
20
24
28
32
SPEED - MPH
HO
RS
EP
OW
ER
PE
R T
ON
Train Power Requirements on 4 Percent GradeHorsepower Per Ton; Train Weight = 119 Tons
Air & Rolling HP/Ton
Gravitational HP/Ton
Total HP/Ton
3-Car FLIRT

The Proposed I-70 The Proposed I-70 Corridor Railroad is Corridor Railroad is
UniqueUnique
Line gradients (ruling grade) is critical in determining equipment requirements, safe speeds, and operating and maintenance costs
Train weight is very important Required power to weight ratios are high,
and increase as speed limits, weight and gradients increase (more power adds weight)
FRA crash worthiness requirements (weight) need to be modified to focus more on accident avoidance and prevention

The Opportunity is The Opportunity is Here…Here…
Needed technology is proven, off the shelf Highway alternatives are more expensive,
less environmentally sound, less safe, and will incur years of construction related congestion
A single track has more than twice the passenger carrying capacity of a single lane of highway
RAIL IS THE BEST SOLUTION TO ALLEVIATE I-70 CONGESTION AND PROVIDE CAPACITY FOR THE FUTURE

California high-speed rail plan back on California high-speed rail plan back on track for 700-mile routetrack for 700-mile route Harrison Sheppard and Sue Doyle, Los Angeles Daily News Staff Writers. Wednesday, April 11,2007
SACRAMENTO -- Supporters of a $40 billion high-speed rail line in California are revitalizing their decade-long battle for a 700-mile route...
The plan for the transit corridor has languished for years, unable to overcome weak political support and strong criticism of its hefty pricetag.
A Final Note…A Final Note…

…[A] record-breaking run by a French TGV train …has revived interest …[to] whisk passengers between Los Angeles and San Francisco in less than three hours.
"I think this is the future for California,'' said Assemblywoman Fiona Ma, D-San Francisco, …one of several state lawmakers who … witness[ed] the speed record.
"I think people are sick and tired of long commutes, tired of not knowing whether their plane is going to come in on time, tired of the high cost of gas and airline tickets,'' Ma said….

Still, the plan faces significant challenges.
"I think it's a ridiculous boondoggle,'' said Robert Poole, director of transportation studies at the Reason Foundation in Los Angeles….. “Californians prefer driving their cars regardless of traffic, and airlines already offer quick north-south routes at a reasonable price”
[Norm] King [director of the Leonard Transportation Center at Cal State San Bernardino] said money would be better invested in highway projects because roads would create more congestion relief…
The road ahead for the I-70 Coalition is not easy – it must The road ahead for the I-70 Coalition is not easy – it must stay focused and on track. (Pun intended.)stay focused and on track. (Pun intended.)