
SO #64 Global Greening Trends - Final - Consent and Country
39
Real Estate Research i Globalization and Global Trends in Green Real Estate Investment Number 64 September 2008 Executive Summary A confluence of several distinct but related factors is forcing the real estate industry to address climate change with meaningful measures. Tenant space requirements, government regulations, and demands for socially-responsible investments, are among the issues driving a rapid transformation of property markets globally to greener construction and building operations. The globalization of property markets, and the rise of truly global investors and other change agents, are only intensifying these trends. And all of these forces are set on a foundation of attractive financial returns for greener buildings due to soaring energy prices and more affordable greening technologies. Recent years have witnessed an explosion in the creation of more sustainable buildings, through both new construction and retrofits to greener standards, though this activity has been highly concentrated in the wealthiest nations. But even here, institutional investors have been slow to seize the opportunities – or recognize the risks of the changing landscape. As a result, most regions see an imbalance between tenant demands for greener space and the response from real estate markets – evidenced by performance premiums for green buildings relative to conventional buildings in terms of rental rates, occupancy levels, and absorption rates, among other measures. The rising number of firms purchasing carbon credits to offset their greenhouse gas emissions also suggests the supply of green facilities is insufficient to meet their needs. Finally, tenants have spoken most loudly of all through their actions, in effect declaring, “if you won’t build it, then we’ll build it ourselves.” Most green construction has been initiated by corporate or government owner-occupiers – who continue to own green buildings far disproportionate to their share of conventional facilities. Looking forward, some of the greatest opportunities for investors to leverage emerging global green standards will be in the developing economies of the world due to their faster rates of population and economic growth and relatively unencumbered built environment. Nonetheless, the various factors that inhibit sustainable business practices in these regions cannot be minimized, which will limit near-term opportunities in many nations. On the other hand, the greater wealth and property investment in the developed world, in conjunction with deeper acceptance of environmental principles, provides more opportunities to improve the sustainability of the standing inventory through retrofits – but also presents perilous risks for failure to move quickly enough to greener standards. In some markets, the shift to sustainability has been so complete that green buildings cannot be thought of as a distinct class of property – it’s already the new standard, certainly for Class A. Opportunities and risks will vary within regions and among the various types of real estate products and investment vehicles. Properties that offer the greatest benefits to users and owners relative to conventional buildings should see the most rapid transformation, particularly energy-intensive uses (such as high-rise office buildings) and high-profile uses in which tenants have substantial client contact (such as retail centers). Moreover, urban infill sites will be increasingly valued in both developed and emerging economies. In the capital markets, we expect activity in public equity markets to surge as more sustainable buildings come to market and green product definitions become more standardized. We also anticipate ever-greater participation by private funds, especially in partnership with public pension funds, as the funds and their advisors recognize the fiduciary risks of not greening their portfolios, as well as the opportunities for premium returns through greener buildings. Prepared By: Andrew J. Nelson Vice President RREEF Research San Francisco USA (415) 262-7735 [email protected] Report Contents - Executive Summary - Key Findings - Climate Change and the Need to Act - Global Greening Forces - Regional Analysis - Implications for Investors RREEF Research
Transcript of SO #64 Global Greening Trends - Final - Consent and Country
Real Estate Research i
Globalization and Global Trends in Green Real Estate Investment
Number 64 September 2008
Executive Summary A confluence of several distinct but related factors is forcing the real estate industry to address climate change with meaningful measures. Tenant space requirements, government regulations, and demands for socially-responsible investments, are among the issues driving a rapid transformation of property markets globally to greener construction and building operations. The globalization of property markets, and the rise of truly global investors and other change agents, are only intensifying these trends. And all of these forces are set on a foundation of attractive financial returns for greener buildings due to soaring energy prices and more affordable greening technologies.
Recent years have witnessed an explosion in the creation of more sustainable buildings, through both new construction and retrofits to greener standards, though this activity has been highly concentrated in the wealthiest nations. But even here, institutional investors have been slow to seize the opportunities – or recognize the risks of the changing landscape.
As a result, most regions see an imbalance between tenant demands for greener space and the response from real estate markets – evidenced by performance premiums for green buildings relative to conventional buildings in terms of rental rates, occupancy levels, and absorption rates, among other measures. The rising number of firms purchasing carbon credits to offset their greenhouse gas emissions also suggests the supply of green facilities is insufficient to meet their needs. Finally, tenants have spoken most loudly of all through their actions, in effect declaring, “if you won’t build it, then we’ll build it ourselves.” Most green construction has been initiated by corporate or government owner-occupiers – who continue to own green buildings far disproportionate to their share of conventional facilities.
Looking forward, some of the greatest opportunities for investors to leverage emerging global green standards will be in the developing economies of the world due to their faster rates of population and economic growth and relatively unencumbered built environment. Nonetheless, the various factors that inhibit sustainable business practices in these regions cannot be minimized, which will limit near-term opportunities in many nations.
On the other hand, the greater wealth and property investment in the developed world, in conjunction with deeper acceptance of environmental principles, provides more opportunities to improve the sustainability of the standing inventory through retrofits – but also presents perilous risks for failure to move quickly enough to greener standards. In some markets, the shift to sustainability has been so complete that green buildings cannot be thought of as a distinct class of property – it’s already the new standard, certainly for Class A.
Opportunities and risks will vary within regions and among the various types of real estate products and investment vehicles. Properties that offer the greatest benefits to users and owners relative to conventional buildings should see the most rapid transformation, particularly energy-intensive uses (such as high-rise office buildings) and high-profile uses in which tenants have substantial client contact (such as retail centers). Moreover, urban infill sites will be increasingly valued in both developed and emerging economies.
In the capital markets, we expect activity in public equity markets to surge as more sustainable buildings come to market and green product definitions become more standardized. We also anticipate ever-greater participation by private funds, especially in partnership with public pension funds, as the funds and their advisors recognize the fiduciary risks of not greening their portfolios, as well as the opportunities for premium returns through greener buildings.
Prepared By: Andrew J. Nelson Vice President RREEF Research San Francisco USA (415) 262-7735 [email protected]
Report Contents - Executive Summary - Key Findings - Climate Change and the Need to Act - Global Greening Forces - Regional Analysis - Implications for Investors
RREEF Research
ii Real Estate Research
Introduction and Report Overview Real estate investors everywhere are discovering green building – long after major tenants and governments have made it a top priority. In a white paper released last year, RREEF Research drew attention to the sudden recognition of green issues by the institutional property sector in the United States.1 The earlier paper also documented that mainstream real estate investors initially were slow to participate in the green building movement, but that the volume of green construction and retrofits has surged in recent years – and green building in the US has continued unabated since then, despite the sharp drop in overall construction activity.
But how universal are these trends around the world, and what does all this portend for increasingly global real estate investment markets? In this paper, RREEF Research examines the forces affecting property sustainability in major regions around the globe. One perhaps surprising conclusion: Although trade globalization is commonly thought to increase greenhouse gases and pollution generally, in the real estate sector global flows of capital are also encouraging countertrends toward greener property standards. The world’s property markets are increasingly dominated by large multinational investors and developers who transport their technology, knowledge, and business practices from their home markets to regions around the globe, accelerating nascent local sustainability trends.*
Still, considerable regional variation remains in the adoption of sustainable real estate practices. What accounts for these differences, how long are they likely to endure, and what are the implications for real estate investors? In addressing these issues, we provide a substantive foundation for assessing green building activity and potential around the world.
We begin with an overview of the environmental context in which property markets operate globally, including the rising concerns with climate change and real estate’s contribution to greenhouse gas emissions. The property market response to these issues is introduced, leading to a discussion of the global and other economic forces driving toward more sustainable development and operating practices. Particular attention is paid to the role of global actors – among them, investors, environmentalists, and multilateral organizations. After a brief overview of the capital markets for green building, the second half of the paper presents a regional analysis of sustainable building potential based on the key drivers outlined earlier: government, tenants, investors, societal attitudes, the real estate sector, and economic factors. We conclude with a consideration of implications for investors, examining both investment opportunities and risks to portfolio owners today.
With this background in mind, the following are some of the key trends and conclusions we see for global real estate markets:
Key Findings: Global Trends
• Real estate developers and managers are adopting greener business practices in all regions of the world, at all stages of economic development, driven by the favorable financial returns for greener buildings owing to soaring energy and the significant savings afforded by thoughtful green designs or renovations.
• Globalization is reinforcing and accelerating these sustainable property development and operating trends throughout the world, though in developing regions, rapid wealth creation and economic development are simultaneously causing significant growth in energy consumption and greenhouse gas emissions.
• Multi-national corporations and global investment firms are especially important in establishing greener real estate business practices worldwide through their tenancy and investment criteria. These trends are being facilitated by the growing standardization of real estate products throughout the world, as well as falling trade barriers.
* “Sustainable” and “green” are used interchangeably in this paper, although “sustainability” is the preferred term in some regions (especially Europe), while “green” is more common in others (North America and Asia). Moreover, some analysts imbue “sustainable” with social as well as environmental qualities, but unless otherwise noted, “sustainable” in this paper refers only to the more limited environmental features.
Real Estate Research iii
• Major corporate tenants are seeking greener facilities in order to attract and retain workers, differentiate their products, improve their image to consumers, and satisfy shareholder demands, all of which have ties to environmental concerns. Thus, firms increasingly set minimum global energy-efficiency and/or green standards for the buildings they occupy, and these standards often exceed the norm in their local markets.
• Property investors seeking to diversify their portfolios and leverage their expertise and business platforms are looking globally for their acquisitions and developments, propagating sustainability practices as they expand into new regions.
• Greener business practices are also being driven by increasingly prescriptive government regulations. In a growing number of advanced economies, developers must build sustainably due to greener building codes and other complementary policies. At the same time, however, sustainability is being undermined in many emerging economies by heavy government energy subsidies.
• Global international actors such as environmental and green building organizations, investor pressure groups, and multi-lateral institutions, among others, also are playing key roles in driving greener building standards.
Key Findings: Regional Trends
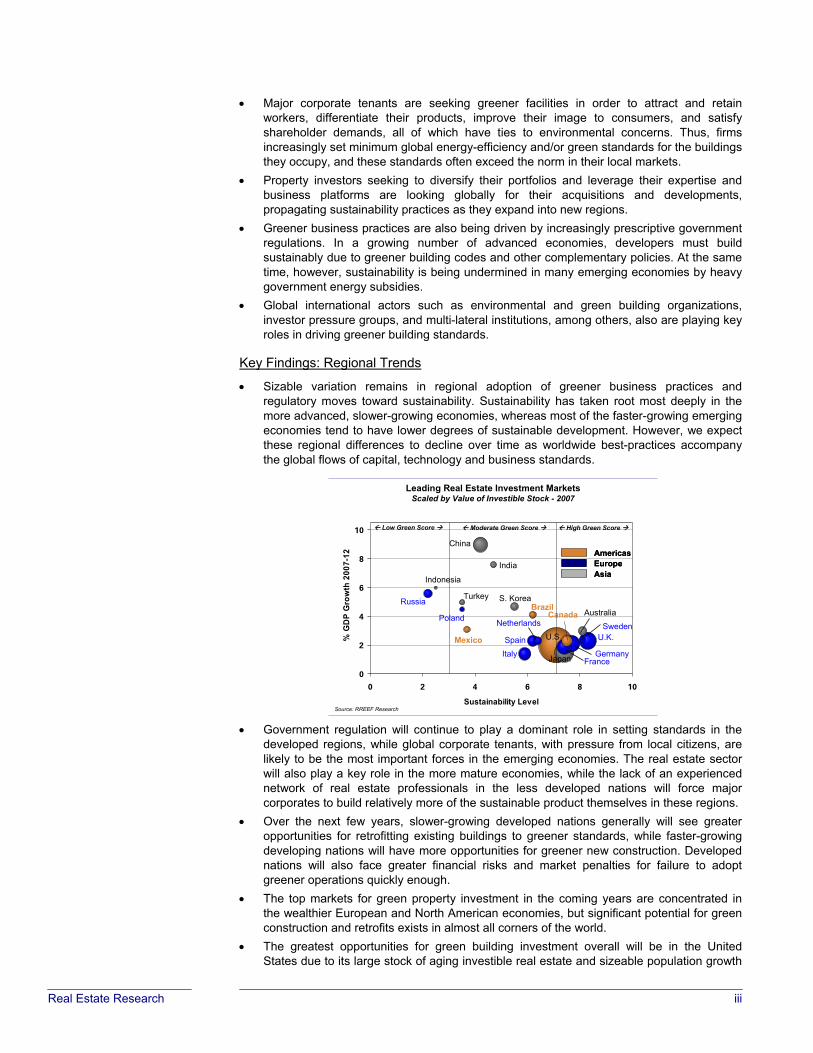
• Sizable variation remains in regional adoption of greener business practices and regulatory moves toward sustainability. Sustainability has taken root most deeply in the more advanced, slower-growing economies, whereas most of the faster-growing emerging economies tend to have lower degrees of sustainable development. However, we expect these regional differences to decline over time as worldwide best-practices accompany the global flows of capital, technology and business standards.
• Government regulation will continue to play a dominant role in setting standards in the developed regions, while global corporate tenants, with pressure from local citizens, are likely to be the most important forces in the emerging economies. The real estate sector will also play a key role in the more mature economies, while the lack of an experienced network of real estate professionals in the less developed nations will force major corporates to build relatively more of the sustainable product themselves in these regions.
• Over the next few years, slower-growing developed nations generally will see greater opportunities for retrofitting existing buildings to greener standards, while faster-growing developing nations will have more opportunities for greener new construction. Developed nations will also face greater financial risks and market penalties for failure to adopt greener operations quickly enough.
• The top markets for green property investment in the coming years are concentrated in the wealthier European and North American economies, but significant potential for green construction and retrofits exists in almost all corners of the world.
• The greatest opportunities for green building investment overall will be in the United States due to its large stock of aging investible real estate and sizeable population growth
Leading Real Estate Investment Markets Scaled by Value of Investible Stock - 2007
0
2
4
6
8
10
0 2 4 6 8 10
Sustainability Level
% G
DP
Gro
wth
200
7-12
Source: RREEF Research
U.S.
Japan
Russia
China
India
S. KoreaBrazil
FranceItaly Germany
U.K.
Australia
Indonesia
SwedenCanada
Netherlands
Spain
Low Green Score Moderate Green Score High Green Score
Turkey
Poland
Mexico
EuropeAmericas
AsiaEuropeAmericas
Asia
iv Real Estate Research
relative to the world’s mature economies, as well as increasing green business practices and rising government mandates. The United Kingdom, Germany, and Japan also rank high for both new construction and retrofits.
• China should see a significant amount of green construction due to its tremendous growth, though the green share of its total construction will be only moderate. Canada and Australia are notable for green building investment opportunities due to the strength of their sustainability commitments, despite relatively limited growth prospects. Outside of these top markets, other leading markets include Brazil, India, and Russia among the “BRIC” nations, as well as France, Spain, and South Korea.
Key Findings: Property and Capital Market Trends
• To date, the vast majority of green building has been initiated, and continues to be owned by, government and corporate owner-occupants. The failure of property markets to provide sufficient green product reflects widespread industry ignorance of tenant demands for greener facilities (underestimated) and actual green construction costs (overstated), as well as risk aversion borne of limited performance data for green buildings.
• The shortage of green building space relative to tenant demand is demonstrated by operating performance premiums for green buildings, as well as by the growing corporate purchases of carbon offsets to reduce their net greenhouse gas emissions – revenue that otherwise could be captured by owners of green buildings, if they were available.
• To the extent that investors are participating in the green building arena, virtually all the activity has been undertaken by private funds, often with the partnership of public pension funds. Investments from public equity markets have been minor, held back by the extremely limited availability of certified green building product for purchase and the lack of common green product definitions throughout the industry.
• Paralleling trends among most institutional investors, pension fund advisors have been slow to recognize the fiduciary importance of green buildings, which has restrained pension fund investments. However, fund advisors in Europe and Australia have recently
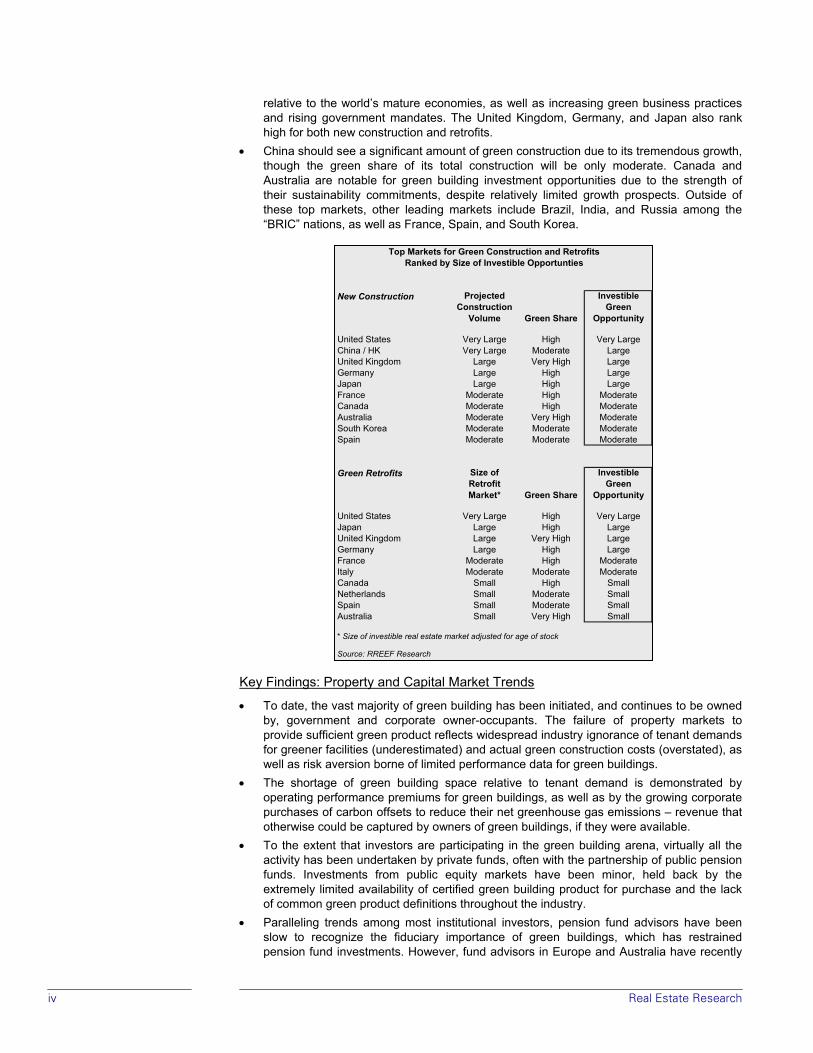
New Construction Projected Construction
Volume Green Share
Investible Green
Opportunity
United States Very Large High Very LargeChina / HK Very Large Moderate LargeUnited Kingdom Large Very High LargeGermany Large High LargeJapan Large High LargeFrance Moderate High ModerateCanada Moderate High ModerateAustralia Moderate Very High ModerateSouth Korea Moderate Moderate ModerateSpain Moderate Moderate Moderate
Green Retrofits Size of Retrofit Market* Green Share
Investible Green
Opportunity
United States Very Large High Very LargeJapan Large High LargeUnited Kingdom Large Very High LargeGermany Large High LargeFrance Moderate High ModerateItaly Moderate Moderate ModerateCanada Small High SmallNetherlands Small Moderate SmallSpain Small Moderate SmallAustralia Small Very High Small
* Size of investible real estate market adjusted for age of stock
Source: RREEF Research
Top Markets for Green Construction and RetrofitsRanked by Size of Investible Opportunties
Real Estate Research v
awakened to the issue, encouraging greater green building investment and greener building operations in these regions.
• In addition to traditional real estate buyers, green building is attracting two overlapping yet distinct groups of investors: “next wave” investors intent on capturing outsized returns by being early to capitalize on green investing; and “social” investors concerned with the societal impacts of their investments. Together these two groups represent significant new sources of real estate capital.
Key Findings: Implications for Investors
• The rapid transformation toward green-only construction in many countries will reward early adopters who gain critical experience and assemble a network of complementary, experienced service providers. These early adopters can capture the (short-term) market premiums offered by green buildings today, and also minimize the risks from holding obsolete buildings in the future.
• With the number of investor-owned green buildings being so small, operating premiums for green buildings are difficult to establish with precision, but studies of operating performance uniformly conclude that green buildings do, in fact, command higher rents and occupancy rates, and achieve other measures of superior market performance. Similarly, green buildings almost certainly trade at a premium relative to conventional buildings (lower capitalization rates), though the even smaller universe of green building sales transactions makes precise value premiums impossible to calculate.
• Urban infill sites will be increasingly valued in both developed and emerging economies. Sustainable design principles favoring re-use of central, accessible sites support worldwide urbanization trends. Transit-friendly properties near worker and population bases will be especially favored over more remote greenfield sites.
• Opportunities for investments from public equity markets should surge as more green building product comes to market for purchase and green product definitions become more standardized. The growing market acceptance of LEED and BREEAM as industry standards in more countries should help in this regard.
• The biggest move to green buildings will be in the properties that: (1) confer the greatest benefits to users and owners relative to conventional buildings, (2) align landlord and tenant interests in the property, and (3) offer tangible benefits that matter to tenants. Thus, Class A office buildings will experience the most market penetration by green product, and lower-end industrial the least. Retail will experience the next largest gain in green product.
• At least three major types of risk are material to investors: market (rising green standards will make inefficient buildings increasingly obsolete over time); regulatory (governments may quickly alter the playing field and cost/benefit calculations); and environmental (physical damages attributable to climate change). Each will present challenges to owners that fail to adapt quickly to new standards, and threaten reversion values.
• Markets will be flipping from a premium for green buildings to a discount for obsolete construction, with the pace in individual regions depending upon the amount of construction relative to the standing stock, the strength of tenant preferences for greener space, and the extent of government penalties on energy inefficiency, among other factors. Supply-constrained markets with significant barriers to entry will be protected longer than more dynamic, faster-growing markets. But in many markets – particularly the most desirable markets for tenants and investors in Northern Europe, Asia, and North America – the tipping point should be well within the traditional ten-year institutional hold period for investment real estate, and thus should enter investment criteria today.
• The immediate risks are to older, inefficient buildings, whose obsolescence will be reflected in diminished performance potential (lower rents and occupancy rates) and property value (equal to the cost to cure to the new market standard). Longer term, the risk will shift more broadly to institutions slow to change and cultivate the competency required to convert to more sustainable buildings.
Real Estate Research
Table of Contents Executive Summary i Introduction and Report Overview ii Climate Change and the Need to Act 1
The Role of the Built Environment 2 The Real Estate Response 3
Global Greening Forces – Primary Drivers 5
Tenant Demand 6 Green and Socially Responsible Investing 8 The Rise of Global Real Estate Players and Global Capital Flows 9 The Environmental Movement and Multilateral Change Agents 10 The Role of Government 11 The Business Case 12 The Role of Globalization Reconsidered 13
Green Building Markets 14 Regional Analysis 15
Overview of Findings 15 Summary Regional Conclusions 18
Implications for Investors 22
Market Opportunities 23 Risk Mitigation 24 Product Types 25
Appendix A: Data Description and Sources for Regional Analysis 26 Endnotes 29
Real Estate Research 1
Climate Change and the Need to Act The past few years have seen global warming jump from the obscurity of science journals to the front pages of newspapers, and ultimately to their financial pages, as environmental concerns emerged as one of the top business stories of the era. That is, until this year, when surging energy prices came to dominate the concerns of consumers and businesses alike.
The two are strongly linked: The soaring price of oil is at least partly due to the swelling global demand for energy, particularly from developing nations. And the price rises almost certainty will continue, notwithstanding the recent easing in prices. The latest World Energy Outlook from the International Energy Agency concluded that the world’s primary energy needs are “projected to grow by 55% between 2005 and 2030, at an average annual rate of 1.8% per year.”2 A study by the McKinsey Global Institute sees even faster energy demand growth of 2.2% annually through 2020, absent corrective action.3 Concerns over unchecked energy demand, as well as unprecedented energy prices, underscore calls for energy usage to be tamed through greater energy efficiency and other measures.
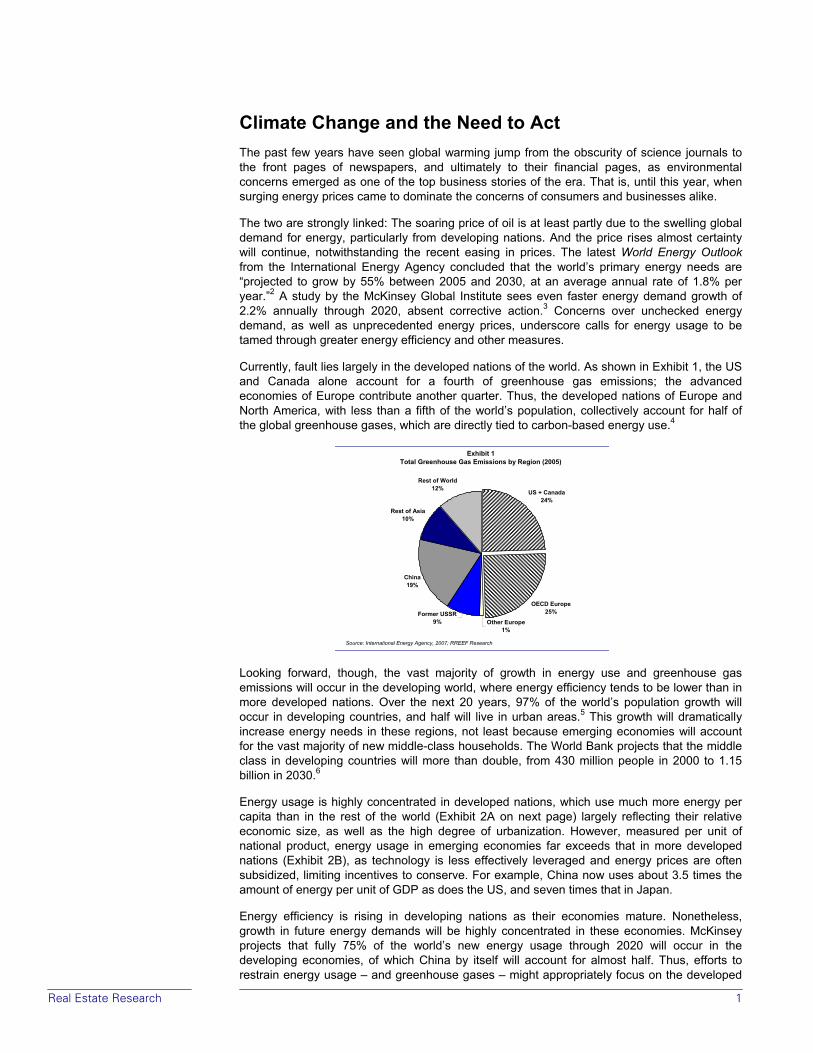
Currently, fault lies largely in the developed nations of the world. As shown in Exhibit 1, the US and Canada alone account for a fourth of greenhouse gas emissions; the advanced economies of Europe contribute another quarter. Thus, the developed nations of Europe and North America, with less than a fifth of the world’s population, collectively account for half of the global greenhouse gases, which are directly tied to carbon-based energy use.4
Looking forward, though, the vast majority of growth in energy use and greenhouse gas emissions will occur in the developing world, where energy efficiency tends to be lower than in more developed nations. Over the next 20 years, 97% of the world’s population growth will occur in developing countries, and half will live in urban areas.5 This growth will dramatically increase energy needs in these regions, not least because emerging economies will account for the vast majority of new middle-class households. The World Bank projects that the middle class in developing countries will more than double, from 430 million people in 2000 to 1.15 billion in 2030.6
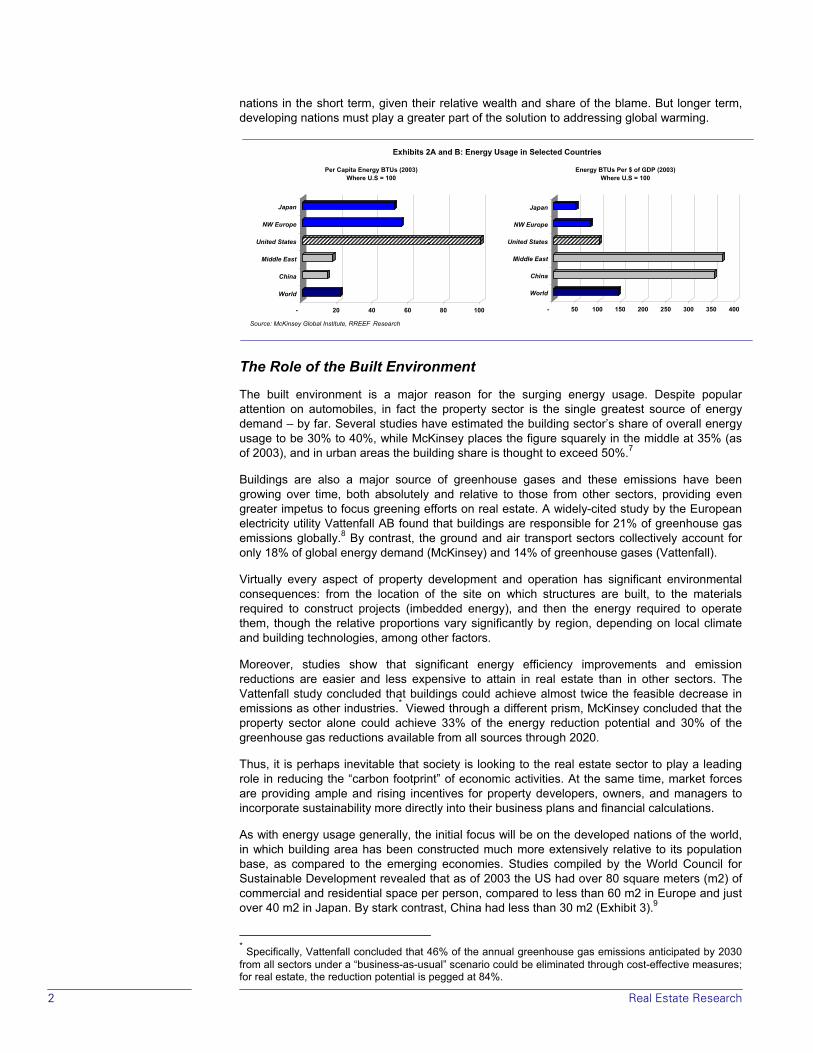
Energy usage is highly concentrated in developed nations, which use much more energy per capita than in the rest of the world (Exhibit 2A on next page) largely reflecting their relative economic size, as well as the high degree of urbanization. However, measured per unit of national product, energy usage in emerging economies far exceeds that in more developed nations (Exhibit 2B), as technology is less effectively leveraged and energy prices are often subsidized, limiting incentives to conserve. For example, China now uses about 3.5 times the amount of energy per unit of GDP as does the US, and seven times that in Japan.
Energy efficiency is rising in developing nations as their economies mature. Nonetheless, growth in future energy demands will be highly concentrated in these economies. McKinsey projects that fully 75% of the world’s new energy usage through 2020 will occur in the developing economies, of which China by itself will account for almost half. Thus, efforts to restrain energy usage – and greenhouse gases – might appropriately focus on the developed
Exhibit 1Total Greenhouse Gas Emissions by Region (2005)
US + Canada24%
OECD Europe25%
Other Europe1%
Former USSR9%
China19%
Rest of Asia10%
Rest of World12%
Source: International Energy Agency, 2007; RREEF Research
2 Real Estate Research
nations in the short term, given their relative wealth and share of the blame. But longer term, developing nations must play a greater part of the solution to addressing global warming.
Exhibits 2A and B: Energy Usage in Selected Countries
- 20 40 60 80 100
World
China
Middle East
United States
NW Europe
Japan
Per Capita Energy BTUs (2003)Where U.S = 100
Source: McKinsey Global Institute, RREEF Research
- 50 100 150 200 250 300 350 400
World
China
Middle East
United States
NW Europe
Japan
Energy BTUs Per $ of GDP (2003)Where U.S = 100
The Role of the Built Environment
The built environment is a major reason for the surging energy usage. Despite popular attention on automobiles, in fact the property sector is the single greatest source of energy demand – by far. Several studies have estimated the building sector’s share of overall energy usage to be 30% to 40%, while McKinsey places the figure squarely in the middle at 35% (as of 2003), and in urban areas the building share is thought to exceed 50%.7
Buildings are also a major source of greenhouse gases and these emissions have been growing over time, both absolutely and relative to those from other sectors, providing even greater impetus to focus greening efforts on real estate. A widely-cited study by the European electricity utility Vattenfall AB found that buildings are responsible for 21% of greenhouse gas emissions globally.8 By contrast, the ground and air transport sectors collectively account for only 18% of global energy demand (McKinsey) and 14% of greenhouse gases (Vattenfall).
Virtually every aspect of property development and operation has significant environmental consequences: from the location of the site on which structures are built, to the materials required to construct projects (imbedded energy), and then the energy required to operate them, though the relative proportions vary significantly by region, depending on local climate and building technologies, among other factors.
Moreover, studies show that significant energy efficiency improvements and emission reductions are easier and less expensive to attain in real estate than in other sectors. The Vattenfall study concluded that buildings could achieve almost twice the feasible decrease in emissions as other industries.* Viewed through a different prism, McKinsey concluded that the property sector alone could achieve 33% of the energy reduction potential and 30% of the greenhouse gas reductions available from all sources through 2020.
Thus, it is perhaps inevitable that society is looking to the real estate sector to play a leading role in reducing the “carbon footprint” of economic activities. At the same time, market forces are providing ample and rising incentives for property developers, owners, and managers to incorporate sustainability more directly into their business plans and financial calculations.
As with energy usage generally, the initial focus will be on the developed nations of the world, in which building area has been constructed much more extensively relative to its population base, as compared to the emerging economies. Studies compiled by the World Council for Sustainable Development revealed that as of 2003 the US had over 80 square meters (m2) of commercial and residential space per person, compared to less than 60 m2 in Europe and just over 40 m2 in Japan. By stark contrast, China had less than 30 m2 (Exhibit 3).9
* Specifically, Vattenfall concluded that 46% of the annual greenhouse gas emissions anticipated by 2030 from all sectors under a “business-as-usual” scenario could be eliminated through cost-effective measures; for real estate, the reduction potential is pegged at 84%.
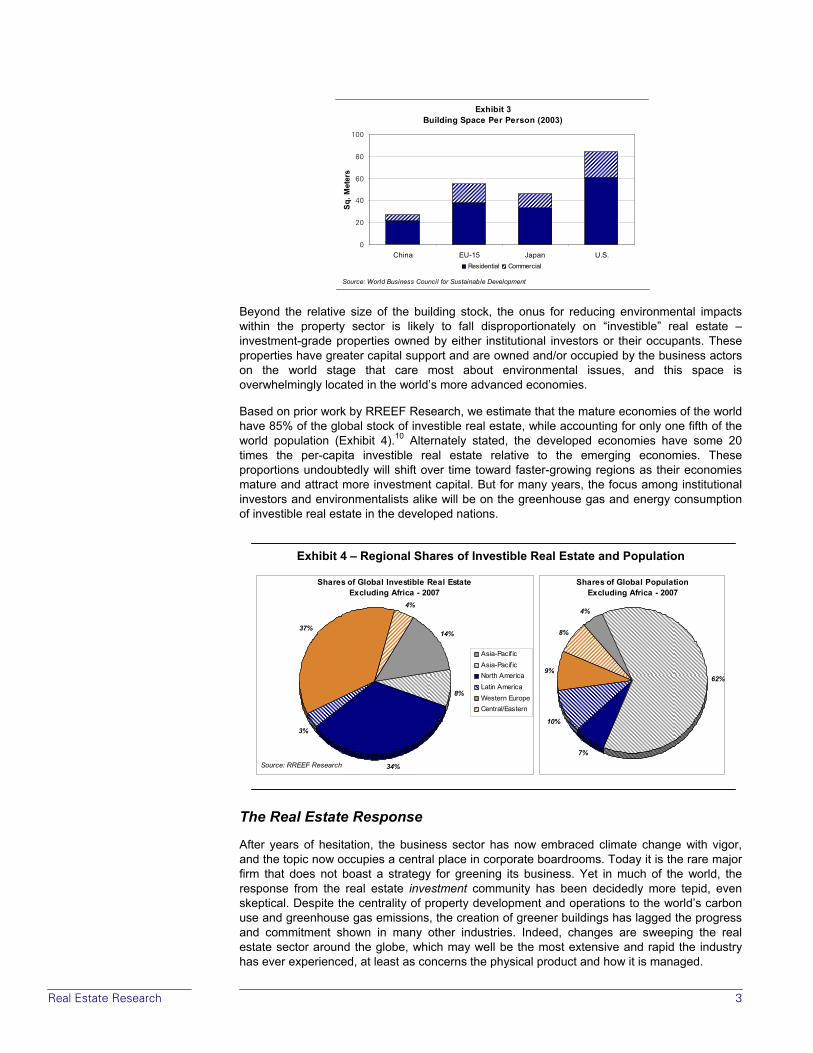
Real Estate Research 3
Beyond the relative size of the building stock, the onus for reducing environmental impacts within the property sector is likely to fall disproportionately on “investible” real estate – investment-grade properties owned by either institutional investors or their occupants. These properties have greater capital support and are owned and/or occupied by the business actors on the world stage that care most about environmental issues, and this space is overwhelmingly located in the world’s more advanced economies.
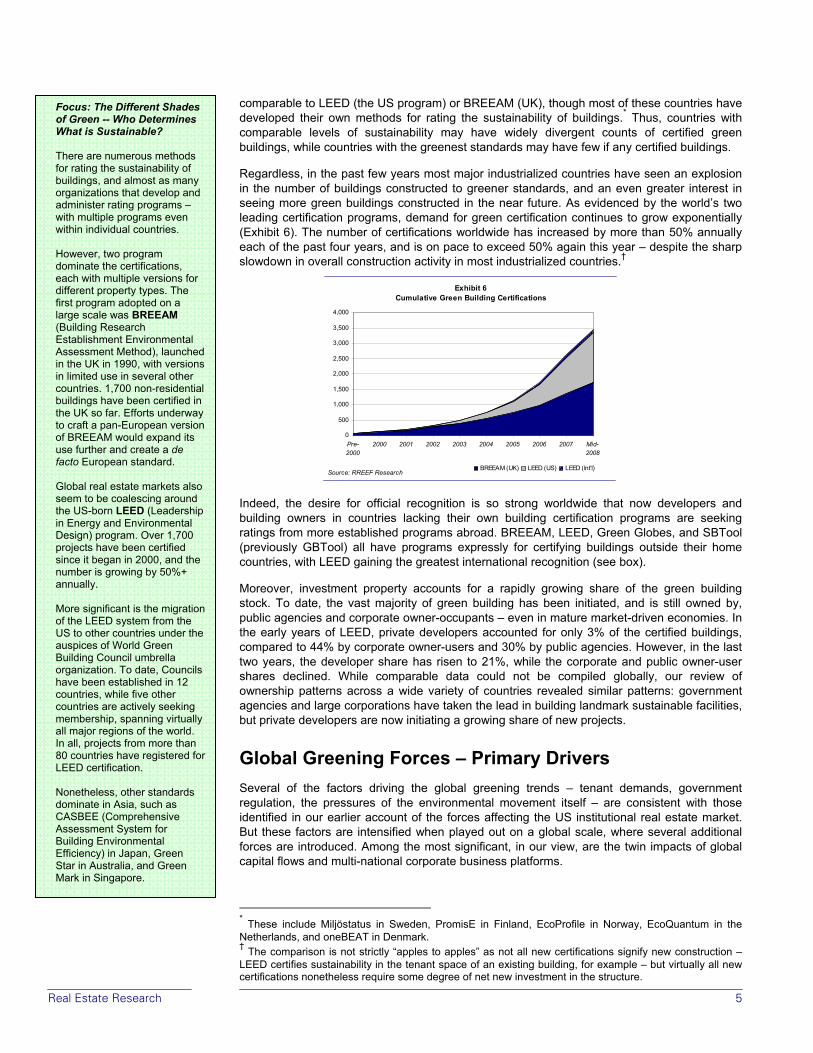
Based on prior work by RREEF Research, we estimate that the mature economies of the world have 85% of the global stock of investible real estate, while accounting for only one fifth of the world population (Exhibit 4).10 Alternately stated, the developed economies have some 20 times the per-capita investible real estate relative to the emerging economies. These proportions undoubtedly will shift over time toward faster-growing regions as their economies mature and attract more investment capital. But for many years, the focus among institutional investors and environmentalists alike will be on the greenhouse gas and energy consumption of investible real estate in the developed nations.
Exhibit 4 – Regional Shares of Investible Real Estate and Population
The Real Estate Response
After years of hesitation, the business sector has now embraced climate change with vigor, and the topic now occupies a central place in corporate boardrooms. Today it is the rare major firm that does not boast a strategy for greening its business. Yet in much of the world, the response from the real estate investment community has been decidedly more tepid, even skeptical. Despite the centrality of property development and operations to the world’s carbon use and greenhouse gas emissions, the creation of greener buildings has lagged the progress and commitment shown in many other industries. Indeed, changes are sweeping the real estate sector around the globe, which may well be the most extensive and rapid the industry has ever experienced, at least as concerns the physical product and how it is managed.
Exhibit 3Building Space Per Person (2003)
0
20
40
60
80
100
China EU-15 Japan U.S.
Sq. M
eter
s
Residential Commercial
Source: World Business Council for Sustainable Development
Shares of Global Investible Real EstateExcluding Africa - 2007
14%
8%
34%
3%
37%
4%
Asia-Pacif icAsia-Pacif icNorth AmericaLatin AmericaWestern EuropeCentral/Eastern
Source: RREEF Research
Shares of Global PopulationExcluding Africa - 2007
4%
62%
7%
10%
9%
8%

4 Real Estate Research
The green building movement has taken hold to a greater or lesser degree in all corners of the world, from Canada and Scandinavia in the north, to Australia and New Zealand in the south, and from the United States and Europe in the west to Japan and China in the east. To be sure, the extent and pace of adoption varies considerably among and even within regions, with the wealthiest, more developed, nations typically exhibiting greater commitment to sustainable property development and operations. Still, our review of property development patterns around the world shows that the principles of sustainability are finding widespread and growing application even in much less affluent countries.
Nonetheless, documenting the extent of green building development across the globe defies simple quantification or categorization. For one thing, the standards and approaches to defining green buildings vary widely from one country to another, and multiple certification schemas exist simultaneously even within countries. Interregional comparisons are also complicated by variations in climates and local building materials, so that building standards that may be suitable in one country may be wildly inappropriate in another.
Meaningful building counts are also elusive because most green certification programs have been adopted only in the last few years – well after the industry began constructing more sustainable projects, and many owners resist the expense of seeking certifications retroactively. Lastly, not all countries are equally concerned with “keeping score.” In fact, only two nations, the United Kingdom and the United States, have a large number of certifications, while only a handful of others pursue certifications with any great enthusiasm (Exhibit 5).*
To be sure, many thousands of buildings have been rated in other countries using a variety of systems. Sweden’s Miljöstatus (“Environmental Status”) program has rated well over 2,000 buildings, while several cities in Japan together have seen ratings over 2,000 buildings using the CASBEE system (though only 27 have been awarded a true CASBEE certification). But the vast majority of these ratings are geared toward either assisting with building design by assessing alternative approaches during the development phase, or gauging energy use during operations, as opposed to rewarding excellent design once the building is completed.
On the other hand, many countries, even those practicing high levels of sustainability, do not have formal certification programs. Most prominent is Germany, which for over a generation has maintained among the highest sustainable building standards in the world.11 Yet the German property sector did not form an association to certify building sustainability until 2007, and released its certification program only in June of this year (the “Made in Germany” label from the Deutsche Gesellschaft für Nachhaltiges Bauen or DGNB). Other northern European countries, especially the Scandinavian nations, have similarly strict energy efficiency and sustainability standards as part of their building codes, but no green certification infrastructure
* This chart is based on building design certification programs widely recognized in the real estate investment community. Programs included are: BREEAM (both UK and non-UK), LEED (US and non-US), HQE (France), Green Mark (Singapore), GBTool (multiple countries), GreenStar (Australia), and CASBEE (Japan). The analysis excludes self-assessment programs (e.g., Green Globes) and rating systems more oriented to assessing building performance for design (e.g., EcoPofile or oneBEAT) or regulatory compliance (local CASBEE ratings). Ratings of individual homes are also excluded.
Focus: Just What is a “Green Building”? There is no broad agreement within the real estate community on the definition of a “green” or “sustainable” building (used interchangeably in this paper). However, most experts agree on certain fundamentals. Among the common building features:
• Efficient use of national resources, particularly energy and water, and limited on-site waste, such as effluents and trash.
• Use of locally-produced materials to reflect local climatic conditions and materials, and to reduce the energy required to transport building materials to the project site.
• Limited impacts on surroundings (e.g., lower greenhouse gas emissions than conventional buildings) and on those who use the building (e.g., reduced worker illnesses).
• Integrated building design and operations based on life-cycle costs, which reflect the cost of the building over its entire life span rather than just “first” costs.
• Location near population centers and/or transit hubs to reduce commutes and associated energy usage.
• Building operations are as important as the design in defining a green building; even the greenest design can be undone by inefficient building operations. A critical step is commissioning the building to fine-tune system operations.
Together these factors can dramatically lower utility usage and expenses, and even increase greater worker productivity, which is why green buildings are often referred to as “high-performance” buildings.
Exhibit 5"Certified" Green Buildings
Excluding Individual Homes - Mid 2008
40%
8%
9%
43%
BREEAM (UK) LEED (US) Other LEED All OthersSource: RREEF Research
Real Estate Research 5
comparable to LEED (the US program) or BREEAM (UK), though most of these countries have developed their own methods for rating the sustainability of buildings.* Thus, countries with comparable levels of sustainability may have widely divergent counts of certified green buildings, while countries with the greenest standards may have few if any certified buildings.
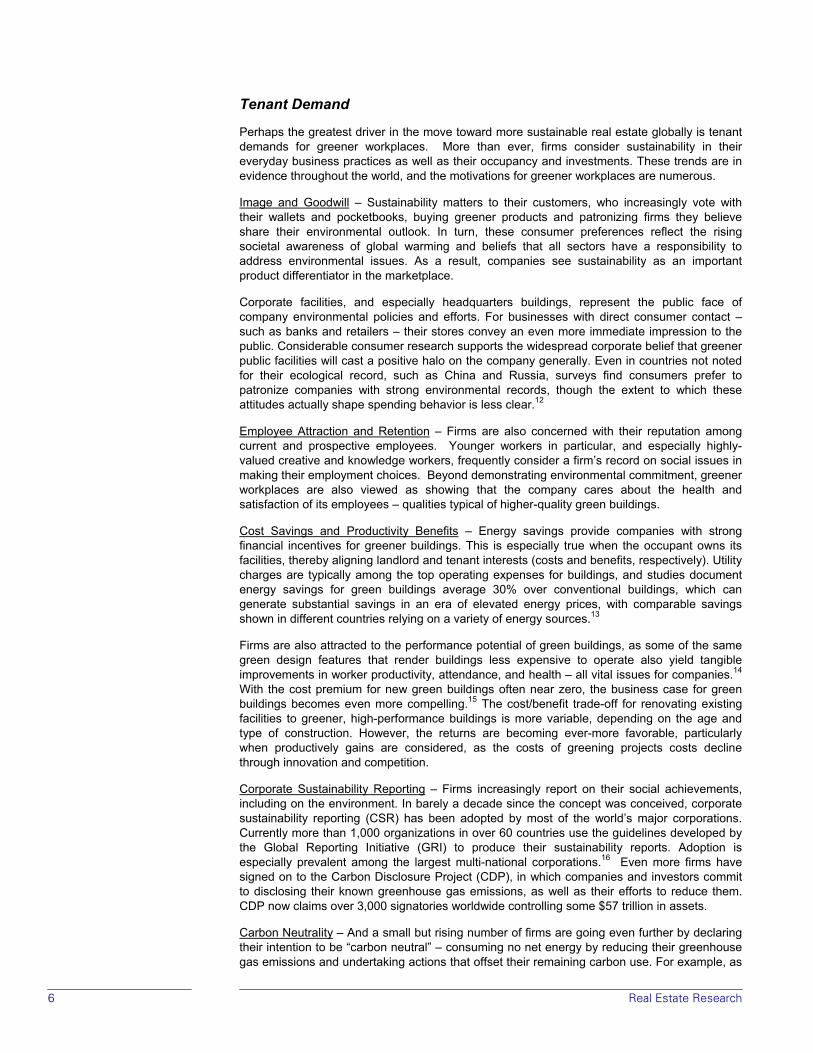
Regardless, in the past few years most major industrialized countries have seen an explosion in the number of buildings constructed to greener standards, and an even greater interest in seeing more green buildings constructed in the near future. As evidenced by the world’s two leading certification programs, demand for green certification continues to grow exponentially (Exhibit 6). The number of certifications worldwide has increased by more than 50% annually each of the past four years, and is on pace to exceed 50% again this year – despite the sharp slowdown in overall construction activity in most industrialized countries.†
Indeed, the desire for official recognition is so strong worldwide that now developers and building owners in countries lacking their own building certification programs are seeking ratings from more established programs abroad. BREEAM, LEED, Green Globes, and SBTool (previously GBTool) all have programs expressly for certifying buildings outside their home countries, with LEED gaining the greatest international recognition (see box).
Moreover, investment property accounts for a rapidly growing share of the green building stock. To date, the vast majority of green building has been initiated, and is still owned by, public agencies and corporate owner-occupants – even in mature market-driven economies. In the early years of LEED, private developers accounted for only 3% of the certified buildings, compared to 44% by corporate owner-users and 30% by public agencies. However, in the last two years, the developer share has risen to 21%, while the corporate and public owner-user shares declined. While comparable data could not be compiled globally, our review of ownership patterns across a wide variety of countries revealed similar patterns: government agencies and large corporations have taken the lead in building landmark sustainable facilities, but private developers are now initiating a growing share of new projects.
Global Greening Forces – Primary Drivers Several of the factors driving the global greening trends – tenant demands, government regulation, the pressures of the environmental movement itself – are consistent with those identified in our earlier account of the forces affecting the US institutional real estate market. But these factors are intensified when played out on a global scale, where several additional forces are introduced. Among the most significant, in our view, are the twin impacts of global capital flows and multi-national corporate business platforms.
* These include Miljöstatus in Sweden, PromisE in Finland, EcoProfile in Norway, EcoQuantum in the Netherlands, and oneBEAT in Denmark. † The comparison is not strictly “apples to apples” as not all new certifications signify new construction – LEED certifies sustainability in the tenant space of an existing building, for example – but virtually all new certifications nonetheless require some degree of net new investment in the structure.
Focus: The Different Shades of Green -- Who Determines What is Sustainable? There are numerous methods for rating the sustainability of buildings, and almost as many organizations that develop and administer rating programs – with multiple programs even within individual countries. However, two program dominate the certifications, each with multiple versions for different property types. The first program adopted on a large scale was BREEAM (Building Research Establishment Environmental Assessment Method), launched in the UK in 1990, with versions in limited use in several other countries. 1,700 non-residential buildings have been certified in the UK so far. Efforts underway to craft a pan-European version of BREEAM would expand its use further and create a de facto European standard. Global real estate markets also seem to be coalescing around the US-born LEED (Leadership in Energy and Environmental Design) program. Over 1,700 projects have been certified since it began in 2000, and the number is growing by 50%+ annually. More significant is the migration of the LEED system from the US to other countries under the auspices of World Green Building Council umbrella organization. To date, Councils have been established in 12 countries, while five other countries are actively seeking membership, spanning virtually all major regions of the world. In all, projects from more than 80 countries have registered for LEED certification. Nonetheless, other standards dominate in Asia, such as CASBEE (Comprehensive Assessment System for Building Environmental Efficiency) in Japan, Green Star in Australia, and Green Mark in Singapore.
Exhibit 6Cumulative Green Building Certifications
0
500
1,000
1,500
2,000
2,500
3,000
3,500
4,000
Pre-2000
2000 2001 2002 2003 2004 2005 2006 2007 Mid-2008
BREEAM (UK) LEED (US) LEED (Int'l)Source: RREEF Research
6 Real Estate Research
Tenant Demand
Perhaps the greatest driver in the move toward more sustainable real estate globally is tenant demands for greener workplaces. More than ever, firms consider sustainability in their everyday business practices as well as their occupancy and investments. These trends are in evidence throughout the world, and the motivations for greener workplaces are numerous.
Image and Goodwill – Sustainability matters to their customers, who increasingly vote with their wallets and pocketbooks, buying greener products and patronizing firms they believe share their environmental outlook. In turn, these consumer preferences reflect the rising societal awareness of global warming and beliefs that all sectors have a responsibility to address environmental issues. As a result, companies see sustainability as an important product differentiator in the marketplace.
Corporate facilities, and especially headquarters buildings, represent the public face of company environmental policies and efforts. For businesses with direct consumer contact – such as banks and retailers – their stores convey an even more immediate impression to the public. Considerable consumer research supports the widespread corporate belief that greener public facilities will cast a positive halo on the company generally. Even in countries not noted for their ecological record, such as China and Russia, surveys find consumers prefer to patronize companies with strong environmental records, though the extent to which these attitudes actually shape spending behavior is less clear.12
Employee Attraction and Retention – Firms are also concerned with their reputation among current and prospective employees. Younger workers in particular, and especially highly-valued creative and knowledge workers, frequently consider a firm’s record on social issues in making their employment choices. Beyond demonstrating environmental commitment, greener workplaces are also viewed as showing that the company cares about the health and satisfaction of its employees – qualities typical of higher-quality green buildings.
Cost Savings and Productivity Benefits – Energy savings provide companies with strong financial incentives for greener buildings. This is especially true when the occupant owns its facilities, thereby aligning landlord and tenant interests (costs and benefits, respectively). Utility charges are typically among the top operating expenses for buildings, and studies document energy savings for green buildings average 30% over conventional buildings, which can generate substantial savings in an era of elevated energy prices, with comparable savings shown in different countries relying on a variety of energy sources.13
Firms are also attracted to the performance potential of green buildings, as some of the same green design features that render buildings less expensive to operate also yield tangible improvements in worker productivity, attendance, and health – all vital issues for companies.14 With the cost premium for new green buildings often near zero, the business case for green buildings becomes even more compelling.15 The cost/benefit trade-off for renovating existing facilities to greener, high-performance buildings is more variable, depending on the age and type of construction. However, the returns are becoming ever-more favorable, particularly when productively gains are considered, as the costs of greening projects costs decline through innovation and competition.
Corporate Sustainability Reporting – Firms increasingly report on their social achievements, including on the environment. In barely a decade since the concept was conceived, corporate sustainability reporting (CSR) has been adopted by most of the world’s major corporations. Currently more than 1,000 organizations in over 60 countries use the guidelines developed by the Global Reporting Initiative (GRI) to produce their sustainability reports. Adoption is especially prevalent among the largest multi-national corporations.16 Even more firms have signed on to the Carbon Disclosure Project (CDP), in which companies and investors commit to disclosing their known greenhouse gas emissions, as well as their efforts to reduce them. CDP now claims over 3,000 signatories worldwide controlling some $57 trillion in assets.
Carbon Neutrality – And a small but rising number of firms are going even further by declaring their intention to be “carbon neutral” – consuming no net energy by reducing their greenhouse gas emissions and undertaking actions that offset their remaining carbon use. For example, as
Real Estate Research 7
of 2007, 28 firms in the FTSE All Share Index were seeking carbon neutrality. Though these firms represent only 5% of the 557 FTSE All-Share companies, they account for over a quarter of the FTSE All-Share’s total market capitalization. In other words, “larger companies are much more likely to be pursuing carbon neutrality.”17 The number of such firms nearly doubled from 15 in 2006, and continues to increase, both in Europe and around the globe.
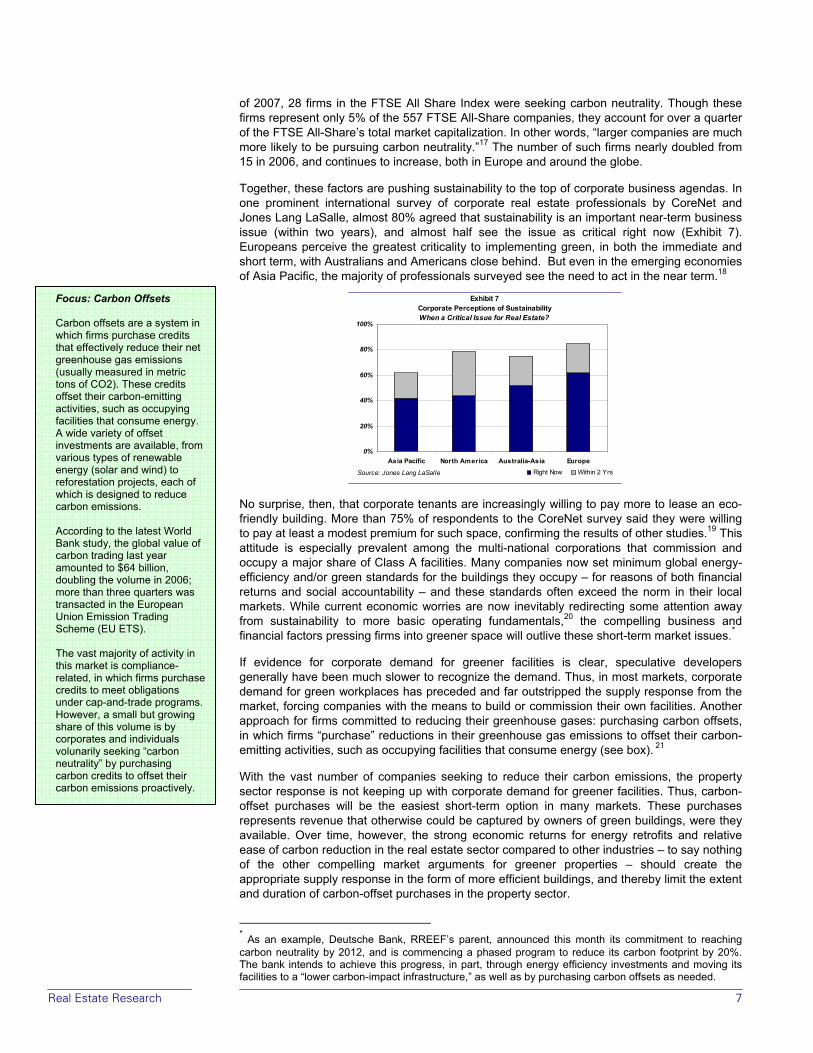
Together, these factors are pushing sustainability to the top of corporate business agendas. In one prominent international survey of corporate real estate professionals by CoreNet and Jones Lang LaSalle, almost 80% agreed that sustainability is an important near-term business issue (within two years), and almost half see the issue as critical right now (Exhibit 7). Europeans perceive the greatest criticality to implementing green, in both the immediate and short term, with Australians and Americans close behind. But even in the emerging economies of Asia Pacific, the majority of professionals surveyed see the need to act in the near term.18
No surprise, then, that corporate tenants are increasingly willing to pay more to lease an eco-friendly building. More than 75% of respondents to the CoreNet survey said they were willing to pay at least a modest premium for such space, confirming the results of other studies.19 This attitude is especially prevalent among the multi-national corporations that commission and occupy a major share of Class A facilities. Many companies now set minimum global energy-efficiency and/or green standards for the buildings they occupy – for reasons of both financial returns and social accountability – and these standards often exceed the norm in their local markets. While current economic worries are now inevitably redirecting some attention away from sustainability to more basic operating fundamentals,20 the compelling business and financial factors pressing firms into greener space will outlive these short-term market issues.*
If evidence for corporate demand for greener facilities is clear, speculative developers generally have been much slower to recognize the demand. Thus, in most markets, corporate demand for green workplaces has preceded and far outstripped the supply response from the market, forcing companies with the means to build or commission their own facilities. Another approach for firms committed to reducing their greenhouse gases: purchasing carbon offsets, in which firms “purchase” reductions in their greenhouse gas emissions to offset their carbon-emitting activities, such as occupying facilities that consume energy (see box). 21
With the vast number of companies seeking to reduce their carbon emissions, the property sector response is not keeping up with corporate demand for greener facilities. Thus, carbon-offset purchases will be the easiest short-term option in many markets. These purchases represents revenue that otherwise could be captured by owners of green buildings, were they available. Over time, however, the strong economic returns for energy retrofits and relative ease of carbon reduction in the real estate sector compared to other industries – to say nothing of the other compelling market arguments for greener properties – should create the appropriate supply response in the form of more efficient buildings, and thereby limit the extent and duration of carbon-offset purchases in the property sector.
* As an example, Deutsche Bank, RREEF’s parent, announced this month its commitment to reaching carbon neutrality by 2012, and is commencing a phased program to reduce its carbon footprint by 20%. The bank intends to achieve this progress, in part, through energy efficiency investments and moving its facilities to a “lower carbon-impact infrastructure,” as well as by purchasing carbon offsets as needed.
Focus: Carbon Offsets Carbon offsets are a system in which firms purchase credits that effectively reduce their net greenhouse gas emissions (usually measured in metric tons of CO2). These credits offset their carbon-emitting activities, such as occupying facilities that consume energy. A wide variety of offset investments are available, from various types of renewable energy (solar and wind) to reforestation projects, each of which is designed to reduce carbon emissions. According to the latest World Bank study, the global value of carbon trading last year amounted to $64 billion, doubling the volume in 2006; more than three quarters was transacted in the European Union Emission Trading Scheme (EU ETS). The vast majority of activity in this market is compliance-related, in which firms purchase credits to meet obligations under cap-and-trade programs. However, a small but growing share of this volume is by corporates and individuals volunarily seeking “carbon neutrality” by purchasing carbon credits to offset their carbon emissions proactively.
Exhibit 7Corporate Perceptions of SustainabilityWhen a Critical Issue for Real Estate?
0%
20%
40%
60%
80%
100%
Asia Pacific North America Australia-Asia EuropeRight Now Within 2 YrsSource: Jones Lang LaSalle
8 Real Estate Research
Green and Socially Responsible Investing
In addition to traditional real estate buyers, green building is attracting the attention of two other overlapping yet distinct groups of investors. First are the “next wave” investors intent on capturing outsized returns by being early to identify and capitalize on the next big investment trend, in this case, green investing. While there is no universally-accepted definition for “green investing,” the category typically includes alternative energies and clean technology, as well as sustainable property development. The United Nations estimates that almost $150 billion of new money was raised globally in 2007 for investment in sustainable energy, a 60% rise over 2006; total transactions in sustainable energy, including acquisitions, amounted to almost $205 billion.22 More significantly, the UN expects investments will reach $450 billion annually within five years, and $600 billion by 2020.
The other camp interested in green building is the “social” investors, a burgeoning group concerned with the impacts of their investments, in addition to their returns. Referred to generically as Socially Responsible Investing (SRI), and to Responsible Property Investing (RPI) when focused on the real estate sector, adherents look at the “triple bottom line” that tracks environmental and social impacts, as well as the traditional financial returns. This market amounts to over $4.0 trillion in assets just in the US and Europe; the extent of SRI investing within Asia is still modest, however.23 In sum, SRI is thought to account for more than 10% of total assets invested in Europe and the US, and is growing rapidly, both absolutely and relative to all investments. A new survey of major asset managers controlling almost $20 trillion in assets predicts a 35% increase in responsible investment over the next two years24 (though it should be emphasized that this survey was conducted prior to the most recent spike in credit market turmoil, which could blunt or delay these trends until the markets stabilize).
Despite its reputation for being the province of only socially-conscious investors, in fact SRI is dominated by institutional investors and high net-worth individuals (HNWIs), who together control more than 70% of the SRI assets under management in the US, and 94% of the SRI assets in Europe. Environmental concerns rank among the top issues for SRI investors. So green investing is well positioned to appeal to both “next wave” and “social” investors.
Nor is SRI is confined to the developed economies. A recent global survey found that 12% of HNWIs worldwide allocate at least part of their investment portfolio to green investing. The greatest percentage of investors going green were found in the Middle East (20%) and Europe (17%), followed by Latin America (15%) and then Asia (13%). By far the lowest participation was found in North America, where only 5% of HNWIs allocated part of their portfolio holdings to green investing.25
The Capital Market Response
The capital markets have responded as well. Several organizations now help investors screen their investments (see box). And numerous investment firms now focus on green and other types of SRI investments, providing opportunities for social investors to channel their capital according to their specific moral principles. Long-standing players in this space include Calvert Group, Domini Social Investments, and Innovest Strategic Value Advisors in the US, The Ethical Funds Company in Canada, and Barchester Green and Sustainable Asset Management (SAM) Group in Europe.
Also significant in this realm is the increasing social activism practiced by mainstream institutional investors. RPI is becoming especially common with public pension funds, which account for a huge share of real estate ownership worldwide. In Western Europe, Australia, and elsewhere, many major pension funds include sustainability principles among their core investment criteria and strategy.26 The advisors that select and evaluate the investment firms that acquire and manage real estate on behalf of pension funds are now starting to consider sustainability in the process. Industry leaders such as Hermes Real Estate, PruPIM, and Morley, all UK-based investment managers, Kennedy Associates in the US, Dutch-based ING Real Estate, and Investa Funds Management based in Australia, all highlight their sustainability record as key operating attributes.27
Focus: Measuring Sustainability for SRI Responding to investor desires to screen their investments, several independent organizations have emerged in recent years – GES Investment Services, Vigeo, and Ethical Investment Research Services (EIRIS) in Europe, KLD Research & Analytics and Ceres in the United States, and the Sustainable Investment Research Institute (SIRIS) in Australia – each with their own methods for rating companies, though little as yet is focused on property firms. Also facilitating SRI investing are stock indices that set minimum sustainability measures for listed companies. Among the most prominent are the FTSE4Good Index Series and the Dow Jones Sustainability Group (DJSG) Index. Much like the more prominent Dow Jones Industrial Index or the Nikkei 225, public companies covet inclusion on social responsibility indexes for the exposure and prestige conferred among the corporations listed. Being listed on such an index opens the company up to a distinct and growing group of investors, which alone provides incentives for firms to adopt more sustainable business practices. Again, as yet few real estate firms qualify for these listings.
Real Estate Research 9
Moreover, the staff making investment decisions and board members setting policies for the pension funds are subject to the same societal forces propelling socially-conscious investing generally – plan participants want to feel good about the uses to which their capital are devoted. In some countries pension funds are required by law (e.g., the Netherlands and Sweden) or board policy (e.g., California) to consider social and environmental issues in their investment decisions and policies; other countries have disclosure regulations requiring pension funds to state the extent to which social, environmental and ethical criteria are part of their investment decisions (e.g., Belgium, Germany, France, Sweden and the UK).
In turn, these institutional investors – who control vast sums of investment capital – pressure companies to adopt greener business practices, through “engagement” (dialogue with corporate officers to encourage a desired policies or behavior) or more activist shareholder interventions (e.g., proxy initiatives). Pension funds can act even more directly with firms in the real estate sector, entering into joint ventures for sustainable property development (as is becoming more common in the US); selecting investment managers based on their sustainability record (as is becoming the norm in the UK and Australia); or pressuring their investment managers to adopt greener property management practices. Two of the leading public pension funds in the US, CalPERS and CalSTRS, jointly committed to a 20% energy reduction in the “core” (stabilized) portfolio over a five-year period.*
The Rise of Global Real Estate Players and Global Capital Flows
Accentuating growing investor demands for sustainable property is the greater global reach of capital today. Not long ago, real estate was viewed as among the most local of industries, with investors building and buying only in the nearby geographic markets they knew best. Local knowledge still is vital for profitable property investing. But today sophisticated property investors seek out opportunities in ever-more distant markets spanning national and even international opportunities in order to capitalize on the value of their brand and expertise. In this sense real estate investing trends parallel those in many other industries in which firms have developed global strategies, even if the particulars fueling globalization vary by industry. Major investors also seek global opportunities as part of their efforts to diversify their portfolios across geographies, product types, and asset classes.
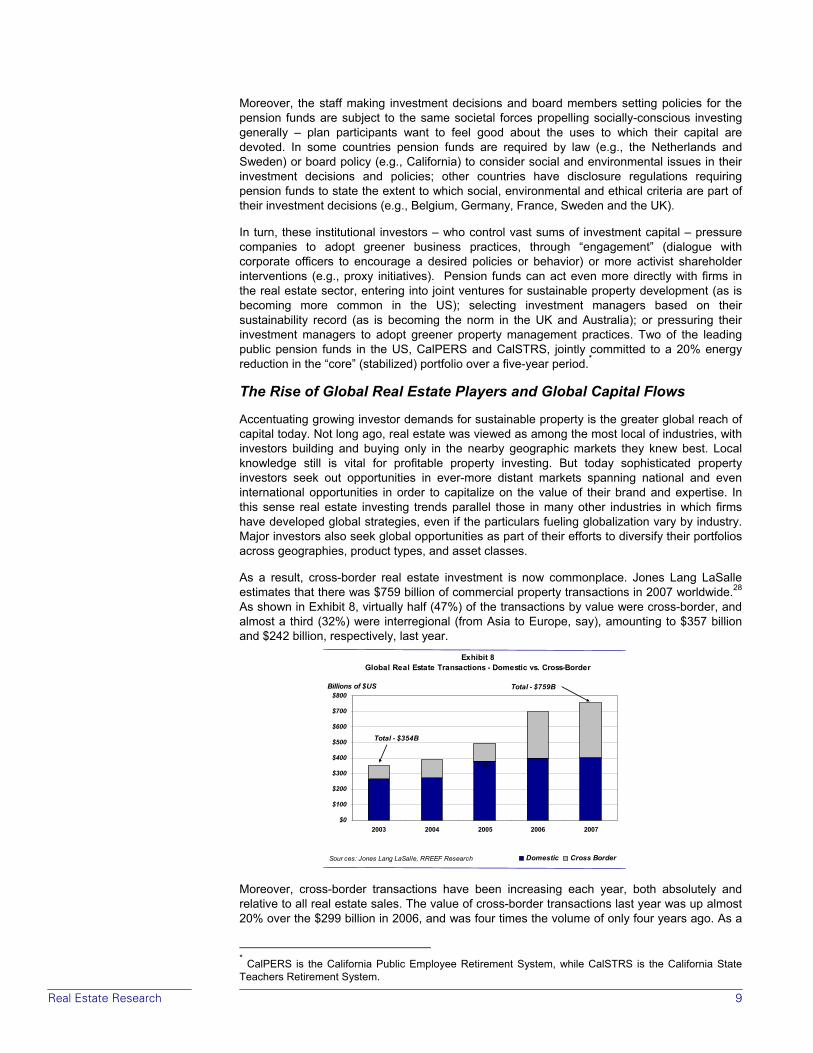
As a result, cross-border real estate investment is now commonplace. Jones Lang LaSalle estimates that there was $759 billion of commercial property transactions in 2007 worldwide.28 As shown in Exhibit 8, virtually half (47%) of the transactions by value were cross-border, and almost a third (32%) were interregional (from Asia to Europe, say), amounting to $357 billion and $242 billion, respectively, last year.
Moreover, cross-border transactions have been increasing each year, both absolutely and relative to all real estate sales. The value of cross-border transactions last year was up almost 20% over the $299 billion in 2006, and was four times the volume of only four years ago. As a
* CalPERS is the California Public Employee Retirement System, while CalSTRS is the California State Teachers Retirement System.
Exhibit 8Global Real Estate Transactions - Domestic vs. Cross-Border
$0
$100
$200
$300
$400
$500
$600
$700
$800
2003 2004 2005 2006 2007
Billions of $US
Domestic Cross BorderSour ces: Jones Lang LaSalle, RREEF Research
Total
Total - $354B
Total - $759B
10 Real Estate Research
result, cross-border sales rose from barely a quarter of all property transactions in 2003 to almost half in 2007. With the recent tumult in credit markets, real estate transactions of all sorts, domestic and cross-border, have been down sharply in 2008.29 But the longer-term trends to increasing cross-border investment are clear and likely to endure, if not expand.
In turn, this capital flow has enabled real estate firms to grow far larger than they were a generation ago, and thereby pursue portfolios of global range. Other global factors are making such far-reaching expansion plans easier to pursue as well (see box). A recent report from Real Capital Analytics (“RCA”) identified 167 firms each transacting at least $1 billion in property sales in 2007, the vast majority working internationally.30 The top 50 buyers alone acquired $193 billion in cross-border property assets, with the least buying $1.6 billion.31 In total, RCA found that “over 1,000 different individuals or companies were active cross-border property buyers in 2007 and the number of participants is increasing rapidly.”32
The rise of global real estate players abets sustainability as best practices from around the world are shared through their network of local offices. Firms learn about energy-saving and market-pleasing building techniques in one region and then share that knowledge across their platform. Plus, fully-integrated firms can find it easier and fruitful to set global operating standards, based on their best practices.
A prominent example is US-based ProLogis, the largest owner and manager of distribution facilities in the world. The firm committed itself in 2007 to pursuing green certification for all new construction projects using recognized green building rating systems where they exist (namely LEED in the United States, BREEAM in the United Kingdom, and CASBEE in Japan), and to utilize a “global standards checklist” they created for all other regions. Their goal is to build a global brand recognized for sustainability in all of their markets.
Other firms have adopted comparable goals or policies. In fact, most of the leading cross-border investors on the RCA top buyer list have adopted strong environmental policies, including #1 Morgan Stanley, which recently purchased Investa, a leading Australian sustainability investor, and #2 Unibail, which adopted a set of sustainability development principles in 2003, including meeting France’s “Factor 4” energy savings plan for all projects.
The cumulative impact of all these major players insisting on sustainable development and operations is to force greener market standards even in advance of government regulations. Already most property firms benchmark their own practices and property portfolio against the evolving market standards. Soon firms that do not rapidly transform to meet these standards will find themselves at a competitive disadvantage – in terms of property performance, ability to attract capital, and ultimately financial performance.
The Environmental Movement and Multilateral Change Agents
A final global force underlying the move to greener buildings has been pressure from the worldwide environmental movement. Perhaps uniquely among the great social movements of the past century, environmentalism has been virtually universal, with significant interest in all regions around the world, and largely grassroots, with much of the action occurring at a very local level and through small organizations, before coalescing and rising up to drive national and international action. The universality of environmental concerns is shown in the polling data reviewed in the Regional Analysis section of this paper. Even in some of the least democratic nations suffering from deplorable polluted levels, citizens are clamoring for greater environmental action – and governments are responding.
To a large extent, though, the environmental pressures on the real estate industry have been more indirect than direct, by influencing parties that interact with property owners. For example, corporate tenants are motivated to seek greener facilities in order to attract and retain workers, differentiate their products, improve their image to consumers, and satisfy shareholder demands, all of which have ties to environmental concerns.
Similarly, environmental consciousness underpins much of the interest in responsible property investing and sustainability investing generally. Important in this regard is the role of investment forums and various independent groups that either pressure companies to act/invest more sustainably and/or rate sustainability performance. Eurosif is a pan-European
Focus: Real Estate Markets Go Global Global property investors and builders typically rely on a network of regional offices to source and execute deals, but a host of other factors is enabling investors to expand their investment horizons: • the growing institutionalization
of real estate markets and standardization of real estate products across regions;
• falling trade and ownership barriers, though many limitations and impediments certainly still remain, particularly in the emerging economies;
• the greater transparency of many property markets; and,
• the increasing availability, quality and reliability of third-party property market and transaction data,.
As a result, property developers and investors who are successful in one region or country now can more easily export their business model into new geographies far removed from their home base.
Real Estate Research 11
group whose mission is to advance sustainability through financial markets. Among its many activities, Eurosif provides members with research on “legislation, policies and practices for the integration of social, environmental, ethical and governance issues into European financial services.” Their report on the real estate industry highlights “the major social and environmental challenges facing the European real estate industry and the associated risks and opportunities these pose for long-term financial returns.”33
Other prominent groups include the Investor Network on Climate Risk (INCR), a US-based network of 60+ institutional investors who control over $5 trillion in assets, and the Institutional Investors Group on Climate Change (IIGCC), a comparable European group with over 45 members representing about €4 trillion of assets.* Each group seeks to educate both members and other institutional inventors on the challenges and opportunities presented by climate change, and each has issued detailed action plans committing its members to more sustainable business and investment practices.34
But perhaps the most influential environmental forces from the environmental movement are filtered through broader multilateral organizations. Among the most prominent is United Nations Environment Programme (UNEP). With a mandate to “coordinate the development of environmental policy consensus,” the UNEP pressures both governments and the business community to undertake action. With a budget of over $300 million and staff of over 500 professionals, UNEP has established numerous working groups based on industry affiliations and other functional areas.
Of particular relevance to green building, the UNEP has a group focused on Financial Institutions (UNEP FI), and within that, a Property Working Group (PWG). Central to PWG’s agenda has been developing and pushing adoption of Responsible Property Investment (RPI) principles. Toward this end, PWG has published several reports highlighting notable RPI accomplishments by industry leaders as a means of rewarding achievement but also disseminating industry best practices.35
The Role of Government
Governments have been a dominant force in the move toward more sustainable property. Often acting under pressure from the environmental movement, in most countries the public sector has forced changes on the real estate industry, often well in advance of the business sector’s own schedule for adoption. Although not a global force per se, many government initiatives are spreading internationally through multilateral agents such as the United Nations.
The public sector influences property markets in at least three key ways: regulation of what buildings can be constructed and how they are to be managed; taxation and environmental regulation that alter market dynamics; and, the occupancy and construction of their own facilities.
In addition, governments play an indirect role of increasing tenant demand and developer by raising awareness and demonstrating proof of concept. Often governments commission the earliest green buildings in a locality, providing the local market with the first tangible experience with sustainable building practices.
Building Construction and Operation – Government’s most direct impact on green building is by setting minimum standards for new construction. Typically, these mandates are promulgated through building codes, whether at the federal level (most European countries) or local governments (the US). Governments also can require existing buildings to operate more efficiently, as India’s Energy Conservation Act mandated in 2002. And these regulations are getting more extreme. The influential California State government recently enacted legislation phasing in escalating sustainability standards for all residential and commercial buildings, and eventually requiring buildings to be fully “carbon neutral.” Other governments in Europe and elsewhere are considering comparable regulations. * Deutsche Asset Management (DeAM), the parent organization of RREEF, signed INCR’s 2008 Action Plan as a “supporter in principle,” while DWS Investments, the mutual fund arm of Deutsche Asset Management, is a member of IIGCC.
12 Real Estate Research
Another mechanism for change is through the light of transparency: Several jurisdictions in Japan require all buildings to obtain and post their CASBEE rating, but do not mandate a particular rating level. Countries in the European Union are implementing measures to comply with the EPBD (see box). In addition to raising the bar for new construction and major renovations, the EPBD requires commercial buildings to rate their energy “performance” as a pre-condition for any transactions (sales or new leases). While these required Energy Performance Certificates (EPCs) set no standards for existing buildings, the very act of requiring owners to disclose the energy efficiency of their buildings is likely to motivate them to upgrade their buildings – especially when all new buildings will be constructed to greener standards.
Market Dynamics – The public sector can influence energy efficiency and other sustainable building practices by raising the cost of inefficiency or subsidizing moves to more sustainable buildings. Examples abound in virtually every country. China has a “tax and fee rebate” system, which rewards low-energy buildings and penalizes less efficient buildings. In the US, many utilities provide subsidies to buildings renovating to greater energy efficiency while local governments provide expedited approvals for green buildings.
Increasingly, however, governments are moving from providing incentives for doing good to penalizing for not doing good. Under terms of the Kyoto treaty, developed countries must reduce their greenhouse gas emissions, and many countries are considering either “carbon taxes” or “cap and trade” schemes that would raise the relative cost of operating less efficient buildings. To date, governments have not capped emissions for investment property, focusing instead on power plants and other major greenhouse gas emitters. However, with the greater recognition of the building sector’s role in consuming energy, extending greenhouse caps to tradition real estate should not be unexpected.
Tenancy and Development – Finally, governments are also pushing green construction through the standards they set for their own occupancy. In most countries, the federal government represents the single largest tenant and developer in the nation – typically by a wide margin. By this market domination the public sector establishes de facto market standards, even if unintentionally. On top of this, the public sector typically sets higher standards for its own facilities – whether leased or owned – than it does for the private sector. This is especially true in the developing world (China and India being prominent examples, if in principle more than actuality), but throughout developed countries as well.
At the same time, it must be pointed out that not all government policies serve to enhance sustainability. In many emerging economies, energy prices are heavily subsidized, in contrast to most developed nations, where prices are raised through special taxes. As discussed in our Regional Analysis below, such subsidies can undermine sustainability efforts by reducing incentives for energy consumption.
The Business Case
As with the public sector role, the business case for green buildings is not directly linked to globalization, but nonetheless is fundamental to attracting investor interest. These market dynamics were covered exhaustively in our earlier paper, though given the small universe of investor-owned green buildings, the evidence was hardly definitive with respect to building performance. In short, the available data suggested that sustainable buildings command higher rents and lower vacancies, and lease-up quicker than conventional buildings, and certainly have lower energy and other operating expenses. Moreover, the cost premium for green construction can be minimal to non-existent. Plus, green buildings are eligible for a variety of incentives that can more than offset any putative cost premiums. Together, these factors point to premium returns on green building investments.
Today the universe of investor-owned certified green buildings is still small. Nonetheless, more recent studies all support these benefits to varying extents.36 To be sure, these early studies all have drawbacks,37 but it is significant that no major study to date has failed to find at least some positive performance impact, even if the precise figures are elusive.
Regional Focus: The EPBD in Europe The Energy Performance for Buildings Directive (EPBD) may prove to be the single most significant driving force for sustainability in Europe, if not the world. Enacted by the European Commission in 2002 to meet Europe’s Kyoto commitment, EPBD sets out various energy efficiency requirements for all EU countries. The EPBD has three main components: • minimum energy performance
for all new development and major renovations;
• Energy Performance Certificates (EPCs) for all existing buildings when they are sold or rented; and,
• regular inspections of air conditioning systems and boilers.
All counties will use a common system of letter ratings, though each country is developing their own methods for calculating energy performance and ensuring compliance. All nations are required to implement their systems by January 2009, though some are sure to miss the deadline, while others have already implemented the rules (e.g., Denmark in 2006). While each element will make its mark on building sustainability, the EPCs will have the largest and most immediate impact on commercial property investors. Building owners will not be able to execute normal business transactions (leases and sales) without the EPCs. An independent energy inspection is mandated for obtaining an EPC, requiring significant outlays and lead-time; already some markets report a backlog of inspection requests and a shortage of qualified inspectors.
Real Estate Research 13
For existing buildings, the costs and net benefits of renovating to green standards is less certain or quantifiable because the extreme diversity of the standing stock (e.g., age, condition, quality) makes blanket conclusions impossible. Nonetheless, a growing body of successful projects demonstrates feasibility in a wide variety of circumstances, particularly with respect to energy-efficiency initiatives.
Lastly, questions still remain as to the financial premiums – whether green buildings command lower capitalization rates or yield higher returns on investment, particularly now that transactions are frozen in many market due to the weakness in the credit markets. Despite the explosion of green buildings, few buildings have sold to investors. (For perspective, CoStar reports only 12 transactions during 2007 involving LEED-certified buildings in the entire United States, with a total value of under $1.5 billion. By comparison, the US office market saw over $210 billion in assets change hands in over 4,000 transactions.38) Nonetheless, green buildings should trade at elevated values relative to conventional buildings due to their lower life-cycle and operating costs, greater tenant demand, and expected longer life span.
In short, green buildings do not seem to cost much more to build than conventional buildings but can yield substantial operating cost savings. Demand for greener property is outstripping the industry’s ability, or at least willingness, to supply it, leading to at least temporary rent and occupancy premiums. Add in the subsidies available to greener buildings – and now penalties for non-green buildings – and a favorable return profile relative to conventional buildings seems probable, if not certain.
The Role of Globalization Reconsidered
Often it is assumed that trade globalization increases greenhouse gases and pollution generally, as goods are shipped further, consuming more energy, while developed nations “export” their pollution by moving their production to less-developed nations where environmental regulations are more lax. However, recent studies have begun to question this “race to the bottom” hypothesis by examining the positive local impacts of the technology and business practices that accompany this international trade.39 This trade may lead to more sustainable standards in the new markets, particularly when multinational companies establish subsidiaries in new regions, which facilitates this knowledge transfer.
But these analyses have focused on the manufacturing and trade of physical products across borders. Left unexamined are how these trade dynamics play out in the real estate sector, where ideas, rather than finished physical products, are the main items shipped across borders. Clearly, when the economies of less-developed nations start to mature, the physical nature of the building stock changes as well – typically to non-indigenous designs that use energy much more intensively. Witness the explosive growth of western-style skyscrapers and shopping malls in China and India.
What’s new is the greater technological sophistication of this construction – facilitated by the flow of financial and intellectual capital that accompanies international trade – thus allowing for more energy-efficient structures than might otherwise been built. These forces enable the local market to leapfrog from rudimentary indigenous technology to world-class designs, which can be especially successful when building practices are adapted to local markets, such as using regional building materials and adapting building prototypes to local climates. Finally, rising incomes due to global trade can be expected to raise already elevated public awareness and concerns with environmental degradation, putting additional pressure on the local property markets to adopt more eco-friendly approaches.
How these forces ultimately play out is a matter of empirical inquiry beyond the scope of our analysis. The issue for investors, however, is whether the project economics and global market demands will be sufficient to tip the scales toward greener construction in the emerging economies. To be sure, evidence of a strong sustainability sentiment in the real estate markets of most emerging nations is thin, and the few examples of greener construction are overwhelmed by the sheer volume of all new construction. Nonetheless, the pressures for greener property from global investors and tenants alike are likely to prove inexorable and over time will raise sustainability standards even in emerging nations.
14 Real Estate Research
Green Building Markets As we noted above, characterizing the size and other features of the green building market is elusive due to regional and industry inconsistencies in definitions and recordkeeping. Nonetheless, the extent of green building now is large and growing swiftly.
Still, the investment community has not yet embraced green building as a discrete investment class, as it has, say, renewable energy. In part, this may be because green buildings are not as fundamentally distinct from conventional buildings as is, say, solar energy from nuclear or carbon-based energy. The differences, after all, are more matters of degree, so what renders one building “sustainable” and another not is ultimately a subjective determination – and definitions of “green building” vary widely across regions, even within countries. Also, unlike most other green products, what makes buildings sustainable has as much (if not more) to do with their operation as their design and construction.
But perhaps most important in holding back a broader recognition of green building as a separate investment class is the limited supply of certified investible product. As explained previously, most certified green buildings have been built by, and continue to be occupied by, government and corporate owner/users. The pendulum has started to swing more to third-party developers, with more speculative buildings and a decreasing share of net leased, built-to-suit and owner-occupied buildings, but the numbers of multi-tenant, investor-owned green buildings are still small.
Thus, few certified green buildings are in the hands of non-occupying investors, limiting opportunities for new investors – though sale-leasebacks remain one largely untapped market. To the extent that private investors are participating in green building, virtually all activity has been undertaken by private funds, often with the partnership of public pension funds, such as the Hines-CalPERS Green Investment Fund. Most are development or value-added funds, as so little standing green product is brought to market for purchase by investors. Nonetheless, green-only core funds do exist, such as Investa’s Commercial Property Fund in Australia, Commonwealth Property Office Fund from Colonial First State, also in Australia, and Wereldhave in the Netherlands, though not all assets in these funds are certified as green. These funds are certain to grow in number and size as more product comes to market.
With so few green buildings available for purchase, the public equity markets, which tend to focus on existing product over development, have been minor in this area. Several REITs and mutual funds have been established that focus on green building, but they are all small or use broad definitions of what constitutes “green real estate” – purchasing the stocks of building materials makers and solar power firms, for example, in addition to shares in property firms. Of the 40+ firms tracked by investment banking firm Canaccord Adams in their global Green Building Index, only four are real estate owners, none of which is actually entirely green. Similarly, real estate accounts for only a small share of assets in most SRI funds.40
Investment opportunities are also limited by the multiplicity of green building standards and certification programs. Without a common standard, compiling assets for a green building fund is daunting. Toward that end, initiatives are underway in capital markets around the world to develop standards for “green mortgages,” which then could serve as a foundation for securitized green products (e.g., commercial mortgage-backed securities or CMBS), while other groups are seeking greater agreement on green product definitions as a prelude to the proliferation of green mutual funds and REITs. This standardization is fundamental to attracting greater investor interest because CMBS and REITs account for such large shares of overall retail estate capital, yet for now are effectively out of the green building market.
A final obstacle concerns the misalignment between landlord and tenant interests in investor-owned properties. This is particularly the case with “net leased” properties in which the tenant incurs all utility and maintenance expenses, and thus would capture all the financial benefits from (landlord-provided) green renovations, at least during the lease term. In response, the industry has developed several innovations under the umbrella of “green leases,” in which landlord and tenant agree on how the responsibilities and benefits can be shared equitably. Australia is widely recognized as being a leader in this field.41 While new or unknown in many markets, the proliferation of green leases could help accelerate green building retrofits.
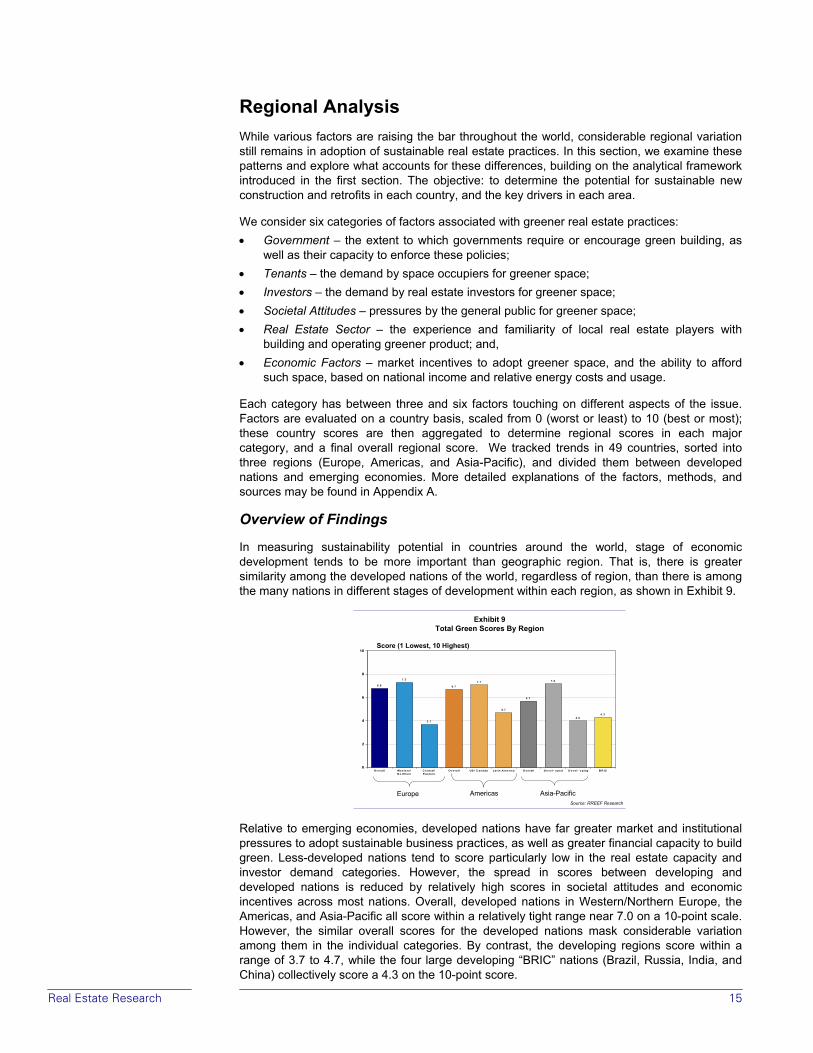
Real Estate Research 15
Regional Analysis While various factors are raising the bar throughout the world, considerable regional variation still remains in adoption of sustainable real estate practices. In this section, we examine these patterns and explore what accounts for these differences, building on the analytical framework introduced in the first section. The objective: to determine the potential for sustainable new construction and retrofits in each country, and the key drivers in each area.
We consider six categories of factors associated with greener real estate practices: • Government – the extent to which governments require or encourage green building, as
well as their capacity to enforce these policies; • Tenants – the demand by space occupiers for greener space; • Investors – the demand by real estate investors for greener space; • Societal Attitudes – pressures by the general public for greener space; • Real Estate Sector – the experience and familiarity of local real estate players with
building and operating greener product; and, • Economic Factors – market incentives to adopt greener space, and the ability to afford
such space, based on national income and relative energy costs and usage.
Each category has between three and six factors touching on different aspects of the issue. Factors are evaluated on a country basis, scaled from 0 (worst or least) to 10 (best or most); these country scores are then aggregated to determine regional scores in each major category, and a final overall regional score. We tracked trends in 49 countries, sorted into three regions (Europe, Americas, and Asia-Pacific), and divided them between developed nations and emerging economies. More detailed explanations of the factors, methods, and sources may be found in Appendix A.
Overview of Findings
In measuring sustainability potential in countries around the world, stage of economic development tends to be more important than geographic region. That is, there is greater similarity among the developed nations of the world, regardless of region, than there is among the many nations in different stages of development within each region, as shown in Exhibit 9.
Relative to emerging economies, developed nations have far greater market and institutional pressures to adopt sustainable business practices, as well as greater financial capacity to build green. Less-developed nations tend to score particularly low in the real estate capacity and investor demand categories. However, the spread in scores between developing and developed nations is reduced by relatively high scores in societal attitudes and economic incentives across most nations. Overall, developed nations in Western/Northern Europe, the Americas, and Asia-Pacific all score within a relatively tight range near 7.0 on a 10-point scale. However, the similar overall scores for the developed nations mask considerable variation among them in the individual categories. By contrast, the developing regions score within a range of 3.7 to 4.7, while the four large developing “BRIC” nations (Brazil, Russia, India, and China) collectively score a 4.3 on the 10-point score.
Exhibit 9Total Green Scores By Region
6.8
7.3
3.7
6 .7
7 .1
4 .7
5 .7
7 .2
4.04 .3
0
2
4
6
8
10
Overall Western/N o rthern
C entral/Eastern
Overa ll US/ C anada Latin A merica Overall D evel- o ped D evel- o ping B R IC
Source: RREEF Research
Score (1 Lowest, 10 Highest)
Europe Americas Asia-Pacific
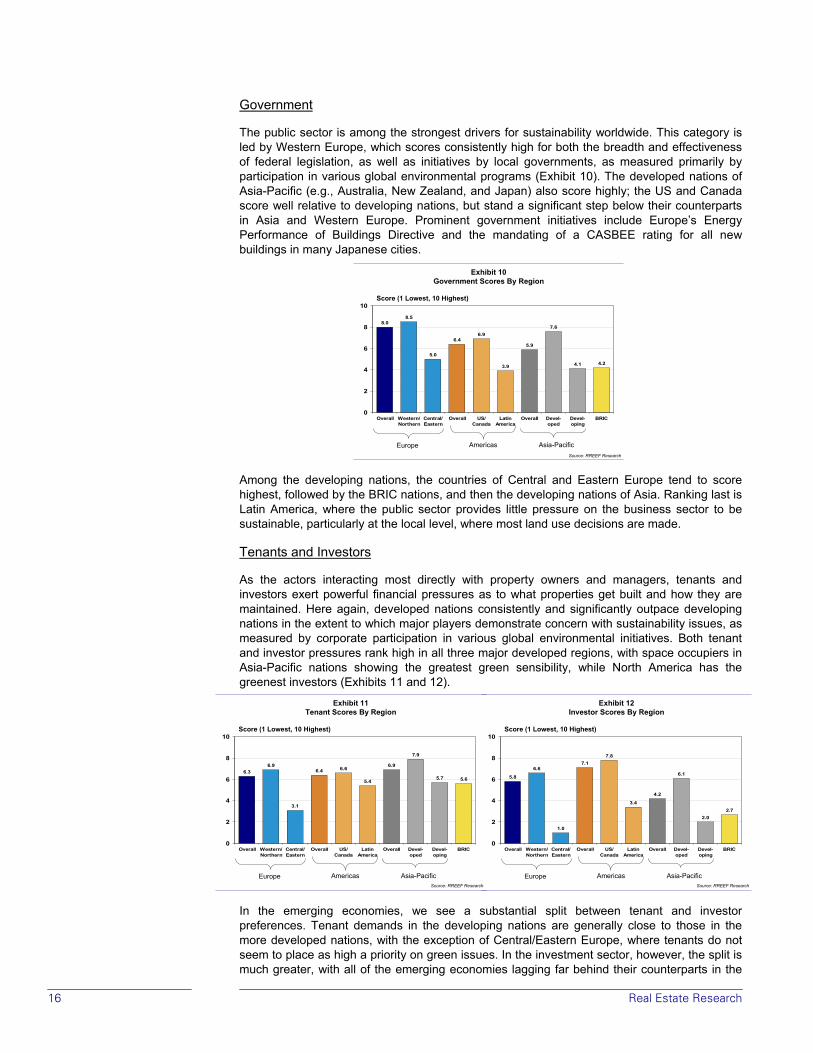
16 Real Estate Research
Government
The public sector is among the strongest drivers for sustainability worldwide. This category is led by Western Europe, which scores consistently high for both the breadth and effectiveness of federal legislation, as well as initiatives by local governments, as measured primarily by participation in various global environmental programs (Exhibit 10). The developed nations of Asia-Pacific (e.g., Australia, New Zealand, and Japan) also score highly; the US and Canada score well relative to developing nations, but stand a significant step below their counterparts in Asia and Western Europe. Prominent government initiatives include Europe’s Energy Performance of Buildings Directive and the mandating of a CASBEE rating for all new buildings in many Japanese cities.
Among the developing nations, the countries of Central and Eastern Europe tend to score highest, followed by the BRIC nations, and then the developing nations of Asia. Ranking last is Latin America, where the public sector provides little pressure on the business sector to be sustainable, particularly at the local level, where most land use decisions are made.
Tenants and Investors
As the actors interacting most directly with property owners and managers, tenants and investors exert powerful financial pressures as to what properties get built and how they are maintained. Here again, developed nations consistently and significantly outpace developing nations in the extent to which major players demonstrate concern with sustainability issues, as measured by corporate participation in various global environmental initiatives. Both tenant and investor pressures rank high in all three major developed regions, with space occupiers in Asia-Pacific nations showing the greatest green sensibility, while North America has the greenest investors (Exhibits 11 and 12).
In the emerging economies, we see a substantial split between tenant and investor preferences. Tenant demands in the developing nations are generally close to those in the more developed nations, with the exception of Central/Eastern Europe, where tenants do not seem to place as high a priority on green issues. In the investment sector, however, the split is much greater, with all of the emerging economies lagging far behind their counterparts in the
Exhibit 10Government Scores By Region
8.08.5
5.0
6.46.9
3.9
5.9
7.6
4.1 4.2
0
2
4
6
8
10
Overall Western/Northern
Central/Eastern
Overall US/Canada
LatinAmerica
Overall Devel-oped
Devel-oping
BRIC
Source: RREEF Research
Score (1 Lowest, 10 Highest)
Europe Americas Asia-Pacific
Exhibit 11Tenant Scores By Region
6.36.9
3.1
6.4 6.6
5.4
6.9
7.9
5.7 5.6
0
2
4
6
8
10
Overall Western/Northern
Central/Eastern
Overall US/Canada
LatinAmerica
Overall Devel-oped
Devel-oping
BRIC
Source: RREEF Research
Score (1 Lowest, 10 Highest)
Europe Americas Asia-Pacific
Exhibit 12Investor Scores By Region
5.8
6.6
1.0
7.17.8
3.4
4.2
6.1
2.02.7
0
2
4
6
8
10
Overall Western/Northern
Central/Eastern
Overall US/Canada
LatinAmerica
Overall Devel-oped
Devel-oping
BRIC
Source: RREEF Research
Score (1 Lowest, 10 Highest)
Europe Americas Asia-Pacific
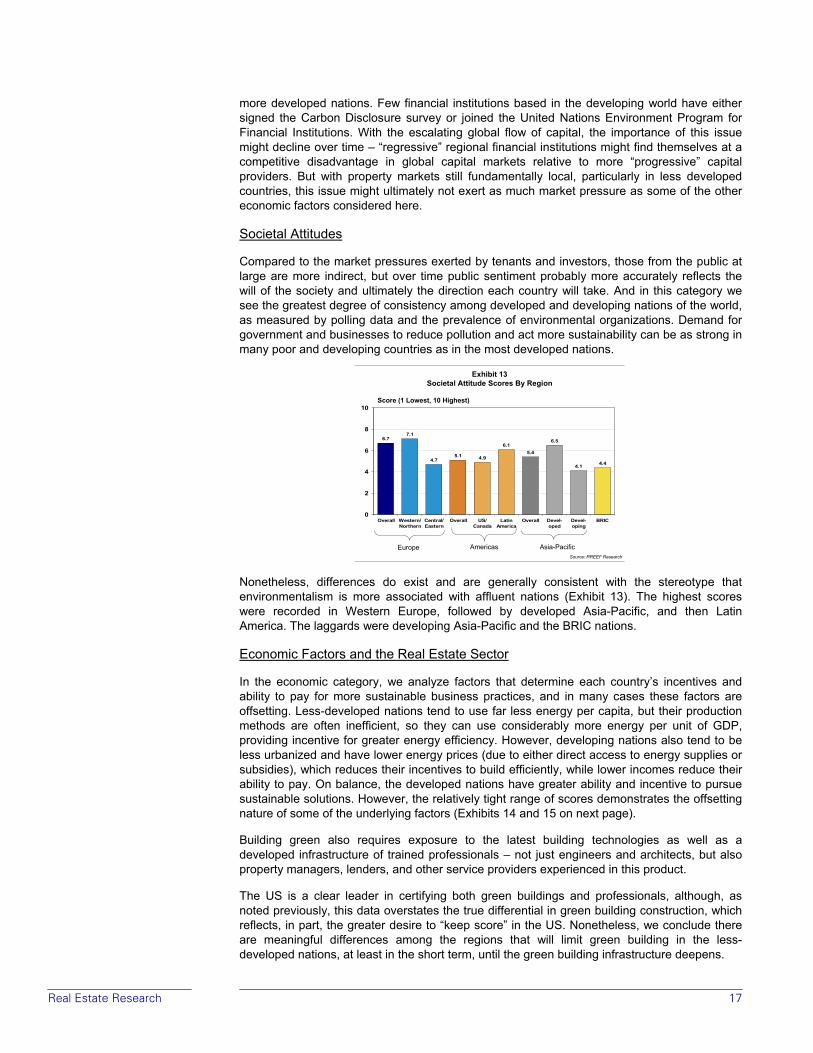
Real Estate Research 17
more developed nations. Few financial institutions based in the developing world have either signed the Carbon Disclosure survey or joined the United Nations Environment Program for Financial Institutions. With the escalating global flow of capital, the importance of this issue might decline over time – “regressive” regional financial institutions might find themselves at a competitive disadvantage in global capital markets relative to more “progressive” capital providers. But with property markets still fundamentally local, particularly in less developed countries, this issue might ultimately not exert as much market pressure as some of the other economic factors considered here.
Societal Attitudes
Compared to the market pressures exerted by tenants and investors, those from the public at large are more indirect, but over time public sentiment probably more accurately reflects the will of the society and ultimately the direction each country will take. And in this category we see the greatest degree of consistency among developed and developing nations of the world, as measured by polling data and the prevalence of environmental organizations. Demand for government and businesses to reduce pollution and act more sustainability can be as strong in many poor and developing countries as in the most developed nations.
Nonetheless, differences do exist and are generally consistent with the stereotype that environmentalism is more associated with affluent nations (Exhibit 13). The highest scores were recorded in Western Europe, followed by developed Asia-Pacific, and then Latin America. The laggards were developing Asia-Pacific and the BRIC nations.
Economic Factors and the Real Estate Sector
In the economic category, we analyze factors that determine each country’s incentives and ability to pay for more sustainable business practices, and in many cases these factors are offsetting. Less-developed nations tend to use far less energy per capita, but their production methods are often inefficient, so they can use considerably more energy per unit of GDP, providing incentive for greater energy efficiency. However, developing nations also tend to be less urbanized and have lower energy prices (due to either direct access to energy supplies or subsidies), which reduces their incentives to build efficiently, while lower incomes reduce their ability to pay. On balance, the developed nations have greater ability and incentive to pursue sustainable solutions. However, the relatively tight range of scores demonstrates the offsetting nature of some of the underlying factors (Exhibits 14 and 15 on next page).
Building green also requires exposure to the latest building technologies as well as a developed infrastructure of trained professionals – not just engineers and architects, but also property managers, lenders, and other service providers experienced in this product.
The US is a clear leader in certifying both green buildings and professionals, although, as noted previously, this data overstates the true differential in green building construction, which reflects, in part, the greater desire to “keep score” in the US. Nonetheless, we conclude there are meaningful differences among the regions that will limit green building in the less-developed nations, at least in the short term, until the green building infrastructure deepens.
Exhibit 13Societal Attitude Scores By Region
6.77.1
4.75.1 4.9
6.15.4
6.5
4.1 4.4
0
2
4
6
8
10
Overall Western/Northern
Central/Eastern
Overall US/Canada
LatinAmerica
Overall Devel-oped
Devel-oping
BRIC
Source: RREEF Research
Score (1 Lowest, 10 Highest)
Europe Americas Asia-Pacific
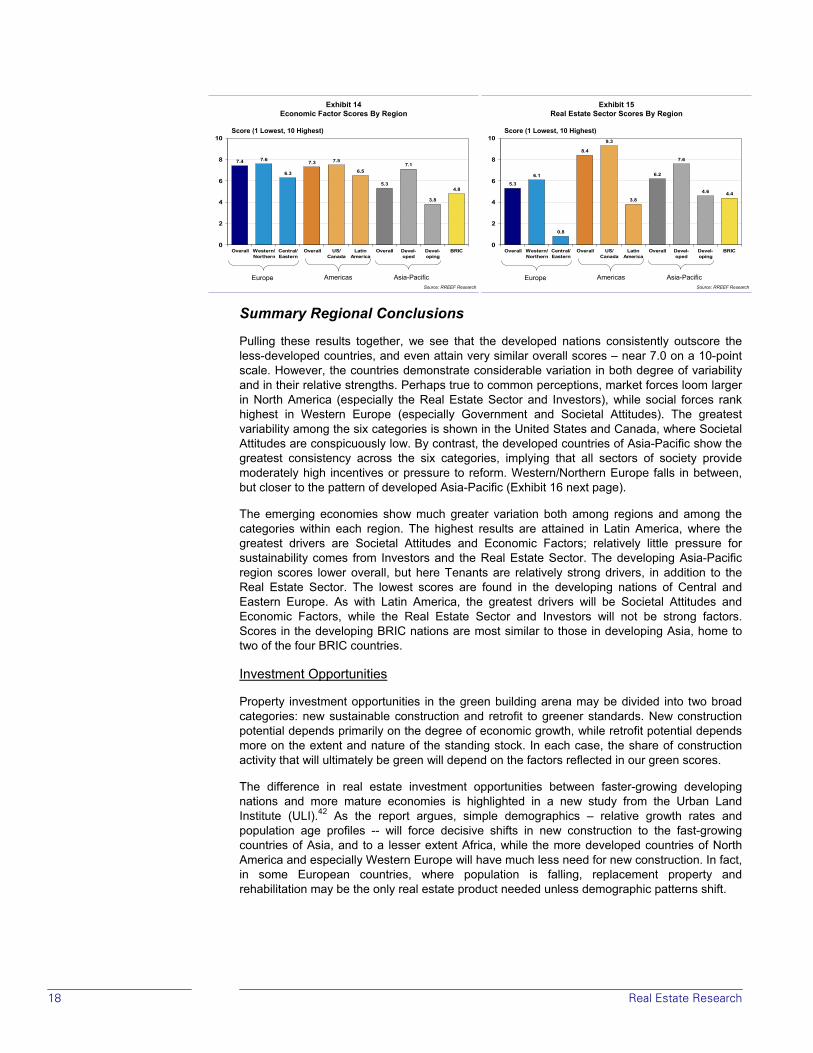
18 Real Estate Research
Summary Regional Conclusions
Pulling these results together, we see that the developed nations consistently outscore the less-developed countries, and even attain very similar overall scores – near 7.0 on a 10-point scale. However, the countries demonstrate considerable variation in both degree of variability and in their relative strengths. Perhaps true to common perceptions, market forces loom larger in North America (especially the Real Estate Sector and Investors), while social forces rank highest in Western Europe (especially Government and Societal Attitudes). The greatest variability among the six categories is shown in the United States and Canada, where Societal Attitudes are conspicuously low. By contrast, the developed countries of Asia-Pacific show the greatest consistency across the six categories, implying that all sectors of society provide moderately high incentives or pressure to reform. Western/Northern Europe falls in between, but closer to the pattern of developed Asia-Pacific (Exhibit 16 next page).
The emerging economies show much greater variation both among regions and among the categories within each region. The highest results are attained in Latin America, where the greatest drivers are Societal Attitudes and Economic Factors; relatively little pressure for sustainability comes from Investors and the Real Estate Sector. The developing Asia-Pacific region scores lower overall, but here Tenants are relatively strong drivers, in addition to the Real Estate Sector. The lowest scores are found in the developing nations of Central and Eastern Europe. As with Latin America, the greatest drivers will be Societal Attitudes and Economic Factors, while the Real Estate Sector and Investors will not be strong factors. Scores in the developing BRIC nations are most similar to those in developing Asia, home to two of the four BRIC countries.
Investment Opportunities
Property investment opportunities in the green building arena may be divided into two broad categories: new sustainable construction and retrofit to greener standards. New construction potential depends primarily on the degree of economic growth, while retrofit potential depends more on the extent and nature of the standing stock. In each case, the share of construction activity that will ultimately be green will depend on the factors reflected in our green scores.
The difference in real estate investment opportunities between faster-growing developing nations and more mature economies is highlighted in a new study from the Urban Land Institute (ULI).42 As the report argues, simple demographics – relative growth rates and population age profiles -- will force decisive shifts in new construction to the fast-growing countries of Asia, and to a lesser extent Africa, while the more developed countries of North America and especially Western Europe will have much less need for new construction. In fact, in some European countries, where population is falling, replacement property and rehabilitation may be the only real estate product needed unless demographic patterns shift.
Exhibit 14Economic Factor Scores By Region
7.4 7.6
6.3
7.3 7.5
6.5
5.3
7.1
3.8
4.8
0
2
4
6
8
10
Overall Western/Northern
Central/Eastern
Overall US/Canada
LatinAmerica
Overall Devel-oped
Devel-oping
BRIC
Source: RREEF Research
Score (1 Lowest, 10 Highest)
Europe Americas Asia-Pacific
Exhibit 15Real Estate Sector Scores By Region
5.3
6.1
0.8
8.4
9.3
3.8
6.2
7.6
4.6 4.4
0
2
4
6
8
10
Overall Western/Northern
Central/Eastern
Overall US/Canada
LatinAmerica
Overall Devel-oped
Devel-oping
BRIC
Source: RREEF Research
Score (1 Lowest, 10 Highest)
Europe Americas Asia-Pacific
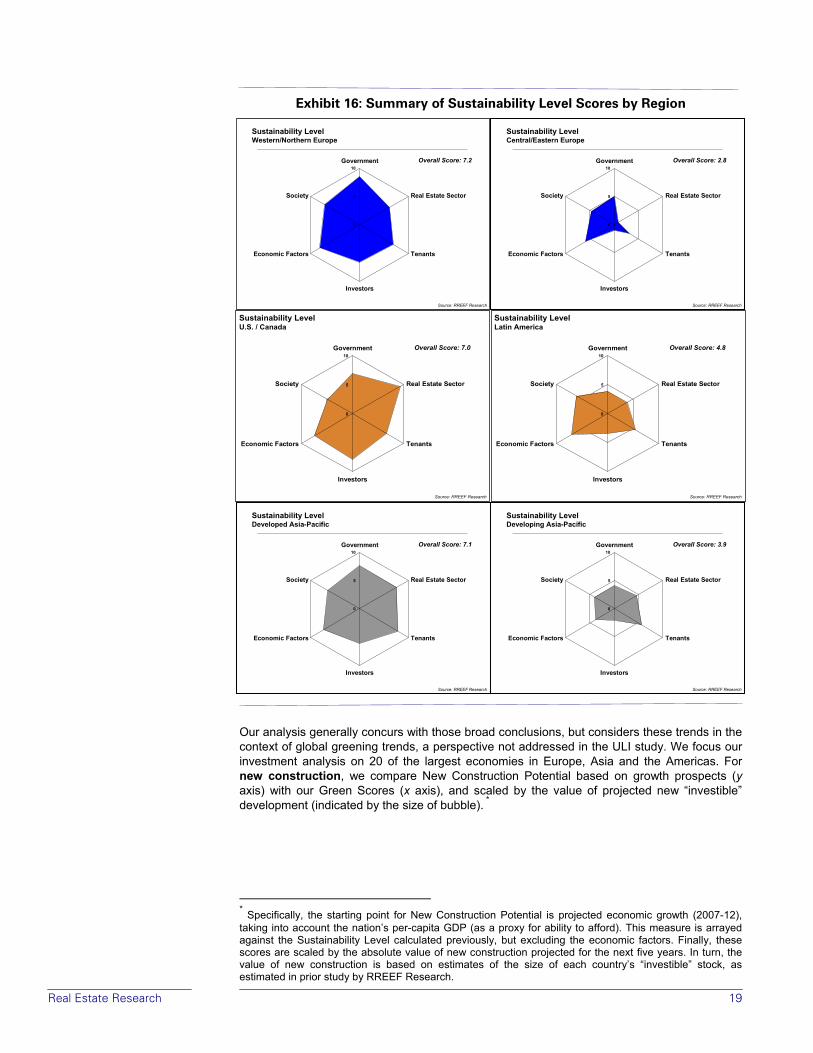
Real Estate Research 19
Exhibit 16: Summary of Sustainability Level Scores by Region
Our analysis generally concurs with those broad conclusions, but considers these trends in the context of global greening trends, a perspective not addressed in the ULI study. We focus our investment analysis on 20 of the largest economies in Europe, Asia and the Americas. For new construction, we compare New Construction Potential based on growth prospects (y axis) with our Green Scores (x axis), and scaled by the value of projected new “investible” development (indicated by the size of bubble). *
* Specifically, the starting point for New Construction Potential is projected economic growth (2007-12), taking into account the nation’s per-capita GDP (as a proxy for ability to afford). This measure is arrayed against the Sustainability Level calculated previously, but excluding the economic factors. Finally, these scores are scaled by the absolute value of new construction projected for the next five years. In turn, the value of new construction is based on estimates of the size of each country’s “investible” stock, as estimated in prior study by RREEF Research.
Sustainability LevelWestern/Northern Europe
0
5
10Government
Real Estate Sector
Tenants
Investors
Economic Factors
Society
Source: RREEF Research
Overall Score: 7.2
Sustainability LevelCentral/Eastern Europe
0
5
10Government
Real Estate Sector
Tenants
Investors
Economic Factors
Society
Source: RREEF Research
Overall Score: 2.8
Sustainability LevelDeveloped Asia-Pacific
0
5
10Government
Real Estate Sector
Tenants
Investors
Economic Factors
Society
Source: RREEF Research
Overall Score: 7.1
Sustainability LevelDeveloping Asia-Pacific
0
5
10Government
Real Estate Sector
Tenants
Investors
Economic Factors
Society
Source: RREEF Research
Overall Score: 3.9
Sustainability LevelU.S. / Canada
0
5
10Government
Real Estate Sector
Tenants
Investors
Economic Factors
Society
Source: RREEF Research
Overall Score: 7.0
Sustainability LevelLatin America
0
5
10Government
Real Estate Sector
Tenants
Investors
Economic Factors
Society
Source: RREEF Research
Overall Score: 4.8
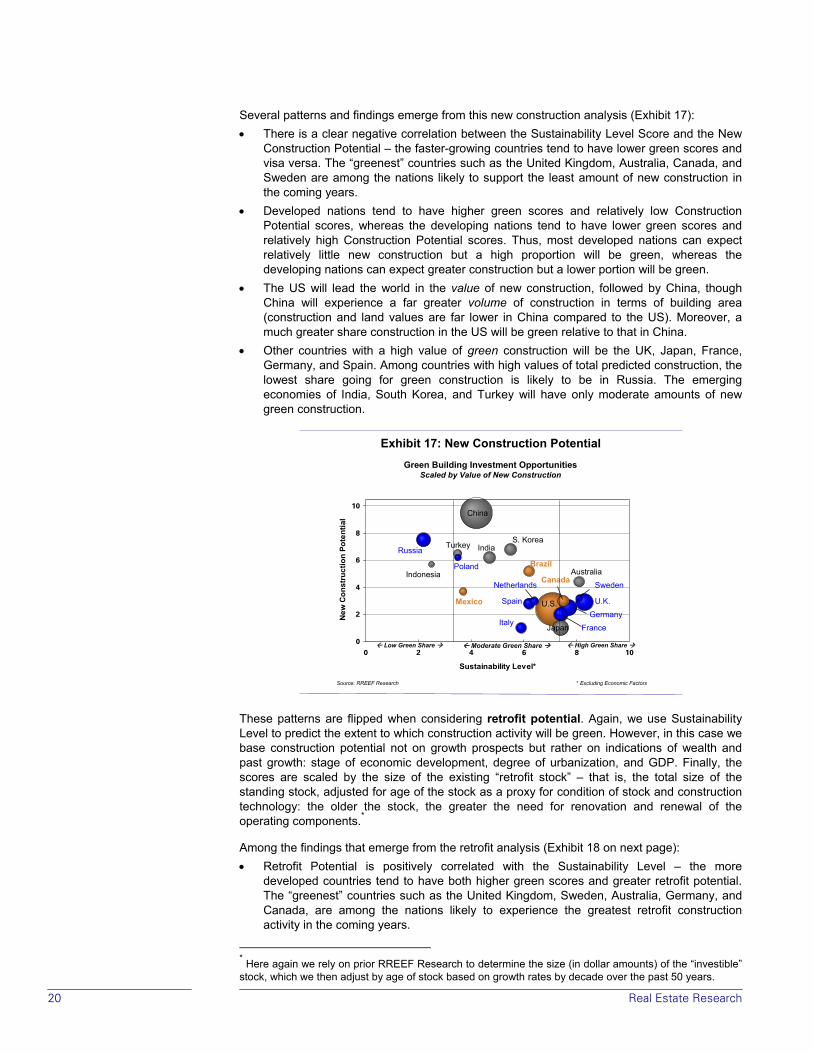
20 Real Estate Research
Several patterns and findings emerge from this new construction analysis (Exhibit 17): • There is a clear negative correlation between the Sustainability Level Score and the New
Construction Potential – the faster-growing countries tend to have lower green scores and visa versa. The “greenest” countries such as the United Kingdom, Australia, Canada, and Sweden are among the nations likely to support the least amount of new construction in the coming years.
• Developed nations tend to have higher green scores and relatively low Construction Potential scores, whereas the developing nations tend to have lower green scores and relatively high Construction Potential scores. Thus, most developed nations can expect relatively little new construction but a high proportion will be green, whereas the developing nations can expect greater construction but a lower portion will be green.
• The US will lead the world in the value of new construction, followed by China, though China will experience a far greater volume of construction in terms of building area (construction and land values are far lower in China compared to the US). Moreover, a much greater share construction in the US will be green relative to that in China.
• Other countries with a high value of green construction will be the UK, Japan, France, Germany, and Spain. Among countries with high values of total predicted construction, the lowest share going for green construction is likely to be in Russia. The emerging economies of India, South Korea, and Turkey will have only moderate amounts of new green construction.
Exhibit 17: New Construction Potential
These patterns are flipped when considering retrofit potential. Again, we use Sustainability Level to predict the extent to which construction activity will be green. However, in this case we base construction potential not on growth prospects but rather on indications of wealth and past growth: stage of economic development, degree of urbanization, and GDP. Finally, the scores are scaled by the size of the existing “retrofit stock” – that is, the total size of the standing stock, adjusted for age of the stock as a proxy for condition of stock and construction technology: the older the stock, the greater the need for renovation and renewal of the operating components.*
Among the findings that emerge from the retrofit analysis (Exhibit 18 on next page): • Retrofit Potential is positively correlated with the Sustainability Level – the more
developed countries tend to have both higher green scores and greater retrofit potential. The “greenest” countries such as the United Kingdom, Sweden, Australia, Germany, and Canada, are among the nations likely to experience the greatest retrofit construction activity in the coming years.
* Here again we rely on prior RREEF Research to determine the size (in dollar amounts) of the “investible” stock, which we then adjust by age of stock based on growth rates by decade over the past 50 years.
Green Building Investment Opportunities Scaled by Value of New Construction
0
2
4
6
8
10
0 2 4 6 8 10
Sustainability Level*
New
Con
stru
ctio
n Po
tent
ial
Source: RREEF Research
U.S.
Japan
Russia
China
IndiaS. Korea
Brazil
FranceItaly
Germany
U.K.
AustraliaIndonesiaSwedenCanadaNetherlands
Spain
* Excluding Economic Factors
Low Green Share Moderate Green Share High Green Share
Turkey
Poland
Mexico
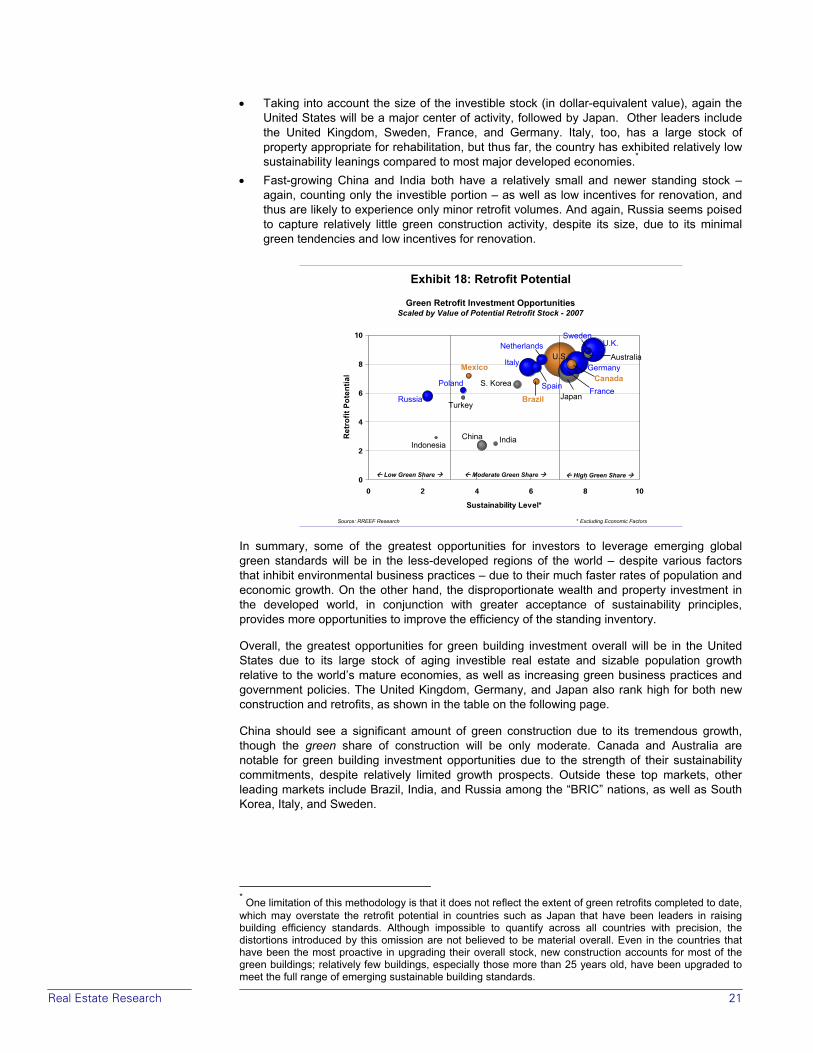
Real Estate Research 21
• Taking into account the size of the investible stock (in dollar-equivalent value), again the United States will be a major center of activity, followed by Japan. Other leaders include the United Kingdom, Sweden, France, and Germany. Italy, too, has a large stock of property appropriate for rehabilitation, but thus far, the country has exhibited relatively low sustainability leanings compared to most major developed economies.*
• Fast-growing China and India both have a relatively small and newer standing stock – again, counting only the investible portion – as well as low incentives for renovation, and thus are likely to experience only minor retrofit volumes. And again, Russia seems poised to capture relatively little green construction activity, despite its size, due to its minimal green tendencies and low incentives for renovation.
In summary, some of the greatest opportunities for investors to leverage emerging global green standards will be in the less-developed regions of the world – despite various factors that inhibit environmental business practices – due to their much faster rates of population and economic growth. On the other hand, the disproportionate wealth and property investment in the developed world, in conjunction with greater acceptance of sustainability principles, provides more opportunities to improve the efficiency of the standing inventory.
Overall, the greatest opportunities for green building investment overall will be in the United States due to its large stock of aging investible real estate and sizable population growth relative to the world’s mature economies, as well as increasing green business practices and government policies. The United Kingdom, Germany, and Japan also rank high for both new construction and retrofits, as shown in the table on the following page.
China should see a significant amount of green construction due to its tremendous growth, though the green share of construction will be only moderate. Canada and Australia are notable for green building investment opportunities due to the strength of their sustainability commitments, despite relatively limited growth prospects. Outside these top markets, other leading markets include Brazil, India, and Russia among the “BRIC” nations, as well as South Korea, Italy, and Sweden.
* One limitation of this methodology is that it does not reflect the extent of green retrofits completed to date, which may overstate the retrofit potential in countries such as Japan that have been leaders in raising building efficiency standards. Although impossible to quantify across all countries with precision, the distortions introduced by this omission are not believed to be material overall. Even in the countries that have been the most proactive in upgrading their overall stock, new construction accounts for most of the green buildings; relatively few buildings, especially those more than 25 years old, have been upgraded to meet the full range of emerging sustainable building standards.
Exhibit 18: Retrofit Potential
Green Retrofit Investment Opportunities Scaled by Value of Potential Retrofit Stock - 2007
0
2
4
6
8
10
0 2 4 6 8 10
Sustainability Level*
Ret
rofit
Pot
entia
l
Source: RREEF Research
U.S.
JapanRussia
China India
S. Korea
BrazilFrance
Italy Australia
Indonesia
Turkey
Sweden
Canada
Netherlands
Spain
* Excluding Economic Factors
Low Green Share Moderate Green Share High Green Share
Mexico
Poland
Germany
U.K.
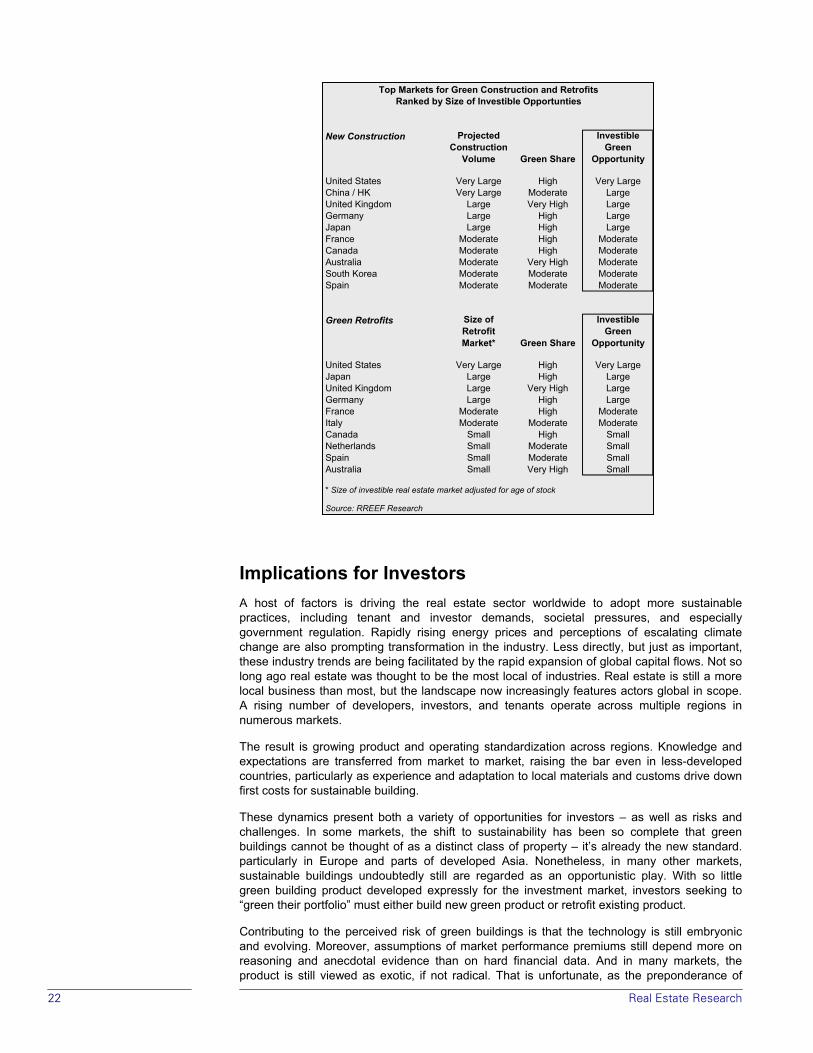
22 Real Estate Research
Implications for Investors A host of factors is driving the real estate sector worldwide to adopt more sustainable practices, including tenant and investor demands, societal pressures, and especially government regulation. Rapidly rising energy prices and perceptions of escalating climate change are also prompting transformation in the industry. Less directly, but just as important, these industry trends are being facilitated by the rapid expansion of global capital flows. Not so long ago real estate was thought to be the most local of industries. Real estate is still a more local business than most, but the landscape now increasingly features actors global in scope. A rising number of developers, investors, and tenants operate across multiple regions in numerous markets.
The result is growing product and operating standardization across regions. Knowledge and expectations are transferred from market to market, raising the bar even in less-developed countries, particularly as experience and adaptation to local materials and customs drive down first costs for sustainable building.
These dynamics present both a variety of opportunities for investors – as well as risks and challenges. In some markets, the shift to sustainability has been so complete that green buildings cannot be thought of as a distinct class of property – it’s already the new standard. particularly in Europe and parts of developed Asia. Nonetheless, in many other markets, sustainable buildings undoubtedly still are regarded as an opportunistic play. With so little green building product developed expressly for the investment market, investors seeking to “green their portfolio” must either build new green product or retrofit existing product.
Contributing to the perceived risk of green buildings is that the technology is still embryonic and evolving. Moreover, assumptions of market performance premiums still depend more on reasoning and anecdotal evidence than on hard financial data. And in many markets, the product is still viewed as exotic, if not radical. That is unfortunate, as the preponderance of
New Construction Projected Construction
Volume Green Share
Investible Green
Opportunity
United States Very Large High Very LargeChina / HK Very Large Moderate LargeUnited Kingdom Large Very High LargeGermany Large High LargeJapan Large High LargeFrance Moderate High ModerateCanada Moderate High ModerateAustralia Moderate Very High ModerateSouth Korea Moderate Moderate ModerateSpain Moderate Moderate Moderate
Green Retrofits Size of Retrofit Market* Green Share
Investible Green
Opportunity
United States Very Large High Very LargeJapan Large High LargeUnited Kingdom Large Very High LargeGermany Large High LargeFrance Moderate High ModerateItaly Moderate Moderate ModerateCanada Small High SmallNetherlands Small Moderate SmallSpain Small Moderate SmallAustralia Small Very High Small
* Size of investible real estate market adjusted for age of stock
Source: RREEF Research
Top Markets for Green Construction and RetrofitsRanked by Size of Investible Opportunties

Real Estate Research 23
evidence suggests, if not proves, that green buildings outperform financially and will physically outlive otherwise comparable conventional buildings. And the willingness of corporate tenants to purchase carbon offsets is further, if indirect, proof of pent-up demand for greener facilities.
Market Opportunities
For organizations directly involved in the creation or ownership and operation of real estate, the chief opportunities from a global perspective will be new construction in the emerging economies and renovation of older stock in the more developed nations. For new construction, the market will most readily support Class A buildings in Class A locations but all product types and qualities will be able to benefit from the greening trends. Retrofit opportunities will be almost as diverse as the existing building stock, but some of the easiest, most cost-effective conversions will be older Class B and C buildings in Class A locations, particularly those with solid structures and operable windows.
Market opportunities will not be limited to developers, however. Service providers, from architects to engineers and from leasing brokers to closing attorneys, are most gaining market share by specializing in green buildings. Vendors in aligned industries such as insurance, mortgage lending, building materials, and janitorial supplies are similarly developing specialized products focused on the green building sector. And new products and services are emerging, such as certification expeditors and alternative energy specialists.
All of these areas provide investors with opportunities to participate in the green building sector (see box). Conspicuously missing from this list, however, is the purchasing of green buildings directly, or shares in companies who own them exclusively, as well as securitized products such as green CMBS. With so little green building product created for the investment market so far, investors have had few opportunities to purchase certified product, even through REITs or mutual funds. Moreover, the multiplicity of certification and rating systems has prevented broad market acceptance of a single standard, which is crucial for securitized products. However, efforts are underway in key markets to uniform standards for mortgages, and LEED is now spreading to countries around the globe under the auspices of the World Green Building Council. These and other efforts should begin to provide markets with the standardization required for extending investor adoption.
Together with bringing more product to market through continued green construction and renovation to greener operations, standardization should provide the spark to truly ignite investor participation in the green building movement. As these trends mature, the industry should see more funds and investment vehicles created that focus on the ownership and operation of green buildings. In turn, demand for these products should be significant, from major financial institutions and small investors alike, as demonstrated by the popularity of SRI funds generally.
A final avenue of potential investment concerns the large and still growing stock of green product that is of investment-grade quality but still owner-occupied. This “investible” product is sometimes introduced into the investment market through sale-leaseback arrangements. A prominent example is the three-building sale of the CH2M Hill headquarters in the Meridian Office Park in Englewood, Colorado. CH2M Hill developed the buildings in 2002 and sold the LEED-Certified complex in September 2007 to a private REIT for a reported $138.5 million.
Worldwide we estimate that almost half (46%) of investible real estate is owner-occupied, but the proportions differ widely across regions. Reflecting their more entrepreneurial economies, mature economies tend to have a much greater share of their real estate owned by investors as opposed to the tenant. We calculate that about a third (32%) of investible property in mature economies is owner-occupied, meaning two thirds is investor-owned. The proportions are exactly reversed in emerging nations, with two thirds (68%) owner-occupied and one third owned by investors. The proportions for green buildings alone are unknown, but based on development patterns throughout the world, the owner-occupied share is almost certainly greater than that for conventional buildings. These assets represent another untapped opportunity for green building investment.
Focus: Competing for Green Building Investments Competing in the green building market will require specialized expertise, as well as identifying market opportunities. This competency will depend on several factors: • project experience in both
sustainable design construction and operations, and, perhaps in securing green certifications;
• a transportable product archetype or business model that can be adapted to local conditions and building materials;
• a deep bench of staff expertise;
• a network of relationships with capital sources, lenders, and other service providers themselves experienced in sustainable practices; and
• access to major multi-national tenants.
In addition, as demonstrated across many industries, building brand recognition around sustainability can yield distinct and enduring market advantages. Already, some leading real estate players are building and burnishing their green credentials – such as Hines, ProLogis, Lend Lease, and CB Richard Ellis -- though these firms tend to be either builders or service providers, as opposed to independent investors. To date few investment firms have clearly staked out sustainability as a central feature of their identity, but their ranks are growing.
24 Real Estate Research
Risk Mitigation
Beyond the significant and growing opportunities to invest in green buildings, for much of the real estate sector the focus will be at least as much on risk mitigation, particularly in developed economies, and for core investors generally. At least three major types of risk are material: market, regulatory, and physical.
Market Risks – Tenants are increasingly demanding greener facilities – particularly the prestige tenants that support new and high-value construction. To date few firms seem to be fully integrating their tenancy decisions into their sustainability reporting to the extent of breaking leases or selling energy-inefficient or otherwise less sustainable buildings, but anecdotal evidence (e.g., carbon offset purchases, survey data) suggests much greater activity can be expected in the coming years.
At present there is not enough green product to satisfy potential demand, yielding operating premiums to owners for the limited supply that is available. But that premium for green buildings will flip to a discount for obsolete construction once the supply of green building reaches a critical mass and establishes a new norm for institutional-quality real estate.
How soon? Certainly, the pace will vary by market, depending upon the pace of construction relative to the standing stock, the strength of tenant preferences for greener space, and the extent of government penalties on energy inefficiency, among other factors. Supply-constrained markets with significant barriers to entry will be protected longer than more dynamic, faster-growing markets. But our analysis suggests that in many markets – particularly the most desirable markets for tenants and investors in Northern Europe, the Pacific, and North America – the tipping point should be well within the traditional ten-year institutional hold period for investment real estate.
The immediate risks are to older, inefficient buildings, whose obsolescence will be reflected in diminished performance potential (lower rents and occupancy rates) and property value (equal to the cost to cure to the new market standard). Buyers will simply factor these issues into their pricing. Longer term, the risk will shift more broadly to institutions slow to change and cultivate the core competency required to convert to more sustainable buildings.
And with greater corporate transparency today, tenants cannot afford to have less stringent ecological standards in one region just because the prevailing local sustainability standards are lower – and nor should their landlords or property managers expect it. The thousands of corporate tenants who signed the Carbon Disclosure Project – and now must measure and reduce their carbon footprints – will demand efficiency and sustainability standards in Shanghai and Mumbai comparable to those they get in San Francisco and London, adapted for local climactic conditions and local resource availability and pricing.
A final market risk to consider: Corporate commitments to reducing their carbon footprints over time may translate into reduced space per worker. Such moves would reinforce longer-term trends occupancy trends that are reducing office demand per worker in many developed nations. On the other hand, rapid economic growth and maturation is causing booms in office demand in emerging nations.
Regulatory Risks – Governments clearly have the potential to impose on property owners significant penalties beyond those dictated by the market – altering the product that can be brought to market and the cost of occupying green vs. conventional buildings. More and more governments around the world will be mandating sustainable construction either through greener minimum standards or through energy disclosure requirements, which drives the market to be more sustainable through the weight of public pressure. For example, half of tenants surveyed in Europe believe that the new “EPCs [Energy Performance Certificates] will have an effect on their choice . . . when there is more of a choice of buildings available.”43
Regulatory pressures undoubtedly are driving the sector to embrace greener building standards faster than unfettered market dynamics would otherwise dictate. Again, the immediate risks are to older, inefficient buildings. Even if the government does not retroactively apply the new building standards, the market will render less sustainable buildings ever-more obsolete over time.
Real Estate Research 25
Environmental Risks – A final and emerging factor is the growing concerns over the damages that climate change presents for owners. A recent study by the UCL Environment Institute outlined potential property impacts, including the risks of floods, droughts, and extreme temperatures.44 A more comprehensive US government report documented the impact of extreme weather events on the economy generally as well as property, and outlined economic vulnerabilities attributable to climate change.45 Today few scientists doubt the need to address the causes of climate change before the impacts become truly catastrophic.
For property owners, the short-term risks are primarily two-fold: insurance cost spikes and/or property damage in more vulnerable regions, such as coastal areas, and the costs of operating property in regions subject to weather extremes, such as ever-escalating utility and maintenance expenses. Longer-term, particularly if current climate change trends continue, owners may need to weigh the risks of mass depopulation in the most vulnerable regions, leading to extreme property value losses over time.
Product Types
The foregoing trends will not be unique to any particular land use. All property types are seeing rising production of green buildings – and demand for much more. However, we expect the biggest move to green buildings will be in the properties that: (1) confer the greatest benefits to users and owners relative to conventional buildings, (2) align landlord and tenant interests in the property, and (3) offer tangible benefits that matter to tenants.
Clearly buildings that use high amounts of energy – climate controlled offices, for example – will gain more from sustainable construction than a property that typically has only a small share of space that less conditioned, such as a non-refrigerated warehouse. And tenants and owners alike leverage more prestige from green construction in prominent, centrally-located buildings than from more modest and remote structures.
With regard to the landlord-tenant dynamics, properties with full-service leases can more easily align the interests of landlord and tenant than net leased buildings, again favoring Class A offices over typical industrial space. Though green leases are being used to better align responsibilities and benefits, full-service leases still are the most manageable and present the least risk to each side.
On this basis, higher-end offices are seeing the greatest tenant interest and developer activity. To date retail has attracted relatively little attention, accounting for less than 10% of LEED certifications and under 1% of BREEAM, but those shares are bound to jump in the coming years, as large retail chains increasingly demand greener space due to their direct customer contact. Residential uses such as apartments and hotels are also starting to see greater green development, but the volume is being limited by the relatively tepid demand from consumers, as many of the benefits are not immediately obvious or material to occupants.
Finally, industrial properties are likely to lag other property sectors in converting to greener construction, though exceptions certainly do and will continue to exist. Aside from offering tenants fewer tangible benefits from more sustainable approaches, these bare-bones buildings often cannot generate the rents needed to offset more expensive construction. Also, industrial properties typically often are located in remote sites because their noxious uses need to be situated away from population centers – sites that most rating systems would not consider sustainable. Nonetheless, these market indications are not nearly absolute, as a growing number of firms are staking out reputations for greener industrial buildings worldwide.
Mature economies are also likely to see increasing market preference for real estate that embody the locational and functional attributes of sustainable development. Sometimes lumped together under labels such as smart growth and new urbanism, the market should increasingly reward denser, mixed-use and transit-oriented developments – projects located near transit stations and/or population centers.
Matthew Anderson of Foresight Analytics provided significant analytical and research support for this paper.

26 Real Estate Research
Appendix A: Data Description and Sources for Regional Analysis 1. Government Environmental Governance (Sources: Yale Environmental Sustainability Index (ESI), World Economic Forum)46 Principal components of survey questions addressing several aspects of environmental governance: air pollution regulations, chemical waste regulations, clarity and stability of regulations, flexibility of regulations, environmental regulatory innovation, leadership in environmental policy, consistency of regulation enforcement, environmental regulatory stringency, toxic waste disposal regulations, and water pollution regulations. Government Effectiveness (Source: World Bank)47 A measure of "the quality of public service provision, the quality of the bureaucracy, the competence of public servants, and the independence of the civil service from political pressures." This index describes the ability of governments to effectively deliver public services and make policy. Agenda 21 – Local Government (Source: International Council for Local Environmental Initiatives (ICLEI))48 The number of municipalities involved in the Local Agenda 21 (LA21) process (formal commitment to LA21 or are actively undertaking the process). LA21s were created to promote sustainable development at the municipal level in response to the 1992 UN Conference on Environment and Development's call to local governments to create their own agenda outlining local priorities.
Agenda 21 – Local Government per Capita (Source: ICLEI) See above, divided by population.
2. Green Building Industry (Quality and Depth) Green Building Council (Sources: World Green Building Council, individual councils)49 A measure of whether a country has a green building council, whether it is active or in the formative stage, and, in the case of an active council, how mature the council is. Green Buildings Registered (Sources: US GBC, individual councils, World GBC)50 The number of buildings registered, either with LEED or with the country’s own green building certification standard. Green Professionals (Sources: US GBC, individual councils, World GBC)51 The number of accredited green building professionals (from US GBC), or active members (from a country council). EU Greenbuilding (Source: European Commission)52 Bonus score - Does the country participate in the EU’s GreenBuilding Programme, a voluntary program meant to the enhance the realization of cost-effective energy efficiency potentials by creating awareness and providing information support and public recognition to companies whose top management is ready to show actual commitment to adopt energy efficient measures in non-residential buildings. Green Building Challenge (Source: International Initiative for a Sustainable Built Environment)53 Bonus score – has the country participated in and how many of the Green Building Challenges held in 1998, 2000, 2002 and 2005, and sponsored by IISBE. Showcased projects are viewed as examples of “best practices.”
Real Estate Research 27
3. Tenants CDP Disclosure (Source: Carbon Disclosure Project)54 Questionnaire on behalf of institutional investors sent to more than 2,800 of the world’s largest quoted companies. The current round is CDP6 (the sixth round). In 2007, more than 1,300 companies answered the questionnaire (including 77% of the FT500) in the fifth round (CDP5). ISO 14001 Certification (Source: ISO - International Organization for Standardization)55 The number of companies with ISO 14001 certification. ISO 14001:2004 provides guidelines on the elements of an environmental management system and its implementation, and discusses principal issues involved. ISO 14001:2004 does not specify levels of environmental performance. ISO 14001 Certification, Scaled by GDP (Sources: ISO, International Monetary Fun (IMF) for GDP) The number of companies with ISO 14001 certification, divided by GDP (for 2007 in USD). 4. Investors UNEP Financial Institution Signatories (Source: UNEP Finance Initiative)56 The number of UNEP FI signatories. UNEP FI is a global partnership between UNEP and the financial sector. Over 160 institutions, including banks, insurers and fund managers, work with UNEP to understand the impacts of environmental and social considerations on financial performance. Carbon Disclosure Project (CDP) Signatories (Source: Carbon Disclosure Project)57 The number of CDP signatories. The Carbon Disclosure Project (CDP) is an independent not-for-profit organization aiming to create a lasting relationship between shareholders and corporations regarding the implications for shareholder value and commercial operations presented by climate change. CDP Signatories, Scaled by Population (Sources: Carbon Disclosure Project, IMF (Population)) The number of CDP signatories, divided by population (as of 2007). Scaling by population allows smaller countries to rank higher. 5. Economic Factors Economic Stage (Source: World Bank, RREEF Research)58 The composition of GDP from the agriculture, industrial, and service sectors is analyzed, with low agriculture, high services, and average industrial shares of GDP receiving the highest scores. The most developed economies in the world generally have these characteristics. Urbanization (Source: World Bank)59 Percent of population in urban areas, as of 2005. Ability and Incentive to Pay Combination of three factors: Cost of Gasoline, Energy as an Input to GDP and Wealth. • Cost of Gasoline (Source: Factsoft AG – gasoline-germany.com)60 Cost Price per
gallon for regular gasoline, or if unavailable, average of other gasoline/diesel prices. • Energy as an Input to GDP (Source: IEA)61 Amount of primary energy used per unit of
GDP. Data reported in metric tons of oil equivalent (toe) per million constant 2000 international dollars.
• Wealth (Source: IMF)62 GDP (in USD) per capita (as of 2007).
28 Real Estate Research
6. Societal Attitudes Climate Change Importance (Source: The Pew Global Attitudes Project)63 Percentage of respondents answering “very serious” to the question, “How serious a problem is Global Warming?” Global Warming Concerns (Source: AC Nielsen)64 Percent of consumers naming Global Warming as one of their top two concerns. Environmental NGOs (Source: Center for the Study of Global Governance)65 The number of international non-governmental organizations (INGOs) that have either member organizations or individuals in each country. Density of Environmental NGOs (Source: Center for the Study of Global Governance) The number of international non-governmental organizations that have either member organizations or individuals in each country per one million population. 7. Other Scores / Calculations New Construction Potential (Source: RREEF Research) Calculated as the combination of forecasted GDP growth from 2007 to 2012 in percent (Source: The Economist), Ability and Incentive to Pay (from Economic Factors above) and estimated new construction in square feet. New Construction (in USD) – the forecasted increase in the dollar value of commercial real estate (see Commercial Real Estate Stock below) from 2007 to 2012 is used as a proxy for the dollar amount of new construction.
Retrofit Potential (Source: RREEF Research) Calculated as the combination of Stage of Development, Urbanization, and Ability and Incentive to Pay (all from Economic Factors above). • The size of Retrofit Potential is estimated by multiplying the Retrofit Potential score by the
estimated Age of Stock. • Age of Stock is estimated, using urban population growth since 1950 (source: UN), and a
depletion/obsolescence factor. Commercial Real Estate Stock in USD (Source: RREEF Research, “The Future of Size of the Global Real Estate Market, July 2007)66
Real Estate Research 29
Endnotes 1 “The Greening of US Investment Real Estate – Market Fundamentals, Prospects and Opportunities,” Strategic Outlook #57, Andrew J. Nelson, RREEF Research, November 2007. 2 World Energy Outlook 2007, International Energy Agency, an autonomous body established by the Organization for Economic Co-operation and Development (OECD). 3 “Curbing Global Energy Demand Growth: The Energy Productivity Opportunity,” McKinsey Global Institute, May 2007. 4 CO2 emissions from fuel combustion only, as of 2005, as estimated by the International Energy Agency, Key World Energy Statistics – 2007. 5 “Sustainable Building and Construction: Facts and Figures,” in UNEP Industry and Environment, United Nations Environment Programme, April-September 2003. 6 Global Economic Prospects 2007: Managing the Next Wave of Globalization’ World Bank, 2007. 7 See Buildings and Climate Change: Status, Challenges, and Opportunities, United Nations Environment Programme, 2007 and Energy Efficiency in Buildings: Business Realities and Opportunities, World Business Council for Sustainable Development, as well as McKinsey Global Institute, May 2007, op. cit. 8 “Global Mapping of Greenhouse Gas Abatement Opportunities up to 2030,” Vattenfall AB, January 2007. 9 World Business Council for Sustainable Development, op. cit. 10 “The Future Size of the Global Real Estate Market, Peter Hobbs and Henry Chin, RREEF Research, July 2007, and unpublished data updated to year-end 2007. Dollar equivalent basis, excluding Africa. 11 See, for example, "'Green Buildings' – Just Environmentally Sound or also Economical and a Stable Investment?", T. Lützkendorf, and D. Lorenz, in Real Estate Banking – Committed to Professionalism – Facts and Figures (Fact Book Real Estate 2007/2008), Association of German Pfandbrief Banks, Berlin, 12 See, for example, “Corporate Environmental Behavior and the Impact on Brand Values,” survey conducted by Ipsos MORI, published by Tandberg, October 2007. Also see: A.T. Kearney and Institute for Supply Management (ISM) Sustainability Management Survey, January 2007. 13 The classic study in this field is: “The Costs and Financial Benefits of Green Buildings – A Report to California’s Sustainable Building Task Force,” Greg Kats, Capital E, October 2003. Also see: “Towards a Green Investment Fund - Opportunities & Issues,” Compass Resource Management, February 2007, and “It Pays to Be Green,” Bennett Voyles, National Real Estate Investor, July 1, 2005. 14 See, for example: Quantifying the Business Benefits of Sustainable Buildings – Summary of existing research findings,” Alan Yates, Centre for Sustainable Construction, BRE, February 2001 and “Greening The Building And The Bottom Line: Increasing Productivity Through Energy-Efficient Design,” Joseph J. Romm, US Department Of Energy and William D. Browning, Rocky Mountain Institute, 1998. 15 See, for example, “Global Survey Shows 'Green' Construction Costs Dramatically Lower than Believed,” press release from the World Business Council on Sustainable Development, August 21, 2007, and “Market Barometer – 2005 Survey of Green Building,” Turner Construction, 2005. Also, “The Costs and Financial Benefits of Green Buildings – A Report to California’s Sustainable Building Task Force,” Principal Author: Greg Kats, Capital E, October 2003. 16 Analysis prepared by the Social Investment Research Analyst Network (SIRAN) and KLD Research and Analytics, Inc., as reported on the SIRAN website. 17 Carbon Neutrality and Carbon Offsetting in the FTSE All-Share 2007, Trucost, published jointly by Standard Life Investments and The Environment Agency (UK), 2007. 18 “Sustainability Perceptions and Trends in the Corporate Real Estate Industry,” global survey of 400 corporate tenants conducted by CoreNet Global and Jones Lang LaSalle as reported in: CoreNet Global and Jones Lang LaSalle, “Global Trends in Sustainable Real Estate: An Occupier’s Perspective,” February 2008, and Richard Kadzis, “Two New Studies from CoreNet Global Show Sustainability is Now a Mainstream Business Practice,” The Leader, CoreNet, January/February 2008. Also see: "Greening of Corporate America," SmartMarket report released by McGraw-Hill, May 2007; and “2007 Green Building Survey,” National Real Estate Investor and Retail Traffic, November 2007. 19 “Landlord & Tenant Survey,” Cushman & Wakefield Business Briefing, November 2007. The study was based on a survey of over 800 senior executives throughout western, central, and eastern Europe. 20 See, for example, “Central London Occupier Survey,” Frank Knight, September 2008, which showed that “energy efficiency” fell to tenth place among the top concerns of real estate directors of firms located in Central London. 21 State and Trends of the Carbon Market 2008, Karan Capoor and Philippe Ambrosi, World Bank, May 2008. 22 Global Trends in Sustainable Energy Investment 2008: Analysis of Trends and Issues in the Financing of Renewable Energy and Energy Efficiency, United Nations Environment Programme, Sustainable Energy Finance Initiative, and the New Energy Finance Limited, 2008. 23 “2007 Report on Socially Responsible Investing Trends in the United States,” Social Investment Forum;“European SRI Study – 2006,” Eurosif; and OWW Consulting Research 2007, as reported by SRI Asia. SRI investments totalled $2.7 trillion in the US as of 2007) and $1.3 trillion in Europe as of 2005. 24 “Responsible Investment Landscape 2008 – Asset Managers,” Investment & Pensions Europe, June 2008. 25 2008 Capgemini and Merrill Lynch Financial Advisor Survey, April 2008, as reported in their “2008 World Wealth Report.”
30 Real Estate Research
26 Responsible Investment in Focus: How Leading Public Pension Funds are Meeting the Challenge, The United Nations Environment Programme Finance Initiative, Asset Management Working Group, and The United Kingdom Social Investment Forum Sustainable Pensions Project. 2007 report. 27 Responsible Property Investing: What the leaders are doing, United Nations Environment Project – Financial Institutions Property Working Group, 2008. Also, Property Assets and the Principles for Responsible Investing: Guidance from Practice, Principles for Responsible Investment and UNEP Finance Initiative, June 2008. 28 “Global Real Estate Capital,” Jones Lang LaSalle, March 2008. This report specifically excluded entity-level transactions, such as the blockbuster Equity Office deal, as well as development deals and multi-family residential, all of which are included in the Real Capital Analytics report. 29 “Global Capital Trends,” Real Capital Analytics, July/August 2008. RCA reports that first-half sales in 2008 are down 42% over 2007. 30 Unpublished data from Real Capital Analytics, June 2008. 31 “Global Capital Trends,” Real Capital Analytics, March/April 2008. 32 Real Capital Analytics, 2008, op cit. 33 “Eurosif Real Estate Sector Report,” compiled by Dutch Sustainability Research, on behalf of SiRi Company, June 2007. 34 “Investor Network on Climate Risk Action Plan -- Capitalizing the New Energy Future: Minimizing Climate Risks, Seizing Opportunities,” February 2008. And “The Investor Statement on Climate Change Report 2007,“ The Institutional Investors Group on Climate Change. 35 UNEP FI, 2008, op. cit. 36 Among many studies, two of the most prominent have been: “Does Green Pay Off?,” Norm Miller, Jay Spivey and Andy Florance, CoStar, March 2008 and “Doing Well by Doing Good? Green Office Buildings,” Piet Eichholtz, Nils Kok, and John M. Quigley, Institute of Business and Economic Research Berkeley Program on Housing and Urban Policy, University of California, Berkeley, April 2008. Both of these studies examine LEED data only. An Australian perspective using Green Star data is provided in: “Valuing Green - How Green Buildings Affect Property Values and Getting the Valuation Method Right,”Richard Bowman and John Wills, Green Building Council of Australia, 2008. And a British view, again using LEED and Energy Star data is provided in: “Does it Pay to Be Green? Connecting Economic and Environmental Performance in Commercial Real Estate Markets,” Franz Fuerst and Patrick McAllister, The University of Reading Business School, June 2008. 37 For a somewhat contrarian view see “Quantifying ‘Green’ Value: Assessing the Applicability of the CoStar Studies,” Scott Muldavin, Green Building Finance Consortium, June 2008. 38 “Capital Trends Monthly – Office,” Real Capital Analytics, January 2008. 39 See, for example, “Is Trade Good or Bad for the Environment? Sorting Out the Causality,” Jeffrey Frankel and Andrew K. Rose, John F. Kennedy School of Government (Harvard University) Faculty Research Working Paper RWP03-038, September 2003. Also, International Trade and Climate Change: Economic, Legal, and Institutional Perspectives, World Bank, October 2007. 40 Investment & Pensions Europe, June 2008, op. cit. 41 See, for example, “The Green Lease -- What’s In It for Both Landlord and Tenant?” from Lessons Learned: The Costs and Benefits of High Performance Buildings, Earth Day New York, forthcoming. 42 Global Demographics 2008: Shaping Real Estate’s Future, M. Leanne Lachman, and Deborah L. Brett, Urban Land Institute, June 2008. 43 Cushman & Wakefield Business Briefing, November 2007, op. cit. 44 “Climate Change – The Risks for Property in the UK,” University College London (UCL) Environment Institute, May 2008. 45 US Climate Change Science Program and the Subcommittee on Global Change Research, Weather and Climate Extremes in a Changing Climate, Regions of Focus: North America, Hawaii, Caribbean, and US Pacific Islands, June 2008. 46 World Economic Forum Survey on Environmental Governance, from the Yale ESI Variable Profiles. http://www.yale.edu/esi/c_variableprofiles.pdf 47 World Resources Institute, “Environmental Governance and Institutions” data menu: http://earthtrends.wri.org/searchable_db/index.php?theme=10&variable_ID=1278&action=select_countries 48 World Resources Institute, “Environmental Governance and Institutions” data menu: http://earthtrends.wri.org/searchable_db/index.php?theme=10&variable_ID=661&action=select_countries 49 http://www.worldgbc.org/council-development/member-green-building-councils 50 Multiple sources. See for example, “LEED Projects Directory” http://www.usgbc.org/LEED/Project/CertifiedProjectList.aspx 51 Multiple sources. See for example, “LEED Accredited Professionals Directory.” http://www.usgbc.org/LEED/AP/ViewAll.aspx 52 Membership information taken from the website, http://www.eu-greenbuilding.org/ 53 “Green Building Challenge Archives” at: http://www.iisbe.org/ 54 Results tabulated from website query, performed by country at: http://www.cdproject.net/results.asp 55 “The ISO Survey – 2006.,” released November 2007 at: http://www.iso.org/iso/survey2006.pdf 56 See link for source data: http://www.unepfi.org/signatories/index.html?&no_cache=1 57 See website for membership information. http://www.cdproject.net/index.asp 58 “World Development Indicators”: http://ddp-ext.worldbank.org/ext/DDPQQ/member.do?method=getMembers&userid=1&queryId=135 59 “Urbanization”: http://siteresources.worldbank.org/DATASTATISTICS/Resources/table3_10.pdf 60 Price comparison as of February 14, 2008: http://gasoline-germany.com/international.phtml 61 World Resources Institute, “Energy and Resources” data menu:

Real Estate Research 31
http://earthtrends.wri.org/searchable_db/index.php?theme=6&variable_ID=668&action=select_countries 62 World Economic Outlook (WEO). http://www.imf.org/external/ns/cs.aspx?id=28 63 “Global Unease With Major World Powers: Rising Environmental Concern in 47-Nation Survey,” released June 27, 2007: http://pewglobal.org/reports/display.php?ReportID=256 64 “Consumer Confidence, Concerns & Spending Intentions, a global Nielsen consumer report,” July 2007. http://www2.acnielsen.com/reports/documents/GlobalConsumerConfidenceJuly07.pd 65 World Resources Institute, “Environmental Governance and Institutions” data menu: http://earthtrends.wri.org/searchable_db/index.php?theme=10&variable_ID=575&action=select_countries 66 Population data is from the UN Population Division: http://esa.un.org/unup/index.asp
32 Real Estate Research
Important disclosure © 2008. All rights reserved.
No further distribution is allowed without prior written consent of the Issuer. RREEF is the brand name of the real estate, infrastructure and private equity division for the asset management activities of Deutsche Bank AG. In the US this relates to the asset management activities of RREEF America L.L.C.; in Germany: RREEF Investment GmbH, RREEF Management GmbH, and RREEF Spezial Invest GmbH; in Australia: Deutsche Asset Management (Australia) Limited (ABN 63 116 232 154) Australian financial services license holder; in Hong Kong: Deutsche Asset Management (Hong Kong) Limited (“DeAMHK”); in Japan: Deutsche Securities Inc. (*); in Singapore, Deutsche Asset Management (Asia) Limited (Company Reg. No. 198701485N) and in the United Kingdom, RREEF Limited, RREEF Global Advisers Limited, and Deutsche Asset Management (UK) Limited; in addition to other regional entities in the Deutsche Bank Group. (*) For DSI, financial advisory (not investment advisory) and distribution services only. Key RREEF research personnel, including Asieh Mansour, Chief Economist and Strategist and Peter Hobbs, Head of Real Estate Research are voting members of the investment committee of certain of the RREEF Alternative Investment Funds. Members of the investment committees vote with respect to underlying investments and/or transactions and certain other matters subjected to a vote of such investment committee. Additionally, research personnel receive, and may in the future receive incentive compensation based on the performance of a certain investment accounts and investment vehicles managed by RREEF and its affiliates. This material is intended for informational purposes only and it is not intended that it be relied on to make any investment decision. It does not constitute investment advice or a recommendation or an offer or solicitation and is not the basis for any contract to purchase or sell any security or other instrument, or for Deutsche Bank AG and its affiliates to enter into or arrange any type of transaction as a consequence of any information contained herein. Neither Deutsche Bank AG nor any of its affiliates, gives any warranty as to the accuracy, reliability or completeness of information which is contained in this document. Except insofar as liability under any statute cannot be excluded, no member of the Deutsche Bank Group, the Issuer or any officer, employee or associate of them accepts any liability (whether arising in contract, in tort or negligence or otherwise) for any error or omission in this document or for any resulting loss or damage whether direct, indirect, consequential or otherwise suffered by the recipient of this document or any other person. The views expressed in this document constitute Deutsche Bank AG or its affiliates’ judgment at the time of issue and are subject to change. This document is only for professional investors. This document was prepared without regard to the specific objectives, financial situation or needs of any particular person who may receive it. No further distribution is allowed without prior written consent of the Issuer. An investment in real estate involves a high degree of risk and is suitable only for sophisticated investors who can bear substantial investment losses. The value of shares/units and their derived income may fall as well as rise. Past performance or any prediction or forecast is not indicative of future results. The forecasts provided are based upon our opinion of the market as at this date and are subject to change, dependent on future changes in the market. Any prediction, projection or forecast on the economy, stock market, bond market or the economic trends of the markets is not necessarily indicative of the future or likely performance. For Investors in the United Kingdom: Issued in the United Kingdom by RREEF Limited or RREEF Global Advisers Limited of One Appold Street, London, EC2A 2UU. Authorised and regulated by the Financial Services Authority. This document is a “non-retail communication” within the meaning of the FSA’s Rules and is directed only at persons satisfying the FSA’s client categorisation criteria for an eligible counterparty or a professional client. This document is not intended for and should not be relied upon by a retail client. When making an investment decision, potential investors should rely solely on the final documentation relating to the investment or service and not the information contained herein. The investments or services mentioned herein may not be appropriate for all investors and before entering into any transaction you should take steps to ensure that you fully understand the transaction and have made an independent assessment of the appropriateness of the transaction in the light of your own objectives and circumstances, including the possible risks and benefits of entering into such transaction. You should also consider seeking advice from your own advisers in making this assessment. If you decide to enter into a transaction with us you do so in reliance on your own judgment. For Investors in Australia: In Australia, Issued by Deutsche Asset Management (Australia) Limited (ABN 63 116 232 154), holder of an Australian Financial Services License. An investment with Deutsche Asset Management is not a deposit with or any other type of liability of Deutsche Bank AG ARBN 064 165 162, Deutsche Asset Management (Australia) Limited or any other member of the Deutsche Bank AG Group. The capital value of and performance of an investment with Deutsche Asset Management is not guaranteed by Deutsche Bank AG, Deutsche Asset Management (Australia) Limited or any other member of the Deutsche Bank Group. Investments are subject to investment risk, including possible delays in repayment and loss of income and principal invested. For Investors in Hong Kong: Interests in the funds may not be offered or sold in Hong Kong or other jurisdictions, by means of an advertisement, invitation or any other document, other than to Professional Investors or in circumstances that do not constitute an offering to the public. This document is therefore for the use of Professional Investors only and as such, is not approved under the Securities and Futures Ordinance (SFO) or the Companies Ordinance and shall not be distributed to non-Professional Investors in Hong Kong or to anyone in any other jurisdiction in which such distribution is not authorised. For the purposes of this statement, a Professional investor is defined under the SFO. For investors in MENA region: This information has been provided to you by Deutsche Bank AG Dubai branch, an Authorised Firm regulated by the Dubai Financial Services Authority. It is solely directed at wholesale clients of Deutsche Bank AG Dubai branch, who Deutsche Bank AG Dubai branch is satisfied meet the regulatory criteria as established by the Dubai Financial Services Authority.
RREEF Research
Main Offices
Frankfurt
Mergenthalerallee 73-75 65760 Eschborn Germany Tel: +49 69 71704 906
Hong Kong
48/F Cheung Kong Centre 2 Queen’s Road Central Hong Kong Tel: +852 2203 8888 London
1 Appold Street Broadgate London EC2A 2UU United Kingdom Tel: +44 20 7545 8000 New York
280 Park Avenue 23W Floor New York NY10017-1270 United States Tel:+1 212 454 3900 San Francisco
101 California Street 26th Floor San Francisco CA 94111 United States Tel:+1 415 781 3300 Tokyo Floor 17 Sanno Park Tower 2-11-1 Nagata-cho Chiyoda-Ku Japan Tel:+81 3 5156 6000
RREEF Research
Publication Address: RREEF 101 California Street 26th Floor San Francisco, CA 94111 USA Website: www.rreef.com Additional information is available upon request
Europe Brenna O’Roarty Director +44 20 7545 6099 Lonneke Löwik Vice President +44 20 7545 6328 Maren Väth Vice President +49 69 717 04 204 Ermina Topintzi Assistant Vice President+30 210 7256 153 Susannah Hunter Assistant Vice President+44 20 7545 5150
Asia Pacific Tan Yen Keng Vice President +852 2203 8062 Koichiro Obu Vice President +81 3 5156 6000 Henry (Wei) Chin Vice President +852 2203 7908
Peter HobbsHead, Global Real Estate Research +44 20 7547 4855
Asieh Mansour Chief Economist and Strategist +1 415 262 2044
North America Alan Billingsley Director +1 415 262 2017 Brooks Wells Director +1 212 454 6437 Hope Nadji Director +1 415 262 2022 Andrew J. Nelson Vice President +1 415 262 7735 Bill Hersler Vice President +1 415 262 2075 Ross Adams Vice President +1 415 262 2097 Jaimala Patel Vice President +1 212 454 1752 Stella Yun Xu Assistant Vice President +1 415 262 7715
1-007392-1.1


