Snoring Detection in a Centrifugal Pump with Vibrations542561/FULLTEXT… · ·...
74
Snoring Detection in a Centrifugal Pump with Vibrations ALEXANDER BJARNESTAM FULLEMANN Master of Science Thesis Stockholm, Sweden 2009
-
Upload
nguyenminh -
Category
Documents
-
view
219 -
download
1
Transcript of Snoring Detection in a Centrifugal Pump with Vibrations542561/FULLTEXT… · ·...

Snoring Detection in a Centrifugal Pump with Vibrations
ALEXANDER BJARNESTAM FULLEMANN
Master of Science Thesis
Stockholm, Sweden 2009


Snoring Detection in a Centrifugal Pump with Vibrations
Alexander Bjarnestam Fullemann
Master of Science Thesis MMK 2009:43 MDA 351
KTH Industrial Engineering and Management
Machine Design
SE-100 44 STOCKHOLM


Examensarbete MMK 2009:43 MDA 351
Sörplingsdetektering i en Centrifugalpump med Vibrationer
Alexander Bjarnestam Fullemann
Godkänt
2009-06-16
Examinator
Jan Wikander
Handledare
Bengt Eriksson
Uppdragsgivare
ITT W&WW
Kontaktperson
Henrik Myringer
Sammanfattning
Detta examensarbete är utfört på ITT W&WW i Sundbyberg, Sverige, i samarbete med KTH,
Instutitionen för Maskinkonstruktion. Arbetet har gått ut på att finna parametrar som kan användas
för att detektera sörpling i en pump. Arbetet har fokuserat på att undersöka om vibrationer och ljud
kan ge information om när pumpen sörplar eller ej, samt att utveckla en algoritm baserat på dessa
parametrar.
När en pump pumpar en blandning av luft och vatten kallar man det att den sörplar. Detta innebär
slitage på pumpen samt energiförluster, då verkningsgraden minskar betydligt. Detta är ett problem
för bland annat dräneringspumpar inom gruv- och byggindustrin där permanenta installationer och
externa sensorer för att undvika sörpling ofta saknas. Det saknas idag en kommersiell fullt integrerad
sörplingsvakt för dräneringespumpar och att utveckla en pump med en integrerad sörplingsvakt vore
därför mycket intressant.
För att kunna skapa en algoritm för sörplingsdetektering har mätningar av vibrationer samt ljud
under sörpling utförts på en 2620 dräneringspump från ITT W&WW. Signalerna har sedan
analyserats med hjälp av programmet Matlab från MathWorks. Fokus har legat på att finna så
alllmäna parametrar som möjligt, för att kunna detektera sörpling för olika pumpar och situationer.
Enligt mätningarna varierade energiinehållet i vibrationernas frekvenskomponenter mer vid sörpling
än vid normala förhållanden, vilket ledde till att sörplingsdetekteringsalgoritmen baserades på detta
fenomen. Denna karaktäristik för vibrationerna uppträdde genomgående för de testade situationerna.
Slutligen testades algoritmen med hjälp av simulationer med de uppmätta signalerna och visade sig
fungera i extremfallen av alla de testade situationerna.


Master of Science Thesis MMK 2009:43 MDA 351
Snoring Detection in a Centrifugal Pump with Vibrations
Alexander Bjarnestam Fullemann
Approved
2009-06-16
Examiner
Jan Wikander
Supervisor
Bengt Eriksson
Commissioner
ITT W&WW
Contact person
Henrik Myringer
Abstract
This Master Thesis work has been performed at ITT W&WW in Sundbyberg, Sweden in
collaboration with KTH, Department of Machine Design. The work has been to find parameters that
can be used to detect snoring in a pump. The work has focused on investigating if vibrations and
sound could provide information about if the pump was snoring or not, as well as to develop an
algorithm based on these parameters.
When a pump is pumping a mixture of air and water it is said to snore. This causes wear and tear on
the pump as well as energy losses, since the efficiency of the pump decrease considerably. This is a
problem for among others drainage pumps in the mining and construction industry where permanent
installations and external sensors to avoid snoring seldom are used. Today no commercial fully
integrated application for preventing snoring in drainage pumps exists and to develop a pump
capable of preventing snoring would therefore be very desirable.
In order to create an algorithm for detecting snoring measurements of the vibrations and sound
during snoring have been done on a 2620 drainage pump from ITT W&WW. The signals have then
been analyzed with the help of the program Matlab from MathWorks. Focus has been on finding as
general parameters as possible, in order to detect snoring from different pumps and situations.
According to the measurements the energy contained in the frequency components of the vibrations
varied more with snoring than during normal conditions, which led the snoring detection algorithm
to be based on that phenomenon. This characteristic for the vibrations was seen consistently for the
tested situations.
The developed algorithm was finally tested in simulations with the measured signals and was shown
to work for the extreme cases of all the tested situations.


Snoring Detection in a Centrifugal Pump with Vibrations Acknowledgements
Acknowledgements
First and foremost I would like to thank my advisor and supervisor at ITT Water & WasteWater,
Henrik Myringer and Jürgen Mökander, for their support during this project. Their help with
everything from finding equipment to discussions about technical solutions was invaluable. I feel the
same gratitude towards my advisor at KTH, Bengt Eriksson, who during our discussions helped me
think in new ways.
I would also like to take the opportunity to thank Gert Hallgren, Staffan Olsson and Stefan Nordemo
at ITT W & WW for providing valuable feedback and different perspectives throughout the project,
the skilled and helpful people working in the lab for helping me with way too many things and
Rainer Balssen, formerly at ITT, for his help regarding vibration measurements.
Finally, I would like to thank Corelatus and John Fullemann for letting me use their lab during the
project.

Snoring Detection in a Centrifugal Pump with Vibrations Contents
Contents
Acknowledgements ......................................................................................................................... 1
1 Introduction ............................................................................................................................. 1
2 Background.............................................................................................................................. 2
2.1 ITT Water & WasteWater ............................................................................................................. 2
2.2 Problem description ..................................................................................................................... 2 2.2.1 The drainage pump ................................................................................................................................ 2 2.2.2 The effects of snoring ............................................................................................................................. 3 2.2.3 The never snoring pump ........................................................................................................................ 3
2.3 Scope and target .......................................................................................................................... 3 2.3.1 Target .................................................................................................................................................... 3 2.3.2 Scope and limitations ............................................................................................................................. 4
2.4 Requirements ............................................................................................................................... 4 2.4.1 The drainage pump ................................................................................................................................ 4 2.4.2 The application ...................................................................................................................................... 4 2.4.3 The detection algorithm ......................................................................................................................... 5
2.5 Existing methods of snoring detection ......................................................................................... 5 2.5.1 Integrated flow meter ............................................................................................................................ 5 2.5.2 Thermal water level sensor .................................................................................................................... 5 2.5.3 Current characteristics analysis – FPC 80 & FPC 100................................................................................ 6 2.5.4 Current characteristics analysis – current variations ............................................................................... 6 2.5.5 Water level sensor ................................................................................................................................. 6 2.5.6 Other methods ...................................................................................................................................... 7
2.6 A new approach – Vibration and acoustic analysis ....................................................................... 7 2.6.1 Previous Studies ..................................................................................................................................... 7 2.6.2 A snoring algorithm based on sound and vibrations ................................................................................ 8
3 Theory ...................................................................................................................................... 9
3.1 The centrifugal pump ................................................................................................................... 9 3.1.1 The basic principle ................................................................................................................................. 9 3.1.2 Categorization........................................................................................................................................ 9 3.1.3 Power composition ...............................................................................................................................10 3.1.4 Losses and efficiency .............................................................................................................................11
3.2 Vibration and sound analysis ..................................................................................................... 14 3.2.1 Measurements ......................................................................................................................................14
Vibration measurements ................................................................................................................................14 Sound measurements ....................................................................................................................................14
3.2.2 Signal analysis .......................................................................................................................................14 The discrete Fourier transform .......................................................................................................................15 The fast Fourier transform .............................................................................................................................15 Power spectral density ...................................................................................................................................15 Amplitude spectrum.......................................................................................................................................15
3.2.3 The theory of snoring and vibrations .....................................................................................................15

Snoring Detection in a Centrifugal Pump with Vibrations Contents
4 Method .................................................................................................................................. 17
4.1 Test design ................................................................................................................................. 17 4.1.1 Tested situations and cases ...................................................................................................................17 4.1.2 The test rig ............................................................................................................................................18 4.1.3 Sensors .................................................................................................................................................20
4.2 Measurements ........................................................................................................................... 22 4.2.1 Measurement resources .......................................................................................................................22 4.2.2 Execution ..............................................................................................................................................23
4.3 Data acquisition and treatment ................................................................................................. 23 4.3.1 Analysis resources .................................................................................................................................23
4.4 Simplifications and limitations ................................................................................................... 24
5 Measurements and analysis .................................................................................................. 25
5.1 Sensor and measurement results ............................................................................................... 25 5.1.1 Accelerometer - results .........................................................................................................................25 5.1.2 Mems-microphone - results ..................................................................................................................27 5.1.3 Contact microphones - result ................................................................................................................27 5.1.4 Sensor analysis - discussion ...................................................................................................................28
5.2 Data analysis .............................................................................................................................. 29 5.2.1 Signal characteristic – Reference situation .............................................................................................29
Test case 1 - Wear resistant impeller ..............................................................................................................29 Test case 2 – Clog resistant impeller ...............................................................................................................37 Conclusion .....................................................................................................................................................45
5.2.2 Signal characteristics - geodetic height ..................................................................................................45 Test case 1 – wear resistant impeller ..............................................................................................................45 Test case 2 – Clog resistant impeller ...............................................................................................................46 Conclusion .....................................................................................................................................................46
5.2.3 Signal characteristics – Pump orientation ..............................................................................................46 Test case 1 – Wear resistant impeller, 45 degrees inclination ..........................................................................47 Test case 2 – Wear resistant impeller, 0 degrees inclination............................................................................48 Test case 3 – Clog resistant impeller, 45 degrees inclination ...........................................................................49 Test case 4 – Clog resistant impeller, 0 degrees inclination .............................................................................50
5.2.4 Signal characteristics – Changing outgoing flow .....................................................................................51 Test case 1 – Wear resistant impeller .............................................................................................................51 Test case 2 – Clog resistant impeller ...............................................................................................................52
5.2.5 Signal characteristics – Reflow...............................................................................................................53 5.2.6 Signal characteristics – Discussion .........................................................................................................53
5.3 Algorithm Synthesis ................................................................................................................... 54 5.3.1 Background theory ................................................................................................................................54 5.3.2 Algorithm description ...........................................................................................................................54 5.3.3 Test results ...........................................................................................................................................56
The situations covered by the detection algorithm .........................................................................................57
6 Results ................................................................................................................................... 58
6.1 Summary .................................................................................................................................... 58
6.2 Conclusions ................................................................................................................................ 58
6.3 Further studies ........................................................................................................................... 58 6.3.1 New measurements ..............................................................................................................................58

Snoring Detection in a Centrifugal Pump with Vibrations Contents
6.3.2 Different algorithm ...............................................................................................................................59 6.3.3 Implementation on a pump controller ...................................................................................................59 6.3.4 Product aspects ....................................................................................................................................59 6.3.1 Additional uses for vibration sensors .....................................................................................................59
6.4 Recommendations ..................................................................................................................... 59
7 References ............................................................................................................................. 60


Snoring Detection in a Centrifugal Pump with Vibrations 1 Introduction
Alexander Bjarnestam Fullemann 1
1 Introduction
When a water pump is pumping a mixture of air and fluid, the pump is said to snore. During snoring
the pump suffers high mechanical stress at the same time as the efficiency greatly decreases. Usually
the water level or flow of the pump is regulated to avoid snoring but in situations with many
temporary placements of pumps no such surveillance is available. Such is the case for submersible
drainage pumps used in construction and mining. A method of preventing snoring in drainage pumps
without depending on external equipment would mean huge savings in the form of reduced energy
costs and less wear on the pumps.
In this master thesis the connection between vibrations, sound and snoring in a submersible drainage
pump from ITT have been examined and analyzed in order to find parameters for an algorithm that
could detect snoring.
An empirical approach was used and the vibrations from a 2600-submersible drainage pump were
measured with different parameters in order to investigate their effects on the vibration
characteristics of the pump. The investigated parameters were different geodetic height, different
types of impellers, having a different inclination of the pump, the presence of incoming water and
varying outgoing flow. Common parameters for distinguishing between snoring and normal
operation were identified and were the basis for an algorithm that detected if the pump was snoring
or not. The algorithm was then tested in simulations with measured data from the drainage pump.
The developed algorithm was successful in all the tested situations and did not require any input
from users. More tests and further work on an algorithm are needed before it can be said with
confidence weather the method will work or not, but thus far no unsolvable problems have arisen.
The next logical step is to analyze data from more pumps and situations to further generalize the
algorithm.
A brief summary of the different parts of the thesis:
In section 2 the background for the thesis project is presented, together with a summary of some of
the alternative approaches to preventing snoring.
In section 3 basic theory regarding centrifugal pumps and vibration measurements are presented.
In section 4 the overarching method used during the project is presented, as well as how the
measurements and design were carried out.
In section 5 the results from the measurements and the simulations with the algorithm are presented.
The measured data from different situations and sensors are analyzed, and the algorithm synthesis is
explained.
In section 6 the conclusions to the project are presented, together with recommendations and
possible future areas of interest.

Snoring Detection in a Centrifugal Pump with Vibrations 2 Background
2 Alexander Bjarnestam Fullemann
2 Background
2.1 ITT Water & WasteWater
ITT Water & WasteWater, hereby referred to as ITT W&WW, is part of the global concern ITT. ITT
W&WW is operating in 140 countries with 6000 employees globally and are focused on producing
water treatment equipment, such as submersible pumps, mixers and mechanical aeration equipment
for water and waste water treatment, raw water supply, industrial processes, mining and construction
as well as for irrigation.
2.2 Problem description
2.2.1 The drainage pump
A drainage pump is a pump used for draining different types of reservoirs. In this master thesis
submersible centrifugal electric drainage pumps will be examined. They are mainly used within
construction and mining, as they are mobile and designed to be easy to move and setup. Submersible
means that the motor and impeller housing are combined into one water tight unit, and the whole
pump is submersed in the reservoir it needs to drain. The environment for these kinds of pumps is
demanding and they can pump anything from mud and sludge to water with gravel in it. The pump
models from the 2600-series of dewatering, or drainage pumps from ITT W&WW are shown in
Figure 1.
Figure 1 The 2600-series of drainage pumps from ITT W&WW

Snoring Detection in a Centrifugal Pump with Vibrations 2 Background
Alexander Bjarnestam Fullemann 3
The usage of drainage pumps is by its nature temporary. They are seldom used at the same place for
long which makes the amount of fixed installations around them minimal. More often than not the
pump is connected to a power supply, unceremoniously dropped into the water reservoir about to be
drained and left until the reservoir in question is empty. Often this occurs during the night, which
means that no one is there to turn it off when it completes its mission. This also means that extra
equipment like depth-sensors, rpm-controllers and dry-running protection rarely are used with the
pumps.
2.2.2 The effects of snoring
When a centrifugal pump is running on a mixture of water and air the pump is experiencing heavy
mechanical and thermal stress. The flowing water is important for the cooling of the engine. Without
it the temperature in the pump rises to levels which significantly reduce component life-span,
primarily in the electric motor and electronics. Another effect of reduced water flow is that particles
which during normal conditions are transported further away in the system with the water begin to
sediment in the pump. This causes extra wear on the impeller, the pump housing and the motor. One
final reason of avoiding dry-running is that since no water, or significantly less water than normal is
transported the pump is not doing any work. Energy and the pump‟s life are then wasted.
2.2.3 The never snoring pump
A reduction or elimination of snoring would save big amounts of energy and a reduction of repairs
which would decrease the cost of dewatering significantly. ITT W & WW have a history of
innovation and of being a technology leader in the world of pumping and dewatering. A pump with
integrated snore-detection and prevention would suit their product portfolio and enable them to stay
ahead in the years to come. No competitors offer this functionality in a drainage pump today.
2.3 Scope and target
2.3.1 Target The target of the thesis is to find one or more parameters for detecting when a drainage pump is
pumping air, commonly called snoring, and to use these parameters to create a method or algorithm
for detecting snoring. Some kind of verification of the algorithm in the case one is found is also
within the scope of the thesis. The work with the thesis is planned to last 20 weeks.
The tests will be carried out on centrifugal drainage pumps from the 2600-series produced by ITT
W&WW. The parameters for detecting snoring will be sought within vibrations and sound coming
from the pump.
Another area to investigate in this project is which kind of vibration sensor would be the most
interesting to investigate. Different sensor approaches will be examined.

Snoring Detection in a Centrifugal Pump with Vibrations 2 Background
4 Alexander Bjarnestam Fullemann
An empirical approach will be used since it is hard to find models modeling the pump-system with
enough accuracy to identify and separate vibrations caused by snoring from vibrations caused by
other sources. The development of such a model falls outside the scope of this thesis.
2.3.2 Scope and limitations The scope of this master thesis lies in the evaluation of the function. The connection between
vibration signals and snoring will be examined. If the connection is strong enough an algorithm for
recognizing snoring will be sought, with the goal of finding a method as general as possible capable
of detecting snoring during as many conditions as possible.
Due to time constraints the implementation of an eventual algorithm will not be examined, and
neither will product-aspects. The discussion regarding which hardware to implement the algorithm
on, user interactions and design towards limiting production costs will be very brief.
This is also intended to be a concept-study. That means that the examinations will be based on a
small portion of the theoretical situations and pump models available. The measurements were
initially planned to be done on the 2620 and 2640 pump models, but due to time constraints only the
2620 was examined. A selection of the most common and representative use-cases were also
examined.
2.4 Requirements
2.4.1 The drainage pump
In order to withstand the harsh environment and the ever changing working conditions the drainage
pumps have to be robustly constructed and not dependant on external devices. They also need to be
reliable, safe and easy to use.
2.4.2 The application
Due to the nature of the work required by the pumps the solution needs to be integrated into the
pump. This creates limits on space, production costs, installation methods, robustness and longevity
among others. The system should ideally be usable in all kinds of pumps and all kinds of situations,
produced for a minimal cost and without the need for future repairs. The amount of input from
typical users should be kept to a minimum, preferably none. The application need to be self
contained and not dependant on anything other than power. The sensors for identifying vibrations
must be small and robust enough to be mounted inside the pump. If they are mounted outside a
secure connection to the inside need to be devised. The number of changes in the mechanical
construction should be kept to a minimum.

Snoring Detection in a Centrifugal Pump with Vibrations 2 Background
Alexander Bjarnestam Fullemann 5
2.4.3 The detection algorithm
The requirements on a valid method for detecting snoring are functional, practical and economical.
For a snoring detection method to be viable it must be able to detect snoring in a high number of
cases and situations. Ideally the same algorithm should work for every kind of pump, impeller and
situation. It should also be robust enough to allow modifications to pumps and to work with future
pump models, without too extensive redesigns of the algorithm. The algorithm should ideally be
executable by low cost hardware that physically can be installed in the pumps.
2.5 Existing methods of snoring detection
Several approaches to detect snoring exist. The most intuitive way of avoiding snoring is to simply
monitor the out-flow of the pump or the water level and from this information stop or slow the pump
when the outflow or water level drops below a certain threshold. Methods working on this principle
are common but require more or less permanent installations, since the sensors for measuring water
level and flow are external and take some time to install. Since an integrated solution is desirable,
ITT W & WW have investigated different mechanical, thermal and electrical approaches to this
problem. No patents or other commercial solutions to integrate snoring detection have of this writing
been found. The method currently recommended in industry journals as optimal is to use a level
sensor to monitor the water level and control the flow of the pump accordingly[1], which suggests
that there is no reliable, integrated application for that on the market.
2.5.1 Integrated flow meter
One approach is to measure the out flow of the pump. If this can be done in an integrated application
it could serve as a successful snoring detector. Different concepts have been created and examined in
collaboration with ITT W&WW, first in S. Svensson and A. Wikingsson‟s work[2], then by H.
Linder and G. Johansson[3]. The concepts showed promise and proved to be successful in tests but
have difficulties detecting a flow when the pump is lying down. The risk of clogging or mechanical
wear on the measuring devices is also one that needs to be better examined. These concepts only
exist as prototypes. No commercial products based off these concepts have of this writing been
found.
2.5.2 Thermal water level sensor
Detecting the presence of water outside the pump with the help of thermal sensing is another
approach. The information thereby provided would allow the pump to detect when the water level
drop below a certain point. This would then indicate snoring. A concept study has been conducted by
M. Markström in collaboration with ITT W & WW, where the idea showed promise[4]. Thermal
sensors were installed on the outside of the pump and one of them heated. The presence of water
would keep them the same temperature but in air there would be a difference in temperature. The
sensor was however sensitive to external variations in heat and humidity which makes it an

Snoring Detection in a Centrifugal Pump with Vibrations 2 Background
6 Alexander Bjarnestam Fullemann
unsatisfactory method in certain situations. The theory is tested in a prototype but there are no
commercial snoring detecting applications based on this principle.
2.5.3 Current characteristics analysis – FPC 80 & FPC 100
Experiments analyzing the characteristics of the current and voltage have thus far proved to be the
most fruitful approach to detecting snoring. The control unit from ITT W & WW, FPC 100,
basically works by analyzing the current characteristics. When the pump is pumping water a control
unit measuring the power to the pump is calibrated, and when the power drops to a certain limit the
control unit consider the pump to be snoring and shuts it off. With simple input from the operator
this method works satisfactory. The problems have risen when the system was to be integrated in the
pump. A drawback with this method is the need for a calibration every time conditions change, in
effect every time the pump is moved. Due to the high mobility of drainage pumps this is impractical
and time consuming. No practical way of auto-calibrating the pump has then been found.
2.5.4 Current characteristics analysis – current variations
Experiments have been conducted with an algorithm that detects snoring by analyzing variations in
the electric current. Different variations in the current give an indication if the pump is snoring or
not. The application can be placed inside the pump, so the method satisfies the requirement for
integration. No calibration is necessary when the situation of the pump change. The problems lie in
reliably detecting snoring in a big enough number of situations. The method have problems detecting
snoring in a few specific situations. These situations are during very low flow and when the pump
has pumped away all the water and there is no inflow.
2.5.5 Water level sensor
The most commonly used method is to use floating level switches attached to the pump. This can be
seen in Figure 2. The switch will then give a binary answer to if the water level is above or under a
certain level in relation to the level sensor. It is a commercially available application.

Snoring Detection in a Centrifugal Pump with Vibrations 2 Background
Alexander Bjarnestam Fullemann 7
Figure 2 - Drainage pump with binary water level sensor
It is a cheap and intuitive solution. The disadvantages with this method are that the floating switches
quickly stop working due to the harsh conditions the drainage pumps operate in and that they get
entangled easily.
2.5.6 Other methods
Apart from these approaches the research are is largely unexplored. No patents, scientific
publications or commercially available products regarding an integrated way of detecting snoring of
this writing have of this writing been found. Some insights have been gained from studying papers
on vibration analysis in order to monitor centrifugal pumps for breakdowns and wear and tear such
as J. K. Sinha and A. R. Rao‟s work with vibration based diagnosis of pumps[5] and R. S. Beebes
work with condition monitoring of pumps[6], as well as the studies of the electrical signature of
cavitation in A. Hernandez-Solis work[7].
2.6 A new approach – Vibration and acoustic analysis
The previous attempts at making an integrated application for detecting snoring suggests that a new
approach is needed. Vibrations and sound show promise.
2.6.1 Previous Studies
A study done at ITT W & WW by Å. Conradsson[8] showed that there was a connection between
snoring in drainage pumps and vibrations, namely that the root mean square, or rms-value of the
acceleration of a pump increased during snoring. The absolute levels of vibrations varied more
between different wheel types than between snoring and normal pumping which suggested that
further studies were necessary in order to create a general approach. Since the frequency-
characteristics of the vibrations were not examined, hopefully more detailed studies of the actual
frequencies during snoring would make a general detection algorithm possible. The difficulties were
in finding a general detection algorithm working for a large number of pumps, impellers and
situations, since absolute-level thresholds could be used for each specific pump and situation.
The results from C. Y. Ho‟s work at ITT[9] further strengthened the connection between vibrations
and snoring. The characteristics of the vibrations changed greatly due to clogging, a phenomenon of
similar nature to snoring. Besides that, many experienced mechanics working with pumps have

Snoring Detection in a Centrifugal Pump with Vibrations 2 Background
8 Alexander Bjarnestam Fullemann
reported an audible noise when the pump begins to snore. This indicates a connection between
snoring and noise, which makes it interesting to also investigate this connection.
Initial measurements done at ITT by R. Balssen with a new sensor also confirms the results from the
study done by Å. Conradsson[8], that the amplitude of vibrations in a pump change when the pump
goes from pumping water to snoring.
2.6.2 A snoring algorithm based on sound and vibrations
With the support of the results of previous measurements in the area (see above), it is believable that
an algorithm for detecting snoring can utilize vibrations and sound. However, before an algorithm
can be synthesized more data from when the actual pumps are snoring is needed. Other uncertainties
are for instance what type of sensors to use, where they are to be placed and how many that is
needed

Snoring Detection in a Centrifugal Pump with Vibrations 3 Theory
Alexander Bjarnestam Fullemann 9
3 Theory
3.1 The centrifugal pump
3.1.1 The basic principle
A pump is a machine that transfers mechanical energy to a liquid or a gas. The manner in which
pumps transmit energy to the pumped media is often used to divide them into classes. It can either be
by positive displacement or kinetic displacement. The centrifugal pump is a kinetic displacement
pump and works by impelling kinetic energy to the fluid through a rotating element [10]. The
centrifugal pump is a trusted pump design. The simple construction and the overall sturdiness has
contributed to widespread use in the most diverse environments[10].
In essence a rotating element, the impeller, “impels” mechanical energy to a fluid. A collector,
volute or a diffuser, then guides the fluid to a discharge. It is classified as a „rotodynamic‟ pump
since kinetic energy via the impeller continuously is transferred to the water[11]. This can be seen in
Figure 3.
Figure 3 Schematic of a single volute centrifugal pump
3.1.2 Categorization
Depending on the shape of the impeller and the volute seen in Figure 3, the pump is given different
characteristics. Pumps using a single volute are called volute pumps, while pumps using a diffuser
are called diffuser pumps. Such a construction can be seen in Figure 4.
OUTLET
IMPELLER EYE
VOLUTE IMPELLER
INLET

Snoring Detection in a Centrifugal Pump with Vibrations 3 Theory
10 Alexander Bjarnestam Fullemann
Figure 4 Schematic of a diffuser centrifugal pump
Centrifugal pumps are further categorized as either single- or multi stage pumps. A multi stage pump
uses many impellers in either series or parallel to increase pressure or flow, respectively. The
impellers are categorized based on many factors, including their type as axial-, radial- (mixed) or
peripheral flow and if they are open or closed. These factors influence among other things the
maximum flow, the range of possible liquids to be pumped and the resistance to wear.
3.1.3 Power composition
The transfer of power from the shaft power to the pumped liquid is governed by the first law of
thermodynamics. Losses and efficiency are governed by the second law of thermodynamics. The
heat transfer during fluid flow in pumps is negligible in comparison to the other forces involved in
the process. This together with the weak temperature-dependency for the density of liquids make it
possible to write the first law of thermodynamics as follows:
Because
ROTATING IMPELLER
STATIONARY DIFFUSER VANES

Snoring Detection in a Centrifugal Pump with Vibrations 3 Theory
Alexander Bjarnestam Fullemann 11
The shaft power Ps is transferred to the fluid and expressed as the mass flow rate (often written Q
when talking about pumps) times the change in total enthalpy. E stands for energy and W is work, or
energy per time unit. The energies in a pumping system are kinetic energy, , static pressure
energy and static elevation energy . is the distance in elevation between the inlet level
and the outlet level, V is the velocity of the impeller, g is gravity, u are the losses, p is the pressure
and ρ is the density of the pumped liquid.
For a given centrifugal pump and a given rotation speed, the amount of transferred energy per unit of
mass is constant. The density of the liquid, and thereby the type of liquid, does not change the
amount of energy being transferred. This has led to that energy in centrifugal pump systems is often
referred to as “Head”:
The change in H, , is called Head, or since it includes the velocity head and the elevation head,
“Total Dynamic Head”. It is abbreviated simply “H” instead of . It stands for the height of a
theoretical water column being lifted by the pump if the static pressure head and the kinetic energy
head were converted without loss into static elevation head at the inlet and outlet.
3.1.4 Losses and efficiency
A real pump system, no matter how good, have losses, so the energy transferred to the water does
not only consist of useful kinetic energy , and static energy and . A part is
transferred to internal energy . This is mostly heat and is due to the second law of
thermodynamics:

Snoring Detection in a Centrifugal Pump with Vibrations 3 Theory
12 Alexander Bjarnestam Fullemann
The overall pump efficiency is:
The losses in a centrifugal pump can be mechanical, volumetric or hydraulic[11].
Mechanical losses come from external drags on the rotating element due to bearings, seals and fluid
friction on the outside surfaces of the impeller shrouds (disc friction). The biggest component is
normally the disc friction and the mechanical efficiency is the portion of the shaft power delivered to
the fluid flowing through the impeller passages.
Volumetric losses are external leakages leaking past the impeller and back into the inlet eye. This
leakage has received the full amount of power delivered to the fluid passing through the impeller.
Hydraulic losses are the ones occurring in the inlet branch, impeller, volute and outlet branch. The
ratio of output head to the input head is called the hydraulic efficiency. This is the main focus of
pump design for typical centrifugal pumps since mechanical and volumetric efficiencies are quite
high in comparison.
With constant shaft power and for a given pump geometry, the losses in the pump, , depends on
the flow Q (labeled in the equation above). Thus the effective total dynamic head, H, for a pump
varies with varied flow. This is illustrated in the performance characteristic curves of a pump. It
shows the developed head as a function of flow. See Figure 5. The flow for a given pump, fluid and
power, depends on the pipes geometry, diameter, the hoses, the geodetic height the fluid needs to be
pumped and in short, the pump system. The geodetic height means the height between water pumped
from one level to another level.

Snoring Detection in a Centrifugal Pump with Vibrations 3 Theory
Alexander Bjarnestam Fullemann 13
Figure 5 Actual HQ graph with losses subtracted from an ideal graph
As can be seen in Figure 5, the losses increase towards the extremes of the flow and head. The point
with the least losses is called the “Best Efficiency Point”, or BEP. This is the preferred operating
point of a centrifugal pump and should be considered when choosing one. Deviations from BEP
result in lost efficiency.
The sources for vibrations in centrifugal pumps during normal running conditions and with a
correctly working pump are mostly related to the so called vane pass frequency. Every time an
impeller blade passes a vane, see Figure 4, the pulse from the water being pressed outwards give rise
to vibrations. This frequency is:
The normal causes for vibrations in rotating machines, like shaft misalignment, imbalance and
mechanical problems like faulty bearings are of course a factor even for centrifugal pumps. The
effects of these causes are well documented in literature. When present, they can be very strong.
Another common, but unwanted, phenomenon in centrifugal pumps is cavitation. On the back of the
spinning impeller blades the pressure is lowered considerably. When it become lower than the
fluid‟s vapor pressure small bubbles of gas are created, even in relatively cold fluids. As the pressure
rise again these bubbles implode and the resulting pressure pulse is very high. This is a common
source of damage in the pump[10].
Ideal H-Q graph
Best efficiency point
Impact losses
Friction losses
Finite number of impeller blades

Snoring Detection in a Centrifugal Pump with Vibrations 3 Theory
14 Alexander Bjarnestam Fullemann
3.2 Vibration and sound analysis
Vibration analysis is relatively common for all kinds of machinery and pumps. Much information
about the state of a machine can be learned from studying vibrations and especially changes in
vibrations over time. Many techniques exist for detecting bearing faults, clogging in pumps or to
detect when the risk of a breakdown is increasing.
The difficulties with vibration, and sound analysis, lie in the measurement and the analysis itself.
Depending on the construction and type of machine the vibrations usually vary greatly depending on
operation, measurement place and age of the machine. Where to measure, what and how is very
important. The difficulties in modeling vibrations for a certain machine also make it difficult to give
general limits or formulas for vibration analysis. There are guidelines for certain types of machines,
like the classic Rathbone chart of 1939, which can be found in condensed form in [11], but to
discover critical vibration limits indicating a breakdown in a machine, the machine in question often
needs to be analyzed and tested. Usually, vibration analysis focuses on changes in vibrations[6],
which has made neural networks popular. They can “learn” and be adapted to a specific machine and
specific situation, like shown in[12]. They are however at the present time too resource demanding
to be of much interest for an integrated application for detecting snoring in a pump.
3.2.1 Measurements
Vibration measurements
When measuring vibrations one can measure placement, speed or acceleration. There is no universal
best-choice, so depending on the frequency range of interest, the machine, mounting capabilities and
measuring equipment a suitable measuring method need to be chosen. A summary can be found in S.
Goldman‟s book about vibration spectrum analysis, [13].
Special care need to be taken when mounting vibration sensors. Ideally they are placed as close to
the point of interest as possible, and with the strongest possible contact. A stiffer contact transfers
more high frequencies, with a loose mounting working as a low-pass filter.
Sound measurements
With sound measurements the direction and sensitivity of the microphone become important. Most
microphones have varying sensitivity based on how they are pointed[14]. This makes it important to
identify from where the sound source is coming when choosing a place for a microphone.
3.2.2 Signal analysis
When the signals of interest have been acquired the question of interpreting them arises. There are
several methods available.

Snoring Detection in a Centrifugal Pump with Vibrations 3 Theory
Alexander Bjarnestam Fullemann 15
The discrete Fourier transform
The discrete Fourier transform makes it possible to transform a finite, discrete function in the time
domain to a function in the frequency domain. More specifically it breaks down a function into its
sinusoidal base functions, showing the frequency spectrum components inherent in the function [15].
The sequence of N complex numbers is transformed into the sequence of N complex
numbers by the DFT. It is defined as follows:
The fast Fourier transform
The fast Fourier transform, or FFT, is an efficient algorithm for computing the discrete Fourier
transform, or DFT, and it‟s inverse. Often FFT is said when referring to DFT. By choosing the
number of discrete time samples, N, to a power of 2, the FFT reduces the number of operations from
O(N2) to O(Nlog(N)) operations.
Power spectral density
The power spectral density of a finite signal show how the energy within the signal is distributed
with frequency.
Amplitude spectrum
The amplitude spectrum of a finite signal show how the amplitude of the frequency components
contained in the signal is distributed with frequency.
3.2.3 The theory of snoring and vibrations
A clear definition of “snoring” is difficult to find. It is a transient phenomenon and not binary. It is
closely connected to the water level relative to the pump inlet, but also to the flow. A higher flow
will create a swirl, making air enter the inlet of the pump even though the water level is well above
the inlet. The flow affects at what water level compared to the inlet the pump will start to snore.
There are also different levels of snoring, depending on the amount of air in the fluid-air mix. For the
purpose of this thesis, snoring is defined as any time air enters the pump.
In theory, when the pump is pumping nothing but water (or a homogenous fluid) and the impeller
and volutes are symmetrical, the balance of the impeller and the water being driven should be

Snoring Detection in a Centrifugal Pump with Vibrations 3 Theory
16 Alexander Bjarnestam Fullemann
roughly balanced and periodic. When air is entering the inlet during snoring, however, the
distribution of weight on the impeller should theoretically be more random and less balanced, which
should give rise to vibrations in the pump. These mechanical vibrations should be measureable both
as acceleration of the pump body and as sound within and outside of the pump. The amount of air
entering the inlet should be influencing the vibrations. It is therefore reasonable to believe that there
exist a connection between vibrations in the pump and snoring, and that these vibrations can be
distinguished from vibrations caused by other sources. The load for the engine should also
theoretically decrease during snoring, so an increase in rotational speed and a decrease in the current
are to be expected.
In order to discover characteristics in the vibrations that indicates snoring the analysis will focus on
phenomenon that change between snoring and normal operation. It is reasonable to believe that the
vibrations from snoring will be linked to the impeller and the flow. This suggests that frequencies in
the range of the rotation frequency and its multiples should be the most promising to investigate.
This means frequencies in the range of 50 to 1000 Hz for typical pumps.
A synergy-effect of having sensors in the pump able to detect vibrations is that it also makes it
theoretically possible to detect other phenomena and conditions that can be identified through
vibration analysis, such as cavitation and mechanical wear, as investigated by A. Hernandez-Solis[7]
among others.
The expected sources of vibrations in centrifugal pumps are the rotational speed, the vane-pass
frequency and high frequency random noise from turbulence, around the 2000 Hz range (hydraulic
losses). Depending on the water temperature, cavitation can be present and disturbances and traces
of the motor current are also to be expected in case the measuring equipment and sensors aren‟t
completely shielded from interference. They should show up as peaks in a graph of the energy
composition in the frequency spectrum from the measured signals.

Snoring Detection in a Centrifugal Pump with Vibrations 4 Method
Alexander Bjarnestam Fullemann 17
4 Method
In order to choose the best method for solving the objectives specified at the beginning of the project
a literary study was conducted in order to identify probable risk factors and the field in question.
This can be seen in section 2.5 and 3.2.3. During the literary study it was discovered that knowledge
in the field regarding methods of detecting snoring in centrifugal pumps and the character of
vibrations was inadequate for developing a reliable detection-algorithm. More data and knowledge
about the vibrations during snoring was needed. During the project no model detailed enough to
simulate the vibrations in snoring was available or found so empirical tests were necessary in order
to get the needed data. In order to get data suitable for analysis the tests needed to be as accurate as
possible to the real working conditions of drainage pumps. Therefore typical user-cases and
situations for the pumps were identified.
The amount of data received during testing was very large which made manual analysis very time
consuming and difficult. Automated analysis methods were needed in order to speed up the process.
Based on the results from the analysis, a detection algorithm was developed and tested in simulations
with the collected data acting as input from the sensors. The algorithm was developed and tested
with measured data in steps. When an algorithm worked with the old data and situations, new
situations were added.
In order to get as much information as possible from each test, multiple sensors were used. A three
axis accelerometer, a microphone and two contact microphones, so called piezo electric elements
were installed.
4.1 Test design
4.1.1 Tested situations and cases
The measurements needed to be as realistic as possible in order to make a developed algorithm
robust. The measurements also needed to be controlled and performed in a laboratory environment.
In order to keep the number of tests down, as few tests as possible were planned.
In cooperation with a reference group drawing on ITT W & WW‟s experience from user scenarios,
demanding situations were identified. From these the most probable conditions that could be
simulated in ITT W & WW‟s laboratory were chosen.
The probable factors that affect the vibration characteristic, can be seen in Table 1 sorted from top to
bottom in order of priority:

Snoring Detection in a Centrifugal Pump with Vibrations 4 Method
18 Alexander Bjarnestam Fullemann
Impeller type
Pump orientation
Inflow to the pump
Changing out flow
Geodetic height Table 1 Factors that influence vibrations in pumps
The impeller type is believed to have a big impact on the vibrations. Earlier tests done by Å.
Conradsson[8] also confirm this theory. Changing the pump orientation means changing the
inclination of the pump, from standing to lying down. The pump orientation have shown to have an
impact in earlier tests when snoring was detected using variations in current, as in section 2.5.4.
Weather new water will flow into the reservoir with the pump or not will affect the time of the
snoring cycle which makes it interesting to investigate, and changes in the outgoing flow, especially
when the flow was very low, proved difficult for other snoring detection methods to detect. Changes
in the geodetic height have a big impact on the system characteristics, especially regarding pressure
pulsations and variations that might lead to changes in the vibration characteristic. The limited
height in the laboratory made it difficult to test very large differences in geodetic height, however, so
the tested height difference is lower than the one found in real systems. The difference between
“high” and “low” geodetic height was around 4 meters during the tests.
The pump model is believed to have a big impact on the vibrations. This will however also affect
testing time, since new sensors need to be installed in each pump tested. Only one pump model was
tested during this project.
4.1.2 The test rig
The tests were carried out in two separate tanks. The investigated drainage pump was placed in one,
pumping the water to another tank, where a second pump made sure the water could return to the
original tank. Two different sizes of tanks for the tested pump were used to change the time during
the snoring cycle, since it changed greatly depending on the outgoing and incoming water flow.

Snoring Detection in a Centrifugal Pump with Vibrations 4 Method
Alexander Bjarnestam Fullemann 19
Figure 6 Test rig used during tests
Figure 7 Drainage pump model 2620 used during tests

Snoring Detection in a Centrifugal Pump with Vibrations 4 Method
20 Alexander Bjarnestam Fullemann
The test rig can be seen in Figure 6. The smaller tank was used during a few tests to get a faster
snoring cycle during very low flow. The geodetic height was simulated by hanging the hose the
water was pumped through several meters above ground. In order to reduce the flow from the pump
a clamp was placed on the hose, thus simulating a long, winding hose or clogging in the system. The
pump being used during the tests can be seen in Figure 7.
4.1.3 Sensors
Since it was not clear which kind of sensors or which placement of said sensors would be successful
in detecting snoring, multiple sensor types were used during testing.
Sensor Sensitive span (Hz) Manufacturer Name
3 axis accelerometer 1-3000 STMicroelectronics LIS3L02AQ3
Mems microphone 100-10 000 Infineon SMM310
Contact microphone 750 – 20 000 Maplin Electronics Piezo Xducer4 Table 2 Sensors installed in the pump
The sensors in Table 2 are the sensors installed in the
pump and which the detection algorithm was based
on. The accelerometer measured the vibrations in
m/s2, the mems microphone the vibrations, or
pressure, of the air as dB and the contact microphones
delivered a potential difference between the
membranes based on structural deformation. The
absolute levels measured are interested as a reality
check but since measurements already have shown
that the amplitudes of the vibrations vary with for
instance impeller type, the algorithm probably cannot
be based on them alone. The frequency spectrum of
the signals will therefore also be investigated.
Figure 8 Installed sensors in the pump top
The accelerometer, mems microphone and one of the contact microphones were installed in the
pump top, as seen in Figure 8. The orientation of the accelerometers axis in relation to the pump can
be seen in Figure 9. The x and y directions were parallel to the ground, with the z axis upwards. For
easy installation and to simulate the installation of a possible future product the sensors were first
fastened to a circuit board which was screwed to the pump. The remaining contact microphone was
installed on the outside of the pump, with electric cables running in parallel with the other sensor
cables.

Snoring Detection in a Centrifugal Pump with Vibrations 4 Method
Alexander Bjarnestam Fullemann 21
The theory behind the outside-mounted contact microphone was to identify the pulsations in the
water from the impeller. That way, when the water level dropped below the sensor, the pulsations
would cease and clogging would be imminent. This can be seen in Figure 10.
Figure 10 Contact microphone outside the pump sealed with silicone
Z
Y
X
A
Figure 9 Accelerometer axis orientation in relation to the pump top

Snoring Detection in a Centrifugal Pump with Vibrations 4 Method
22 Alexander Bjarnestam Fullemann
Figure 11 Contact microphone installation on circuit board
Figure 11 shows the installation of the contact microphone in the pump top. The vibrations would
make the different circuit board parts vibrate differently and thereby bending the contact
microphone. This would create a signal that could be used to see the vibrations. The contact
microphone can measure higher frequencies than the accelerometer and is cheap to produce, which
is why it is interesting to test if it can be used or not. Amplifying circuits were designed and
constructed for the contact microphones.
Sensor
Water level sensor
Pressure sensor
Current sensor Table 3 Sensors installed outside the pump
In addition to the sensors installed in the pump, external sensors were installed for reference. These
can be seen in Table 3. The water level sensor was installed in the tank to measure the water level
and from that calculate the flow, the pressure sensor was installed right after the pump to measure
the outgoing pressure and the current sensor was installed on one of the power wires for the pump.
The accelerometer was calibrated using a signal generator and a loudspeaker. The accelerometer was
fastened to the loudspeaker and the signal generator was connected to the loudspeaker. The signals
from the accelerometer matched the outgoing signals of the signal generator. The mems microphone
was calibrated using music, a spectrum analyzer and specific tones to verify the installation. The
contact microphones were tested using induced vibrations and a spectrum analyzer.
4.2 Measurements
4.2.1 Measurement resources
The signals from the sensors were sampled and saved using a NI DAQPad-6015 with a NI-SC-2345
from National Instruments. It is a programmable I/O unit with a large number of analog in- and out
ports that can be connected to a PC. The sensors were connected to the DAQPad and a Virtual
Instrument was created in the language LabView that scaled and saved the data to a PC connected to
the DAQPad.
Contact microphone
Installed circuit board

Snoring Detection in a Centrifugal Pump with Vibrations 4 Method
Alexander Bjarnestam Fullemann 23
4.2.2 Execution
The full number of combinations of parameters could not be tested due to time constraints. The
worst case of every test parameter was identified and used. During the analysis a few parameters
were more difficult to interpret than others, most notably the variations in flow, which led to
repeated tests. Other changes in the tests arose due to hardware issues. In order to sample data for
longer periods, resolution or the number of sampled channels had to be reduced. This led to a
reduction in first sample rate, then a reduction in the number of sampled sensors during the end of
the testing. This was to enable a longer sampled cycle, since variations in the flow greatly increased
the time of the snoring cycle. The used parameters can be seen in Table 4.
Setup 1 Setup 2 Setup 3 Setup 4
Accelerometer Accelerometer Accelerometer Accelerometer
Mems microphone Mems microphone Mems microphone -
Contact microphone Contact microphone Contact microphone -
Pressure sensor Pressure sensor Pressure sensor -
Current sensor Current sensor Current sensor -
Water level sensor Water level sensor Water level sensor Water level sensor
15.5 kHz sampl. freq 15.5 kHz sampl. freq 9 kHz sampl. freq 9 kHz sampl. freq
40 sec cycle 60 sec cycle 120 sec cycle 300 sec cycle Table 4 Parameters during testing
The final setup was used at the end of testing, when analysis already showed that the most
interesting sensor was the accelerometer. Towards the end of the tests, the electric current sensor
malfunctioned. Since the time was short and the current was considered a secondary measurement
signal, the last remaining tests were conducted without it.
4.3 Data acquisition and treatment
The data was saved with as few modifications as possible. This was to make it possible to change
and investigate the signal properties using simulations in software.
4.3.1 Analysis resources
The program Matlab was used to analyze, scale and filter the data. Several scripts were developed,
notably scripts to find the most “active” frequencies, where the differences between snoring and
normal operation was most obvious. Another script showing the changes in the energy spectrum over
time was also used. For the frequency analysis, amplitude and energy spectrums were calculated by
Fourier transforming the signals, using a Fast Fourier Transform function. A rectangular window
function was used, with different sampling rates depending on the test.

Snoring Detection in a Centrifugal Pump with Vibrations 4 Method
24 Alexander Bjarnestam Fullemann
4.4 Simplifications and limitations
Due to time- and cost constraints only vibrations and sound signals were analyzed for the use of a
snoring detection algorithm. Variations in current and pressure were measured but not utilized.
Several combinations of parameters were not tested. The reduction was based on hints from previous
measurements as well as from observations during the tests. The testing for the wear resistant
impeller was for instance more focused on those areas where the measurements with the clog
resistant impeller proved difficult to analyze. Only one pump was tested, and the only pumped liquid
was water. A notable omission is when the pump pump gravel or a thicker medium, since these both
parameters are probable to affect the vibration characteristics.

Snoring Detection in a Centrifugal Pump with Vibrations 5 Measurements and analysis
Alexander Bjarnestam Fullemann 25
5 Measurements and analysis
This section presents the results of the measurements and the accompanying analysis.
5.1 Sensor and measurement results
Since it was unclear which kind of information every sensor would provide, one part of the
experiment was to determine which sensors would be the most probable information carriers for an
algorithm for detecting snoring. The sensors were evaluated based on credibility, consistency over
time, how well they compared to theoretical results and finally, based on how much the signal
response changed during snoring. The parameters for the reference measurement can be seen in
Table 5.
Pump 2620
Impeller Clog Resistant
Orientation 90 degrees
Geodetic height High
Flow Full
Reflow No
Sampling frequency 15 500 Hz
Sampled time 40 s
Table 5 Parameters for sensor evaluation reference
5.1.1 Accelerometer - results
The accelerometer showed vibrations with an amplitude around (+-) 5 m/s2 when pumping water
without any snoring. This can be seen in Figure 12.
Figure 12 Acceleration in the x-axis from reference situation, unfiltered, early test phase

Snoring Detection in a Centrifugal Pump with Vibrations 5 Measurements and analysis
26 Alexander Bjarnestam Fullemann
Figure 13 Acceleration in the x-axis from reference situation, unfiltered, late test phase
The measurements from the accelerometer were also consistent over time. The measurements from
the early testing phase, the first of December shown in Figure 12, matched those in the end of the
testing phase, as can be seen in Figure 13 from the end of January. No notable differences occurred
between the early and the late tests.
Figure 14 Acceleration in the x-axis from reference situation, unfiltered, full snoring cycle, snoring at 16 seconds
As can be seen in Figure 14, there is a difference between the signals in area A and B which
corresponds to when the pump started to snore, at about 16 seconds into the test. Snoring clearly
affect the signals from the accelerometer.
Not much can be said about the placement of the accelerometer, since only one place was examined.
The orientation of the accelerometer in relation to the ground will affect how much of earth‟s
gravity, g, will show in the measured acceleration but since the pump will be used in various
positions this is best solved mathematically after measurements have been taken. In some
measurements the high frequency components of the signal were stronger in the y axis of the
accelerometer. This could be due to the installation, since it is stiffer in one direction than the other.
This would transfer more high frequency vibrations to one axis of the accelerometer.

Snoring Detection in a Centrifugal Pump with Vibrations 5 Measurements and analysis
Alexander Bjarnestam Fullemann 27
In conclusion, the measurements showed the accelerometer to be stable, reliable and to provide
different signals before and during snoring, thus making it a viable choice for further analysis.
5.1.2 Mems-microphone - results
The mems microphone showed promise, but the measured signals were not as clear as those from the
accelerometer.
Figure 15 Mems microphone, unfiltered data from reference test, snoring at 16 seconds
In Figure 15 the raw measured data from the mems microphone can be seen. There is an amplitude
increase during the snoring cycle, but it started before snoring could be observed so it is an uncertain
parameter. Some differences in the vibrations between when the pump was snoring and when it was
pumping water normally could be seen for the clog resistant impeller in the energy spectrum of the
signals but this did not extend to the wear resistant impeller. During the same tests the accelerometer
showed a distinct difference when the pump started to snore. Tests of the microphone after the
measurements were done showed that the sensor was working just as well as it was before the
installation, so it proved stable and consistent throughout the tests.
In conclusion, the microphone could in some cases provide information about when the pump was
snoring and not but the accelerometer provided better information and provided information in all
tested situations.
5.1.3 Contact microphones - result
The contact microphone installed outside the pump stopped working during testing so no algorithm
approach was based on the signals from it. The contact microphone installed inside the pump
showed promise but did not provide as clear difference between snoring and normal conditions as
the accelerometer did.

Snoring Detection in a Centrifugal Pump with Vibrations 5 Measurements and analysis
28 Alexander Bjarnestam Fullemann
Figure 16 Internal contact microphone, reference case, unfiltered, power spectrum, before snoring
Figure 17 Internal contact microphone, reference case, unfiltered, power spectrum, during snoring
Figure 16 and Figure 17 show an average of the power spectrum of the internally installed contact
microphone before and during snoring. The expected frequencies can be seen, such as the vane pass
frequency, marked with an arrow in the figures. The difference in signals between snoring and
normal conditions was however not as clear as with the accelerometer. This can be seen when
comparing the signals from the mems microphone in Figure 16 and Figure 17 with the frequency
spectrum from similar signals from the accelerometer in Figure 29 and Figure 31.
5.1.4 Sensor analysis - discussion
After the measurements it was apparent that the signals from the accelerometer were the most
consistent and reliable. The biggest difference in the signals when the pump started to snore could be
seen there so the more detailed analysis was therefore based on the accelerometer.

Snoring Detection in a Centrifugal Pump with Vibrations 5 Measurements and analysis
Alexander Bjarnestam Fullemann 29
5.2 Data analysis
Since the best and most informative signals were obtained from the accelerometers the following
analysis of the vibrations in the pump were carried out on them.
5.2.1 Signal characteristic – Reference situation
In order to understand the vibration characteristic during snoring the signal characteristic, or
“vibration footprint”, for normal conditions was identified. In Table 6 these test parameters are
shown. They were chosen as a reference situation and the pump was pumping water without any
snoring.
Table 6 Reference test cases for analysis
Test case 1 - Wear resistant impeller
Due to the unknown nature of the expected signals as little filtering or enhancements as possible was
used on the signals. The amplitude data is scaled to compensate for the influence of earth‟s gravity,
g, which would otherwise offset the signals from each axis depending on the pump inclination. The
signals were centered around zero. The signals were also filtered with a running average filter with a
window size of 8, in order for low frequency trends to be seen more clearly, when investigating the
signals in the time-domain. The filter blocks signal components with a frequency roughly above
1000 Hz.
Parameters Test case 1 Test case 2
Pump 2620 2620
Impeller Clog Resistant Wear Resistant
Orientation 90 degrees 90 degrees
Geodetic height High High
Flow Full Full
Reflow No No
Sampling frequency 9 000 Hz 9 000 Hz
Measured time 120 s 120 s

Snoring Detection in a Centrifugal Pump with Vibrations 5 Measurements and analysis
30 Alexander Bjarnestam Fullemann
Figure 18 Accelerometer x axis, wear resistant impeller, filtered, full snoring cycle, snoring at 40 seconds
Figure 19 Accelerometer x axis, wear resistant impeller, filtered, before snoring, detailed
Figure 20 Accelerometer x axis, wear resistant impeller, filtered, during snoring, detailed
In Figure 18 the data from the x axis of the accelerometer is shown. The signal is noisy but a few
periodic characteristics can be seen by directly looking at the data in Figure 19. The period 0.02 s, 50
Hz, is clearly visible before the pump starts to snore. This corresponds to the rotational speed, at
something below 50 Hz (the lag is due to the “slip” that all asynchronous engines electrical engines
have[16]). The signal gets more complex after snoring, as can be seen in Figure 20. More than one
frequency component affect the signal.

Snoring Detection in a Centrifugal Pump with Vibrations 5 Measurements and analysis
Alexander Bjarnestam Fullemann 31
Figure 21 Accelerometer y axis, wear resistant impeller, filtered, full snoring cycle, snoring at 40 seconds
Figure 22 Accelerometer y axis, wear resistant impeller, filtered, before snoring detailed
Figure 23 Accelerometer y axis, wear resistant impeller, filtered, during snoring, detailed
In Figure 21 data from the y-axis of the accelerometer is shown. The signals are similar in nature to
the ones measured in the x-axis, which is logical considering they are both installed in the horizontal
plane in relation to the pump and ground. The signal from the y-axis is a bit noisier than the x-axis,

Snoring Detection in a Centrifugal Pump with Vibrations 5 Measurements and analysis
32 Alexander Bjarnestam Fullemann
with more varying frequency components. A roughly 50 Hz signal can however be seen in Figure 22,
which shows the signals before snoring occurs. The 50 Hz signal is relatively close to the rotational
speed of a little bit less than 50 Hz. Figure 23 shows the signal during snoring. Even here a
frequency component close to 50 Hz can be observed.
.
Figure 24 Accelerometer z axis, wear resistant impeller, filtered, full snoring cycle, snoring at 40 seconds
Figure 25 Accelerometer z axis, wear resistant impeller, filtered, before snoring

Snoring Detection in a Centrifugal Pump with Vibrations 5 Measurements and analysis
Alexander Bjarnestam Fullemann 33
Figure 26 Accelerometer z axis, wear resistant impeller, filtered, before snoring, detailed
Figure 27 Accelerometer z axis, wear resistant impeller, filtered, during snoring
Figure 28 Accelerometer z axis, wear resistant impeller, filtered, during snoring, detailed
The change in amplitude of the vibrations (their accelerations) is even more pronounced along the z-
axis than in the x or y direction, as can be seen in Figure 24. In Figure 25 and Figure 26 it can be
seen that the signal before snoring is relatively periodic, with a strong 50 Hz component, and in
Figure 27 and Figure 28 that the signal during is more chaotic and with more diverge frequency
components.
During the snoring cycle, three distinct stages can be seen. This has been identified as different states
of snoring. This is most clearly showed in Figure 18. Phase A is when the pump is not snoring at all.
Only fluid is pumped and as such, vibrations are relatively periodic, as seen in Figure 19, Figure 22
and Figure 25. Phase B is during the initial phase of the snoring1 when a mixture of water and air is
being pumped, with the water level being above the pump inlet but sinking. Phase C is the
equilibrium state, where the water level is more or less fixed. The flow will, depending on the actual
system, for instance if the geodetic height is high or not or if there is a reflow to the pump reservoir,
1 See 3.2.3, The theory of snoring and vibrations.

Snoring Detection in a Centrifugal Pump with Vibrations 5 Measurements and analysis
34 Alexander Bjarnestam Fullemann
be very low. During phase A the signals are periodic but become more chaotic and noisy during
phase B and C.
Figure 29 Accelerometer x axis, wear resistant impeller, power spectrum, unfiltered, before snoring
Figure 30 Accelerometer x axis, wear resistant impeller, power spectrum, unfiltered, before snoring, detailed
Figure 29 shows the power spectrum of the signals from the accelerometer in the x-axis during
continuous operation before snoring. The by far most notable peak is the one from the rotational
speed at 47.8 Hz. Figure 30 shows the same situation but with a lower amplitude to show the other
weaker frequency components. Then it can be seen that the second highest peak is at F, 599.4 Hz.
The rotational speed is marked as A.
The harmonics from the rotational speed show up all through the power spectrum. The peaks at B
95.6 Hz (2x), C, 143.4 Hz (3 x), D, 239 Hz (5 x), E, 478 Hz (10 x), F, 647.3 Hz (15 x) and G, 1438
Hz (30 x) are all multiples of 47.9 Hz. Of special note is the vane pass frequency2 at D. Since the
wear resistant impeller has 5 blades, the frequency is 5 times the rotational speed. This frequency
also shows up at E and G. The energy in these frequencies is considerably lower than that of the
rotational speed, however. This indicates that imbalance in the impeller is contributing much more to
2 See 3.2.3

Snoring Detection in a Centrifugal Pump with Vibrations 5 Measurements and analysis
Alexander Bjarnestam Fullemann 35
vibrations than the water being pressed into the volutes. Since the impeller is old and slightly worn,
this is considered probable.
Around H, 2300 Hz, there is a wide area of high frequency noise. These are probably connected to
the turbulence from high water flow and possibly to cavitation[7]. The chaotic behavior of these
frequency components matches the unpredictable results of turbulence and cavitation. The peak at G.
599.6 Hz is not a multiple of the rotation speed, but of a weaker 100Hz component at B.
Figure 31 Accelerometer x axis, wear resistant impeller, power spectrum, unfiltered, during snoring
Figure 31 shows the power spectrum of the accelerometers x axis during snoring. The signals are
from both phase B and C, meaning an average of the signals after snoring have occurred. The peak at
C, 245.4 Hz (5 times the rotational speed), is far higher than the other frequencies at A, 49.04 Hz (1
X), B, 99.9 Hz and D, 490.2 Hz (10 X). This means that the vane pass frequency during snoring is
the most dominant one. The high frequency noise around E in the 2000 Hz area that could be
observed before snoring is no longer visible. This further strengthens the belief that these were
connected to turbulence, high water flow and possibly cavitation.
A
A
B
C
D

Snoring Detection in a Centrifugal Pump with Vibrations 5 Measurements and analysis
36 Alexander Bjarnestam Fullemann
Figure 32 X axis, wear resistant impeller, power spectrum with time resolution, unfiltered, full snoring cycle, snoring at 40
seconds
Figure 33 Y axis, wear resistant impeller, power spectrum with time resolution, unfiltered, full snoring cycle, snoring at 40
seconds

Snoring Detection in a Centrifugal Pump with Vibrations 5 Measurements and analysis
Alexander Bjarnestam Fullemann 37
Figure 34 Z axis, wear resistant impeller, power spectrum with time resolution, unfiltered, full snoring cycle, snoring at 40
seconds
Figure 32 shows how the power spectrum of the x axis change during one snoring cycle. This can be
seen in Figure 33 and Figure 34 for the y and z axis, respectively. The total energy contained in the y
axis signal is spread between many frequencies in comparison to the concentration of low frequency
components for the x axis.
The tests show that most activity is occurring in the low frequency range, between zero and 700 Hz.
There the big change is most notable when the pump starts to snore. In Figure 33, for the y axis, a
unfocused noise between 2000 Hz and 2500 Hz prior to snoring can be seen.
The figures showing the trends of the frequency components of the vibrations use one second time
resolution. That translates to 9000 or 15500 samples for each second, depending on the sampling rate
used. When this resolution was changed, first by halving it to a half second, meaning 4500 or 7750
samples, and doubling it to two seconds, the amplitude difference between the rotational speed and
its multiples was reduced. This indicates that the frequency components of the signal coming from
the multiples of the rotational speed were not as stable over time as the rotational frequency.
Test case 2 – Clog resistant impeller
The raw signals from the accelerometer are noisy but certain trends can be observed directly.
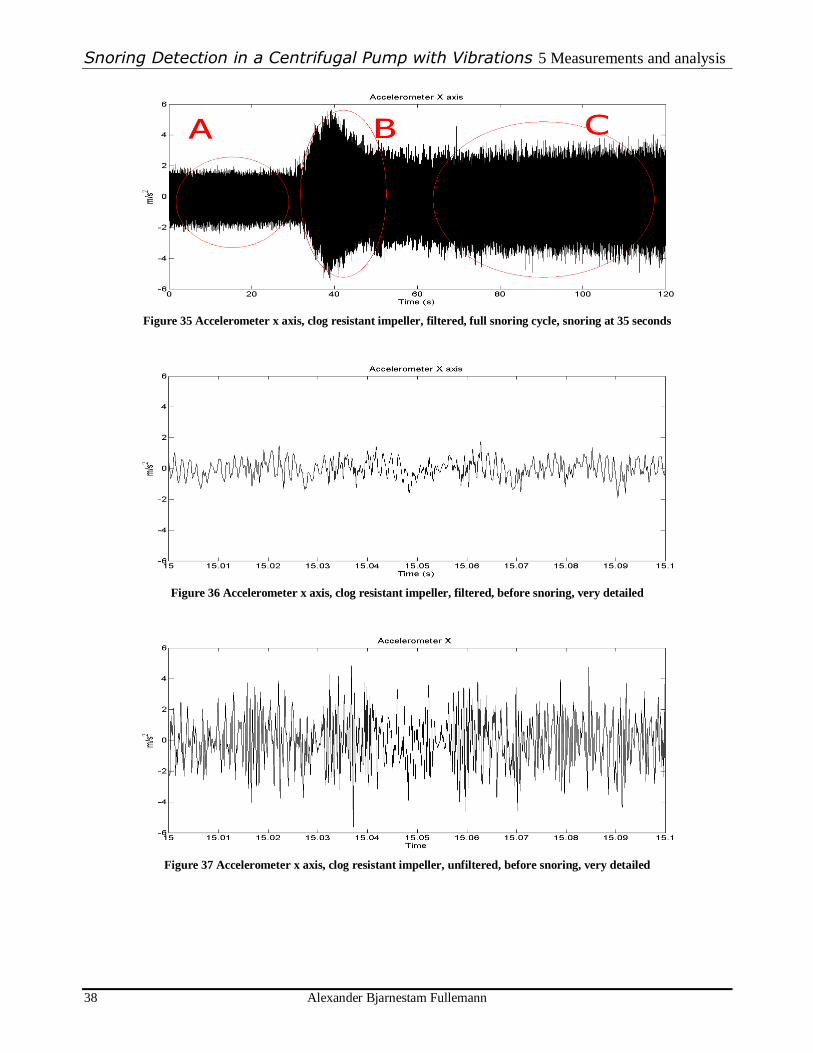
Snoring Detection in a Centrifugal Pump with Vibrations 5 Measurements and analysis
38 Alexander Bjarnestam Fullemann
Figure 35 Accelerometer x axis, clog resistant impeller, filtered, full snoring cycle, snoring at 35 seconds
Figure 36 Accelerometer x axis, clog resistant impeller, filtered, before snoring, very detailed
Figure 37 Accelerometer x axis, clog resistant impeller, unfiltered, before snoring, very detailed

Snoring Detection in a Centrifugal Pump with Vibrations 5 Measurements and analysis
Alexander Bjarnestam Fullemann 39
Figure 38 Accelerometer x axis, clog resistant impeller, filtered, during snoring, detailed
In Figure 35 the full snoring cycle for the clog resistant impeller can be seen. The three phases, A, B
and C, of snoring are clearly visible. As can be seen in Figure 36, Figure 37 and Figure 38, when the
clog resistant impeller is used, the vibrations are more periodic before snoring than after. During
snoring the most dominant frequency is 100 Hz, which is the vane pass frequency (the clog resistant
impeller has two blades). The amplitude of the vibrations is also notably higher during snoring than
before. Figure 36 show a more detailed graph of the vibration signals before snoring occurs, and
Figure 37 shows the same signals unfiltered. Here, a frequency component of the vibrations with a
period of ca: 1.5 ms can be seen. That corresponds to a frequency of roughly 660 Hz.
Figure 39 Accelerometer y axis, clog resistant impeller, filtered, full snoring cycle, snoring at 35 seconds

Snoring Detection in a Centrifugal Pump with Vibrations 5 Measurements and analysis
40 Alexander Bjarnestam Fullemann
Figure 40 Accelerometer y axis, clog resistant impeller, filtered, before snoring, detailed
Figure 41 Accelerometer y axis, clog resistant impeller, filtered, snoring, detailed
Figure 39, Figure 40, and Figure 41 shows the signals from the accelerometer along the y axis. The
signals are pretty similar to the x axis. Slightly higher amplitudes during snoring can be seen in
Figure 41 and the noise is a bit higher in frequency than signals from the same measurement along
the x-axis. The same periodic signals can be seen before and after snoring, around 100 Hz.

Snoring Detection in a Centrifugal Pump with Vibrations 5 Measurements and analysis
Alexander Bjarnestam Fullemann 41
Figure 42 Accelerometer z axis, clog resistant impeller, filtered, full snoring cycle, snoring at 35 seconds
Figure 43 Accelerometer z axis, clog resistant impeller, filtered, before snoring
Figure 44 Accelerometer z axis, clog resistant impeller, filtered, before snoring, detailed

Snoring Detection in a Centrifugal Pump with Vibrations 5 Measurements and analysis
42 Alexander Bjarnestam Fullemann
Figure 45 Accelerometer z axis, clog resistant impeller, filtered, snoring, detailed
The z axis shows the highest amplitudes of the three axes, as can be seen in Figure 42. Besides that,
the strong vane pass frequency of 100 Hz can be seen both before and during snoring, in Figure 43,
Figure 44 and Figure 45.
Figure 46 Accelerometer x axis, clog resistant impeller, power spectrum, unfiltered, before snoring
Figure 46 shows the power spectrum of the accelerometer signal in the x axis from when the pump is
pumping continuously, before snoring occurs. The strongest frequency component is the 665 Hz
component at D, a multiple (14 x) of the rotation speed at A, 47.5 Hz. The vane passing frequency
95.8 Hz, at B (2 x), and its first harmonic at C, 190 Hz, are notable as well. All the highest peaks are
even multiples of the rotational speed, or vane passing frequency as can be seen by the peaks at E,
760 Hz (16 x), F, 1900 Hz (40 x) and G, 1994 Hz (42 x). The vibrations caused by the impeller
pressing water into the volutes are thereby dominant for the vibrations when using the clog resistant
impeller.
As well as with the wear resistant impeller, there is a band of high frequency noise between 1500 Hz
and 2500 Hz, most likely resulting from turbulence and possibly cavitation due to the high flow. This
is especially notable for the y axis.
A
B
C
D
E F
G

Snoring Detection in a Centrifugal Pump with Vibrations 5 Measurements and analysis
Alexander Bjarnestam Fullemann 43
The peak at 599.6 Hz is also present here, with energy comparable to the one measured with the
wear resistant impeller. That means it is much lower than the dominating frequencies shown in
Figure 46, with a value around 400. This is therefore a frequency not dependant on the mechanical
effects of the impeller. Since it is a harmonic of 50 Hz that is unaffected by the impeller, one theory
is that it is connected to the power or engine. It can also be connected to the flow and turbulence,
since the energy of the frequency component decrease when the flow decreases.
Figure 47 Accelerometer x axis, clog resistant impeller, power spectrum, unfiltered, during snoring
In Figure 47 the power spectrum for the signals from accelerometer‟s x axis during snoring can be
seen. The totally dominating frequency component is the vane pass frequency at B, 97.52 Hz, double
the rotational speed, 48.74 Hz, at A. The other notable frequency components are at 195 Hz (4 x) at
C, 292.5 Hz (6 x) at D and 389.9 Hz (8 x) at E, all multiples of the vane pass frequency.
Figure 48 X axis, clog resistant impeller, power spectrum with time resolution, unfiltered, full snoring cycle, snoring at 35
seconds
A
B
D E C

Snoring Detection in a Centrifugal Pump with Vibrations 5 Measurements and analysis
44 Alexander Bjarnestam Fullemann
Figure 49 Y axis, clog resistant impeller, power spectrum with time resolution, unfiltered, full snoring cycle, snoring at 35
seconds
Figure 50 Z axis, clog resistant impeller, power spectrum with time resolution, unfiltered, full snoring cycle, snoring at 35
seconds
Figure 48 show the power spectrum for the whole snoring cycle of the x axis with a time resolution
of one second. Figure 49 and Figure 50 show the y and z axis, respectively. Although the signals
from the y axis contains more concentrated frequency components after snoring than the x and z
axis, the majority of changes occur below 800 Hz. The frequency components around 700 Hz
disappear and lower frequency components around 100 Hz, the vane pass frequency, greatly
increase.

Snoring Detection in a Centrifugal Pump with Vibrations 5 Measurements and analysis
Alexander Bjarnestam Fullemann 45
Conclusion
There is a notable difference between the signals from the impellers, both in their frequency
spectrum and their signals in the time domain. The clog resistant impeller has much higher
amplitudes than the wear resistant. This is most likely a result of the larger number of impeller
blades on the wear resistant impeller. The pulses from each impeller decrease when the number
increases.
5.2.2 Signal characteristics - geodetic height
This examines the effects of changes in the geodetic height. Table 7 shows the test parameters used
during the measurement.
Test case 1 – wear resistant impeller
Figure 51 X axis, wear resistant impeller, power spectrum, time resolution, unfiltered, low geodetic height, snoring at 60
seconds
Parameters Test case 1 Test case 2
Pump 2620 2620
Impeller Wear Resistant Clog Resistant
Orientation 90° 90°
Geodetic height High High
Flow Full Full
Reflow No No
Sampling frequency 9 000 Hz 15 500 Hz
Sampled time 120 s 40 s
Table 7 Test parameters for changing the geodetic height
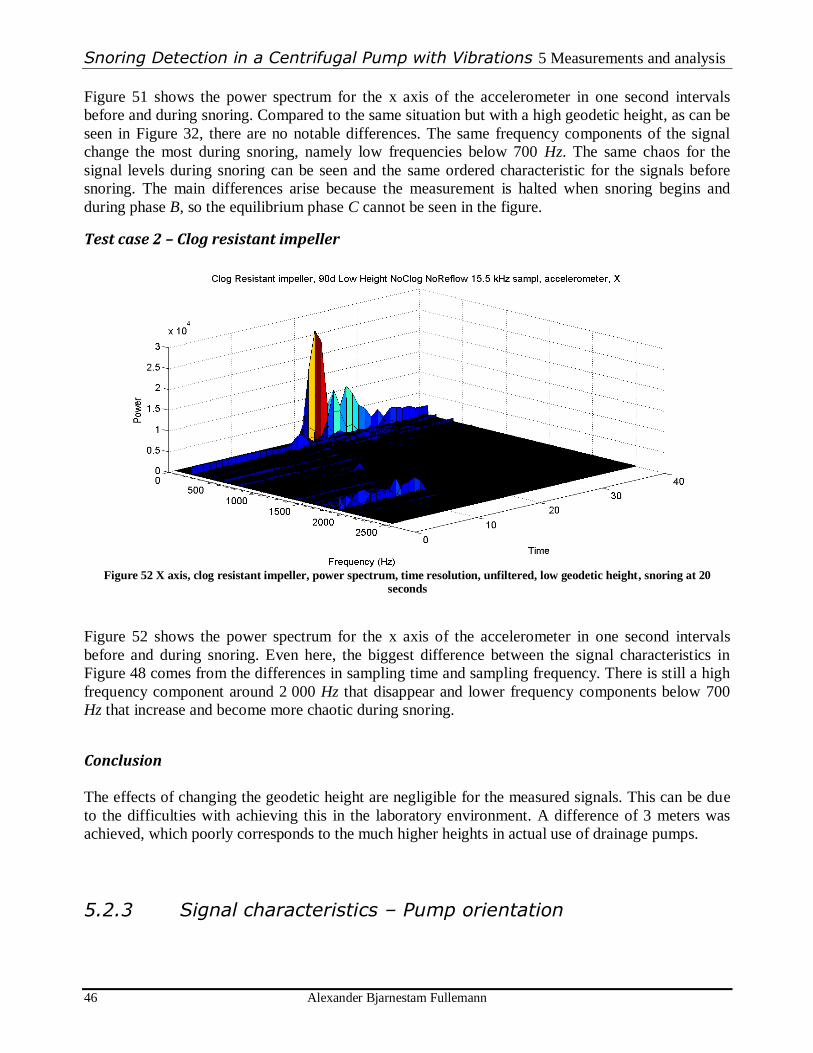
Snoring Detection in a Centrifugal Pump with Vibrations 5 Measurements and analysis
46 Alexander Bjarnestam Fullemann
Figure 51 shows the power spectrum for the x axis of the accelerometer in one second intervals
before and during snoring. Compared to the same situation but with a high geodetic height, as can be
seen in Figure 32, there are no notable differences. The same frequency components of the signal
change the most during snoring, namely low frequencies below 700 Hz. The same chaos for the
signal levels during snoring can be seen and the same ordered characteristic for the signals before
snoring. The main differences arise because the measurement is halted when snoring begins and
during phase B, so the equilibrium phase C cannot be seen in the figure.
Test case 2 – Clog resistant impeller
Figure 52 X axis, clog resistant impeller, power spectrum, time resolution, unfiltered, low geodetic height, snoring at 20
seconds
Figure 52 shows the power spectrum for the x axis of the accelerometer in one second intervals
before and during snoring. Even here, the biggest difference between the signal characteristics in
Figure 48 comes from the differences in sampling time and sampling frequency. There is still a high
frequency component around 2 000 Hz that disappear and lower frequency components below 700
Hz that increase and become more chaotic during snoring.
Conclusion
The effects of changing the geodetic height are negligible for the measured signals. This can be due
to the difficulties with achieving this in the laboratory environment. A difference of 3 meters was
achieved, which poorly corresponds to the much higher heights in actual use of drainage pumps.
5.2.3 Signal characteristics – Pump orientation

Snoring Detection in a Centrifugal Pump with Vibrations 5 Measurements and analysis
Alexander Bjarnestam Fullemann 47
This examines the effects of running the pump when it is lying down and standing at an angle. The
test parameters used during the measurement can be seen in Table 8. 0° means the pump was lying
down, 90° means it was standing up.
The following figures show the power spectrum of the x axis of the accelerometer in one second
intervals before and during snoring.
Test case 1 – Wear resistant impeller, 45 degrees inclination
Figure 53 X axis, wear resistant impeller, power spectrum, time resolution, unfiltered, 45 degrees inclination, snoring at 20
seconds
As can be seen in Figure 53 the interesting frequencies are the same as in the reference situation,
Figure 32. Snoring occurs relatively early, around 10 seconds in the test. The characteristic
irregularity in signals during snoring can also be seen.
Parameters Test case 1 Test case 2 Test case 3 Test case 4
Pump 2620 2620 2620 2620
Impeller Wear Resistant Wear Resistant Clog Resistant Clog Resistant
Orientation 45° 0° 45° 0°
Geodetic height High High High High
Flow Full Full Full Full
Reflow No No No No
Sampling frequency 9 000 Hz 9 000 Hz 15 500 Hz 15 500 Hz
Sampled time 120 s 120 s 60 s 60 s
Table 8 The test parameters for changing geodetic height
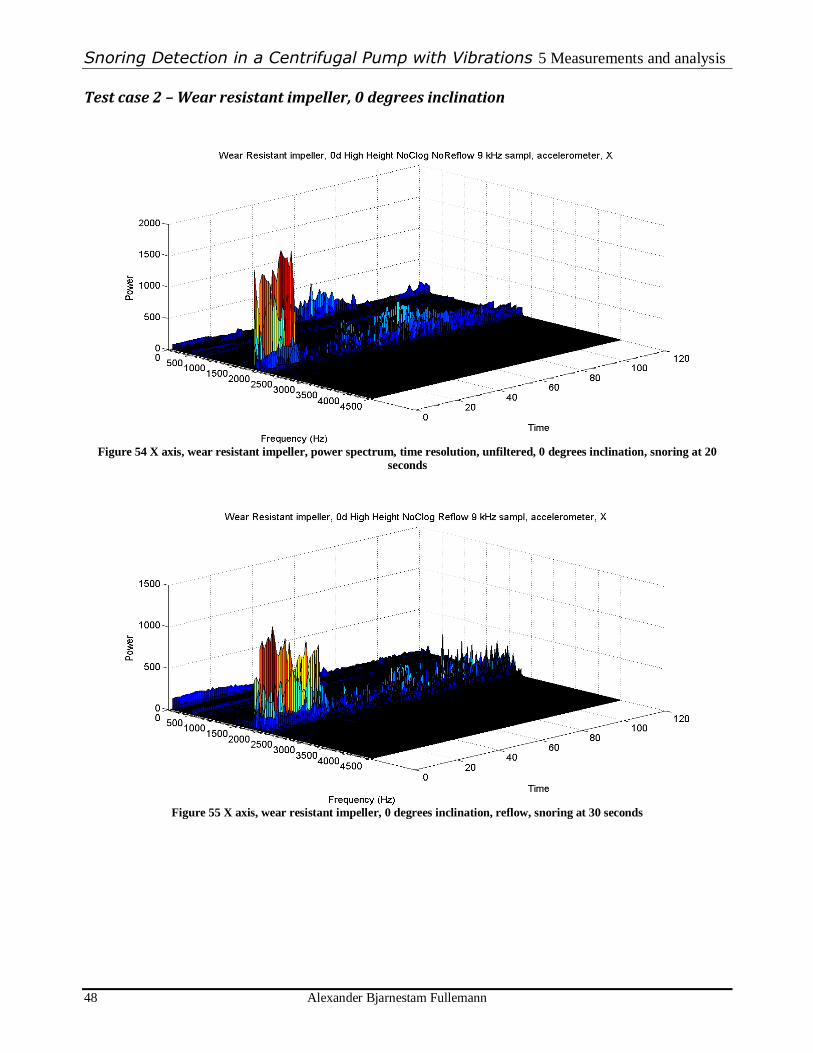
Snoring Detection in a Centrifugal Pump with Vibrations 5 Measurements and analysis
48 Alexander Bjarnestam Fullemann
Test case 2 – Wear resistant impeller, 0 degrees inclination
Figure 54 X axis, wear resistant impeller, power spectrum, time resolution, unfiltered, 0 degrees inclination, snoring at 20
seconds
Figure 55 X axis, wear resistant impeller, 0 degrees inclination, reflow, snoring at 30 seconds

Snoring Detection in a Centrifugal Pump with Vibrations 5 Measurements and analysis
Alexander Bjarnestam Fullemann 49
Figure 56 X axis, wear resistant impeller, 0 degrees inclination, low flow, snoring at 60 seconds
When the pump is lying on the bottom of the tank, the characteristics of the vibrations change
significantly. As can be seen in Figure 54, there are very strong frequency components around 2 000
Hz in the signal before snoring, and these can still be seen during snoring. The expected steady
signals around 500 and 250 Hz are still present, but considerably weaker. For comparison the
measurements from when water is constantly flowing into the tank and when the out flow is reduced
are shown as Figure 55 and Figure 56 respectively. In Figure 55 the same type of vibration behavior
is present as when there is no reflow, which suggests that the presence of reflow does not affect the
signals that much. In Figure 56, when the flow of the pump is significantly reduced, more normal
signal characteristics can be seen. There are no high frequency components of note during snoring,
and only weak ones before snoring. The significant frequencies stay below the 700 Hz limit. Since
the strong 2 000 Hz components are not present when the flow is reduced, and since other turbulence
phenomena show up as noisy signals around 2 000 Hz, it is probable that these components are a
result of high flow when the pump is lying down, when using the wear resistant impeller. They are
either turbulence or cavitation related.
Test case 3 – Clog resistant impeller, 45 degrees inclination

Snoring Detection in a Centrifugal Pump with Vibrations 5 Measurements and analysis
50 Alexander Bjarnestam Fullemann
Figure 57 X axis, clog resistant impeller, power spectrum, time resolution, unfiltered, 45 degrees inclination, snoring at 20
seconds
Figure 57 show the power spectrum of the x axis from the accelerometer before and during snoring.
The signals are similar to those from the reference situation in Figure 48 There is a high frequency
component around 2 000 Hz that disappear when snoring starts and chaotic, stronger components
around 100 Hz become dominant.
Test case 4 – Clog resistant impeller, 0 degrees inclination
Figure 58 X axis, clog resistant impeller, power spectrum, time resolution, unfiltered, 0 degrees inclination, snoring at 10
seconds

Snoring Detection in a Centrifugal Pump with Vibrations 5 Measurements and analysis
Alexander Bjarnestam Fullemann 51
As can be seen when comparing Figure 58 and Figure 57, the signal characteristics are very similar.
The strange high frequency behavior of the wear resistant impeller in the same situation is not
present here. With the clog resistant impeller, no notable difference can be seen in the vibrations
when changing the inclination of the pump.
5.2.4 Signal characteristics – Changing outgoing flow
The flow from the pump was changed by putting a clamp on the outgoing hose, in order to simulate
changing system conditions. The other test parameters used during the test can be seen in Table 9.
Test case 1 – Wear resistant impeller
Figure 59 X axis, wear resistant impeller, power spectrum, time resolution 1 sec, unfiltered, low flow, full snoring cycle,
snoring at 50 seconds
Figure 59 shows the effects of reduced flow for the wear resistant impeller. There is still a notable
change in the characteristics of the vibrations when the pump starts to snore but the vibrations before
are more varying than during high flow.
Parameters Test case 1 Test case 2
Pump 2620 2620
Impeller Wear Resistant Clog Resistant
Orientation 90 degrees 90 degrees
Geodetic height High High
Flow Low Varying
Reflow No Yes
Sampling frequency 9 000 Hz 15 500 Hz
Sampled time 180 s 120 s
Table 9 Parameters during tests with changing flow
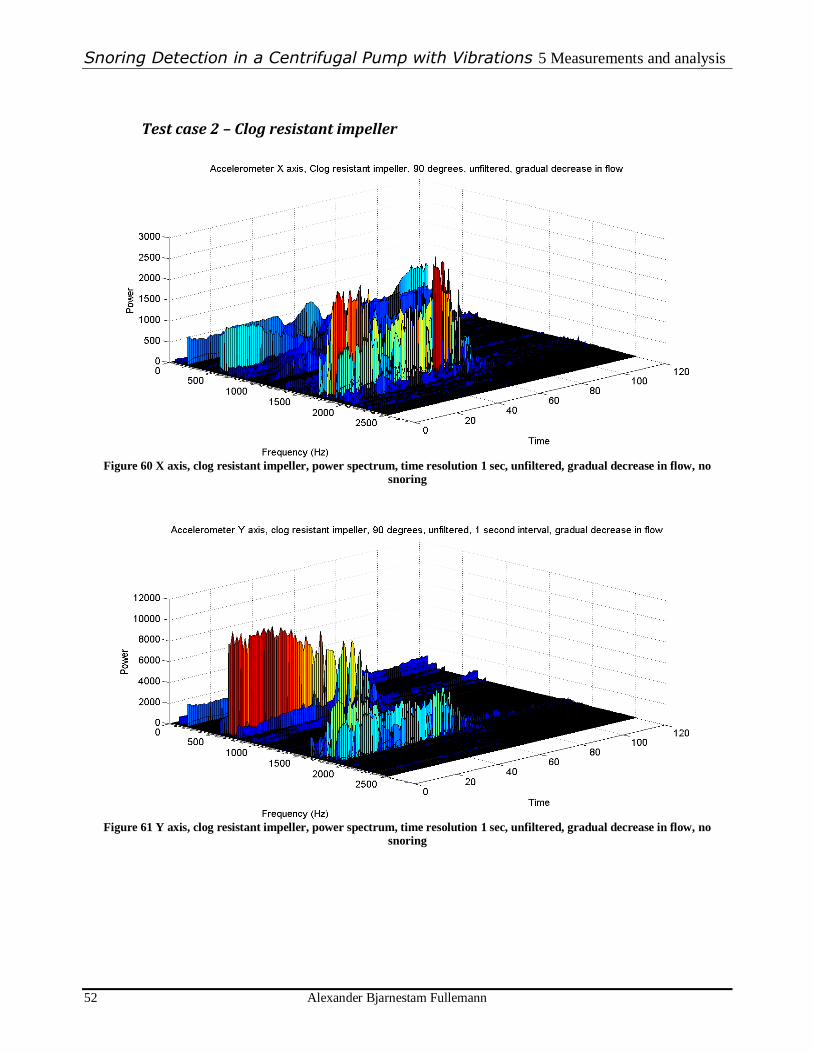
Snoring Detection in a Centrifugal Pump with Vibrations 5 Measurements and analysis
52 Alexander Bjarnestam Fullemann
Test case 2 – Clog resistant impeller
Figure 60 X axis, clog resistant impeller, power spectrum, time resolution 1 sec, unfiltered, gradual decrease in flow, no
snoring
Figure 61 Y axis, clog resistant impeller, power spectrum, time resolution 1 sec, unfiltered, gradual decrease in flow, no
snoring

Snoring Detection in a Centrifugal Pump with Vibrations 5 Measurements and analysis
Alexander Bjarnestam Fullemann 53
Figure 62 Z axis, clog resistant impeller, power spectrum, time resolution 1 sec, unfiltered, gradual decrease in flow, no
snoring
Figure 60, Figure 61 and Figure 62 show the vibrations from when the flow is going from full to no
flow without any snoring. As can be seen, the high frequency components due to turbulence decrease
together with the flow, and the low frequency components related to the rotational speed and the
vane pass frequency become more chaotic or varying. Towards the end of the cycle, when the flow
was completely blocked, vibration characteristics reminiscent of the characteristics of snoring can be
seen, with fast changing energy levels of the frequency components in the vibrations.
5.2.5 Signal characteristics – Reflow
The characteristics of the vibrations does not change because of a change in the inflow. The biggest
effect is that the snoring cycle takes more time.
5.2.6 Signal characteristics – Discussion
The exact frequencies that are interesting vary with varying situations but some aspects stay
relatively constant. The frequencies around the rotational and vane pass frequency, around 50 to
600-700 Hz are the ones showing most stable change when snoring occurs. The higher frequency
components that show up around 2000 to 2500 Hz are less consistent. The rotational speed increase
during snoring, most likely due to reduced load because of air in the system. The biggest difference
comes from the different impellers, which creates different vibrations before and after snoring. The
wear resistant impeller result in less stable (non-varying) frequency components during snoring than
the clog resistant. During snoring the most dominant frequency for both impellers is the vane-pass
frequency.

Snoring Detection in a Centrifugal Pump with Vibrations 5 Measurements and analysis
54 Alexander Bjarnestam Fullemann
5.3 Algorithm Synthesis
The most successful algorithm was based on the chaotic nature of the lower frequency components
in the vibrations measured by the accelerometer in the y axis. The amplitude spectrum data was
differentiated in order to get the speed which the frequency components amplitudes varied with, and
the values of these speeds within a frequency interval were compared to a trigger value.
5.3.1 Background theory
Based on the observed characteristics of the vibrations, the biggest difficulty with finding a detection
algorithm for snoring is to find something working in all situations. One simple approach that was
tried is to have a comparator that compares amplitudes in certain frequencies and consider the pump
to snore when the amplitudes reach a threshold, but it could not detect snoring with different
impellers. There are many phenomena that indicate the change from normal pumping to snoring: A
change in absolute amplitude for the vibrations, changed dominant frequency components, different
amplitudes for different frequency components and changed rotational speed. The problem lies in
finding one unique for snoring but not unique for the situation. Another problem comes when not
only the change, from normal pumping to snoring should be detectable, but a pump being started in
too little water should still be able to detect snoring. An algorithm with this characteristic is more
suitable for real applications and this was therefore a self imposed requirement during development.
Because of this, the work focused on identifying characteristics of the measured signals from the
pump during snoring, and to be able to identify characteristics not apparent during other conditions,
such as when pumping just water or when the system was blocked.
Algorithms and algorithm approaches were investigated and tested in off line detection of snoring in
the data from the measurements. The measured data from the different sensors were used in Matlab
to simulate the pump and the algorithm had to detect if the pump was snoring or not. It is important
to point out that the developed algorithm not necessarily represents the best possible algorithm. It
was merely successful in the examined situations. To further optimize is beyond the scope of this
thesis.
5.3.2 Algorithm description
The algorithm was based on the y axis from the accelerometer. Since both the data from the y and x
axis showed the same characteristics, it was not necessary to use more than the information from one
axis to develop an algorithm that proved successful.

Snoring Detection in a Centrifugal Pump with Vibrations 5 Measurements and analysis
Alexander Bjarnestam Fullemann 55
The logic of the algorithm can be seen in Figure 63. The data from the sensor, in this case the
accelerometer, is sampled and normalized to compensate for the influence of the earth‟s gravity and
a discrete Fourier transform is applied with a FFT algorithm, every second. The data is then filtered
using a simple fixed amplitude filter, to single out the significant signals, and the resulting amplitude
spectrum data with time resolution is then differentiated. The filter sets all frequency components
under four times the noise level to zero. From this, a frequency band is chosen and the contained
values compared to a threshold value. If any frequency component within the frequency band has a
value higher than the threshold value, it will count as “snoring” for that particular time frame. When
a number of consecutive timeframes with snoring have occurred, in this case three, the algorithm
decides that the pump is snoring. This is the formula used for the algorithm:
The vector is the sampled data from the accelerometer during one second, is the number of
samples sampled during one second and is the limit for the amplitude filter, four times the noise
level. The vector is of similar size as and multiplied element by element and is the trigger
value of the algorithm. The values of the parameters in the algorithm can be seen in Table 10.
Sensor
Comparator Counter
Sampling Normalizer FFT
Filter Derivator
Frequency selector
Snoring
Figure 63 Functional description of algorithm for detecting snoring

Snoring Detection in a Centrifugal Pump with Vibrations 5 Measurements and analysis
56 Alexander Bjarnestam Fullemann
Parameter Value
Time resolution 1 sec
Sampling rate 9 000 Hz
Frequency range 1- 495 Hz
Trigger level 0.07
Delay 3 sec Table 10 Detection algorithm parameters
The value of the frequency-amplitude filter was chosen based on observations of the noise in the
signals, and then chosen to be four times as high as the most notable disturbances due to noise. The
trigger level was chosen after a combination of testing, observations and calculations of the values of
the differentiated signals.
A vibration characteristic that was consistent during snoring and did not require previous knowledge
about the vibrations during normal conditions was selected. The irregularity and fast changes of the
amplitudes and energy for the frequency components around the rotational speed was used for the
algorithm. The differentiated signals from the energy spectrum of the vibrations were analyzed,
frequency by frequency. A band of frequencies were chosen so as not to confuse snoring with the
variations in the spectrum around 2 000 Hz coming from turbulence and the variations during low
flow, as seen in section 5.2.4, “Signal characteristics – Changing outgoing flow”. When the outgoing
flow is reduced to zero, signals similar to the changes that occur during snoring, but concentrated to
higher frequencies can be seen. A delay was chosen to avoid faulty measurements and singular
impulses to be mistaken for snoring.
5.3.3 Test results
Due to time constraints every combination of every test parameter was not tested. A selection based
on measurements results, previous measurements and experience from developers was made.
Orientation 0 45 90
Flow HighHeight LowHeight HighHeight LowHeight HighHeight LowHeight
Reflow Reflow Reflow Reflow Reflow Reflow
Low WR OK OK - - OK OK - - OK OK - -
CR OK OK - - OK OK - - OK OK - OK
High WR OK OK - - OK OK - - OK OK - OK
CR OK OK - - OK OK - - OK OK OK OK
No flow WR - - - - - - - - - - - -
CR - - - - - OK - OK - OK - OK
Table 11 Results from simulations with the developed algorithm
Table 11 shows the possible combinations of the test parameters. A red NO indicates a situation
where the algorithm could not detect snoring, a green OK indicates that the algorithm was successful
in differentiating between snoring and normal conditions and an empty table means the situation was
not tested. During testing the difference between low and high geodetic height did not affect the
algorithm to a large degree, as well as the presence of weather there was an inflow into the tank or

Snoring Detection in a Centrifugal Pump with Vibrations 5 Measurements and analysis
Alexander Bjarnestam Fullemann 57
not. The difficult situations turned out to be when the inclination changed, when the flow changed
and when changing the impeller, so more tests focused on them.
The parameters had to be tuned in order to work well with the wear resistant impeller. Snoring for
clog resistant impeller was a lot easier to detect. This means that the parameter robustness for the
wear resistant impeller was worse than for the clog resistant.
The situations covered by the detection algorithm
Changes in geodetic height between 1 and 4 meters.
Changing impeller from a wear resistant to a clog resistant impeller.
The presence of reflow or not into the reservoir.
Changing the inclination of the pump from standing to lying down, as well as at a 45° angle.
Changes in the flow by blocking the out flow pipe, from full flow to no flow.

Snoring Detection in a Centrifugal Pump with Vibrations 6 Results
58 Alexander Bjarnestam Fullemann
6 Results
6.1 Summary
The vibrations from the pump and the sound inside the pump top during snoring were measured on a
2620 submersible drainage pump from ITT W&WW. The vibrations measured by a three-axis
accelerometer were the most useful and after analysis an algorithm for connecting snoring to
vibration characteristics was developed. The algorithm was then tested in simulations to see if it
could be used to detect snoring in the pump, based on the measured signals from the accelerometer
inside the pump during snoring.
6.2 Conclusions
The conclusion to this thesis project is that a method of detecting snoring based on vibrations for the
tested cases is possible. An algorithm was developed that could distinguish between snoring and
normal running conditions in all the tested situations and for the tested pump.
The question if it is possible to detect snoring via vibrations for all situations and all pump models is
however not answered. Further studies are needed. Thus far nothing has been found that speaks
against such a solution.
Of the evaluated sensors, the 3 axis accelerometer proved to be the most useful. An application
capable of sampling vibrations at least 3000 times per second and able to perform a FFT on and
derive the data once a second could be used for the developed algorithm. The used accelerometer
have reduced sensitivity above 3000 Hz and based on the results from this work the interesting
frequency ranges are 50 to 1000 Hz, so the minimum sampling frequency does not need to be much
higher than 2000 Hz to avoid aliasing in that frequency range.
Without discussing an eventual product too deeply, an application based on vibration analysis for
detecting and preventing snoring could be integrate able and manage without calibration from the
user every time the conditions change. Depending on the results from testing other pumps, maybe a
onetime calibration is necessary in production. No deeper analysis of the costs of an eventual
product has been made.
6.3 Further studies
6.3.1 New measurements
The next logical step is to test and measure vibrations during more situations. Different pumps and
different fluids would probably provide vibrations with different characteristics. The case when
gravel or stones are pumped is also especially interesting with vibrations in mind. As a final step,
measurements from pumps in real situations should provide plenty of information.

Snoring Detection in a Centrifugal Pump with Vibrations 6 Results
Alexander Bjarnestam Fullemann 59
6.3.2 Different algorithm
The chosen algorithm is probably not the only working one and an algorithm more suitable for a
commercial application could be sought. The existing one could also be refined considerably. By
using more sophisticated, statistical methods for detecting when the vibrations indicate snoring a
more robust algorithm could be developed.
6.3.3 Implementation on a pump controller
When the algorithm have been tested and refined, field tests would provide much information. To
implement the algorithm in I/O hardware and a PC, in for example National Instruments LabView
and to test this equipment on pumps, preferably during real conditions, would give valuable
feedback.
6.3.4 Product aspects
When the algorithm has been refined, tested and verified the question of how to turn it into a product
arises. How to implement the chosen algorithm with requirements for cost, space and reliability
satisfied would be a fruitful area to investigate.
6.3.1 Additional uses for vibration sensors
The usefulness of vibration sensors is not limited to detecting snoring. Additional studies about how
integrated vibration sensors and some kind of “intelligent system” with a digital signal processor
inside the pump could be implemented in drainage pumps from ITT would help carry the costs of an
eventual application for detecting snoring.
6.4 Recommendations
I would recommend further studies in the area of vibration characteristics during snoring for
submersible drainage pumps. More specifically I would recommend measuring the vibrations from
more pump models and during more situations.

Snoring Detection in a Centrifugal Pump with Vibrations 7 References
60 Alexander Bjarnestam Fullemann
7 References
1. Morgan, S.E., The ABCs of Pump Selection for Mine Dewatering. Engineering and Mining
Journal, 2008. 209(8).
2. Svensson, S. and A. Wikingsson, Flödeskännande Pumpavstängning (Flow Sensitive Pump
Shut Down), in Instutitionen för Maskinkonstruktion (Departement of Machine Design).
2002, Kungliga Tekniska Högskolan (Royal Institute of Technology): Stockholm.
3. Linder, H. and G. Johansson, Integrerad Flödeskännande Pumpavstängning (Integrated
Flow-Sensitive Pump Shutdown), in Instutitionen för Maskinkonstruktion (Departement of
Machine Design). 2003, Kungliga Tekniska Högskolan (Royal Institute of Technology):
Stockholm.
4. Markström, M., Termisk Vattensensor för Pumpstyrning (Thermal Water Sensor for Pump
Control), in Instutitionen för Maskinkonstruktion (Departement of Machine Design). 2001,
Kungliga Tekniska Högskolan (The Royal Institute of Technology): Stockholm.
5. Sinha, J.K. and A.R. Rao, Vibration Based Diagnosis of a Centrifugal Pump, Vibration
Laboratory: Mumbai.
6. Beebe, R.S., Predictive Maintenance of Pumps Using Condition Monitoring. 2004: Elsevier
Science & Technology Books
7. Hernandez-Solis, A., Diagnosis of Centrifugal Pumps, in Instutitionen för Elektriska
Maskiner och Effektelektronik (Department of Electrical Machines and Power Electronics).
2006, Kungliga Tekniska Högskolan (Royal Institute of Technology): Stockholm.
8. Conradsson, Å., Metod för Sörplingsdetektering av Dräneringspumpar (Method for Snore
Control of Submersible Drainage Pumps), in Instutitionen för Industridesign och
Produktutveckling (Department of Information, Design and Product Development). 2002,
Mälardalens Högskola (Mälardalen University): Stockholm.
9. HO, C., Effects pf Clogging on Vibration and System Parameters of Submersible Sewage
Pumps. 1999, University of Sydney: Sydney.
10. Nelik, L., Centrifugal and Rotary Pumps - Fundamentals With Applications. 1999, Boca
Raton: CRC Press.
11. Karassik, I.J., et al., Pump Handbook. 3 ed. 2001: McGraw-Hill.
12. Huaqing, W. and C. Peng, Intelligent diagnosis method for a centrifugal pump using features
of vibration signals. Neural Computing & Applications, 2006. 10.1007/s00521-008-0192-4.
13. Goldman, S., Vibration Spectrum Analysis: A practical approach. First edition ed. Vol. First
printing. 1991, New York: Idustrial Press Inc.
14. Nymand, M. How to read microphone specifications. Volume,
15. Gustafsson, F., L. Ljung, and M. Millnert, Signalbehandling. 2000, Lund: Studentlitteratur.
16. Johansson, H., et al., Elektroteknik, ed. H. Johansson. 2005, Stockholm: Instutitionen för
Maskinkonstruktion - Mekatronik.