Snohomish County Surface Water Management Resource ...
31
SWM-RM-002- Standard Operating Procedures for Continuous Temperature Monitoring of Fresh Water Rivers and Streams – V1.2 1/2/2020 Page 1 of 30 Snohomish County Surface Water Management Resource Monitoring Group Standard Operating Procedures for Continuous Temperature Monitoring of Fresh Water Rivers and Streams. Version 1.2 Author – Steve Britsch Date – Jan 2, 2020 Reviewers: Keith Westlund and Tong Tran QA Approval - Robert Plotnikoff –Quality Assurance Officer Date – Jan 21, 2020 SWM-RM-002 Original Approval Date: Sept 10, 2019 Latest Recertification Date: Latest QA Approval Date: Jan 21, 2020
Transcript of Snohomish County Surface Water Management Resource ...
SWM-RM-002- Standard Operating Procedures for Continuous Temperature Monitoring of Fresh Water Rivers and Streams – V1.2 1/2/2020
Page 1 of 30
Snohomish County Surface Water Management
Resource Monitoring Group
Standard Operating Procedures for Continuous Temperature Monitoring of Fresh Water Rivers and
Streams.
Version 1.2
Author – Steve Britsch
Date – Jan 2, 2020
Reviewers: Keith Westlund and Tong Tran
QA Approval - Robert Plotnikoff –Quality Assurance Officer
Date – Jan 21, 2020
SWM-RM-002
Original Approval Date: Sept 10, 2019
Latest Recertification Date:
Latest QA Approval Date: Jan 21, 2020
SWM-RM-002- Standard Operating Procedures for Continuous Temperature Monitoring of Fresh Water Rivers and Streams – V1.2 1/2/2020
Page 2 of 30
Please note that Snohomish County Surface Water Management’s (SWM) Standard Operating
Procedures (SOPs) are adapted from Washington State Department of Ecology Standard Operating
Procedure EAP 080, other published methods, or developed by in-house technical and administrative
experts. Their primary purpose is for internal Snohomish County use, although sampling and
administrative SOPs may have a wider utility. Our SOPs do not supplant official published methods.
Distribution of these SOPs does not constitute an endorsement of a particular procedure or method.
Any reference to specific equipment, manufacturer, or supplies is for descriptive purposes
only and does not constitute an endorsement of a particular product or service by the author
or by Snohomish County.
Although SWM follows the SOP in most cases, there may be instances in which the County uses an
alternative methodology, procedure, or process.
SWM-RM-002- Standard Operating Procedures for Continuous Temperature Monitoring of Fresh Water Rivers and Streams V1.2 1/2/2020
Page 3 of 30
SOP Revision History
Revision
Date
Rev
numbe
r
Summary of changes Sections Reviser(s)
April 10 ,
2018
1.0 Updated from SWM 2012 SOP Version 1.2 ..\..\..\..\..\Wq\Temperature
Logger\Protocols\Continuous_Temperature_Data_Management_Ver1.2
_Update_March2012.pdf
All Steve
Britsch
September
10, 2019
1.1 Added attachment E, additional quality control detail. 14 Steve
Britsch
January 2,
2020
1.2 Added clarity on correction of raw data after 2nd failed post monitoring
calibration check
14.4 Steve
Britsch
SWM-RM-002- Standard Operating Procedures for Continuous Temperature Monitoring of Fresh Water Rivers and Streams – V1.2 1/2/2020
Page 4 of 30
Water Quality Monitoring Program
Standard Operating Procedures for Continuous Temperature Monitoring of Fresh Water Rivers and
Streams.
Introduction
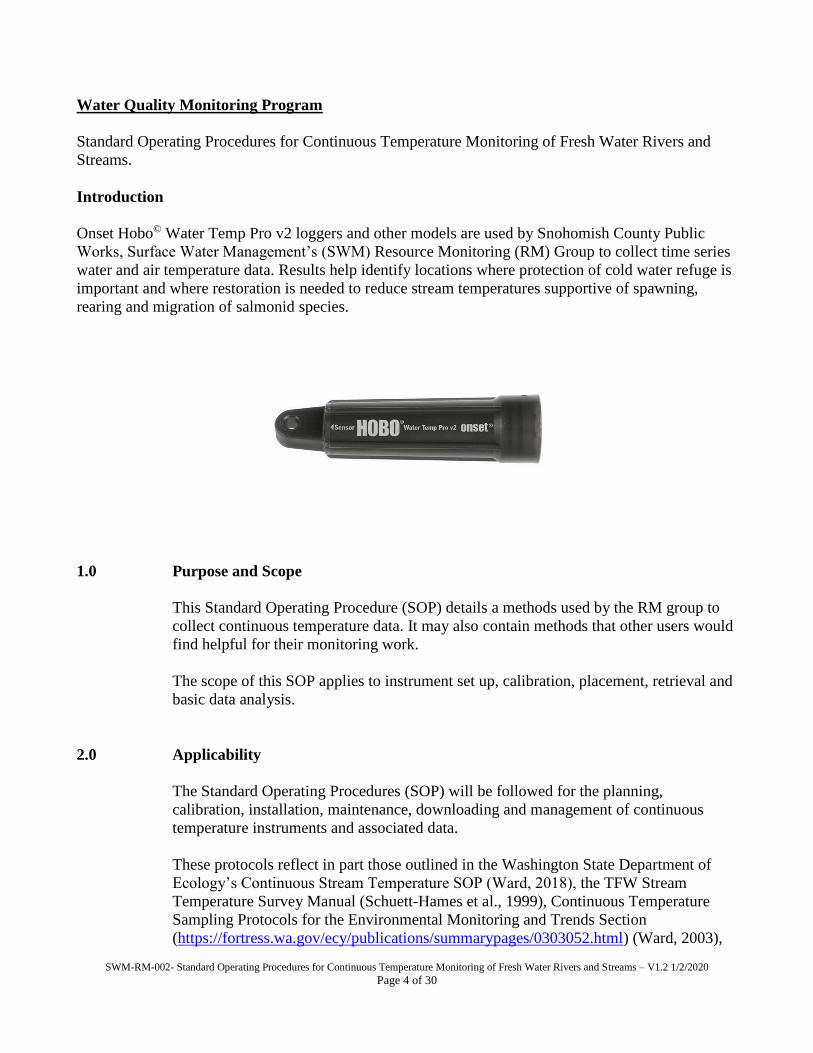
Onset Hobo© Water Temp Pro v2 loggers and other models are used by Snohomish County Public
Works, Surface Water Management’s (SWM) Resource Monitoring (RM) Group to collect time series
water and air temperature data. Results help identify locations where protection of cold water refuge is
important and where restoration is needed to reduce stream temperatures supportive of spawning,
rearing and migration of salmonid species.
1.0 Purpose and Scope
This Standard Operating Procedure (SOP) details a methods used by the RM group to
collect continuous temperature data. It may also contain methods that other users would
find helpful for their monitoring work.
The scope of this SOP applies to instrument set up, calibration, placement, retrieval and
basic data analysis.
2.0 Applicability
The Standard Operating Procedures (SOP) will be followed for the planning,
calibration, installation, maintenance, downloading and management of continuous
temperature instruments and associated data.
These protocols reflect in part those outlined in the Washington State Department of
Ecology’s Continuous Stream Temperature SOP (Ward, 2018), the TFW Stream
Temperature Survey Manual (Schuett-Hames et al., 1999), Continuous Temperature
Sampling Protocols for the Environmental Monitoring and Trends Section
(https://fortress.wa.gov/ecy/publications/summarypages/0303052.html) (Ward, 2003),

SWM-RM-002- Standard Operating Procedures for Continuous Temperature Monitoring of Fresh Water Rivers and Streams – V1.2 1/2/202019
Page 5 of 30
Measuring Stream Temperature with Digital Data Loggers (USFS, 2005), and Standard
Operating Procedures for continuous temperature monitoring of fresh water rivers and
streams conducted in a Total Maximum Daily Load (TMDL) project for stream
temperature (Bilhimer and Stohr, 2008).
3.0 Glossary of Acronyms
3.1 7DADMax - 7-day average of the daily maximum temperature
3.2 EAP - Ecology’s Environmental Assessment Program
3.3 GPS - Global Position System
3.4 NIST - National Institute of Standards and Technology
3.5 PST - Pacific Standard Time
3.6 PDT - Pacific Daylight savings Time
3.7 QAMP - Quality Assurance Management Plan
3.8 SOP - Standard Operating Procedure
3.9 SWM - Surface Water Management
3.10 TFW - Timber, Fish, and Wildlife Program
3.11 TMDL - Total Maximum Daily Load
4.0 Personnel Qualifications/Responsibilities
4.1 Field operations require training specified by job title in SWM’s Safety Training
database.
4.2 This SOP pertains to all Natural Resource Scientists, Environmental Specialists,Interns
and Environmental Technicians in the RM group or other staff using this SOP.
4.3 All field staff must have read the instrument manual, this SOP, completed field training
and be familiar with procedures for data collection.
4.4 All field staff must be familiar with the electronic data recording tablet.
4.5 The field lead directing sample collection must be knowledgeable of all aspects of the
project’s Quality Assurance Monitoring Plan (QAMP) to ensure that credible and
useable data are collected. All field staff should be briefed by the field lead or project
manager about the sampling goals and objectives prior to arriving at the site.
SWM-RM-002- Standard Operating Procedures for Continuous Temperature Monitoring of Fresh Water Rivers and Streams – V1.2 1/2/2020 Page 6 of 30
5.0 Equipment, Reagents, and Supplies
5.1 General Field Equipment:
5.2 See Attachment A for a list of the typical equipment and supplies that may be used to
deploy temperature loggers.
5.3 Specialized Field Equipment1
5.4 Rebar Pounder (see design specifications in Attachment B)
5.5 PVC Shade Device (see design specifications in Attachment B)
5.6 Onset Hobo© Water Temp Pro v2, (#U22-001), -20°C to +50°C, +/- 0.2C
5.7 Onset Water Level/Temp Logger (MX2001-0x-S +/- 0.44 0° to 50°C
5.8 Oakton Digital thermistor with an accuracy of +/-0.2ºC
5.9 PC communication cables or optic shuttles
6.0 Summary of Procedure
6.1 Pre-Deployment Preparation
6.2 Gather equipment. Use a checklist to ensure that all of the necessary preparation tasks,
equipment, supplies, and safety gear are completed (See Attachment A for the
Continuous Temperature Sampling Checklist).
6.3 Calibration Checks. All temperature loggers must be calibration checked both pre- and
post-study to document instrument accuracy specifications.
6.4 The calibration checks are done using test-bath temperatures that bracket the intended
monitoring range (near 20 and 0ºC). The bath temperatures must be verified with a
NIST traceable or calibrated reference thermistor, thermocouple, or thermometer (NIST
thermometer)2. Note: This procedure is also used to determine correction factors (if
required) for the field thermistor and thermometer measurements.
6.5 A calibration-check test-bath method that can maintain a constant temperature is
essential to obtain excellent test results.
6.6 Place a necessary number of open coolers half full of water overnight in room (SWM
Lab) that has a constant air temperature near 20ºC. If necessary, use an aquarium heater
capable of warming and maintaining water temperatures near 20ºC.
1 The specialized equipment listed does not represent an endorsement by Snohomish County. Other equipment may be used
if it meets the project QA/QC requirements for accuracy and reliability. 2 All NIST reference thermistors, thermocouplers and thermometers, used for this test, need to have an annual three-point
(near 0, 10, 20°C) calibration check through the manufacturer who provides a calibration certificate. Certificates are kept in
hardcopy with each year’s monitoring records and electronically on the County network.
7SWM-RM-002- Standard Operating Procedures for Continuous Temperature Monitoring of Fresh Water Rivers and Streams V1.2 1/2/2020
Page 7 of 30
Note: Test baths done in rooms that have the target temperature ensure stable bath
temperatures and the overall quality of the test.
6.7 Program the temperature loggers for the test start time and a 10 minute logging duration
at one minute measurement intervals.
6.8 On the day of calibration, fill a necessary number of coolers half full with ice and add
just enough water to fill the space between the ice.
6.9 Put the programmed temperature loggers in the near 20ºC water bath, stir for uniformity
and ensure loggers stay submerged. Allow several minutes prior to start of check for
loggers to stabilize in the water bath.
6.9.1 At the same time, place the NIST thermometer in the water bath oriented to easily view
the scale increments. Then, gently stir the water to help ensure a uniform water
temperature.
6.9.2 Gently stir the water bath again a few minutes before test and just after reading and
recording the NIST thermometer temperature.
6.9.3 Record ten relatively constant and consecutive (every 1 minute) NIST thermometer
comparison measurements on the Calibration Check Form (See Attachment C1 for
blank form and Attachment C2 for an example of a used form).
6.9.4 Transfer the temperature loggers, thermometers, and thermistor probes to the ice bath
coolers. Gently stir the transition ice bath and allow the loggers to soak there for several
minutes to stabilize temperatures.
6.9.5 Repeat the process noted above to obtain ten relatively constant NIST thermometer
comparison measurements from the ice water bath.
6.9.6 Download the temperature loggers as soon as possible after the test to shut them off and
minimize battery life impacts.
6.9.7 Calculate the mean absolute value of the difference between the temperature logger
measurements and the NIST thermometer for water and ice baths independently. Water-
temperature loggers that have a mean difference greater than 0.2°C in one or both water
baths have failed the test and cannot be used unless they pass a follow up test. Air
temperature loggers that have a mean difference greater than 0.4°C in one or both have
failed the test and cannot be used unless they pass a follow up test.
6.9.8 Launch temperature loggers. Adjust the computer clock settings to Pacific Standard
Time (PST) and also make sure that it will not automatically adjust to Daylight Savings
Time (DST). Then adjust the clock time to the atomic clock (e.g.,
http://www.time.gov/). These necessary steps ensure that all the data will be in PST
year-round and that all loggers will monitor at exactly the same time.
7SWM-RM-002- Standard Operating Procedures for Continuous Temperature Monitoring of Fresh Water Rivers and Streams – V1.2 1/2/2020
Page 8 of 30
6.9.9 Program the temperature loggers for a delayed launch that starts at least one hour before
the first planned deployment time of the season and at a 30 minute monitoring interval.
7.0 Stream temperature logger site selection methods
7.1 Deploy temperature loggers in the active and well-mixed part of the stream (or as close
as possible to it) to ensure representative temperatures (based on flow volume) are
recorded throughout the entire deployment period.
7.2 The preferred location in these areas is against an in-stream landmark or other
submerged structure that can help hide the logger and minimize the loss to vandalism or
high-flow events and also where direct sunlight may be avoided. Note: avoid
deployment locations near popular swimming holes and fishing access points where
there is a much higher chance of logger discovery and loss to vandalism.
7.2 Ideal deployment locations are typically at the upstream outside edge or downstream
inside edge of the river bends, or in the middle of riffles of low flow and wadeable
stream (see Figure 1 below).
7.3 Temperature logger locations should never be in eddies or pools or locations where
these conditions may develop during low flows. In addition, unless the study
question requires it, locations just downstream of tributaries, stream-side wetland areas,
point-source discharges, and potential hillside groundwater seeps should also be
avoided because these conditions may seasonally bias the recorded temperatures.
Consider locations either on the opposite side of the stream or upstream of these
conditions.
7.4 Deployment depth locations should not be on the stream bottom where the loggers may
record groundwater inflow, but deep enough that they do not become exposed to air
during a low-flow period. The basic deployment location depth goal is six (6) inches
(<0.5 ft) off the stream bottom in smaller streams and wadeable locations and, if
possible, at about one half of the water depth in the large streams (Schuett-Hames et al.,
1999). Note: Locating temperature loggers near the stream bottom may be necessary in
small streams to ensure that the logger remains submerged during low flows.

SWM-RM-002- Standard Operating Procedures for Continuous Temperature Monitoring of Fresh Water Rivers and Streams – V1.2 1/2/2020
Page 9 of 30
Figure 1. Potential Temperature Logger Deployment Locations
8.0 Stream temperature logger deployment options
8.1 Record the water-temperature-logger serial numbers on the survey form. (See
Attachment D1 for blank form and Attachment D2 for an example).
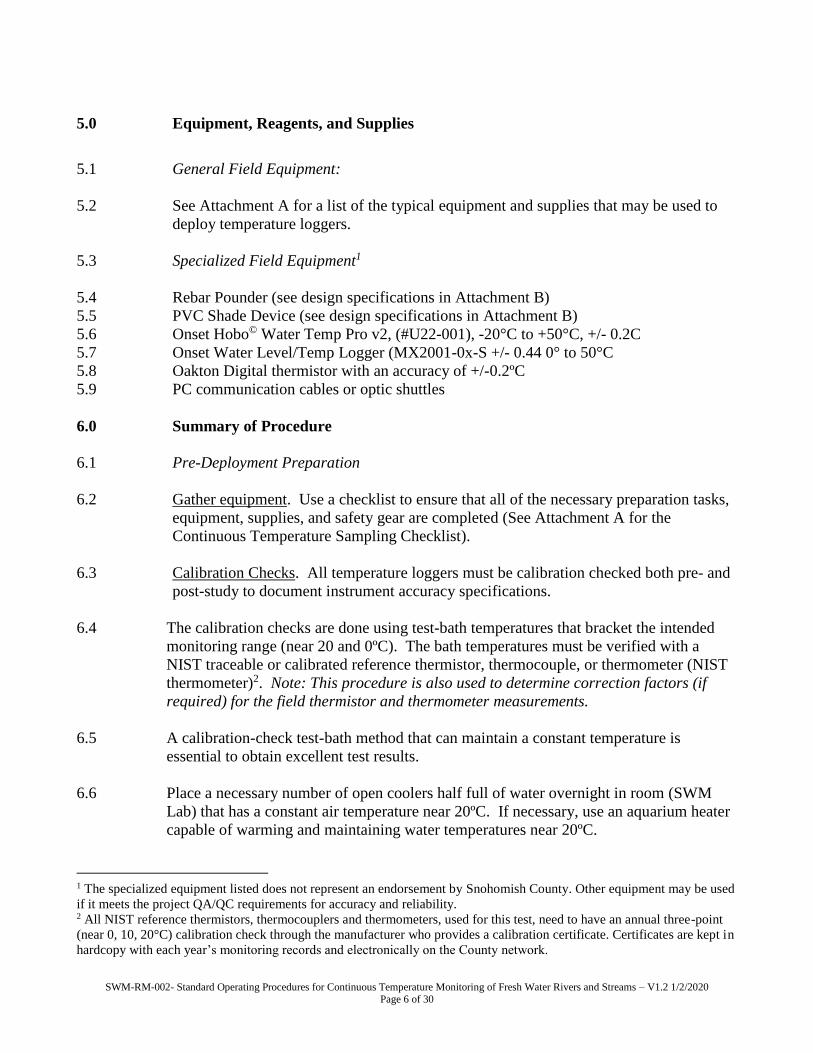
8.2 Pre-assemble the water-temperature logger with a PVC shade device cover (See fig.2
below and design in Attachment B) that helps hide the logger and prevent any bias from
indirect solar radiation.
8.3 Avoid low-flow and direct-sunlight temperature logger deployment locations. If the
temperature logger needs to be deployed in these locations, then a PVC shade cover
must be used to prevent any solar-biased temperature results (USFS, 2005).
SWM-RM-002- Standard Operating Procedures for Continuous Temperature Monitoring of Fresh Water Rivers and Streams – V1.2 1/2/2020
Page 10 of 30
8.4
Figure 2. Assembled Temperature Logger and PVC Cover
8.5 Rebar Deployments. This option is typically used in small- and medium-sized streams
to create a suitable temperature logger attachment location in or as near as possible to
the active part of the stream. In most cases, this method is best used against the active-
part-of-the-stream side of a large landmark rock or log.
8.6 Choose a 2-3 foot length of rebar that can be driven deep enough into the streambed to
stay in place during high streamflow events and provide an attachment location that is
six inches to one-half of the expected total stream depth during the seasonal low-flow
period.
8.7 Insert the rebar into the open end of the rebar pounder and use a 4# engineering hammer
(or an alternative) to hammer the rebar into the streambed by striking the heavy steel
head of the pounder. Hammer all but eight inches of the rebar into the streambed3.
8.8 Leave the rebar pounder on the rebar, and document the water-temperature logger
location with photographs.
8.9 Large Rock, Tree Root, or woody debris deployments. This option uses existing
instream structures such as large rocks or boulders, woody debris, or roots that are
located in or extend into the desired location in the active part of the stream. Attach the
water-temperature logger to these structures with cable ties or wire, or to cable or heavy
wire that may be used to create the location near the base of these structures. Photos of
the location using a visual marker (such as the rebar pounder, hammer handle, nearby
3 If a mid-stream depth is desired, then leave more rebar exposed.
SWM-RM-002- Standard Operating Procedures for Continuous Temperature Monitoring of Fresh Water Rivers and Streams – V1.2 1/2/2020
Page 11 of 30
flagging, or pointing with a finger) are essential to help relocate loggers installed by this
method.
8.10 Anchor deployments. This option can be used where stable large woody debris is not
available or where near-surface bedrock or other consolidated sediments prohibit rebar
use. The basic approach is to attach the water-temperature-logger assembly to a heavy
weight (i.e., rock, brick, concrete block, wadded up piece of chain, or rebar) that may be
set in the desired water-temperature-logger location.
8.11 It is also advisable that the heavy object be cabled or chained to something on the
nearest bank (or other stable instream structure) to prevent loss during a possible high
flow event (Note: rusty chain use may deter logger loss to vandalism more than a shiny
cable). The heavy weight may be encouraged into the desired deployment location
using a stick or boat hook (or similar device). Note: this is not considered a viable
option in locations with a significant groundwater inflow.
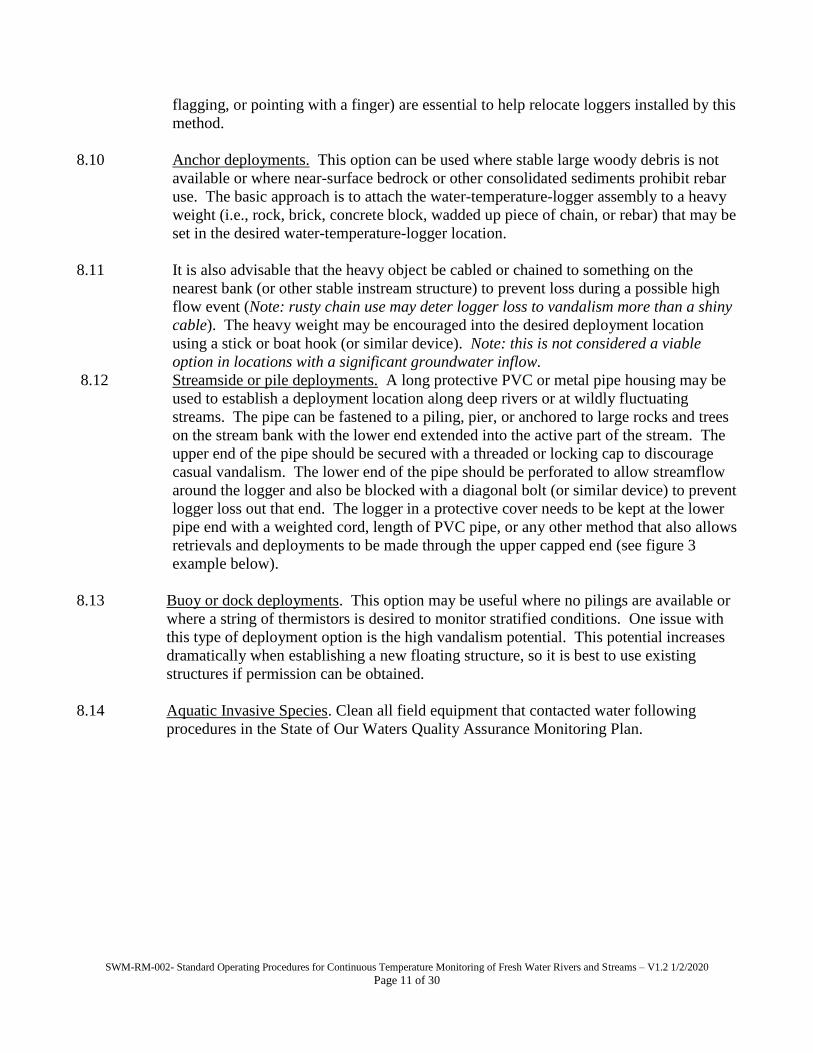
8.12 Streamside or pile deployments. A long protective PVC or metal pipe housing may be
used to establish a deployment location along deep rivers or at wildly fluctuating
streams. The pipe can be fastened to a piling, pier, or anchored to large rocks and trees
on the stream bank with the lower end extended into the active part of the stream. The
upper end of the pipe should be secured with a threaded or locking cap to discourage
casual vandalism. The lower end of the pipe should be perforated to allow streamflow
around the logger and also be blocked with a diagonal bolt (or similar device) to prevent
logger loss out that end. The logger in a protective cover needs to be kept at the lower
pipe end with a weighted cord, length of PVC pipe, or any other method that also allows
retrievals and deployments to be made through the upper capped end (see figure 3
example below).
8.13 Buoy or dock deployments. This option may be useful where no pilings are available or
where a string of thermistors is desired to monitor stratified conditions. One issue with
this type of deployment option is the high vandalism potential. This potential increases
dramatically when establishing a new floating structure, so it is best to use existing
structures if permission can be obtained.
8.14 Aquatic Invasive Species. Clean all field equipment that contacted water following
procedures in the State of Our Waters Quality Assurance Monitoring Plan.
SWM-RM-002- Standard Operating Procedures for Continuous Temperature Monitoring of Fresh Water Rivers and Streams – V1.2 1/2/2020
Page 12 of 30
Figure 3. Deployment method using a length of PVC pipe
9.0 Documentation Procedures
9.1 Record all the field data and deployment location information on the Continuous
Temperature Station Survey Form (See example in Attachment D-1) or by a similar
method. Be sure to note the station number and name, temperature logger ID numbers,
and any other useful narrative observations, especially those useful for finding the
location (e.g. – “upstream of largest boulder on right bank”).
9.2 Draw a map and describe the general area, noting the temperature-logger locations,
logger installation technique, and any landmark references such as a unique rock, log,
root, flagging, or tree (See example in Attachment D-2). Note: if possible, draw the
map with north being toward the page top or denote the direction of north on the
drawing. Use your cell phone compass application to find the north-facing direction.
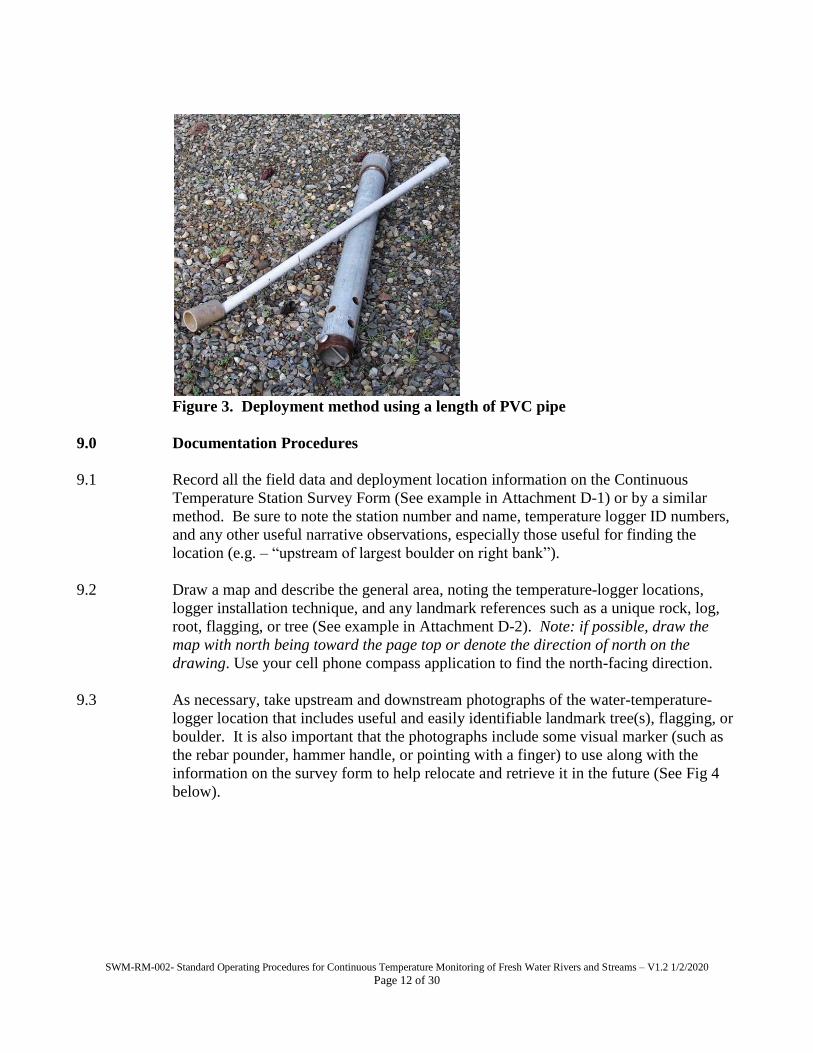
9.3 As necessary, take upstream and downstream photographs of the water-temperature-
logger location that includes useful and easily identifiable landmark tree(s), flagging, or
boulder. It is also important that the photographs include some visual marker (such as
the rebar pounder, hammer handle, or pointing with a finger) to use along with the
information on the survey form to help relocate and retrieve it in the future (See Fig 4
below).
SWM-RM-002- Standard Operating Procedures for Continuous Temperature Monitoring of Fresh Water Rivers and Streams – V1.2 1/2/2020
Page 13 of 30
Figure 4. Photo showing the water-temperature-logger deployment location.
10.0 Mid-deployment checks
10.1 Periodically visit the temperature-logger location during the deployment period and to
make sure that it remains submerged and in a representative location. If the logger
needs to be moved or is missing and needs to be replaced, then take the appropriate
action and enter new remarks and notes on the survey form. Note: consider taking
replacement loggers and deployment equipment along when doing these checks to help
expedite the relocation process.
11.0 Retrieval Procedures
11.1 Record all the retrieval information on the Continuous Temperature Station Survey
Form (See example in Attachment D-1).
11.2 If the stream may be easily waded, then also consider doing a cross-sectional survey of
the stream temperature. The survey results may help determine if the stream-
temperature logger measured representative temperatures and show any cross-sectional
temperature differences.
11.3 Remove all rebar, cement blocks, or other deployed equipment at the end of the study.
11.4 Aquatic Invasive Species. Clean all field equipment that contacted water following the
procedures in the State of Our Waters Quality Assurance Project Plan.
SWM-RM-002- Standard Operating Procedures for Continuous Temperature Monitoring of Fresh Water Rivers and Streams – V1.2 1/2/2020
Page 14 of 30
12.0 Downloading Procedures
12.1 Gently clean the temperature loggers with a soft wet cloth to remove any bio-fouling or
sediment that may affect its ability to communicate optically during the downloading
process. The preferred method is to use water and a soft cloth or soft-bristled brush.
Note: avoid using any method that can scratch the logger optic communication area.
12.2 Set the computer clock to atomic clock time for the Pacific Time Zone before
downloading any temperature loggers. Then follow the manufacturer’s downloading
procedures, and save the data in text files that may be opened in Excel or another type
of spreadsheet software.
13.0 Records Management
13.1 Continuous Temperature Survey Forms are used to document the deployment and
retrieval information for a station. Filled-out field forms are organized and stored in
binders to use for long-term recordkeeping.
13.2 Use standard data processing and analysis sheets to trim, process and analyze data. The
WISKI database will be used to store, process and view data.
13.3 Spatial, technical and data quality attributes are maintained in a geographical
information systems file.
13.4 Guidance for archival of records can be found at
https://team/depts/spw/AO/Records/default.aspx
14.0 Quality Control and Quality Assurance Section
14.1 The reference thermistor, used for calibration of data loggers, receives annual factory
calibration. Digital calibration certificates are saved to network drives.
14.2 Temperature Logger Post-Deployment Accuracy Check. Verify the accuracy of the
retrieved temperature loggers by conducting a post-deployment calibration check (Refer
to Calibration Check section 6, above).
14.3 If the mean absolute value of the temperature difference for a logger in each ice and
water bath, compared against the NIST certified thermometer, is equal to or less than
the manufacturer stated accuracy ±0.2°C for a water-temperature logger, a second check
should be performed. Air temperature loggers that have a mean difference greater than
0.4°C in one or both have failed the test and cannot be used unless they pass a follow up
test.
SWM-RM-002- Standard Operating Procedures for Continuous Temperature Monitoring of Fresh Water Rivers and Streams V1.2 1/2/2020
Page 15 of 30
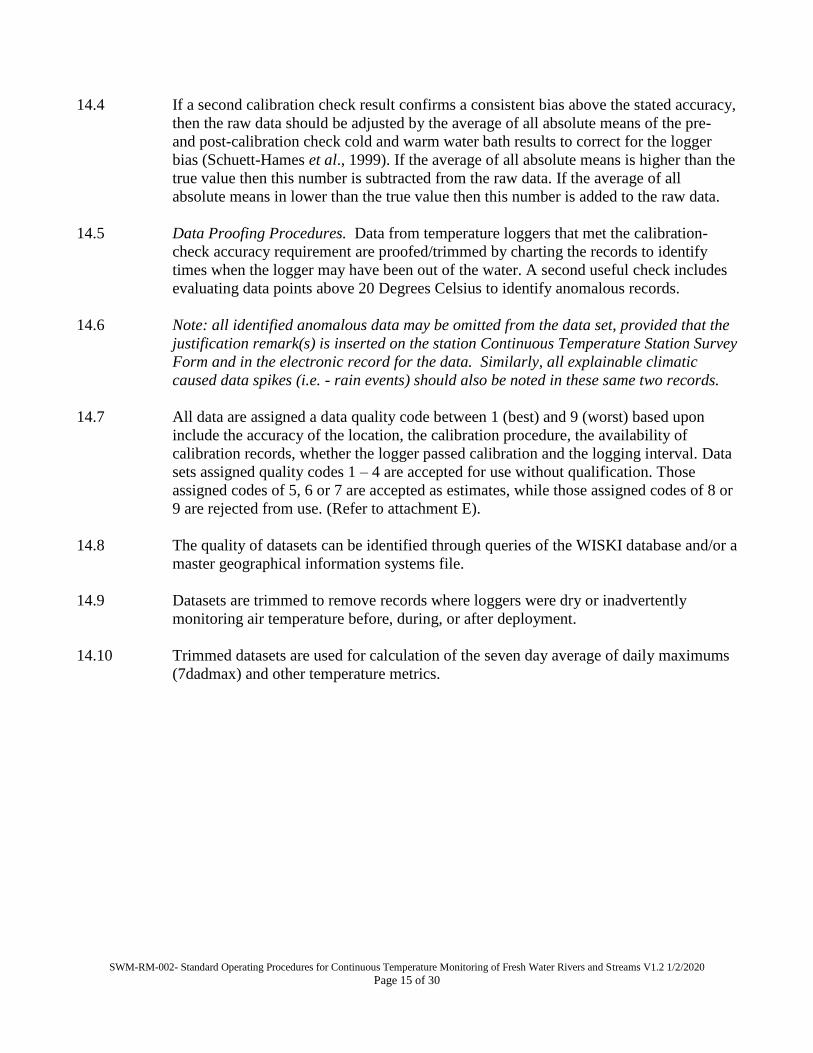
14.4 If a second calibration check result confirms a consistent bias above the stated accuracy,
then the raw data should be adjusted by the average of all absolute means of the pre-
and post-calibration check cold and warm water bath results to correct for the logger
bias (Schuett-Hames et al., 1999). If the average of all absolute means is higher than the
true value then this number is subtracted from the raw data. If the average of all
absolute means in lower than the true value then this number is added to the raw data.
14.5 Data Proofing Procedures. Data from temperature loggers that met the calibration-
check accuracy requirement are proofed/trimmed by charting the records to identify
times when the logger may have been out of the water. A second useful check includes
evaluating data points above 20 Degrees Celsius to identify anomalous records.
14.6 Note: all identified anomalous data may be omitted from the data set, provided that the
justification remark(s) is inserted on the station Continuous Temperature Station Survey
Form and in the electronic record for the data. Similarly, all explainable climatic
caused data spikes (i.e. - rain events) should also be noted in these same two records.
14.7 All data are assigned a data quality code between 1 (best) and 9 (worst) based upon
include the accuracy of the location, the calibration procedure, the availability of
calibration records, whether the logger passed calibration and the logging interval. Data
sets assigned quality codes 1 – 4 are accepted for use without qualification. Those
assigned codes of 5, 6 or 7 are accepted as estimates, while those assigned codes of 8 or
9 are rejected from use. (Refer to attachment E).
14.8 The quality of datasets can be identified through queries of the WISKI database and/or a
master geographical information systems file.
14.9 Datasets are trimmed to remove records where loggers were dry or inadvertently
monitoring air temperature before, during, or after deployment.
14.10 Trimmed datasets are used for calculation of the seven day average of daily maximums
(7dadmax) and other temperature metrics.
SWM-RM-002- Standard Operating Procedures for Continuous Temperature Monitoring of Fresh Water Rivers and Streams – V1.2 1/2/2020
Page 16 of 30
15.0 Safety
15.1 Persons involved with collection of temperature data could be subjected to unsafe
environments. Hazards include, but are not limited to roadside traffic, slips, trips,
falls, drowning, heat and cold stress, exposure to chemicals and biological pathogens.
15.2 Staff are provided appropriate PPE to minimize hazards. Teams of two should be
considered especially for sites where data are gathered on larger streams/rivers during
moderate to high flow events.
15.3 Washington State Department of Labor and Industries requires that employers
provide a safe work environment through communicating hazards and providing
adequate training.
15.4 Required safety training, inclusive of General Field Safety, Chemical Hygiene,
Hazwoper, Roadway Safety, and Swift-water awareness have been identified by
position.
SWM-RM-002- Standard Operating Procedures for Continuous Temperature Monitoring of Fresh Water Rivers and Streams V1.2 1/2/2020
Page 17 of 30
16.0 References
Bilhimer, D. and Stohr, A., 2008. Standard Operating Procedures for Continuous
Temperature Monitoring of Freshwater Rivers and Streams Conducted in a Total Maximum
Daily Load (TMDL) Project for Stream Temperature, Version 2.2. Washington State
Department of Ecology, SOP Number EAP044.
http://www.ecy.wa.gov/programs/eap/qa/docs/ECY_EAP_SOP_Cont_Temp_Monit_TMD
L_v3_0EAP044.pdf.
Dunham J., G. Chandler, B. Rieman, and D. Martin, 2005. Measuring Stream
Temperature with Digital Data Loggers: A User’s Guide. U.S.D.A. Forest Service
Rocky Mountain Research Station. General Technical Report RMRS-GTR-150WWW.
16 p.
Environmental Assessment Program, 2015. Environmental Assessment Program Safety
Manual. Washington Department of Ecology, Olympia, WA.
Hallock, D. 2010. Standard Operating Procedures to Minimize the Spread of Invasive
Species from Areas of Extreme Concern. EAP_SOP070.
Schuett-Hames, D., A. E. Pleus, E. Rashin, and J. Matthews, 1999. TFW Monitoring
Program Method Manual for the Stream Temperature Survey. Washington State
Department of Natural Resources and NW Indian Fisheries Commission publication
#TFW-AM9-99-005.
Ward, W., 2003. Continuous Temperature Sampling Protocols for the Environmental
Monitoring and Trends Section. Washington State Department of Ecology, Olympia,
WA. https://fortress.wa.gov/ecy/publications/summarypages/0303052.html.
Ward, W., 2018. Updated and Recertified Draft: Continuous Temperature Sampling
Protocols for the Environmental Monitoring and Trends Section. Washington State
Department of Ecology, Olympia, WA.

SWM-RM-002- Standard Operating Procedures for Continuous Temperature Monitoring of Fresh Water Rivers and Streams – V1.2 1/2/2020
Page 18 of 30
Attachment A
This Attachment contains the checklist used to prepare for temperature logger deployments.
SWM-RM-002- Standard Operating Procedures for Continuous Temperature Monitoring of Fresh Water Rivers and Streams – V1.2 1/2/2020Page 19 of
30
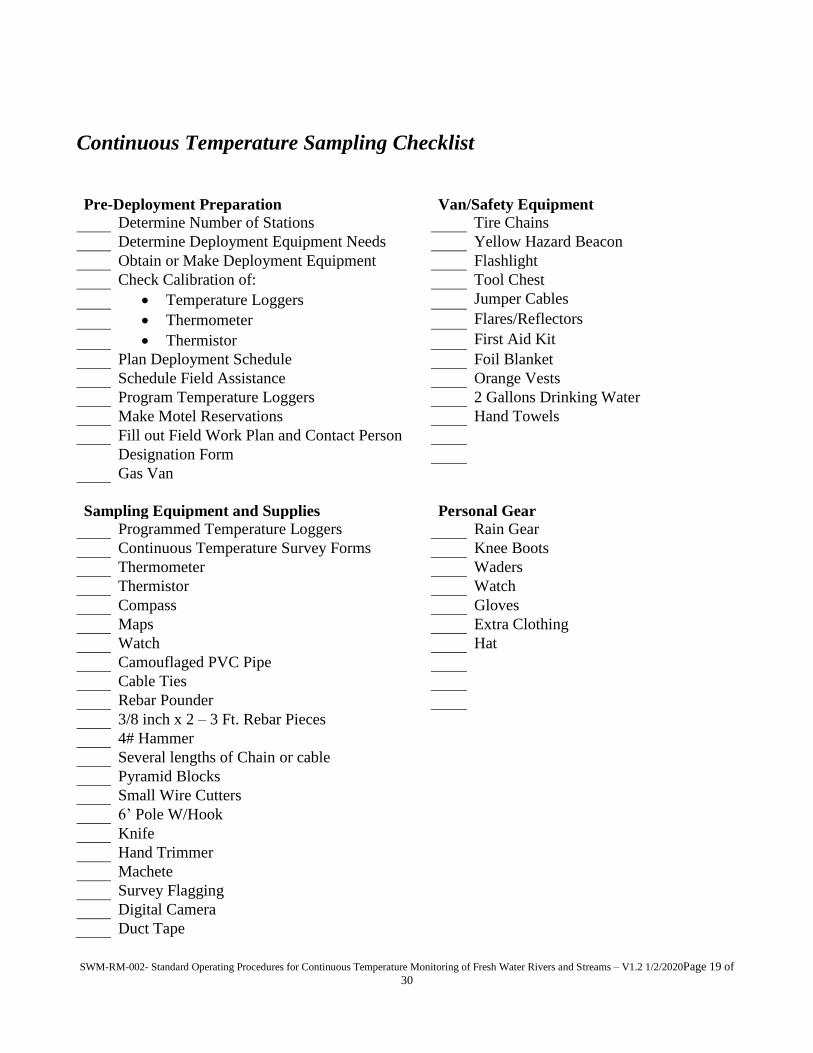
Continuous Temperature Sampling Checklist
Pre-Deployment Preparation Van/Safety Equipment
Determine Number of Stations Tire Chains
Determine Deployment Equipment Needs Yellow Hazard Beacon
Obtain or Make Deployment Equipment Flashlight
Check Calibration of: Tool Chest
Temperature Loggers Jumper Cables
Thermometer Flares/Reflectors
Thermistor First Aid Kit
Plan Deployment Schedule Foil Blanket
Schedule Field Assistance Orange Vests
Program Temperature Loggers 2 Gallons Drinking Water
Make Motel Reservations Hand Towels
Fill out Field Work Plan and Contact Person
Designation Form
Gas Van
Sampling Equipment and Supplies Personal Gear
Programmed Temperature Loggers Rain Gear
Continuous Temperature Survey Forms Knee Boots
Thermometer Waders
Thermistor Watch
Compass Gloves
Maps Extra Clothing
Watch Hat
Camouflaged PVC Pipe
Cable Ties
Rebar Pounder
3/8 inch x 2 – 3 Ft. Rebar Pieces
4# Hammer
Several lengths of Chain or cable
Pyramid Blocks
Small Wire Cutters
6’ Pole W/Hook
Knife
Hand Trimmer
Machete
Survey Flagging
Digital Camera
Duct Tape
SWM-RM-002- Standard Operating Procedures for Continuous Temperature Monitoring of Fresh Water Rivers and Streams – V1.2 1/2/2020
Page 20 of 30
Attachment B
This attachment contains the design specifications for the equipment that is made “in-house.” These
designs have been created to meet specific needs for past field studies and can be modified as needed.
The equipment to make these includes: power saws, drill press, and other hand tools. The rebar
pounder is manufactured by a contracted welder
SWM-RM-002- Standard Operating Procedures for Continuous Temperature Monitoring of Fresh Water Rivers and Streams – V1.2 1/2/2020
Page 21 of 30
8 inches
2 ½ Ft. steel pipe with a
¾ inch inside diameter.½ inch solid steel rod Round striking plate
welded to the rod and
then the pipe.
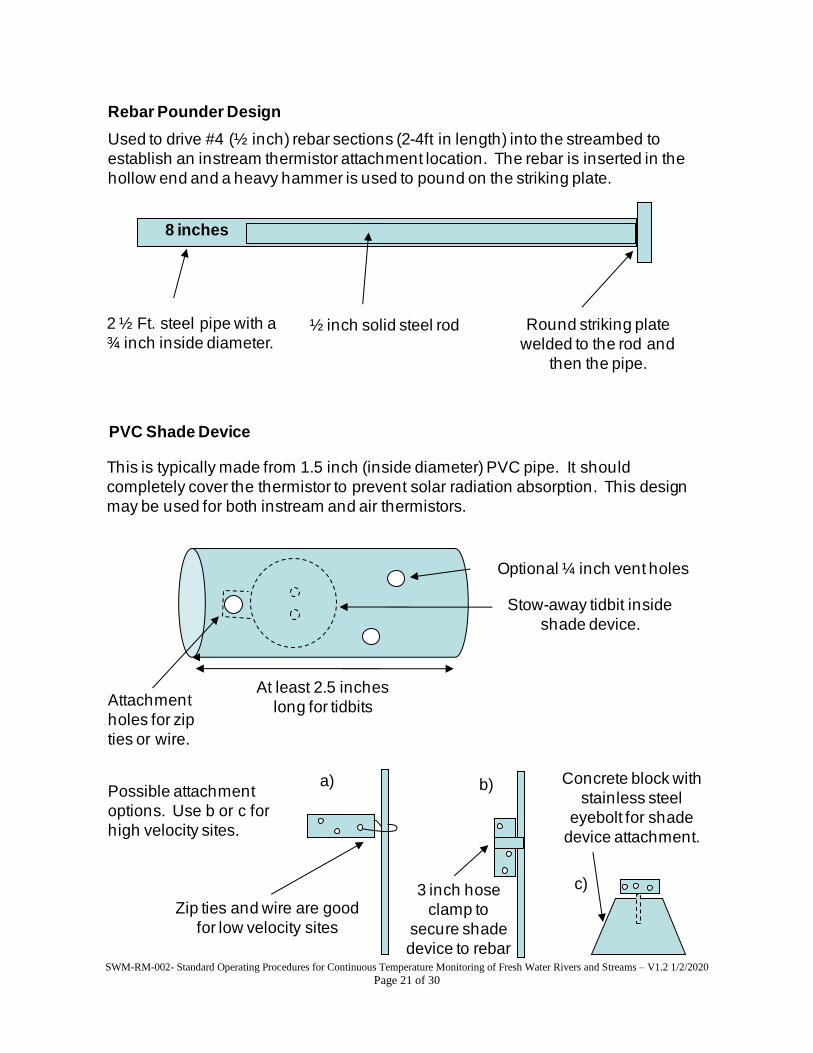
Used to drive #4 (½ inch) rebar sections (2-4ft in length) into the streambed to
establish an instream thermistor attachment location. The rebar is inserted in the
hollow end and a heavy hammer is used to pound on the striking plate.
Rebar Pounder Design
PVC Shade Device
This is typically made from 1.5 inch (inside diameter) PVC pipe. It should
completely cover the thermistor to prevent solar radiation absorption. This design
may be used for both instream and air thermistors.
At least 2.5 inches
long for tidbitsAttachment
holes for zip
ties or wire.
Optional ¼ inch vent holes
Stow-away tidbit inside
shade device.
Possible attachment
options. Use b or c for
high velocity sites.
Concrete block with
stainless steel
eyebolt for shade
device attachment.
3 inch hose
clamp to
secure shade
device to rebar
Zip ties and wire are good
for low velocity sites
a) b)
c)
SWM-RM-002- Standard Operating Procedures for Continuous Temperature Monitoring of Fresh Water Rivers and Streams – V1.2 1/2/2020
Page 22 of 30
Attachment C.
C-1. Temperature Logger Calibration Check Form - Blank Form.
C-2. Temperature Logger Calibration Check Form - Filled Out Form.
SWM-RM-002- Standard Operating Procedures for Continuous Temperature Monitoring of Fresh Water Rivers and Streams – V1.2 1/2/2020
Page 23 of 30
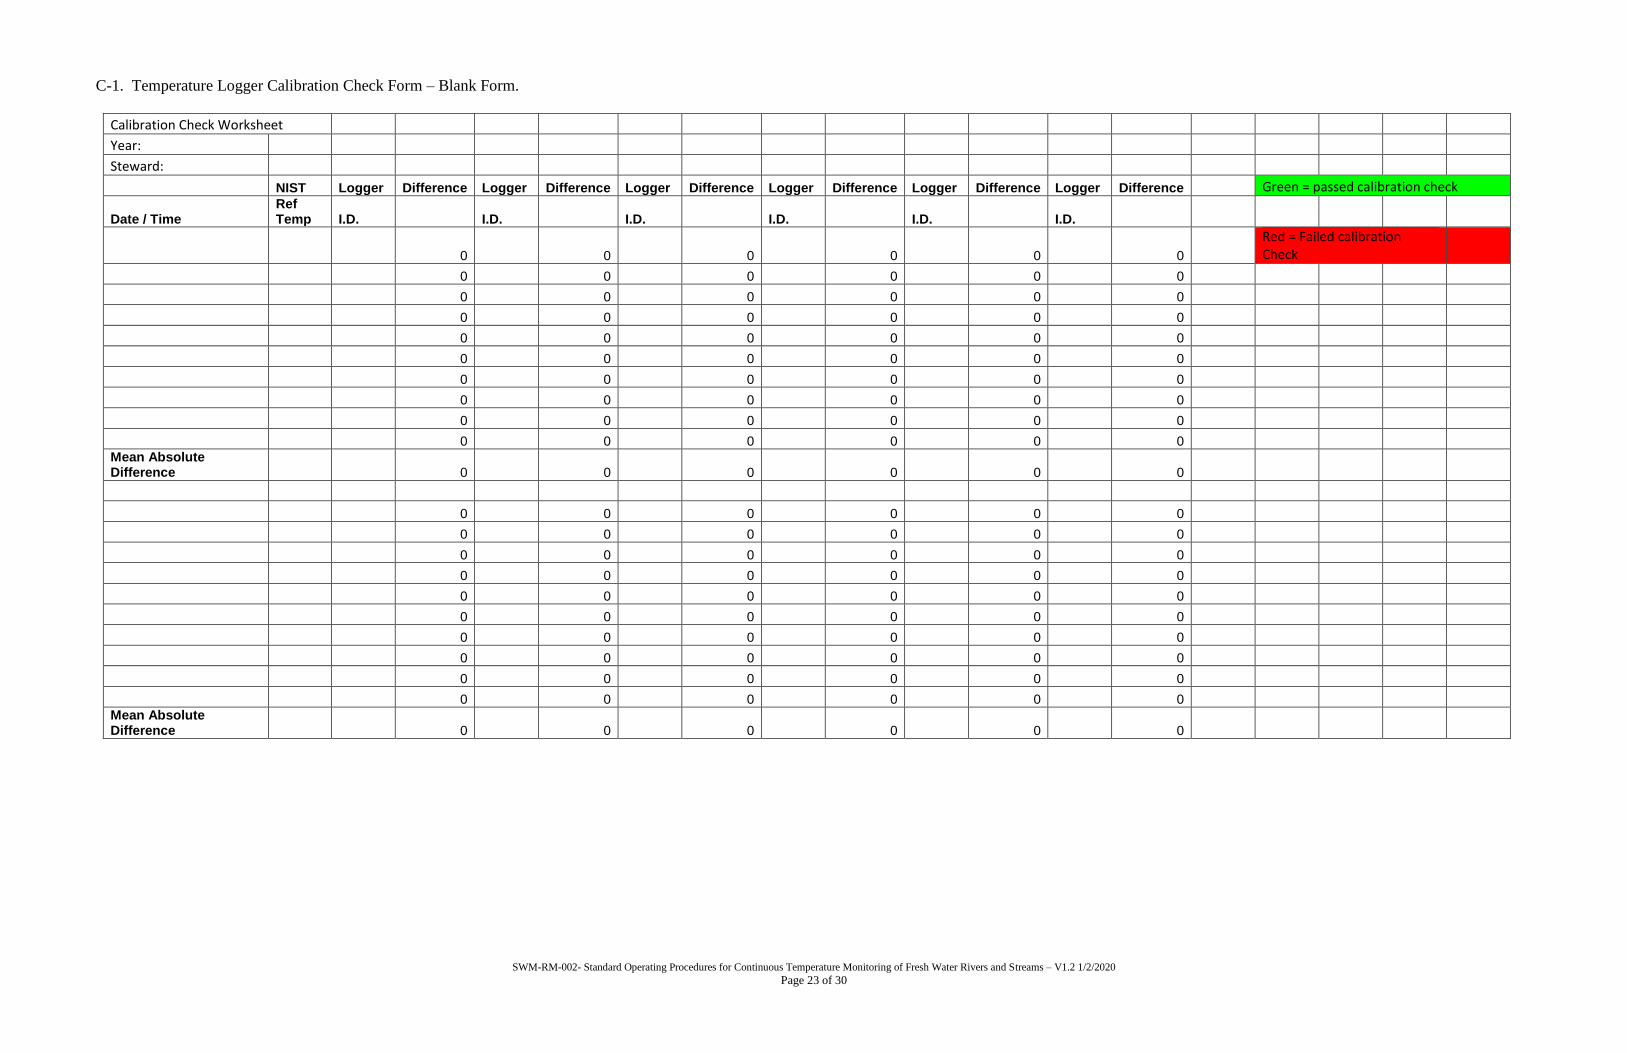
C-1. Temperature Logger Calibration Check Form – Blank Form.
Calibration Check Worksheet
Year:
Steward:
NIST Logger Difference Logger Difference Logger Difference Logger Difference Logger Difference Logger Difference Green = passed calibration check
Date / Time Ref Temp I.D. I.D. I.D. I.D. I.D. I.D.
0 0 0 0 0 0
Red = Failed calibration Check
0 0 0 0 0 0
0 0 0 0 0 0
0 0 0 0 0 0
0 0 0 0 0 0
0 0 0 0 0 0
0 0 0 0 0 0
0 0 0 0 0 0
0 0 0 0 0 0
0 0 0 0 0 0 Mean Absolute Difference 0 0 0 0 0 0
0 0 0 0 0 0
0 0 0 0 0 0
0 0 0 0 0 0
0 0 0 0 0 0
0 0 0 0 0 0
0 0 0 0 0 0
0 0 0 0 0 0
0 0 0 0 0 0
0 0 0 0 0 0
0 0 0 0 0 0 Mean Absolute Difference 0 0 0 0 0 0

SWM-RM-002- Standard Operating Procedures for Continuous Temperature Monitoring of Fresh Water Rivers and Streams – V1.2 1/2/2020Page 24 of 30
C-2. Temperature Logger Calibration Check Form - Example Data Entries Provided.
Calibration Check Worksheet
Year: 2018
Green = passed calibration check
Steward: WQ IM
1st Pre-Cal Check
NIST Logger Difference Logger Difference Logger Difference Logger Difference Logger Difference Logger Difference Red = Failed calibration Check
Date / Time Ref Temp I.D. 9 I.D. 19 I.D. 20 I.D. 23 I.D. 28 I.D. 32
5/15/2018 9:10 -0.1 -0.088 0.012 -0.032 0.068 -0.088 0.012 -0.06 0.04 -0.06 0.04 -0.06 0.04
5/15/2018 9:11 -0.1 -0.088 0.012 -0.032 0.068 -0.088 0.012 -0.06 0.04 -0.088 0.012 -0.06 0.04
5/15/2018 9:12 -0.1 -0.088 0.012 -0.032 0.068 -0.088 0.012 -0.088 0.012 -0.088 0.012 -0.06 0.04
5/15/2018 9:13 -0.1 -0.088 0.012 -0.032 0.068 -0.088 0.012 -0.088 0.012 -0.088 0.012 -0.06 0.04
5/15/2018 9:14 -0.1 -0.088 0.012 -0.06 0.04 -0.088 0.012 -0.088 0.012 -0.088 0.012 -0.088 0.012
5/15/2018 9:15 -0.1 -0.088 0.012 -0.06 0.04 -0.088 0.012 -0.088 0.012 -0.088 0.012 -0.088 0.012
5/15/2018 9:16 -0.1 -0.088 0.012 -0.06 0.04 -0.088 0.012 -0.088 0.012 -0.088 0.012 -0.088 0.012
5/15/2018 9:17 -0.1 -0.088 0.012 -0.06 0.04 -0.088 0.012 -0.088 0.012 -0.088 0.012 -0.088 0.012
5/15/2018 9:18 -0.1 -0.088 0.012 -0.06 0.04 -0.088 0.012 -0.088 0.012 -0.088 0.012 -0.088 0.012
5/15/2018 9:19 -0.1 -0.088 0.012 -0.06 0.04 -0.088 0.012 -0.088 0.012 -0.088 0.012 -0.088 0.012 Mean Absolute Difference 0.012 0.0512 0.012 0.0176 0.0148 0.0232
5/15/2018 8:31 17.2 17.201 0.001 17.153 0.047 17.177 0.023 17.225 0.025 17.225 0.025 17.177 0.023
5/15/2018 8:32 17.2 17.177 0.023 17.153 0.047 17.201 0.001 17.225 0.025 17.225 0.025 17.177 0.023
5/15/2018 8:33 17.2 17.177 0.023 17.153 0.047 17.201 0.001 17.225 0.025 17.225 0.025 17.177 0.023
5/15/2018 8:34 17.2 17.177 0.023 17.153 0.047 17.201 0.001 17.225 0.025 17.225 0.025 17.177 0.023
5/15/2018 8:35 17.2 17.201 0.001 17.153 0.047 17.201 0.001 17.225 0.025 17.225 0.025 17.177 0.023
5/15/2018 8:36 17.2 17.225 0.025 17.153 0.047 17.201 0.001 17.225 0.025 17.225 0.025 17.177 0.023
5/15/2018 8:37 17.2 17.225 0.025 17.153 0.047 17.201 0.001 17.249 0.049 17.249 0.049 17.177 0.023
5/15/2018 8:38 17.2 17.225 0.025 17.153 0.047 17.201 0.001 17.249 0.049 17.249 0.049 17.177 0.023
5/15/2018 8:39 17.2 17.225 0.025 17.153 0.047 17.225 0.025 17.225 0.025 17.272 0.072 17.177 0.023
5/15/2018 8:40 17.2 17.249 0.049 17.177 0.023 17.225 0.025 17.249 0.049 17.249 0.049 17.177 0.023 Mean Absolute Difference 0.022 0.0446 0.008 0.0322 0.0369 0.023
SWM-RM-002- Standard Operating Procedures for Continuous Temperature Monitoring of Fresh Water Rivers and Streams – V1.2 1/2/2020
Page 25 of 30
Attachment D
This section contains a blank and filled out example of the Continuous Temperature Survey Form that should be used for Ambient Monitoring - continuous temperature logger deployments. The form must be printed on
waterproof paper and all completed ones need to be organized and stored in binders for archival purposes.
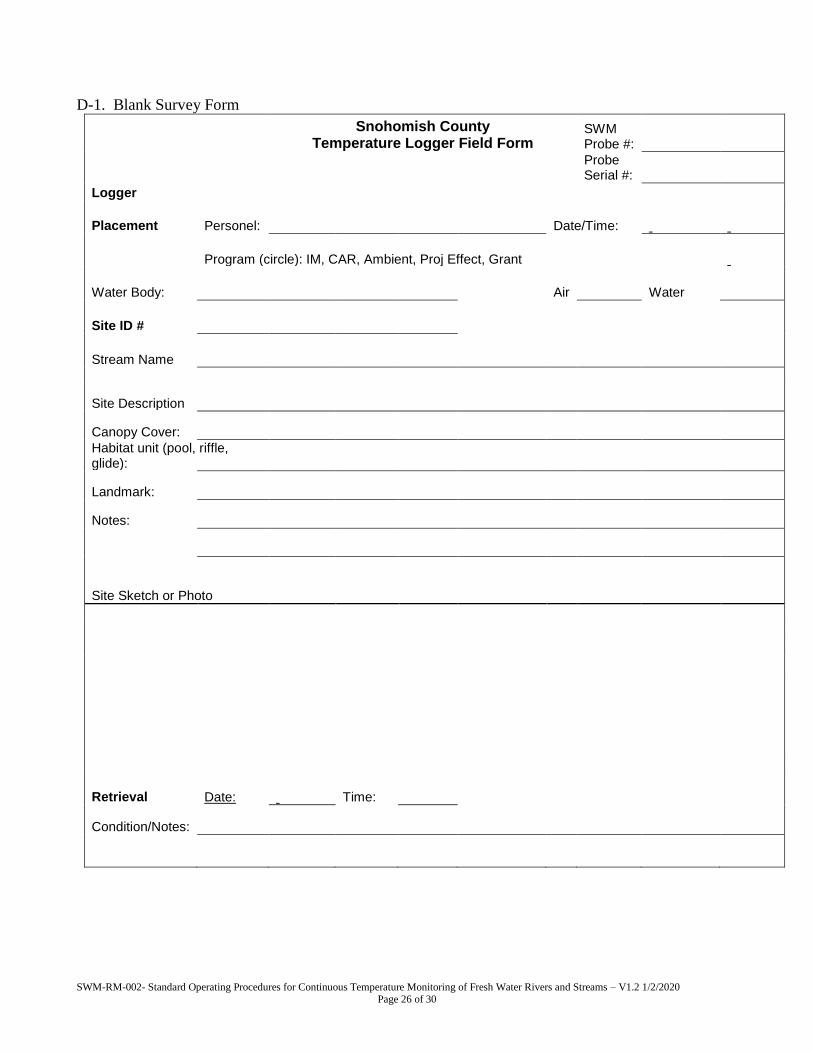
D-1. Blank Survey Form
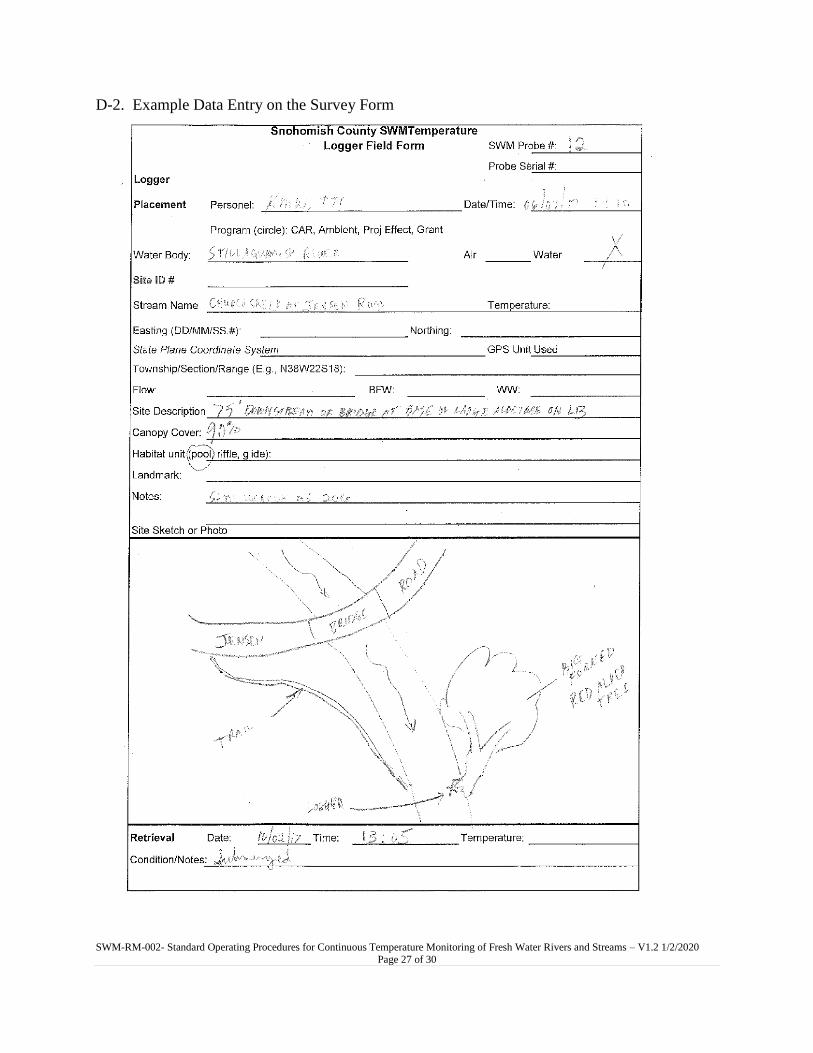
D-2. Filled-out Survey Form
SWM-RM-002- Standard Operating Procedures for Continuous Temperature Monitoring of Fresh Water Rivers and Streams – V1.2 1/2/2020 Page 26 of 30
D-1. Blank Survey Form
Snohomish County Temperature Logger Field Form
SWM Probe #:
Probe Serial #:
Logger
Placement Personel: Date/Time:
Program (circle): IM, CAR, Ambient, Proj Effect, Grant
Water Body: Air Water
Site ID #
Stream Name
Site Description
Canopy Cover:
Habitat unit (pool, riffle, glide):
Landmark:
Notes:
Site Sketch or Photo
Retrieval Date: Time:
Condition/Notes:
SWM-RM-002- Standard Operating Procedures for Continuous Temperature Monitoring of Fresh Water Rivers and Streams – V1.2 1/2/2020
Page 27 of 30
D-2. Example Data Entry on the Survey Form
SWM-RM-002- Standard Operating Procedures for Continuous Temperature Monitoring of Fresh Water Rivers and Streams – V1.2
1/2/2020Page 28 of 30
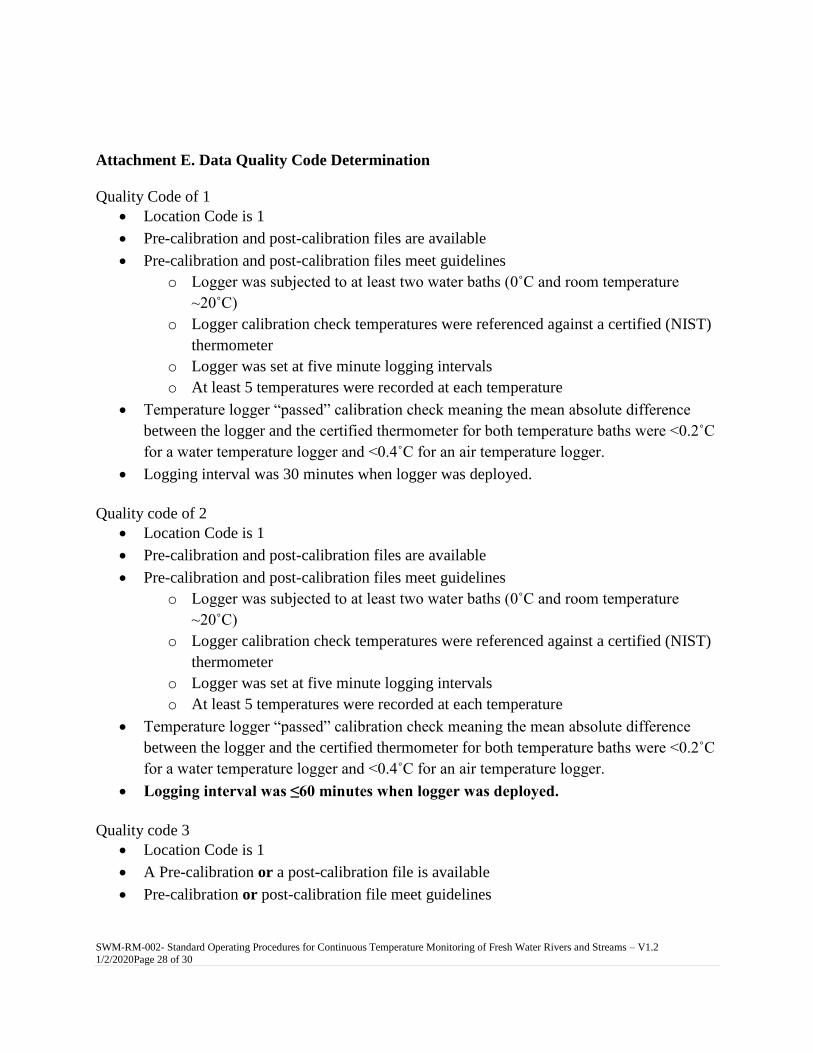
Attachment E. Data Quality Code Determination
Quality Code of 1
Location Code is 1
Pre-calibration and post-calibration files are available
Pre-calibration and post-calibration files meet guidelines
o Logger was subjected to at least two water baths (0˚C and room temperature
~20˚C)
o Logger calibration check temperatures were referenced against a certified (NIST)
thermometer
o Logger was set at five minute logging intervals
o At least 5 temperatures were recorded at each temperature
Temperature logger “passed” calibration check meaning the mean absolute difference
between the logger and the certified thermometer for both temperature baths were <0.2˚C
for a water temperature logger and <0.4˚C for an air temperature logger.
Logging interval was 30 minutes when logger was deployed.
Quality code of 2
Location Code is 1
Pre-calibration and post-calibration files are available
Pre-calibration and post-calibration files meet guidelines
o Logger was subjected to at least two water baths (0˚C and room temperature
~20˚C)
o Logger calibration check temperatures were referenced against a certified (NIST)
thermometer
o Logger was set at five minute logging intervals
o At least 5 temperatures were recorded at each temperature
Temperature logger “passed” calibration check meaning the mean absolute difference
between the logger and the certified thermometer for both temperature baths were <0.2˚C
for a water temperature logger and <0.4˚C for an air temperature logger.
Logging interval was ≤60 minutes when logger was deployed.
Quality code 3
Location Code is 1
A Pre-calibration or a post-calibration file is available
Pre-calibration or post-calibration file meet guidelines
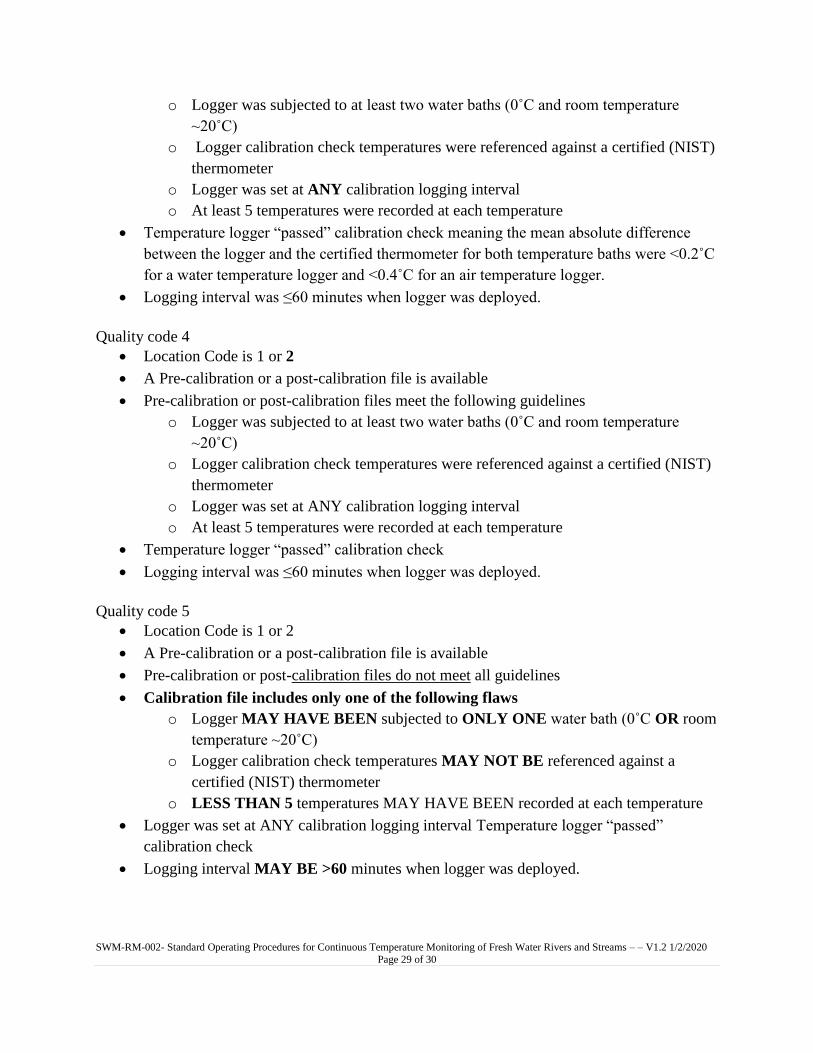
SWM-RM-002- Standard Operating Procedures for Continuous Temperature Monitoring of Fresh Water Rivers and Streams – – V1.2 1/2/2020
Page 29 of 30
o Logger was subjected to at least two water baths (0˚C and room temperature
~20˚C)
o Logger calibration check temperatures were referenced against a certified (NIST)
thermometer
o Logger was set at ANY calibration logging interval
o At least 5 temperatures were recorded at each temperature
Temperature logger “passed” calibration check meaning the mean absolute difference
between the logger and the certified thermometer for both temperature baths were <0.2˚C
for a water temperature logger and <0.4˚C for an air temperature logger.
Logging interval was ≤60 minutes when logger was deployed.
Quality code 4
Location Code is 1 or 2
A Pre-calibration or a post-calibration file is available
Pre-calibration or post-calibration files meet the following guidelines
o Logger was subjected to at least two water baths (0˚C and room temperature
~20˚C)
o Logger calibration check temperatures were referenced against a certified (NIST)
thermometer
o Logger was set at ANY calibration logging interval
o At least 5 temperatures were recorded at each temperature
Temperature logger “passed” calibration check
Logging interval was ≤60 minutes when logger was deployed.
Quality code 5
Location Code is 1 or 2
A Pre-calibration or a post-calibration file is available
Pre-calibration or post-calibration files do not meet all guidelines
Calibration file includes only one of the following flaws
o Logger MAY HAVE BEEN subjected to ONLY ONE water bath (0˚C OR room
temperature ~20˚C)
o Logger calibration check temperatures MAY NOT BE referenced against a
certified (NIST) thermometer
o LESS THAN 5 temperatures MAY HAVE BEEN recorded at each temperature
Logger was set at ANY calibration logging interval Temperature logger “passed”
calibration check
Logging interval MAY BE >60 minutes when logger was deployed.

SWM-RM-002- Standard Operating Procedures for Continuous Temperature Monitoring of Fresh Water Rivers and Streams – V1.2 1/2/2020
Quality code 6
Location Code is 1 or 2 or 3
A Pre-calibration or a post-calibration file is available
Pre-calibration or post-calibration files do not meet all guidelines
Calibration file includes ONLY ONE of the following
o Logger MAY HAVE BEEN subjected to ONLY ONE water bath (0˚C OR room
temperature ~20˚C)
Quality code 7
Location Code is 1 or 2 or 3
A Pre-calibration or a post-calibration file is available
Pre-calibration or post-calibration files do not meet all guidelines
Calibration file includes MORE THAN ONE of the following
o Logger was subjected to ONLY ONE water bath (0˚C OR room temperature ~20˚C)
o Logger calibration check temperatures MAY NOT BE referenced against a certified
(NIST) thermometer
o 5 temperatures MAY NOT HAVE BEEN recorded at each temperature
Logger was set at ANY calibration logging interval
Temperature logger “DID NOT” calibration check
Logging interval MAY BE >60 minutes when logger was deployed
Quality code 8
No calibration files
Quality code 9
No location coordinate or calibration files