SnapshotSpectral)Imaging) Technologies)for)On5Site) Inspec6on)€¦ · RL Associates) Multispectral...
20
Sandia National Laboratories is a multi-program laboratory managed and operated by Sandia Corporation, a wholly owned subsidiary of Lockheed Martin Corporation, for the U.S. Department of Energy’s National Nuclear Security Administration under contract DE-AC04-94AL85000. SAND NO. 2015-4814 C Snapshot Spectral Imaging Technologies for OnSite Inspec6on Julia Craven Jones 1 , Nathan Hagen 2 , John Henderson 3 , Michael Kudenov 4 , and Aled Rowlands 5 1. Sandia Na6onal Laboratories, Albuquerque, New Mexico, USA 2. Rebellion Photonics, Houston, Texas, USA 3. Lawrence Livermore Na6onal Laboratory, Livermore, California, USA 4. North Carolina State University, Raleigh, North Carolina, USA 5. Provisional Technical Secretariat, Comprehensive NuclearTestBanTreaty Organiza6on, Vienna Austria CTBTO Science and Technology 2015 The views expressed here do not necessarily reflect the views of the United States Government, the United States Department of Energy National Nuclear Security Administration, Sandia National Laboratories, or Lawrence Livermore National Laboratory. This presentation was funded by the US Department of State and the U.S. Department of Energy, National Nuclear Security Administration, Office of Nuclear Verification
Transcript of SnapshotSpectral)Imaging) Technologies)for)On5Site) Inspec6on)€¦ · RL Associates) Multispectral...

Sandia National Laboratories is a multi-program laboratory managed and operated by Sandia Corporation, a wholly owned subsidiary of Lockheed Martin Corporation, for the U.S. Department of Energy’s National Nuclear Security Administration under contract DE-AC04-94AL85000. SAND NO. 2015-4814 C
Snapshot Spectral Imaging Technologies for On-‐Site Inspec6on Julia Craven Jones1, Nathan Hagen2,
John Henderson3, Michael Kudenov4, and Aled Rowlands5
1. Sandia Na6onal Laboratories, Albuquerque, New Mexico, USA 2. Rebellion Photonics, Houston, Texas, USA
3. Lawrence Livermore Na6onal Laboratory, Livermore, California, USA 4. North Carolina State University, Raleigh, North Carolina, USA
5. Provisional Technical Secretariat, Comprehensive Nuclear-‐Test-‐Ban-‐Treaty Organiza6on, Vienna Austria
CTBTO Science and Technology 2015
The views expressed here do not necessarily reflect the views of the United States Government, the United States Department of Energy National Nuclear Security Administration, Sandia National Laboratories, or Lawrence Livermore National Laboratory. This presentation was funded by the US Department of State and the U.S. Department of Energy, National Nuclear Security Administration, Office of Nuclear Verification

Introduc6on to Spectral Imaging § Spectrometers characterize
electromagne6c radia6on as a func6on of wavelength. § Op6cal regime: 0.2 – 20.0 μm
§ Spectral imagers provide spectral informa6on as a func6on of spa6al coordinates. § Acquire I(x,y,λ) datacubes
§ Many scien6fic and commercial applica6ons for mul6-‐, hyper-‐, and ultra-‐spectral imagers.
§ Parameters of interest in passive remote sensing are typically spectral reflectance ρ(λ) or emi^ance ε(λ).
Figure from [7]
Figure from [1]
Image from [8]

Spectral Imaging for CTBTO OSI § [Mul6-‐]Spectral imaging is
allowed during an on-‐site inspec6on (OSI) to detect spectral features that could be used to priori6ze regions within the inspec6on area (IA) and thereby accelerate and op6mize the inspec6on process. § Infrared imaging also allowed;
MSIR = mul6spectral + infrared imaging
§ The CTBT permits MSIR data acquisi6on from the air, or at or below the surface.
§ Opera6onal constraints are imposed.
3
For on-site inspections, “…Multi-spectral imaging, including
infrared measurements, at and below the surface, and from the
air, [may be conducted] to search for anomalies or
artifacts.” (Protocol paragraph 69b)
“For any additional overflights
conducted pursuant to paragraph 73, inspectors on board the aircraft
may also use portable, easily installed equipment for (a) multi-
spectral (including infrared) imagery…” (Protocol paragraph 80)
Image from [2]

§ How is spectral imagery typically acquired?
Data Acquisi6on Approaches
4
All scanning spectral imagers scan in time to assemble the 3D cube of
information from multiple 2D projections or slices.
In Fourier transform approaches, optical
path difference (OPD) is measured
to recover λ
Figure from [1]
Point-scanning (whiskbroom) spectrometer: Recover spectrum for a point location: I(xi,yj,λ)
Line-scanning (pushbroom) spectrometer:
Recover spectra for one spatial dimension: I(x,yj,λ)
Wavelength-scanning spectrometer: Recover two spatial dimensions for an integrated wavelength range: I(x,y,λk)
Figure from [10]
Whiskbroom and pushbroom spectral imagers are often implemented for
airborne applications.
Figure from [9]

§ Familiar example: A Bayer-‐filtered camera is snapshot for 3 wavelengths (red, green, blue).
Snapshot Data Acquisi6on § Snapshot spectral imagers (SSIs) capture the I(x,y,λ) spectral
datacube during a single detector integra6on period.
5
Figure from [1]
Figure from [12]
Image from [11]
Figure from [13]

Enable Longer Dwell Time SSI for OSI
§ Previous OSI exercises have relied heavily on pushbroom imagers, which are well suited for an airborne scanning geometry – so what is the advantage of SSIs?
6
Optimize Data Acquisition & Reduce Acquisition Constraints Simplify Data Analysis
t = 1 pushbroom snapshot
SNR = Ψ SNR = Ψ SNR = 1.4Ψ SNR = 1.8Ψ SNR = 2Ψ SNR = 2.2Ψ SNR = 2.4Ψ SNR = 2.6Ψ SNR = 2.8Ψ SNR = 3Ψ SNR = 3.2Ψ Image from [14]
Image from [15] Image from [16]
Multi-configuration
Landsat image used at IFE14
Image from [5]

§ Enable fast data processing § Offer high spa6al resolu6on
§ Offer moderate spectral resolu6on § Be rugged, portable, and suitable for
field opera6on
SSI for OSI § CTBTO OSI applica6ons impose par6cular requirements on spectral
imagers. If an SSI architecture is to be well suited for CTBTO OSI, it must:
7
Key OSI Observables Relevant to MSIR Techniques [4] Technology Class ƞ M (pixels used)
IFS-‐F F 1 NxNy(Nw + s)(2s + 1)
IFS-‐L F 1 NxNy(Nw + s)(2s + 1)
IFS-‐M F 1 Nx(Ny + 2s)(Nw + 2s)
IFS-‐µ F 1 Nx(Ny + 2s)(Nw + 2s)
IMS F 1 Nx(Ny + 2s)(Nw + 2s)
IRIS A 1/2 (Nx + 2s)(Ny + 2s)Nw
MAFC P 1 (Nx + 2s)(Ny + 2s)Nw
MSBS A 1 (Nx + 2s)(Ny + 2s)Nw
MSI F 1/4 NxNy(2Nw + 1)
SHIFT P 1/4 (Nx + 2s)(Ny + 2s)Nw
SRDA F 1/Nw NxNyNw
TEI A + F 1 (Nx + 2s)(Ny + 2s)Nw CTIS A* 1/3 ~N
CASSI X* 1/2 Ny(Nx + Nw -‐ 1)
Snapshot Imager Technologies [1]
Signature Spectral Region Spectral Resolu6on Spa6al Resolu6on Temporal Behavior
Primary Observables Surface disrup6on
(spectral) VIS, NIR, SWIR
required; LWIR useful Low to Medium
10-‐30 m goal < 1 km required
Weeks if dry Hours to days if weathering
Surface fluffing (thermal -‐ reconnaissance mode) Thermal IR N/A
10-‐30 m goal < 1 km required
Data taken around maxiumum ΔT
Thermal hot spots/plumes Thermal IR N/A
0.3-‐1 m goal < 10 m required
Stable for years/ Days to weeks
Spectral anomalies All Low to Medium
0.3-‐1 m goal < 10 m required
Weeks to months
Secondary Observables
Material plumes VIS, NIR, SWIR
required; LWIR useful Low to Medium
0.3-‐1 m goal < 10 m required
Permanent un6l covered
Surface fluffing (thermal -‐ hypothesis mode) Thermal IR N/A
10-‐30 m goal < 1 km required
Data taken around maxiumum ΔT
Geology Low to High N/A
Undefined
Vegeta6on stress VNIR, SWIR Low 10-‐30 m goal
< 1 km required Low aver 7 days, senescence aver
weeks

SSI Architectures for OSI
8
Commercial SRDAs can be small - 77 x 142 x 36 mm3
Figure from [1]
Figure from [17]
Image from [18]
Compact and rugged, but require interpolation algorithms and spectral
channels are fixed.
Spatially Resolved Detector Arrays (SRDA)
Produces 4-16 spectral images, but image registration must be
implemented to accurately reconstruct.
Multispectral Beamsplitters (MSBS)
Figures from [1]

SSI Architectures for OSI
9
Figure from [1]
Compact and light efficient, but subject to parallax induced artifacts and require
image registration.
Multi-Aperture Cameras (MAC)
Offers high spatial and moderate spectral resolution, but maintaining
calibration may be challenging.
Image Mapping Spectrometer (IMS)
Image from [18]
Filters bonded to FPA Filter array in
front of lenslets
SHIFT: Fourier transform approach
Figure from [1]
Figure from [1]

SSI Technology Comparison § Comparison below is focused exclusively on the four sensor
architectures reviewed. § Signal to noise ra6o (SNR) is propor6onal to op6cal efficiency and
detector u6liza6on. § Op6cal efficiency assumes lossless op6cs.
§ Example shows achievable spa6al samples given a 4096x4096 (~16M) pixel FPA and 12 spectral channels. § Pixel margin between spectra is assumed to be 5 pixels.
10
Technology Ideal Optical
Efficiency FPA Pixels Used Detector
Utilization
Max Spatial Samples (given 12 spectral channels)
Calibration Robustnessa
Airborne Robustnessb
Commercially Available
SRDA 1/Nw NxNyNw 1.00 1182 x 1182 high high yes MSBS 0.5-1 (Nx + 2s)(Ny + 2s)Nw 1.00 1182 x 1182 med-high low-med yes MAC 0.25-1 (Nx + 2s)(Ny + 2s)Nw 0.98 1172 x 1172 med-high medium unknown IMS 1 Nx(Ny + 2s)(Nw + 2s) 0.54 868 x 868 high low yes
Pushbroom 1/Ny NxNw 1.00 4096 high high yes
Portions of table from [3]
aThe Calibration Robustness metric is assessing the relative maintainability of spatial and spectral calibration once a sensor is transitioned from the laboratory to the field. For example, a technology assessed as high means the technology will likely maintain its calibration better than a technology assessed as a medium. b The Airborne Robustness metric is assessing the relative ability to withstand and successfully collect data under airborne deployment conditions . For example, a technology assessed as low will likely be less successful during an airborne deployment than a technology assessed as medium.

Commercially Available Sensors § VNIR Spectral Imagers: Snapshot and limited pushbroom.
11
Manufacturer Instrument Architecture Spectral Range Spectral Samples
Spatial Samples
Frame Rate
Bayspec OCI-2000 SRDA 600-1000 nm 25 256x256 8 Hz
Bodkin Hyperpixel Array Camera IFS-L 500-910 nm; or
450-675 nm 90; or
20 55 x 44; or
90 x 75 25 Hz Cubert Hedgehog & Firefly SRDA (?) 450-950 nm 125 50 x 50 5-20 Hz IMEC Snapshot Tiled Imager MAFC 600-1000 nm 32 256 x 256 340 Hz
IMEC SM4x4 or SM 5x5 SRDA
470-630 nm; or 600-1000 nm
16; or 25
512 x 256; or 409 x 216 340 Hz
Opto Knowledge HyperVideo 4DIS IFS-F 400-1100 nm 300 44 x 40 30 Hz P&P Optica Hyperchannel IFS-F 450-900 nm 100 14 x 14 40-100 Hz
RL Associates Multispectral Imager MSBS - holographic 450 – 800 nm 4 - 12 ? ?
Rebellion Photonics Arrow IMS
413 - 766 nm; or 462 - 645 nm; or
417-497 nm 32 320x480 7-15 Hz
Headwall Photonics Hyperspec E Series pushbroom 400-1000 nm 923 1600 100-400
Hz
Gilden Photonics HS Spectral Cameras pushbroom 380-800 nm; or 400-1000 nm 840 1600 33 Hz
Specim AisaEAGLE pushbroom 400-970 nm 488 1024 30 Hz

Summary § Snapshot spectral imagers (SSIs) offer unique advantages over
scanning spectral imagers for remote sensing. § SSIs afford data acquisi6on under conven6onal airborne scanning
configura6ons but also enable flexible and targeted collec6ons. § Signal to noise ra6o for SSIs can be higher versus scanning spectrometers. § Data collected can be processed faster allowing more 6me to be spent on
analysis – and sooner.
§ Further technology development may enable even more elegant snapshot approaches.
§ The market for commercial SSIs is growing, many more solu6ons available today than even 2 years ago. § The future of SSIs may benefit from a number of emerging technologies,
such as three dimensional focal plane arrays
§ For more informa6on on SSI designs and development, see ref. 3.
12

Bibliography References 1. N. Hagen and M.W. Kudenov, “Review of snapshot spectral imaging technologies,” Opt. Eng. 52 (9), 2013; doi: 10.1117/1.OE.52.9.090901. 2. Comprehensive Nuclear Test Ban Treaty: h^p://www.ctbto.org/the-‐treaty/ 3. J.R. Henderson, “Primer on Use of Mul6-‐Spectral and Infrared Imaging for On-‐Site Inspec6ons,” Lawrence Livermore Na6onal Laboratory
Technical Report, LLNL-‐TR-‐463081, 2010. doi: 10.2172/1018775 4. Report on OSI Expert Mee6ng on Mul6spectral and Infrared Imaging, see CTBT/PTS/INF.1133 5. “Assessment of the Poten6al of Mul6spectral Including Infrared Imaging for an On-‐Site Inspec6on: Review of Field Tests in 2011 and 2012,”
CTBTO Technical Report TR2014-‐1, 2014. 6. D. Alleysson and S. Süsstrunk, Aliasing in Digital Cameras, SPIE EI NewsleEer, Special Issue on Smart Image AcquisiKon and Processing, Vol. 14,
Nr. 12, pp. 1,8, 2004. Image and Figure Credits 7. h^p://commons.wikimedia.org/wiki/File:EM_Spectrum_Proper6es_edit.svg 8. h^p://commons.wikimedia.org/wiki/File:Toy_balls_with_different_colors.jpg 9. Figure from: Q. Li, X. He, Y. Wang, H. Liu, D. Xu, and F. Guo, “Review of spectral imaging technology in biomedical engineering: achievements
and challenges.” J. Biomed. Opt., 18(10), 2013; doi:10.1117/1.JBO.18.10.100901. 10. Figure from: G. Shaw and H.K. Burke, “Spectral Imaging for Remote Sensing,” Lincoln Laboratory Journal 14(1), 2003 11. h^p://commons.wikimedia.org/wiki/File:Sony_DSC-‐H2_01.jpg 12. h^p://commons.wikimedia.org/wiki/File:BayerPa^ernFiltra6on.png 13. h^p://commons.wikimedia.org/wiki/File:Colorful_spring_garden_Bayer.png 14. h^p://commons.wikimedia.org/wiki/File:Rose-‐Ringed_Parakeet.jpg 15. Figure from: N. Oppelt and W.Mauser, ”Airborne Visible / Infrared Imaging Spectrometer AVIS: Design, Characteriza6on and Calibra6on”,
Sensors7(9), 1934-‐1953, 2007: h^p://www.mdpi.com/1424-‐8220/7/9/1934/htm 16. h^p://commons.wikimedia.org/wiki/File:DJI-‐Phantom2.png 17. Image from Bayspec datasheet, available upon request at: h^p://www.bayspec.com/spectroscopy/snapshot-‐hyperspectral-‐imager/ 18. Image from IMEC datasheets, available at:
h^p://www2.imec.be/be_en/research/image-‐sensors-‐and-‐vision-‐systems/hyperspectral-‐imaging.html
13

SNAPSHOT SPECTRAL IMAGING TECHNOLOGIES FOR ON-‐SITE INSPECTION Julia Craven Jones, Nathan Hagen,
John Henderson, Michael Kudenov, and Aled Rowlands
CTBTO Science and Technology 2015
14
Thank you!
This presentation was funded by the US Department of State and the U.S. Department of Energy, National Nuclear Security Administration, Office of Nuclear Verification

Addi6onal Informa6on
§ More detailed informa6on on select SSI architectures follows.
15
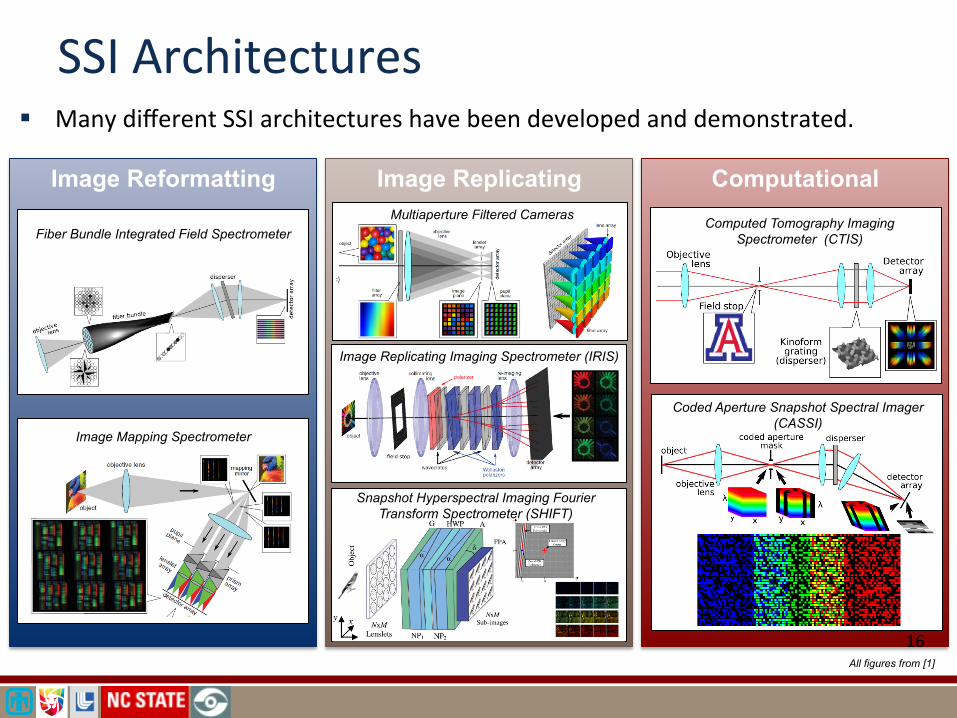
Image Reformatting
§ Many different SSI architectures have been developed and demonstrated.
Image Replicating Computational
SSI Architectures
16
Computed Tomography Imaging Spectrometer (CTIS)
Coded Aperture Snapshot Spectral Imager (CASSI)
Snapshot Hyperspectral Imaging Fourier Transform Spectrometer (SHIFT)
Image Replicating Imaging Spectrometer (IRIS)
Multiaperture Filtered Cameras Fiber Bundle Integrated Field Spectrometer
Image Mapping Spectrometer
All figures from [1]
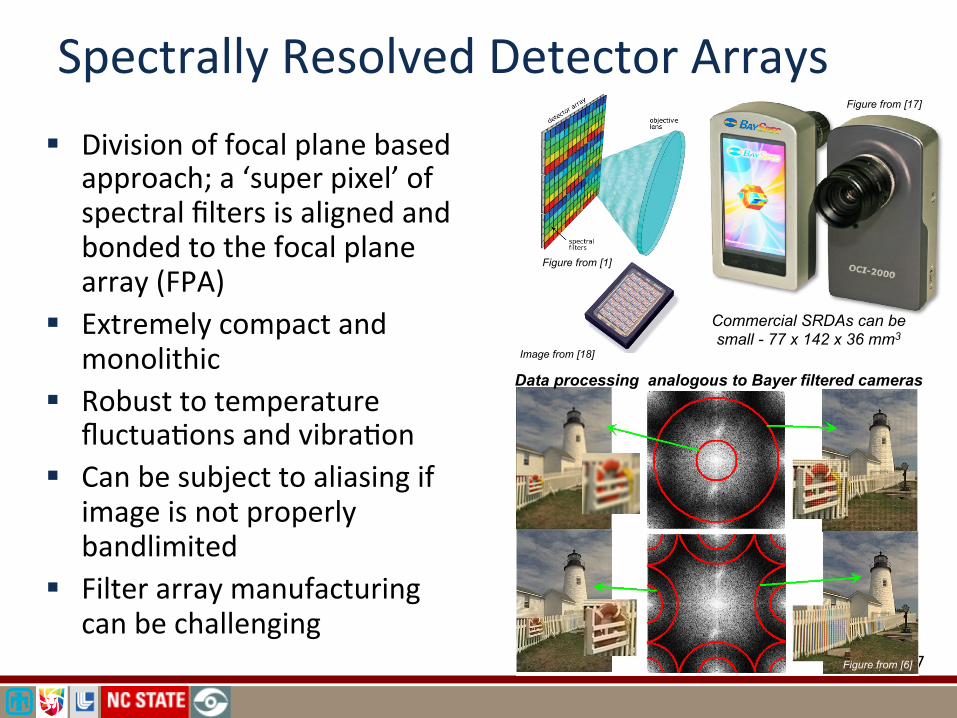
Spectrally Resolved Detector Arrays § Division of focal plane based
approach; a ‘super pixel’ of spectral filters is aligned and bonded to the focal plane array (FPA)
§ Extremely compact and monolithic
§ Robust to temperature fluctua6ons and vibra6on
§ Can be subject to aliasing if image is not properly bandlimited
§ Filter array manufacturing can be challenging
17
Data processing analogous to Bayer filtered cameras
Commercial SRDAs can be small - 77 x 142 x 36 mm3
Figure from [1]
Figure from [17]
Figure from [6]
Image from [18]

Mul6spectral Beamspli^ers § Division of amplitude based
approach. § Spectral images are produced
through implementa6on of sequen6al spectral filters. § Mul6ple FPA and single FPA
designs have been demonstrated.
§ Most implementa6ons are limited to 4-‐16 spectral images.
§ Image registra6on must be implemented to accurately reconstruct.
18
Approaches use volume holograms, spectral filters, spectral beamsplitters, or Wollaston prisms
IRIS: Image-Replicating Imaging Spectrometer
All figures from [1]

Filter array in front of lenslets Mul6-‐Aperture Cameras § Division of pupil approach: a
lenslet array is used to produce mul6ple images of the scene on a single FPA.
§ Filtered and filterless MACs have been developed. § Mul6ple filtered designs have
been proposed using filter arrays in pupil space or bonded to the detector.
§ Fourier transform designs are filterless and reconstruct uses discrete Fourier transform processing techniques (ex: SHIFT)
§ MACs require image registra6on and are subject to parallax effects, which can produce spectral ar6facts and complicate datacube reconstruc6on.
19
Figure from [1] Image from [18]
Figure from [1]
SHIFT: Snapshot Hyperspectral Imaging Fourier Transform Spectrometer
Filters bonded to FPA

Image Mapping Spectrometer
20
§ Other image reforma�ng approaches exist, but the IMS architecture is the best choice for OSI applica6ons § IMS offers high spa6al resolu6on
and moderate spectral resolu6on
§ Intermediate image is ‘sliced’ by a microfaceted mirror to produce mul6ple picket fence images, which are then dispersed.
§ Image slicing mirror can be difficult to manufacture.
§ Maintaining alignment and calibra6on through airborne opera6ons may be difficult.
Figure from [1]