Smoking and allergic respiratory disease · The prevalence of allergic respiratory diseases such as...
16
C AUSAL A NALYSIS R ESEARCH IN T OBACCO AND A LCOHOL (CARTA) Smoking and allergic respiratory disease Analysis plan April 24, 2015
Transcript of Smoking and allergic respiratory disease · The prevalence of allergic respiratory diseases such as...
CAUSAL ANALYSIS RESEARCH IN TOBACCO AND ALCOHOL (CARTA)
Smoking and allergic respiratory disease
Analysis plan
April 24, 2015

2
Writing group
Allan Linneberg, Professor, MD, PhD
Research Centre for Prevention and Health, Capital Region of Denmark, Denmark
Department of Clinical Experimental Research, Glostrup University Hospital, Glostrup, Denmark
Department of Clinical Medicine, University of Copenhagen, Denmark
Contact: [email protected]
Lise Lotte Nystrup Husemoen, cand.scient., PhD
Research Centre for Prevention and Health, Capital Region of Denmark, Denmark
Contact: [email protected]
Tea Skaaby, MD, PhD
Research Centre for Prevention and Health, Capital Region of Denmark, Denmark
Contact: [email protected]
Rikke Kart Jacobsen, cand.scient
Research Centre for Prevention and Health, Capital Region of Denmark, Denmark
Contact: [email protected]
Amy Taylor, PhD
MRC Integrative Epidemiology Unit (IEU), University of Bristol, United Kingdom
UK Centre for Tobacco and Alcohol Research Studies, University of Bristol, United Kingdom
Contact: [email protected]
3
Contents
BACKGROUND AND AIMS............................................................................................................................................ 4
ELIGIBLE STUDIES ......................................................................................................................................................... 4
Inclusion criteria ............................................................................................................................................................ 4
Exclusion criteria ........................................................................................................................................................... 5
Sample information ........................................................................................................................................................ 5
POWER CALCULATION ................................................................................................................................................. 5
OUTLINE OF ANALYSES ............................................................................................................................................... 5
Outcome measures ......................................................................................................................................................... 6
Exposure measure .......................................................................................................................................................... 6
Definitions of smoking status ........................................................................................................................................ 6
Additional considerations .............................................................................................................................................. 7
Other covariates ............................................................................................................................................................. 7
Hardy Weinberg ............................................................................................................................................................. 7
Summary statistics ......................................................................................................................................................... 7
MR analysis ................................................................................................................................................................... 7
Observational statistical analyses ................................................................................................................................... 8
The instrument ............................................................................................................................................................... 9
Output ............................................................................................................................................................................ 9
REFERENCES ................................................................................................................................................................. 10
APPENDIX ...................................................................................................................................................................... 12
4
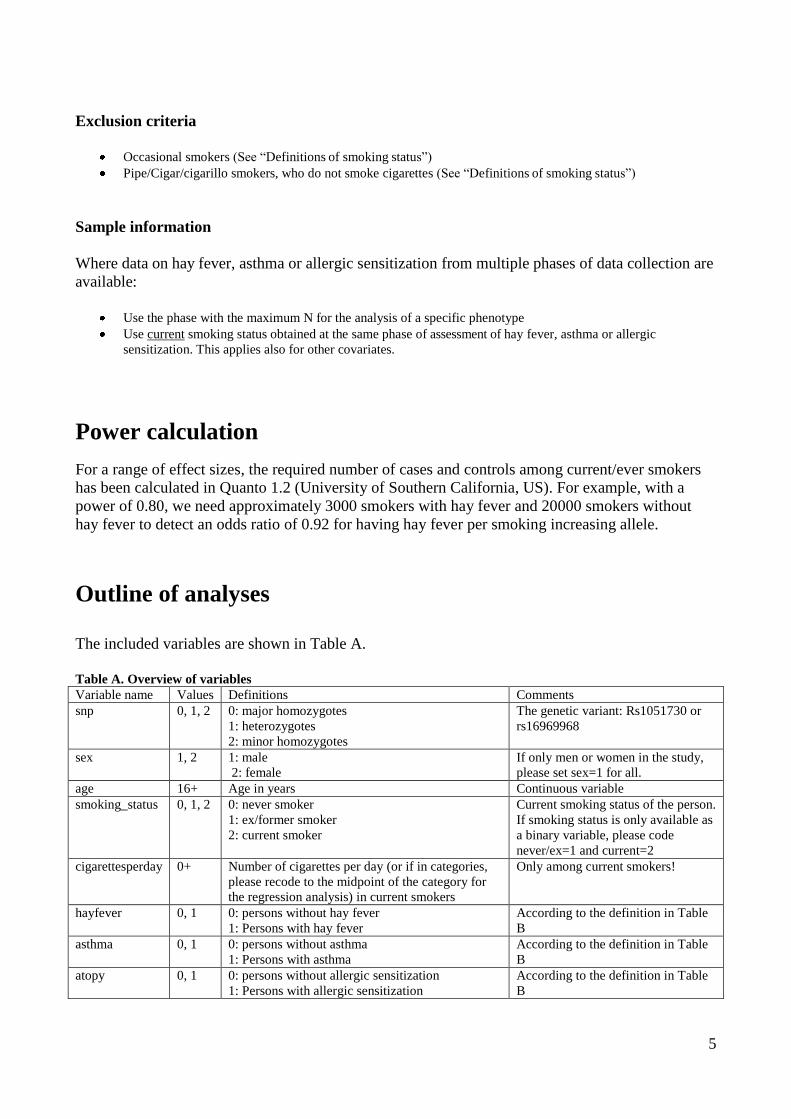
Background and aims
The prevalence of allergic respiratory diseases such as allergic rhinitis and allergic asthma has
increased over recent decades in countries living a Westernized, urbanized, and affluent lifestyle
(1;2). However, the causes of this increase are largely unknown (3). Allergic diseases are costly for
both patients and society and affect the patient’s quality of life (1). Persons who are sensitized to
inhalant allergens by a specific IgE mediated immune response or skin prick test (SPT) reactivity
are considered at risk of developing allergic respiratory disease, and both are accepted objective
biomarkers of allergic respiratory disease in clinical assessment and in epidemiological studies.
Smoking has been suggested to increase the risk of allergic symptoms by increased
inflammation in the airways, and smoking is a known risk factor for asthma, but it is still
unresolved whether smoking confers an increased or a decreased risk of allergy (1). Some studies
have found a negative association between smoking and allergic sensitization (17;20;21), whereas
other studies have not (22). Of interest, a recent meta-analysis of observational studies found no
associations between active smoking and allergic rhinitis (1).
We will perform a meta-analysis of population-based studies in adults (>=16y at
outcome and smoking measurement) with data on the rs1051730/rs16969968 genotype, smoking
status, and hay fever, asthma or allergic sensitization. The aims are to examine the effects of the
smoking increasing allele of the rs1051730/rs16969968 SNP on hay fever, asthma and allergic
sensitization. The effects will be examined for never, former, current, and ever smokers separately.
It is expected that the effects will be seen only among current and ever smokers.
Eligible studies
A study needs to have data on at least one of the following three phenotypes: hay fever, asthma or
allergic sensitization. The following studies have data on hay fever, asthma or allergic sensitization
according to the data sheets/information received so far:
1) 1958 BC
2) MONICA10
3) Inter99
4) Health2006
5) Health2008
6) Goya Males
7) ALSPAC Mothers
8) FINRISK
9) HUNT2
Inclusion criteria
Studies must have data on at least one of the three allergic respiratory disease phenotypes (hay fever, asthma or
allergic sensitization), SNP genotype, and smoking status
Studies must have at least 200 smokers with genotype and phenotype data to be included in the analyses
Individuals must be of European ethnic origin (self-report, genetic or registry-based)
Individuals must be ≥16 years (at collection of data on hay fever, asthma and allergic sensitization and
smoking)
5
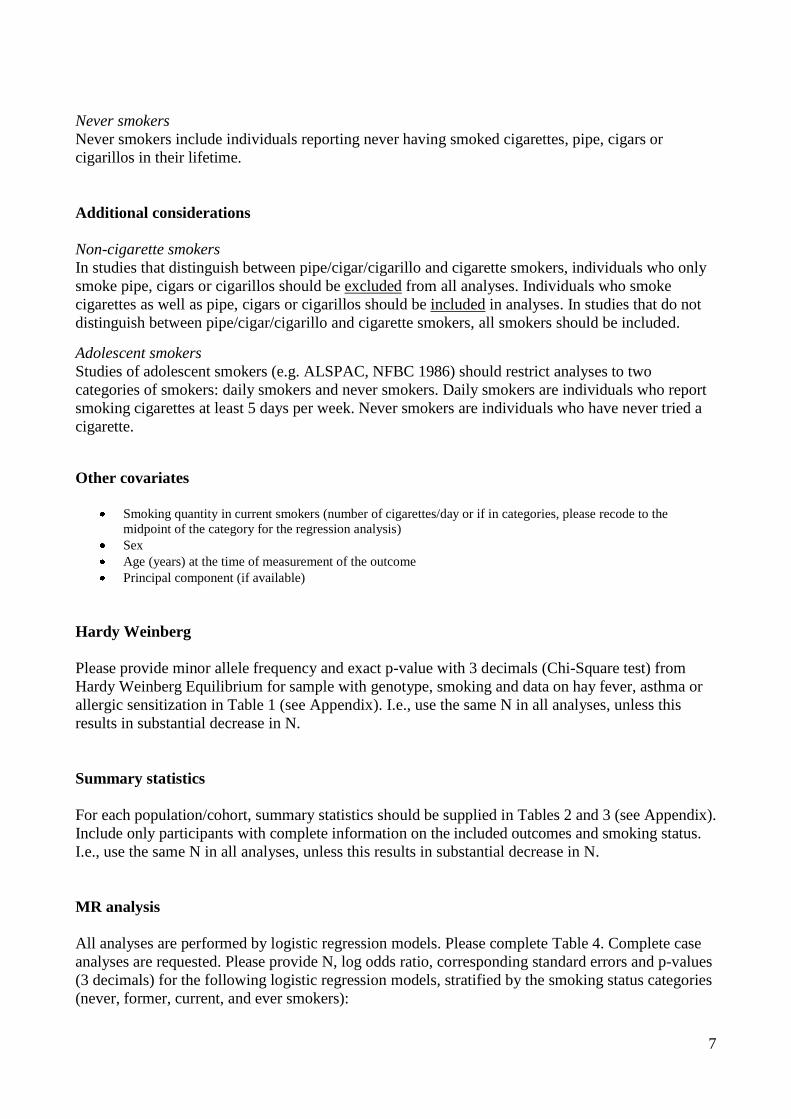
Exclusion criteria
Occasional smokers (See “Definitions of smoking status”)
Pipe/Cigar/cigarillo smokers, who do not smoke cigarettes (See “Definitions of smoking status”)
Sample information
Where data on hay fever, asthma or allergic sensitization from multiple phases of data collection are
available:
Use the phase with the maximum N for the analysis of a specific phenotype
Use current smoking status obtained at the same phase of assessment of hay fever, asthma or allergic
sensitization. This applies also for other covariates.
Power calculation
For a range of effect sizes, the required number of cases and controls among current/ever smokers
has been calculated in Quanto 1.2 (University of Southern California, US). For example, with a
power of 0.80, we need approximately 3000 smokers with hay fever and 20000 smokers without
hay fever to detect an odds ratio of 0.92 for having hay fever per smoking increasing allele.
Outline of analyses
The included variables are shown in Table A.
Table A. Overview of variables
Variable name Values Definitions Comments
snp 0, 1, 2 0: major homozygotes
1: heterozygotes
2: minor homozygotes
The genetic variant: Rs1051730 or
rs16969968
sex 1, 2 1: male
2: female
If only men or women in the study,
please set sex=1 for all.
age 16+ Age in years Continuous variable
smoking_status 0, 1, 2 0: never smoker
1: ex/former smoker
2: current smoker
Current smoking status of the person.
If smoking status is only available as
a binary variable, please code
never/ex=1 and current=2
cigarettesperday 0+ Number of cigarettes per day (or if in categories,
please recode to the midpoint of the category for
the regression analysis) in current smokers
Only among current smokers!
hayfever 0, 1 0: persons without hay fever
1: Persons with hay fever
According to the definition in Table
B
asthma 0, 1 0: persons without asthma
1: Persons with asthma
According to the definition in Table
B
atopy 0, 1 0: persons without allergic sensitization
1: Persons with allergic sensitization
According to the definition in Table
B

6
Outcome measures
Analyses will be run for the following binary outcomes (see definitions in Table B):
a) Hay fever
b) Asthma
c) Allergic sensitization
Table B. Case definitions for hay fever, asthma and allergic sensitization
Hay fever Asthma Allergic sensitization
Self-reported or doctor-diagnosed
hay fever
OR
Self-reported or doctor-diagnosed
allergic rhinitis or rhinitis in the
absence of infection
OR
Self-reported or doctor-diagnosed
nasal allergy
Self-reported or doctor-diagnosed
asthma or allergic asthma
Serum specific IgE positivity
against inhalant allergens
OR
Skin prick test positivity against
inhalant allergens
Exposure measure
Analyses will use one of two SNPs, rs1051730/rs16969968 (use the SNP with the largest N if both
available), located within the 15q25 nicotinic acetylcholine receptor gene cluster (CHRNA5-
CHRNA3-CHRNB4). The SNP should be coded additively, i.e. 0, 1, 2 minor alleles/T-alleles (A-
alleles if opposite strand) for the rs1051730 SNP according to the number of risk (smoking
increasing) alleles and run as a continuous covariate in the regression analyses.
Definitions of smoking status
Smoking status should be defined within each participating study. A uniform definition cannot be
applied across all studies due to the different information collected in each study. However, the
following guidelines should be used. Current smokers
Current smokers include individuals reporting cigarette smoking at the time of data collection on
hay fever, asthma or allergic sensitization. If information on smoking frequency is available, please
restrict this sample to daily smokers or near daily smokers (smoking 5/6 days a week). Smokers
who report smoking less frequently than this should be excluded from analyses.
Former smokers
Former smokers include individuals reporting ever having smoked cigarettes that no longer smoke
at the time of data collection. If information on past smoking frequency is available, please restrict
this sample to daily smokers or near daily smokers (smoking 5/6 days a week). Smokers who report
smoking less frequently than this should be excluded from analyses.
Ever smokers
Ever smokers include current and former smokers.
7
Never smokers
Never smokers include individuals reporting never having smoked cigarettes, pipe, cigars or
cigarillos in their lifetime.
Additional considerations
Non-cigarette smokers
In studies that distinguish between pipe/cigar/cigarillo and cigarette smokers, individuals who only
smoke pipe, cigars or cigarillos should be excluded from all analyses. Individuals who smoke
cigarettes as well as pipe, cigars or cigarillos should be included in analyses. In studies that do not
distinguish between pipe/cigar/cigarillo and cigarette smokers, all smokers should be included.
Adolescent smokers
Studies of adolescent smokers (e.g. ALSPAC, NFBC 1986) should restrict analyses to two
categories of smokers: daily smokers and never smokers. Daily smokers are individuals who report
smoking cigarettes at least 5 days per week. Never smokers are individuals who have never tried a
cigarette.
Other covariates
Smoking quantity in current smokers (number of cigarettes/day or if in categories, please recode to the
midpoint of the category for the regression analysis)
Sex
Age (years) at the time of measurement of the outcome
Principal component (if available)
Hardy Weinberg
Please provide minor allele frequency and exact p-value with 3 decimals (Chi-Square test) from
Hardy Weinberg Equilibrium for sample with genotype, smoking and data on hay fever, asthma or
allergic sensitization in Table 1 (see Appendix). I.e., use the same N in all analyses, unless this
results in substantial decrease in N.
Summary statistics
For each population/cohort, summary statistics should be supplied in Tables 2 and 3 (see Appendix).
Include only participants with complete information on the included outcomes and smoking status.
I.e., use the same N in all analyses, unless this results in substantial decrease in N.
MR analysis
All analyses are performed by logistic regression models. Please complete Table 4. Complete case
analyses are requested. Please provide N, log odds ratio, corresponding standard errors and p-values
(3 decimals) for the following logistic regression models, stratified by the smoking status categories
(never, former, current, and ever smokers):

8
Logistic regression models performed only in never smokers
1. Hay fever = SNP
2. Hay fever = SNP + sex + age (continuous)
3. Asthma = SNP
4. Asthma = SNP + sex + age (continuous)
5. Allergic sensitization = SNP
6. Allergic sensitization = SNP + sex + age (continuous) Logistic regression models performed only in former smokers
7. Hay fever = SNP
8. Hay fever = SNP + sex + age (continuous)
9. Asthma = SNP
10. Asthma = SNP + sex + age (continuous)
11. Allergic sensitization = SNP
12. Allergic sensitization = SNP + sex + age (continuous)
Logistic regression models performed only in current smokers
13. Hay fever = SNP
14. Hay fever = SNP + sex + age (continuous)
15. Asthma = SNP
16. Asthma = SNP + sex + age (continuous)
17. Allergic sensitization = SNP
18. Allergic sensitization = SNP + sex + age (continuous)
Logistic regression models performed only in ever smokers (combined former and current smokers)
19. Hay fever = SNP
20. Hay fever = SNP + sex + age (continuous)
21. Asthma = SNP
22. Asthma = SNP + sex + age (continuous)
23. Allergic sensitization = SNP
24. Allergic sensitization = SNP + sex + age (continuous)
If principal components data are available in your study, and you are able to do so, please provide
MR analyses adjusted for principal components.
Observational statistical analyses Observational effects of smoking status (please complete Table 5)
‘Never smokers’ are used as reference category in all analyses. The other two categories are current
and former smokers (see Table 5).
9
The following logistic regression analyses are performed:
25. Hay fever = smoking_status
26. Hay fever = smoking_status + sex + age (continuous)
27. Asthma = smoking_status
28. Asthma = smoking_status + sex + age (continuous)
29. Allergic sensitization = smoking_status
30. Allergic sensitization = smoking_status + sex + age (continuous)
Observational effects of smoking heaviness (please complete Table 6)
The following logistic regression analyses are performed only in current smokers:
31. Hay fever = Cigarettes/day
32. Hay fever = Cigarettes/day + sex + age (continuous)
33. Asthma = Cigarettes/day
34. Asthma = Cigarettes/day + sex + age (continuous)
35. Allergic sensitization = Cigarettes/day
36. Allergic sensitization = Cigarettes/day + sex + age (continuous)
The instrument
To validate the association between the SNP and smoking quantity, the following linear regression
analyses are performed in current smokers (Table 7):
37. Smoking quantity (cigarettes/day) = SNP
38. Smoking quantity (cigarettes/day) = SNP + sex + age (continuous)
Output
Please fill in Table 1-8 in Appendix. If you use the provided STATA-script, you only need to fill
in Table 8 by hand, since STATA will create the results from Table 1-7: Create a dataset with the
variables described in Table A and use the provided STATA-script (.do-file) to generate the results
in Tables 1-7 in Appendix. Please then return Table 8, the .log-file and the .dta-files that are
generated by the STATA-script.
10
References
(1) Saulyte J, Regueira C, Montes-Martinez A, Khudyakov P, Takkouche B. Active or passive
exposure to tobacco smoking and allergic rhinitis, allergic dermatitis, and food allergy in
adults and children: a systematic review and meta-analysis. PLoS Med 2014
Mar;11(3):e1001611.
(2) Ring J, Kramer U, Schafer T, Behrendt H. Why are allergies increasing? Curr Opin
Immunol 2001 Dec;13(6):701-8.
(3) van GR, van der Ent CK, Rovers MM, Kimpen JL, van Essen-Zandvliet LE, de MG.
Excessive body weight is associated with additional loss of quality of life in children with
asthma. J Allergy Clin Immunol 2007 Mar;119(3):591-6.
(4) Visness CM, London SJ, Daniels JL, Kaufman JS, Yeatts KB, Siega-Riz AM, et al.
Association of childhood obesity with atopic and nonatopic asthma: results from the
National Health and Nutrition Examination Survey 1999-2006. J Asthma 2010
Sep;47(7):822-9.
(5) Guh DP, Zhang W, Bansback N, Amarsi Z, Birmingham CL, Anis AH. The incidence of co-
morbidities related to obesity and overweight: a systematic review and meta-analysis. BMC
Public Health 2009;9:88.
(6) Flaherman V, Rutherford GW. A meta-analysis of the effect of high weight on asthma. Arch
Dis Child 2006 Apr;91(4):334-9.
(7) Boulet LP. Obesity and atopy. Clin Exp Allergy 2014 Oct 16.
(8) Chen Y, Rennie D, Cormier Y, Dosman J. Atopy, obesity, and asthma in adults: the
Humboldt study. J Agromedicine 2009;14(2):222-7.
(9) Chen Y, Rennie D, Cormier Y, Dosman J. Association between obesity and atopy in adults.
Int Arch Allergy Immunol 2010;153(4):372-7.
(10) Hersoug LG, Linneberg A. The link between the epidemics of obesity and allergic diseases:
does obesity induce decreased immune tolerance? Allergy 2007 Oct;62(10):1205-13.
(11) Yeh YF, Huang SL. Enhancing effect of dietary cholesterol and inhibitory effect of
pravastatin on allergic pulmonary inflammation. J Biomed Sci 2004 Sep;11(5):599-606.
(12) Schafer T, Ruhdorfer S, Weigl L, Wessner D, Heinrich J, Doring A, et al. Intake of
unsaturated fatty acids and HDL cholesterol levels are associated with manifestations of
atopy in adults. Clin Exp Allergy 2003 Oct;33(10):1360-7.
(13) Fessler MB, Jaramillo R, Crockett PW, Zeldin DC. Relationship of serum cholesterol levels
to atopy in the US population. Allergy 2010 Jul;65(7):859-64.
(14) Assing K, Bodtger U, Linneberg A, Malling HJ, Poulsen LK. Association between alcohol
consumption and skin prick test reactivity to aeroallergens. Ann Allergy Asthma Immunol
2007 Jan;98(1):70-4.
11
(15) Gonzalez-Quintela A, Gude F, Boquete O, Rey J, Meijide LM, Suarez F, et al. Association
of alcohol consumption with total serum immunoglobulin E levels and allergic sensitization
in an adult population-based survey. Clin Exp Allergy 2003 Feb;33(2):199-205.
(16) Gonzalez-Quintela A, Vidal C, Gude F. Alcohol, IgE and allergy. Addict Biol 2004
Sep;9(3-4):195-204.
(17) Linneberg A, Nielsen NH, Madsen F, Frolund L, Dirksen A, Jorgensen T. Factors related to
allergic sensitization to aeroallergens in a cross-sectional study in adults: The Copenhagen
Allergy Study. Clin Exp Allergy 2001 Sep;31(9):1409-17.
(18) Linneberg A, Petersen J, Nielsen NH, Madsen F, Frolund L, Dirksen A, et al. The
relationship of alcohol consumption to total immunoglobulin E and the development of
immunoglobulin E sensitization: the Copenhagen Allergy Study. Clin Exp Allergy 2003
Feb;33(2):192-8.
(19) Vidal C, Armisen M, Dominguez-Santalla MJ, Gude F, Lojo S, Gonzalez-Quintela A.
Influence of alcohol consumption on serum immunoglobulin E levels in atopic and
nonatopic adults. Alcohol Clin Exp Res 2002 Jan;26(1):59-64.
(20) Linneberg A, Nielsen NH, Madsen F, Frolund L, Dirksen A, Jorgensen T. Smoking and the
development of allergic sensitization to aeroallergens in adults: a prospective population-
based study. The Copenhagen Allergy Study. Allergy 2001 Apr;56(4):328-32.
(21) Wuthrich B, Schindler C, Medici TC, Zellweger JP, Leuenberger P. IgE levels, atopy
markers and hay fever in relation to age, sex and smoking status in a normal adult Swiss
population. SAPALDIA (Swiss Study on Air Pollution and Lung Diseases in Adults) Team.
Int Arch Allergy Immunol 1996 Dec;111(4):396-402.
(22) Gergen PJ, Turkeltaub PC. The association of allergen skin test reactivity and respiratory
disease among whites in the US population. Data from the Second National Health and
Nutrition Examination Survey, 1976 to 1980. Arch Intern Med 1991 Mar;151(3):487-92.
12
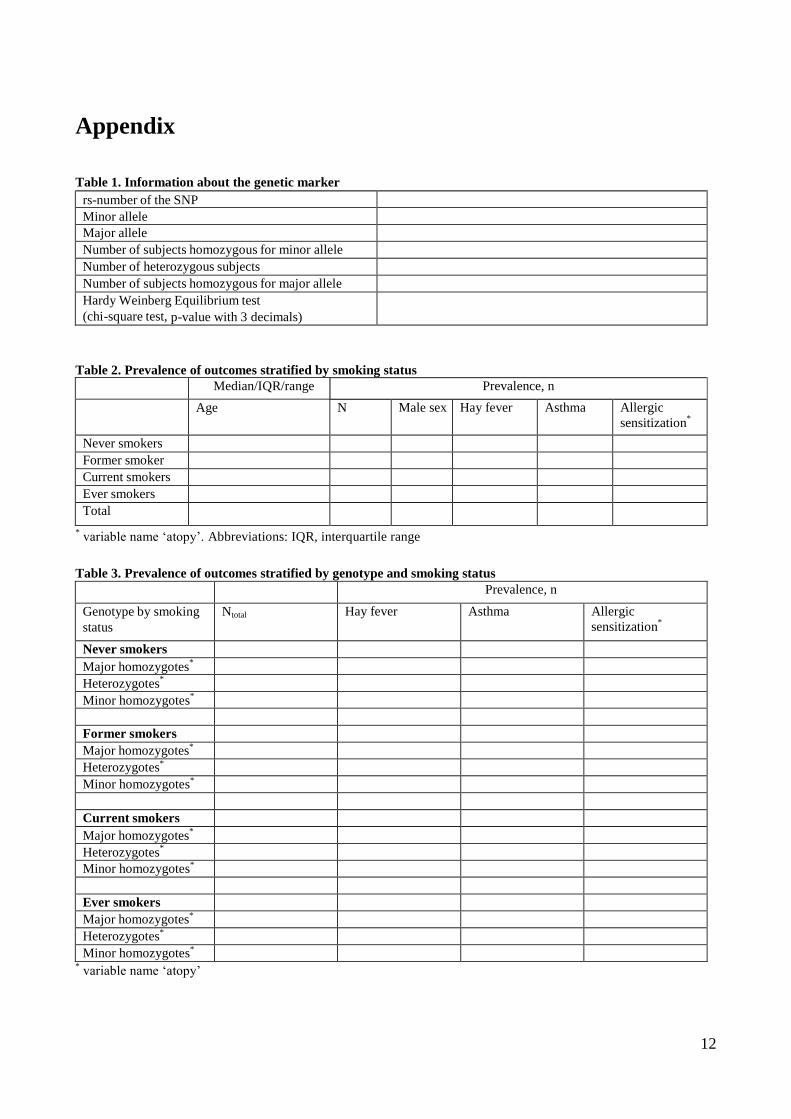
Appendix
Table 1. Information about the genetic marker
rs-number of the SNP
Minor allele
Major allele
Number of subjects homozygous for minor allele
Number of heterozygous subjects
Number of subjects homozygous for major allele
Hardy Weinberg Equilibrium test
(chi-square test, p-value with 3 decimals)
Table 2. Prevalence of outcomes stratified by smoking status
Median/IQR/range Prevalence, n
Age N Male sex Hay fever
Asthma
Allergic
sensitization*
Never smokers
Former smoker
Current smokers
Ever smokers
Total
* variable name ‘atopy’. Abbreviations: IQR, interquartile range
Table 3. Prevalence of outcomes stratified by genotype and smoking status
Prevalence, n
Genotype by smoking
status
Ntotal
Hay fever
Asthma
Allergic
sensitization*
Never smokers
Major homozygotes*
Heterozygotes*
Minor homozygotes*
Former smokers
Major homozygotes*
Heterozygotes*
Minor homozygotes*
Current smokers
Major homozygotes*
Heterozygotes*
Minor homozygotes*
Ever smokers
Major homozygotes*
Heterozygotes*
Minor homozygotes*
* variable name ‘atopy’
13
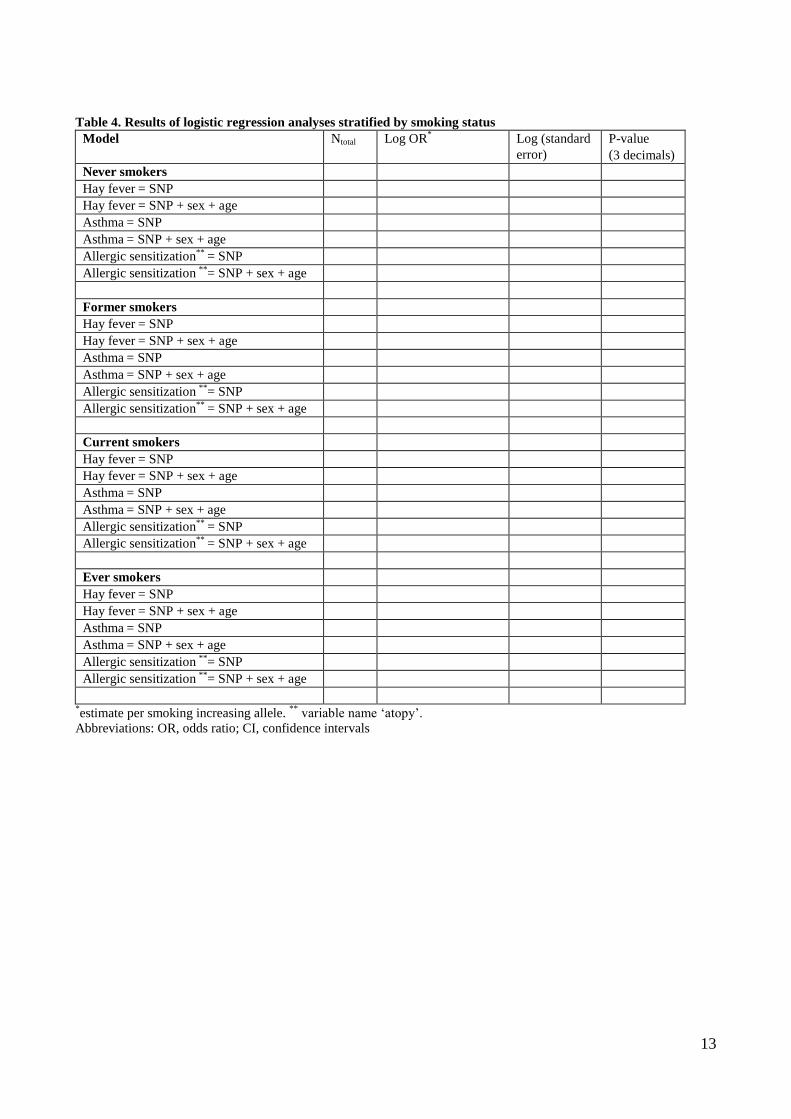
Table 4. Results of logistic regression analyses stratified by smoking status
Model Ntotal Log OR*
Log (standard
error)
P-value
(3 decimals)
Never smokers
Hay fever = SNP
Hay fever = SNP + sex + age
Asthma = SNP
Asthma = SNP + sex + age
Allergic sensitization** = SNP
Allergic sensitization **= SNP + sex + age
Former smokers
Hay fever = SNP
Hay fever = SNP + sex + age
Asthma = SNP
Asthma = SNP + sex + age
Allergic sensitization **= SNP
Allergic sensitization** = SNP + sex + age
Current smokers
Hay fever = SNP
Hay fever = SNP + sex + age
Asthma = SNP
Asthma = SNP + sex + age
Allergic sensitization** = SNP
Allergic sensitization** = SNP + sex + age
Ever smokers
Hay fever = SNP
Hay fever = SNP + sex + age
Asthma = SNP
Asthma = SNP + sex + age
Allergic sensitization **= SNP
Allergic sensitization **= SNP + sex + age
*estimate per smoking increasing allele.
** variable name ‘atopy’.
Abbreviations: OR, odds ratio; CI, confidence intervals
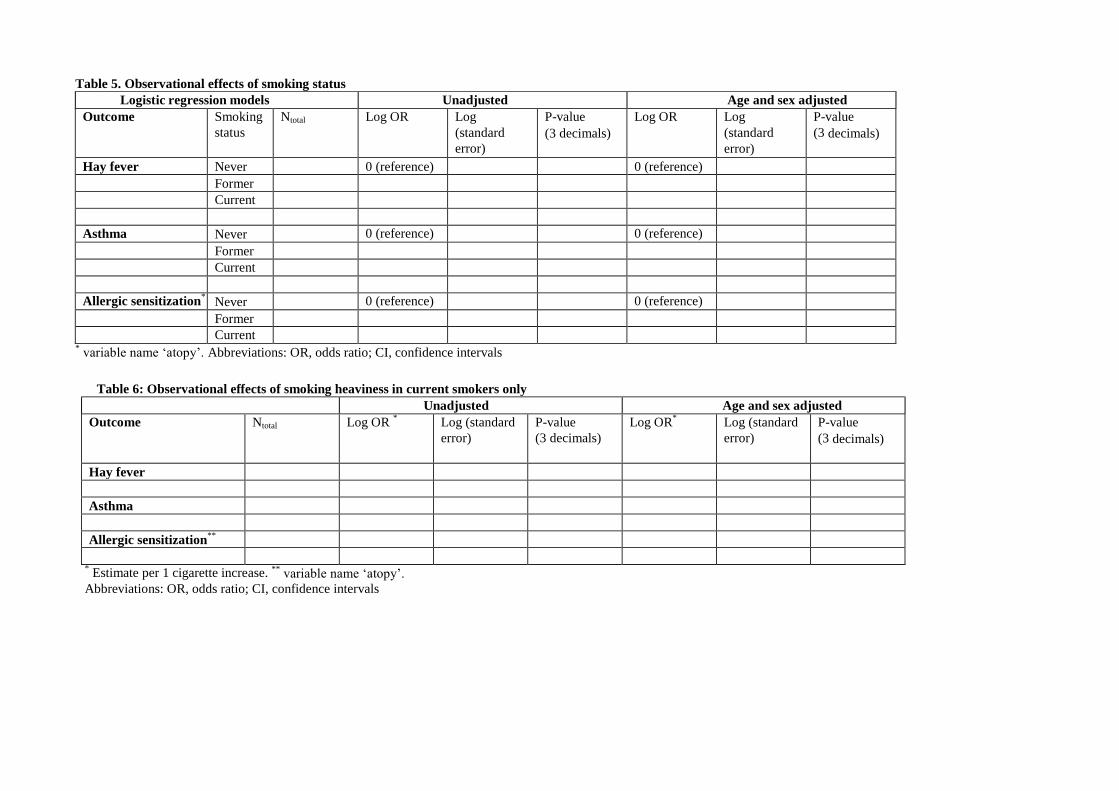
Table 5. Observational effects of smoking status
Logistic regression models Unadjusted Age and sex adjusted
Outcome Smoking
status
Ntotal Log OR Log
(standard
error)
P-value
(3 decimals)
Log OR Log
(standard
error)
P-value
(3 decimals)
Hay fever Never 0 (reference) 0 (reference)
Former
Current
Asthma Never 0 (reference) 0 (reference)
Former
Current
Allergic sensitization* Never 0 (reference) 0 (reference)
Former
Current * variable name ‘atopy’. Abbreviations: OR, odds ratio; CI, confidence intervals
Table 6: Observational effects of smoking heaviness in current smokers only
Unadjusted Age and sex adjusted
Outcome Ntotal Log OR * Log (standard
error)
P-value
(3 decimals)
Log OR* Log (standard
error)
P-value
(3 decimals)
Hay fever
Asthma
Allergic sensitization**
* Estimate per 1 cigarette increase. **
variable name ‘atopy’.
Abbreviations: OR, odds ratio; CI, confidence intervals

Table 7. Linear regression analyses of the association between the genotype and smoking quantity in current
smokers
Model N**
ß-estimate per
allele*
Standard
error
P-value
(3 decimals)
Current smokers
Smoking quantity = SNP
Smoking quantity = SNP + sex + age *i.e. estimate per smoking increasing allele.
** Please notice that only current smokers are included in this table.
16
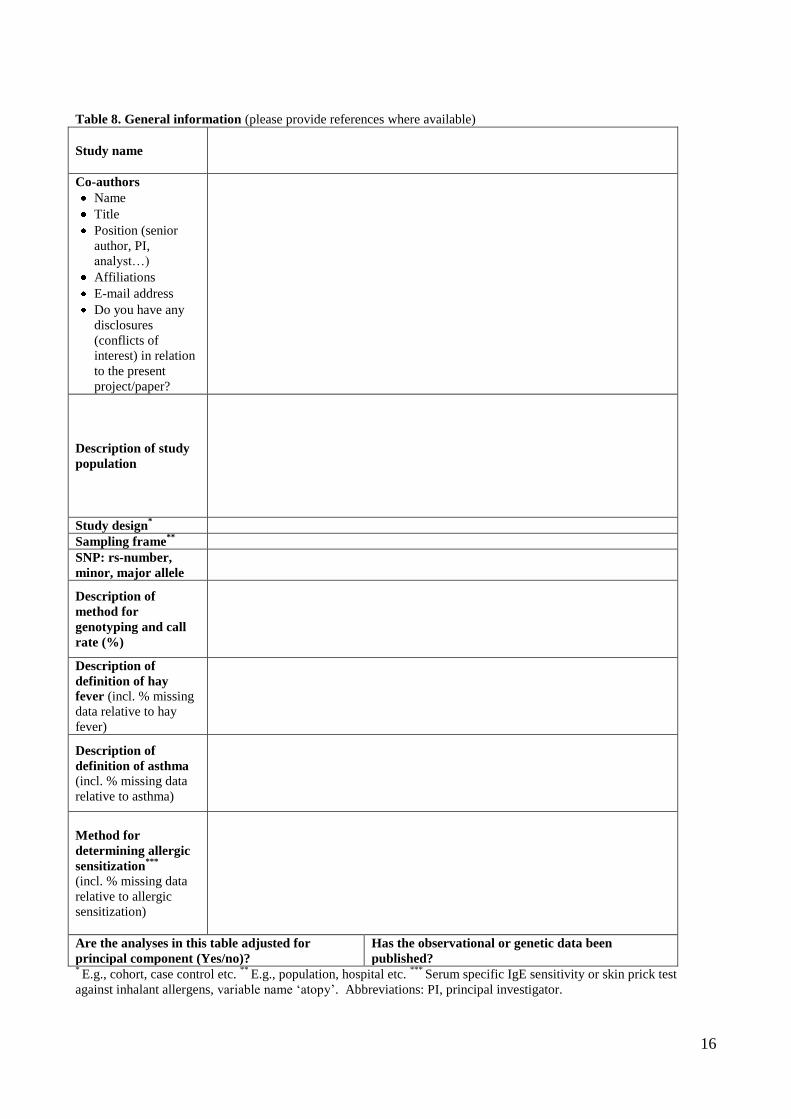
Table 8. General information (please provide references where available)
Study name
Co-authors
Name
Title
Position (senior
author, PI,
analyst…)
Affiliations
E-mail address
Do you have any
disclosures
(conflicts of
interest) in relation
to the present
project/paper?
Description of study
population
Study design*
Sampling frame**
SNP: rs-number,
minor, major allele
Description of
method for
genotyping and call
rate (%)
Description of
definition of hay
fever (incl. % missing
data relative to hay
fever)
Description of
definition of asthma (incl. % missing data
relative to asthma)
Method for
determining allergic
sensitization***
(incl. % missing data
relative to allergic
sensitization)
Are the analyses in this table adjusted for
principal component (Yes/no)?
Has the observational or genetic data been
published? * E.g., cohort, case control etc.
** E.g., population, hospital etc.
*** Serum specific IgE sensitivity or skin prick test
against inhalant allergens, variable name ‘atopy’. Abbreviations: PI, principal investigator.