SME Developments and Outlook S · SME ANNUAL REPORT 2016/17 MEs in Malaysia continued to expand at...
21
SME ANNUAL REPORT 2016/17 MEs in Malaysia continued to expand at a faster pace than the overall economy, despite the challenging environment faced by them in 2016. SMEs recorded a real Gross Domestic Product (GDP) growth of 5.2% during the year, resulting in an increase in the SME contribution to 36.6% of the country’s GDP. The SME GDP growth was reflected across all major economic sectors, mainly supported by strong tourism activity and domestic demand, led by both consumption and investment activities. In 2017, given the strong growth performance of the Malaysian economy in the first half of 2017 at 5.7%, the economy is expected to expand by more than 4.8% in 2017, higher than the earlier official growth projection of between 4.3 - 4.8%. Similarly, SME GDP growth is also expected to record a much higher growth than the earlier growth projection of between 5.5 - 6.0%. Given that the SMEs’ performance is closely linked with domestic demand and tourism activity, the anticipated pick-up in private consumption activities and increase in tourism-related activities are expected to feature more robust growth performance of SMEs in 2017. SME Developments and Outlook S
Transcript of SME Developments and Outlook S · SME ANNUAL REPORT 2016/17 MEs in Malaysia continued to expand at...

SME ANNUAL REPORT 2016/17
MEs in Malaysia continued to expand at a faster pace than the overall economy, despite the challenging environment faced by them in 2016. SMEs recorded a real Gross Domestic Product (GDP) growth of 5.2% during the year, resulting in an increase in the SME contribution to 36.6% of the country’s GDP. The SME GDP growth was reflected across
all major economic sectors, mainly supported by strong tourism activity and domestic demand, led by both consumption and investment activities.
In 2017, given the strong growth performance of the Malaysian economy in the first half of 2017 at 5.7%, the economy is expected to expand by more than 4.8% in 2017, higher than the earlier official growth projection of between 4.3 - 4.8%. Similarly, SME GDP growth is also expected to record a much higher growth than the earlier growth projection of between 5.5 - 6.0%.
Given that the SMEs’ performance is closely linked with domestic demand and tourism activity, the anticipated pick-up in private consumption activities and increase in tourism-related activities are expected to feature more robust growth performance of SMEs in 2017.
SME Developments and Outlook
S
CHAPTER 1 THE MALAYSIAN ECONOMY
SMEs are key players in national economies, contributing to economic growth around the globe. The Asia-Pacific Economic Cooperation (APEC) reported that 97.0% of establishments and over 50.0% of employment in the workforce comprise of SMEs in its economies. Meanwhile, according to a report by the Organisation for Economic Co-operation and Development (OECD) titled ‘Enhancing the Contributions of SMEs in a Global and Digitalised Economy’, SMEs assume a key role in national economies around the world, generating employment, value added and contributing to innovation. Additionally, better access to global markets and knowledge networks can strengthen SMEs’ contributions. As governments across the economies pursue inclusive growth, SMEs must be an integral part of the solution by adopting to latest Megatrends in the technological development and innovation. In addition, SMEs’ participation in the global value chains (GVCs) can provide the opportunity to the public and private sectors in achieving economies of scale, expanding market share and increasing productivity.
The year 2017 is the first year APEC’s Small and Medium Enterprises Working Group (SMEWG) implements the SMEWG Strategic Plan for 2017 - 2020. The plan is a roadmap to address critical issues pertaining to the growth of microenterprises and SMEs (MSMEs) in the APEC region which is entrepreneurship, innovation and the internet & digital economy; financing for business expansion and capability development; inclusive business ecosystem that supports SME growth; and market access for SMEs. Taking into account the current theme ‘Creating New Dynamism, Fostering a Shared Future’, APEC 2017 highlights that one of its key priorities is to strengthen MSMEs’ competitiveness and innovation in the digital age. The objective is to continue its focus on facilitating the greater participation of SMEs in the global value chain, facilitating their business environment in the digital age; and promoting start-ups and innovative SMEs. This will imply concrete progress in increasing their innovation capacities and competitiveness, including intellectual property rights commercialisation, work towards guaranteeing access to financial means and capacity building, enhancing their participation in the internet and digital economy through electronic commerce, reducing the technological gap, strengthening ethical business practices to support MSMEs’ growth and cross border trade. The ultimate objective is to progressively induce a shift into a more sustainable, eco-friendly and green production and supporting their internationalisation, including through ICT.
Through the implementation of the ASEAN Strategic Action Plan for SME Development 2016 - 2025 (SAPSMED 2016 - 2025), there are various projects being initiated, among others the 5th ASEAN-OECD Regional Policy Network (RPN) meeting on promoting productivity, technology and innovation; a technology transfer programme for SMEs; a basic survey on credit guarantee schemes; research studies on crowd funding and alternative financing. Under the 2017 ASEAN Chairmanship theme of ‘inclusive, innovation-led growth’ and recognising ASEAN MSMEs as drivers of inclusive growth, various initiatives such as inclusive business for women and youth entrepreneurship were created. These initiatives are designed to enhance the ecosystem for MSME development and to improve policy platforms to encourage MSMEs to internationalise and take advantage of opportunities created through the ASEAN Economic Community (AEC). Complementary to these initiatives were key deliverables on MSMEs for 2017 which include the production of a handbook for SMEs on accessing alternative sources of finance and a report for policy makers on facilitating equity crowd funding. Both initiatives aim to increase access to finance for MSMEs.
DEVELOPMENTS OF SMEs IN ADVANCED AND EMERGING ECONOMIES
CHAPTER 2 SME developments and outlook
15

SME ANNUAL REPORT 2016/17
Overview: Growth Trends of SMEs during 2011 - 2016
Based on the newly released Economic Census 2016: Profile of Small and Medium Enterprises by the Department of Statistics, Malaysia (DOSM) (featured in Special Highlight on page 109), SMEs in Malaysia constituted 98.5% of the total business establishments. Majority of the businesses were in services sector, mainly in wholesale & retail trade, followed by manufacturing, construction, agriculture and mining & quarrying.
Since the establishment of the National SME Development Council (NSDC) in 2004, the outcome of definitive policies and holistic approach to SME development have shown results on the performance of SMEs whereby the SME GDP growth has consistently outperformed the growth of the overall GDP. For the growth period of 2011 - 2016, the average annual growth rate of SMEs was 6.5%, higher than the average growth of the overall economy of 5.1%. This has led to higher SME contribution to GDP from 32.2% in 2010 to 36.6% in 2016 (refer to Table 2.1).
In terms of performance by key economic sectors, the increase in share of SMEs to GDP was largely contributed by the services sector and further supported by the construction sector. SME GDP growth in the construction and services sectors expanded at average annual rates of 10.2% and 7.0% respectively in the growth period of 2011 - 2016, much higher than the average overall SME GDP growth of 6.5%.
PERFORMANCE OF SMES IN MALAYSIA
Table 2.1: SME GDP by Key Economic Activity (constant 2010 prices)
1CAGR refers to compounded annual growth rate (underlying growth of 7.9% for 2014)2Total value-added after taking into account import duties
Source: Department of Statistics, Malaysia
SME Contribution to GDP SME GDP Growth
2010(% share)
2016(% share)
Increase / decrease in
shareCAGR1
2011-2016 (%)
Overall2
AgricultureMining & QuarryingManufacturingConstructionServices
32.2 4.3 0.05 7.2 0.9 19.6
36.6 4.1 0.2 7.9 2.1
21.8
+4.4 -0.2
+0.15 +0.7 +1.2 +2.2
6.5 2.2 9.1 6.4 10.2 7.0
16

CHAPTER 1 THE MALAYSIAN ECONOMY
Despite the external and domestic challenges, SME GDP in Malaysia remained resilient and grew at a more moderate pace of 5.2% in 2016 (2015: 6.1%), supported by domestic demand, tourism activity and supportive policies by the Government. The SME GDP continued to surpass the overall Malaysia GDP growth of 4.2% in 2016 (2015: 5.0%).
PERFORMANCE IN 2016
Chart 2.1: SME GDP and Overall GDP Growth (%)
1Growth based on 2014 New SME Definition versus 2013 Old SME Definition2Growth based on 2014 New SME Definition versus 2013 New SME Definition
p: preliminary
Source: Department of Statistics, Malaysia and SME Corp. Malaysia
CHAPTER 2 SME developments and outlook
Annual growth, %
2001-2.0
0.0
2.0
4.0
6.0
8.05.4 5.8
6.8
5.3 5.66.3
4.8
-1.5
7.4
5.3 5.5 4.76.0
5.0 4.2
5.26.1
13.5
7.96.46.0
7.38.3
6.5
0.2
10.0
6.46.9
8.3
5.24.6
-0.4
0.5
2
1
10.0
12.0
14.0
2002 2003 2004 2005 2006 2007 2008 2009
SME GDP Overall GDP
2010 2011 2012 2013 2014 2015 2016p
Partly due to theredefinition of SMEs
20114.0
5.0
6.0
7.0
8.0
9.0
10.0
2012 2013 2014 2015
6.86.45.95.8
5.6
2016 p1
Wholesale & retail trade, F&B and accommodation
Transport & storage and information &communicationOverall services
Other services
Finance, insurance, real estate and business services
Annual growth, %
Annual growth, %
20110.0
5.0
10.0
15.o
2012 2013 2014 2015 2016
6.25.44.8
2.8
1 p
Petroleum, chemical, rubber and plastic products
Food, beverages and tobaccoNon-metalic mineral products, basic metal and fabricated metal products
Overall manufacturing
Other manufacturing
2011 2012 2013 2014 2015
-3.0-2.4-1.7
1.6
2016 p1
10.0
5.0
0.0
-5
-10
Annual growth, %
Crops and livestock Fishing Forestry & logging Overall agriculture
Annual growth, %18.0
16.0
14.0
12.0
10.0
8.0
6.0
4.0
2.0
2011 2012 2013 2014 2015 2016
6.8
8.2
0.0p1
Construction Mining & Quarrying
Annual growth, %
Partly due to theredefinition of SMEs
25.0
20.0
15.0
10.0
5.0
0.0
-5.0
-10.0
2012 2014 2015 2016p
SME Employment SME GDPSME Productivity
13.0
11.0
9.0
7.0
5.0
3.0
1.0
-1.0
10.0
8.0
6.0
4.0
2.0
0.0
-2.02011 2012 2013 2014 2016
4.0
7.57.89.2
-4.0
-6.0
-8.0
2011 2013 2014 2015 2016
1.8
6.6
p
Annual growth, %
Annual growth, %
SME Exports
Tourist ArrivalsOverall Services Exports
Tourist ReceiptsSME Services Exports
Overall Exports
2015
14.0
8.3
5.85.4
0.54.6
-0.4
5.2
6.85.3 5.6
6.34.8
6.96.4
10.0
6.5
0.2
-1.5
8.37.3
6.0 6.4
7.4
5.3 5.5 4.76.0
5.0 4.2
5.26.1
13.5
7.9
12.0
10.0
8.0
6.0
4.0
2.0
0.0
-2.02001 2002 2003 2004 2005 2006 2007 2008 2009 2010 2011 2012 2013 2014 2015 2016 2017
Annual growth, %
p e
2
1
Overall GDP
6.0% or more
Partly due to theredefinition of SMEs
More than 4.8%
SME GDP
Annual growth, %
Index
4.0
3.0
2.0
1.0
0.0
-1.0
-2.0
125.0
105.0
99.7
q1 q2
2013
q3 q4 q1 q2
2014
q3 q4 q1 q2
2015
q3 q4 q1 q2 q1
1.3
1.1
-1.0
q2
2016 2017
q3 q4
p
140.0
120.0
100.0
80.0
60.0q1 q2
2013
q3 q4 q1 q2
2014
q3 q4 q1 q2
2015
q3 q4 q1 q2 q1 q2
2016 2017
q3 q4
Leading Index
4.8
2013
2012
MIER Business Conditions IndexMIER Consumer Sentiments Index
114.1
80.7
160.0
120.0
140.0
100.0
80.0
60.0q1 q2
2013
q3 q4 q1 q2
2014
q3 q4 q1 q2
2015
q3 q4 q1 q2 q1 q2
2016 2017
q3 q4
MIER Retail Trade IndexMIER Tourism Market IndexMIER Auto Industry Index
Index
17
SME ANNUAL REPORT 2016/17
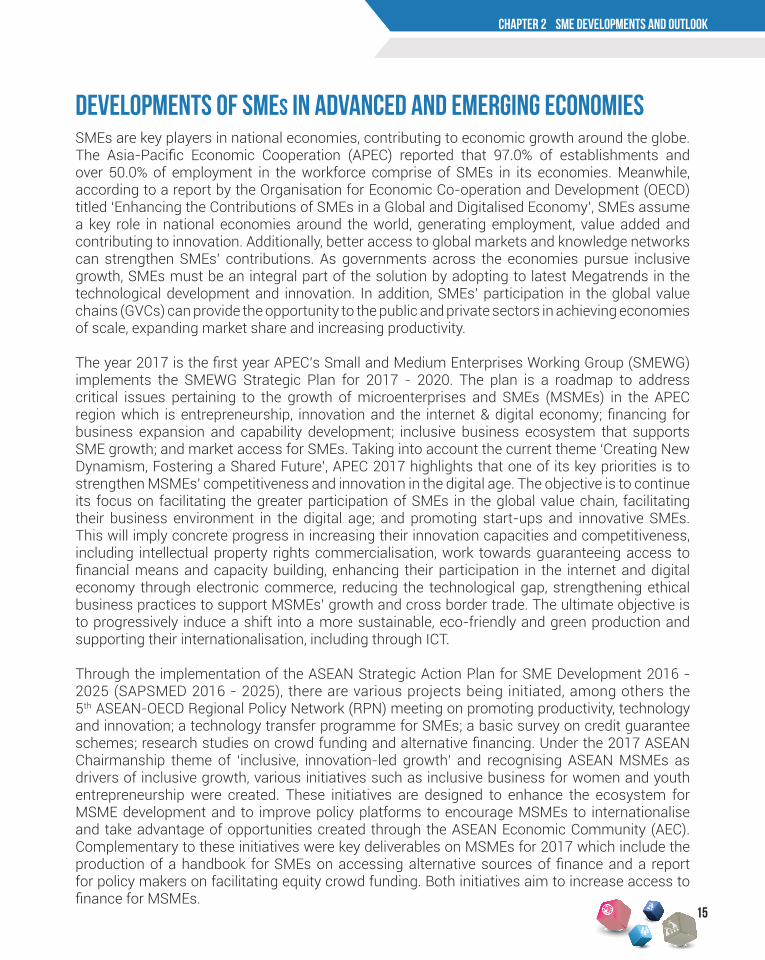
In terms of sectoral contribution to the SME GDP in 2016, the services sector was the largest contributor (59.6%) to total SME GDP, followed by manufacturing (21.6%), agriculture (11.2%), construction (5.8%) and mining & quarrying (0.4%). The SME GDP structure is somewhat similar to the overall GDP structure with the exception that contribution of SME GDP in mining & quarrying is small given the fact that SMEs in this sector accounted for only a small share of total establishments of SMEs (refer to Table 2.3).
Annual Growth, %2015 SME GDP 2016 SME GDP 2016 Overall GDP
AgricultureMining & QuarryingManufacturingConstructionServices
2.08.96.07.66.6
-1.78.24.86.86.4
-5.12.24.47.45.6
Total 6.1 5.2 4.2
2016(Percentage Share to Total, %)
SME GDP Overall GDP
ServicesManufacturingAgricultureConstructionMining & QuarryingPlus: import duties
59.621.611.25.80.41.4
54.323.0 8.14.58.81.3
Total 100.0 100.0
Table 2.2: SME GDP and Overall GDP Growth by Key Economic Activity (constant 2010 prices)
Table 2.3: SME GDP and Overall GDP Share by Key Economic Activity in 2016 (constant 2010 prices)
Source: Department of Statistics, Malaysia
Source: Department of Statistics, Malaysia
In 2016, all economic sectors of SMEs continued to expand with the exception of the agriculture sector as the sector showed a reversed trend due to lower SME production of oil palm and rubber. The non-key economic sectors of SMEs, namely mining & quarrying and construction were the high performing sectors among SMEs. Meanwhile, when compared between the overall economy and SMEs, the SME GDP growth was higher across all economic sectors except construction sector (refer to Table 2.2).
18
CHAPTER 1 THE MALAYSIAN ECONOMY
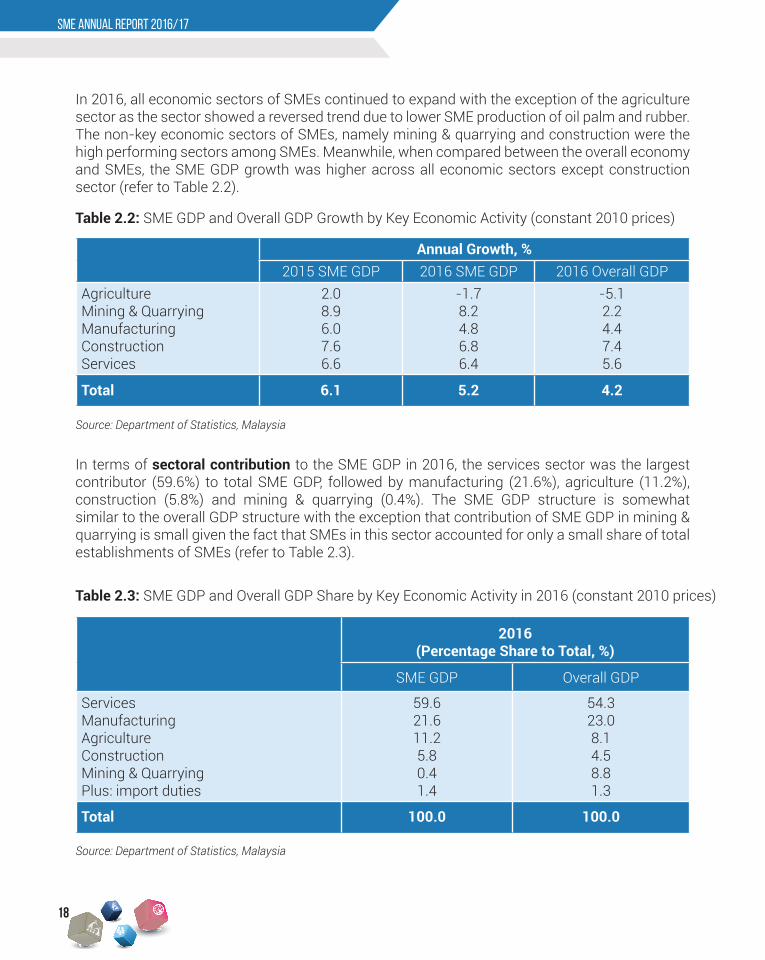
Chart 2.2: SME Value-added Growth of Sub-sectors in the Services Sector (%)
1Growth based on 2014 New SME Definition versus 2013 New SME Definition (redefinition effect has been eliminated)
p: preliminary
Source: Department of Statistics, Malaysia
SME Value-added in the Services Sector
CHAPTER 2 SME developments and outlook
Chart 2.3: Components of Value-added of SMEs in the Services Sector (%)
Infrastructure
Innovation & Technology Adoption
7.5%
18.8%22.6%
22.6%
28.5%Market Access
Access to Financing Human Capital Development
6.3%
Market Access
Access to Financing
85.0%
Innovation & Technology Adoption
5.2%Human Capital Development2.3%
Market Access
Human Capital Development
17.1%
Access to Financing
79.6%
2.7%
Innovation & Technology Adoption
Finance, insurance, real estateand business services
10.3%
Wholesale & retail trade, F&B and accommodation
62.1%
20.3%
Other services
7.3%
Transport & storageand information & communication
Petroleum, chemical, rubberand plastic products
Other manufacturing
35.9%20.9%
18.7%
24.5%
Non-metalic mineral products,basic metal and fabricatedmetal products
Food, beveragesand tobacco
Non-residential buildingsSpecial trades
35.2%22.3%
19.4%
23.1%
Civil engineering
Construction Sector Mining & Quarrying Sector
Residentialbuildings
Chart 2.3
Chart 2.5
Chart 2.7
17.5%
Forestry & logging
Crops and livestock
78.3%
Fishing
4.2%
Stones, rocks &granite quarrying
Petroleum &natural gas
50.0%
38.5%
Insurancecompanies
Individual investors
and family officesOther investors
Pension andprovident funds
Fund of fundsand other assetmanagers
Corporateinvestors
Governmentagencies
0.3% 0.4%
29.9%
14.9%
3.5%
1.6%
1.3%
Sovereign wealthfunds and Government investment companies
47.7%19.1%61%
0.7%
7.7%0.9%
10.7%
Early stage
Growth
Bridge / Mezzaine /Pre-IPO
Others
Seed
Start-up
11.5%
Mineral mining
0.5%
Infrastructure
0.01%
Infrastructure
1.2%
Source: Department of Statistics, Malaysia
2016
Annual growth, %
2001-2.0
0.0
2.0
4.0
6.0
8.05.4 5.8
6.8
5.3 5.66.3
4.8
-1.5
7.4
5.3 5.5 4.76.0
5.0 4.2
5.26.1
13.5
7.96.46.0
7.38.3
6.5
0.2
10.0
6.46.9
8.3
5.24.6
-0.4
0.5
2
1
10.0
12.0
14.0
2002 2003 2004 2005 2006 2007 2008 2009
SME GDP Overall GDP
2010 2011 2012 2013 2014 2015 2016p
Partly due to theredefinition of SMEs
20114.0
5.0
6.0
7.0
8.0
9.0
10.0
2012 2013 2014 2015
6.86.45.95.8
5.6
2016 p1
Wholesale & retail trade, F&B and accommodation
Transport & storage and information &communicationOverall services
Other services
Finance, insurance, real estate and business services
Annual growth, %
Annual growth, %
20110.0
5.0
10.0
15.o
2012 2013 2014 2015 2016
6.25.44.8
2.8
1 p
Petroleum, chemical, rubber and plastic products
Food, beverages and tobaccoNon-metalic mineral products, basic metal and fabricated metal products
Overall manufacturing
Other manufacturing
2011 2012 2013 2014 2015
-3.0-2.4-1.7
1.6
2016 p1
10.0
5.0
0.0
-5
-10
Annual growth, %
Crops and livestock Fishing Forestry & logging Overall agriculture
Annual growth, %18.0
16.0
14.0
12.0
10.0
8.0
6.0
4.0
2.0
2011 2012 2013 2014 2015 2016
6.8
8.2
0.0p1
Construction Mining & Quarrying
Annual growth, %
Partly due to theredefinition of SMEs
25.0
20.0
15.0
10.0
5.0
0.0
-5.0
-10.0
2012 2014 2015 2016p
SME Employment SME GDPSME Productivity
13.0
11.0
9.0
7.0
5.0
3.0
1.0
-1.0
10.0
8.0
6.0
4.0
2.0
0.0
-2.02011 2012 2013 2014 2016
4.0
7.57.89.2
-4.0
-6.0
-8.0
2011 2013 2014 2015 2016
1.8
6.6
p
Annual growth, %
Annual growth, %
SME Exports
Tourist ArrivalsOverall Services Exports
Tourist ReceiptsSME Services Exports
Overall Exports
2015
14.0
8.3
5.85.4
0.54.6
-0.4
5.2
6.85.3 5.6
6.34.8
6.96.4
10.0
6.5
0.2
-1.5
8.37.3
6.0 6.4
7.4
5.3 5.5 4.76.0
5.0 4.2
5.26.1
13.5
7.9
12.0
10.0
8.0
6.0
4.0
2.0
0.0
-2.02001 2002 2003 2004 2005 2006 2007 2008 2009 2010 2011 2012 2013 2014 2015 2016 2017
Annual growth, %
p e
2
1
Overall GDP
6.0% or more
Partly due to theredefinition of SMEs
More than 4.8%
SME GDP
Annual growth, %
Index
4.0
3.0
2.0
1.0
0.0
-1.0
-2.0
125.0
105.0
99.7
q1 q2
2013
q3 q4 q1 q2
2014
q3 q4 q1 q2
2015
q3 q4 q1 q2 q1
1.3
1.1
-1.0
q2
2016 2017
q3 q4
p
140.0
120.0
100.0
80.0
60.0q1 q2
2013
q3 q4 q1 q2
2014
q3 q4 q1 q2
2015
q3 q4 q1 q2 q1 q2
2016 2017
q3 q4
Leading Index
4.8
2013
2012
MIER Business Conditions IndexMIER Consumer Sentiments Index
114.1
80.7
160.0
120.0
140.0
100.0
80.0
60.0q1 q2
2013
q3 q4 q1 q2
2014
q3 q4 q1 q2
2015
q3 q4 q1 q2 q1 q2
2016 2017
q3 q4
MIER Retail Trade IndexMIER Tourism Market IndexMIER Auto Industry Index
Index
19
SME ANNUAL REPORT 2016/17
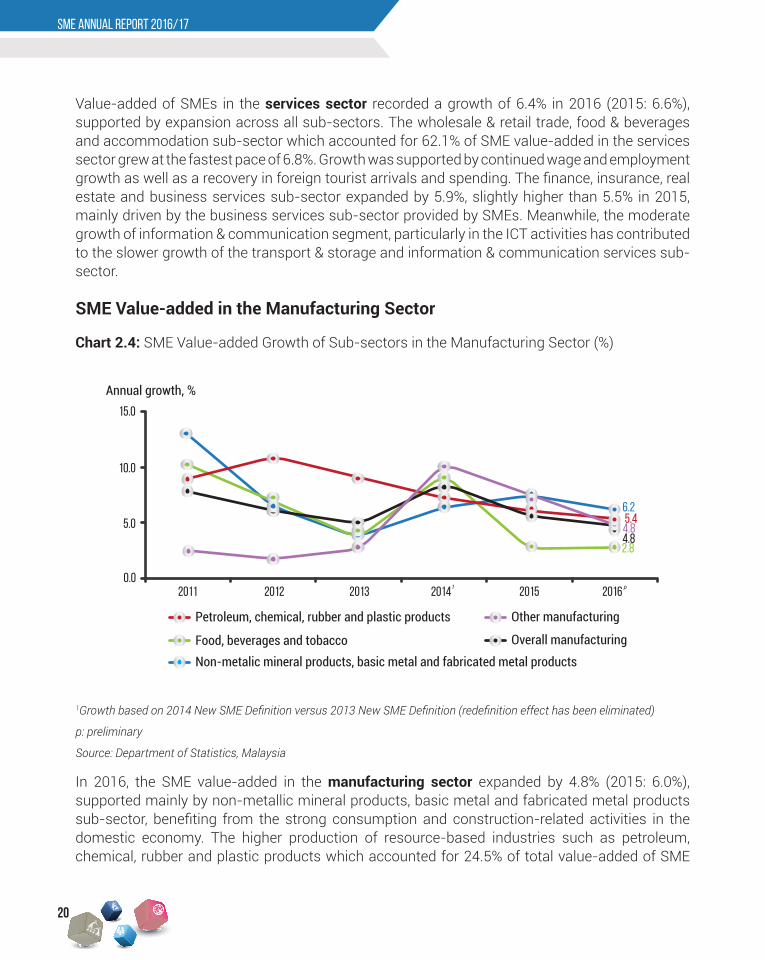
Chart 2.4: SME Value-added Growth of Sub-sectors in the Manufacturing Sector (%)
1Growth based on 2014 New SME Definition versus 2013 New SME Definition (redefinition effect has been eliminated)
p: preliminary
Source: Department of Statistics, Malaysia
Value-added of SMEs in the services sector recorded a growth of 6.4% in 2016 (2015: 6.6%), supported by expansion across all sub-sectors. The wholesale & retail trade, food & beverages and accommodation sub-sector which accounted for 62.1% of SME value-added in the services sector grew at the fastest pace of 6.8%. Growth was supported by continued wage and employment growth as well as a recovery in foreign tourist arrivals and spending. The finance, insurance, real estate and business services sub-sector expanded by 5.9%, slightly higher than 5.5% in 2015, mainly driven by the business services sub-sector provided by SMEs. Meanwhile, the moderate growth of information & communication segment, particularly in the ICT activities has contributed to the slower growth of the transport & storage and information & communication services sub-sector.
In 2016, the SME value-added in the manufacturing sector expanded by 4.8% (2015: 6.0%), supported mainly by non-metallic mineral products, basic metal and fabricated metal products sub-sector, benefiting from the strong consumption and construction-related activities in the domestic economy. The higher production of resource-based industries such as petroleum, chemical, rubber and plastic products which accounted for 24.5% of total value-added of SME
SME Value-added in the Manufacturing Sector
Annual growth, %
2001-2.0
0.0
2.0
4.0
6.0
8.05.4 5.8
6.8
5.3 5.66.3
4.8
-1.5
7.4
5.3 5.5 4.76.0
5.0 4.2
5.26.1
13.5
7.96.46.0
7.38.3
6.5
0.2
10.0
6.46.9
8.3
5.24.6
-0.4
0.5
2
1
10.0
12.0
14.0
2002 2003 2004 2005 2006 2007 2008 2009
SME GDP Overall GDP
2010 2011 2012 2013 2014 2015 2016p
Partly due to theredefinition of SMEs
20114.0
5.0
6.0
7.0
8.0
9.0
10.0
2012 2013 2014 2015
6.86.45.95.8
5.6
2016 p1
Wholesale & retail trade, F&B and accommodation
Transport & storage and information &communicationOverall services
Other services
Finance, insurance, real estate and business services
Annual growth, %
Annual growth, %
20110.0
5.0
10.0
15.o
2012 2013 2014 2015 2016
6.25.44.8
2.8
1 p
Petroleum, chemical, rubber and plastic products
Food, beverages and tobaccoNon-metalic mineral products, basic metal and fabricated metal products
Overall manufacturing
Other manufacturing
2011 2012 2013 2014 2015
-3.0-2.4-1.7
1.6
2016 p1
10.0
5.0
0.0
-5
-10
Annual growth, %
Crops and livestock Fishing Forestry & logging Overall agriculture
Annual growth, %18.0
16.0
14.0
12.0
10.0
8.0
6.0
4.0
2.0
2011 2012 2013 2014 2015 2016
6.8
8.2
0.0p1
Construction Mining & Quarrying
Annual growth, %
Partly due to theredefinition of SMEs
25.0
20.0
15.0
10.0
5.0
0.0
-5.0
-10.0
2012 2014 2015 2016p
SME Employment SME GDPSME Productivity
13.0
11.0
9.0
7.0
5.0
3.0
1.0
-1.0
10.0
8.0
6.0
4.0
2.0
0.0
-2.02011 2012 2013 2014 2016
4.0
7.57.89.2
-4.0
-6.0
-8.0
2011 2013 2014 2015 2016
1.8
6.6
p
Annual growth, %
Annual growth, %
SME Exports
Tourist ArrivalsOverall Services Exports
Tourist ReceiptsSME Services Exports
Overall Exports
2015
14.0
8.3
5.85.4
0.54.6
-0.4
5.2
6.85.3 5.6
6.34.8
6.96.4
10.0
6.5
0.2
-1.5
8.37.3
6.0 6.4
7.4
5.3 5.5 4.76.0
5.0 4.2
5.26.1
13.5
7.9
12.0
10.0
8.0
6.0
4.0
2.0
0.0
-2.02001 2002 2003 2004 2005 2006 2007 2008 2009 2010 2011 2012 2013 2014 2015 2016 2017
Annual growth, %
p e
2
1
Overall GDP
6.0% or more
Partly due to theredefinition of SMEs
More than 4.8%
SME GDP
Annual growth, %
Index
4.0
3.0
2.0
1.0
0.0
-1.0
-2.0
125.0
105.0
99.7
q1 q2
2013
q3 q4 q1 q2
2014
q3 q4 q1 q2
2015
q3 q4 q1 q2 q1
1.3
1.1
-1.0
q2
2016 2017
q3 q4
p
140.0
120.0
100.0
80.0
60.0q1 q2
2013
q3 q4 q1 q2
2014
q3 q4 q1 q2
2015
q3 q4 q1 q2 q1 q2
2016 2017
q3 q4
Leading Index
4.8
2013
2012
MIER Business Conditions IndexMIER Consumer Sentiments Index
114.1
80.7
160.0
120.0
140.0
100.0
80.0
60.0q1 q2
2013
q3 q4 q1 q2
2014
q3 q4 q1 q2
2015
q3 q4 q1 q2 q1 q2
2016 2017
q3 q4
MIER Retail Trade IndexMIER Tourism Market IndexMIER Auto Industry Index
Index
20
CHAPTER 1 THE MALAYSIAN ECONOMY
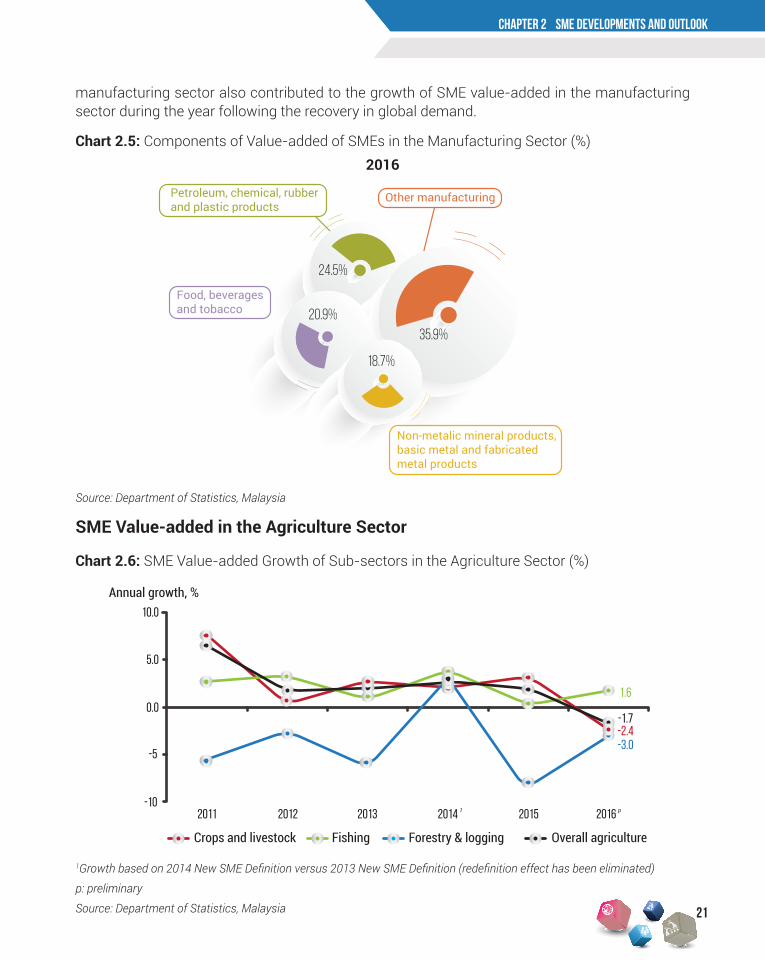
Chart 2.6: SME Value-added Growth of Sub-sectors in the Agriculture Sector (%)
Chart 2.5: Components of Value-added of SMEs in the Manufacturing Sector (%)
Source: Department of Statistics, Malaysia
1Growth based on 2014 New SME Definition versus 2013 New SME Definition (redefinition effect has been eliminated)
p: preliminary
Source: Department of Statistics, Malaysia
SME Value-added in the Agriculture Sector
CHAPTER 2 SME developments and outlook
manufacturing sector also contributed to the growth of SME value-added in the manufacturing sector during the year following the recovery in global demand.
Infrastructure
Innovation & Technology Adoption
7.5%
18.8%22.6%
22.6%
28.5%Market Access
Access to Financing Human Capital Development
6.3%
Market Access
Access to Financing
85.0%
Innovation & Technology Adoption
5.2%Human Capital Development2.3%
Market Access
Human Capital Development
17.1%
Access to Financing
79.6%
2.7%
Innovation & Technology Adoption
Finance, insurance, real estateand business services
10.3%
Wholesale & retail trade, F&B and accommodation
62.1%
20.3%
Other services
7.3%
Transport & storageand information & communication
Petroleum, chemical, rubberand plastic products
Other manufacturing
35.9%20.9%
18.7%
24.5%
Non-metalic mineral products,basic metal and fabricatedmetal products
Food, beveragesand tobacco
Non-residential buildingsSpecial trades
35.2%22.3%
19.4%
23.1%
Civil engineering
Construction Sector Mining & Quarrying Sector
Residentialbuildings
Chart 2.3
Chart 2.5
Chart 2.7
17.5%
Forestry & logging
Crops and livestock
78.3%
Fishing
4.2%
Stones, rocks &granite quarrying
Petroleum &natural gas
50.0%
38.5%
Insurancecompanies
Individual investors
and family officesOther investors
Pension andprovident funds
Fund of fundsand other assetmanagers
Corporateinvestors
Governmentagencies
0.3% 0.4%
29.9%
14.9%
3.5%
1.6%
1.3%
Sovereign wealthfunds and Government investment companies
47.7%19.1%61%
0.7%
7.7%0.9%
10.7%
Early stage
Growth
Bridge / Mezzaine /Pre-IPO
Others
Seed
Start-up
11.5%
Mineral mining
0.5%
Infrastructure
0.01%
Infrastructure
1.2%
2016
Annual growth, %
2001-2.0
0.0
2.0
4.0
6.0
8.05.4 5.8
6.8
5.3 5.66.3
4.8
-1.5
7.4
5.3 5.5 4.76.0
5.0 4.2
5.26.1
13.5
7.96.46.0
7.38.3
6.5
0.2
10.0
6.46.9
8.3
5.24.6
-0.4
0.5
2
1
10.0
12.0
14.0
2002 2003 2004 2005 2006 2007 2008 2009
SME GDP Overall GDP
2010 2011 2012 2013 2014 2015 2016p
Partly due to theredefinition of SMEs
20114.0
5.0
6.0
7.0
8.0
9.0
10.0
2012 2013 2014 2015
6.86.45.95.8
5.6
2016 p1
Wholesale & retail trade, F&B and accommodation
Transport & storage and information &communicationOverall services
Other services
Finance, insurance, real estate and business services
Annual growth, %
Annual growth, %
20110.0
5.0
10.0
15.o
2012 2013 2014 2015 2016
6.25.44.8
2.8
1 p
Petroleum, chemical, rubber and plastic products
Food, beverages and tobaccoNon-metalic mineral products, basic metal and fabricated metal products
Overall manufacturing
Other manufacturing
2011 2012 2013 2014 2015
-3.0-2.4-1.7
1.6
2016 p1
10.0
5.0
0.0
-5
-10
Annual growth, %
Crops and livestock Fishing Forestry & logging Overall agriculture
Annual growth, %18.0
16.0
14.0
12.0
10.0
8.0
6.0
4.0
2.0
2011 2012 2013 2014 2015 2016
6.8
8.2
0.0p1
Construction Mining & Quarrying
Annual growth, %
Partly due to theredefinition of SMEs
25.0
20.0
15.0
10.0
5.0
0.0
-5.0
-10.0
2012 2014 2015 2016p
SME Employment SME GDPSME Productivity
13.0
11.0
9.0
7.0
5.0
3.0
1.0
-1.0
10.0
8.0
6.0
4.0
2.0
0.0
-2.02011 2012 2013 2014 2016
4.0
7.57.89.2
-4.0
-6.0
-8.0
2011 2013 2014 2015 2016
1.8
6.6
p
Annual growth, %
Annual growth, %
SME Exports
Tourist ArrivalsOverall Services Exports
Tourist ReceiptsSME Services Exports
Overall Exports
2015
14.0
8.3
5.85.4
0.54.6
-0.4
5.2
6.85.3 5.6
6.34.8
6.96.4
10.0
6.5
0.2
-1.5
8.37.3
6.0 6.4
7.4
5.3 5.5 4.76.0
5.0 4.2
5.26.1
13.5
7.9
12.0
10.0
8.0
6.0
4.0
2.0
0.0
-2.02001 2002 2003 2004 2005 2006 2007 2008 2009 2010 2011 2012 2013 2014 2015 2016 2017
Annual growth, %
p e
2
1
Overall GDP
6.0% or more
Partly due to theredefinition of SMEs
More than 4.8%
SME GDP
Annual growth, %
Index
4.0
3.0
2.0
1.0
0.0
-1.0
-2.0
125.0
105.0
99.7
q1 q2
2013
q3 q4 q1 q2
2014
q3 q4 q1 q2
2015
q3 q4 q1 q2 q1
1.3
1.1
-1.0
q2
2016 2017
q3 q4
p
140.0
120.0
100.0
80.0
60.0q1 q2
2013
q3 q4 q1 q2
2014
q3 q4 q1 q2
2015
q3 q4 q1 q2 q1 q2
2016 2017
q3 q4
Leading Index
4.8
2013
2012
MIER Business Conditions IndexMIER Consumer Sentiments Index
114.1
80.7
160.0
120.0
140.0
100.0
80.0
60.0q1 q2
2013
q3 q4 q1 q2
2014
q3 q4 q1 q2
2015
q3 q4 q1 q2 q1 q2
2016 2017
q3 q4
MIER Retail Trade IndexMIER Tourism Market IndexMIER Auto Industry Index
Index
21
SME ANNUAL REPORT 2016/17
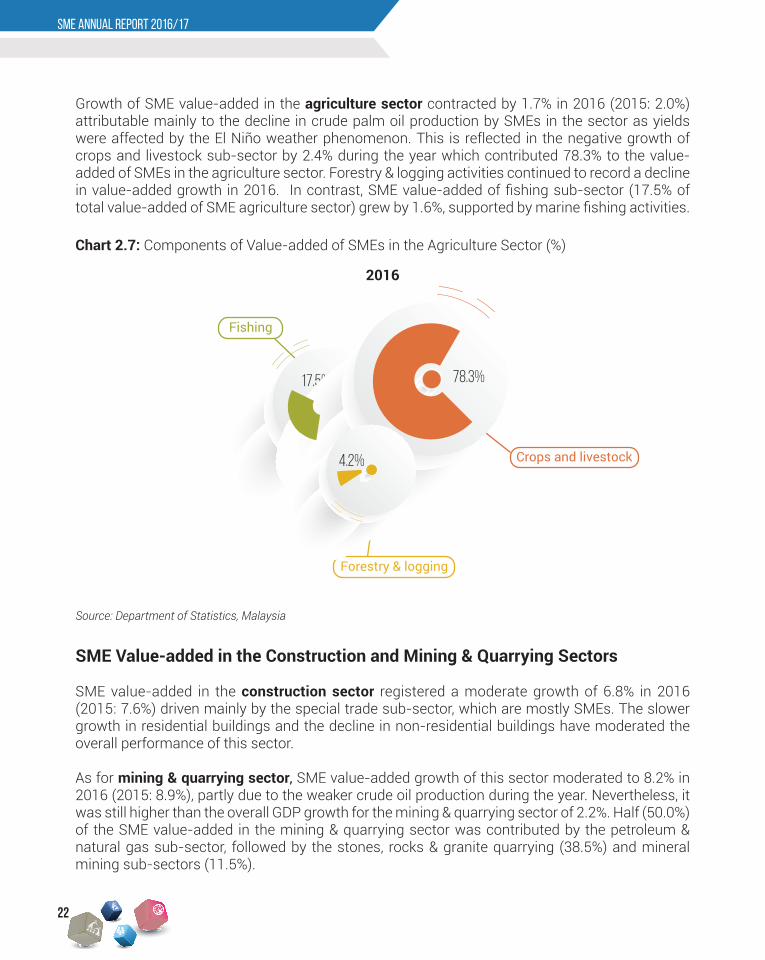
Chart 2.7: Components of Value-added of SMEs in the Agriculture Sector (%)
Source: Department of Statistics, Malaysia
SME Value-added in the Construction and Mining & Quarrying Sectors
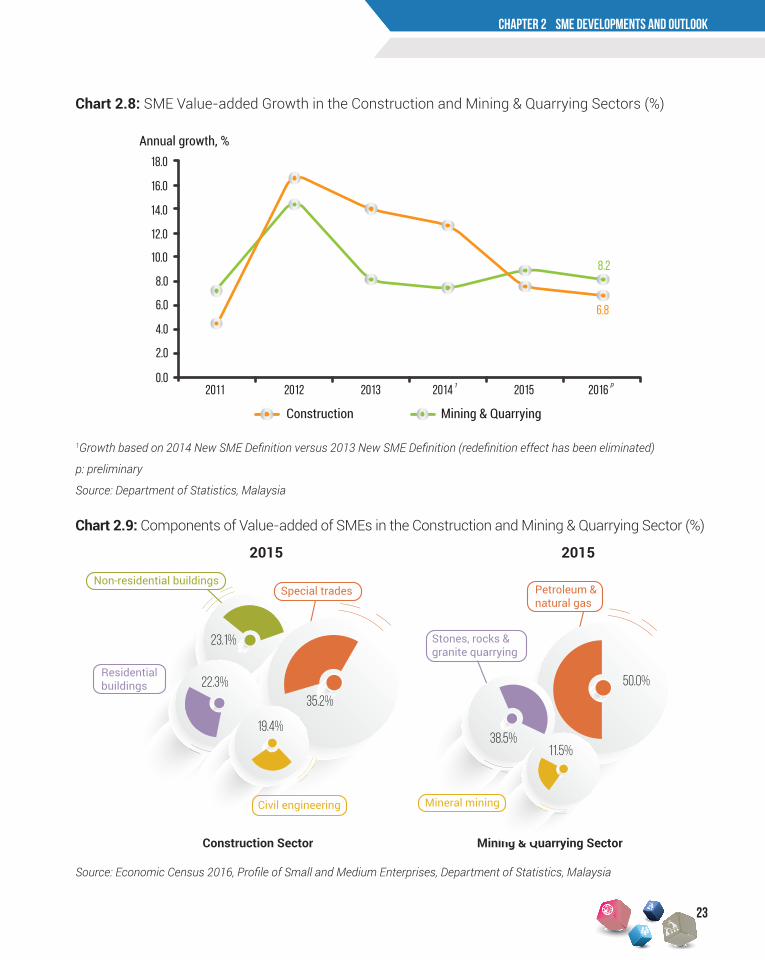
SME value-added in the construction sector registered a moderate growth of 6.8% in 2016 (2015: 7.6%) driven mainly by the special trade sub-sector, which are mostly SMEs. The slower growth in residential buildings and the decline in non-residential buildings have moderated the overall performance of this sector.
As for mining & quarrying sector, SME value-added growth of this sector moderated to 8.2% in 2016 (2015: 8.9%), partly due to the weaker crude oil production during the year. Nevertheless, it was still higher than the overall GDP growth for the mining & quarrying sector of 2.2%. Half (50.0%) of the SME value-added in the mining & quarrying sector was contributed by the petroleum & natural gas sub-sector, followed by the stones, rocks & granite quarrying (38.5%) and mineral mining sub-sectors (11.5%).
Growth of SME value-added in the agriculture sector contracted by 1.7% in 2016 (2015: 2.0%) attributable mainly to the decline in crude palm oil production by SMEs in the sector as yields were affected by the El Niño weather phenomenon. This is reflected in the negative growth of crops and livestock sub-sector by 2.4% during the year which contributed 78.3% to the value-added of SMEs in the agriculture sector. Forestry & logging activities continued to record a decline in value-added growth in 2016. In contrast, SME value-added of fishing sub-sector (17.5% of total value-added of SME agriculture sector) grew by 1.6%, supported by marine fishing activities.
Infrastructure
Innovation & Technology Adoption
7.5%
18.8%22.6%
22.6%
28.5%Market Access
Access to Financing Human Capital Development
6.3%
Market Access
Access to Financing
85.0%
Innovation & Technology Adoption
5.2%Human Capital Development2.3%
Market Access
Human Capital Development
17.1%
Access to Financing
79.6%
2.7%
Innovation & Technology Adoption
Finance, insurance, real estateand business services
10.3%
Wholesale & retail trade, F&B and accommodation
62.1%
20.3%
Other services
7.3%
Transport & storageand information & communication
Petroleum, chemical, rubberand plastic products
Other manufacturing
35.9%20.9%
18.7%
24.5%
Non-metalic mineral products,basic metal and fabricatedmetal products
Food, beveragesand tobacco
Non-residential buildingsSpecial trades
35.2%22.3%
19.4%
23.1%
Civil engineering
Construction Sector Mining & Quarrying Sector
Residentialbuildings
Chart 2.3
Chart 2.5
Chart 2.7
17.5%
Forestry & logging
Crops and livestock
78.3%
Fishing
4.2%
Stones, rocks &granite quarrying
Petroleum &natural gas
50.0%
38.5%
Insurancecompanies
Individual investors
and family officesOther investors
Pension andprovident funds
Fund of fundsand other assetmanagers
Corporateinvestors
Governmentagencies
0.3% 0.4%
29.9%
14.9%
3.5%
1.6%
1.3%
Sovereign wealthfunds and Government investment companies
47.7%19.1%61%
0.7%
7.7%0.9%
10.7%
Early stage
Growth
Bridge / Mezzaine /Pre-IPO
Others
Seed
Start-up
11.5%
Mineral mining
0.5%
Infrastructure
0.01%
Infrastructure
1.2%
2016
22
CHAPTER 1 THE MALAYSIAN ECONOMY
Chart 2.9: Components of Value-added of SMEs in the Construction and Mining & Quarrying Sector (%)
Source: Economic Census 2016, Profile of Small and Medium Enterprises, Department of Statistics, Malaysia
CHAPTER 2 SME developments and outlook
Chart 2.8: SME Value-added Growth in the Construction and Mining & Quarrying Sectors (%)
1Growth based on 2014 New SME Definition versus 2013 New SME Definition (redefinition effect has been eliminated)
p: preliminary
Source: Department of Statistics, Malaysia
Infrastructure
Innovation & Technology Adoption
7.5%
18.8%22.6%
22.6%
28.5%Market Access
Access to Financing Human Capital Development
6.3%
Market Access
Access to Financing
85.0%
Innovation & Technology Adoption
5.2%Human Capital Development2.3%
Market Access
Human Capital Development
17.1%
Access to Financing
79.6%
2.7%
Innovation & Technology Adoption
Finance, insurance, real estateand business services
10.3%
Wholesale & retail trade, F&B and accommodation
62.1%
20.3%
Other services
7.3%
Transport & storageand information & communication
Petroleum, chemical, rubberand plastic products
Other manufacturing
35.9%20.9%
18.7%
24.5%
Non-metalic mineral products,basic metal and fabricatedmetal products
Food, beveragesand tobacco
Non-residential buildingsSpecial trades
35.2%22.3%
19.4%
23.1%
Civil engineering
Construction Sector Mining & Quarrying Sector
Residentialbuildings
Chart 2.3
Chart 2.5
Chart 2.7
17.5%
Forestry & logging
Crops and livestock
78.3%
Fishing
4.2%
Stones, rocks &granite quarrying
Petroleum &natural gas
50.0%
38.5%
Insurancecompanies
Individual investors
and family officesOther investors
Pension andprovident funds
Fund of fundsand other assetmanagers
Corporateinvestors
Governmentagencies
0.3% 0.4%
29.9%
14.9%
3.5%
1.6%
1.3%
Sovereign wealthfunds and Government investment companies
47.7%19.1%61%
0.7%
7.7%0.9%
10.7%
Early stage
Growth
Bridge / Mezzaine /Pre-IPO
Others
Seed
Start-up
11.5%
Mineral mining
0.5%
Infrastructure
0.01%
Infrastructure
1.2%
2015 2015
Annual growth, %
2001-2.0
0.0
2.0
4.0
6.0
8.05.4 5.8
6.8
5.3 5.66.3
4.8
-1.5
7.4
5.3 5.5 4.76.0
5.0 4.2
5.26.1
13.5
7.96.46.0
7.38.3
6.5
0.2
10.0
6.46.9
8.3
5.24.6
-0.4
0.5
2
1
10.0
12.0
14.0
2002 2003 2004 2005 2006 2007 2008 2009
SME GDP Overall GDP
2010 2011 2012 2013 2014 2015 2016p
Partly due to theredefinition of SMEs
20114.0
5.0
6.0
7.0
8.0
9.0
10.0
2012 2013 2014 2015
6.86.45.95.8
5.6
2016 p1
Wholesale & retail trade, F&B and accommodation
Transport & storage and information &communicationOverall services
Other services
Finance, insurance, real estate and business services
Annual growth, %
Annual growth, %
20110.0
5.0
10.0
15.o
2012 2013 2014 2015 2016
6.25.44.8
2.8
1 p
Petroleum, chemical, rubber and plastic products
Food, beverages and tobaccoNon-metalic mineral products, basic metal and fabricated metal products
Overall manufacturing
Other manufacturing
2011 2012 2013 2014 2015
-3.0-2.4-1.7
1.6
2016 p1
10.0
5.0
0.0
-5
-10
Annual growth, %
Crops and livestock Fishing Forestry & logging Overall agriculture
Annual growth, %18.0
16.0
14.0
12.0
10.0
8.0
6.0
4.0
2.0
2011 2012 2013 2014 2015 2016
6.8
8.2
0.0p1
Construction Mining & Quarrying
Annual growth, %
Partly due to theredefinition of SMEs
25.0
20.0
15.0
10.0
5.0
0.0
-5.0
-10.0
2012 2014 2015 2016p
SME Employment SME GDPSME Productivity
13.0
11.0
9.0
7.0
5.0
3.0
1.0
-1.0
10.0
8.0
6.0
4.0
2.0
0.0
-2.02011 2012 2013 2014 2016
4.0
7.57.89.2
-4.0
-6.0
-8.0
2011 2013 2014 2015 2016
1.8
6.6
p
Annual growth, %
Annual growth, %
SME Exports
Tourist ArrivalsOverall Services Exports
Tourist ReceiptsSME Services Exports
Overall Exports
2015
14.0
8.3
5.85.4
0.54.6
-0.4
5.2
6.85.3 5.6
6.34.8
6.96.4
10.0
6.5
0.2
-1.5
8.37.3
6.0 6.4
7.4
5.3 5.5 4.76.0
5.0 4.2
5.26.1
13.5
7.9
12.0
10.0
8.0
6.0
4.0
2.0
0.0
-2.02001 2002 2003 2004 2005 2006 2007 2008 2009 2010 2011 2012 2013 2014 2015 2016 2017
Annual growth, %
p e
2
1
Overall GDP
6.0% or more
Partly due to theredefinition of SMEs
More than 4.8%
SME GDP
Annual growth, %
Index
4.0
3.0
2.0
1.0
0.0
-1.0
-2.0
125.0
105.0
99.7
q1 q2
2013
q3 q4 q1 q2
2014
q3 q4 q1 q2
2015
q3 q4 q1 q2 q1
1.3
1.1
-1.0
q2
2016 2017
q3 q4
p
140.0
120.0
100.0
80.0
60.0q1 q2
2013
q3 q4 q1 q2
2014
q3 q4 q1 q2
2015
q3 q4 q1 q2 q1 q2
2016 2017
q3 q4
Leading Index
4.8
2013
2012
MIER Business Conditions IndexMIER Consumer Sentiments Index
114.1
80.7
160.0
120.0
140.0
100.0
80.0
60.0q1 q2
2013
q3 q4 q1 q2
2014
q3 q4 q1 q2
2015
q3 q4 q1 q2 q1 q2
2016 2017
q3 q4
MIER Retail Trade IndexMIER Tourism Market IndexMIER Auto Industry Index
Index
23

SME ANNUAL REPORT 2016/17
Chart 2.10: Employment by Firm Size
p: preliminary
Source: Department of Statistics, Malaysia
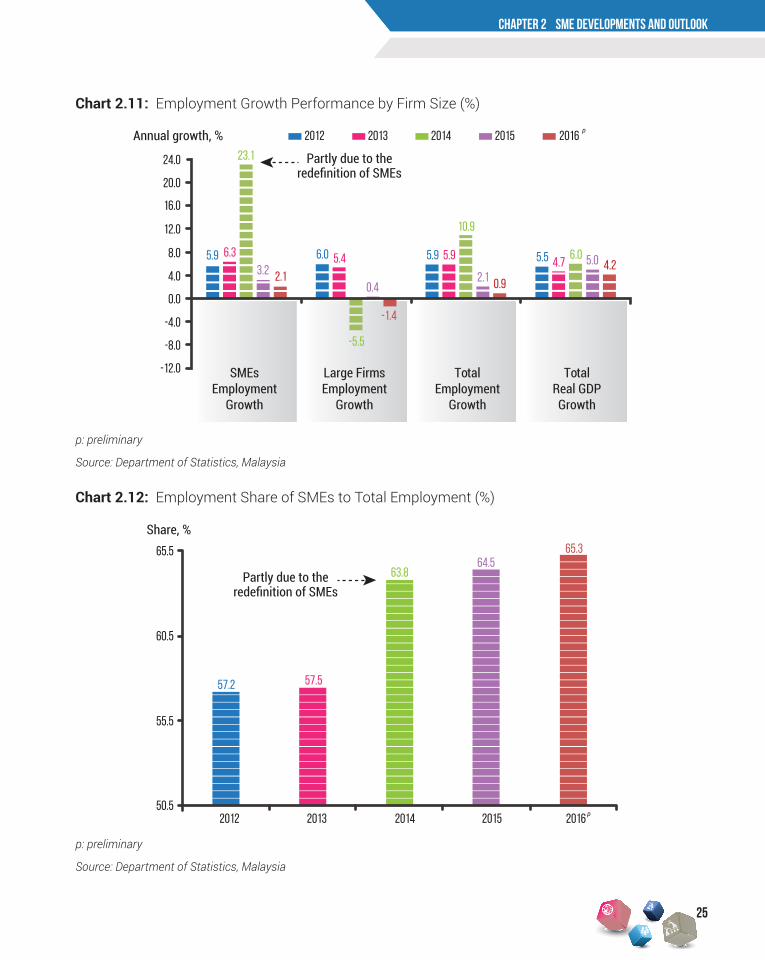
In 2016, employment of SMEs continued to expand with a growth of 2.1% (2015: 3.2%) to 6.7 million workers (refer to Chart 2.10 and Chart 2.11), resulting in the share of SME employment to total employment increased from 64.5% in 2015 to 65.3% in 2016 (refer to Chart 2.12) achieving the SME Masterplan target of 65.0% of SME employment to total employment by year 2020.
In terms of SME employment by economic sector, services sector recorded the highest contribution of SME employment with a percentage share of 63.0% followed by manufacturing (16.5%), construction (10.4%), agriculture (9.8%) and mining & quarrying (0.3%). In 2016, the positive growth of SME employment was supported by higher growth of SME employment in the services sector (2.7%) and mining & quarrying sector (7.0%). In the construction sector, both large firms and SMEs registered a decline in employment growth during the year, partly due to lower construction activities and higher foreign worker levy rates charged, effective on 18 March 2016.
Employment of SMEs
Large FirmsNo. of Workers SMEs Total Employment
20120
1,000,000
2,000,000
3,000,000
4,000,000
5,000,000
6,000,000
7,000,000
8,000,000
9,000,000
10,000,000
11,000,000
2013 2014 2015 2016 p
24
CHAPTER 1 THE MALAYSIAN ECONOMY
Chart 2.12: Employment Share of SMEs to Total Employment (%)
p: preliminary
Source: Department of Statistics, Malaysia
p: preliminary
Source: Department of Statistics, Malaysia
CHAPTER 2 SME developments and outlook
Chart 2.11: Employment Growth Performance by Firm Size (%)
2012 2013 2014 2015 2016pAnnual growth, %
SMEsEmployment
Growth
Large FirmsEmployment
Growth
TotalEmployment
Growth
TotalReal GDPGrowth
24.0
-5.5
-1.4
0.4
5.9 5.9
2.1 0.9
5.5 4.76.0 5.0 4.2
10.9
5.46.0
2.13.2
6.3
23.1
5.9
20.0
16.0
12.0
8.0
4.0
0.0
-4.0
-8.0
-12.0
25
Share, %65.5
60.5
57.2 57.5
63.864.5
65.3
55.5
50.52012 2013 2014 2015 2016 p
SME ANNUAL REPORT 2016/17
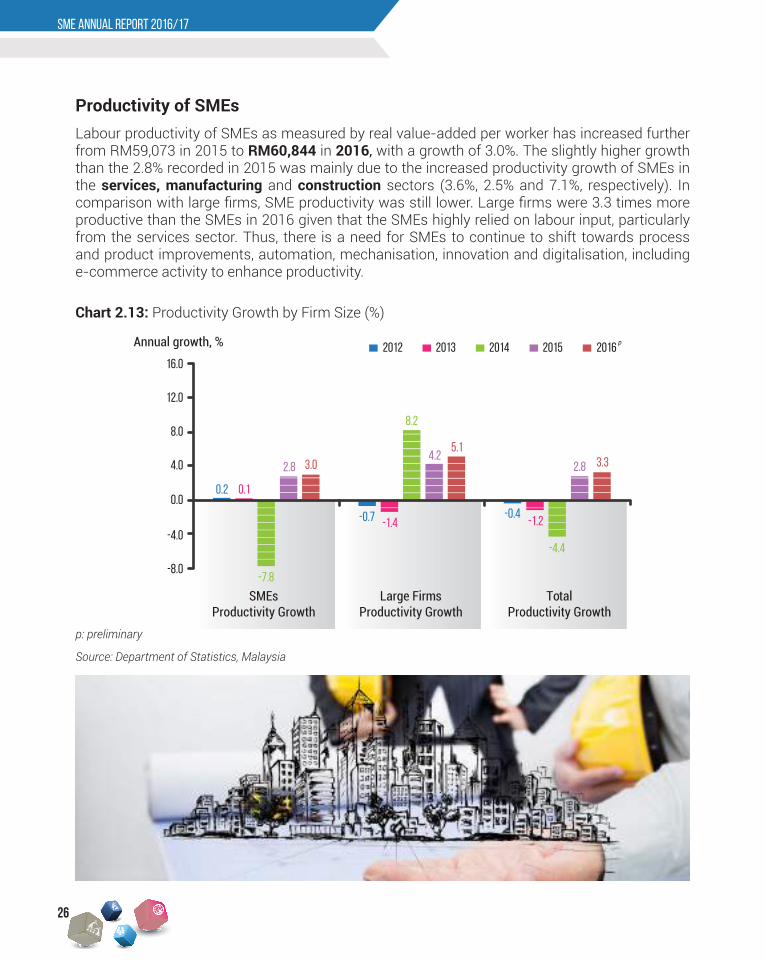
Labour productivity of SMEs as measured by real value-added per worker has increased further from RM59,073 in 2015 to RM60,844 in 2016, with a growth of 3.0%. The slightly higher growth than the 2.8% recorded in 2015 was mainly due to the increased productivity growth of SMEs in the services, manufacturing and construction sectors (3.6%, 2.5% and 7.1%, respectively). In comparison with large firms, SME productivity was still lower. Large firms were 3.3 times more productive than the SMEs in 2016 given that the SMEs highly relied on labour input, particularly from the services sector. Thus, there is a need for SMEs to continue to shift towards process and product improvements, automation, mechanisation, innovation and digitalisation, including e-commerce activity to enhance productivity.
Productivity of SMEs
Chart 2.13: Productivity Growth by Firm Size (%)
p: preliminary
Source: Department of Statistics, Malaysia
16.0
12.0
8.0
4.0
0.0
-4.0
-8.0-7.8
0.2 0.1
2.8 3.0
-0.7 -1.4
8.2
4.25.1
-0.4-1.2
-4.4
2.8 3.3
20162015201420132012
SMEsProductivity Growth
Large FirmsProductivity Growth
TotalProductivity Growth
Annual growth, % p
26

CHAPTER 1 THE MALAYSIAN ECONOMYCHAPTER 2 SME developments and outlook
Chart 2.15: Productivity of Firms by Size
p: preliminary
Source: Department of Statistics, Malaysia
Chart 2.14: Growth of SME GDP, SME Employment and SME Productivity (%)
p: preliminary
Source: Department of Statistics, Malaysia
300,000
250,000
200,000
150,000
100,000
50,000
2012 2013 2014 2015 20160
RM/ worker
SMEs Productivity Large Firms Productivity
p
Annual growth, %
2001-2.0
0.0
2.0
4.0
6.0
8.05.4 5.8
6.8
5.3 5.66.3
4.8
-1.5
7.4
5.3 5.5 4.76.0
5.0 4.2
5.26.1
13.5
7.96.46.0
7.38.3
6.5
0.2
10.0
6.46.9
8.3
5.24.6
-0.4
0.5
2
1
10.0
12.0
14.0
2002 2003 2004 2005 2006 2007 2008 2009
SME GDP Overall GDP
2010 2011 2012 2013 2014 2015 2016p
Partly due to theredefinition of SMEs
20114.0
5.0
6.0
7.0
8.0
9.0
10.0
2012 2013 2014 2015
6.86.45.95.8
5.6
2016 p1
Wholesale & retail trade, F&B and accommodation
Transport & storage and information &communicationOverall services
Other services
Finance, insurance, real estate and business services
Annual growth, %
Annual growth, %
20110.0
5.0
10.0
15.o
2012 2013 2014 2015 2016
6.25.44.8
2.8
1 p
Petroleum, chemical, rubber and plastic products
Food, beverages and tobaccoNon-metalic mineral products, basic metal and fabricated metal products
Overall manufacturing
Other manufacturing
2011 2012 2013 2014 2015
-3.0-2.4-1.7
1.6
2016 p1
10.0
5.0
0.0
-5
-10
Annual growth, %
Crops and livestock Fishing Forestry & logging Overall agriculture
Annual growth, %18.0
16.0
14.0
12.0
10.0
8.0
6.0
4.0
2.0
2011 2012 2013 2014 2015 2016
6.8
8.2
0.0p1
Construction Mining & Quarrying
Annual growth, %
Partly due to theredefinition of SMEs
25.0
20.0
15.0
10.0
5.0
0.0
-5.0
-10.0
2012 2014 2015 2016p
SME Employment SME GDPSME Productivity
13.0
11.0
9.0
7.0
5.0
3.0
1.0
-1.0
10.0
8.0
6.0
4.0
2.0
0.0
-2.02011 2012 2013 2014 2016
4.0
7.57.89.2
-4.0
-6.0
-8.0
2011 2013 2014 2015 2016
1.8
6.6
p
Annual growth, %
Annual growth, %
SME Exports
Tourist ArrivalsOverall Services Exports
Tourist ReceiptsSME Services Exports
Overall Exports
2015
14.0
8.3
5.85.4
0.54.6
-0.4
5.2
6.85.3 5.6
6.34.8
6.96.4
10.0
6.5
0.2
-1.5
8.37.3
6.0 6.4
7.4
5.3 5.5 4.76.0
5.0 4.2
5.26.1
13.5
7.9
12.0
10.0
8.0
6.0
4.0
2.0
0.0
-2.02001 2002 2003 2004 2005 2006 2007 2008 2009 2010 2011 2012 2013 2014 2015 2016 2017
Annual growth, %
p e
2
1
Overall GDP
6.0% or more
Partly due to theredefinition of SMEs
More than 4.8%
SME GDP
Annual growth, %
Index
4.0
3.0
2.0
1.0
0.0
-1.0
-2.0
125.0
105.0
99.7
q1 q2
2013
q3 q4 q1 q2
2014
q3 q4 q1 q2
2015
q3 q4 q1 q2 q1
1.3
1.1
-1.0
q2
2016 2017
q3 q4
p
140.0
120.0
100.0
80.0
60.0q1 q2
2013
q3 q4 q1 q2
2014
q3 q4 q1 q2
2015
q3 q4 q1 q2 q1 q2
2016 2017
q3 q4
Leading Index
4.8
2013
2012
MIER Business Conditions IndexMIER Consumer Sentiments Index
114.1
80.7
160.0
120.0
140.0
100.0
80.0
60.0q1 q2
2013
q3 q4 q1 q2
2014
q3 q4 q1 q2
2015
q3 q4 q1 q2 q1 q2
2016 2017
q3 q4
MIER Retail Trade IndexMIER Tourism Market IndexMIER Auto Industry Index
Index
27

SME ANNUAL REPORT 2016/17
Exports of SMEs
Despite the challenging economic environment, exports of SMEs increased by 6.6% in 2016, rebounded from 0.1% decline in 2015 (refer to Chart 2.16). The strong performance of SME exports was underpinned by growth in the manufacturing (4.6%), services (7.8%) and agriculture (35.0%) sectors.
In terms of share, exports of SMEs contributed about 18.6% to total exports in 2016 (2015: 17.7%), whereby 9.4 percentage points was from services sector while the remaining 9.2 percentage points was derived from manufacturing and agriculture sectors (refer to Chart 2.17). The exports of SMEs in services sector were mainly supported by a strong rebound in tourist arrivals and receipts. The tourist arrivals growth rebounded to 4.0% in 2016 as the country received 26.8 million tourists compared to 25.7 million tourists in 2015 (refer to Chart 2.18).
Chart 2.16: SME Exports Growth (%)
p: preliminary
Source: Department of Statistics, Malaysia
Annual growth, %
2001-2.0
0.0
2.0
4.0
6.0
8.05.4 5.8
6.8
5.3 5.66.3
4.8
-1.5
7.4
5.3 5.5 4.76.0
5.0 4.2
5.26.1
13.5
7.96.46.0
7.38.3
6.5
0.2
10.0
6.46.9
8.3
5.24.6
-0.4
0.5
2
1
10.0
12.0
14.0
2002 2003 2004 2005 2006 2007 2008 2009
SME GDP Overall GDP
2010 2011 2012 2013 2014 2015 2016p
Partly due to theredefinition of SMEs
20114.0
5.0
6.0
7.0
8.0
9.0
10.0
2012 2013 2014 2015
6.86.45.95.8
5.6
2016 p1
Wholesale & retail trade, F&B and accommodation
Transport & storage and information &communicationOverall services
Other services
Finance, insurance, real estate and business services
Annual growth, %
Annual growth, %
20110.0
5.0
10.0
15.o
2012 2013 2014 2015 2016
6.25.44.8
2.8
1 p
Petroleum, chemical, rubber and plastic products
Food, beverages and tobaccoNon-metalic mineral products, basic metal and fabricated metal products
Overall manufacturing
Other manufacturing
2011 2012 2013 2014 2015
-3.0-2.4-1.7
1.6
2016 p1
10.0
5.0
0.0
-5
-10
Annual growth, %
Crops and livestock Fishing Forestry & logging Overall agriculture
Annual growth, %18.0
16.0
14.0
12.0
10.0
8.0
6.0
4.0
2.0
2011 2012 2013 2014 2015 2016
6.8
8.2
0.0p1
Construction Mining & Quarrying
Annual growth, %
Partly due to theredefinition of SMEs
25.0
20.0
15.0
10.0
5.0
0.0
-5.0
-10.0
2012 2014 2015 2016p
SME Employment SME GDPSME Productivity
13.0
11.0
9.0
7.0
5.0
3.0
1.0
-1.0
10.0
8.0
6.0
4.0
2.0
0.0
-2.02011 2012 2013 2014 2016
4.0
7.57.89.2
-4.0
-6.0
-8.0
2011 2013 2014 2015 2016
1.8
6.6
p
Annual growth, %
Annual growth, %
SME Exports
Tourist ArrivalsOverall Services Exports
Tourist ReceiptsSME Services Exports
Overall Exports
2015
14.0
8.3
5.85.4
0.54.6
-0.4
5.2
6.85.3 5.6
6.34.8
6.96.4
10.0
6.5
0.2
-1.5
8.37.3
6.0 6.4
7.4
5.3 5.5 4.76.0
5.0 4.2
5.26.1
13.5
7.9
12.0
10.0
8.0
6.0
4.0
2.0
0.0
-2.02001 2002 2003 2004 2005 2006 2007 2008 2009 2010 2011 2012 2013 2014 2015 2016 2017
Annual growth, %
p e
2
1
Overall GDP
6.0% or more
Partly due to theredefinition of SMEs
More than 4.8%
SME GDP
Annual growth, %
Index
4.0
3.0
2.0
1.0
0.0
-1.0
-2.0
125.0
105.0
99.7
q1 q2
2013
q3 q4 q1 q2
2014
q3 q4 q1 q2
2015
q3 q4 q1 q2 q1
1.3
1.1
-1.0
q2
2016 2017
q3 q4
p
140.0
120.0
100.0
80.0
60.0q1 q2
2013
q3 q4 q1 q2
2014
q3 q4 q1 q2
2015
q3 q4 q1 q2 q1 q2
2016 2017
q3 q4
Leading Index
4.8
2013
2012
MIER Business Conditions IndexMIER Consumer Sentiments Index
114.1
80.7
160.0
120.0
140.0
100.0
80.0
60.0q1 q2
2013
q3 q4 q1 q2
2014
q3 q4 q1 q2
2015
q3 q4 q1 q2 q1 q2
2016 2017
q3 q4
MIER Retail Trade IndexMIER Tourism Market IndexMIER Auto Industry Index
Index
28

CHAPTER 1 THE MALAYSIAN ECONOMY
Chart 2.17: Share of SME Exports by Economic Sector (%)
Chart 2.18: Growth of Tourist Arrivals, Tourist Receipts, Overall Services Exports and SME Services Exports (%)
p: preliminary
Note: Figures may not necessarily add up due to rounding
Source: Department of Statistics, Malaysia
p: preliminary
Source: Department of Statistics, Malaysia
CHAPTER 2 SME developments and outlook
Annual growth, %
2001-2.0
0.0
2.0
4.0
6.0
8.05.4 5.8
6.8
5.3 5.66.3
4.8
-1.5
7.4
5.3 5.5 4.76.0
5.0 4.2
5.26.1
13.5
7.96.46.0
7.38.3
6.5
0.2
10.0
6.46.9
8.3
5.24.6
-0.4
0.5
2
1
10.0
12.0
14.0
2002 2003 2004 2005 2006 2007 2008 2009
SME GDP Overall GDP
2010 2011 2012 2013 2014 2015 2016p
Partly due to theredefinition of SMEs
20114.0
5.0
6.0
7.0
8.0
9.0
10.0
2012 2013 2014 2015
6.86.45.95.8
5.6
2016 p1
Wholesale & retail trade, F&B and accommodation
Transport & storage and information &communicationOverall services
Other services
Finance, insurance, real estate and business services
Annual growth, %
Annual growth, %
20110.0
5.0
10.0
15.o
2012 2013 2014 2015 2016
6.25.44.8
2.8
1 p
Petroleum, chemical, rubber and plastic products
Food, beverages and tobaccoNon-metalic mineral products, basic metal and fabricated metal products
Overall manufacturing
Other manufacturing
2011 2012 2013 2014 2015
-3.0-2.4-1.7
1.6
2016 p1
10.0
5.0
0.0
-5
-10
Annual growth, %
Crops and livestock Fishing Forestry & logging Overall agriculture
Annual growth, %18.0
16.0
14.0
12.0
10.0
8.0
6.0
4.0
2.0
2011 2012 2013 2014 2015 2016
6.8
8.2
0.0p1
Construction Mining & Quarrying
Annual growth, %
Partly due to theredefinition of SMEs
25.0
20.0
15.0
10.0
5.0
0.0
-5.0
-10.0
2012 2014 2015 2016p
SME Employment SME GDPSME Productivity
13.0
11.0
9.0
7.0
5.0
3.0
1.0
-1.0
10.0
8.0
6.0
4.0
2.0
0.0
-2.02011 2012 2013 2014 2016
4.0
7.57.89.2
-4.0
-6.0
-8.0
2011 2013 2014 2015 2016
1.8
6.6
p
Annual growth, %
Annual growth, %
SME Exports
Tourist ArrivalsOverall Services Exports
Tourist ReceiptsSME Services Exports
Overall Exports
2015
14.0
8.3
5.85.4
0.54.6
-0.4
5.2
6.85.3 5.6
6.34.8
6.96.4
10.0
6.5
0.2
-1.5
8.37.3
6.0 6.4
7.4
5.3 5.5 4.76.0
5.0 4.2
5.26.1
13.5
7.9
12.0
10.0
8.0
6.0
4.0
2.0
0.0
-2.02001 2002 2003 2004 2005 2006 2007 2008 2009 2010 2011 2012 2013 2014 2015 2016 2017
Annual growth, %
p e
2
1
Overall GDP
6.0% or more
Partly due to theredefinition of SMEs
More than 4.8%
SME GDP
Annual growth, %
Index
4.0
3.0
2.0
1.0
0.0
-1.0
-2.0
125.0
105.0
99.7
q1 q2
2013
q3 q4 q1 q2
2014
q3 q4 q1 q2
2015
q3 q4 q1 q2 q1
1.3
1.1
-1.0
q2
2016 2017
q3 q4
p
140.0
120.0
100.0
80.0
60.0q1 q2
2013
q3 q4 q1 q2
2014
q3 q4 q1 q2
2015
q3 q4 q1 q2 q1 q2
2016 2017
q3 q4
Leading Index
4.8
2013
2012
MIER Business Conditions IndexMIER Consumer Sentiments Index
114.1
80.7
160.0
120.0
140.0
100.0
80.0
60.0q1 q2
2013
q3 q4 q1 q2
2014
q3 q4 q1 q2
2015
q3 q4 q1 q2 q1 q2
2016 2017
q3 q4
MIER Retail Trade IndexMIER Tourism Market IndexMIER Auto Industry Index
Index
29
Agriculture ServicesShare of SME exports to total exports
Manufacturing
Share of SME Exports to Total Exports, %
20.0
16.9 17.5 17.8 17.8 17.718.6
18.0
16.0
14.0
12.0
10.0
8.0
6.0
4.0
2.0
0.02011 2012 2013 2014 2015 2016
8.8
0.2
7.8
8.8
9.4
0.3
8.9
0.20.20.20.2
9.18.98.4
8.98.68.58.6
p

SME ANNUAL REPORT 2016/17
Chart 2.19: Growth Projections of SME GDP and Overall GDP (%)
Outlook for SMEs in 2017
Going forward, given the strong growth performance of the Malaysian economy in the first half of 2017 at 5.7%, the economy is expected to expand by more than 4.8% in 2017, higher than the earlier official growth projection of between 4.3 - 4.8% announced in March 2017 (refer to Chart 2.19).
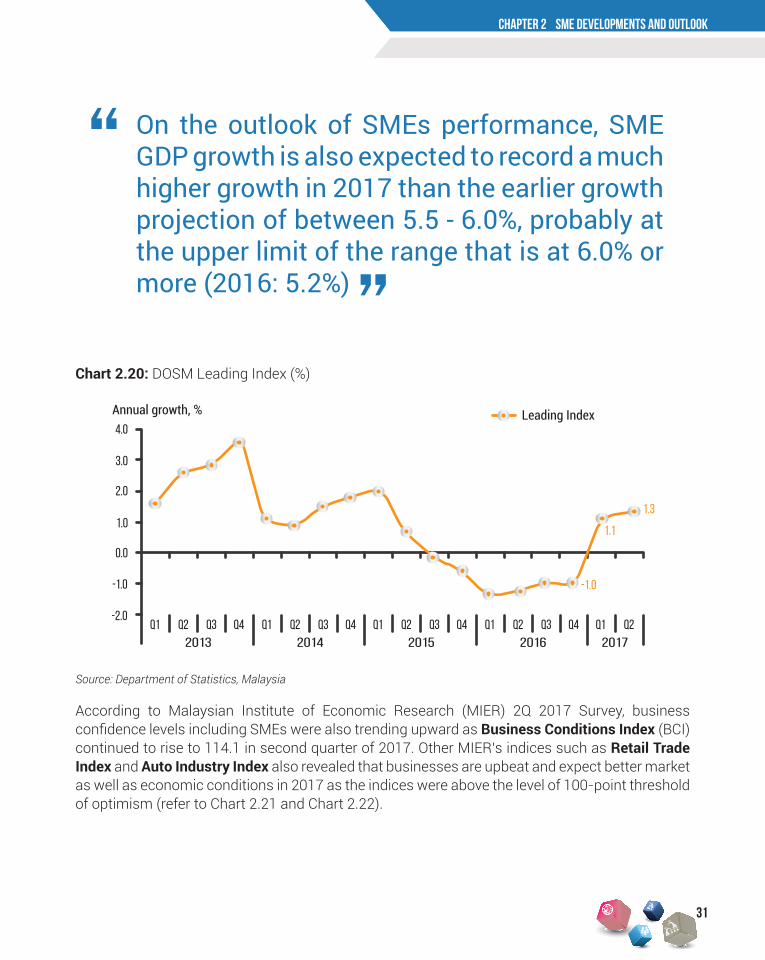
On the outlook of SMEs performance, SME GDP growth is also expected to record a much higher growth in 2017 than the earlier growth projection of between 5.5 - 6.0%, probably at the upper limit of the range that is at 6.0% or more (2016: 5.2%). Based on past performance, SME GDP growth is expected to record, on average, one percentage point higher than the overall GDP growth. The new SME GDP growth projection for 2017 will be revised once the new official Malaysia’s economic growth estimate for 2017 is released during the Budget 2018 announcement.
The higher expected growth will be supported by domestic demand and stronger-than-expected improvement in global growth benefiting exports. Given that the SMEs’ performance is closely linked with domestic demand and tourism activity, the anticipated pick-up in private consumption activities and increase in tourism-related activities are expected to feature more robust growth performance of SMEs in 2017.
Meanwhile, DOSM’s leading index, which is the leading economic indicator for the country’s performance, registered a higher growth of 1.3% in the second quarter of 2017 compared to the same quarter a year ago indicating that the economic activity will continue to expand in the second half of 2017.
1Growth based on 2014 New SME Definition versus 2013 Old SME Definition2Growth based on 2014 New SME Definition versus 2013 New SME Definition
p: preliminary, e: estimate
Source: Department of Statistics, Malaysia and SME Corp. Malaysia
Annual growth, %
2001-2.0
0.0
2.0
4.0
6.0
8.05.4 5.8
6.8
5.3 5.66.3
4.8
-1.5
7.4
5.3 5.5 4.76.0
5.0 4.2
5.26.1
13.5
7.96.46.0
7.38.3
6.5
0.2
10.0
6.46.9
8.3
5.24.6
-0.4
0.5
2
1
10.0
12.0
14.0
2002 2003 2004 2005 2006 2007 2008 2009
SME GDP Overall GDP
2010 2011 2012 2013 2014 2015 2016p
Partly due to theredefinition of SMEs
20114.0
5.0
6.0
7.0
8.0
9.0
10.0
2012 2013 2014 2015
6.86.45.95.8
5.6
2016 p1
Wholesale & retail trade, F&B and accommodation
Transport & storage and information &communicationOverall services
Other services
Finance, insurance, real estate and business services
Annual growth, %
Annual growth, %
20110.0
5.0
10.0
15.o
2012 2013 2014 2015 2016
6.25.44.8
2.8
1 p
Petroleum, chemical, rubber and plastic products
Food, beverages and tobaccoNon-metalic mineral products, basic metal and fabricated metal products
Overall manufacturing
Other manufacturing
2011 2012 2013 2014 2015
-3.0-2.4-1.7
1.6
2016 p1
10.0
5.0
0.0
-5
-10
Annual growth, %
Crops and livestock Fishing Forestry & logging Overall agriculture
Annual growth, %18.0
16.0
14.0
12.0
10.0
8.0
6.0
4.0
2.0
2011 2012 2013 2014 2015 2016
6.8
8.2
0.0p1
Construction Mining & Quarrying
Annual growth, %
Partly due to theredefinition of SMEs
25.0
20.0
15.0
10.0
5.0
0.0
-5.0
-10.0
2012 2014 2015 2016p
SME Employment SME GDPSME Productivity
13.0
11.0
9.0
7.0
5.0
3.0
1.0
-1.0
10.0
8.0
6.0
4.0
2.0
0.0
-2.02011 2012 2013 2014 2016
4.0
7.57.89.2
-4.0
-6.0
-8.0
2011 2013 2014 2015 2016
1.8
6.6
p
Annual growth, %
Annual growth, %
SME Exports
Tourist ArrivalsOverall Services Exports
Tourist ReceiptsSME Services Exports
Overall Exports
2015
14.0
8.3
5.85.4
0.54.6
-0.4
5.2
6.85.3 5.6
6.34.8
6.96.4
10.0
6.5
0.2
-1.5
8.37.3
6.0 6.4
7.4
5.3 5.5 4.76.0
5.0 4.2
5.26.1
13.5
7.9
12.0
10.0
8.0
6.0
4.0
2.0
0.0
-2.02001 2002 2003 2004 2005 2006 2007 2008 2009 2010 2011 2012 2013 2014 2015 2016 2017
Annual growth, %
p e
2
1
Overall GDP
6.0% or more
Partly due to theredefinition of SMEs
More than 4.8%
SME GDP
Annual growth, %
Index
4.0
3.0
2.0
1.0
0.0
-1.0
-2.0
125.0
105.0
99.7
q1 q2
2013
q3 q4 q1 q2
2014
q3 q4 q1 q2
2015
q3 q4 q1 q2 q1
1.3
1.1
-1.0
q2
2016 2017
q3 q4
p
140.0
120.0
100.0
80.0
60.0q1 q2
2013
q3 q4 q1 q2
2014
q3 q4 q1 q2
2015
q3 q4 q1 q2 q1 q2
2016 2017
q3 q4
Leading Index
4.8
2013
2012
MIER Business Conditions IndexMIER Consumer Sentiments Index
114.1
80.7
160.0
120.0
140.0
100.0
80.0
60.0q1 q2
2013
q3 q4 q1 q2
2014
q3 q4 q1 q2
2015
q3 q4 q1 q2 q1 q2
2016 2017
q3 q4
MIER Retail Trade IndexMIER Tourism Market IndexMIER Auto Industry Index
Index
30
CHAPTER 1 THE MALAYSIAN ECONOMY
Chart 2.20: DOSM Leading Index (%)
Source: Department of Statistics, Malaysia
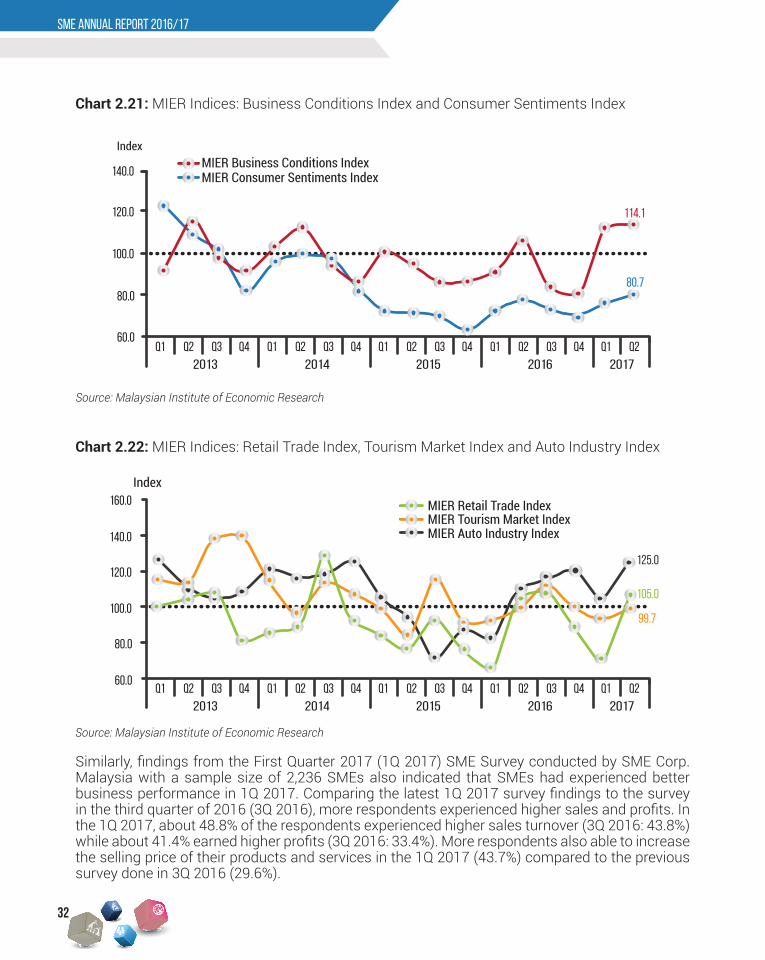
According to Malaysian Institute of Economic Research (MIER) 2Q 2017 Survey, business confidence levels including SMEs were also trending upward as Business Conditions Index (BCI) continued to rise to 114.1 in second quarter of 2017. Other MIER’s indices such as Retail Trade Index and Auto Industry Index also revealed that businesses are upbeat and expect better market as well as economic conditions in 2017 as the indices were above the level of 100-point threshold of optimism (refer to Chart 2.21 and Chart 2.22).
CHAPTER 2 SME developments and outlook
Annual growth, %
2001-2.0
0.0
2.0
4.0
6.0
8.05.4 5.8
6.8
5.3 5.66.3
4.8
-1.5
7.4
5.3 5.5 4.76.0
5.0 4.2
5.26.1
13.5
7.96.46.0
7.38.3
6.5
0.2
10.0
6.46.9
8.3
5.24.6
-0.4
0.5
2
1
10.0
12.0
14.0
2002 2003 2004 2005 2006 2007 2008 2009
SME GDP Overall GDP
2010 2011 2012 2013 2014 2015 2016p
Partly due to theredefinition of SMEs
20114.0
5.0
6.0
7.0
8.0
9.0
10.0
2012 2013 2014 2015
6.86.45.95.8
5.6
2016 p1
Wholesale & retail trade, F&B and accommodation
Transport & storage and information &communicationOverall services
Other services
Finance, insurance, real estate and business services
Annual growth, %
Annual growth, %
20110.0
5.0
10.0
15.o
2012 2013 2014 2015 2016
6.25.44.8
2.8
1 p
Petroleum, chemical, rubber and plastic products
Food, beverages and tobaccoNon-metalic mineral products, basic metal and fabricated metal products
Overall manufacturing
Other manufacturing
2011 2012 2013 2014 2015
-3.0-2.4-1.7
1.6
2016 p1
10.0
5.0
0.0
-5
-10
Annual growth, %
Crops and livestock Fishing Forestry & logging Overall agriculture
Annual growth, %18.0
16.0
14.0
12.0
10.0
8.0
6.0
4.0
2.0
2011 2012 2013 2014 2015 2016
6.8
8.2
0.0p1
Construction Mining & Quarrying
Annual growth, %
Partly due to theredefinition of SMEs
25.0
20.0
15.0
10.0
5.0
0.0
-5.0
-10.0
2012 2014 2015 2016p
SME Employment SME GDPSME Productivity
13.0
11.0
9.0
7.0
5.0
3.0
1.0
-1.0
10.0
8.0
6.0
4.0
2.0
0.0
-2.02011 2012 2013 2014 2016
4.0
7.57.89.2
-4.0
-6.0
-8.0
2011 2013 2014 2015 2016
1.8
6.6
p
Annual growth, %
Annual growth, %
SME Exports
Tourist ArrivalsOverall Services Exports
Tourist ReceiptsSME Services Exports
Overall Exports
2015
14.0
8.3
5.85.4
0.54.6
-0.4
5.2
6.85.3 5.6
6.34.8
6.96.4
10.0
6.5
0.2
-1.5
8.37.3
6.0 6.4
7.4
5.3 5.5 4.76.0
5.0 4.2
5.26.1
13.5
7.9
12.0
10.0
8.0
6.0
4.0
2.0
0.0
-2.02001 2002 2003 2004 2005 2006 2007 2008 2009 2010 2011 2012 2013 2014 2015 2016 2017
Annual growth, %
p e
2
1
Overall GDP
6.0% or more
Partly due to theredefinition of SMEs
More than 4.8%
SME GDP
Annual growth, %
Index
4.0
3.0
2.0
1.0
0.0
-1.0
-2.0
125.0
105.0
99.7
q1 q2
2013
q3 q4 q1 q2
2014
q3 q4 q1 q2
2015
q3 q4 q1 q2 q1
1.3
1.1
-1.0
q2
2016 2017
q3 q4
p
140.0
120.0
100.0
80.0
60.0q1 q2
2013
q3 q4 q1 q2
2014
q3 q4 q1 q2
2015
q3 q4 q1 q2 q1 q2
2016 2017
q3 q4
Leading Index
4.8
2013
2012
MIER Business Conditions IndexMIER Consumer Sentiments Index
114.1
80.7
160.0
120.0
140.0
100.0
80.0
60.0q1 q2
2013
q3 q4 q1 q2
2014
q3 q4 q1 q2
2015
q3 q4 q1 q2 q1 q2
2016 2017
q3 q4
MIER Retail Trade IndexMIER Tourism Market IndexMIER Auto Industry Index
Index
On the outlook of SMEs performance, SME GDP growth is also expected to record a much higher growth in 2017 than the earlier growth projection of between 5.5 - 6.0%, probably at the upper limit of the range that is at 6.0% or more (2016: 5.2%)
“
”
31
SME ANNUAL REPORT 2016/17
Similarly, findings from the First Quarter 2017 (1Q 2017) SME Survey conducted by SME Corp. Malaysia with a sample size of 2,236 SMEs also indicated that SMEs had experienced better business performance in 1Q 2017. Comparing the latest 1Q 2017 survey findings to the survey in the third quarter of 2016 (3Q 2016), more respondents experienced higher sales and profits. In the 1Q 2017, about 48.8% of the respondents experienced higher sales turnover (3Q 2016: 43.8%) while about 41.4% earned higher profits (3Q 2016: 33.4%). More respondents also able to increase the selling price of their products and services in the 1Q 2017 (43.7%) compared to the previous survey done in 3Q 2016 (29.6%).
Chart 2.22: MIER Indices: Retail Trade Index, Tourism Market Index and Auto Industry Index
Source: Malaysian Institute of Economic Research
Annual growth, %
2001-2.0
0.0
2.0
4.0
6.0
8.05.4 5.8
6.8
5.3 5.66.3
4.8
-1.5
7.4
5.3 5.5 4.76.0
5.0 4.2
5.26.1
13.5
7.96.46.0
7.38.3
6.5
0.2
10.0
6.46.9
8.3
5.24.6
-0.4
0.5
2
1
10.0
12.0
14.0
2002 2003 2004 2005 2006 2007 2008 2009
SME GDP Overall GDP
2010 2011 2012 2013 2014 2015 2016p
Partly due to theredefinition of SMEs
20114.0
5.0
6.0
7.0
8.0
9.0
10.0
2012 2013 2014 2015
6.86.45.95.8
5.6
2016 p1
Wholesale & retail trade, F&B and accommodation
Transport & storage and information &communicationOverall services
Other services
Finance, insurance, real estate and business services
Annual growth, %
Annual growth, %
20110.0
5.0
10.0
15.o
2012 2013 2014 2015 2016
6.25.44.8
2.8
1 p
Petroleum, chemical, rubber and plastic products
Food, beverages and tobaccoNon-metalic mineral products, basic metal and fabricated metal products
Overall manufacturing
Other manufacturing
2011 2012 2013 2014 2015
-3.0-2.4-1.7
1.6
2016 p1
10.0
5.0
0.0
-5
-10
Annual growth, %
Crops and livestock Fishing Forestry & logging Overall agriculture
Annual growth, %18.0
16.0
14.0
12.0
10.0
8.0
6.0
4.0
2.0
2011 2012 2013 2014 2015 2016
6.8
8.2
0.0p1
Construction Mining & Quarrying
Annual growth, %
Partly due to theredefinition of SMEs
25.0
20.0
15.0
10.0
5.0
0.0
-5.0
-10.0
2012 2014 2015 2016p
SME Employment SME GDPSME Productivity
13.0
11.0
9.0
7.0
5.0
3.0
1.0
-1.0
10.0
8.0
6.0
4.0
2.0
0.0
-2.02011 2012 2013 2014 2016
4.0
7.57.89.2
-4.0
-6.0
-8.0
2011 2013 2014 2015 2016
1.8
6.6
p
Annual growth, %
Annual growth, %
SME Exports
Tourist ArrivalsOverall Services Exports
Tourist ReceiptsSME Services Exports
Overall Exports
2015
14.0
8.3
5.85.4
0.54.6
-0.4
5.2
6.85.3 5.6
6.34.8
6.96.4
10.0
6.5
0.2
-1.5
8.37.3
6.0 6.4
7.4
5.3 5.5 4.76.0
5.0 4.2
5.26.1
13.5
7.9
12.0
10.0
8.0
6.0
4.0
2.0
0.0
-2.02001 2002 2003 2004 2005 2006 2007 2008 2009 2010 2011 2012 2013 2014 2015 2016 2017
Annual growth, %
p e
2
1
Overall GDP
6.0% or more
Partly due to theredefinition of SMEs
More than 4.8%
SME GDP
Annual growth, %
Index
4.0
3.0
2.0
1.0
0.0
-1.0
-2.0
125.0
105.0
99.7
q1 q2
2013
q3 q4 q1 q2
2014
q3 q4 q1 q2
2015
q3 q4 q1 q2 q1
1.3
1.1
-1.0
q2
2016 2017
q3 q4
p
140.0
120.0
100.0
80.0
60.0q1 q2
2013
q3 q4 q1 q2
2014
q3 q4 q1 q2
2015
q3 q4 q1 q2 q1 q2
2016 2017
q3 q4
Leading Index
4.8
2013
2012
MIER Business Conditions IndexMIER Consumer Sentiments Index
114.1
80.7
160.0
120.0
140.0
100.0
80.0
60.0q1 q2
2013
q3 q4 q1 q2
2014
q3 q4 q1 q2
2015
q3 q4 q1 q2 q1 q2
2016 2017
q3 q4
MIER Retail Trade IndexMIER Tourism Market IndexMIER Auto Industry Index
IndexChart 2.21: MIER Indices: Business Conditions Index and Consumer Sentiments Index
Source: Malaysian Institute of Economic Research
Annual growth, %
2001-2.0
0.0
2.0
4.0
6.0
8.05.4 5.8
6.8
5.3 5.66.3
4.8
-1.5
7.4
5.3 5.5 4.76.0
5.0 4.2
5.26.1
13.5
7.96.46.0
7.38.3
6.5
0.2
10.0
6.46.9
8.3
5.24.6
-0.4
0.5
2
1
10.0
12.0
14.0
2002 2003 2004 2005 2006 2007 2008 2009
SME GDP Overall GDP
2010 2011 2012 2013 2014 2015 2016p
Partly due to theredefinition of SMEs
20114.0
5.0
6.0
7.0
8.0
9.0
10.0
2012 2013 2014 2015
6.86.45.95.8
5.6
2016 p1
Wholesale & retail trade, F&B and accommodation
Transport & storage and information &communicationOverall services
Other services
Finance, insurance, real estate and business services
Annual growth, %
Annual growth, %
20110.0
5.0
10.0
15.o
2012 2013 2014 2015 2016
6.25.44.8
2.8
1 p
Petroleum, chemical, rubber and plastic products
Food, beverages and tobaccoNon-metalic mineral products, basic metal and fabricated metal products
Overall manufacturing
Other manufacturing
2011 2012 2013 2014 2015
-3.0-2.4-1.7
1.6
2016 p1
10.0
5.0
0.0
-5
-10
Annual growth, %
Crops and livestock Fishing Forestry & logging Overall agriculture
Annual growth, %18.0
16.0
14.0
12.0
10.0
8.0
6.0
4.0
2.0
2011 2012 2013 2014 2015 2016
6.8
8.2
0.0p1
Construction Mining & Quarrying
Annual growth, %
Partly due to theredefinition of SMEs
25.0
20.0
15.0
10.0
5.0
0.0
-5.0
-10.0
2012 2014 2015 2016p
SME Employment SME GDPSME Productivity
13.0
11.0
9.0
7.0
5.0
3.0
1.0
-1.0
10.0
8.0
6.0
4.0
2.0
0.0
-2.02011 2012 2013 2014 2016
4.0
7.57.89.2
-4.0
-6.0
-8.0
2011 2013 2014 2015 2016
1.8
6.6
p
Annual growth, %
Annual growth, %
SME Exports
Tourist ArrivalsOverall Services Exports
Tourist ReceiptsSME Services Exports
Overall Exports
2015
14.0
8.3
5.85.4
0.54.6
-0.4
5.2
6.85.3 5.6
6.34.8
6.96.4
10.0
6.5
0.2
-1.5
8.37.3
6.0 6.4
7.4
5.3 5.5 4.76.0
5.0 4.2
5.26.1
13.5
7.9
12.0
10.0
8.0
6.0
4.0
2.0
0.0
-2.02001 2002 2003 2004 2005 2006 2007 2008 2009 2010 2011 2012 2013 2014 2015 2016 2017
Annual growth, %
p e
2
1
Overall GDP
6.0% or more
Partly due to theredefinition of SMEs
More than 4.8%
SME GDP
Annual growth, %
Index
4.0
3.0
2.0
1.0
0.0
-1.0
-2.0
125.0
105.0
99.7
q1 q2
2013
q3 q4 q1 q2
2014
q3 q4 q1 q2
2015
q3 q4 q1 q2 q1
1.3
1.1
-1.0
q2
2016 2017
q3 q4
p
140.0
120.0
100.0
80.0
60.0q1 q2
2013
q3 q4 q1 q2
2014
q3 q4 q1 q2
2015
q3 q4 q1 q2 q1 q2
2016 2017
q3 q4
Leading Index
4.8
2013
2012
MIER Business Conditions IndexMIER Consumer Sentiments Index
114.1
80.7
160.0
120.0
140.0
100.0
80.0
60.0q1 q2
2013
q3 q4 q1 q2
2014
q3 q4 q1 q2
2015
q3 q4 q1 q2 q1 q2
2016 2017
q3 q4
MIER Retail Trade IndexMIER Tourism Market IndexMIER Auto Industry Index
Index
32
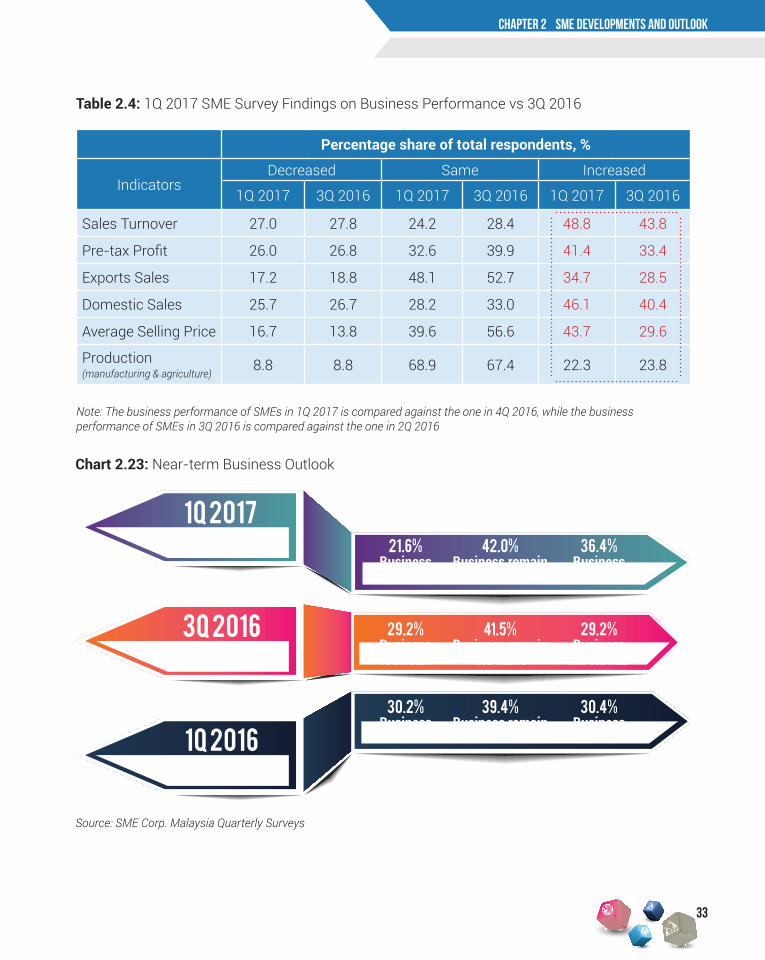
CHAPTER 1 THE MALAYSIAN ECONOMYCHAPTER 2 SME developments and outlook
Table 2.4: 1Q 2017 SME Survey Findings on Business Performance vs 3Q 2016
Note: The business performance of SMEs in 1Q 2017 is compared against the one in 4Q 2016, while the business performance of SMEs in 3Q 2016 is compared against the one in 2Q 2016
Percentage share of total respondents, %
IndicatorsDecreased Same Increased
1Q 2017 3Q 2016 1Q 2017 3Q 2016 1Q 2017 3Q 2016
Sales Turnover 27.0 27.8 24.2 28.4 48.8 43.8
Pre-tax Profit 26.0 26.8 32.6 39.9 41.4 33.4
Exports Sales 17.2 18.8 48.1 52.7 34.7 28.5
Domestic Sales 25.7 26.7 28.2 33.0 46.1 40.4
Average Selling Price 16.7 13.8 39.6 56.6 43.7 29.6
Production (manufacturing & agriculture)
8.8 8.8 68.9 67.4 22.3 23.8
Chart 2.23: Near-term Business Outlook
Source: SME Corp. Malaysia Quarterly Surveys
1q 2017SME Survey 21.6%
BusinessWORSEN
42.0%Business remain
the same
36.4%Business
IMPROVED
29.2%BusinessWORSEN
41.5%Business remain
the same
29.2%Business
IMPROVED
30.2%BusinessWORSEN
39.4%Business remain
the same
30.4%Business
IMPROVED
3q 2016SME Survey
1q 2016SME Survey
33
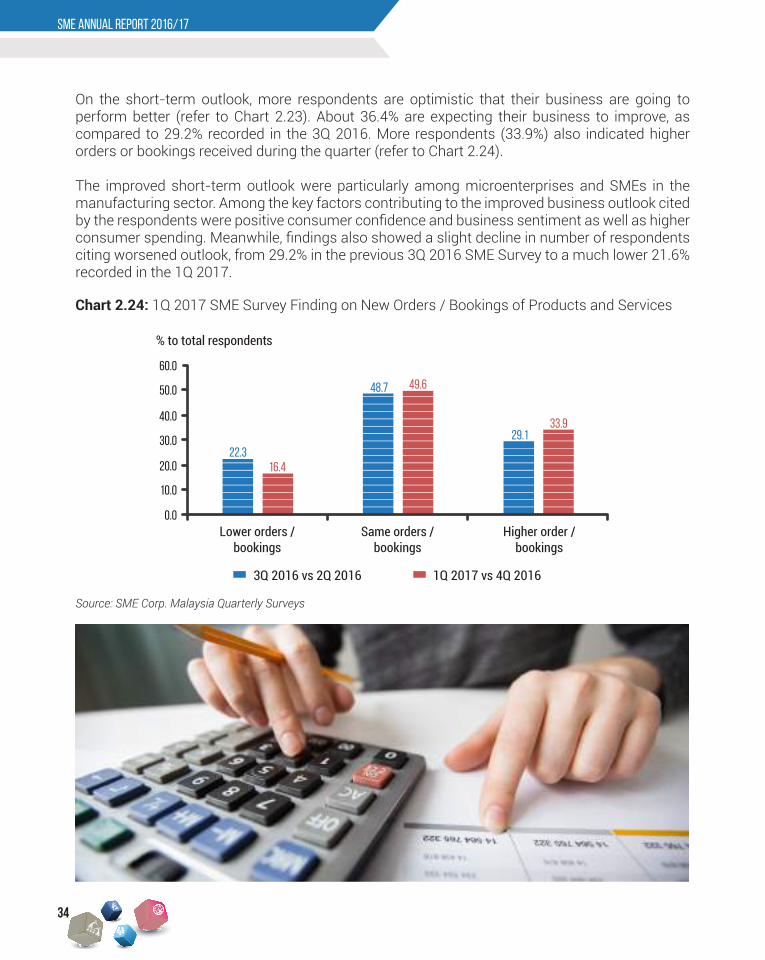
SME ANNUAL REPORT 2016/17
Chart 2.24: 1Q 2017 SME Survey Finding on New Orders / Bookings of Products and Services
Source: SME Corp. Malaysia Quarterly Surveys
Lower orders /bookings
3Q 2016 vs 2Q 2016 1Q 2017 vs 4Q 2016
Same orders /bookings
Higher order /bookings
60.0
50.0
40.0
30.022.3
48.7
29.133.9
16.4
49.6
20.0
10.0
0.0
% to total respondents
On the short-term outlook, more respondents are optimistic that their business are going to perform better (refer to Chart 2.23). About 36.4% are expecting their business to improve, as compared to 29.2% recorded in the 3Q 2016. More respondents (33.9%) also indicated higher orders or bookings received during the quarter (refer to Chart 2.24).
The improved short-term outlook were particularly among microenterprises and SMEs in the manufacturing sector. Among the key factors contributing to the improved business outlook cited by the respondents were positive consumer confidence and business sentiment as well as higher consumer spending. Meanwhile, findings also showed a slight decline in number of respondents citing worsened outlook, from 29.2% in the previous 3Q 2016 SME Survey to a much lower 21.6% recorded in the 1Q 2017.
34