Smartphone Cities - Ofcom · Southampton. These cities were chosen because all four mobile network...
41
Smartphone Cities Measuring 4G mobile broadband and voice performance Research Document Publication date: 16 December 2016
Transcript of Smartphone Cities - Ofcom · Southampton. These cities were chosen because all four mobile network...

Smartphone Cities Measuring 4G mobile broadband and voice
performance
Research Document
Publication date: 16 December 2016
1
About this document This document outlines the results of Ofcom’s research into the performance of the retail networks of the UK’s four national mobile network operators (MNOs): EE, O2, Three and Vodafone. This is our fourth report measuring mobile broadband performance, although the results presented here are not directly comparable with those in our previous reports due to the evolution in our testing methodology. The purpose of this report is to provide consumers with comparable information on the performance of each MNO on 4G services.
In July-October 2016, we tested the 4G services of the operators in seven UK cities: Belfast, Birmingham, Cardiff, Edinburgh, London, Sheffield and Southampton. We chose these cities because they all had 4G coverage from each of the four operators.
As consumers use their smartphones for a variety of purposes every day, this report presents results for: download speeds, web browsing times, upload speeds, YouTube streaming resolution, network response times (measured through ping tests), call quality and call success rates. As two of the most common mobile internet activities, there is a particular focus on download and web browsing performance. A wider range of performance metrics are provided in the supporting chart pack to this document.
The report presents the results of our testing by comparing the performance of mobile network operators by city, time of day, and whether the tests were carried out indoors or outdoors.
It is important to note that the results presented here are limited to a snapshot of performance in the cities visited over the period we tested and do not reflect UK-wide performance of each MNO.
This report is part of a wider programme of work by Ofcom into mobile quality of service, which includes our interactive coverage maps.

2
Contents
Section Page 1 Executive summary 3
2 4G in context 10
3 The metrics we have used 12
4 Understanding the results 14
5 Results: download and web browsing performance 17
6 Results: internet activities 21
7 Time-of-day and indoor vs. outdoor results 27
8 Metrics tables 27
3
Section 1
1 Executive summary Smartphone Cities provides information on 4G mobile network performance across seven UK cities: Belfast, Birmingham, Cardiff, Edinburgh, London, Sheffield, Southampton. These cities were chosen because all four mobile network operators (EE, O2, Three and Vodafone) had rolled out 4G networks there at the time of our testing. The results provide a snapshot of performance between July and October 2016, showing network performance in specific test conditions based on 4G-enabled SIMs which were provisioned to Ofcom from each MNO for testing purposes. Therefore, it is important to bear in mind the specific test conditions when interpreting the results:
- The research is designed to test performance of the operators on the best network service they can offer at a given time at a given place. The 4G SIMs used were uncapped on speed. EE offers 4G tariffs differentiated by speed, and so in the case of EE testing was carried out on a 4G EE Extra tariff, which was uncapped on speed and not an EE standard tariff which is capped, but cheaper than the 4G EE Extra tariff1. Vodafone, O2 and Three do not differentiate on speed (i.e. all tariffs are uncapped on speed), and so testing was carried out on standard 4G SIMs. Consumers should be aware of the tariff they are on as this can affect the performance they experience.
- We tested network performance in seven cities between July to October, meaning that the results are limited only to these locations and time periods and do not represent UK-wide performance more generally.
- We used a Samsung Galaxy S6 Edge+ handset, other handsets may cause differences in performance due to differing levels of technological upgrades and advances.
- All operators carried out varying degrees of maintenance on their networks during our test period which may have affected their results.
- The results are gathered on 4G SIMs and do not represent performance on 3G SIMs. Consumers using 3G SIMs for each of the MNOs, including EE’s Orange and T-Mobile SIMs, will only be able to access 3G services.
- And lastly, the SIMs and handsets we used to test on were all Carrier Aggregation-enabled, which could also affect performance. At the time of testing, EE, Vodafone and O2 had deployed CA technology in the UK. Rollout is at different stages for each of the operators (more information about Carrier Aggregation can be found in section 2).
It is important to note that these metrics are only some of the factors that consumers may wish to take into account when making decisions about their mobile service. Price, handset type, quality of customer service, coverage and contract terms are some of the other relevant aspects.
1 The 4G EE Extra tariff was replaced by an alternative uncapped tariff in August 2016. Tariffs offered by each operator change from time to time. Consumers need to check which each operator for up to date information.

4
Metrics used in this report
Our report focuses on the two key metrics relevant to the consumer experience of mobile broadband - download speed and web browsing performance - before examining performance relating to other internet activities, and voice calls. For our key metrics, we present the average results across all cities, as well as the distributions, to give a more rounded view of performance.
For web browsing performance, we analyse the percentage of occasions when the homepage of three of the most popular consumer websites successfully downloaded within 15 seconds, as well as the average time it took for all information on the homepage to reach the user’s handset. Consumers may not notice small differences in download speed, but are likely to feel frustrated when a web page fails to download at all.
For download speed, we consider the proportion of tests that produced a speed greater than 2Mbit/s in addition to the overall averages, as such speeds are likely to be sufficient to support high-capacity video services. Looking at the distribution gives a better idea of consistency of performance and how the networks respond under stressed conditions.
Summary
Figure 1 shows the headline results for our key metrics at an aggregate level across all cities. We also show the results for the voice call tests here as successfully setting up and maintaining voice calls remains important for many consumers when using their smartphones. The rest of the executive summary presents the results within each city, where there is variation in performance between the operators.
• There was little difference in 4G web browsing speeds and successful web page loading rates across all MNOs, with an average 98% success rate. On average 94% of download tests achieved speeds of over 2Mbit/s.
• The vast majority of download tests achieved speeds of over 2Mbit/s, with the results showing an average download speeds of 21Mbit/s across the seven cities. EE provided the fastest average speed at 32Mbit/s.
• The vast majority of calls were successful throughout our test period, with 99% of calls being completed on Three and Vodafone, 98% on EE and 97% on O2. Results for voice call performance tests were consistent across MNOs and cities and ranged from 95% to 100%.

5
Figure 1: Key metrics scorecard: 4G results
Source: Ofcom mobile broadband measurements, fieldwork July to October 2016. Note: Average (mean for web browsing and median for download speed) of all tests gathered, with 4G as the best bearer. We used 4G SIMs that were uncapped on speed. In the case of EE testing was carried out on an uncapped 4G EE tariff, but EE also offers tariffs which are capped in relation to speed. Vodafone, O2 and Three do not differentiate on speed, and so testing was carried out on standard 4G SIMs. Tariffs offered by each operator can change. Consumers need to check with each operator for up to date information.
City-by-city 4G tariff results
• EE had the most consistent download speed performance in Cardiff, with 98% of tests coming in at greater than 2Mbit/s, which compared to 92% on Three, 90% on Vodafone and 86% on O2.
• EE had the fastest average download speed in Cardiff at 31Mbit/s, followed by Three (21Mbit/s), Vodafone (12Mbit/s) and O2 (11Mbit/s).
• In the web browsing test in Cardiff, the BBC homepage loaded in full on 98% of tests on EE, 97% of tests on Three and Vodafone and 96% of tests on O2.
4G Web browsing speed 4G Download speed Voice call
Average speed Successful loadingAverage speed
Speeds over
2Mbit/s
Success rateBBC Amazon YouTube BBC Amazon YouTube
EE 4 seconds 2 seconds 1 second 99% 99% 100% 32Mbit/s 99% 98%
O2 5 seconds 2 seconds 1 second 97% 98% 99% 13Mbit/s 90% 97%
Three 4 seconds 2 seconds 1 second 98% 98% 99% 18Mbit/s 93% 99%
Vodafone 4 seconds 2 seconds 1 second 98% 98% 99% 18Mbit/s 95% 99%
6
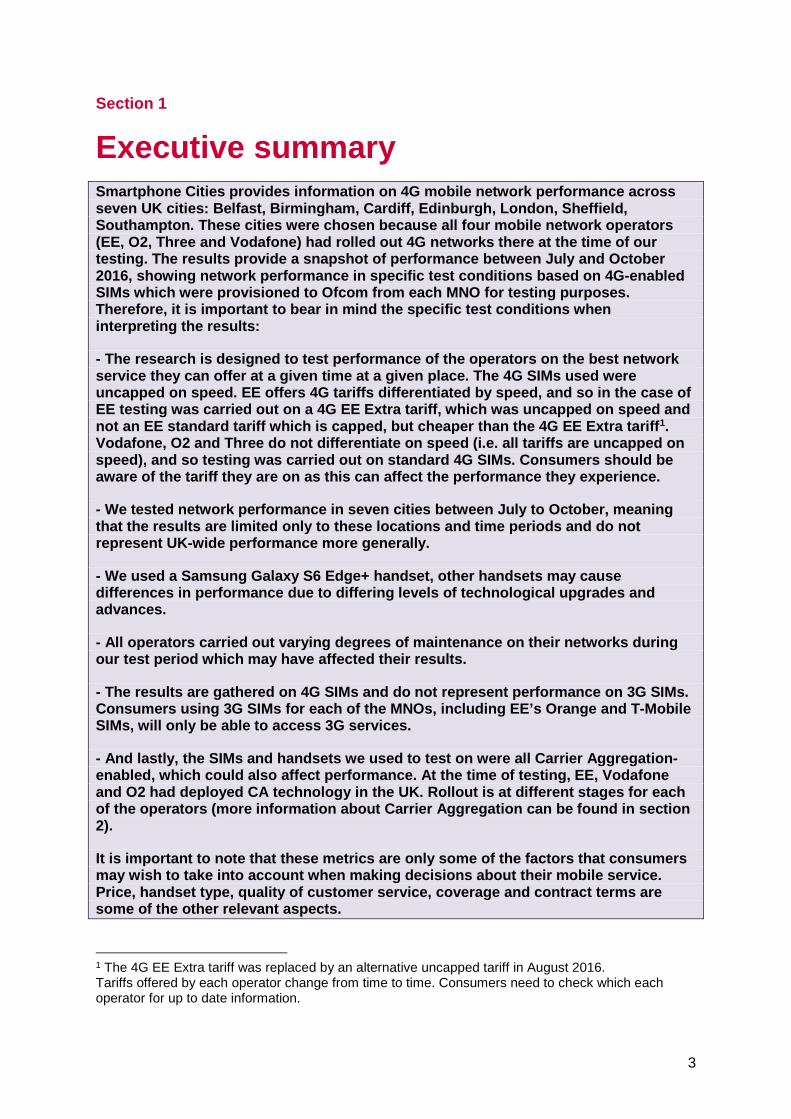
• EE had the most consistent download speed performance in Edinburgh, with 99% of tests coming in at greater than 2Mbit/s, which compared to 98% on O2 and Three and 95% on Vodafone.
• The fastest average download speed in Edinburgh came from EE at 32Mbit/s, followed by Three (19Mbit/s), O2 (17Mbit/s) and Vodafone (15Mbit/s).
• For web browsing performance, the BBC homepage downloaded in full on 100% of occasions for O2, 99% for EE and Three, and on 97% of occasions on Vodafone.
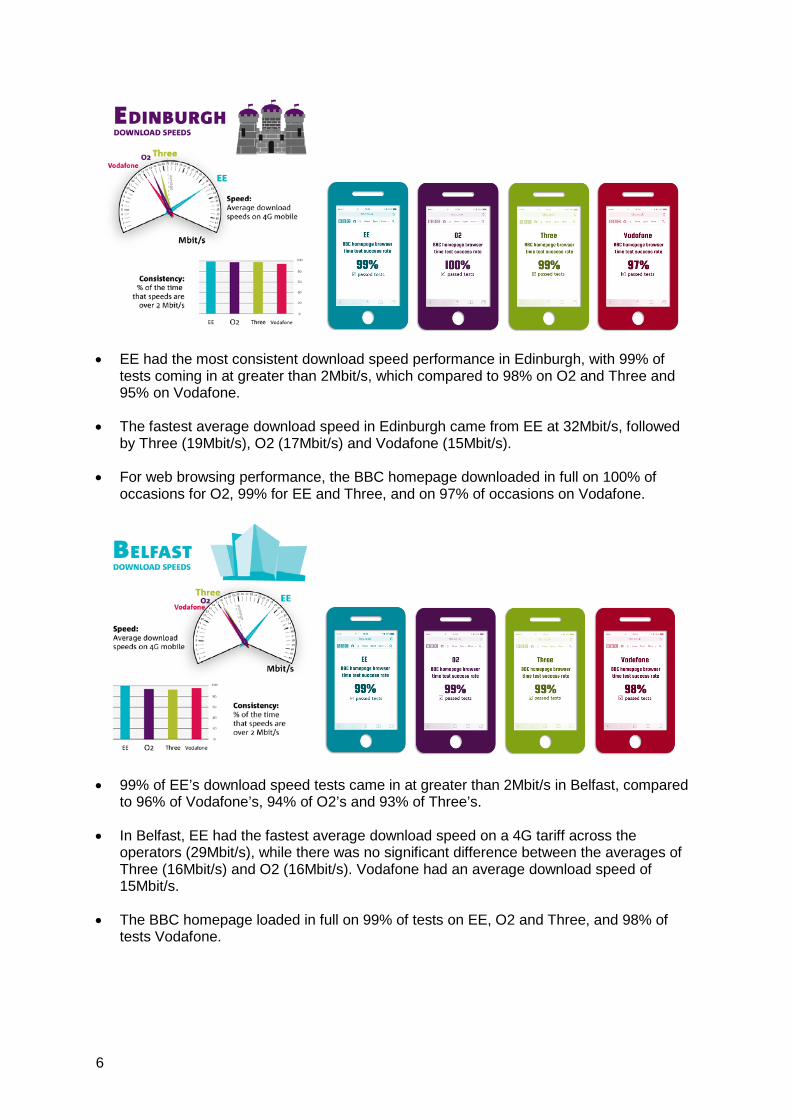
• 99% of EE’s download speed tests came in at greater than 2Mbit/s in Belfast, compared to 96% of Vodafone’s, 94% of O2’s and 93% of Three’s.
• In Belfast, EE had the fastest average download speed on a 4G tariff across the operators (29Mbit/s), while there was no significant difference between the averages of Three (16Mbit/s) and O2 (16Mbit/s). Vodafone had an average download speed of 15Mbit/s.
• The BBC homepage loaded in full on 99% of tests on EE, O2 and Three, and 98% of tests Vodafone.
7
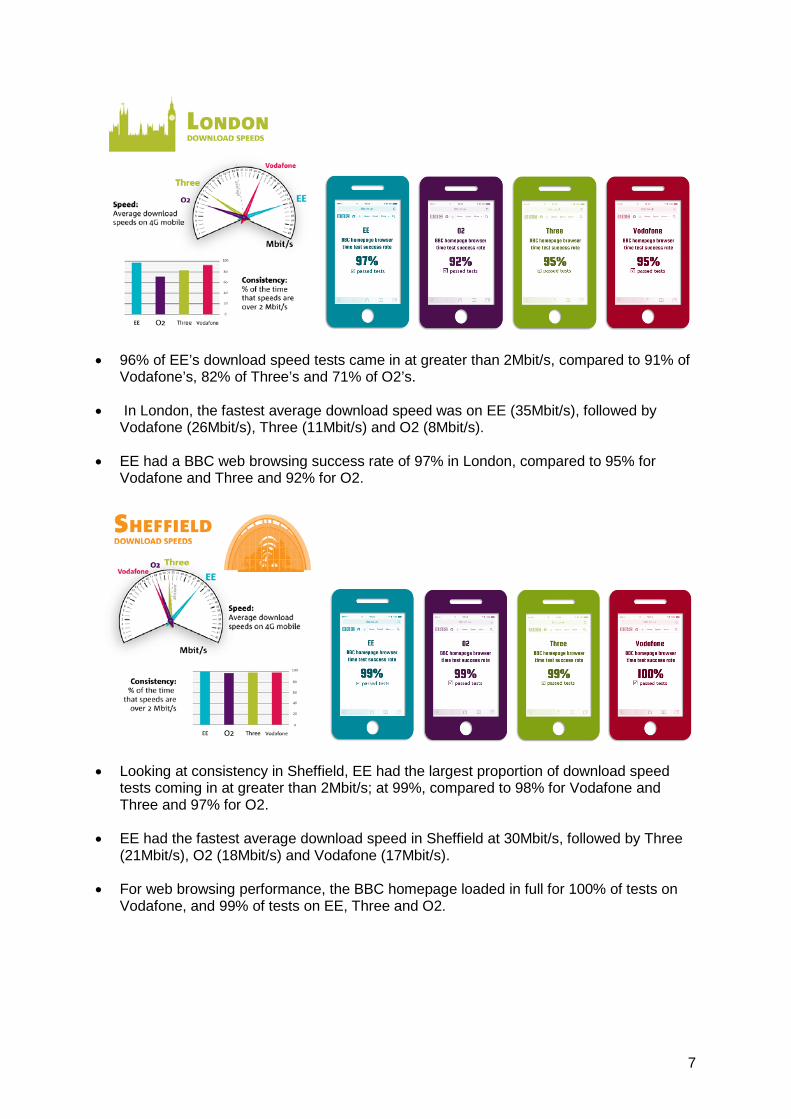
• 96% of EE’s download speed tests came in at greater than 2Mbit/s, compared to 91% of Vodafone’s, 82% of Three’s and 71% of O2’s.
• In London, the fastest average download speed was on EE (35Mbit/s), followed by Vodafone (26Mbit/s), Three (11Mbit/s) and O2 (8Mbit/s).
• EE had a BBC web browsing success rate of 97% in London, compared to 95% for Vodafone and Three and 92% for O2.
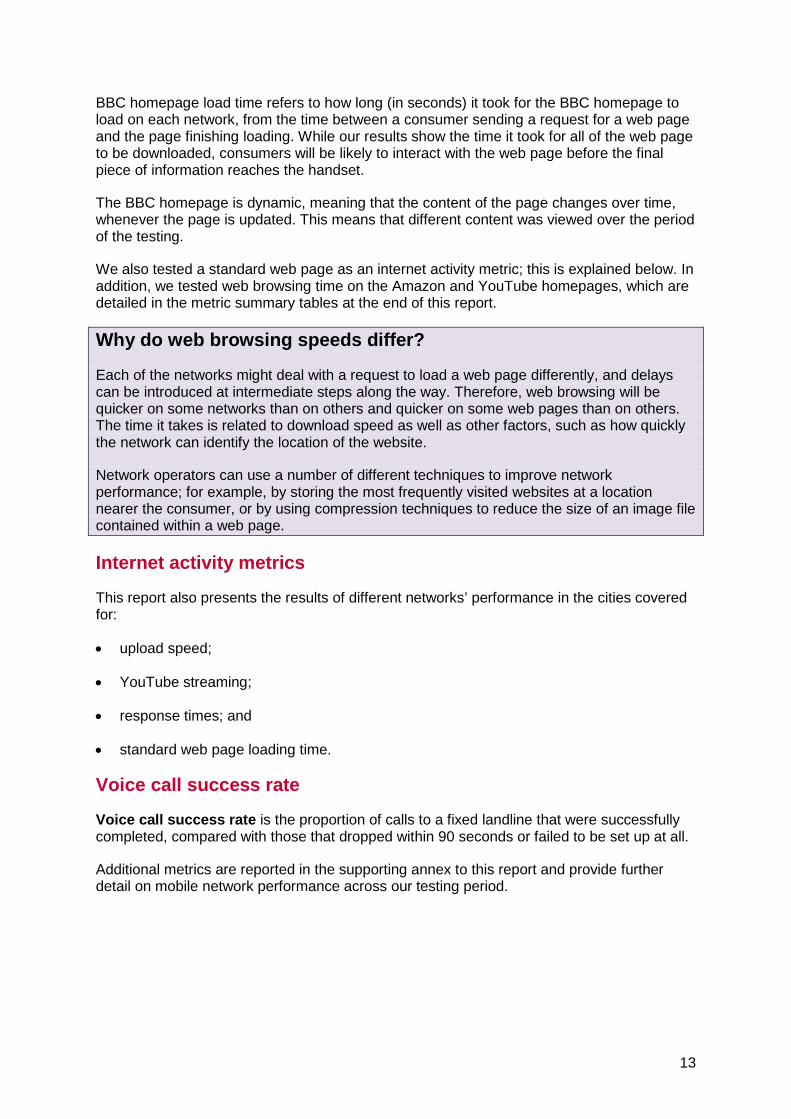
• Looking at consistency in Sheffield, EE had the largest proportion of download speed tests coming in at greater than 2Mbit/s; at 99%, compared to 98% for Vodafone and Three and 97% for O2.
• EE had the fastest average download speed in Sheffield at 30Mbit/s, followed by Three (21Mbit/s), O2 (18Mbit/s) and Vodafone (17Mbit/s).
• For web browsing performance, the BBC homepage loaded in full for 100% of tests on Vodafone, and 99% of tests on EE, Three and O2.

8
• 99% of EE’s download speed tests came in at greater than 2Mbit/s, compared to 95% of Vodafone’s, 95% of O2’s and 93% of Three’s.
• EE had the fastest average download speed in Southampton at 29Mbit/s, followed by Three (18Mbit/s), Vodafone (13Mbit/s) and O2 (12Mbit/s).
• For web browsing performance, the BBC homepage loaded in full for 99% of tests on EE, 98% of tests on O2 and Vodafone and 97% of tests on Three.
• 99% of EE’s download speed tests came in at greater than 2Mbit/s, compared to 97% of Vodafone’s, 95% of Three’s and 91% of O2’s.
• EE had the fastest average download speed in Birmingham at 41Mbit/s, followed by Vodafone (30Mbit/s), Three (19Mbit/s) and O2 (11Mbit/s).
• For web browsing performance, the BBC homepage loaded the fastest for Three. The web page loaded in full for 99% of tests on Three, Vodafone and O2, and 98% of tests on EE.
Other internet activities
The results for a whole range of other tests relevant to the typical consumer experience of mobile network performance are found in the report and supporting annex.

9
• EE had the fastest upload speed across all cities, at 25Mbit/s, followed by Three (14Mbit/s), Vodafone (13Mbit/s) and O2 (11Mbit/s).
• We loaded a trailer for Absolutely Fabulous: The Movie, to test YouTube streaming performance. On 98% of occasions the trailer loaded in HD on Vodafone, EE and O2 and 95% on Three, across all of our seven cities.
• EE had the quickest response time across all cities, important for activities that require minimal delay such as Skype and FaceTime, at 33ms, followed by Vodafone (41ms), Three (42ms) and O2 (43ms).

10
Section 2
2 4G in context What is 4G?
4G stands for fourth-generation mobile technology; it is the fourth version of smartphone technology. 2G technology was suitable for making calls, sending text messages and basic data services, while 3G made it possible to access the internet more effectively through a smartphone.
4G services typically make it much quicker to surf the web and provide the kind of broadband speeds required for video streaming, using mapping services and social networking.
Smartphone society
The UK is increasingly becoming a smartphone society, with 73% of all adults using a smartphone, making the performance of mobile networks more important than ever.2
Data collected from mobile providers as part of Ofcom’s regular programme of industry data collection suggests that more than half of UK mobile users had a tariff which enabled them to access 4G mobile services by June 2016 (although not all of these will use 4G services, either because they do not have a 4G-enabled device or because they do not use their handset in an area with 4G coverage).
Under half of UK mobile users have a tariff which enables access to 3G mobile services. Consumers using 3G SIMs for each of the MNOs, including EE’s Orange and T-Mobile SIMs, will only be able to access 3G services.
Developments in mobile networks
One of the key developments in mobile networks recently has been the deployment of Carrier Aggregation (CA) technology.3 CA can be thought of as the combination of two or more channels to deliver traffic to a CA-enabled device. More channels can result in an increased capacity to handle heavy traffic so that video and other data uses can continue moving smoothly. CA can be deployed for multiple reasons, from increasing the speed at which data can be served by the network to a CA-enabled smartphone, to allowing networks to cope better with traffic during congested time periods and to provide lower over-the-air latency. As such, having a handset that can benefit from CA technology should generally enhance the mobile broadband performance experience by consumers.
At the time of testing, EE, Vodafone and O2 had deployed CA technology in the UK. Rollout is at different stages for each of the operators. To take advantage of CA technology, consumers have to have a Category 6 or above handset and be in coverage of a network that has deployed it. The Samsung Galaxy S6 Edge+ handset we tested with for these results is a Category 9 capable device, meaning it can benefit from this deployment.
2 Ofcom consumer research, H2 2016. 3 Carrier aggregation is also known as LTE-Advanced and 4G+, and is a 4G technology which allows different bands to be simultaneously used by the base station-device pair to exchange user traffic.

11
Mobile network operators
There are four mobile network operators (MNOs) in the UK and all of them offer 4G services: EE, O2, Vodafone and Three.
There are also many mobile virtual network operators (MVNOs), which are third-party companies that lease telephone and data capacity from the network operators. Although some MVNOs now offer 4G services, we didn’t test them in our research.
Therefore, the results contained in this report will not necessarily correspond with the network performance of the MVNOs (e.g. our results on O2 will not necessarily be representative of performance on giffgaff) while other aspects of the mobile quality of experience, such as customer service and tariffing, will also vary between MNOs and MVNOs.
The table below provides examples of which virtual operators correspond with which of the operators:
Figure 2: MVNO network use
What about coverage?
Before consumers can benefit from the performance of a 4G network, they need to be using their smartphone in an area with 4G coverage.
The results in this report were gathered in cities where each operator had 4G coverage. Ofcom’s own online coverage checker maps are regularly updated with coverage information supplied by the operators themselves.4 Ofcom’s 2016 Connected Nation’s report provides information of mobile coverage available across different parts of the UK.
4 Links to the operators’ maps, which may display different levels of coverage, can be found here: EE, O2, Three, Vodafone.
Mobile Network Operators Examples of MVNOs
EE BT Mobile, Virgin Mobile
O2 Tesco Mobile, Lyca Mobile
Three Shebang, iD
Vodafone Lebara Mobile, Age UK My Phone

12
Section 3
3 The metrics we have used Our results were gathered using 4G SIMs for each of EE, O2, Three and Vodafone meaning 4G was the best technology available on each smartphone.
The 4G SIMs used were uncapped on speed. EE offers 4G tariffs differentiated by speed, and so in the case of EE testing was carried out on a 4G EE Extra tariff, which was uncapped on speed and not an EE standard tariff which is capped, but cheaper than the 4G EE Extra tariff5. Vodafone, O2 and Three do not differentiate on speed (i.e. all tariffs are uncapped on speed), and so testing was carried out on standard 4G SIMs. Consumers should be aware of the tariff they are on as this can affect the performance they experience. The two key metrics we have used are download speeds and web browsing time.
Download speeds
Download speed refers to the speed at which information is transferred from the internet to a device. In effect, it determines how quickly a file can be downloaded from a remote source to a smartphone. Typically, this involves downloading a file from a website. Popular types of file that consumers download on their smartphones include music, films, pictures, applications and e-books.
The unit of measurement for download speeds is megabits per second (Mbit/s).
Why do download speeds matter?
Download speeds matter because they determine how long consumers have to wait before getting the content on their device. Higher download speeds are particularly important for downloading larger files, such as films or apps.
For the best consumer experience, getting fast download speeds consistently matters as well as the speeds themselves. The distribution of download speeds gives an indication of this, as does the time-of-day analysis presented later in the report. Examining the variation in average speeds across different day-parts gives an idea of how networks behave at busier times.
Web browsing time
Web browsing is an activity that allows consumers to access content through an internet browser. Many activities – from using a search engine to loading a news website – require web browsing functionality.
To measure web browsing performance we look at BBC homepage loading time and the distributions, particularly the proportion of occasions on which the web page failed to download within 15 seconds.
5 The 4G EE Extra tariff was replaced by an alternative uncapped tariff in August 2016. Tariffs offered by each operator change from time to time. Consumers need to check which each operator for up to date information.
13
BBC homepage load time refers to how long (in seconds) it took for the BBC homepage to load on each network, from the time between a consumer sending a request for a web page and the page finishing loading. While our results show the time it took for all of the web page to be downloaded, consumers will be likely to interact with the web page before the final piece of information reaches the handset.
The BBC homepage is dynamic, meaning that the content of the page changes over time, whenever the page is updated. This means that different content was viewed over the period of the testing.
We also tested a standard web page as an internet activity metric; this is explained below. In addition, we tested web browsing time on the Amazon and YouTube homepages, which are detailed in the metric summary tables at the end of this report.
Why do web browsing speeds differ?
Each of the networks might deal with a request to load a web page differently, and delays can be introduced at intermediate steps along the way. Therefore, web browsing will be quicker on some networks than on others and quicker on some web pages than on others. The time it takes is related to download speed as well as other factors, such as how quickly the network can identify the location of the website.
Network operators can use a number of different techniques to improve network performance; for example, by storing the most frequently visited websites at a location nearer the consumer, or by using compression techniques to reduce the size of an image file contained within a web page.
Internet activity metrics
This report also presents the results of different networks’ performance in the cities covered for:
• upload speed;
• YouTube streaming;
• response times; and
• standard web page loading time.
Voice call success rate
Voice call success rate is the proportion of calls to a fixed landline that were successfully completed, compared with those that dropped within 90 seconds or failed to be set up at all.
Additional metrics are reported in the supporting annex to this report and provide further detail on mobile network performance across our testing period.
14
Section 4
4 Understanding the results Measuring performance
There are many ways of measuring the performance of mobile networks. The results of our testing focus on download speed and web browsing time, because downloading and browsing the web are key mobile internet activities for consumers. Uploading, video streaming, and making and receiving calls are also typical elements of smartphone use on a daily basis.
The tests were conducted using the best available technology as determined by the handset (this is referred to as ‘best bearer’), however most of the tests were on 4G. On a 4G tariff, a network will provide a 4G service if it can, and if it cannot provide a 4G service at a given time, it will provide the best alternative technology instead. Testing networks on a 4G tariff therefore means testing the performance of the operators on the best network service they can offer in at a given time at a given place.
This report does not provide an exhaustive analysis of mobile networks’ performance. It gives a snapshot of how EE, O2, Three and Vodafone performed in a series of tests we conducted in July to October 2016, in certain locations at certain times, with reference to a set of metrics that are easily recognisable to consumers and relevant to how they use their smartphones. The 4G SIMs used were uncapped on speed. EE offers 4G tariffs differentiated by speed, and so in the case of EE testing was carried out on a 4G EE Extra tariff, which was uncapped on speed and not an EE standard tariff which is capped, but cheaper than the 4G EE Extra tariff6. Vodafone, O2 and Three do not differentiate on speed (i.e. all tariffs are uncapped on speed), and so testing was carried out on standard 4G SIMs. Consumers should be aware of the tariff they are on as this can affect the performance they experience.
However, it should also be noted that network performance is only one of the factors that consumers should take into account when choosing their provider. Price, handset type, quality of customer service, coverage, contract terms and handset choice are also relevant and will play a part in consumers’ quality of experience.
Speed and consistency
Both the speed of mobile broadband services and their consistency are important as measures of performance.
While consumers can feel frustration with slow download speeds and long waits for web pages to load, connection failures and failed calls are also a source of irritation.
An average speed metric will indicate how fast a service is on average, but it does not reveal how frequently that service fails. In order to gauge the consistency of a mobile network’s performance, it is necessary to look at the distribution of results.
6 The 4G EE Extra tariff was replaced by an alternative uncapped tariff in August 2016. Tariffs offered by each operator change from time to time. Consumers need to check which each operator for up to date information.

15
Distribution charts are featured in this report so that the consistency of each operator is evident.
The results: Q&A
Q: Are there any measures of mobile network performance which are not included in the report?
A: Not every possible measure of performance is included in this report. Metrics relating to long-form video (as might be viewed on Netflix and BBC iPlayer), and specifically to audio-streaming, are not included.
Q: Do the results reflect what performance is like across the UK?
A: No. You should not interpret the results in this report as reflecting the performance of mobile networks in all parts of the UK. The report gives a snapshot of network performance between July and October 2016 across the seven cities in which we tested. We selected Belfast, Southampton, Birmingham, Cardiff, Edinburgh, London and Sheffield because they all had 4G network coverage from the operators.
The availability of 4G services is generally more common in cities and urban areas. Our results are presented at a city-by-city level, so they will be of most use to consumers who use their smartphones principally in one or more of our seven test cities.
There are other sources that provide information relating to the mobile quality of service across the UK, such as RootMetrics, P3 and Ookla.
Q: Which consumers are these results relevant to?
A: As mentioned previously, these results do not reflect the performance of mobile networks in all parts of the UK, therefore, the results could be of particular relevance to those consumers who are located in the seven cities tested.
In addition, we tested using 4G SIMs and the Samsung Galaxy S6 Edge+, therefore, it should be noted that the use of a different SIM (e.g. 3G only SIMs) or handset will experience differing levels of performance.
The 4G SIMs used were uncapped on speed. EE offers 4G tariffs differentiated by speed, and so in the case of EE testing was carried out on a 4G EE Extra tariff, which was uncapped on speed and not an EE standard tariff which is capped, but cheaper than the 4G EE Extra tariff7. Vodafone, O2 and Three do not differentiate on speed (i.e. all tariffs are uncapped on speed), and so testing was carried out on standard 4G SIMs. Consumers should be aware of the tariff they are on as this can affect the performance they experience. And lastly, the SIMs and handsets we used to test on were all Carrier Aggregation-enabled, which could also affect performance achieved. EE, Vodafone and O2 have all started deploying Carrier Aggregation at the time of testing (more information about Carrier Aggregation can be found in section 2).
Q: What can affect how well each of the networks performed in the tests?
7 The 4G EE Extra tariff was replaced by an alternative uncapped tariff in August 2016. Tariffs offered by each operator change from time to time. Consumers need to check which each operator for up to date information.

16
A: A range of factors can affect the performance of a mobile network in any given test.
The performance of mobile networks can vary according to the load on the network at different times; i.e. how many people are using the network at once.
The type of device a consumer uses also plays a role in the performance of mobile networks. We conducted the July-October testing using a Samsung Galaxy S6 Edge+(model SM-928F), in order to reflect the type of 4G-enabled devices that were popular among consumers at the time of testing.
Consumers with the most up-to-date phones can benefit from the latest network developments, such as the deployment of carrier aggregation technology from EE and Vodafone, and Three and EE’s introduction of VoLTE services in parts of the UK. Conversely, consumers with older phones might experience poorer performance.
The operators also perform maintenance on their networks as they seek to upgrade the performance available across the UK, which while ongoing, may affect the performance experienced by consumers. In addition, for all MNOs, we are aware of some operational issues which could have influenced results in some locations.
Q: Was it only 4G network performance that was tested?
A: No. Most of this report relates to the performance of mobile networks where 4G is the best available technology. In practice, this means that most of our testing was on 4G when possible, dropping down to a lower technology when 4G was not available.
Q: What about coverage?
A: Not all consumers in the UK will be able to access the 3G and 4G services of EE, O2, Three and Vodafone, because the areas where they live might not be covered by these networks. We chose our test cities because each operator had 4G coverage in all of them.
Ofcom’s interactive coverage maps provide the latest coverage figures for each operator.
Q: What does ‘statistical significance’ mean?
A: If a result is statistically significant, it means that the result would be highly likely to be the same even if the test were to be repeated on a much larger scale. Significant difference tables are used throughout this report. These tables indicate when results are statistically significant against one another.
Significant difference tables are essential in comparing the performance of operators against each other. To reflect the experiences of consumers more generally, results must be statistically significant.
However, not all statistically significant differences are noticeable to the consumer. For instance, a difference of 0.2 seconds between two networks, for the time it takes to load a web page, might be statistically significant, but is unlikely to be noticeable to consumers.

17
Section 5
5 Results: download and web browsing performance The results provide a snapshot of performance between July and October 2016 in the test cities, showing network performance in specific test conditions. The research is designed to test performance of the operators on the best network service they can offer at a given time at a given place. The 4G SIMs provided by each operator were uncapped on speed. EE offers 4G tariffs differentiated by speed.
Download results
Overall, EE achieved the fastest average download speeds, at 32Mbit/s on average across all seven cities, and reached the highest in Birmingham at 41Mbit/s. Further, EE also achieved the fastest average download speeds in all seven cities individually. The average download speed for Vodafone and Three was 18Mbit/s and for O2 it was 13Mbit/s.
Figure 3: Average 4G download speed, by city
Source: Ofcom mobile broadband measurements, fieldwork July to October 2016. Note: Average (mean) of all tests gathered, with 4G as the best bearer. We used 4G SIMs that were uncapped on speed. In the case of EE testing was carried out on an uncapped 4G EE tariff, but EE also offers tariffs which are capped in relation to speed. Vodafone, O2 and Three do not differentiate on speed, and so testing was carried out on standard 4G SIMs. Tariffs offered by each operator can change. Consumers need to check with each operator for up to date information.
21 19 18
25
1921 20 22
3229 29
41
31 3235
30
1316
12 11 11
17
8
181815 13
30
1215
26
1718 16 18 19 21 19
11
21
0
10
20
30
40
50
All EE O2 Vodafone Three
Mbit/s

18
Figure 4: Average 4G download speed: significant differences
Source: Ofcom Note: Differences are significant to a 95% confidence level. We used 4G SIMs that were uncapped on speed. In the case of EE testing was carried out on an uncapped 4G EE tariff, but EE also offers tariffs which are capped in relation to speed. Vodafone, O2 and Three do not differentiate on speed, and so testing was carried out on standard 4G SIMs. Tariffs offered by each operator can change. Consumers need to check with each operator for up to date information.
Across all tests, 0.4% of file downloads failed to start across all operators. The proportion of downloads with speeds of >2Mbit/s varied from 98% of downloads attempted on EE’s network, the highest proportion of all operators, to 90% of O2’s downloads. EE also had the highest proportion of downloads with speeds >25Mbit/s, with 54% of tests achieving this.
Figure 5: Distribution of 4G download results
Source: Ofcom mobile broadband measurements, fieldwork July to October 2016. We used 4G SIMs that were uncapped on speed. In the case of EE testing was carried out on an uncapped 4G EE tariff, but EE also offers tariffs which are capped in relation to speed. Vodafone, O2 and Three do not differentiate on speed, and so testing was carried out on standard 4G SIMs. Tariffs offered by each operator can change. Consumers need to check with each operator for up to date information.
The variations in distributions across each city are summarised in the executive summary; more in-depth figures are provided in the chart pack accompanying this publication.
Fastest 2nd Fastest 3rd Fastest 4th Fastest
Overall EE Vodafone, Three (=) - O2
Belfast EE Three, O2 (=) - Vodafone, O2 (=)
Southampton EE Three Vodafone O2
Birmingham EE Vodafone Three O2
Cardiff EE Three Vodafone O2
Edinburgh EE Three O2 Vodafone
London EE Vodafone Three O2
Sheffield EE Three O2 Vodafone
6% 1%10% 5% 6%
44%
21%
56%50% 48%
20%
23%
18%
21% 20%
30%
54%
16%24% 26%
0%
20%
40%
60%
80%
100%
All EE O2 Vodafone Three
Failed <2Mbit/s 2-15Mbit/s 15-25Mbit/s >25Mbit/s
Proportion of samplesDistributions show
consistency
These tables show how operators
performed in each city in terms of
download speed

19
BBC homepage loading time: results
For our web browsing test, we measured the time taken to fully download the BBC homepage on each network. This is the time taken for the website to load all the content contained on the homepage, rather than the time until a consumer can interact with the page. Overall, Three had the quickest BBC web browsing time, at four seconds. For all cities, the time taken to download the BBC homepage varied from four to five seconds (differences which are relatively unlikely to be noticeable for consumers).
Figure 7: Average 4G BBC homepage load time, by city
Source: Ofcom mobile broadband measurements, fieldwork July to October 2016. Note: Average (median) of all tests gathered, with 4G as the best bearer. We used 4G SIMs that were uncapped on speed. In the case of EE testing was carried out on an uncapped 4G EE tariff, but EE also offers tariffs which are capped in relation to speed. Vodafone, O2 and Three do not differentiate on speed, and so testing was carried out on standard 4G SIMs. Tariffs offered by each operator can change. Consumers need to check with each operator for up to date information.
Figure 8: Average 4G BBC homepage load time: significant differences
Source: Ofcom Note: Differences are significant to a 95% confidence level We used 4G SIMs that were uncapped on
4 4 4 4 4 4 4 44 4 4 4 4 4 4 45 5 5 5 5 5 5 54 4 4 4 5 4 4 4
4 4 44 4 4 4 4
00.5
11.5
22.5
33.5
44.5
5
All EE O2 Vodafone Three
seconds
Fastest 2nd Fastest 3rd Fastest 4th Fastest
Overall Three EE Vodafone O2
Belfast EE, Three (=) - Vodafone O2
Southampton EE, Three (=) - Vodafone O2
Birmingham Three EE Vodafone O2
Cardiff EE, Three (=) - Vodafone O2
Edinburgh EE, Three (=) - Vodafone, O2 (=) -
London EE, Three (=) - Vodafone O2
Sheffield EE, Three (=) - Vodafone O2
The shortest time is best

20
speed. In the case of EE testing was carried out on a 4G EE Extra tariff. Vodafone, O2 and Three do not differentiate on speed, and so testing was carried out on standard 4G SIMs.
The highest proportion of successful web browsing attempts occurred on EE’s network, on which 99% of attempts were successful. Three and Vodafone’s network had the second highest success rate, with 98% of web browsing attempts succeeding, followed by O2 with 97%. The operators with the highest proportion of web browsing speeds under 4 seconds were EE and Three, with both having over a third of samples achieving this speed (35%), followed by Vodafone (26%) and O2 (19%).
Figure 9: Distribution of 4G BBC homepage loading time results
Source: Ofcom mobile broadband measurements, fieldwork July to October 2016. We used 4G SIMs that were uncapped on speed. In the case of EE testing was carried out on an uncapped 4G EE tariff, but EE also offers tariffs which are capped in relation to speed. Vodafone, O2 and Three do not differentiate on speed, and so testing was carried out on standard 4G SIMs. Tariffs offered by each operator can change. Consumers need to check with each operator for up to date information.
The variations in distributions across each city are summarised in the executive summary; more in-depth figures are provided in the chart pack accompanying this publication.
The results of the BBC web browser tests should be read in line with the standard web page results, which show how different aspects of a network come into play when different content is loaded. In addition to the tests undertaken on the BBC homepage and standard web page, we also carried out web browsing tests on the Amazon and YouTube homepage. The results of these can be found in the metric summary tables at the end of this report and in the accompanying chart pack.
29% 35%19%
26%35%
62%58%
69%64%
55%
8% 5% 9% 8% 8%2% 2% 3% 2% 2%
0%
20%
40%
60%
80%
100%
All EE O2 Vodafone Three
<4s 4-6s >6s Failed
Proportion of samples

21
Section 5
6 Results: internet activities The results provide a snapshot of performance between July and October 2016 in the test cities, showing network performance in specific test conditions. The research is designed to test performance of the operators on the best network service they can offer at a given time at a given place. The 4G SIMs provided by each operator were uncapped on speed. EE offers 4G tariffs differentiated by speed.
Internet activities: results
This section presents the results of a range of tests which relate to common internet activities. More detail on these tests, and city-by-city analysis, can be found in the technical annex and metric summary table.
Upload speed refers to the speed at which information is transferred from a device to the internet. For example, to post a photo taken on a smartphone to Facebook, a consumer will upload the photo to Facebook from their device.
YouTube streaming is a process in which short-form video content is viewed in real time. This metric indicates the proportion of videos streamed on each network that were in standard definition, high definition, and what proportion failed to play.
Response time is the delay between a consumer making a request to their mobile network for information and the network providing this information to the device. A quick response time is important for activities that require information to be delivered with a little delay as possible. In particular, the responsiveness of a network is significant when using Skype or FaceTime.
Standard web page load time refers to how long it took for a basic web page to load on each of the operators’ networks, from the time between a consumer sending a request for a web page and the page finishing loading. For this test we used an industry standard-sized web page (based on an ETSI ‘mKepler’ standard reference page) which is static – its content does not change. Comparisons with these standard web page results and our BBC browser results show how different aspects of mobile networks come into play for different tasks.
Upload speed
Across all the seven cities, EE achieved the fastest upload speeds, averaging 25Mbit/s. EE also reached the highest upload speed overall with 30Mbit/s in Belfast and was the highest in all individual cities. The average upload speed for Three was 14Mbit/s, for Vodafone it was 13Mbit/s and for O2 it was 11Mbit/s.

22
Figure 11: Average 4G upload speed, by city
Source: Ofcom mobile broadband measurements, fieldwork July to October 2016. Note: Average (mean) of all tests gathered, with 4G as the best bearer. We used 4G SIMs that were uncapped on speed. In the case of EE testing was carried out on an uncapped 4G EE tariff, but EE also offers tariffs which are capped in relation to speed. Vodafone, O2 and Three do not differentiate on speed, and so testing was carried out on standard 4G SIMs. Tariffs offered by each operator can change. Consumers need to check with each operator for up to date information.
Figure 12: Average 4G upload speed: significant differences
Source: Ofcom Note: Differences are significant to a 95% confidence level. We used 4G SIMs that were uncapped on speed. In the case of EE testing was carried out on an uncapped 4G EE tariff, but EE also offers tariffs which are capped in relation to speed. Vodafone, O2 and Three do not differentiate on speed, and so testing was carried out on standard 4G SIMs. Tariffs offered by each operator can change. Consumers need to check with each operator for up to date information.
1618
12
1715
1715
17
25
30
19
2724 25 24 24
11 1310
1211
13
91213 14
10
1411
14 15 1414 1311
15 15 15
10
16
05
101520253035
All EE O2 Vodafone Three
Mbit/s
Fastest 2nd Fastest 3rd Fastest 4th Fastest
Overall EE Three Vodafone O2
Belfast EE Vodafone Three, O2 (=) -
Southampton EE Three O2, Vodafone (=) -
Birmingham EE Three Vodafone O2
Cardiff EE Three O2, Vodafone (=) -
Edinburgh EE Three Vodafone O2
London EE Vodafone Three O2
Sheffield EE Three Vodafone O2

23
YouTube streaming
We used a trailer for Absolutely Fabulous: The Movie8, in our YouTube streaming test.
When loading this video, across all cities and MNOs, 97% of video streams were on high-definition. This proportion was very similar across all MNOs and ranged from 95% for Three to 98% for Vodafone, EE and O2.
Figure 13: Video streaming resolution on 4G
Source: Ofcom mobile broadband measurements, fieldwork July to October 2016. Note: Proportion of all tests gathered with 4G as the best bearer. HD videos here have a resolution of 720p and SD videos have a resolution of 360p. We used 4G SIMs that were uncapped on speed. In the case of EE testing was carried out on an uncapped 4G EE tariff, but EE also offers tariffs which are capped in relation to speed. Vodafone, O2 and Three do not differentiate on speed, and so testing was carried out on standard 4G SIMs. Tariffs offered by each operator can change. Consumers need to check with each operator for up to date information.
Standard web page loading time: results
In addition to our BBC, YouTube and Amazon homepage web browsing tests, we tested web browsing performance on a standard web page containing a small amount of static content.
The average time taken to load a standard static web page, on each of the operators’ networks, was around one second. While differences were statistically significant, the differences are so small as to be unlikely to be noticeable for consumers.
8 https://www.youtube.com/watch?v=Dj3ZWhlmexw
97% 98% 98% 98% 95%
2% 2% 1% 0% 4%1% 2% 2% 1%
0%
20%
40%
60%
80%
100%
All EE O2 Vodafone Three
FailedSDHD

24
Figure 14: Average 4G standard web page load time
Source: Ofcom mobile broadband measurements, fieldwork July to October 2016. Note: Average (mean) of all tests gathered, with 4G as the best bearer. We used 4G SIMs that were uncapped on speed. In the case of EE testing was carried out on an uncapped 4G EE tariff, but EE also offers tariffs which are capped in relation to speed. Vodafone, O2 and Three do not differentiate on speed, and so testing was carried out on standard 4G SIMs. Tariffs offered by each operator can change. Consumers need to check with each operator for up to date information.
Figure 15: Average 4G standard web page load time: significant differences
Source: Ofcom Note: Differences are significant to a 95% confidence level. We used 4G SIMs that were uncapped on speed. In the case of EE testing was carried out on an uncapped 4G EE tariff, but EE also offers tariffs which are capped in relation to speed. Vodafone, O2 and Three do not differentiate on speed, and so testing was carried out on standard 4G SIMs. Tariffs offered by each operator can change. Consumers need to check with each operator for up to date information.
It is worth noting that the results of the standard web page test differ from those of the BBC web page test. This highlights the difference between the two sites, e.g. the larger, dynamic BBC homepage compared to the static content on the standard web page, and how networks respond differently depending on the request being made of it.
11
1 1 11
11
1 1 1 1 1 1 11
1 11 1 1
1 1 1
11
1 1 11
11
1 1 11 1 1
11
0
1
2
All EE O2 Vodafone Three
seconds
Fastest 2nd Fastest 3rd Fastest 4th Fastest
Overall O2 EE Vodafone Three
Belfast O2 EE Vodafone Three
Southampton O2 EE Vodafone Three
Birmingham O2 EE Vodafone Three
Cardiff O2 EE Vodafone Three
Edinburgh O2 EE Vodafone Three
London O2 EE Vodafone Three
Sheffield O2 EE Vodafone Three
A ‘standard web page’ is a very simple page

25
Response time
On average, EE had the most responsive network, taking 33ms for a packet of data to get to a consumer’s device following the request. The response time for Vodafone was 41ms, for Three it was 42ms and for O2 it was 43ms.
Figure 16: Response 4G response time
Source: Ofcom mobile broadband measurements, fieldwork July to October 2016. Note: Average (median) of all 32 byte ping tests gathered, with 4G as the best bearer. We used 4G SIMs that were uncapped on speed. In the case of EE testing was carried out on an uncapped 4G EE tariff, but EE also offers tariffs which are capped in relation to speed. Vodafone, O2 and Three do not differentiate on speed, and so testing was carried out on standard 4G SIMs. Tariffs offered by each operator can change. Consumers need to check with each operator for up to date information.
Figure 17: Response time on a 4G: significant differences
Source: Ofcom Note: Differences are significant to a 95% confidence level. We used 4G SIMs that were uncapped on speed. In the case of EE testing was carried out on an uncapped 4G EE tariff, but EE also offers tariffs which are capped in relation to speed. Vodafone, O2 and Three do not differentiate on speed, and so testing was carried out on standard 4G SIMs. Tariffs offered by each operator can change. Consumers need to check with each operator for up to date information.
41
47
37 38 40
46
38 40
33
4144
2630
37
2629
4346
35
46 4844 43 4141
49
27
37 36
49
35
424247 47
40 41
47
41 40
0
10
20
30
40
50
60
All EE O2 Vodafone Three
Fastest 2nd Fastest 3rd Fastest 4th Fastest
Overall EE Vodafone Three O2
Belfast EE O2 Three Vodafone
Southampton Vodafone O2 EE Three
Birmingham EE Vodafone Three O2
Cardiff EE Vodafone Three O2
Edinburgh EE O2 Three Vodafone
London EE Vodafone Three O2
Sheffield EE Three O2 Vodafone
The shortest response time is best

26
Voice call success rate
Successfully setting up and maintaining a voice call remains important for many consumers using their smartphones. The vast majority of calls were successful throughout our test period, with 99% of calls being completed on Vodafone and Three, 98% on EE and 97% on O2.
Figure 18: Call success rate
Source: Ofcom mobile broadband measurements, fieldwork July to October 2016. We used 4G SIMs that were uncapped on speed. In the case of EE testing was carried out on an uncapped 4G EE tariff, but EE also offers tariffs which are capped in relation to speed. Vodafone, O2 and Three do not differentiate on speed, and so testing was carried out on standard 4G SIMs. Tariffs offered by each operator can change. Consumers need to check with each operator for up to date information.
98% 98% 97% 99% 99%
0%
20%
40%
60%
80%
100%
All EE O2 Vodafone ThreeCompleted Dropped Failed
Proportion of samples

27
Section 6
7 Time-of-day, indoor vs. outdoor results and changes over time Analysing results across the day gives an important reflection of mobile network performance, as it allows us to look at how the networks respond under stressed conditions and when load is at its highest (which, by definition, is when the most consumers are trying to use services). We also include information here around how performance differs when tests are carried out in indoor or outdoor locations.
The following charts split out the average download speeds, and BBC homepage load times, for each operator, across all seven cities on weekday mornings (7am to 10am), at midday (10am – 4.30pm), in the evening (4.30pm – 7pm), at weekends (7am – 7pm) and for indoor and outdoor test locations.
Download speeds
Overall, the fastest download speeds were seen in the mornings (Mon-Fri) and at the weekends, achieving speeds of 21 Mbit/s on average. Weekday evenings provided the slowest average download speeds overall.
Figure 19: Average 4G download speed, by MNO and time of day
Source: Ofcom mobile broadband measurements, fieldwork July to October 2016. Note: Average (mean) of all tests gathered, with 4G as the best bearer. Morning is 7am to 10am, midday is 10am to 4.30pm and evening is 4.30pm to 7pm. We used 4G SIMs that were uncapped on speed. In the case of EE testing was carried out on an uncapped 4G EE tariff, but EE also offers tariffs which are capped in relation to speed. Vodafone, O2 and Three do not differentiate on speed, and so testing was carried out on standard 4G SIMs. Tariffs offered by each operator can change. Consumers need to check with each operator for up to date information.
21
32
14
192020
33
13
18 1819
31
13
1715
21
32
15
21
17
0
5
10
15
20
25
30
35
All EE O2 Vodafone Three
Morning (Mon-Fri) Midday (Mon-Fri) Evening (Mon-Fri) Weekend
Mbit/s

28
Figure 20: Average 4G download speed, by MNO and time of day: significant differences
Source: Ofcom Note: Differences are significant to a 95% confidence level. Morning is 7am to 10am, midday is 10am to 4.30pm and evening is 4.30pm to 7pm (all Monday to Friday). Note: For EE, Weekends, Mornings and Midday are all similar, but while Weekends and Midday are significantly higher than Evenings, Mornings are not. We used 4G SIMs that were uncapped on speed. In the case of EE testing was carried out on an uncapped 4G EE tariff, but EE also offers tariffs which are capped in relation to speed. Vodafone, O2 and Three do not differentiate on speed, and so testing was carried out on standard 4G SIMs. Tariffs offered by each operator can change. Consumers need to check with each operator for up to date information.
The BBC homepage load time was between four and five seconds across all time periods. Despite little noticeable difference, the BBC homepage load time tended to be quicker in the mornings and weekends.
Figure 21: Average 4G tariff BBC homepage load time, by MNO and time of day
Source: Ofcom mobile broadband measurements, fieldwork July to October 2016. Note: Average (median) of all tests gathered, with 4G as the best bearer. Morning is 7am to 10am, midday is 10am to 4.30pm and evening is 4.30pm to 7pm. We used 4G SIMs that were uncapped on speed. In the case of EE testing was carried out on an uncapped 4G EE tariff, but EE also offers tariffs which are capped in relation to speed. Vodafone, O2 and Three do not differentiate on speed, and so testing was carried out on standard 4G SIMs. Tariffs offered by each operator can change. Consumers need to check with each operator for up to date information.
Fastest 2nd Fastest 3rd Fastest 4th Fastest
Overall Weekend, Morning (=) - Midday Evening
EE Weekend, Morning, Midday (=) - Evening, Morning (=) -
O2 Weekend Morning, Evening (=) - Midday
Vodafone Weekend Morning Midday, Evening (=) -
Three Morning Midday Weekend Evening
4 44 4 4
4 45 5
45 4
5 544 4
5 4 4
0
2
4
6
8
All EE O2 Vodafone Three
Morning (Mon-Fri) Midday (Mon-Fri) Evening (Mon-Fri) Weekend
seconds

29
Figure 22: Average 4G BBC browser time, by MNO and time of day: significant differences
Source: Ofcom Note: Differences are significant to a 95% confidence level. Morning is 7am to 10am, midday is 10am to 4.30pm and evening is 4.30pm to 7pm (all Monday to Friday). We used 4G SIMs that were uncapped on speed. In the case of EE testing was carried out on an uncapped 4G EE tariff, but EE also offers tariffs which are capped in relation to speed. Vodafone, O2 and Three do not differentiate on speed, and so testing was carried out on standard 4G SIMs. Tariffs offered by each operator can change. Consumers need to check with each operator for up to date information.
Indoor vs. outdoor results
For all MNOs, download speeds are significantly faster outdoors than compared to indoors. The average download speed indoors is 21Mbit/s compared to18Mbit/s indoors. The fastest indoor speed is by EE (28Mbit/s), while the fastest outdoors is for EE as well (33Mbit/s).
Figure 23: Average 4G download speeds, by MNO: indoor vs. outdoor
Source: Ofcom mobile broadband measurements, fieldwork July to October 2016. Note: Average (mean) of all tests gathered, with 4G as the best bearer. We used 4G SIMs that were uncapped on speed. In the case of EE testing was carried out on an uncapped 4G EE tariff, but EE also offers tariffs which are capped in relation to speed. Vodafone, O2 and Three do not differentiate on speed, and so testing was carried out on standard 4G SIMs. Tariffs offered by each operator can change. Consumers need to check with each operator for up to date information.
Fastest 2nd Fastest 3rd Fastest 4th Fastest
Overall Morning Weekend Midday Evening
EE Weekend Morning Midday Evening
O2 Morning, Weekend (=) - Midday Evening
Vodafone Morning, Weekend (=) - Midday Evening
Three Morning Weekend Midday, Evening (=) -
18
28
11
1716
21
33
14
19 18
0
5
10
15
20
25
30
35
All EE O2 Vodafone Three
Indoor Outdoor
Mbit/s
30
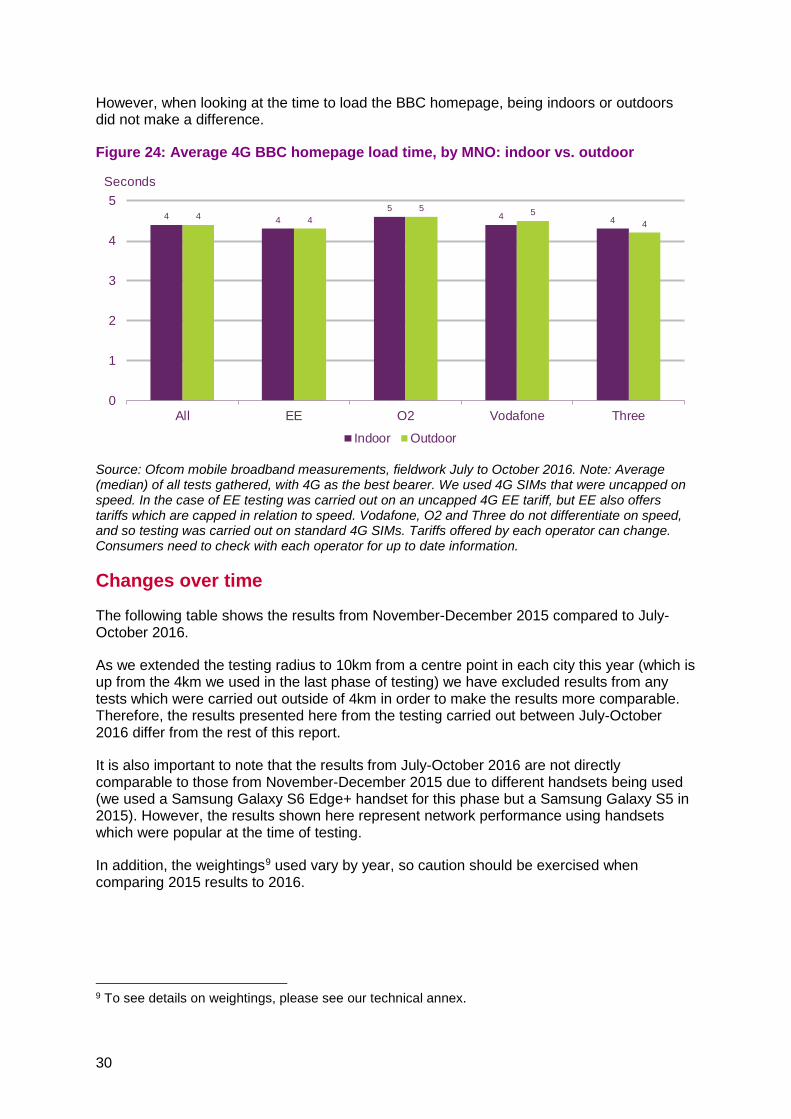
However, when looking at the time to load the BBC homepage, being indoors or outdoors did not make a difference.
Figure 24: Average 4G BBC homepage load time, by MNO: indoor vs. outdoor
Source: Ofcom mobile broadband measurements, fieldwork July to October 2016. Note: Average (median) of all tests gathered, with 4G as the best bearer. We used 4G SIMs that were uncapped on speed. In the case of EE testing was carried out on an uncapped 4G EE tariff, but EE also offers tariffs which are capped in relation to speed. Vodafone, O2 and Three do not differentiate on speed, and so testing was carried out on standard 4G SIMs. Tariffs offered by each operator can change. Consumers need to check with each operator for up to date information.
Changes over time
The following table shows the results from November-December 2015 compared to July-October 2016.
As we extended the testing radius to 10km from a centre point in each city this year (which is up from the 4km we used in the last phase of testing) we have excluded results from any tests which were carried out outside of 4km in order to make the results more comparable. Therefore, the results presented here from the testing carried out between July-October 2016 differ from the rest of this report.
It is also important to note that the results from July-October 2016 are not directly comparable to those from November-December 2015 due to different handsets being used (we used a Samsung Galaxy S6 Edge+ handset for this phase but a Samsung Galaxy S5 in 2015). However, the results shown here represent network performance using handsets which were popular at the time of testing.
In addition, the weightings9 used vary by year, so caution should be exercised when comparing 2015 results to 2016.
9 To see details on weightings, please see our technical annex.
4 45
4 44 45 5
4
0
1
2
3
4
5
All EE O2 Vodafone Three
Indoor Outdoor
Seconds

31
Figure 25: Average 4G download speed, by city and MNO: 2015 vs. 2016
Source: Ofcom mobile broadband measurements, fieldwork July to October 2016 and November-December 2015. Note: Average (mean) of all tests gathered with 4G as the best bearer. We used 4G SIMs that were uncapped on speed. In the case of EE testing was carried out on an uncapped 4G EE tariff, but EE also offers tariffs which are capped in relation to speed. Vodafone, O2 and Three do not differentiate on speed, and so testing was carried out on standard 4G SIMs. Tariffs offered by each operator can change. Consumers need to check with each operator for up to date information.
Figure 26: Proportion of 4G download tests over 2Mbit/s, by city and MNO: 2015 vs. 2016
Source: Ofcom mobile broadband measurements, fieldwork July to October 2016 and November-December 2015. We used 4G SIMs that were uncapped on speed. In the case of EE testing was carried out on an uncapped 4G EE tariff, but EE also offers tariffs which are capped in relation to speed. Vodafone, O2 and Three do not differentiate on speed, and so testing was carried out on standard 4G SIMs. Tariffs offered by each operator can change. Consumers need to check with each operator for up to date information.
30
23
32
21
33
17
10
6
16 15
7 7
119
15 15
28
14
21
14
1815
10
15
0
10
20
30
40
Cardiff 2016 Cardiff 2015 Edinburgh 2016Edinburgh 2015 London 2016 London 2015
EE O2 Vodafone Three
Mbit/s
2016 2015
Cardiff London Edinburgh Cardiff London Edinburgh
EE 99% 96% 99% 95% 92% 92%
Vodafone 91% 93% 99% 74% 80% 94%
O2 85% 67% 97% 54% 59% 96%
Three 94% 82% 98% 92% 81% 87%

32
Figure 27: Proportion of successful 4G BBC homepage loads, by city and MNO: 2015 vs. 2016
Source: Ofcom mobile broadband measurements, fieldwork July to October 2016 and November-December 2015. We used 4G SIMs that were uncapped on speed. In the case of EE testing was carried out on an uncapped 4G EE tariff, but EE also offers tariffs which are capped in relation to speed. Vodafone, O2 and Three do not differentiate on speed, and so testing was carried out on standard 4G SIMs. Tariffs offered by each operator can change. Consumers need to check with each operator for up to date information.
2016 2015
Cardiff London Edinburgh Cardiff London Edinburgh
EE 98% 97% 99% 99% 99% 96%
Vodafone 98% 95% 100% 89% 87% 92%
O2 97% 90% 100% 88% 87% 92%
Three 98% 97% 99% 97% 96% 96%
27
8 Metrics tables The results provide a snapshot of 4G performance between July and October 2016, showing network performance in specific test conditions based on 4G-enabled SIMs. It is important to bear in mind the specific test conditions when interpreting the results, which include the handset used as well as the 4G SIM: EE offers 4G tariffs differentiated by speed (i.e. some SIMs may cap speed, but we used SIMs which were uncapped as to speed in all cases).

28
Figure 28: Results snapshot: Belfast and Southampton
Source: Ofcom. Note: ‘s’ is seconds and ‘ms’ is milliseconds. ‘MOS’ stands for mean opinion score and scores range from 1 (bad) to 5 (excellent). Note: There is no O2 data for YouTube ‘time to first picture’ and Video quality as there was an unknown error which has not been resolved. We used 4G SIMs that were uncapped on speed. In the case of EE testing was carried out on an uncapped 4G EE tariff, but EE also offers tariffs which are capped in relation to speed. Vodafone, O2 and Three do not differentiate on speed, and so testing was carried out on standard 4G SIMs. Tariffs offered by each operator can change. Consumers need to check with each operator for up to date information.
0-10km Belfast Southampton
Metric EE O2 Vodafone Three EE O2 Vodafone Three
Download Speed:
Average speed 29 Mbit/s 16 Mbit/s 15 Mbit/s 16 Mbit/s 29Mbit/s 12Mbit/s 13Mbit/s 18Mbit/s
% over 2Mbit/s 99% 94% 96% 93% 99% 95% 95% 93%
W eb browsing
BBC homepage load time: average 4s 5s 4s 4s 4s 5s 4s 4s
BBC homepage success rate 99% 99% 98% 99% 99% 98% 98% 97%
Amazon homepage load time: average 2s 3s 2.5s 2.6s 1.9s 2s 1.9s 2.2s
Amazon homepage success rate 99% 99% 99% 99% 100% 99% 98% 98%
YouTube homepage load time: average 1s 1.1s 1s 1s 1s 1s 1s 1.1s
YouTube homepage success rate 100% 99% 99% 100% 100% 99% 99% 99%
Standard webpage load time: average 0.8s 0.7s 1.1s 1.2s 0.8s 0.6s 0.9s 1.2s
Standard webpage success rate 99% 99% 99% 99% 99% 100% 99% 99%
Upload speed: average 30Mbit/s 13Mbit/s 14Mbit/s 13Mbit/s 19Mbit/s 10Mbit/s 10Mbit/s 11Mbit/s
YouTube
% of HD streams 86% 98% 98% 100% 99% 98% 99% 81%
Time to first picture: average 1.9s - 2.5s 2.3s 2.2s - 2.4s 2.2s
Video Quality: average MOS 4 - 4 4 4 - 4 4
Response time: average 41ms 46ms 49ms 47ms 44ms 35ms 27ms 47ms
Voice calls
Mobile to mobile call success rate 98% 97% 99% 100% 96% 97% 97% 99%
Mobile to mobile call quality: average MOS 4 4 4 4 4 3 4 4

27
Figure 29: Results snapshot: Birmingham and Cardiff
Source: Ofcom. Note: ‘s’ is seconds and ‘ms’ is milliseconds. ‘MOS’ stands for mean opinion score and scores range from 1 (bad) to 5 (excellent Note: There is no O2 data for YouTube ‘time to first picture’ and Video quality as there was an unknown error which has not been resolved We used 4G SIMs that were uncapped on speed. In the case of EE testing was carried out on an uncapped 4G EE tariff, but EE also offers tariffs which are capped in relation to speed. Vodafone, O2 and Three do not differentiate on speed, and so testing was carried out on standard 4G SIMs. Tariffs offered by each operator can change. Consumers need to check with each operator for up to date information.
0-10km Birmingham Cardiff
Metric EE O2 Vodafone Three EE O2 Vodafone Three
Download Speed:
Av erage speed 41 Mbit/s 11 Mbit/s 30 Mbit/s 19 Mbit/s 31Mbit/s 11Mbit/s 12Mbit/s 21Mbit/s
% ov er 2Mbit/s 99% 91% 97% 95% 98% 85% 90% 92%
Web browsing
BBC homepage load time: av erage 4.3s 4.6s 4.5s 4.2s 4.3s 4.6s 4.6s 4.2s
BBC homepage success rate 98% 99% 99% 99% 98% 96% 97% 97%
Amazon homepage load time: av erage 1.9s 2.3s 2s 2s 2s 2.4s 2.1s 2.2s
Amazon homepage success rate 99% 100% 99% 99% 98% 97% 98% 98%
YouTube homepage load time: av erage 0.9s 1.1s 1s 1s 1s 1.1s 1s 1s
YouTube homepage success rate 100% 99% 99% 99% 99% 98% 98% 98%
Standard webpage load time: av erage 0.8s 0.6s 0.9s 1.1s 0.8s 0.6s 0.9s 1.1s
Standard webpage success rate 99% 100% 100% 99% 99% 98% 98% 98%
Upload speed: av erage 27Mbit/s 12Mbit/s 14Mbit/s 15Mbit/s 24Mbit/s 11Mbit/s 11Mbit/s 15Mbit/s
YouTube
% of HD streams 100% 99% 99% 99% 99% 95% 97% 96%
Time to f irst picture: av erage 1.9s - 2.2s 2.1s 2.2s - 2.4s 2.1s
Video Quality : av erage MOS 4 - 4 4 4 - 4 4
Response time: av erage 26ms 46ms 37ms 40ms 30ms 48ms 36ms 41ms
Voice calls
Mobile to mobile call success rate 100% 98% 99% 98% 98% 98% 97% 100%
Mobile to mobile call quality : av erage MOS 4 3 3 4 4 3 4 4


27
Figure 30: Results snapshot: Edinburgh, London and Sheffield
Source: Ofcom. Note: ‘s’ is seconds and ‘ms’ is milliseconds. ‘MOS’ stands for mean opinion score and scores range from 1 (bad) to 5 (excellent Note: There is no O2 data for YouTube ‘time to first picture’ and Video quality as there was an unknown error which has not been resolved. We used 4G SIMs that were uncapped on speed. In the case of EE testing was carried out on an uncapped 4G EE tariff, but EE also offers tariffs which are capped in relation to speed. Vodafone, O2 and Three do not differentiate on speed, and so testing was carried out on standard 4G SIMs. Tariffs offered by each operator can change. Consumers need to check with each operator for up to date information.
0-10km Edinburgh London Sheffield
Metric EE O2 Vodafone Three EE O2 Vodafone Three EE O2 Vodafone Three
Download Speed
Average speed 32Mbit/s 17Mbit/s 15Mbit/s 19Mbit/s 35Mbit/s 8Mbit/s 26Mbit/s 11Mbit/s 30Mbit/s 18Mbit/s 27Mbit/s 21Mbit/s
% over 2Mbit/s 99% 98% 95% 98% 96% 71% 91% 82% 99% 97% 98% 98%
W eb browsing
BBC homepage load time: average 4.3s 4.5s 4.4s 4.2s 4.4s 4.7s 4.5s 4.3s 4.2s 4.6s 4.5s 4.3s
BBC homepage success rate 99% 100% 97% 99% 97% 92% 95% 95% 99% 99% 100% 99%
Amazon homepage load time: average 2.2s 2.3s 2.3s 2.3s 2.2s 2.7s 2.2s 2.5s 2s 2.2s 2.1s 2.2s
Amazon homepage success rate 98% 99% 96% 99% 98% 93% 96% 95% 100% 99% 99% 99%
YouTube homepage load time: average 1s 1s 1.1s 1s 1s 1.1s 0.9s 1s 1s 1s 1.1s 1s
YouTube homepage success rate 100% 100% 97% 100% 99% 96% 97% 98% 100% 99% 100% 99%
Standard webpage load time: average 0.8s 0.7s 1.1s 1.2s 0.7s 0.6s 0.9s 1s 0.8s 0.7s 1s 1.1s
Standard webpage success rate 99% 100% 97% 99% 98% 97% 98% 98% 100% 99% 100% 100%
Upload speed: average 25Mbit/s 13Mbit/s 14Mbit/s 15Mbit/s 24Mbit/s 9Mbit/s 15Mbit/s 10Mbit/s 24Mbit/s 12Mbit/s 14Mbit/s 16Mbit/s
YouTube
% of HD streams 100% 100% 97% 100% 99% 94% 96% 97% 99% 99% 99% 94%
Time to first picture: average 2.2s - 2.6s 2.0s 2.1s - 2.1s 2.3s 2.2s - 2.6s 2.3s
Video Quality: average MOS 4 - 4 4 4 - 4 4 4 - 4 4
Response time: average 37ms 44ms 49ms 47ms 26ms 43ms 35ms 41ms 29ms 41ms 42ms 40ms
Voice calls
Mobile to Mobile call success rate 99% 99% 99% 99% - - - - 99% 95% 99% 99%
Mobile to mobile call quality: average MOS
4 3 4 4 - - - - 4 3 3 4

28


0