SMARTER TRADE BETTER FUTURE - DP World
77
ANNUAL REPORT AND ACCOUNTS 2018 SMARTER TRADE BETTER FUTURE
Transcript of SMARTER TRADE BETTER FUTURE - DP World
ANNUAL REPORT AND ACCOUNTS 2018
ANN
UAL
REP
ORT
AN
D A
CCO
UN
TS 2
018
2018
م عا
ت لابا
سلح
واي
نوس
الير
قرالت SMARTER TRADE
BETTER FUTURE
IN AN AGE OF UNPRECEDENTED CHANGE, DP WORLD IS ADOPTING DATA-DRIVEN LOGISTICS IN PURSUIT OF SUSTAINABLE SOLUTIONS THAT TRANSFORM OUR BUSINESS AND HELP US LEAD THE FUTURE OF GLOBAL TRADE.
As an integral part of the supply chain, we create opportunities and value for our stakeholders to make trade smarter, faster, safer and more beneficial for all.
Registered Address:Office 27, Level 3, Gate Village Building 4, Dubai International Financial Centre, PO Box 17000, Dubai, UAETelephone: +971 4 8811110www.dpworld.com
C O N T E N T SCompany OverviewHighlights 1What We Do 2
Strategic ReportGlobal Footprint 4Group Chairman and Chief Executive Officer’s Statement 6A Year in Review 10Our Market 14Business Model 16Our Strategy 18Smarter Trade Better Future Case Studies 20Group Chief Financial Officer’s Review 36Risk Management 38Key Performance Indicators 46Sustainability and Impact 48
Corporate GovernanceBoard of Directors 60Report of the Directors 62Chairman’s introduction 64Corporate Governance 66Statement of Directors’ Responsibilities 83
Financial StatementsIndependent Auditors’ Report 84Consolidated Statement of Profit or Loss 89Consolidated Statement of Other Comprehensive Income 90Consolidated Statement of Financial Position 91Consolidated Statement of Changes in Equity 92Consolidated Statement of Cash Flows 93Notes to the Consolidated Financial Statements 94
Read Our Company Overview on page 2
O U R P U R P O S E
SMARTER TRADEBETTER FUTURE
E N A B L I N G S M A R T E R T R A D ETo make trade faster, more controllable, more sustainable and more cost-efficient, through developments in infrastructure,
logistics and innovative applications of digital technology.
TO M A K E A B E T T E R F U T U R E F O R E V E RYO N E Combining the promise of more business value for
customers and shareholders with benefit for society through economic growth and social progress.
B U I L D A L EG AC Y I N S O C I E T Y Smarter trade helps nations grow, supports
business, creates jobs and raises living standards.
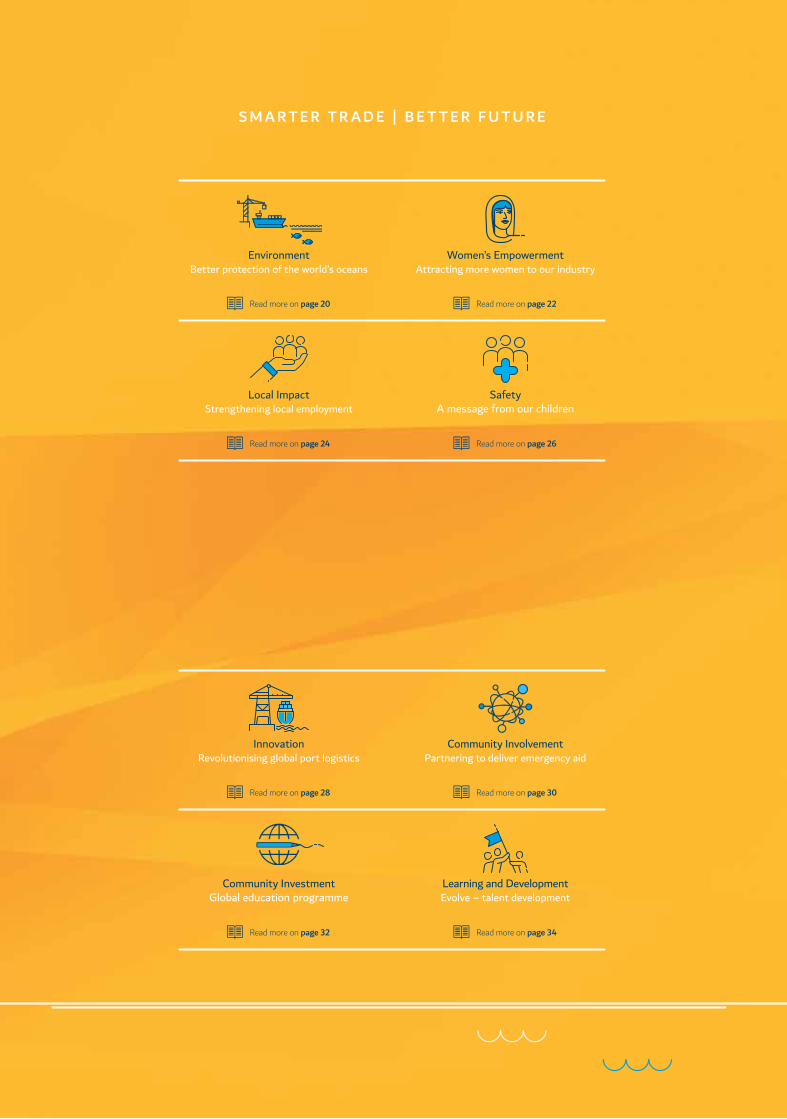
S M A R T E R T R A D E | B E T T E R F U T U R E
Read more on page 20
EnvironmentBetter protection of the world’s oceans
Read more on page 24
Local ImpactStrengthening local employment
Read more on page 30
Community InvolvementPartnering to deliver emergency aid
Read more on page 26
SafetyA message from our children
Read more on page 32
Community InvestmentGlobal education programme
Read more on page 22
Women’s EmpowermentAttracting more women to our industry
Read more on page 28
InnovationRevolutionising global port logistics
Read more on page 34
Learning and DevelopmentEvolve – talent development
DP World Annual Report and Accounts 2018 | 1
Company Overview Corporate Governance Financial StatementsStrategic Report
2018
2017
2016
2015
2014
5,646
4,715
4,163
3,968
3,411
2018
2017
2016
2015
2014
1,270
1,209
1,127
883
675
2018
2017
2016
2015
2014
2,808
2,469
2,263
1,928
1,588
2018
2017
2016
2015
2014
49.7
52.4
54.4
48.6
46.6
O P E R AT I O N A L H I G H L I G H T SS T R AT EG I C H I G H L I G H T S
F I N A N C I A L H I G H L I G H T S
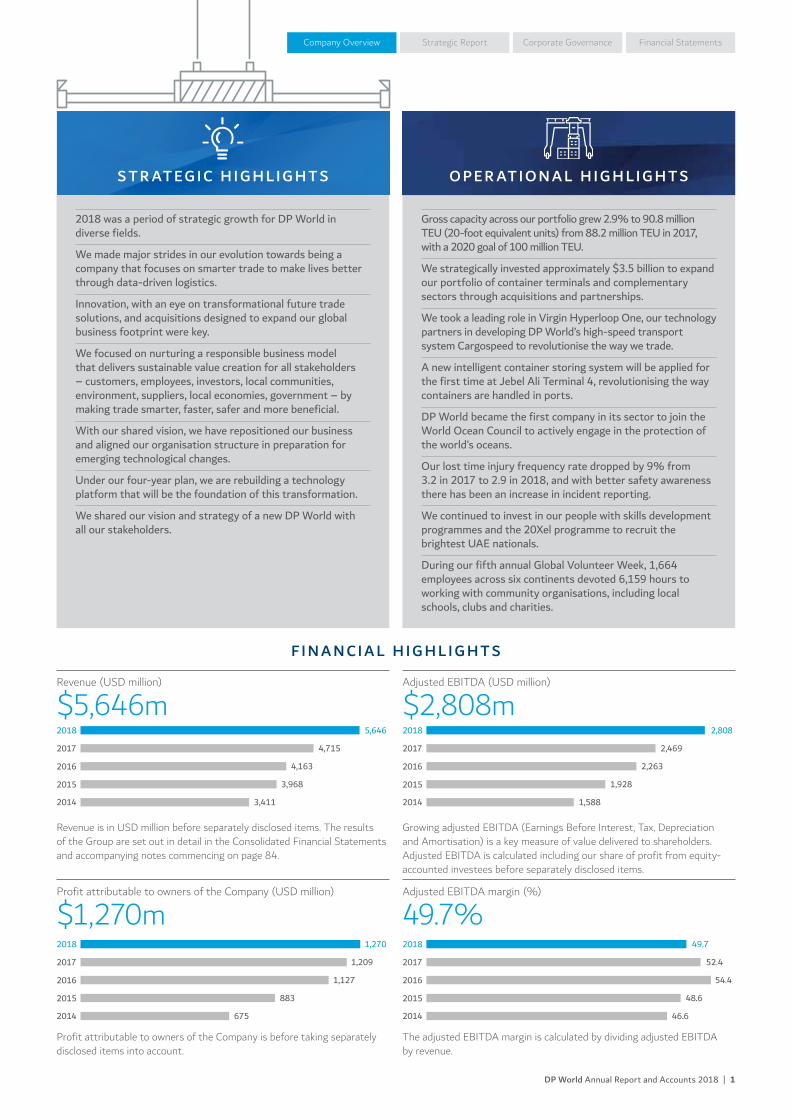
Revenue (USD million)
$5,646m
Revenue is in USD million before separately disclosed items. The results of the Group are set out in detail in the Consolidated Financial Statements and accompanying notes commencing on page 84.
Profit attributable to owners of the Company is before taking separately disclosed items into account.
Growing adjusted EBITDA (Earnings Before Interest, Tax, Depreciation and Amortisation) is a key measure of value delivered to shareholders. Adjusted EBITDA is calculated including our share of profit from equity-accounted investees before separately disclosed items.
The adjusted EBITDA margin is calculated by dividing adjusted EBITDA by revenue.
Profit attributable to owners of the Company (USD million)
$1,270m
Adjusted EBITDA (USD million)
$2,808m
Adjusted EBITDA margin (%)
49.7%
2018 was a period of strategic growth for DP World in diverse fields.
We made major strides in our evolution towards being a company that focuses on smarter trade to make lives better through data-driven logistics.
Innovation, with an eye on transformational future trade solutions, and acquisitions designed to expand our global business footprint were key.
We focused on nurturing a responsible business model that delivers sustainable value creation for all stakeholders – customers, employees, investors, local communities, environment, suppliers, local economies, government – by making trade smarter, faster, safer and more beneficial.
With our shared vision, we have repositioned our business and aligned our organisation structure in preparation for emerging technological changes.
Under our four-year plan, we are rebuilding a technology platform that will be the foundation of this transformation.
We shared our vision and strategy of a new DP World with all our stakeholders.
Gross capacity across our portfolio grew 2.9% to 90.8 million TEU (20-foot equivalent units) from 88.2 million TEU in 2017, with a 2020 goal of 100 million TEU.
We strategically invested approximately $3.5 billion to expand our portfolio of container terminals and complementary sectors through acquisitions and partnerships.
We took a leading role in Virgin Hyperloop One, our technology partners in developing DP World’s high-speed transport system Cargospeed to revolutionise the way we trade.
A new intelligent container storing system will be applied for the first time at Jebel Ali Terminal 4, revolutionising the way containers are handled in ports.
DP World became the first company in its sector to join the World Ocean Council to actively engage in the protection of the world’s oceans.
Our lost time injury frequency rate dropped by 9% from 3.2 in 2017 to 2.9 in 2018, and with better safety awareness there has been an increase in incident reporting.
We continued to invest in our people with skills development programmes and the 20Xel programme to recruit the brightest UAE nationals.
During our fifth annual Global Volunteer Week, 1,664 employees across six continents devoted 6,159 hours to working with community organisations, including local schools, clubs and charities.
DP World Annual Report and Accounts 2018 | 32 | DP World Annual Report and Accounts 2018
Company Overview Corporate Governance Financial StatementsStrategic ReportW H AT W E D O
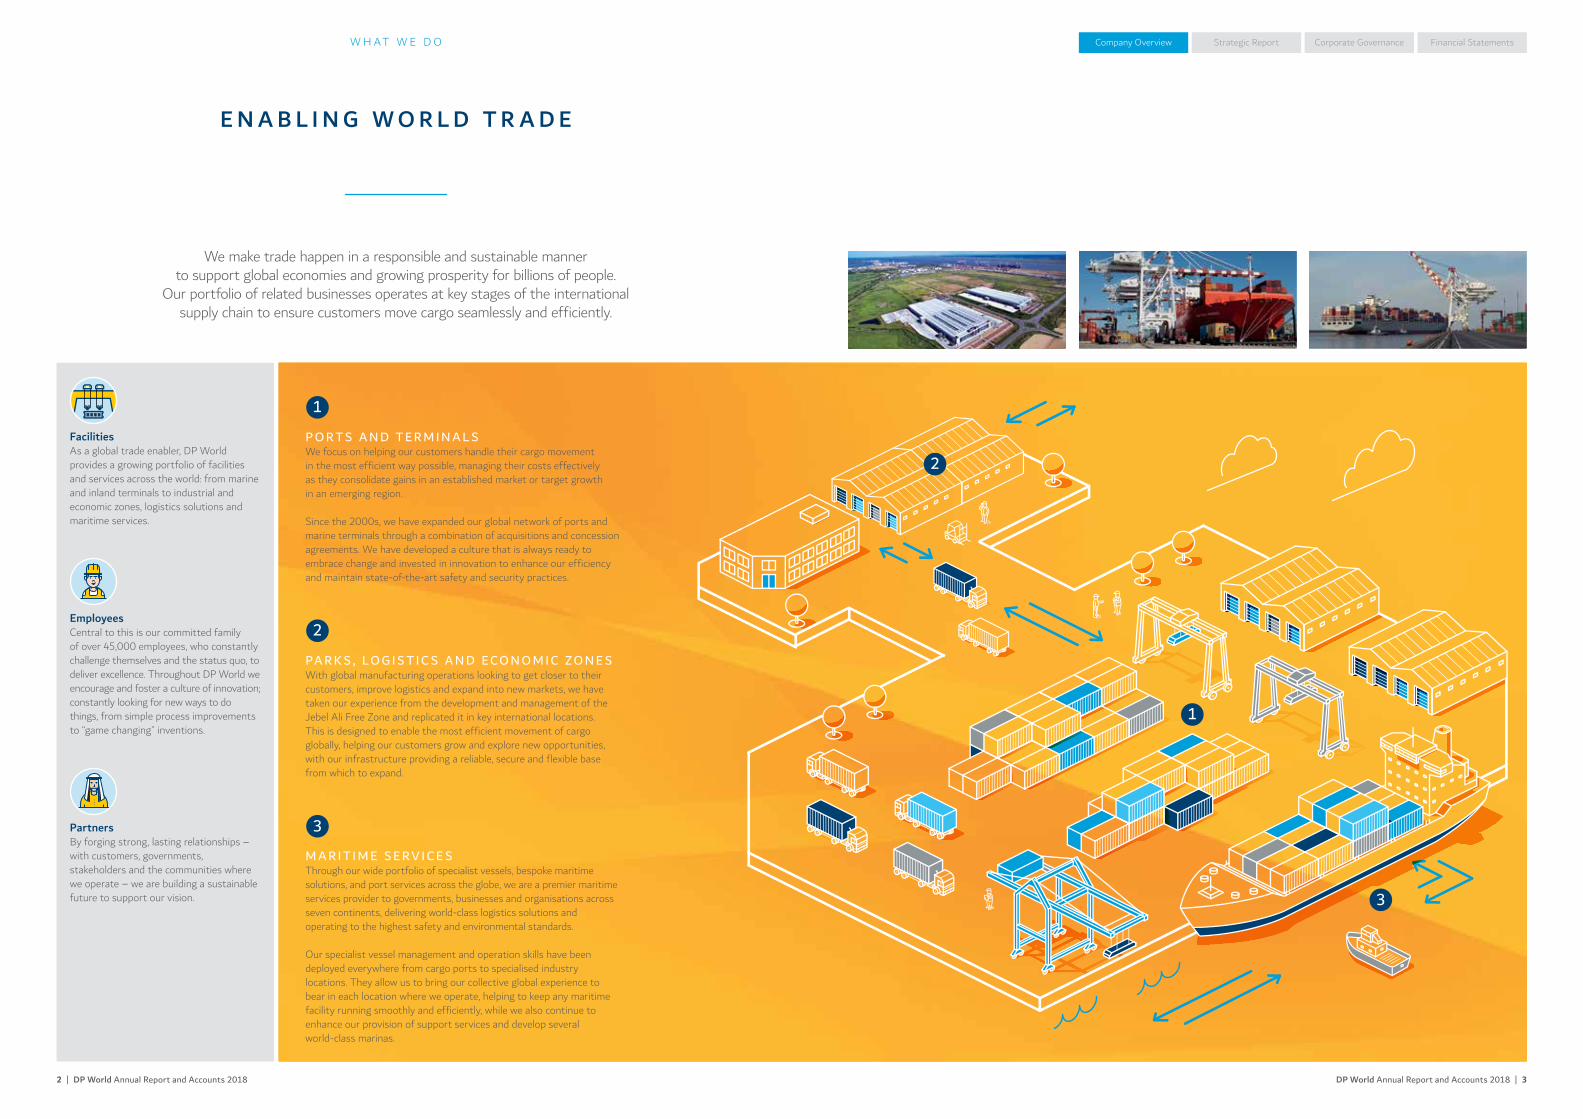
E N A B L I N G W O R L D T R A D E
We make trade happen in a responsible and sustainable manner to support global economies and growing prosperity for billions of people.
Our portfolio of related businesses operates at key stages of the international supply chain to ensure customers move cargo seamlessly and efficiently.
FacilitiesAs a global trade enabler, DP World provides a growing portfolio of facilities and services across the world: from marine and inland terminals to industrial and economic zones, logistics solutions and maritime services.
EmployeesCentral to this is our committed family of over 45,000 employees, who constantly challenge themselves and the status quo, to deliver excellence. Throughout DP World we encourage and foster a culture of innovation; constantly looking for new ways to do things, from simple process improvements to “game changing” inventions.
PartnersBy forging strong, lasting relationships – with customers, governments, stakeholders and the communities where we operate – we are building a sustainable future to support our vision.
P O R T S A N D T E R M I N A L SWe focus on helping our customers handle their cargo movement in the most efficient way possible, managing their costs effectively as they consolidate gains in an established market or target growth in an emerging region.
Since the 2000s, we have expanded our global network of ports and marine terminals through a combination of acquisitions and concession agreements. We have developed a culture that is always ready to embrace change and invested in innovation to enhance our efficiency and maintain state-of-the-art safety and security practices.
1
PA R K S , L O G I S T I C S A N D EC O N O M I C ZO N E SWith global manufacturing operations looking to get closer to their customers, improve logistics and expand into new markets, we have taken our experience from the development and management of the Jebel Ali Free Zone and replicated it in key international locations. This is designed to enable the most efficient movement of cargo globally, helping our customers grow and explore new opportunities, with our infrastructure providing a reliable, secure and flexible base from which to expand.
2
M A R I T I M E S E R V I C E SThrough our wide portfolio of specialist vessels, bespoke maritime solutions, and port services across the globe, we are a premier maritime services provider to governments, businesses and organisations across seven continents, delivering world-class logistics solutions and operating to the highest safety and environmental standards.
Our specialist vessel management and operation skills have been deployed everywhere from cargo ports to specialised industry locations. They allow us to bring our collective global experience to bear in each location where we operate, helping to keep any maritime facility running smoothly and efficiently, while we also continue to enhance our provision of support services and develop several world-class marinas.
3
2
1
3
DP World Annual Report and Accounts 2018 | 54 | DP World Annual Report and Accounts 2018
Company Overview Corporate Governance Financial StatementsStrategic ReportG L O B A L F O O T P R I N T
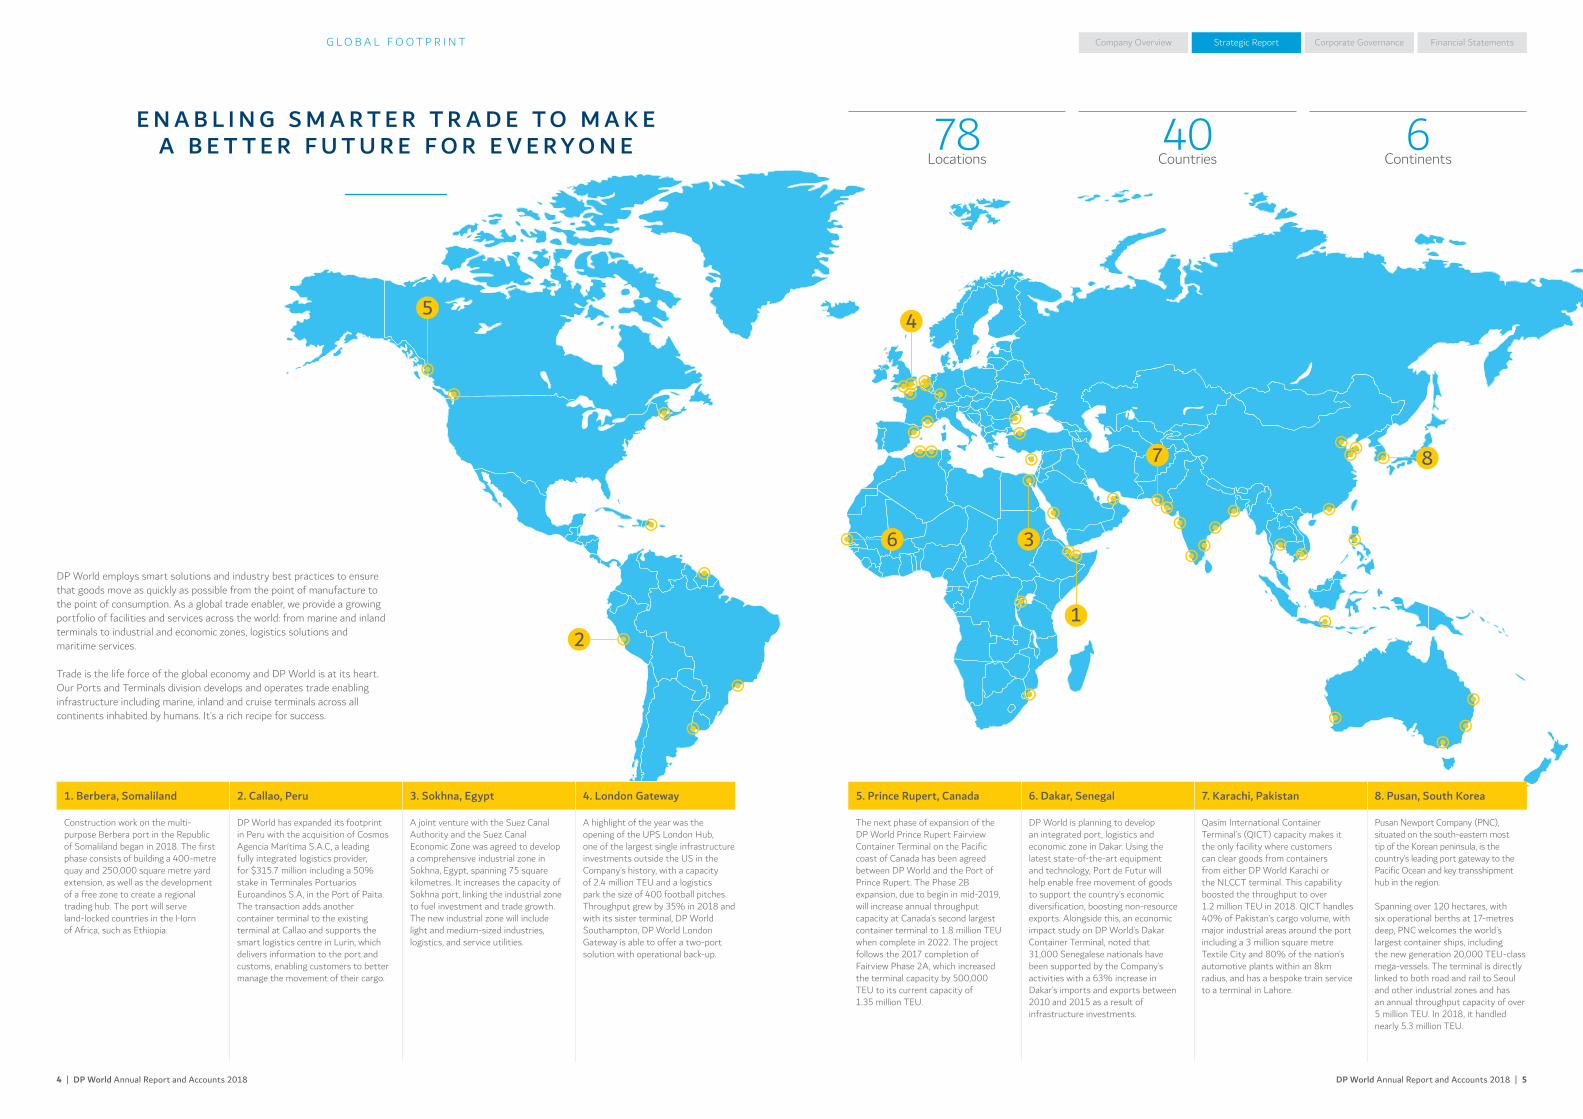
E N A B L I N G S M A R T E R T R A D E T O M A K E A B E T T E R F U T U R E F O R E V E R Y O N E
1. Berbera, Somaliland
Construction work on the multi-purpose Berbera port in the Republic of Somaliland began in 2018. The first phase consists of building a 400-metre quay and 250,000 square metre yard extension, as well as the development of a free zone to create a regional trading hub. The port will serve land-locked countries in the Horn of Africa, such as Ethiopia.
2. Callao, Peru
DP World has expanded its footprint in Peru with the acquisition of Cosmos Agencia Marítima S.A.C, a leading fully integrated logistics provider, for $315.7 million including a 50% stake in Terminales Portuarios Euroandinos S.A, in the Port of Paita. The transaction adds another container terminal to the existing terminal at Callao and supports the smart logistics centre in Lurin, which delivers information to the port and customs, enabling customers to better manage the movement of their cargo.
3. Sokhna, Egypt
A joint venture with the Suez Canal Authority and the Suez Canal Economic Zone was agreed to develop a comprehensive industrial zone in Sokhna, Egypt, spanning 75 square kilometres. It increases the capacity of Sokhna port, linking the industrial zone to fuel investment and trade growth. The new industrial zone will include light and medium-sized industries, logistics, and service utilities.
4. London Gateway
A highlight of the year was the opening of the UPS London Hub, one of the largest single infrastructure investments outside the US in the Company’s history, with a capacity of 2.4 million TEU and a logistics park the size of 400 football pitches. Throughput grew by 35% in 2018 and with its sister terminal, DP World Southampton, DP World London Gateway is able to offer a two-port solution with operational back-up.
5. Prince Rupert, Canada
The next phase of expansion of the DP World Prince Rupert Fairview Container Terminal on the Pacific coast of Canada has been agreed between DP World and the Port of Prince Rupert. The Phase 2B expansion, due to begin in mid-2019, will increase annual throughput capacity at Canada’s second largest container terminal to 1.8 million TEU when complete in 2022. The project follows the 2017 completion of Fairview Phase 2A, which increased the terminal capacity by 500,000 TEU to its current capacity of 1.35 million TEU.
6. Dakar, Senegal
DP World is planning to develop an integrated port, logistics and economic zone in Dakar. Using the latest state-of-the-art equipment and technology, Port de Futur will help enable free movement of goods to support the country’s economic diversification, boosting non-resource exports. Alongside this, an economic impact study on DP World’s Dakar Container Terminal, noted that 31,000 Senegalese nationals have been supported by the Company’s activities with a 63% increase in Dakar’s imports and exports between 2010 and 2015 as a result of infrastructure investments.
7. Karachi, Pakistan
Qasim International Container Terminal’s (QICT) capacity makes it the only facility where customers can clear goods from containers from either DP World Karachi or the NLCCT terminal. This capability boosted the throughput to over 1.2 million TEU in 2018. QICT handles 40% of Pakistan’s cargo volume, with major industrial areas around the port including a 3 million square metre Textile City and 80% of the nation’s automotive plants within an 8km radius, and has a bespoke train service to a terminal in Lahore.
8. Pusan, South Korea
Pusan Newport Company (PNC), situated on the south-eastern most tip of the Korean peninsula, is the country’s leading port gateway to the Pacific Ocean and key transshipment hub in the region.
Spanning over 120 hectares, with six operational berths at 17-metres deep, PNC welcomes the world’s largest container ships, including the new generation 20,000 TEU-class mega-vessels. The terminal is directly linked to both road and rail to Seoul and other industrial zones and has an annual throughput capacity of over 5 million TEU. In 2018, it handled nearly 5.3 million TEU.
DP World employs smart solutions and industry best practices to ensure that goods move as quickly as possible from the point of manufacture to the point of consumption. As a global trade enabler, we provide a growing portfolio of facilities and services across the world: from marine and inland terminals to industrial and economic zones, logistics solutions and maritime services.
Trade is the life force of the global economy and DP World is at its heart. Our Ports and Terminals division develops and operates trade enabling infrastructure including marine, inland and cruise terminals across all continents inhabited by humans. It’s a rich recipe for success.
78Locations
40Countries
6Continents

DP World Annual Report and Accounts 2018 | 7
Company Overview Corporate Governance Financial StatementsStrategic Report
6 | DP World Annual Report and Accounts 2018
G R O U P C H A I R M A N A N D C H I E F E X E C U T I V E O F F I C E R ’ S S TAT E M E N T
A P P R O X I M AT E LY $ 3 . 5 B I L L I O N I N V E S T E D I N A C Q U I S I T I O N S A N D E X PA N S I O N S T O W I D E N
G L O B A L F O O T P R I N T
S T R AT E G I C G R O W T H W I T H A F O C U S O N S U S TA I N A B L E S O L U T I O N S
2018 was a successful year and a period of strategic growth for our business, with a focus on smarter trade to make lives better through data-driven logistics. Innovation, with an eye on sustainable future trade solutions, and acquisitions designed to expand our global business footprint were twin themes.
Despite the challenging global economic uncertainties, we have experienced continued revenue growth. We achieved this by focusing on high-value cargo, operational efficiencies and consistently delivering value to our customers through smart solutions. We are committed to continuing to build on the gains of the past year as we enter 2019.
I’m pleased to report that we delivered another strong set of financial results. On a reported basis, revenue grew 19.8% and adjusted EBITDA increased by 13.7%. Adjusted EBITDA margin was 49.7%, delivering profit attributable to owners of the Company, before separately disclosed items, of $1,270 million.
Our balance sheet remains strong and we continue to generate high levels of cash flow, which gives us the ability to invest in the future growth of our current portfolio and the flexibility to make new investments should the right opportunities arise. Going forward, we aim to integrate our new acquisitions and we continue to extend our core business into port-related, maritime, transportation and logistics sectors, with the objective of removing inefficiencies in global trade, improving the quality of our earnings and driving returns.
Volume MilestonesOur global network of 78 marine and inland cargo terminals, plus our growing portfolio of trade-enabling infrastructure and services, allowed us to move decisively towards our vision of leading the future of global trade.
During the year, we experienced a deceleration in our volume growth due to the strong prior year performance and general caution in the market given the prevailing uncertainty in global trade. The weakness was particularly felt in the UAE region, mainly due to loss of low-margin throughput, where our focus remains on profitable cargo and, while the near term volume outlook in Jebel Ali remains challenging, we have taken measures to maintain profitability.
We handled 71.4 million TEU (20-foot equivalent units) globally, with gross container volumes growing by 1.9% year-on-year on a reported basis and 2.9% on a like-for-like basis. The UAE handled 15 million TEU, down 2.7% year-on-year, due to the challenging macro-environment and loss of lower-margin cargo. Growth in Europe remained robust with strong growth in London Gateway (UK) and Rotterdam (Netherlands).
Innovation and Global MarketsWe invested in revolutionary new technologies, diversified our global business portfolio through investments and acquisitions worth approximately $3.5 billion and supported environmental initiatives around the world.
Our headline projects included the launch of DP World Cargospeed with Virgin Hyperloop One and taking over leadership of the technology company, digital transformation of business operations across our global portfolio, the High Bay Storage system for containers at Jebel Ali and the successful launch of a $3 billion investment platform in India. Elsewhere, we acquired complementary businesses in Europe, India and Peru, unveiled container port development projects in Africa and completed the 100% acquisition of Drydocks World LLC.
The $3 billion investment platform in India with the government’s National Infrastructure Investment Fund (NIIF) saw us acquire Continental Warehousing Corporation (Nhava Seva) Ltd. Complementary businesses were also added to our global portfolio in Europe with the Unifeeder Group.
Africa remained a location of focus for the Group. We signed an agreement with the Suez Canal Economic Zone (SCZone) to implement the first phase of an integrated industrial and residential zone in Sokhna, Egypt. We will also soon build and operate a 1,000-hectare modern logistics hub outside of Bamako in the Republic of Mali. In the Democratic Republic of the Congo, we announced a new concession for the management and development of a greenfield multi-purpose port at Banana, the first deep-sea port in the country along its small coastline of 37 kilometres.
F O U N D E R ’ S P R I N C I P L E S
W H AT D O E S S U S TA I N A B I L I T Y M E A N TO D P W O R L D?
As a leading global business, we have long been committed to sustainability and Our World, Our Future sustainability strategy helps us focus on key areas like people, safety, society and environment. But as we look to the future we are excited to use our role as a global trade enabler to drive societal and economic benefit. We know a dramatic increase in developing country participation in trade has coincided with an equally sharp decline in extreme poverty worldwide. For us sustainability means that our business is part of the answer in addressing some of the world’s hardest challenges by driving sustainable and inclusive economic growth, to which everyone can contribute and where we can create a better future for everyone.
Create Growth
Drive Results
Adapt & Evolve
Make Others Excel
Read more on page 9
Read more on page 48

DP World Annual Report and Accounts 2018 | 98 | DP World Annual Report and Accounts 2018
Strategic Report Financial StatementsCorporate GovernanceCompany Overview
Create Growth
Drive Results
Make Others Excel
Adapt & EvolveFOUNDER’SPRINCIPLES
We create growth by seeing what is possible, especially when others don’t.
We are constantly searching for the next and the new and we are not satisfied with ‘enough’.
We create an environment where others succeed. We help people to improve
by helping them to achieve more. Learning and growth are part of
everyday life at DP World.
We make things happen, often in the midst of adversity.
When faced with obstacles, we find ways to deliver.
While finding solutions, we are not confined by the past.
We adapt and evolve to create the future.
G R O U P C H A I R M A N A N D C H I E F E X E C U T I V E O F F I C E R ’ S S TAT E M E N T
( C O N T I N U E D )
Meanwhile, Ethiopia intends to become a shareholder in the Port of Berbera as we invest in infrastructure to develop the Berbera Corridor as a trade gateway for the land-locked nation, which has one of the fastest growing economies in the world. Construction began on the expansion works in Berbera and we look forward to helping the region develop its economic potential.
Elsewhere, our activities in Kazakhstan developed further as we signed two framework agreements to run Special Economic Zones (SEZ) in Aktau and Khorgos, which act as primary transit points for trans-Eurasian cargo trains.
In the Americas, we have agreed terms for the next phase of expansion for the DP World Prince Rupert Fairview Container Terminal on the Pacific coast of Canada. Alongside this, in Europe, a new cruise passenger terminal at DP World Limassol in Cyprus opened, providing world-class facilities and services for passengers.
SustainabilityWe believe that working in a sustainable and responsible way is essential to building a strong business for our customers, our people and our society. The UN Sustainable Development Goals (SDGs) are important to DP World and fit with our intention to work in a sustainable and responsible way.
Through DP World’s wide-ranging sustainability initiatives – brought together under Our World, Our Future – we are already helping address the SDGs in different ways. In 2018, we launched two new pillars: Women’s empowerment and Oceans, building on our commitments and using the SDGs as our framework to find innovative solutions to global issues.
People development was the other key area of focus, and through association with the Erasmus University in Rotterdam, we developed a strategic skills development programme. Following the successful roll-out of our 20Xel leadership programme for UAE national graduates, we are now seeking a new batch of applicants to join the next intake. The programme
provides participants with management opportunities, across a range of focus areas, involving leadership training and contact with senior management, developing business skills and experiencing coaching and networking opportunities to build successful leadership habits, while learning about DP World’s global business.
Corporate Governance and BoardWe continue to develop and adopt robust corporate governance practices and integrate them into DP World’s culture and business model, which adds value to our corporate performance, improves our strategic vision, and enables us to run our business more effectively, monitoring and addressing the risks that we face. The Corporate Governance report can be found on page 60.
Our Board remains at the centre of DP World’s corporate governance framework and possesses an exceptional balance of skills, experience and diversity to lead DP World effectively. The Board ensures that our business is managed prudently to drive sustained long term value for our shareholders and achieve our goals.
In 2016, I was appointed by the shareholders to the position of Group Chief Executive Officer, in addition to my role as Group Chairman that I have held since 2007. I have been proud to lead DP World with the support of a strong and dedicated Board and look forward to maintaining our drive to greater growth and success and to achieving our vision as a global business leader. I would like to thank our Board members for their continued support and contribution to the Company’s success.
The full biographies of our Board members and information on the roles and responsibilities of our Board and Board Committees can be found in the Corporate Governance Report.
DividendThe Board is recommending a final dividend of $356.9 million or 43.0 US cents per share, an increase of 4.9%, reflecting a sustainable step change in our earnings. Subject to shareholder approval, the dividend will be paid on 1 May 2019 to shareholders on the register at the close of business on 26 March 2019.
Smarter Trade to Make a Better Future for EveryoneOur gaze is firmly fixed on enabling smarter trade – the essence of what we do and will do in the future. Our success will depend on how we make trade faster, more controllable, more sustainable and efficient through developments in infrastructure, logistics and innovative applications of digital technology.
And it is all for a reason. Not only to make us a better, more agile company, but also to help make a better future for everyone – combining the promise of more business value for customers and shareholders, with benefits for nations, encouraging economic growth and social progress, creating jobs and raising living standards.
That is the legacy of DP World, both now and for future generations.
I would like to thank all of our employees, partners and customers for their contributions in 2018. Our teamwork, dedication and enthusiasm helped us make major strides in pursuit of becoming a business leader, one that sets the smart trade agenda to make lives better – for all of us.
S U LTA N A H M E D B I N S U L AY E MG RO U P C H A IR M A N A N D C EO21 M A RC H 2019
Y E A R O F Z AY E D2018 was the Year of Zayed, the late Founding Father of the UAE. To mark it, DP World rolled out a series of social campaigns and initiatives, including volunteering activities, blood donation, community support that covered over 1,000 beneficiaries, and the distribution of more than 100,000 Iftar meals during Ramadan. Sheikh Zayed’s life-long commitment to sustainability has inspired and shaped DP World’s commitment to economic diversification, innovation, clean energy, and respect for land and marine environments. Our policy of giving back to the community draws its inspiration from Sheikh Zayed’s humanitarianism.
F O U N D E R ’ S P R I N C I P L E S
“Our growth extends beyond the balance sheet, to include the development of our people, industry and the economies and communities in which we operate.”
Sultan Ahmed Bin Sulayem
DP World Annual Report and Accounts 2018 | 1110 | DP World Annual Report and Accounts 2018
Company Overview Corporate Governance Financial StatementsStrategic ReportA Y E A R I N R E V I E W
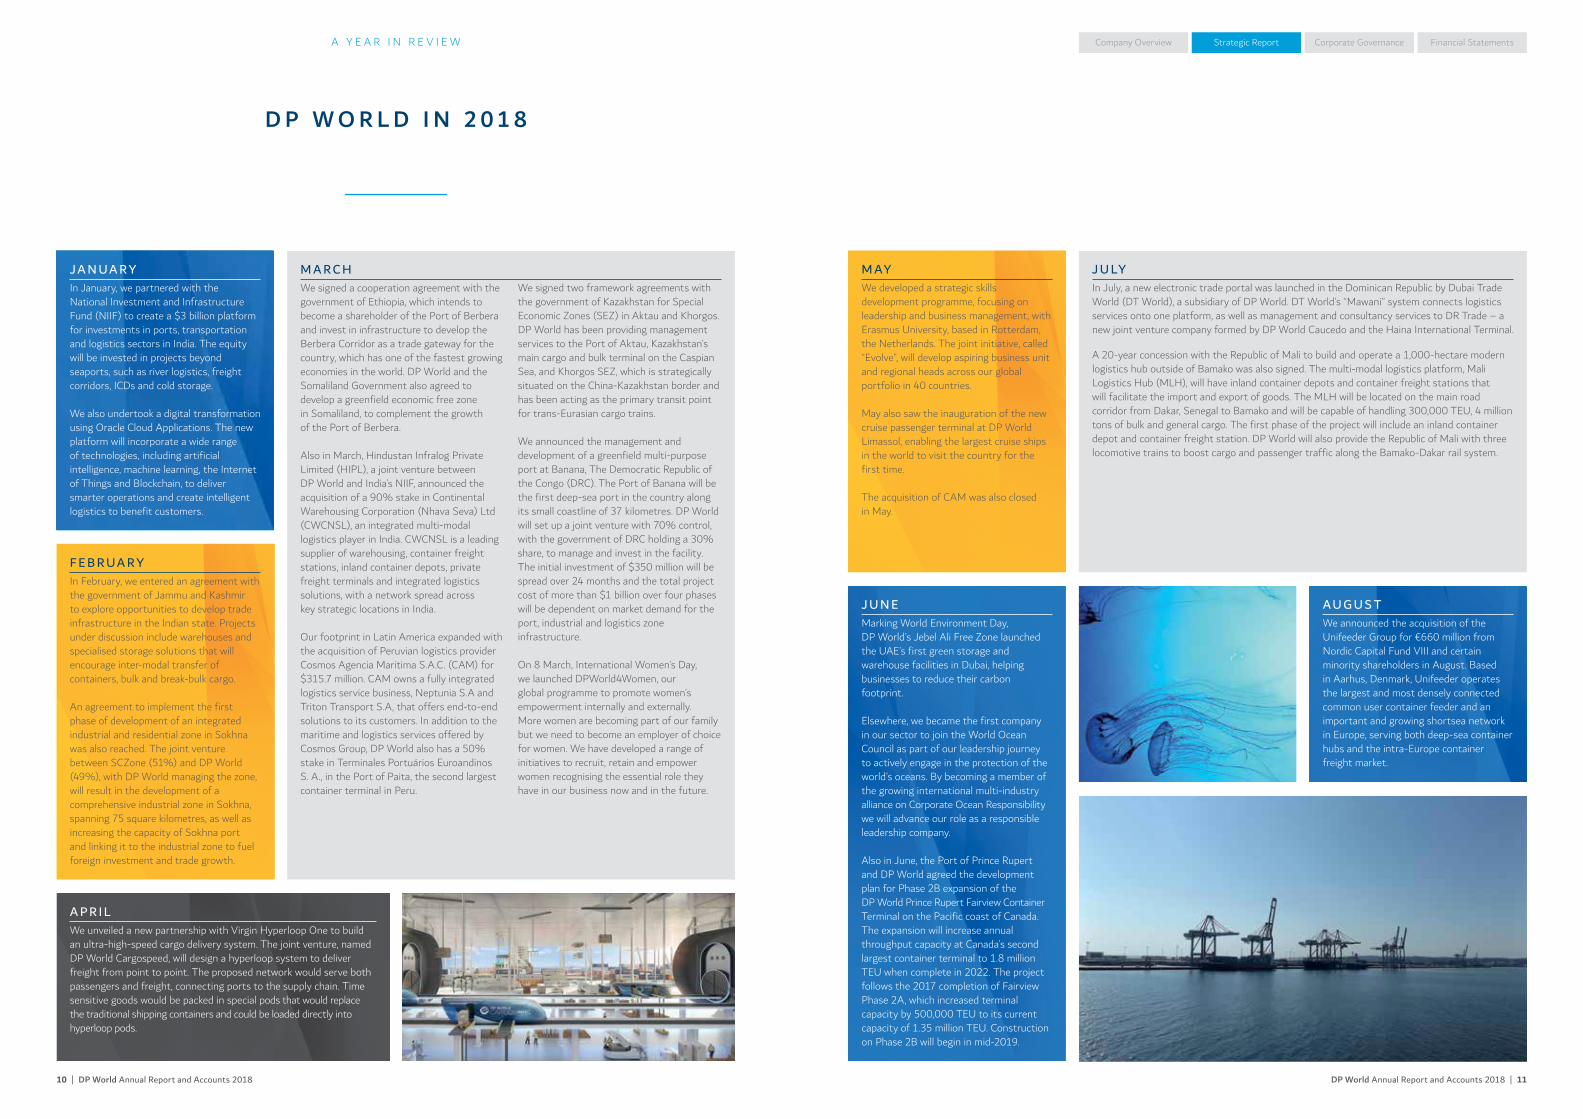
D P W O R L D I N 2 0 1 8
JA N UA RYIn January, we partnered with the National Investment and Infrastructure Fund (NIIF) to create a $3 billion platform for investments in ports, transportation and logistics sectors in India. The equity will be invested in projects beyond seaports, such as river logistics, freight corridors, ICDs and cold storage.
We also undertook a digital transformation using Oracle Cloud Applications. The new platform will incorporate a wide range of technologies, including artificial intelligence, machine learning, the Internet of Things and Blockchain, to deliver smarter operations and create intelligent logistics to benefit customers.
A P R I LWe unveiled a new partnership with Virgin Hyperloop One to build an ultra-high-speed cargo delivery system. The joint venture, named DP World Cargospeed, will design a hyperloop system to deliver freight from point to point. The proposed network would serve both passengers and freight, connecting ports to the supply chain. Time sensitive goods would be packed in special pods that would replace the traditional shipping containers and could be loaded directly into hyperloop pods.
M A R C HWe signed a cooperation agreement with the government of Ethiopia, which intends to become a shareholder of the Port of Berbera and invest in infrastructure to develop the Berbera Corridor as a trade gateway for the country, which has one of the fastest growing economies in the world. DP World and the Somaliland Government also agreed to develop a greenfield economic free zone in Somaliland, to complement the growth of the Port of Berbera.
Also in March, Hindustan Infralog Private Limited (HIPL), a joint venture between DP World and India’s NIIF, announced the acquisition of a 90% stake in Continental Warehousing Corporation (Nhava Seva) Ltd (CWCNSL), an integrated multi-modal logistics player in India. CWCNSL is a leading supplier of warehousing, container freight stations, inland container depots, private freight terminals and integrated logistics solutions, with a network spread across key strategic locations in India.
Our footprint in Latin America expanded with the acquisition of Peruvian logistics provider Cosmos Agencia Maritima S.A.C. (CAM) for $315.7 million. CAM owns a fully integrated logistics service business, Neptunia S.A and Triton Transport S.A, that offers end-to-end solutions to its customers. In addition to the maritime and logistics services offered by Cosmos Group, DP World also has a 50% stake in Terminales Portuários Euroandinos S. A., in the Port of Paita, the second largest container terminal in Peru.
We signed two framework agreements with the government of Kazakhstan for Special Economic Zones (SEZ) in Aktau and Khorgos. DP World has been providing management services to the Port of Aktau, Kazakhstan’s main cargo and bulk terminal on the Caspian Sea, and Khorgos SEZ, which is strategically situated on the China-Kazakhstan border and has been acting as the primary transit point for trans-Eurasian cargo trains.
We announced the management and development of a greenfield multi-purpose port at Banana, The Democratic Republic of the Congo (DRC). The Port of Banana will be the first deep-sea port in the country along its small coastline of 37 kilometres. DP World will set up a joint venture with 70% control, with the government of DRC holding a 30% share, to manage and invest in the facility. The initial investment of $350 million will be spread over 24 months and the total project cost of more than $1 billion over four phases will be dependent on market demand for the port, industrial and logistics zone infrastructure.
On 8 March, International Women’s Day, we launched DPWorld4Women, our global programme to promote women’s empowerment internally and externally. More women are becoming part of our family but we need to become an employer of choice for women. We have developed a range of initiatives to recruit, retain and empower women recognising the essential role they have in our business now and in the future.
J U LYIn July, a new electronic trade portal was launched in the Dominican Republic by Dubai Trade World (DT World), a subsidiary of DP World. DT World’s “Mawani” system connects logistics services onto one platform, as well as management and consultancy services to DR Trade – a new joint venture company formed by DP World Caucedo and the Haina International Terminal.
A 20-year concession with the Republic of Mali to build and operate a 1,000-hectare modern logistics hub outside of Bamako was also signed. The multi-modal logistics platform, Mali Logistics Hub (MLH), will have inland container depots and container freight stations that will facilitate the import and export of goods. The MLH will be located on the main road corridor from Dakar, Senegal to Bamako and will be capable of handling 300,000 TEU, 4 million tons of bulk and general cargo. The first phase of the project will include an inland container depot and container freight station. DP World will also provide the Republic of Mali with three locomotive trains to boost cargo and passenger traffic along the Bamako-Dakar rail system.
F E B R UA RYIn February, we entered an agreement with the government of Jammu and Kashmir to explore opportunities to develop trade infrastructure in the Indian state. Projects under discussion include warehouses and specialised storage solutions that will encourage inter-modal transfer of containers, bulk and break-bulk cargo.
An agreement to implement the first phase of development of an integrated industrial and residential zone in Sokhna was also reached. The joint venture between SCZone (51%) and DP World (49%), with DP World managing the zone, will result in the development of a comprehensive industrial zone in Sokhna, spanning 75 square kilometres, as well as increasing the capacity of Sokhna port and linking it to the industrial zone to fuel foreign investment and trade growth.
J U N EMarking World Environment Day, DP World’s Jebel Ali Free Zone launched the UAE’s first green storage and warehouse facilities in Dubai, helping businesses to reduce their carbon footprint.
Elsewhere, we became the first company in our sector to join the World Ocean Council as part of our leadership journey to actively engage in the protection of the world’s oceans. By becoming a member of the growing international multi-industry alliance on Corporate Ocean Responsibility we will advance our role as a responsible leadership company.
Also in June, the Port of Prince Rupert and DP World agreed the development plan for Phase 2B expansion of the DP World Prince Rupert Fairview Container Terminal on the Pacific coast of Canada. The expansion will increase annual throughput capacity at Canada’s second largest container terminal to 1.8 million TEU when complete in 2022. The project follows the 2017 completion of Fairview Phase 2A, which increased terminal capacity by 500,000 TEU to its current capacity of 1.35 million TEU. Construction on Phase 2B will begin in mid-2019.
AU G U S TWe announced the acquisition of the Unifeeder Group for €660 million from Nordic Capital Fund VIII and certain minority shareholders in August. Based in Aarhus, Denmark, Unifeeder operates the largest and most densely connected common user container feeder and an important and growing shortsea network in Europe, serving both deep-sea container hubs and the intra-Europe container freight market.
M AYWe developed a strategic skills development programme, focusing on leadership and business management, with Erasmus University, based in Rotterdam, the Netherlands. The joint initiative, called “Evolve”, will develop aspiring business unit and regional heads across our global portfolio in 40 countries.
May also saw the inauguration of the new cruise passenger terminal at DP World Limassol, enabling the largest cruise ships in the world to visit the country for the first time.
The acquisition of CAM was also closed in May.

DP World Annual Report and Accounts 2018 | 1312 | DP World Annual Report and Accounts 2018
Company Overview Corporate Governance Financial StatementsStrategic ReportA Y E A R I N R E V I E W
D P W O R L D I N 2 0 1 8 C O N T I N U E D
S EP T E M B E RWe celebrated the third anniversary of the UN Sustainable Development Goals and joined the global campaign #COMPANIES4SDGs developing initiatives to involve and engage our employees in the SDGs.
P U S A N , S O U T H KO R E A C A S E S T U DY
THE Alliance is one of the top three global shipping alliances, the consequence of more than a decade of consolidation within the shipping industry worldwide. As THE Alliance came together it began to
face up to challenges around terminal capacity in Pusan, South Korea.
N OV EM B ERWe joined four other leading global container port operators in a week-long initiative to promote sustainable resource usage in their respective port and facility networks. During the fifth annual Go Green initiative, 8,332 employees of DP World, Hutchison Ports, PSA International, Port of Rotterdam and Shanghai International Port Group collected a total of 1,966kg of aluminium cans and 2,227 mobile phones for recycling.
Virgin Hyperloop One, the only company that has developed a full scale hyperloop system, announced that Sultan Ahmed bin Sulayem, Group Chairman and CEO of DP World, was elected as its new Chairman. Jay Walder, who is one of the world’s leading mass transportation and technology executives, has been appointed as its new CEO. Walder will also join the company’s Board of Directors.
D EC EM B ERWe closed the acquisition of 100% of the Unifeeder Group in December.
A new container storage and stacking project was launched in Jebel Ali Port by DP World and industrial engineering specialists SMS Group. The High Bay Storage, an intelligent storing system, will be applied for the first time ever at Jebel Ali Terminal 4, in time for the Dubai Expo 2020 world fair. Containers are stored in an eleven-story rack, creating 200% more capacity than a conventional container terminal. Each container can be accessed without having to move another one, enabling 100% utilisation in a terminal yard.
O C TO B E RConstruction work on the multi-purpose Port of Berbera in Somaliland started in October. The first phase will consist of building a 400-metre quay and 250,000 square metre yard extension, as well as the development of a free zone to create a new regional trading hub.
HIPL also won the bid to develop and operate the Free Trade Warehousing Zone at India’s largest container gateway – Jawaharlal Nehru Port Trust.
D E N M A R K €660 million acquisition of integrated logistics company Unifeeder Group.
EG Y P T Agreement with the Suez Canal Economic Zone to implement the first phase of an integrated industrial and residential zone in Sokhna, Egypt.
P ER UFootprint in Latin America is extended with the acquisition of Peruvian logistics provider Cosmos Agencia Maritima S.A.C. (CAM) for $315.7 million.
I N D I A The acquisition of Continental Warehousing Corporation, through Hindustan Infralog Private Limited (HIPL), a $3 billion joint venture platform between DP World (65%) and the National Investment and Infrastructure Fund (35%). HIPL also won the bid to develop and operate the Free Trade Warehousing Zone in India.
D R C O N G O Announcement of a new concession for the management and development of a greenfield multi-purpose deep-sea port at Banana, in the Democratic Republic of the Congo.
M A L IAgreement to build and operate a 1,000-hectare modern logistics hub outside of Bamako in the Republic of Mali.
S O M A L I L A N DWe began work on construction of the port and the development of the Berbera Corridor.
C Y P R U SIn Europe, a new cruise passenger terminal at DP World Limassol opened, providing world-class facilities and services for passengers.
K A Z A K H S TA NTwo framework agreements to run Special Economic Zones (SEZ) in Aktau and Khorgos were signed.
C A N A DAIn Canada, terms were agreed for the next phase of expansion for the DP World Prince Rupert Fairview Container Terminal on the Pacific coast.
I N V E S T M E N T H I G H L I G H T S
Each of the five shipping lines involved – Hapag-Lloyd, NYK Line, MOL, K-Line, and Yang Ming – had to split their cargo volumes between two or more terminals. This split operation resulted in inefficiencies and substantial additional costs, especially in transshipment and equipment management. DP World’s Pusan Newport Company (PNC) offered a capacity commitment that would guarantee THE Alliance would only need to use one terminal. This offer won PNC a contract with THE Alliance to be the shipping group’s exclusive terminal in Pusan.
The move allowed THE Alliance member lines to achieve service rationalisation, schedule reliability, improved equipment management and transshipment cost savings. Now, combined annual throughput volume of THE Alliance in Pusan is 3.5 million TEU, representing 17% of the entire port volume and, according to one of the member lines, transshipment costs in Pusan have been reduced by 15%.
DP World Annual Report and Accounts 2018 | 1514 | DP World Annual Report and Accounts 2018
Company Overview Corporate Governance Financial StatementsStrategic ReportO U R M A R K E T
O V E R V I E W O F M A R K E T C O N D I T I O N S
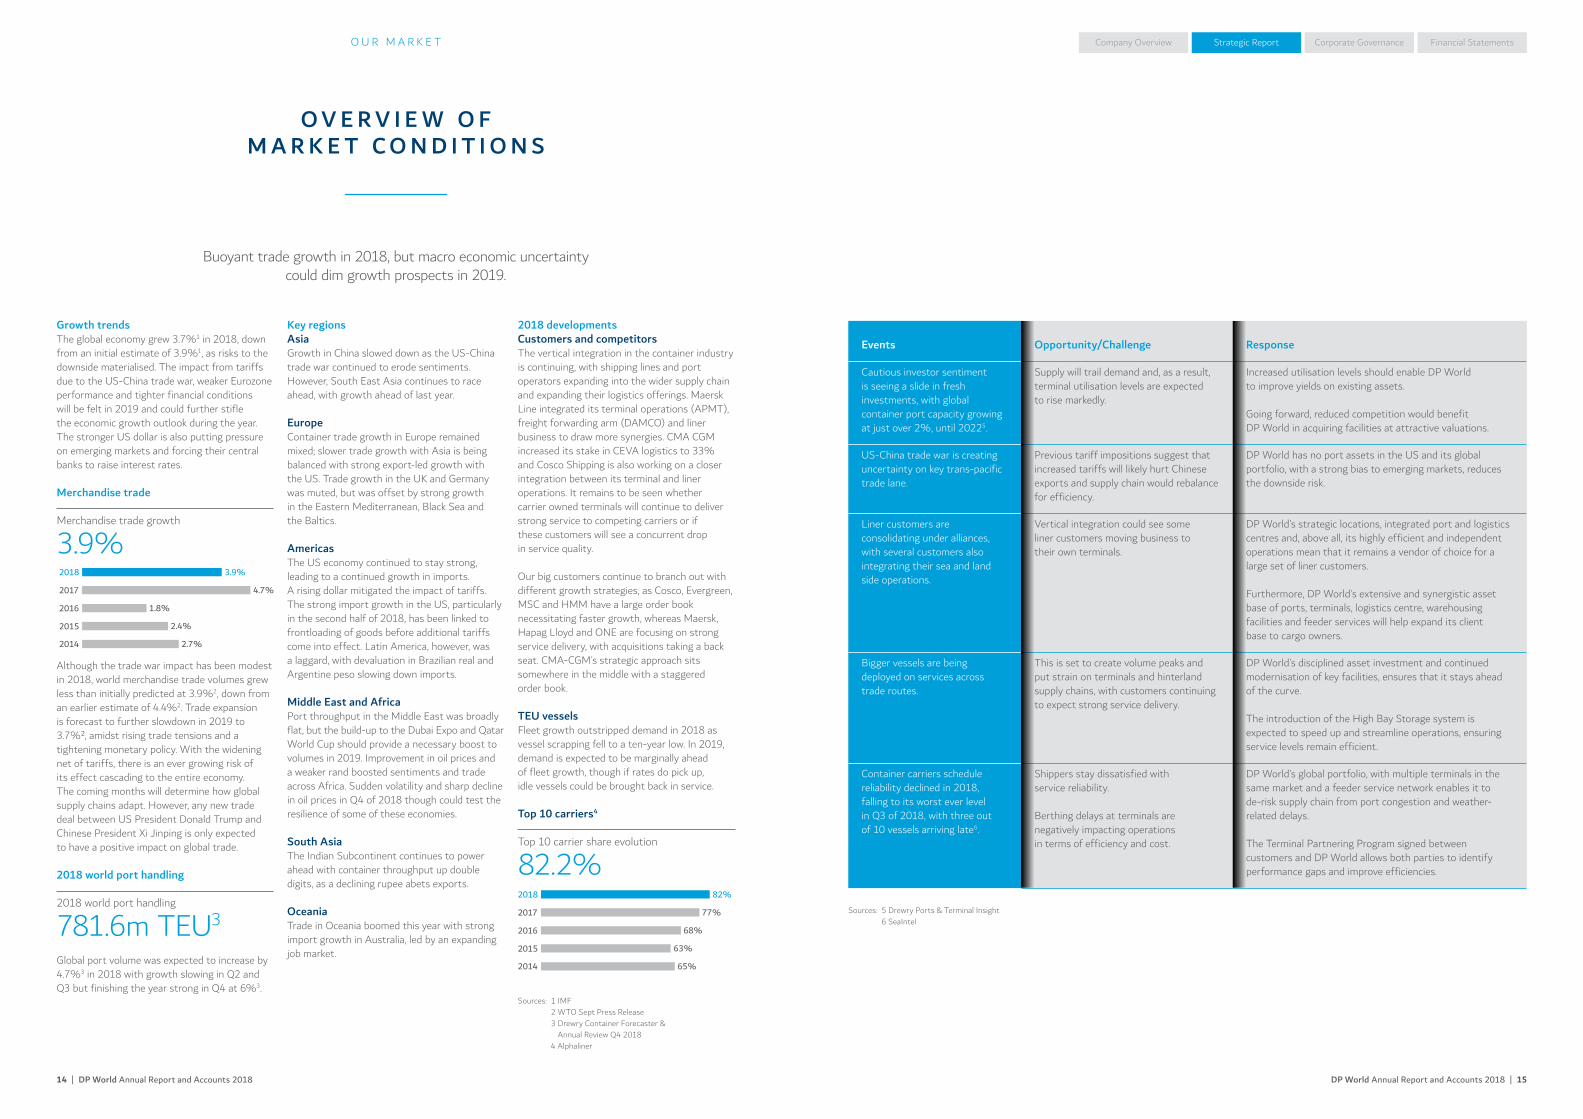
Growth trendsThe global economy grew 3.7%1 in 2018, down from an initial estimate of 3.9%1, as risks to the downside materialised. The impact from tariffs due to the US-China trade war, weaker Eurozone performance and tighter financial conditions will be felt in 2019 and could further stifle the economic growth outlook during the year. The stronger US dollar is also putting pressure on emerging markets and forcing their central banks to raise interest rates.
Merchandise trade
Merchandise trade growth
3.9%2018
2017
2016
2015
2014
3.9%
4.7%
1.8%
2.4%
2.7%
Although the trade war impact has been modest in 2018, world merchandise trade volumes grew less than initially predicted at 3.9%2, down from an earlier estimate of 4.4%2. Trade expansion is forecast to further slowdown in 2019 to 3.7%², amidst rising trade tensions and a tightening monetary policy. With the widening net of tariffs, there is an ever growing risk of its effect cascading to the entire economy. The coming months will determine how global supply chains adapt. However, any new trade deal between US President Donald Trump and Chinese President Xi Jinping is only expected to have a positive impact on global trade.
2018 world port handling
2018 world port handling
781.6m TEU3
Global port volume was expected to increase by 4.7%3 in 2018 with growth slowing in Q2 and Q3 but finishing the year strong in Q4 at 6%3.
Events Opportunity/Challenge Response
Cautious investor sentiment is seeing a slide in fresh investments, with global container port capacity growing at just over 2%, until 20225.
Supply will trail demand and, as a result, terminal utilisation levels are expected to rise markedly.
Increased utilisation levels should enable DP World to improve yields on existing assets.
Going forward, reduced competition would benefit DP World in acquiring facilities at attractive valuations.
US-China trade war is creating uncertainty on key trans-pacific trade lane.
Previous tariff impositions suggest that increased tariffs will likely hurt Chinese exports and supply chain would rebalance for efficiency.
DP World has no port assets in the US and its global portfolio, with a strong bias to emerging markets, reduces the downside risk.
Liner customers are consolidating under alliances, with several customers also integrating their sea and land side operations.
Vertical integration could see some liner customers moving business to their own terminals.
DP World’s strategic locations, integrated port and logistics centres and, above all, its highly efficient and independent operations mean that it remains a vendor of choice for a large set of liner customers.
Furthermore, DP World’s extensive and synergistic asset base of ports, terminals, logistics centre, warehousing facilities and feeder services will help expand its client base to cargo owners.
Bigger vessels are being deployed on services across trade routes.
This is set to create volume peaks and put strain on terminals and hinterland supply chains, with customers continuing to expect strong service delivery.
DP World’s disciplined asset investment and continued modernisation of key facilities, ensures that it stays ahead of the curve.
The introduction of the High Bay Storage system is expected to speed up and streamline operations, ensuring service levels remain efficient.
Container carriers schedule reliability declined in 2018, falling to its worst ever level in Q3 of 2018, with three out of 10 vessels arriving late6.
Shippers stay dissatisfied with service reliability.
Berthing delays at terminals are negatively impacting operations in terms of efficiency and cost.
DP World’s global portfolio, with multiple terminals in the same market and a feeder service network enables it to de-risk supply chain from port congestion and weather-related delays.
The Terminal Partnering Program signed between customers and DP World allows both parties to identify performance gaps and improve efficiencies.
Key regionsAsiaGrowth in China slowed down as the US-China trade war continued to erode sentiments. However, South East Asia continues to race ahead, with growth ahead of last year.
EuropeContainer trade growth in Europe remained mixed; slower trade growth with Asia is being balanced with strong export-led growth with the US. Trade growth in the UK and Germany was muted, but was offset by strong growth in the Eastern Mediterranean, Black Sea and the Baltics.
AmericasThe US economy continued to stay strong, leading to a continued growth in imports. A rising dollar mitigated the impact of tariffs. The strong import growth in the US, particularly in the second half of 2018, has been linked to frontloading of goods before additional tariffs come into effect. Latin America, however, was a laggard, with devaluation in Brazilian real and Argentine peso slowing down imports.
Middle East and AfricaPort throughput in the Middle East was broadly flat, but the build-up to the Dubai Expo and Qatar World Cup should provide a necessary boost to volumes in 2019. Improvement in oil prices and a weaker rand boosted sentiments and trade across Africa. Sudden volatility and sharp decline in oil prices in Q4 of 2018 though could test the resilience of some of these economies.
South AsiaThe Indian Subcontinent continues to power ahead with container throughput up double digits, as a declining rupee abets exports.
OceaniaTrade in Oceania boomed this year with strong import growth in Australia, led by an expanding job market.
2018 developmentsCustomers and competitorsThe vertical integration in the container industry is continuing, with shipping lines and port operators expanding into the wider supply chain and expanding their logistics offerings. Maersk Line integrated its terminal operations (APMT), freight forwarding arm (DAMCO) and liner business to draw more synergies. CMA CGM increased its stake in CEVA logistics to 33% and Cosco Shipping is also working on a closer integration between its terminal and liner operations. It remains to be seen whether carrier owned terminals will continue to deliver strong service to competing carriers or if these customers will see a concurrent drop in service quality.
Our big customers continue to branch out with different growth strategies, as Cosco, Evergreen, MSC and HMM have a large order book necessitating faster growth, whereas Maersk, Hapag Lloyd and ONE are focusing on strong service delivery, with acquisitions taking a back seat. CMA-CGM’s strategic approach sits somewhere in the middle with a staggered order book.
TEU vesselsFleet growth outstripped demand in 2018 as vessel scrapping fell to a ten-year low. In 2019, demand is expected to be marginally ahead of fleet growth, though if rates do pick up, idle vessels could be brought back in service.
Top 10 carriers4
Top 10 carrier share evolution
82.2%2018
2017
2016
2015
2014
82%
77%
68%
63%
65%
Sources: 1 IMF 2 WTO Sept Press Release 3 Drewry Container Forecaster &
Annual Review Q4 2018 4 Alphaliner
Buoyant trade growth in 2018, but macro economic uncertainty could dim growth prospects in 2019.
Sources: 5 Drewry Ports & Terminal Insight 6 SeaIntel
DP World Annual Report and Accounts 2018 | 1716 | DP World Annual Report and Accounts 2018
Company Overview Corporate Governance Financial StatementsStrategic Report
2018 90.878.7
88.279.5
84.675.2
79.677.5
76.178.7
2017
2016
2015
2014
2018 8.4
8.8
9.5
7.9
7.1
2017201620152014
3691
6442
963
2018 14.9
15.1
15.4
15.8
2017201620152014 15.8
B U S I N E S S M O D E L
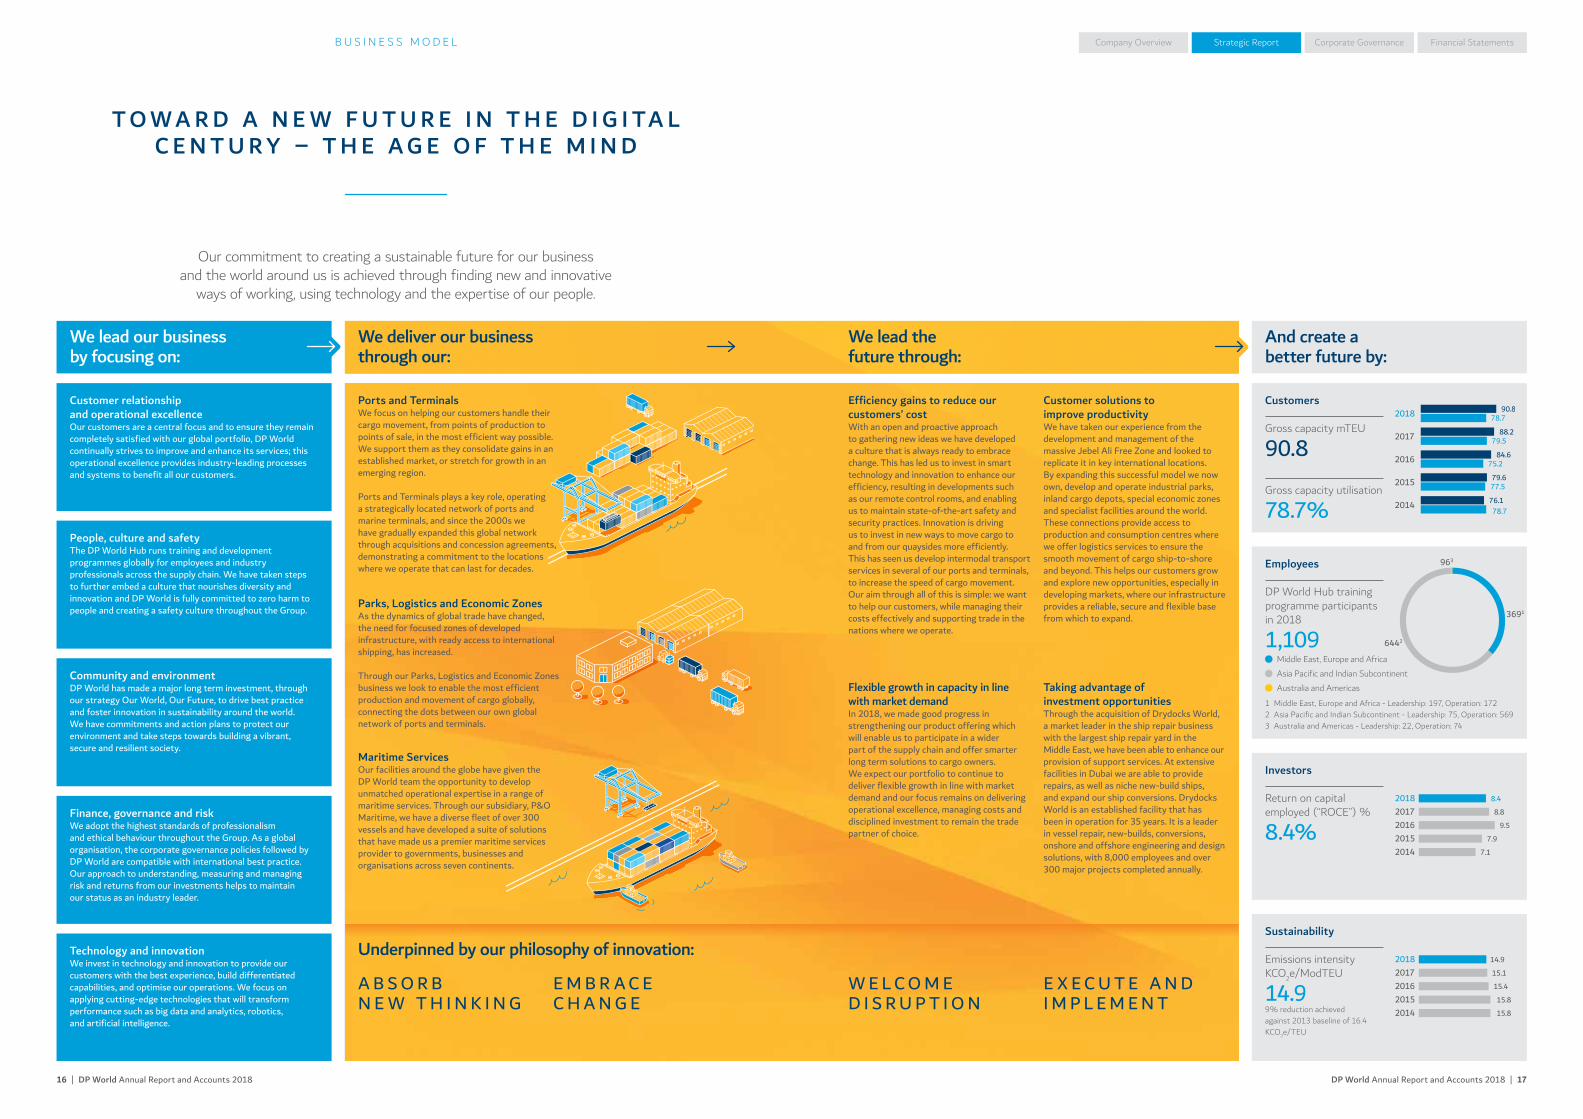
T O W A R D A N E W F U T U R E I N T H E D I G I TA L C E N T U R Y – T H E A G E O F T H E M I N D
Our commitment to creating a sustainable future for our business and the world around us is achieved through finding new and innovative
ways of working, using technology and the expertise of our people.
We lead our business by focusing on:
Customer relationship and operational excellenceOur customers are a central focus and to ensure they remain completely satisfied with our global portfolio, DP World continually strives to improve and enhance its services; this operational excellence provides industry-leading processes and systems to benefit all our customers.
Ports and TerminalsWe focus on helping our customers handle their cargo movement, from points of production to points of sale, in the most efficient way possible. We support them as they consolidate gains in an established market, or stretch for growth in an emerging region.
Ports and Terminals plays a key role, operating a strategically located network of ports and marine terminals, and since the 2000s we have gradually expanded this global network through acquisitions and concession agreements, demonstrating a commitment to the locations where we operate that can last for decades.
Efficiency gains to reduce our customers’ costWith an open and proactive approach to gathering new ideas we have developed a culture that is always ready to embrace change. This has led us to invest in smart technology and innovation to enhance our efficiency, resulting in developments such as our remote control rooms, and enabling us to maintain state-of-the-art safety and security practices. Innovation is driving us to invest in new ways to move cargo to and from our quaysides more efficiently. This has seen us develop intermodal transport services in several of our ports and terminals, to increase the speed of cargo movement. Our aim through all of this is simple: we want to help our customers, while managing their costs effectively and supporting trade in the nations where we operate.
Customer solutions to improve productivityWe have taken our experience from the development and management of the massive Jebel Ali Free Zone and looked to replicate it in key international locations. By expanding this successful model we now own, develop and operate industrial parks, inland cargo depots, special economic zones and specialist facilities around the world. These connections provide access to production and consumption centres where we offer logistics services to ensure the smooth movement of cargo ship-to-shore and beyond. This helps our customers grow and explore new opportunities, especially in developing markets, where our infrastructure provides a reliable, secure and flexible base from which to expand.
Flexible growth in capacity in line with market demandIn 2018, we made good progress in strengthening our product offering which will enable us to participate in a wider part of the supply chain and offer smarter long term solutions to cargo owners. We expect our portfolio to continue to deliver flexible growth in line with market demand and our focus remains on delivering operational excellence, managing costs and disciplined investment to remain the trade partner of choice.
Taking advantage of investment opportunitiesThrough the acquisition of Drydocks World, a market leader in the ship repair business with the largest ship repair yard in the Middle East, we have been able to enhance our provision of support services. At extensive facilities in Dubai we are able to provide repairs, as well as niche new-build ships, and expand our ship conversions. Drydocks World is an established facility that has been in operation for 35 years. It is a leader in vessel repair, new-builds, conversions, onshore and offshore engineering and design solutions, with 8,000 employees and over 300 major projects completed annually.
Parks, Logistics and Economic ZonesAs the dynamics of global trade have changed, the need for focused zones of developed infrastructure, with ready access to international shipping, has increased.
Through our Parks, Logistics and Economic Zones business we look to enable the most efficient production and movement of cargo globally, connecting the dots between our own global network of ports and terminals.
Maritime ServicesOur facilities around the globe have given the DP World team the opportunity to develop unmatched operational expertise in a range of maritime services. Through our subsidiary, P&O Maritime, we have a diverse fleet of over 300 vessels and have developed a suite of solutions that have made us a premier maritime services provider to governments, businesses and organisations across seven continents.
A B S O R B N E W T H I N K I N G
E M B R A C E C H A N G E
W E L C O M E D I S R U P T I O N
E X E C U T E A N D I M P L E M E N T
Customers
Gross capacity mTEU
90.8 Gross capacity utilisation
78.7%People, culture and safetyThe DP World Hub runs training and development programmes globally for employees and industry professionals across the supply chain. We have taken steps to further embed a culture that nourishes diversity and innovation and DP World is fully committed to zero harm to people and creating a safety culture throughout the Group.
Community and environmentDP World has made a major long term investment, through our strategy Our World, Our Future, to drive best practice and foster innovation in sustainability around the world. We have commitments and action plans to protect our environment and take steps towards building a vibrant, secure and resilient society.
Finance, governance and riskWe adopt the highest standards of professionalism and ethical behaviour throughout the Group. As a global organisation, the corporate governance policies followed by DP World are compatible with international best practice. Our approach to understanding, measuring and managing risk and returns from our investments helps to maintain our status as an industry leader.
Technology and innovationWe invest in technology and innovation to provide our customers with the best experience, build differentiated capabilities, and optimise our operations. We focus on applying cutting-edge technologies that will transform performance such as big data and analytics, robotics, and artificial intelligence.
We deliver our business through our:
Underpinned by our philosophy of innovation:
We lead the future through:
And create a better future by:
Employees
DP World Hub training programme participants in 2018
1,109
Investors
Return on capital employed (“ROCE”) %
8.4%
Sustainability
Emissions intensity KCO2e/ModTEU
14.99% reduction achieved against 2013 baseline of 16.4 KCO2e/TEU
Middle East, Europe and Africa Asia Pacific and Indian Subcontinent Australia and Americas
1 Middle East, Europe and Africa - Leadership: 197, Operation: 1722 Asia Pacific and Indian Subcontinent - Leadership: 75, Operation: 5693 Australia and Americas - Leadership: 22, Operation: 74
DP World Annual Report and Accounts 2018 | 1918 | DP World Annual Report and Accounts 2018
Company Overview Corporate Governance Financial StatementsStrategic ReportO U R S T R AT E G Y
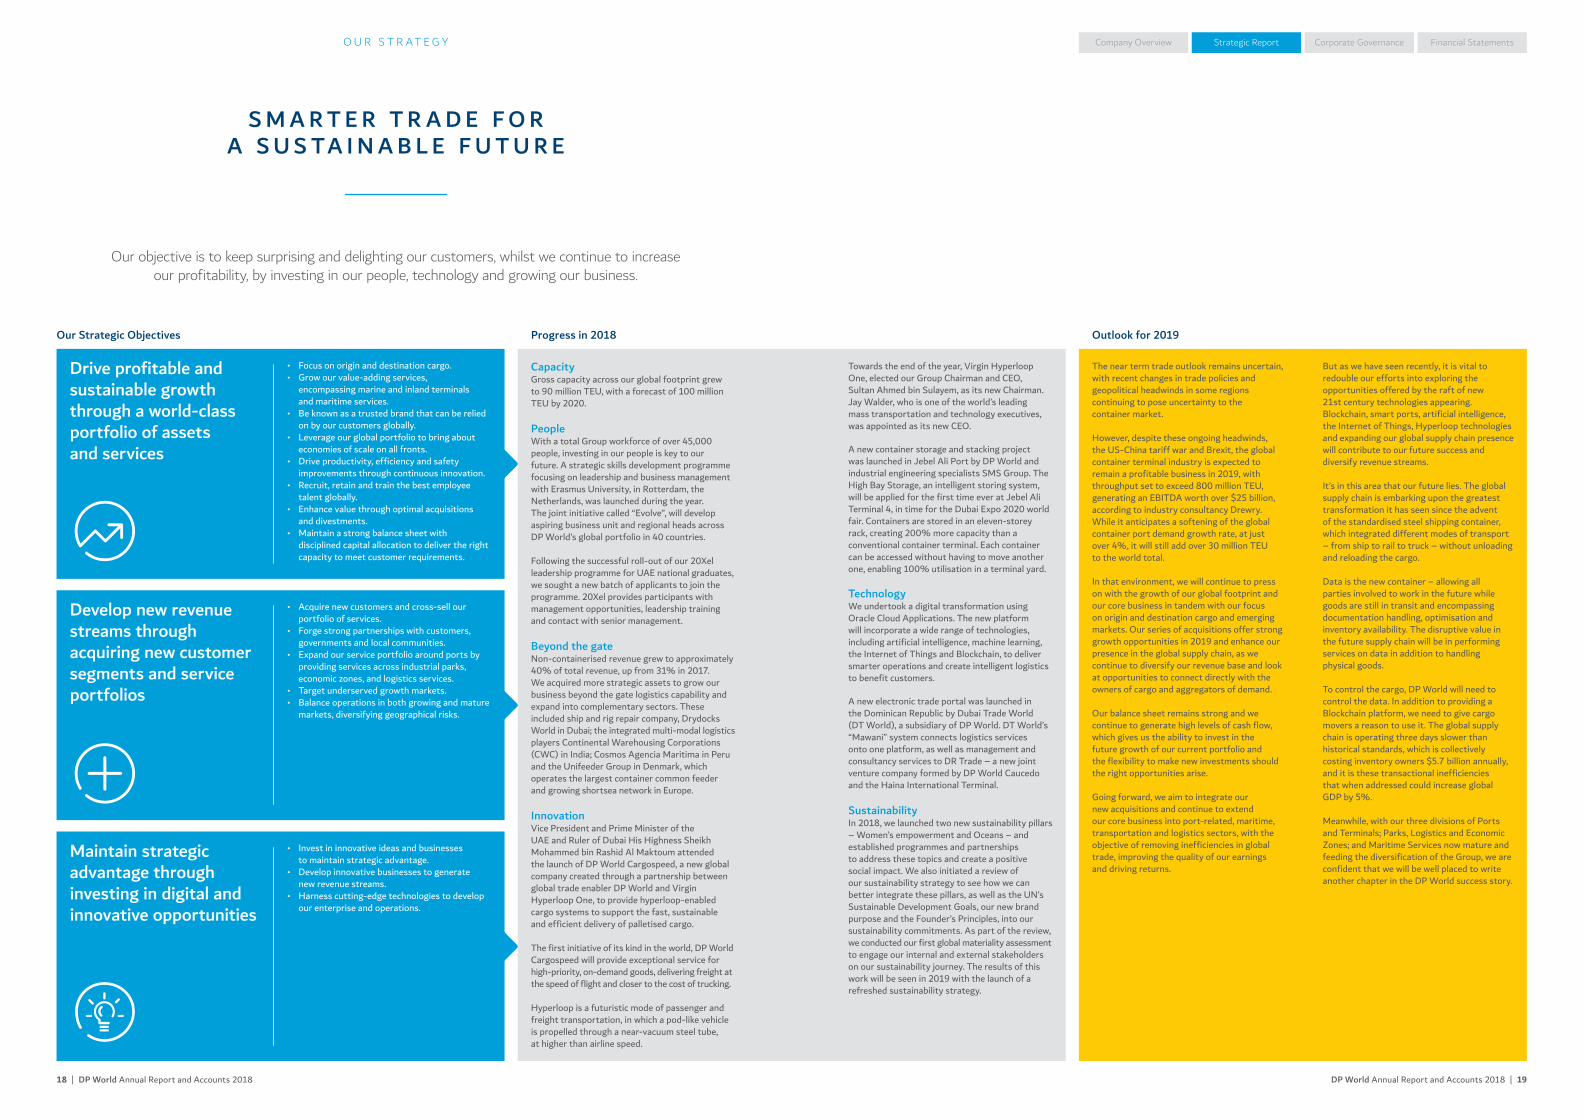
S M A R T E R T R A D E F O R A S U S TA I N A B L E F U T U R E
Our objective is to keep surprising and delighting our customers, whilst we continue to increase our profitability, by investing in our people, technology and growing our business.
Our Strategic Objectives Progress in 2018
CapacityGross capacity across our global footprint grew to 90 million TEU, with a forecast of 100 million TEU by 2020.
PeopleWith a total Group workforce of over 45,000 people, investing in our people is key to our future. A strategic skills development programme focusing on leadership and business management with Erasmus University, in Rotterdam, the Netherlands, was launched during the year. The joint initiative called “Evolve”, will develop aspiring business unit and regional heads across DP World’s global portfolio in 40 countries.
Following the successful roll-out of our 20Xel leadership programme for UAE national graduates, we sought a new batch of applicants to join the programme. 20Xel provides participants with management opportunities, leadership training and contact with senior management.
Beyond the gateNon-containerised revenue grew to approximately 40% of total revenue, up from 31% in 2017. We acquired more strategic assets to grow our business beyond the gate logistics capability and expand into complementary sectors. These included ship and rig repair company, Drydocks World in Dubai; the integrated multi-modal logistics players Continental Warehousing Corporations (CWC) in India; Cosmos Agencia Maritima in Peru and the Unifeeder Group in Denmark, which operates the largest container common feeder and growing shortsea network in Europe.
InnovationVice President and Prime Minister of the UAE and Ruler of Dubai His Highness Sheikh Mohammed bin Rashid Al Maktoum attended the launch of DP World Cargospeed, a new global company created through a partnership between global trade enabler DP World and Virgin Hyperloop One, to provide hyperloop-enabled cargo systems to support the fast, sustainable and efficient delivery of palletised cargo.
The first initiative of its kind in the world, DP World Cargospeed will provide exceptional service for high-priority, on-demand goods, delivering freight at the speed of flight and closer to the cost of trucking.
Hyperloop is a futuristic mode of passenger and freight transportation, in which a pod-like vehicle is propelled through a near-vacuum steel tube, at higher than airline speed.
Towards the end of the year, Virgin Hyperloop One, elected our Group Chairman and CEO, Sultan Ahmed bin Sulayem, as its new Chairman. Jay Walder, who is one of the world’s leading mass transportation and technology executives, was appointed as its new CEO.
A new container storage and stacking project was launched in Jebel Ali Port by DP World and industrial engineering specialists SMS Group. The High Bay Storage, an intelligent storing system, will be applied for the first time ever at Jebel Ali Terminal 4, in time for the Dubai Expo 2020 world fair. Containers are stored in an eleven-storey rack, creating 200% more capacity than a conventional container terminal. Each container can be accessed without having to move another one, enabling 100% utilisation in a terminal yard.
TechnologyWe undertook a digital transformation using Oracle Cloud Applications. The new platform will incorporate a wide range of technologies, including artificial intelligence, machine learning, the Internet of Things and Blockchain, to deliver smarter operations and create intelligent logistics to benefit customers.
A new electronic trade portal was launched in the Dominican Republic by Dubai Trade World (DT World), a subsidiary of DP World. DT World’s “Mawani” system connects logistics services onto one platform, as well as management and consultancy services to DR Trade – a new joint venture company formed by DP World Caucedo and the Haina International Terminal.
Sustainability In 2018, we launched two new sustainability pillars – Women’s empowerment and Oceans – and established programmes and partnerships to address these topics and create a positive social impact. We also initiated a review of our sustainability strategy to see how we can better integrate these pillars, as well as the UN’s Sustainable Development Goals, our new brand purpose and the Founder’s Principles, into our sustainability commitments. As part of the review, we conducted our first global materiality assessment to engage our internal and external stakeholders on our sustainability journey. The results of this work will be seen in 2019 with the launch of a refreshed sustainability strategy.
Drive profitable and sustainable growth through a world-class portfolio of assets and services
Develop new revenue streams through acquiring new customer segments and service portfolios
Maintain strategic advantage through investing in digital and innovative opportunities
The near term trade outlook remains uncertain, with recent changes in trade policies and geopolitical headwinds in some regions continuing to pose uncertainty to the container market.
However, despite these ongoing headwinds, the US-China tariff war and Brexit, the global container terminal industry is expected to remain a profitable business in 2019, with throughput set to exceed 800 million TEU, generating an EBITDA worth over $25 billion, according to industry consultancy Drewry. While it anticipates a softening of the global container port demand growth rate, at just over 4%, it will still add over 30 million TEU to the world total.
In that environment, we will continue to press on with the growth of our global footprint and our core business in tandem with our focus on origin and destination cargo and emerging markets. Our series of acquisitions offer strong growth opportunities in 2019 and enhance our presence in the global supply chain, as we continue to diversify our revenue base and look at opportunities to connect directly with the owners of cargo and aggregators of demand.
Our balance sheet remains strong and we continue to generate high levels of cash flow, which gives us the ability to invest in the future growth of our current portfolio and the flexibility to make new investments should the right opportunities arise.
Going forward, we aim to integrate our new acquisitions and continue to extend our core business into port-related, maritime, transportation and logistics sectors, with the objective of removing inefficiencies in global trade, improving the quality of our earnings and driving returns.
But as we have seen recently, it is vital to redouble our efforts into exploring the opportunities offered by the raft of new 21st century technologies appearing. Blockchain, smart ports, artificial intelligence, the Internet of Things, Hyperloop technologies and expanding our global supply chain presence will contribute to our future success and diversify revenue streams.
It’s in this area that our future lies. The global supply chain is embarking upon the greatest transformation it has seen since the advent of the standardised steel shipping container, which integrated different modes of transport – from ship to rail to truck – without unloading and reloading the cargo.
Data is the new container – allowing all parties involved to work in the future while goods are still in transit and encompassing documentation handling, optimisation and inventory availability. The disruptive value in the future supply chain will be in performing services on data in addition to handling physical goods.
To control the cargo, DP World will need to control the data. In addition to providing a Blockchain platform, we need to give cargo movers a reason to use it. The global supply chain is operating three days slower than historical standards, which is collectively costing inventory owners $5.7 billion annually, and it is these transactional inefficiencies that when addressed could increase global GDP by 5%.
Meanwhile, with our three divisions of Ports and Terminals; Parks, Logistics and Economic Zones; and Maritime Services now mature and feeding the diversification of the Group, we are confident that we will be well placed to write another chapter in the DP World success story.
• Focus on origin and destination cargo. • Grow our value-adding services,
encompassing marine and inland terminals and maritime services.
• Be known as a trusted brand that can be relied on by our customers globally.
• Leverage our global portfolio to bring about economies of scale on all fronts.
• Drive productivity, efficiency and safety improvements through continuous innovation.
• Recruit, retain and train the best employee talent globally.
• Enhance value through optimal acquisitions and divestments.
• Maintain a strong balance sheet with disciplined capital allocation to deliver the right capacity to meet customer requirements.
• Acquire new customers and cross-sell our portfolio of services.
• Forge strong partnerships with customers, governments and local communities.
• Expand our service portfolio around ports by providing services across industrial parks, economic zones, and logistics services.
• Target underserved growth markets.• Balance operations in both growing and mature
markets, diversifying geographical risks.
• Invest in innovative ideas and businesses to maintain strategic advantage.
• Develop innovative businesses to generate new revenue streams.
• Harness cutting-edge technologies to develop our enterprise and operations.
Outlook for 2019

DP World Annual Report and Accounts 2018 | 2120 | DP World Annual Report and Accounts 2018
Company Overview Corporate Governance Financial StatementsStrategic ReportS M A R T E R T R A D E | B E T T E R F U T U R E
E N V I R O N M E N T
BET TER PROTEC TION OF THE
WORLD’S OCEANSDP World Caucedo has developed a holistic approach to ocean protection called Huellazúl which means “blue footprint”, to deliver a wide range of initiatives in the Dominican Republic combining
education and environmental protection as its fundamental axis, to add value to the community, always leaving a positive legacy.
Sponsorship of coral reef protection, which enabled the installation of five coral nurseries in Boca Chica beach.
5So far more than 300 members of the community have benefited
from the Huellazúl initiatives.
300
Blue Marine FoundationDP World has partnered with the Blue Marine Foundation (“BLUE”) in the UK to support its campaign to conserve and protect high seas biodiversity. The high seas – any part of the ocean more than 200 miles offshore – is 45% of the earth’s surface and plays a key role in regulating our climate. The diverse marine life of the high seas including sharks, whales, dolphins, deep-sea corals and species yet to be discovered, is under threat as global fishing fleets increasingly exploit these distant waters, having already overfished most of the world’s coastal seas.
BLUE’s campaign with DP World articulates an ambitious vision for the high seas by 2030 and the economic, legal and scientific reasons why this is so important. To meet 30% of oceans protected by 2030 (the amount at which scientists agree that a healthy ocean is sustainable), a global treaty that protects high seas biodiversity is a vital first step.
So far more than 300 members of the community have benefited from the Huellazúl initiatives. This has included delivering environmental workshops in schools and partnering with the Ocean Soul Foundation to provide surf lessons to teach young people the sport but also how to care for the marine environment.
The normal festive corporate gifts for clients and employees were also replaced with a certificate for the sponsorship of coral reef protection, which enabled the installation of five coral nurseries in Boca Chica beach supported by employee volunteers who were trained in planting and monitoring coral reefs.
DP World Annual Report and Accounts 2018 | 2322 | DP World Annual Report and Accounts 2018
Company Overview Corporate Governance Financial StatementsStrategic Report
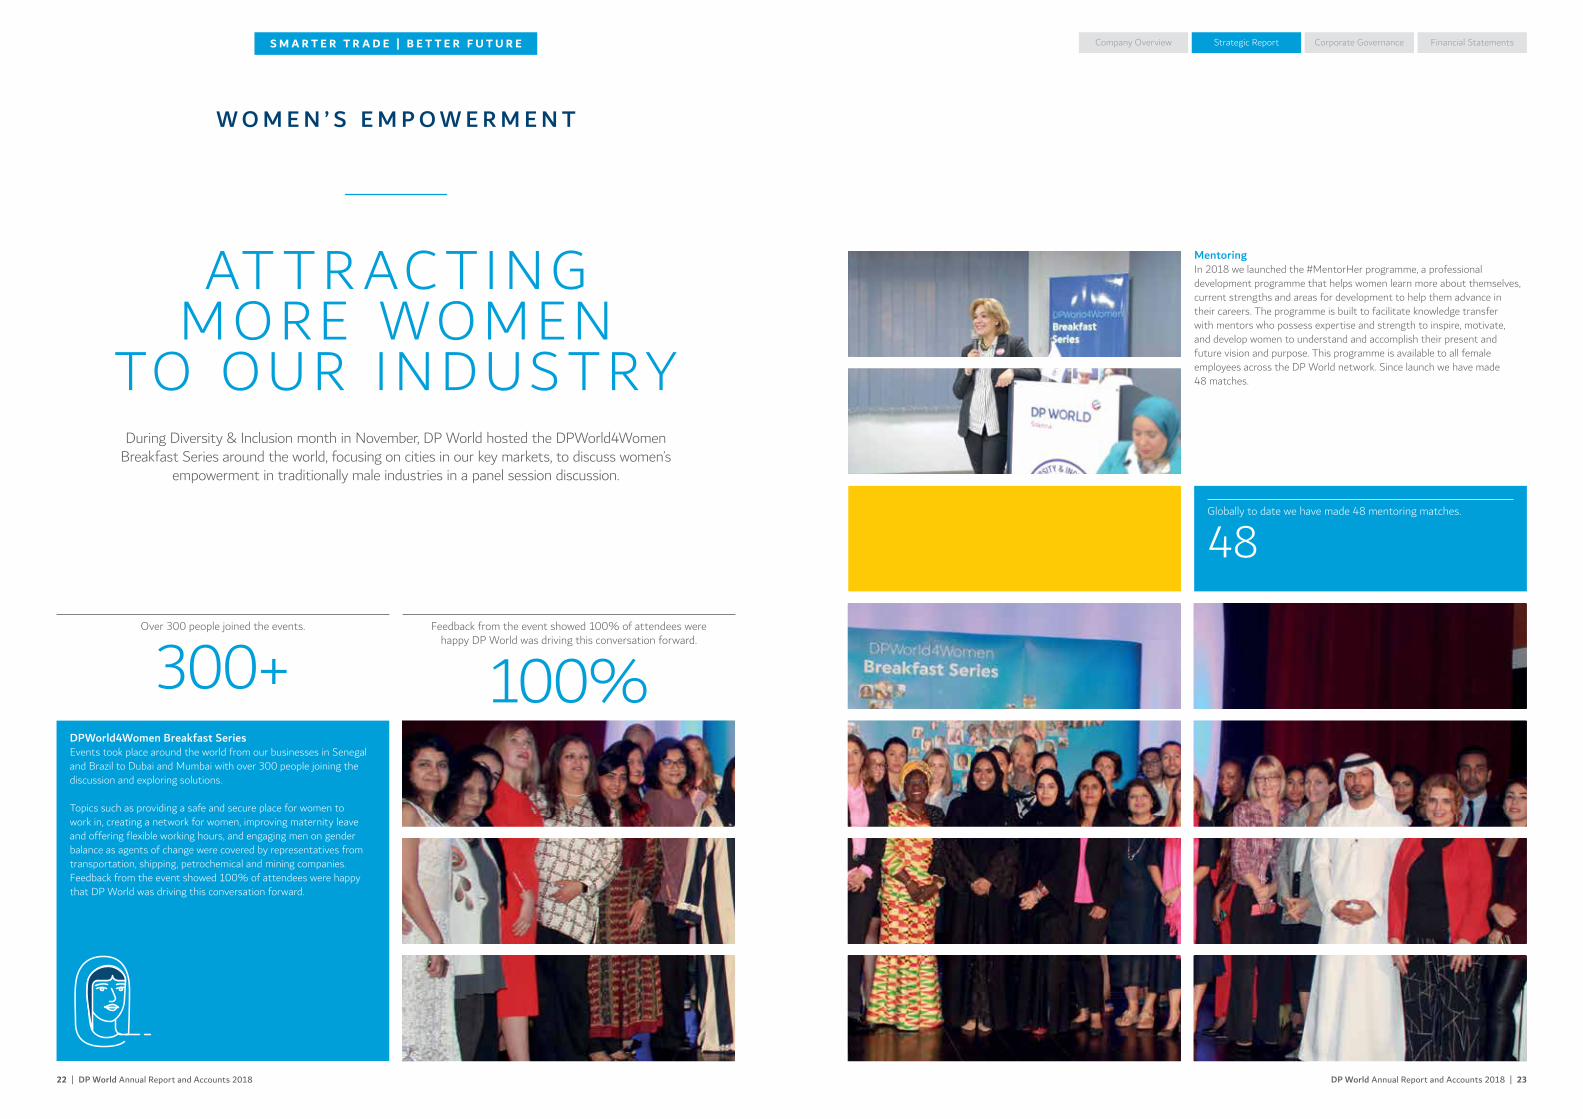
W O M E N ’ S E M P O W E R M E N T
AT TR AC TING MORE WOMEN
TO OUR INDUSTRYDuring Diversity & Inclusion month in November, DP World hosted the DPWorld4Women
Breakfast Series around the world, focusing on cities in our key markets, to discuss women’s empowerment in traditionally male industries in a panel session discussion.
Mentoring In 2018 we launched the #MentorHer programme, a professional development programme that helps women learn more about themselves, current strengths and areas for development to help them advance in their careers. The programme is built to facilitate knowledge transfer with mentors who possess expertise and strength to inspire, motivate, and develop women to understand and accomplish their present and future vision and purpose. This programme is available to all female employees across the DP World network. Since launch we have made 48 matches.
Globally to date we have made 48 mentoring matches.
48Over 300 people joined the events.
300+Feedback from the event showed 100% of attendees were
happy DP World was driving this conversation forward.
100%DPWorld4Women Breakfast SeriesEvents took place around the world from our businesses in Senegal and Brazil to Dubai and Mumbai with over 300 people joining the discussion and exploring solutions.
Topics such as providing a safe and secure place for women to work in, creating a network for women, improving maternity leave and offering flexible working hours, and engaging men on gender balance as agents of change were covered by representatives from transportation, shipping, petrochemical and mining companies. Feedback from the event showed 100% of attendees were happy that DP World was driving this conversation forward.
S M A R T E R T R A D E | B E T T E R F U T U R E
DP World Annual Report and Accounts 2018 | 2524 | DP World Annual Report and Accounts 2018
Company Overview Corporate Governance Financial StatementsStrategic Report
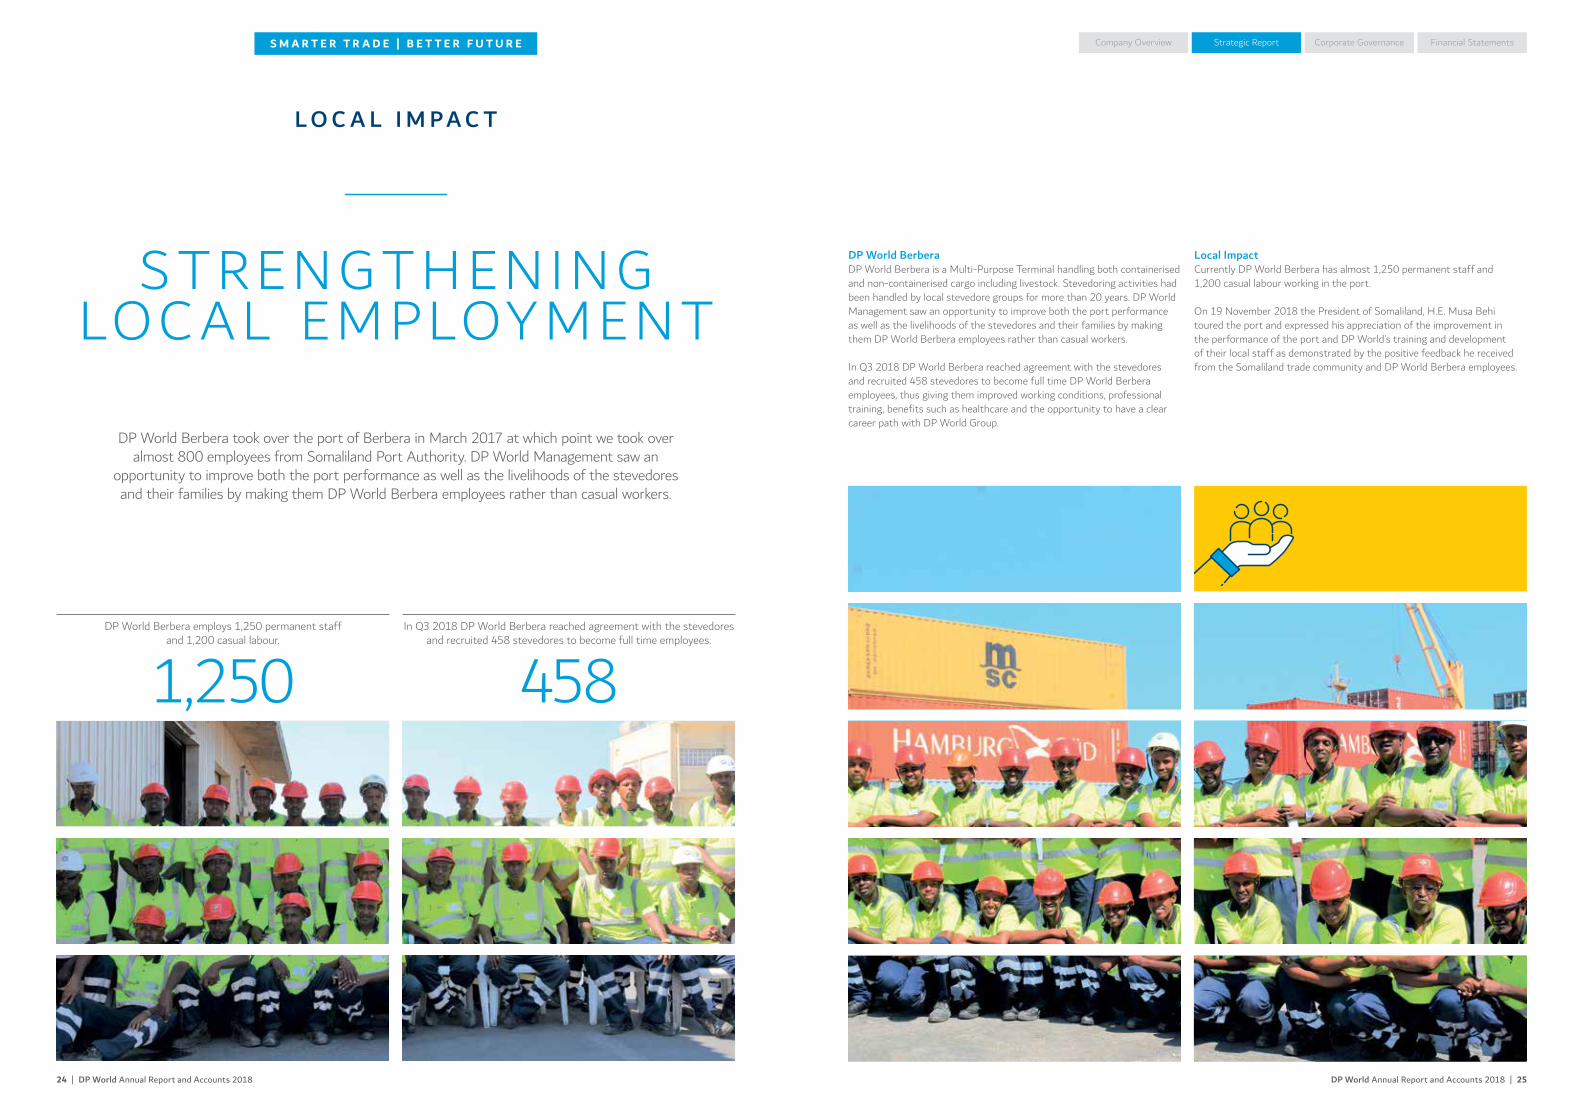
Local ImpactCurrently DP World Berbera has almost 1,250 permanent staff and 1,200 casual labour working in the port.
On 19 November 2018 the President of Somaliland, H.E. Musa Behi toured the port and expressed his appreciation of the improvement in the performance of the port and DP World’s training and development of their local staff as demonstrated by the positive feedback he received from the Somaliland trade community and DP World Berbera employees.
DP World BerberaDP World Berbera is a Multi-Purpose Terminal handling both containerised and non-containerised cargo including livestock. Stevedoring activities had been handled by local stevedore groups for more than 20 years. DP World Management saw an opportunity to improve both the port performance as well as the livelihoods of the stevedores and their families by making them DP World Berbera employees rather than casual workers.
In Q3 2018 DP World Berbera reached agreement with the stevedores and recruited 458 stevedores to become full time DP World Berbera employees, thus giving them improved working conditions, professional training, benefits such as healthcare and the opportunity to have a clear career path with DP World Group.
L O C A L I M P A C T
STRENGTHENING LOC AL EMPLOYMENT
DP World Berbera took over the port of Berbera in March 2017 at which point we took over almost 800 employees from Somaliland Port Authority. DP World Management saw an
opportunity to improve both the port performance as well as the livelihoods of the stevedores and their families by making them DP World Berbera employees rather than casual workers.
DP World Berbera employs 1,250 permanent staff and 1,200 casual labour.
1,250In Q3 2018 DP World Berbera reached agreement with the stevedores
and recruited 458 stevedores to become full time employees.
458
S M A R T E R T R A D E | B E T T E R F U T U R E

DP World Annual Report and Accounts 2018 | 2726 | DP World Annual Report and Accounts 2018
Company Overview Corporate Governance Financial StatementsStrategic Report
S A F E T Y
A MESSAGE FROM OUR CHILDREN
Every employee knows that safety is our top priority. We continually drive engagement programmes to strengthen the safety culture in our business. This year in Mozambique,
our team launched a new campaign to bring to life the importance of our colleagues being safe and going home to their families at the end of each day.
The children of MPDC employees were printed in real size cut-outs and positioned in strategic locations around the port with safety messages. The campaign had a huge visual impact towards all port users, who felt there were real children inside the port and felt compelled to read the messages.
It was a simple, yet very impactful way of getting people to be aware about the risks they are taking when they are working in the port.
The campaign had a huge visual impact on all port users, who felt there were real children inside the port and felt compelled to read the messages.
S M A R T E R T R A D E | B E T T E R F U T U R E

DP World Annual Report and Accounts 2018 | 2928 | DP World Annual Report and Accounts 2018
Company Overview Corporate Governance Financial StatementsStrategic Report
I N N O VAT I O N
REVOLUTIONISING GLOBAL PORT
LOGISTIC SDP World and SMS Group formed an international joint venture this year to revolutionise the way
that containers are handled in ports. The world’s first high bay container storing system will be ready at Jebel Ali Terminal 4, in time for the Dubai Expo 2020 world fair.
Instead of stacking containers directly on top of each other, which has been global standard practice for decades, the system places each container in an individual rack compartment. Containers are stored in an eleven-story rack, creating 200% more capacity than a conventional container terminal, or creating the same capacity in less than a third of the space.
Thanks to the rack’s design each container can be accessed without having to move another one, enabling 100% utilisation in a terminal yard. The system brings big gains in speed, energy efficiency, better safety and a major reduction in costs.
The world’s first high bay container storing system will be ready at Jebel Ali Terminal 4, in time for the Dubai Expo 2020 world fair.
200% more capacity than a conventional container terminal with the world’s first high bay container storing system.
200%Each container can be accessed without having to move another one,
enabling 100% utilisation in a terminal yard.
100%
S M A R T E R T R A D E | B E T T E R F U T U R E
DP World Annual Report and Accounts 2018 | 3130 | DP World Annual Report and Accounts 2018
Company Overview Corporate Governance Financial StatementsStrategic Report
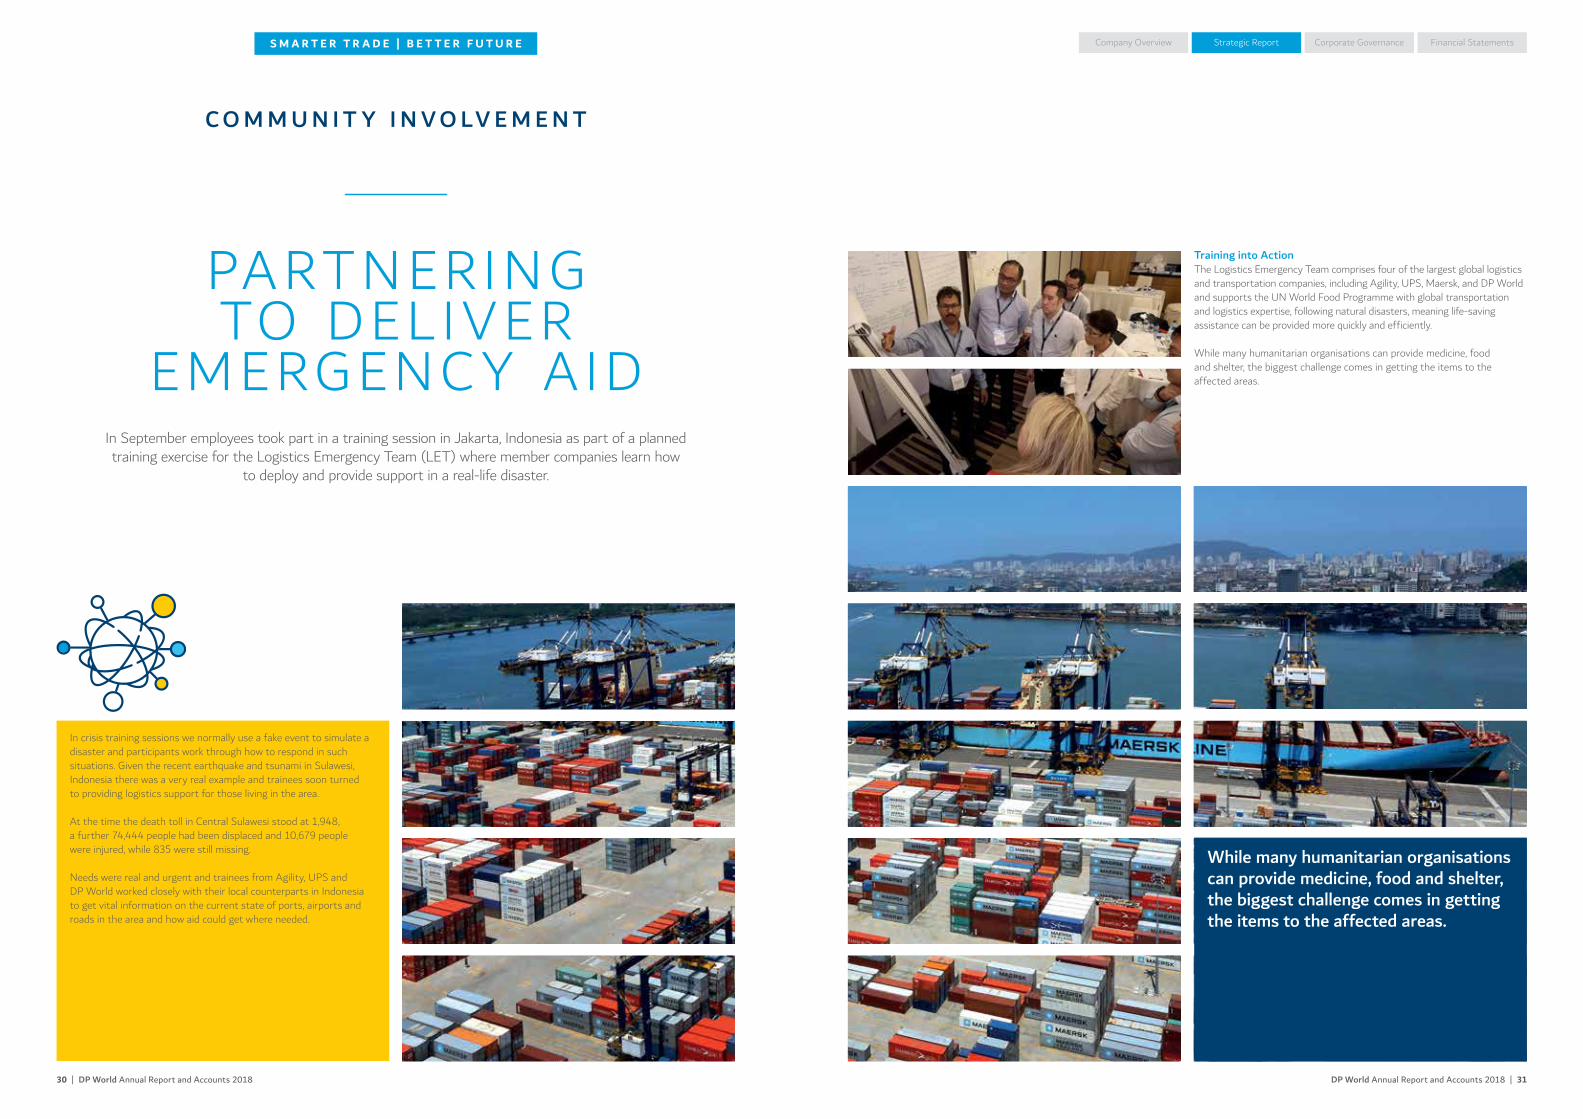
Training into ActionThe Logistics Emergency Team comprises four of the largest global logistics and transportation companies, including Agility, UPS, Maersk, and DP World and supports the UN World Food Programme with global transportation and logistics expertise, following natural disasters, meaning life-saving assistance can be provided more quickly and efficiently.
While many humanitarian organisations can provide medicine, food and shelter, the biggest challenge comes in getting the items to the affected areas.
C O M M U N I T Y I N V O LV E M E N T
PARTNERING TO DELIVER
EMERGENC Y AIDIn September employees took part in a training session in Jakarta, Indonesia as part of a planned training exercise for the Logistics Emergency Team (LET) where member companies learn how
to deploy and provide support in a real-life disaster.
In crisis training sessions we normally use a fake event to simulate a disaster and participants work through how to respond in such situations. Given the recent earthquake and tsunami in Sulawesi, Indonesia there was a very real example and trainees soon turned to providing logistics support for those living in the area.
At the time the death toll in Central Sulawesi stood at 1,948, a further 74,444 people had been displaced and 10,679 people were injured, while 835 were still missing.
Needs were real and urgent and trainees from Agility, UPS and DP World worked closely with their local counterparts in Indonesia to get vital information on the current state of ports, airports and roads in the area and how aid could get where needed.
While many humanitarian organisations can provide medicine, food and shelter, the biggest challenge comes in getting the items to the affected areas.
S M A R T E R T R A D E | B E T T E R F U T U R E

DP World Annual Report and Accounts 2018 | 3332 | DP World Annual Report and Accounts 2018
Company Overview Corporate Governance Financial StatementsStrategic Report
C O M M U N I T Y I N V E S T M E N T
GLOBAL EDUC ATION PROGR AMME
DP World’s Global Education Programme continues to engage 8-14 year olds across our global network, teaching and inspiring them on the topic of global trade and logistics. The programme
has now been translated into 14 languages – from Arabic and English to Hindi, Mandarin, French, Spanish, Thai, Turkish, Korean Portuguese, Indonesian, Vietnamese, Romanian and Dutch.
As of 2018, over 17,000 students have participated in the programme. 97.3% of teachers said the programme provided something the school couldn’t. 96.6% of students said they learned something new.
Over 580 volunteers in 18 countries have participated and delivered the modules to date and 94% of employees say their job satisfaction has increased after taking part.
Tech GenerationKal Ki Kaksha is a digital education programme in association with Pratham Infotech Foundation being run by business units in India and is one of our many initiatives to empower the communities we operate in. It focuses on providing primary and middle school students with computer based education. Our objective is to increase digital literacy and provide students with a platform that encourages collaborative learning and develops a sustainable path for a better learning experience.
So far, through volunteering for around 1,200 hours, we have successfully achieved our yearly goal of reaching 8,000 students across 40 schools with 100% of students saying they found the programme beneficial and 98.6% cited improved confidence in use of laptop/enjoyed the programme.
In around 1,200 hours, we have sucessfully achieved our yearly goal of reaching 8,000 students across 40 schools.
8,000Number of volunteers
580Number of countries participating
18
S M A R T E R T R A D E | B E T T E R F U T U R E

DP World Annual Report and Accounts 2018 | 3534 | DP World Annual Report and Accounts 2018
Company Overview Corporate Governance Financial StatementsStrategic Report
Evolve in 2018Twenty-six participants from 12 nationalities were selected to join Evolve in 2018. Module 1 (Making Strategy Work) took place in Rotterdam in June 2018; Module 2 (Persuasive Leadership; Leading Change and Transition) will be held in January 2019 at DP World’s flagship facility in Dubai, UAE; and Module 3 is scheduled to be held in Caucedo in 2019.
Besides growing leadership capabilities within the DP World organisation, the Evolve programme was a rare and cherished opportunity for the Company’s future talent to build deeper cross-functional, cross-division and cross-cultural relationships.
L E A R N I N G A N D D E V E L O P M E N T
EVOLVE – TALENT DEVELOPMENT
Before the sun came up on June 25, 2018, 26 business leaders from DP World began running through mud-soaked fields in Holland, crawling under barbed wire, and helping each other over tall obstacles. This was part of a 24-hour “Boot Camp” with the Dutch Marines
to prepare these select leaders for the first module of DP World’s “Evolve” programme, a leadership development programme with the purpose of supporting the development
of the next generation of DP World business leaders.
Evolve Talent Development ProgrammeDesigned in partnership with Erasmus University in Rotterdam, Evolve aims at developing newly appointed and aspiring business unit heads and regional roles across our divisions, and it is structured around three main areas of focus – leadership development, business acumen, and “real world application”. The programme comprises an 18-month leadership journey using a blend of face-to-face facilitated meetings, online tools and assignments, project work and continuous coaching and mentoring.
The boot camp taught the need for collaboration and clear communication, not to mention resilience and dedication. It also symbolised the spirit of the Evolve programme, which is meant to stretch people outside of their comfort zones.
“I learned so much about myself and what I am capable of doing. I also appreciated networking with talent from around the world.”Participant – Evolve 2018
Twenty-six participants from 12 nationalities were selected to join Evolve in 2018.
26The programme comprises an 18-month
leadership journey.
18
S M A R T E R T R A D E | B E T T E R F U T U R E

DP World Annual Report and Accounts 2018 | 3736 | DP World Annual Report and Accounts 2018
Company Overview Corporate Governance Financial StatementsStrategic ReportF I N A N C I A L R E V I E W
DP World delivered a robust set of financial results in 2018 and continued strong cash generation with profit attributable to owners of the Company at $1,270 million.
Our adjusted EBITDA was $2,808 million, while our adjusted EBITDA margin was diluted to 49.7% due to a mix change effect as lower margin businesses have now been consolidated into our portfolio. We expect this trend to continue as we add more asset-light logistics businesses. Reported revenue grew by 19.8% to $5,646 million, aided by acquisitions and steady like-for-like revenue growth.
It is worth noting that our 2018 financials are impacted by the acquisitions we have made during the year with Drydocks World (UAE) being of significance in addition to the consolidation of DP World Santos (Brazil), which was previously treated as an equity-accounted investee and the deconsolidation of Doraleh (Djibouti). As always, we provide a like-for-like analysis which is a truer reflection of the underlying business performance. Under a like-for-like basis, revenues grew by 4.2% while consolidated volumes grew by 1.4%, resulting in a like-for-like adjusted EBITDA growth of 6.6% with like-for-like margins of 54.1% and a 7.6% increase in profit attributable to owners of the Company before separately disclosed items.
Cash Flow and Balance Sheet In 2018, we successfully executed a multi-tranche bond transaction and liability management exercise and raised approximately $3.3 billion of new long term finances at attractive rates. This resulted in gross debt increasing to $10,553 million compared to $7,739 million at the end of 2017. Net debt was $7,938 million compared to $6,255 million in 2017 as the cash on the balance sheet stood at $2,615 million due to the fund raising. Cash generation from operations remains strong at $2,161 million.
Our leverage (net debt to adjusted EBITDA) remains well within the range of our guidance (ceiling of approximately 4 times) at 2.8 times in 2018 compared to 2.5 times at 31 December 2017. Overall, the balance sheet remains strong with robust and consistent cash generation and our partnerships with Caisse de Dépôt et Placement du Québec (CDPQ) and the National Investment and Infrastructure Fund (NIIF) of India give us further financial flexibility.
Capital Expenditure In 2018, our capital expenditure reached $908 million across the portfolio as we invested in our assets in the UAE, Posorja (Ecuador), Sokhna (Egypt) and London Gateway amongst others. Maintenance capital expenditure stood at $140 million.
The capital expenditure in 2018 was below our guidance of $1.4 billion as we maintain a disciplined approach to deploying capital. We expect 2019 capital expenditure to be up to $1.4 billion with investment planned mainly into UAE, Banana (DRC), Posorja (Ecuador), Sokhna (Egypt) and Berbera (Somaliland).
G R O U P C H I E F F I N A N C I A L O F F I C E R ’ S R E V I E W
Regional ReviewMiddle East, Europe and Africa
Results before separately disclosed items 2018 2017 % change
Like-for-like at constant
currency % change
USD million
Consolidated throughput (TEU ‘000) 22,585 22,889 -1.3% 2.1%
Revenue 3,852 3,284 17.3% 1.2%
Share of profit from equity-accounted investees 33 21 57.6% 60.2%
Adjusted EBITDA 2,014 1,918 5.0% (0.9%)
Adjusted EBITDA margin 52.3% 58.4% – 56.5%
Market conditions in the Middle East, Europe and Africa (EMEA) region, excluding UAE, were strong with double digit like-for-like volume growth driven by Europe and Africa. London Gateway (UK) and Yarimca (Turkey) continued to ramp up while Dakar (Senegal) and Sokhna (Egypt) delivered a strong performance due to robust regional economic growth. Performance in the UAE was soft due to the loss of lower margin throughput, with our main focus on profitable cargo.
Overall, revenue in the region grew 17.3% to $3,852 million on a reported basis, benefitting from the acquisition of Drydocks World and Dubai Maritime City. Adjusted EBITDA was $2,014 million, up 5.0% compared to 2017. On a like-for-like basis, revenue grew 1.2%, adjusted EBITDA was down marginally, reflecting the challenging market conditions in the UAE.
In 2018, we invested $566 million of capital expenditure in the region, which was mainly focused on Jebel Ali port (UAE), Jebel Ali Free Zone (UAE), Drydocks World (UAE), London Gateway (UK) and Sokhna (Egypt).
Asia Pacific and Indian Subcontinent
Results before separately disclosed items 2018 2017 % change
Like-for-like at constant
currency % change
USD million
Consolidated throughput (TEU ‘000) 10,019 10,020 0.0% 0.5%
Revenue 833 668 24.7% 21.6%
Share of profit from equity-accounted investees 129 117 9.7% 8.6%
Adjusted EBITDA 592 435 36.1% 38.4%
Adjusted EBITDA margin 71.0% 65.1% – 76.3%
Asia Pacific and Indian Subcontinent region market conditions were broadly positive. Strong performance in Asia Pacific was partially offset by more moderate growth in India due to our high levels of utilisation at key locations. Overall, container volume growth was flat. Reported revenue growth of 24.7% to $833 million was due to the acquisition of Continental Warehousing Corporation (CWC). Our share of profit from equity-accounted investees (joint ventures) increased 9.7% from $117 million in 2017 to $129 million in 2018 due to a stronger performance in Manila (Philippines) and Surabaya.
On a like-for-like basis, adjusted EBITDA grew 38.4% while the adjusted EBITDA margin stood at 76.3%. Capital expenditure in this region during the year was $42 million, which was invested in capacity expansions at Pusan (South Korea) and Karachi (Pakistan).
Australia and Americas
Reported results before separately disclosed items 2018 2017 % change
Like-for-like at constant
currency % change
USD million
Consolidated throughput (TEU ‘000) 4,157 3,567 16.5% (0.1%)
Revenue 961 762 26.1% 1.7%
Share of profit from equity-accounted investees 3.0 (15) 120.0% 585.5%
Adjusted EBITDA 340 292 16.7% (8.7%)
Adjusted EBITDA margin 35.4% 38.2% – 40.5%
Market conditions in the Australia and Americas region were mixed, with strong volume growth in Prince Rupert (Canada), Callao (Peru) and Santos consolidation offset by weakness in Buenos Aires (Argentina). Volumes in Australia were broadly stable during the year.
Revenue rose 26.1% to $961 million and adjusted EBITDA increased by 16.7% to $340 million due to the consolidation of Santos (Brazil). On a like-for-like basis, revenue rose 1.7% and adjusted EBITDA decreased 8.7% year-on-year due to weakness in Argentina.
Profit from equity-accounted investees, which recorded a gain of $3 million compared to a loss of $15 million in 2017, was due to the consolidation of Santos (Brazil). We invested $257 million of capital expenditure in the region, mainly in our terminal in Posorja (Ecuador) and Prince Rupert (Canada).
Y U V R A J N A R AYA NG RO U P C H I E F F I N A N C I A L O FFI C E R 21 M A RC H 2 019
Yuvraj NarayanGroup Chief Financial Officer
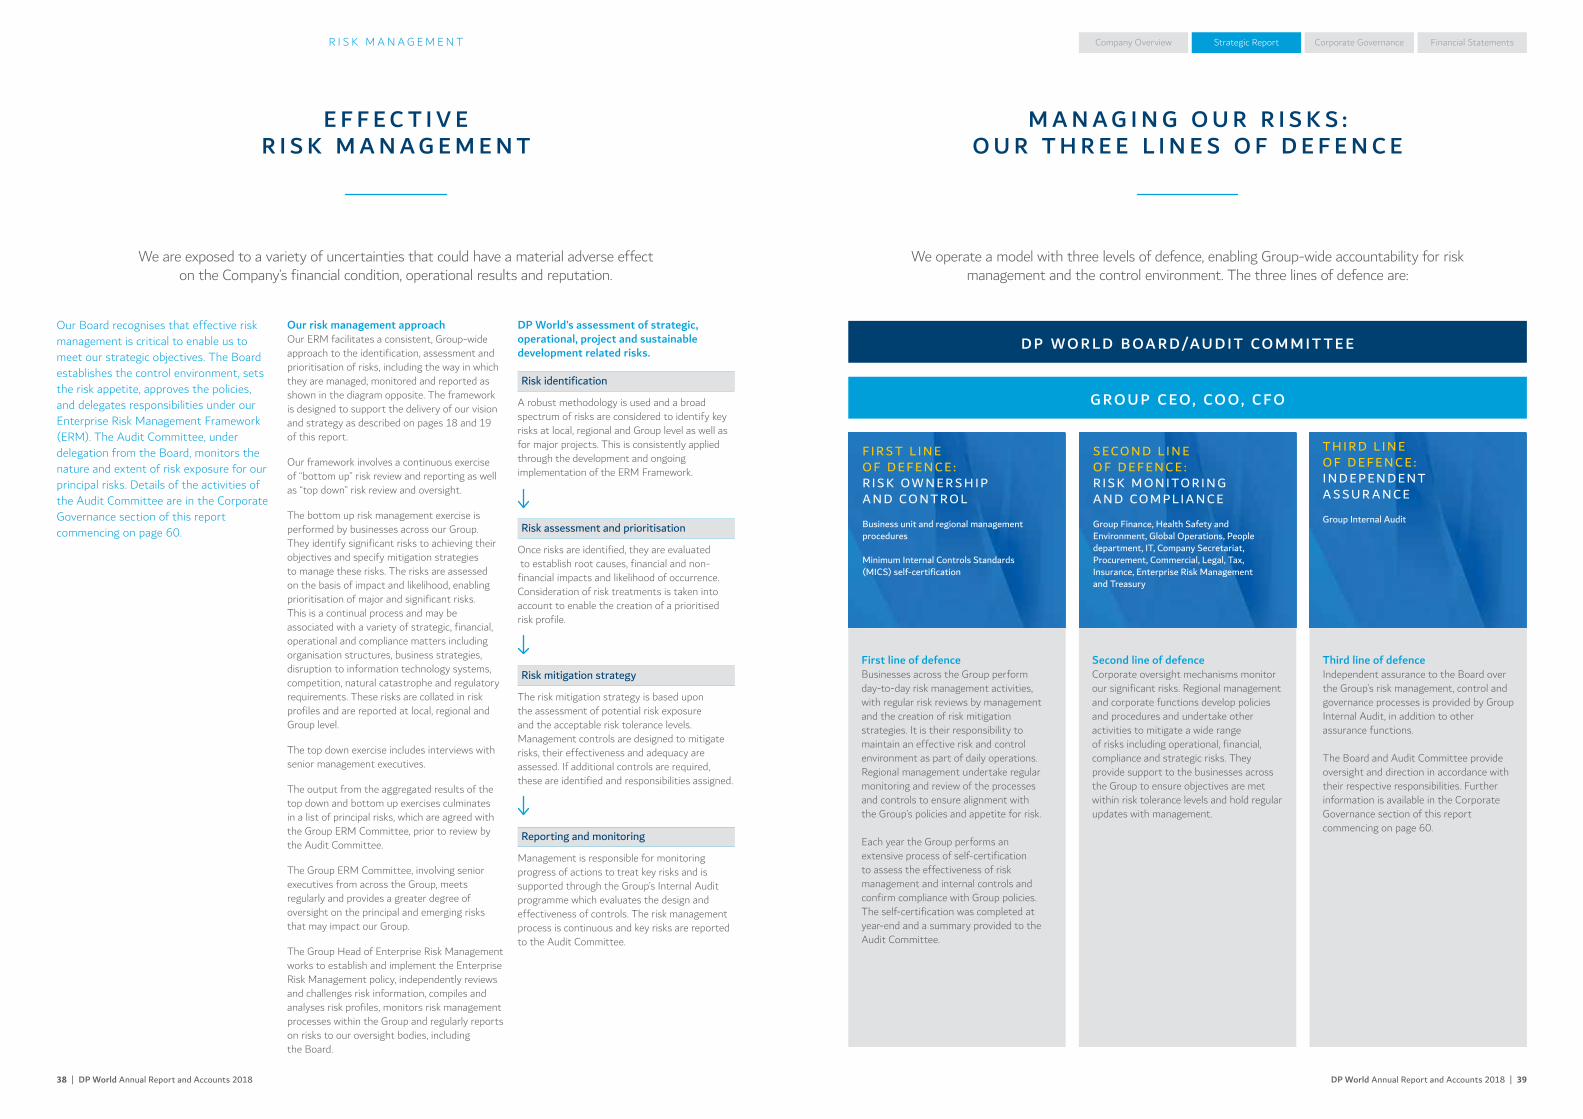
DP World Annual Report and Accounts 2018 | 3938 | DP World Annual Report and Accounts 2018
Company Overview Corporate Governance Financial StatementsStrategic ReportR I S K M A N A G E M E N T
E F F E C T I V E R I S K M A N A G E M E N T
M A N A G I N G O U R R I S K S :O U R T H R E E L I N E S O F D E F E N C E
We are exposed to a variety of uncertainties that could have a material adverse effect on the Company’s financial condition, operational results and reputation.
We operate a model with three levels of defence, enabling Group-wide accountability for risk management and the control environment. The three lines of defence are:
Our Board recognises that effective risk management is critical to enable us to meet our strategic objectives. The Board establishes the control environment, sets the risk appetite, approves the policies, and delegates responsibilities under our Enterprise Risk Management Framework (ERM). The Audit Committee, under delegation from the Board, monitors the nature and extent of risk exposure for our principal risks. Details of the activities of the Audit Committee are in the Corporate Governance section of this report commencing on page 60.
Our risk management approachOur ERM facilitates a consistent, Group-wide approach to the identification, assessment and prioritisation of risks, including the way in which they are managed, monitored and reported as shown in the diagram opposite. The framework is designed to support the delivery of our vision and strategy as described on pages 18 and 19 of this report.
Our framework involves a continuous exercise of “bottom up” risk review and reporting as well as “top down” risk review and oversight.
The bottom up risk management exercise is performed by businesses across our Group. They identify significant risks to achieving their objectives and specify mitigation strategies to manage these risks. The risks are assessed on the basis of impact and likelihood, enabling prioritisation of major and significant risks. This is a continual process and may be associated with a variety of strategic, financial, operational and compliance matters including organisation structures, business strategies, disruption to information technology systems, competition, natural catastrophe and regulatory requirements. These risks are collated in risk profiles and are reported at local, regional and Group level.
The top down exercise includes interviews with senior management executives.
The output from the aggregated results of the top down and bottom up exercises culminates in a list of principal risks, which are agreed with the Group ERM Committee, prior to review by the Audit Committee.
The Group ERM Committee, involving senior executives from across the Group, meets regularly and provides a greater degree of oversight on the principal and emerging risks that may impact our Group.
The Group Head of Enterprise Risk Management works to establish and implement the Enterprise Risk Management policy, independently reviews and challenges risk information, compiles and analyses risk profiles, monitors risk management processes within the Group and regularly reports on risks to our oversight bodies, including the Board.
First line of defence Businesses across the Group perform day-to-day risk management activities, with regular risk reviews by management and the creation of risk mitigation strategies. It is their responsibility to maintain an effective risk and control environment as part of daily operations. Regional management undertake regular monitoring and review of the processes and controls to ensure alignment with the Group’s policies and appetite for risk.
Each year the Group performs an extensive process of self-certification to assess the effectiveness of risk management and internal controls and confirm compliance with Group policies. The self-certification was completed at year-end and a summary provided to the Audit Committee.
Second line of defence Corporate oversight mechanisms monitor our significant risks. Regional management and corporate functions develop policies and procedures and undertake other activities to mitigate a wide range of risks including operational, financial, compliance and strategic risks. They provide support to the businesses across the Group to ensure objectives are met within risk tolerance levels and hold regular updates with management.
Third line of defenceIndependent assurance to the Board over the Group’s risk management, control and governance processes is provided by Group Internal Audit, in addition to other assurance functions.
The Board and Audit Committee provide oversight and direction in accordance with their respective responsibilities. Further information is available in the Corporate Governance section of this report commencing on page 60.
DP World’s assessment of strategic, operational, project and sustainable development related risks.
Risk identification
A robust methodology is used and a broad spectrum of risks are considered to identify key risks at local, regional and Group level as well as for major projects. This is consistently applied through the development and ongoing implementation of the ERM Framework.
Risk assessment and prioritisation
Once risks are identified, they are evaluated to establish root causes, financial and non-financial impacts and likelihood of occurrence. Consideration of risk treatments is taken into account to enable the creation of a prioritised risk profile.
Risk mitigation strategy
The risk mitigation strategy is based upon the assessment of potential risk exposure and the acceptable risk tolerance levels. Management controls are designed to mitigate risks, their effectiveness and adequacy are assessed. If additional controls are required, these are identified and responsibilities assigned.
Reporting and monitoring
Management is responsible for monitoring progress of actions to treat key risks and is supported through the Group’s Internal Audit programme which evaluates the design and effectiveness of controls. The risk management process is continuous and key risks are reported to the Audit Committee.
F I R S T L I N E O F D EF EN C E : R I S K O W N E R S H I P A N D C O N T R O L
Business unit and regional management procedures
Minimum Internal Controls Standards (MICS) self-certification
S EC O N D L I N E O F D EF EN C E :R I S K M O N I TO R I N G A N D C O M P L I A N C E
Group Finance, Health Safety and Environment, Global Operations, People department, IT, Company Secretariat, Procurement, Commercial, Legal, Tax, Insurance, Enterprise Risk Management and Treasury
T H I R D L I N E O F D EF EN C E : I N D EP EN D EN T A S S U R A N C E
Group Internal Audit
D P WO R L D B OA R D/AU D I T CO M M I T T E E
G R O U P C EO , CO O , C F O
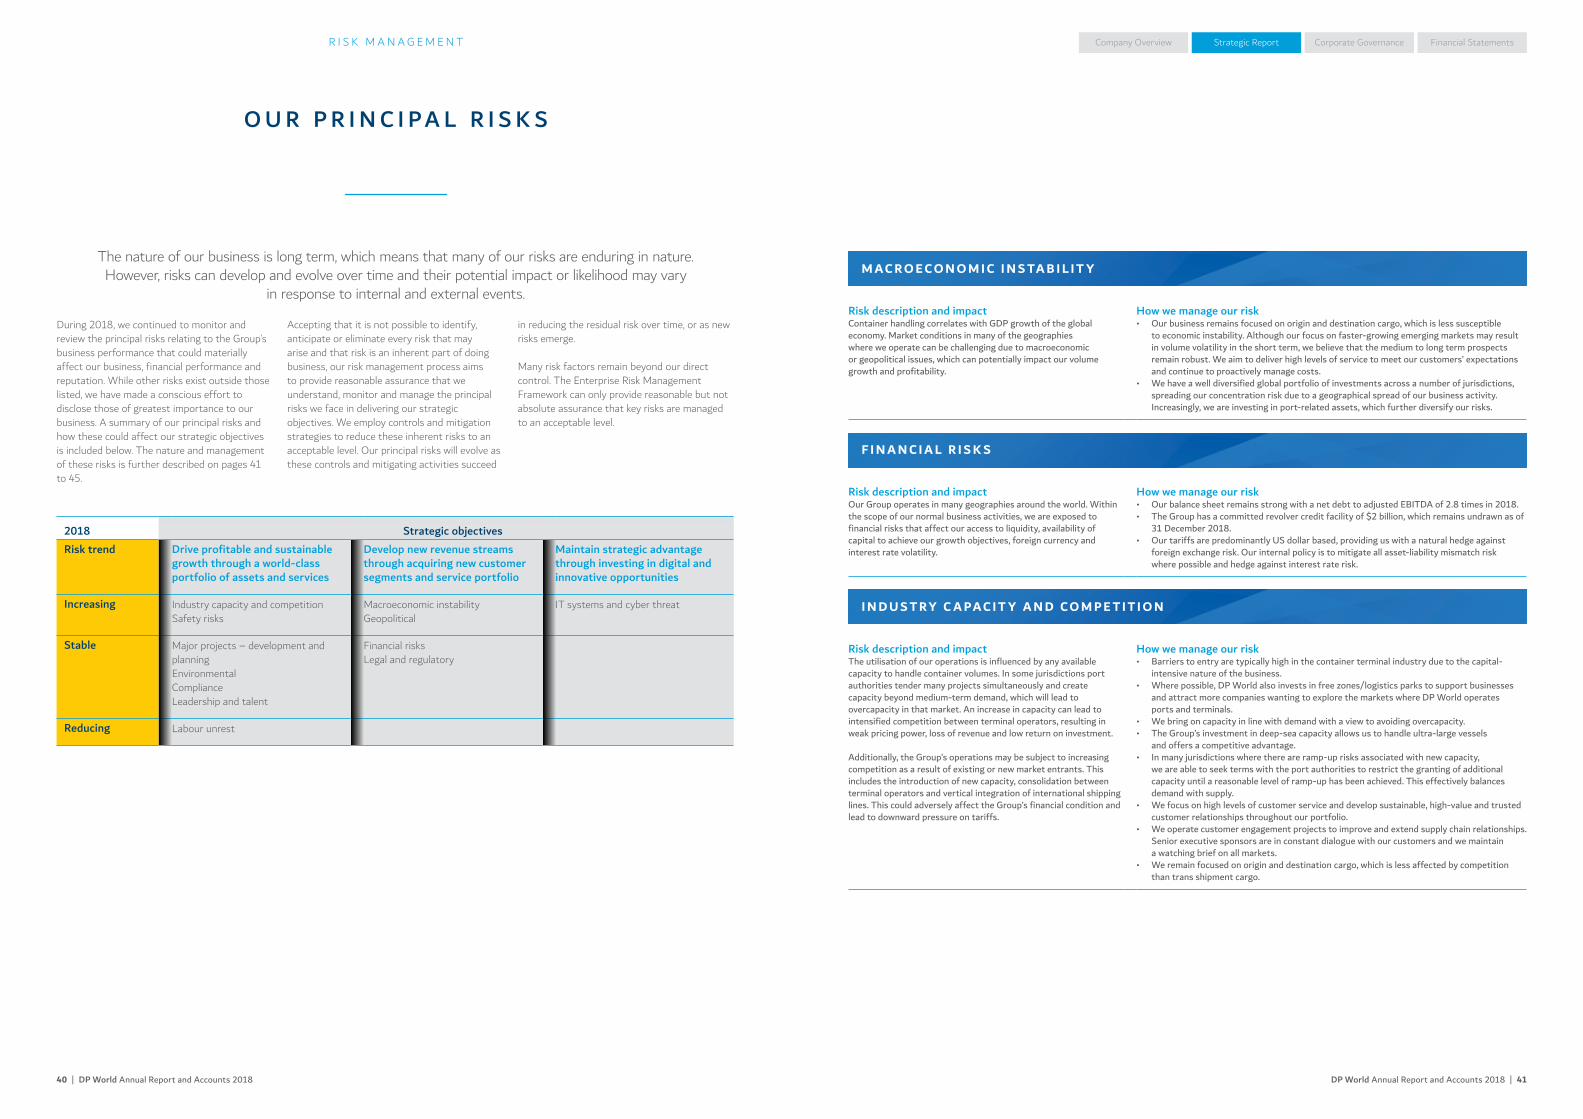
DP World Annual Report and Accounts 2018 | 4140 | DP World Annual Report and Accounts 2018
Company Overview Corporate Governance Financial StatementsStrategic ReportR I S K M A N A G E M E N T
O U R P R I N C I P A L R I S K S
The nature of our business is long term, which means that many of our risks are enduring in nature. However, risks can develop and evolve over time and their potential impact or likelihood may vary
in response to internal and external events.
During 2018, we continued to monitor and review the principal risks relating to the Group’s business performance that could materially affect our business, financial performance and reputation. While other risks exist outside those listed, we have made a conscious effort to disclose those of greatest importance to our business. A summary of our principal risks and how these could affect our strategic objectives is included below. The nature and management of these risks is further described on pages 41 to 45.
Accepting that it is not possible to identify, anticipate or eliminate every risk that may arise and that risk is an inherent part of doing business, our risk management process aims to provide reasonable assurance that we understand, monitor and manage the principal risks we face in delivering our strategic objectives. We employ controls and mitigation strategies to reduce these inherent risks to an acceptable level. Our principal risks will evolve as these controls and mitigating activities succeed
in reducing the residual risk over time, or as new risks emerge.
Many risk factors remain beyond our direct control. The Enterprise Risk Management Framework can only provide reasonable but not absolute assurance that key risks are managed to an acceptable level.
2018 Strategic objectivesRisk trend Drive profitable and sustainable
growth through a world-class portfolio of assets and services
Develop new revenue streams through acquiring new customer segments and service portfolio
Maintain strategic advantage through investing in digital and innovative opportunities
Increasing Industry capacity and competitionSafety risks
Macroeconomic instabilityGeopolitical
IT systems and cyber threat
Stable Major projects – development and planning EnvironmentalComplianceLeadership and talent
Financial risksLegal and regulatory
Reducing Labour unrest
M A C R O E C O N O M I C I N S TA B I L I T Y
Risk description and impactContainer handling correlates with GDP growth of the global economy. Market conditions in many of the geographies where we operate can be challenging due to macroeconomic or geopolitical issues, which can potentially impact our volume growth and profitability.
How we manage our risk• Our business remains focused on origin and destination cargo, which is less susceptible
to economic instability. Although our focus on faster-growing emerging markets may result in volume volatility in the short term, we believe that the medium to long term prospects remain robust. We aim to deliver high levels of service to meet our customers’ expectations and continue to proactively manage costs.
• We have a well diversified global portfolio of investments across a number of jurisdictions, spreading our concentration risk due to a geographical spread of our business activity. Increasingly, we are investing in port-related assets, which further diversify our risks.
F I N A N C I A L R I S K S
Risk description and impactOur Group operates in many geographies around the world. Within the scope of our normal business activities, we are exposed to financial risks that affect our access to liquidity, availability of capital to achieve our growth objectives, foreign currency and interest rate volatility.
How we manage our risk• Our balance sheet remains strong with a net debt to adjusted EBITDA of 2.8 times in 2018.• The Group has a committed revolver credit facility of $2 billion, which remains undrawn as of
31 December 2018.• Our tariffs are predominantly US dollar based, providing us with a natural hedge against
foreign exchange risk. Our internal policy is to mitigate all asset-liability mismatch risk where possible and hedge against interest rate risk.
I N D U S T RY C A PA C I T Y A N D C O M P E T I T I O N
Risk description and impactThe utilisation of our operations is influenced by any available capacity to handle container volumes. In some jurisdictions port authorities tender many projects simultaneously and create capacity beyond medium-term demand, which will lead to overcapacity in that market. An increase in capacity can lead to intensified competition between terminal operators, resulting in weak pricing power, loss of revenue and low return on investment.
Additionally, the Group’s operations may be subject to increasing competition as a result of existing or new market entrants. This includes the introduction of new capacity, consolidation between terminal operators and vertical integration of international shipping lines. This could adversely affect the Group’s financial condition and lead to downward pressure on tariffs.
How we manage our risk• Barriers to entry are typically high in the container terminal industry due to the capital-
intensive nature of the business.• Where possible, DP World also invests in free zones/logistics parks to support businesses
and attract more companies wanting to explore the markets where DP World operates ports and terminals.
• We bring on capacity in line with demand with a view to avoiding overcapacity.• The Group’s investment in deep-sea capacity allows us to handle ultra-large vessels
and offers a competitive advantage. • In many jurisdictions where there are ramp-up risks associated with new capacity,
we are able to seek terms with the port authorities to restrict the granting of additional capacity until a reasonable level of ramp-up has been achieved. This effectively balances demand with supply.
• We focus on high levels of customer service and develop sustainable, high-value and trusted customer relationships throughout our portfolio.
• We operate customer engagement projects to improve and extend supply chain relationships. Senior executive sponsors are in constant dialogue with our customers and we maintain a watching brief on all markets.
• We remain focused on origin and destination cargo, which is less affected by competition than trans shipment cargo.
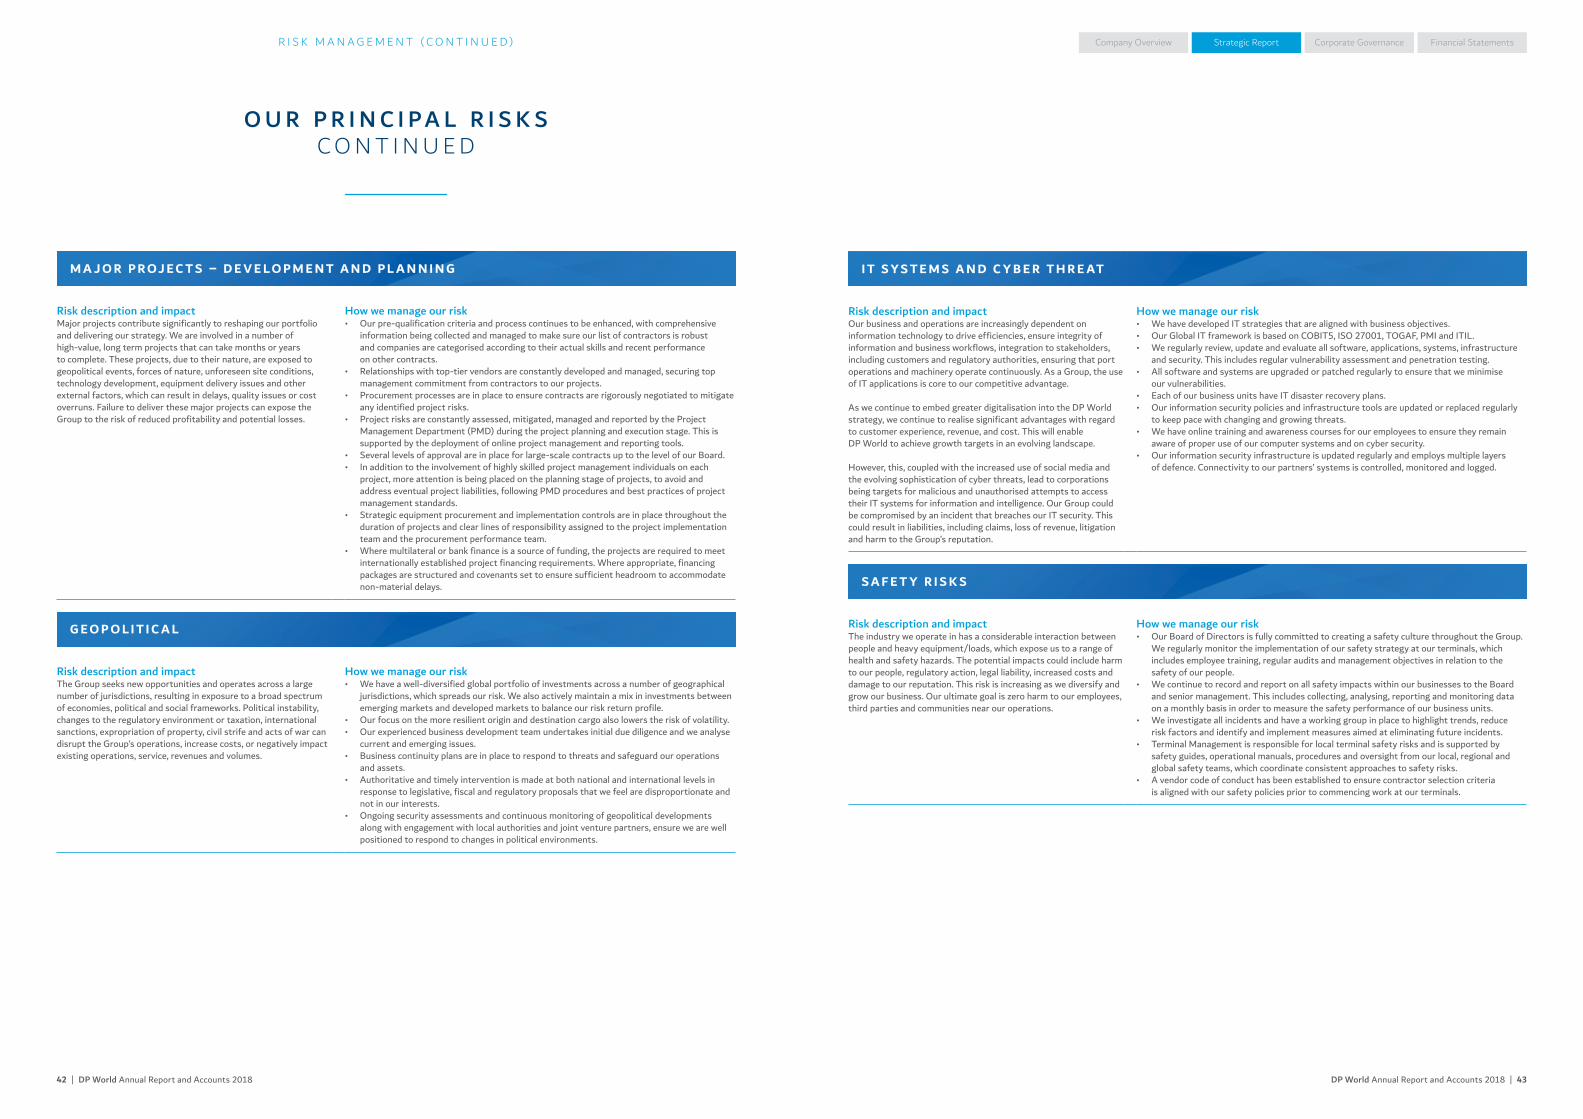
DP World Annual Report and Accounts 2018 | 4342 | DP World Annual Report and Accounts 2018
Company Overview Corporate Governance Financial StatementsStrategic ReportR I S K M A N A G E M E N T ( C O N T I N U E D )
O U R P R I N C I P A L R I S K S C O N T I N U E D
M A J O R P R O J E C T S – D E V E L O P M E N T A N D P L A N N I N G
Risk description and impactMajor projects contribute significantly to reshaping our portfolio and delivering our strategy. We are involved in a number of high-value, long term projects that can take months or years to complete. These projects, due to their nature, are exposed to geopolitical events, forces of nature, unforeseen site conditions, technology development, equipment delivery issues and other external factors, which can result in delays, quality issues or cost overruns. Failure to deliver these major projects can expose the Group to the risk of reduced profitability and potential losses.
How we manage our risk• Our pre-qualification criteria and process continues to be enhanced, with comprehensive
information being collected and managed to make sure our list of contractors is robust and companies are categorised according to their actual skills and recent performance on other contracts.
• Relationships with top-tier vendors are constantly developed and managed, securing top management commitment from contractors to our projects.
• Procurement processes are in place to ensure contracts are rigorously negotiated to mitigate any identified project risks.
• Project risks are constantly assessed, mitigated, managed and reported by the Project Management Department (PMD) during the project planning and execution stage. This is supported by the deployment of online project management and reporting tools.
• Several levels of approval are in place for large-scale contracts up to the level of our Board. • In addition to the involvement of highly skilled project management individuals on each
project, more attention is being placed on the planning stage of projects, to avoid and address eventual project liabilities, following PMD procedures and best practices of project management standards.
• Strategic equipment procurement and implementation controls are in place throughout the duration of projects and clear lines of responsibility assigned to the project implementation team and the procurement performance team.
• Where multilateral or bank finance is a source of funding, the projects are required to meet internationally established project financing requirements. Where appropriate, financing packages are structured and covenants set to ensure sufficient headroom to accommodate non-material delays.
G E O P O L I T I C A L
Risk description and impactThe Group seeks new opportunities and operates across a large number of jurisdictions, resulting in exposure to a broad spectrum of economies, political and social frameworks. Political instability, changes to the regulatory environment or taxation, international sanctions, expropriation of property, civil strife and acts of war can disrupt the Group’s operations, increase costs, or negatively impact existing operations, service, revenues and volumes.
How we manage our risk• We have a well-diversified global portfolio of investments across a number of geographical
jurisdictions, which spreads our risk. We also actively maintain a mix in investments between emerging markets and developed markets to balance our risk return profile.
• Our focus on the more resilient origin and destination cargo also lowers the risk of volatility.• Our experienced business development team undertakes initial due diligence and we analyse
current and emerging issues.• Business continuity plans are in place to respond to threats and safeguard our operations
and assets.• Authoritative and timely intervention is made at both national and international levels in
response to legislative, fiscal and regulatory proposals that we feel are disproportionate and not in our interests.
• Ongoing security assessments and continuous monitoring of geopolitical developments along with engagement with local authorities and joint venture partners, ensure we are well positioned to respond to changes in political environments.
I T S Y S T E M S A N D C Y B E R T H R E AT
Risk description and impactOur business and operations are increasingly dependent on information technology to drive efficiencies, ensure integrity of information and business workflows, integration to stakeholders, including customers and regulatory authorities, ensuring that port operations and machinery operate continuously. As a Group, the use of IT applications is core to our competitive advantage.
As we continue to embed greater digitalisation into the DP World strategy, we continue to realise significant advantages with regard to customer experience, revenue, and cost. This will enable DP World to achieve growth targets in an evolving landscape.
However, this, coupled with the increased use of social media and the evolving sophistication of cyber threats, lead to corporations being targets for malicious and unauthorised attempts to access their IT systems for information and intelligence. Our Group could be compromised by an incident that breaches our IT security. This could result in liabilities, including claims, loss of revenue, litigation and harm to the Group’s reputation.
How we manage our risk• We have developed IT strategies that are aligned with business objectives.• Our Global IT framework is based on COBIT5, ISO 27001, TOGAF, PMI and ITIL.• We regularly review, update and evaluate all software, applications, systems, infrastructure
and security. This includes regular vulnerability assessment and penetration testing.• All software and systems are upgraded or patched regularly to ensure that we minimise
our vulnerabilities.• Each of our business units have IT disaster recovery plans.• Our information security policies and infrastructure tools are updated or replaced regularly
to keep pace with changing and growing threats.• We have online training and awareness courses for our employees to ensure they remain
aware of proper use of our computer systems and on cyber security.• Our information security infrastructure is updated regularly and employs multiple layers
of defence. Connectivity to our partners’ systems is controlled, monitored and logged.
S A F E T Y R I S K S
Risk description and impactThe industry we operate in has a considerable interaction between people and heavy equipment/loads, which expose us to a range of health and safety hazards. The potential impacts could include harm to our people, regulatory action, legal liability, increased costs and damage to our reputation. This risk is increasing as we diversify and grow our business. Our ultimate goal is zero harm to our employees, third parties and communities near our operations.
How we manage our risk• Our Board of Directors is fully committed to creating a safety culture throughout the Group.
We regularly monitor the implementation of our safety strategy at our terminals, which includes employee training, regular audits and management objectives in relation to the safety of our people.
• We continue to record and report on all safety impacts within our businesses to the Board and senior management. This includes collecting, analysing, reporting and monitoring data on a monthly basis in order to measure the safety performance of our business units.
• We investigate all incidents and have a working group in place to highlight trends, reduce risk factors and identify and implement measures aimed at eliminating future incidents.
• Terminal Management is responsible for local terminal safety risks and is supported by safety guides, operational manuals, procedures and oversight from our local, regional and global safety teams, which coordinate consistent approaches to safety risks.
• A vendor code of conduct has been established to ensure contractor selection criteria is aligned with our safety policies prior to commencing work at our terminals.
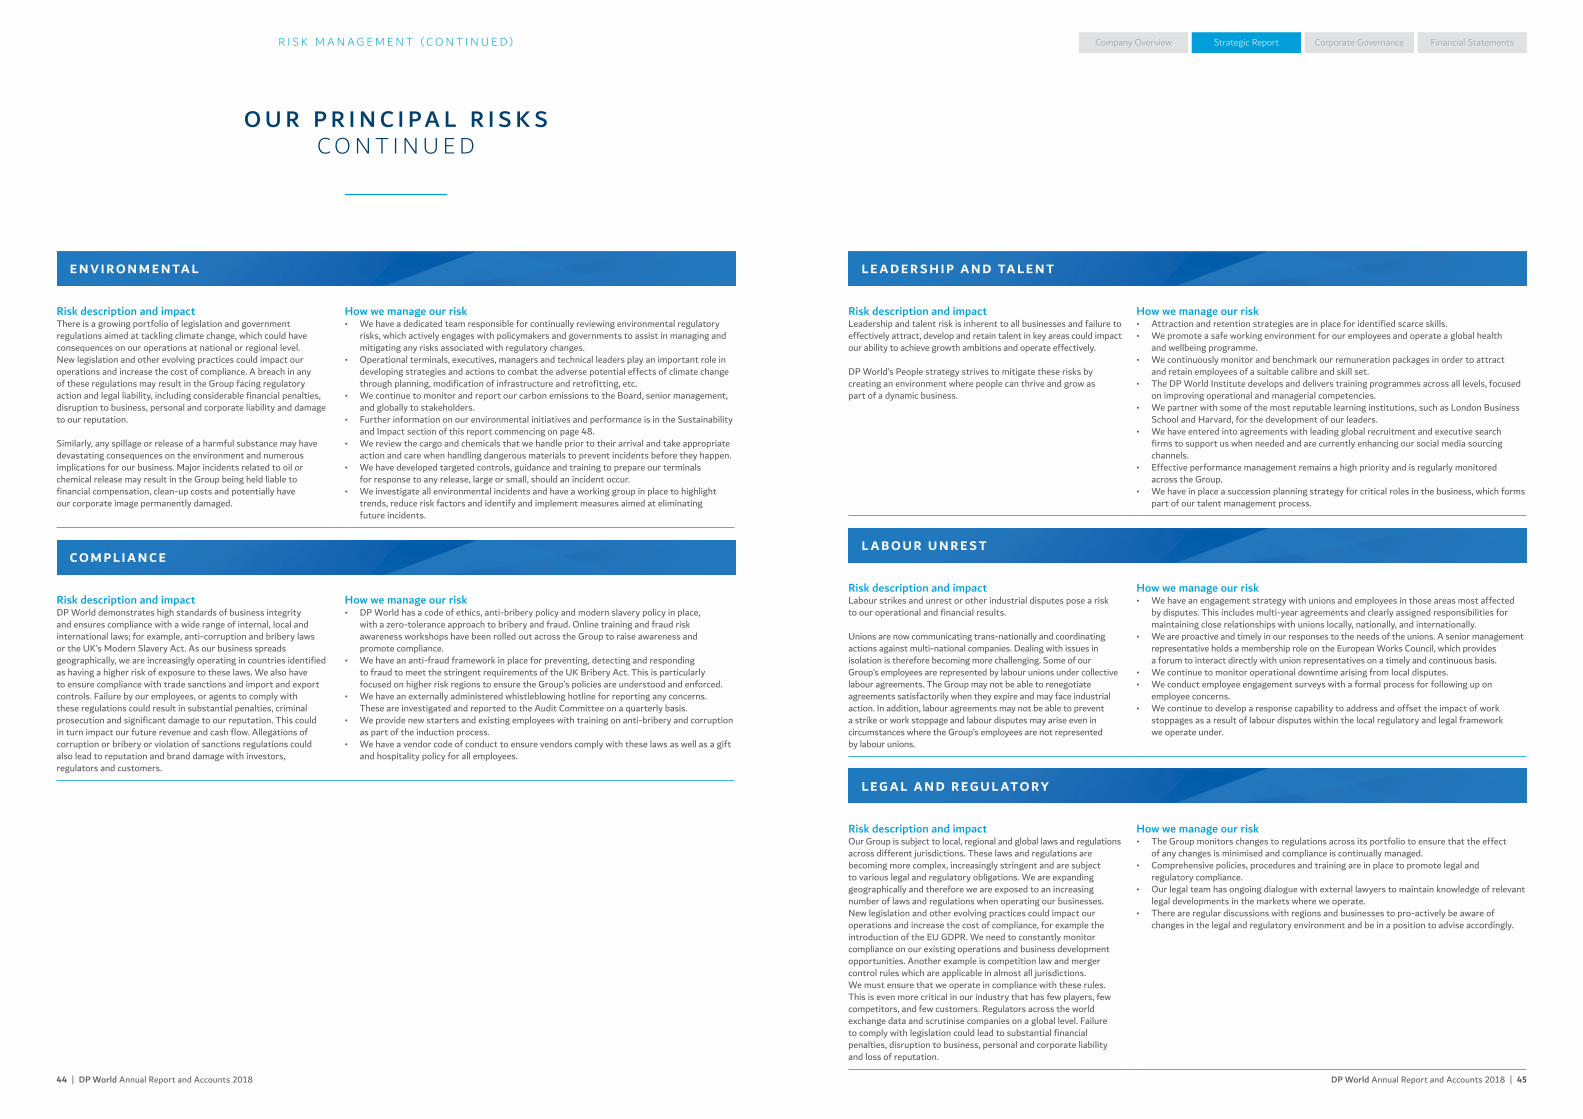
DP World Annual Report and Accounts 2018 | 4544 | DP World Annual Report and Accounts 2018
Company Overview Corporate Governance Financial StatementsStrategic ReportR I S K M A N A G E M E N T ( C O N T I N U E D )
O U R P R I N C I P A L R I S K S C O N T I N U E D
E N V I R O N M E N TA L
Risk description and impactThere is a growing portfolio of legislation and government regulations aimed at tackling climate change, which could have consequences on our operations at national or regional level. New legislation and other evolving practices could impact our operations and increase the cost of compliance. A breach in any of these regulations may result in the Group facing regulatory action and legal liability, including considerable financial penalties, disruption to business, personal and corporate liability and damage to our reputation.
Similarly, any spillage or release of a harmful substance may have devastating consequences on the environment and numerous implications for our business. Major incidents related to oil or chemical release may result in the Group being held liable to financial compensation, clean-up costs and potentially have our corporate image permanently damaged.
How we manage our risk• We have a dedicated team responsible for continually reviewing environmental regulatory
risks, which actively engages with policymakers and governments to assist in managing and mitigating any risks associated with regulatory changes.
• Operational terminals, executives, managers and technical leaders play an important role in developing strategies and actions to combat the adverse potential effects of climate change through planning, modification of infrastructure and retrofitting, etc.
• We continue to monitor and report our carbon emissions to the Board, senior management, and globally to stakeholders.
• Further information on our environmental initiatives and performance is in the Sustainability and Impact section of this report commencing on page 48.
• We review the cargo and chemicals that we handle prior to their arrival and take appropriate action and care when handling dangerous materials to prevent incidents before they happen.
• We have developed targeted controls, guidance and training to prepare our terminals for response to any release, large or small, should an incident occur.
• We investigate all environmental incidents and have a working group in place to highlight trends, reduce risk factors and identify and implement measures aimed at eliminating future incidents.
C O M P L I A N C E
Risk description and impactDP World demonstrates high standards of business integrity and ensures compliance with a wide range of internal, local and international laws; for example, anti-corruption and bribery laws or the UK’s Modern Slavery Act. As our business spreads geographically, we are increasingly operating in countries identified as having a higher risk of exposure to these laws. We also have to ensure compliance with trade sanctions and import and export controls. Failure by our employees, or agents to comply with these regulations could result in substantial penalties, criminal prosecution and significant damage to our reputation. This could in turn impact our future revenue and cash flow. Allegations of corruption or bribery or violation of sanctions regulations could also lead to reputation and brand damage with investors, regulators and customers.
How we manage our risk• DP World has a code of ethics, anti-bribery policy and modern slavery policy in place,
with a zero-tolerance approach to bribery and fraud. Online training and fraud risk awareness workshops have been rolled out across the Group to raise awareness and promote compliance.
• We have an anti-fraud framework in place for preventing, detecting and responding to fraud to meet the stringent requirements of the UK Bribery Act. This is particularly focused on higher risk regions to ensure the Group’s policies are understood and enforced.
• We have an externally administered whistleblowing hotline for reporting any concerns. These are investigated and reported to the Audit Committee on a quarterly basis.
• We provide new starters and existing employees with training on anti-bribery and corruption as part of the induction process.
• We have a vendor code of conduct to ensure vendors comply with these laws as well as a gift and hospitality policy for all employees.
L E A D E R S H I P A N D TA L E N T
Risk description and impactLeadership and talent risk is inherent to all businesses and failure to effectively attract, develop and retain talent in key areas could impact our ability to achieve growth ambitions and operate effectively.
DP World’s People strategy strives to mitigate these risks by creating an environment where people can thrive and grow as part of a dynamic business.
How we manage our risk• Attraction and retention strategies are in place for identified scarce skills.• We promote a safe working environment for our employees and operate a global health
and wellbeing programme.• We continuously monitor and benchmark our remuneration packages in order to attract
and retain employees of a suitable calibre and skill set. • The DP World Institute develops and delivers training programmes across all levels, focused
on improving operational and managerial competencies.• We partner with some of the most reputable learning institutions, such as London Business
School and Harvard, for the development of our leaders.• We have entered into agreements with leading global recruitment and executive search
firms to support us when needed and are currently enhancing our social media sourcing channels.
• Effective performance management remains a high priority and is regularly monitored across the Group.
• We have in place a succession planning strategy for critical roles in the business, which forms part of our talent management process.
L A B O U R U N R E S T
Risk description and impactLabour strikes and unrest or other industrial disputes pose a risk to our operational and financial results.
Unions are now communicating trans-nationally and coordinating actions against multi-national companies. Dealing with issues in isolation is therefore becoming more challenging. Some of our Group’s employees are represented by labour unions under collective labour agreements. The Group may not be able to renegotiate agreements satisfactorily when they expire and may face industrial action. In addition, labour agreements may not be able to prevent a strike or work stoppage and labour disputes may arise even in circumstances where the Group’s employees are not represented by labour unions.
How we manage our risk• We have an engagement strategy with unions and employees in those areas most affected
by disputes. This includes multi-year agreements and clearly assigned responsibilities for maintaining close relationships with unions locally, nationally, and internationally.
• We are proactive and timely in our responses to the needs of the unions. A senior management representative holds a membership role on the European Works Council, which provides a forum to interact directly with union representatives on a timely and continuous basis.
• We continue to monitor operational downtime arising from local disputes.• We conduct employee engagement surveys with a formal process for following up on
employee concerns.• We continue to develop a response capability to address and offset the impact of work
stoppages as a result of labour disputes within the local regulatory and legal framework we operate under.
L E G A L A N D R E G U L AT O RY
Risk description and impactOur Group is subject to local, regional and global laws and regulations across different jurisdictions. These laws and regulations are becoming more complex, increasingly stringent and are subject to various legal and regulatory obligations. We are expanding geographically and therefore we are exposed to an increasing number of laws and regulations when operating our businesses. New legislation and other evolving practices could impact our operations and increase the cost of compliance, for example the introduction of the EU GDPR. We need to constantly monitor compliance on our existing operations and business development opportunities. Another example is competition law and merger control rules which are applicable in almost all jurisdictions. We must ensure that we operate in compliance with these rules. This is even more critical in our industry that has few players, few competitors, and few customers. Regulators across the world exchange data and scrutinise companies on a global level. Failure to comply with legislation could lead to substantial financial penalties, disruption to business, personal and corporate liability and loss of reputation.
How we manage our risk• The Group monitors changes to regulations across its portfolio to ensure that the effect
of any changes is minimised and compliance is continually managed.• Comprehensive policies, procedures and training are in place to promote legal and
regulatory compliance.• Our legal team has ongoing dialogue with external lawyers to maintain knowledge of relevant
legal developments in the markets where we operate.• There are regular discussions with regions and businesses to pro-actively be aware of
changes in the legal and regulatory environment and be in a position to advise accordingly.
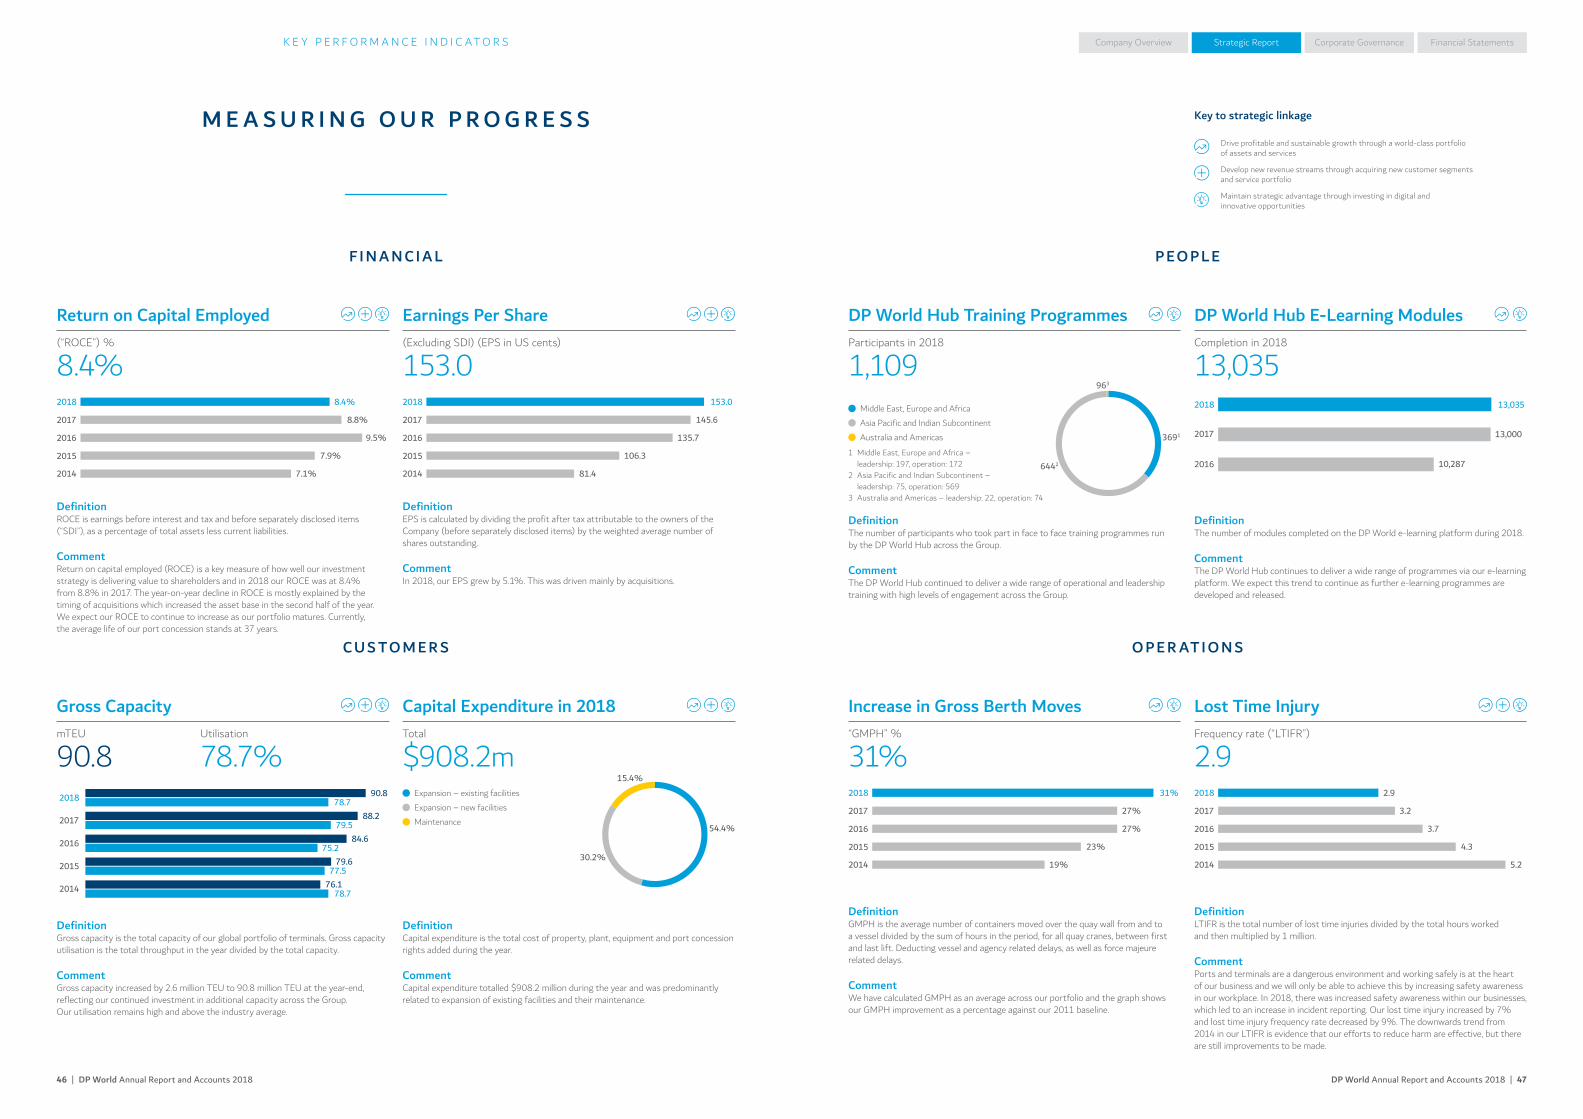
DP World Annual Report and Accounts 2018 | 4746 | DP World Annual Report and Accounts 2018
Company Overview Corporate Governance Financial StatementsStrategic Report
2018
2017
2016
2015
2014
8.4%
8.8%
9.5%
7.9%
7.1%
2018
2017
2016
2015
2014
90.878.7
88.279.5
84.675.2
79.677.5
76.178.7
2018
2017
2016
2015
2014
31%
27%
27%
23%
19%
2018
2017
2016
2015
2014
153.0
145.6
135.7
106.3
81.4
2018
2017
2016
13,035
13,000
10,287
2018
2017
2016
2015
2014
2.9
3.2
3.7
4.3
5.2
54.4%
30.2%
15.4%
3691
6442
963
Expansion – existing facilities Expansion – new facilities Maintenance
Middle East, Europe and Africa Asia Pacific and Indian Subcontinent Australia and Americas
1 Middle East, Europe and Africa – leadership: 197, operation: 172
2 Asia Pacific and Indian Subcontinent – leadership: 75, operation: 569
3 Australia and Americas – leadership: 22, operation: 74
K E Y P E R F O R M A N C E I N D I C AT O R S
M E A S U R I N G O U R P R O G R E S S
F I N A N C I A L
Return on Capital Employed (“ROCE”) %
8.4%
Gross Capacity mTEU Utilisation
90.8 78.7%
Increase in Gross Berth Moves “GMPH” %
31%
Earnings Per Share (Excluding SDI) (EPS in US cents)
153.0
Capital Expenditure in 2018 Total
$908.2m
DP World Hub E-Learning Modules Completion in 2018
13,035
DP World Hub Training Programmes Participants in 2018
1,109
Lost Time Injury Frequency rate (“LTIFR”)
2.9
P EO P L E
O P E R AT I O N SC U S TO M E R S
Definition ROCE is earnings before interest and tax and before separately disclosed items (“SDI”), as a percentage of total assets less current liabilities.
CommentReturn on capital employed (ROCE) is a key measure of how well our investment strategy is delivering value to shareholders and in 2018 our ROCE was at 8.4% from 8.8% in 2017. The year-on-year decline in ROCE is mostly explained by the timing of acquisitions which increased the asset base in the second half of the year. We expect our ROCE to continue to increase as our portfolio matures. Currently, the average life of our port concession stands at 37 years.
Definition The number of participants who took part in face to face training programmes run by the DP World Hub across the Group.
CommentThe DP World Hub continued to deliver a wide range of operational and leadership training with high levels of engagement across the Group.
Definition Gross capacity is the total capacity of our global portfolio of terminals. Gross capacity utilisation is the total throughput in the year divided by the total capacity.
CommentGross capacity increased by 2.6 million TEU to 90.8 million TEU at the year-end, reflecting our continued investment in additional capacity across the Group. Our utilisation remains high and above the industry average.
Definition GMPH is the average number of containers moved over the quay wall from and to a vessel divided by the sum of hours in the period, for all quay cranes, between first and last lift. Deducting vessel and agency related delays, as well as force majeure related delays.
CommentWe have calculated GMPH as an average across our portfolio and the graph shows our GMPH improvement as a percentage against our 2011 baseline.
Definition EPS is calculated by dividing the profit after tax attributable to the owners of the Company (before separately disclosed items) by the weighted average number of shares outstanding.
CommentIn 2018, our EPS grew by 5.1%. This was driven mainly by acquisitions.
Definition Capital expenditure is the total cost of property, plant, equipment and port concession rights added during the year.
CommentCapital expenditure totalled $908.2 million during the year and was predominantly related to expansion of existing facilities and their maintenance.
Definition The number of modules completed on the DP World e-learning platform during 2018.
CommentThe DP World Hub continues to deliver a wide range of programmes via our e-learning platform. We expect this trend to continue as further e-learning programmes are developed and released.
Definition LTIFR is the total number of lost time injuries divided by the total hours worked and then multiplied by 1 million.
CommentPorts and terminals are a dangerous environment and working safely is at the heart of our business and we will only be able to achieve this by increasing safety awareness in our workplace. In 2018, there was increased safety awareness within our businesses, which led to an increase in incident reporting. Our lost time injury increased by 7% and lost time injury frequency rate decreased by 9%. The downwards trend from 2014 in our LTIFR is evidence that our efforts to reduce harm are effective, but there are still improvements to be made.
Key to strategic linkage
Drive profitable and sustainable growth through a world-class portfolio of assets and services
Develop new revenue streams through acquiring new customer segments and service portfolio
Maintain strategic advantage through investing in digital and innovative opportunities
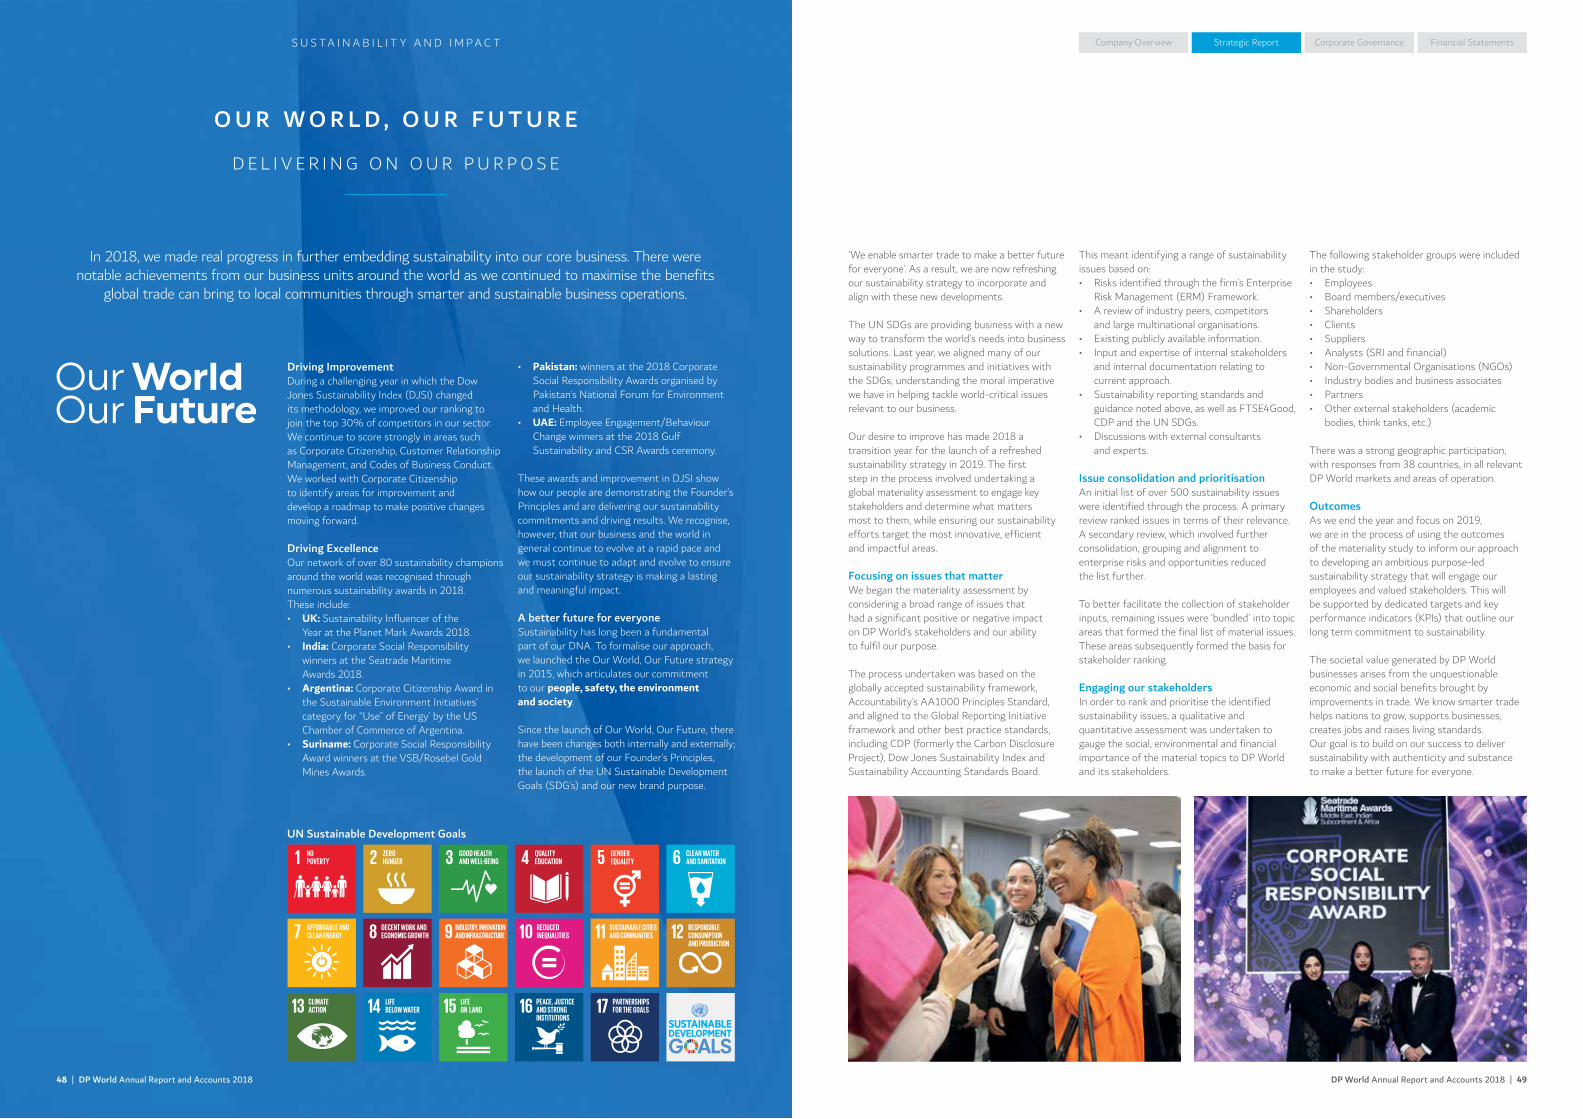
DP World Annual Report and Accounts 2018 | 49
Company Overview Corporate Governance Financial StatementsStrategic Report
48 | DP World Annual Report and Accounts 2018
S U S TA I N A B I L I T Y A N D I M P A C T
In 2018, we made real progress in further embedding sustainability into our core business. There were notable achievements from our business units around the world as we continued to maximise the benefits
global trade can bring to local communities through smarter and sustainable business operations.
‘We enable smarter trade to make a better future for everyone’. As a result, we are now refreshing our sustainability strategy to incorporate and align with these new developments.
The UN SDGs are providing business with a new way to transform the world’s needs into business solutions. Last year, we aligned many of our sustainability programmes and initiatives with the SDGs, understanding the moral imperative we have in helping tackle world-critical issues relevant to our business.
Our desire to improve has made 2018 a transition year for the launch of a refreshed sustainability strategy in 2019. The first step in the process involved undertaking a global materiality assessment to engage key stakeholders and determine what matters most to them, while ensuring our sustainability efforts target the most innovative, efficient and impactful areas.
Focusing on issues that matterWe began the materiality assessment by considering a broad range of issues that had a significant positive or negative impact on DP World’s stakeholders and our ability to fulfil our purpose.
The process undertaken was based on the globally accepted sustainability framework, Accountability’s AA1000 Principles Standard, and aligned to the Global Reporting Initiative framework and other best practice standards, including CDP (formerly the Carbon Disclosure Project), Dow Jones Sustainability Index and Sustainability Accounting Standards Board.
Driving ImprovementDuring a challenging year in which the Dow Jones Sustainability Index (DJSI) changed its methodology, we improved our ranking to join the top 30% of competitors in our sector. We continue to score strongly in areas such as Corporate Citizenship, Customer Relationship Management, and Codes of Business Conduct. We worked with Corporate Citizenship to identify areas for improvement and develop a roadmap to make positive changes moving forward.
Driving ExcellenceOur network of over 80 sustainability champions around the world was recognised through numerous sustainability awards in 2018. These include:• UK: Sustainability Influencer of the
Year at the Planet Mark Awards 2018.• India: Corporate Social Responsibility
winners at the Seatrade Maritime Awards 2018.
• Argentina: Corporate Citizenship Award in the Sustainable Environment Initiatives’ category for “Use” of Energy’ by the US Chamber of Commerce of Argentina.
• Suriname: Corporate Social Responsibility Award winners at the VSB/Rosebel Gold Mines Awards.
This meant identifying a range of sustainability issues based on:• Risks identified through the firm’s Enterprise
Risk Management (ERM) Framework.• A review of industry peers, competitors
and large multinational organisations.• Existing publicly available information.• Input and expertise of internal stakeholders
and internal documentation relating to current approach.
• Sustainability reporting standards and guidance noted above, as well as FTSE4Good, CDP and the UN SDGs.
• Discussions with external consultants and experts.
Issue consolidation and prioritisationAn initial list of over 500 sustainability issues were identified through the process. A primary review ranked issues in terms of their relevance. A secondary review, which involved further consolidation, grouping and alignment to enterprise risks and opportunities reduced the list further.
To better facilitate the collection of stakeholder inputs, remaining issues were ‘bundled’ into topic areas that formed the final list of material issues. These areas subsequently formed the basis for stakeholder ranking.
Engaging our stakeholdersIn order to rank and prioritise the identified sustainability issues, a qualitative and quantitative assessment was undertaken to gauge the social, environmental and financial importance of the material topics to DP World and its stakeholders.
• Pakistan: winners at the 2018 Corporate Social Responsibility Awards organised by Pakistan’s National Forum for Environment and Health.
• UAE: Employee Engagement/Behaviour Change winners at the 2018 Gulf Sustainability and CSR Awards ceremony.
These awards and improvement in DJSI show how our people are demonstrating the Founder’s Principles and are delivering our sustainability commitments and driving results. We recognise, however, that our business and the world in general continue to evolve at a rapid pace and we must continue to adapt and evolve to ensure our sustainability strategy is making a lasting and meaningful impact.
A better future for everyoneSustainability has long been a fundamental part of our DNA. To formalise our approach, we launched the Our World, Our Future strategy in 2015, which articulates our commitment to our people, safety, the environment and society.
Since the launch of Our World, Our Future, there have been changes both internally and externally; the development of our Founder’s Principles, the launch of the UN Sustainable Development Goals (SDG’s) and our new brand purpose.
O U R W O R L D , O U R F U T U R E
D E L I V E R I N G O N O U R P U R P O S E
The following stakeholder groups were included in the study:• Employees• Board members/executives• Shareholders• Clients• Suppliers• Analysts (SRI and financial)• Non-Governmental Organisations (NGOs)• Industry bodies and business associates• Partners• Other external stakeholders (academic
bodies, think tanks, etc.)
There was a strong geographic participation, with responses from 38 countries, in all relevant DP World markets and areas of operation.
OutcomesAs we end the year and focus on 2019, we are in the process of using the outcomes of the materiality study to inform our approach to developing an ambitious purpose-led sustainability strategy that will engage our employees and valued stakeholders. This will be supported by dedicated targets and key performance indicators (KPIs) that outline our long term commitment to sustainability.
The societal value generated by DP World businesses arises from the unquestionable economic and social benefits brought by improvements in trade. We know smarter trade helps nations to grow, supports businesses, creates jobs and raises living standards. Our goal is to build on our success to deliver sustainability with authenticity and substance to make a better future for everyone.
UN Sustainable Development Goals
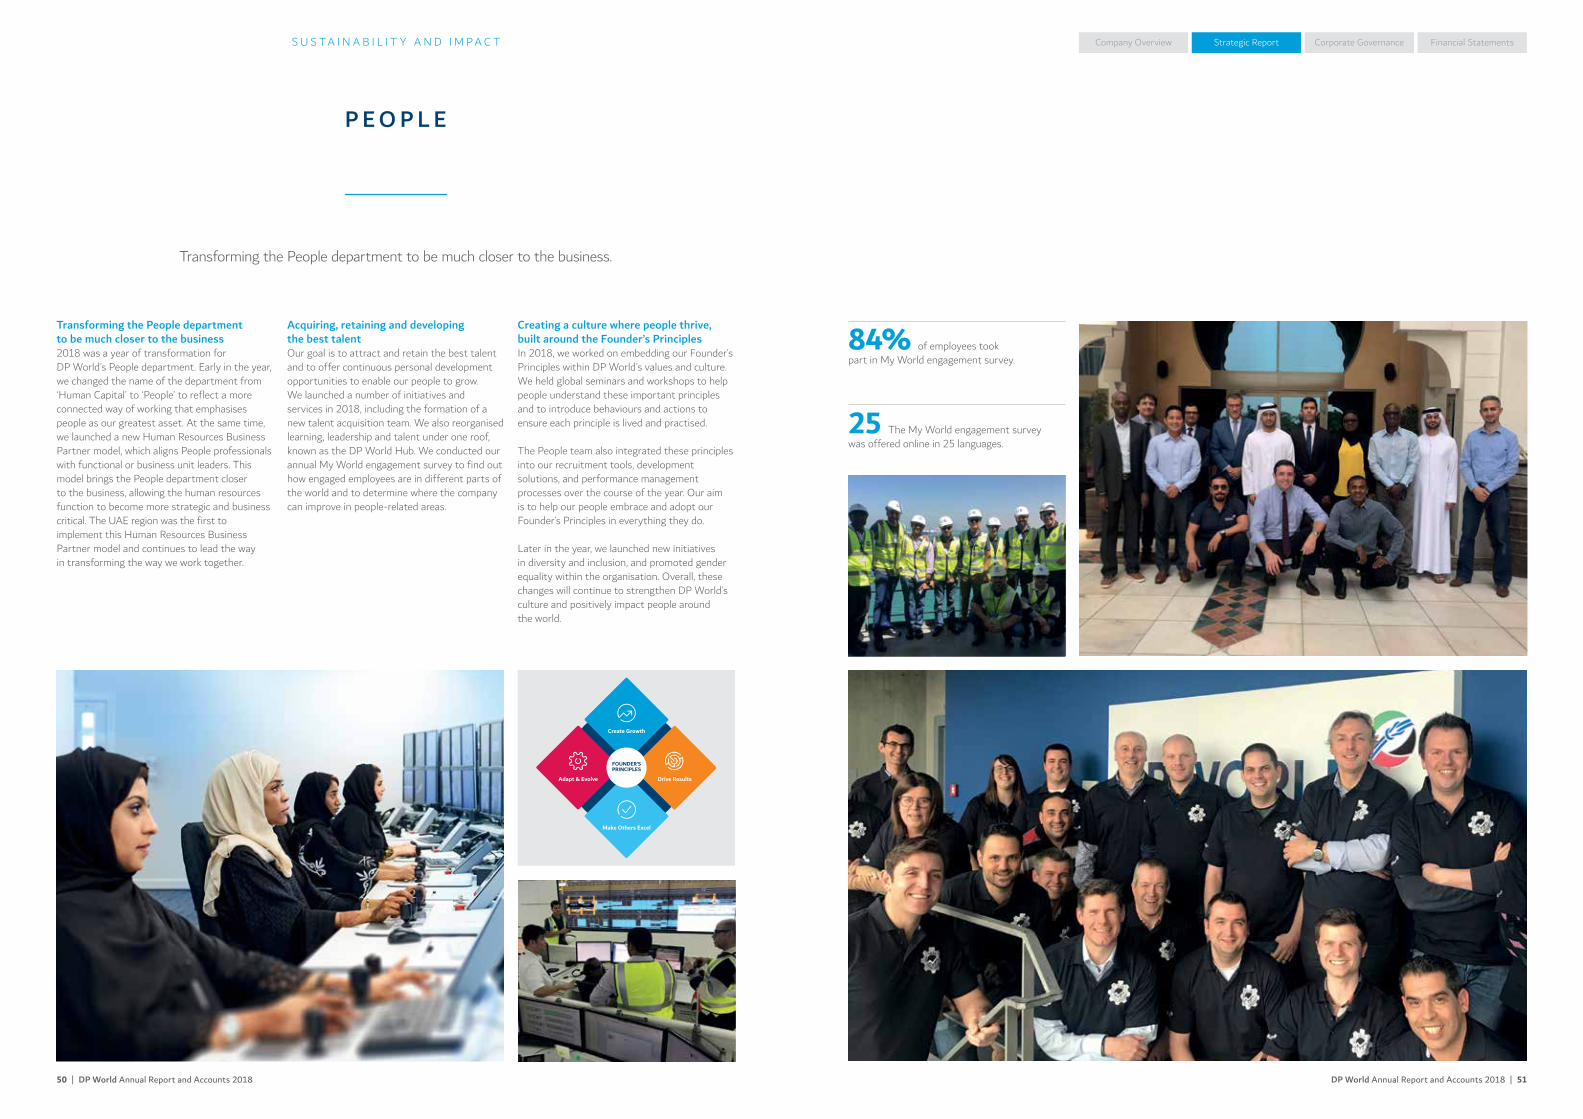
DP World Annual Report and Accounts 2018 | 5150 | DP World Annual Report and Accounts 2018
Company Overview Corporate Governance Financial StatementsStrategic Report
Create Growth
Drive Results
Make Others Excel
Adapt & Evolve
FOUNDER’SPRINCIPLES
P E O P L E
Transforming the People department to be much closer to the business2018 was a year of transformation for DP World’s People department. Early in the year, we changed the name of the department from ‘Human Capital’ to ‘People’ to reflect a more connected way of working that emphasises people as our greatest asset. At the same time, we launched a new Human Resources Business Partner model, which aligns People professionals with functional or business unit leaders. This model brings the People department closer to the business, allowing the human resources function to become more strategic and business critical. The UAE region was the first to implement this Human Resources Business Partner model and continues to lead the way in transforming the way we work together.
Acquiring, retaining and developing the best talentOur goal is to attract and retain the best talent and to offer continuous personal development opportunities to enable our people to grow. We launched a number of initiatives and services in 2018, including the formation of a new talent acquisition team. We also reorganised learning, leadership and talent under one roof, known as the DP World Hub. We conducted our annual My World engagement survey to find out how engaged employees are in different parts of the world and to determine where the company can improve in people-related areas.
Creating a culture where people thrive, built around the Founder’s PrinciplesIn 2018, we worked on embedding our Founder’s Principles within DP World’s values and culture. We held global seminars and workshops to help people understand these important principles and to introduce behaviours and actions to ensure each principle is lived and practised.
The People team also integrated these principles into our recruitment tools, development solutions, and performance management processes over the course of the year. Our aim is to help our people embrace and adopt our Founder’s Principles in everything they do.
Later in the year, we launched new initiatives in diversity and inclusion, and promoted gender equality within the organisation. Overall, these changes will continue to strengthen DP World’s culture and positively impact people around the world.
84% of employees took part in My World engagement survey.
25 The My World engagement survey was offered online in 25 languages.
Transforming the People department to be much closer to the business.
S U S TA I N A B I L I T Y A N D I M P A C T
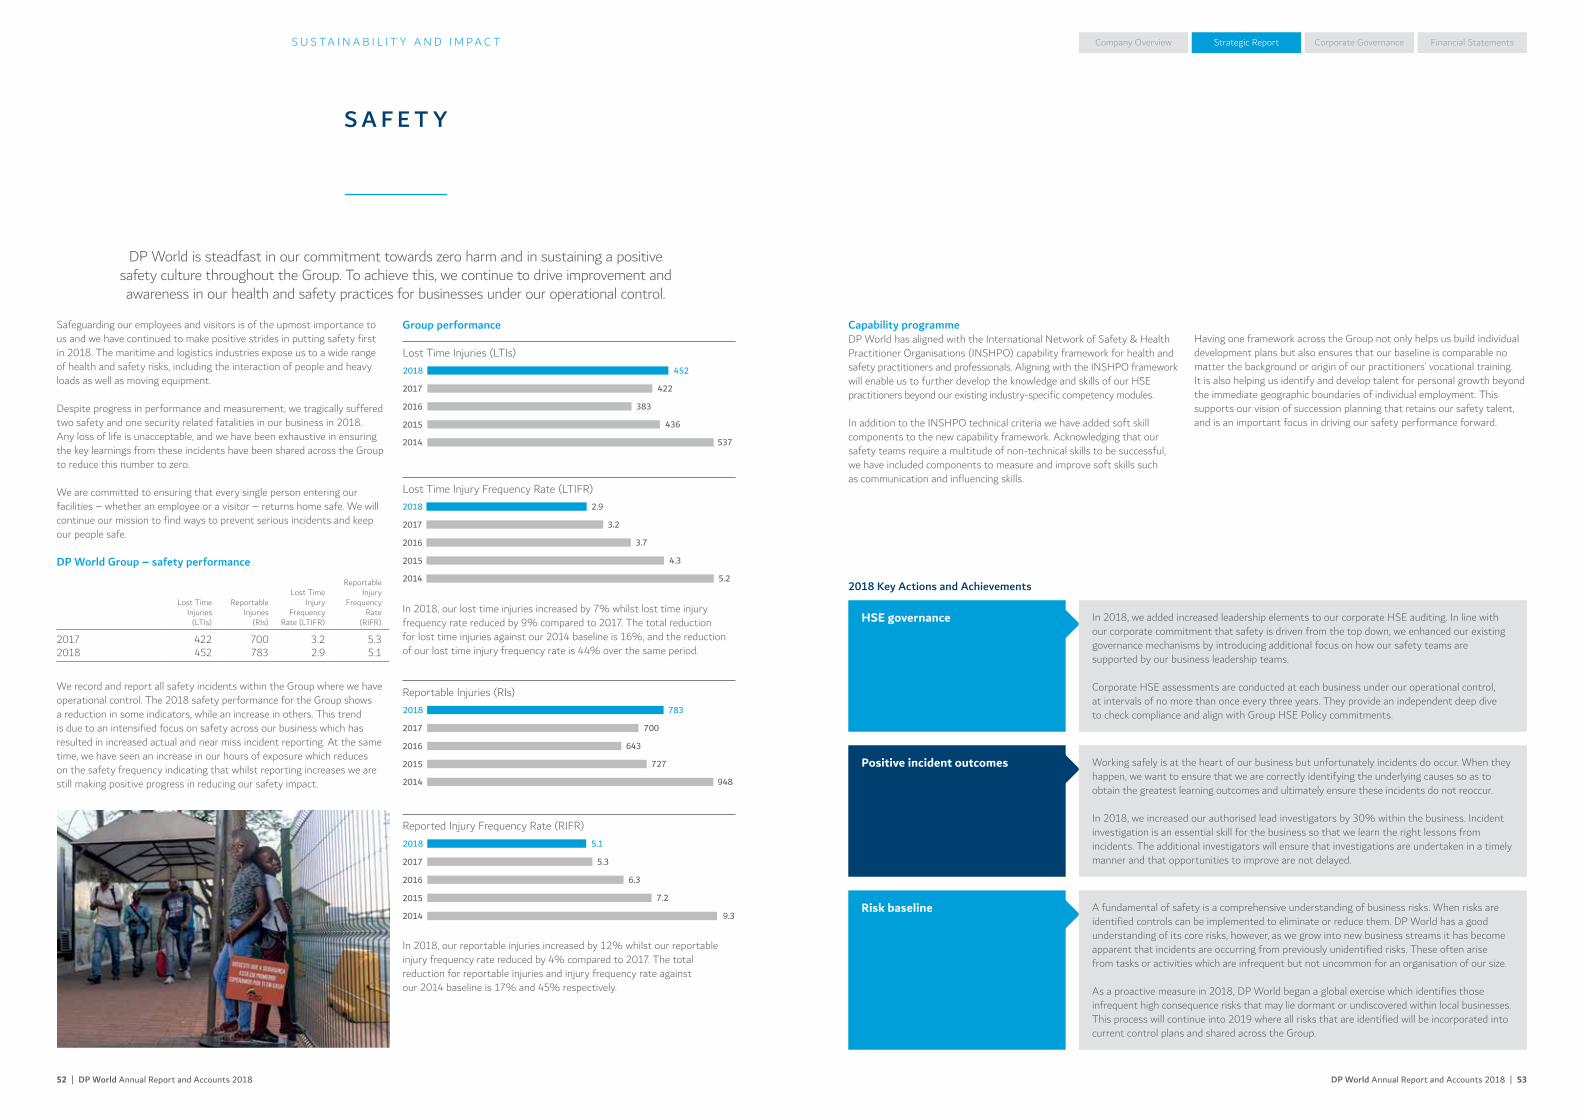
DP World Annual Report and Accounts 2018 | 5352 | DP World Annual Report and Accounts 2018
Company Overview Corporate Governance Financial StatementsStrategic Report
Safeguarding our employees and visitors is of the upmost importance to us and we have continued to make positive strides in putting safety first in 2018. The maritime and logistics industries expose us to a wide range of health and safety risks, including the interaction of people and heavy loads as well as moving equipment.
Despite progress in performance and measurement, we tragically suffered two safety and one security related fatalities in our business in 2018. Any loss of life is unacceptable, and we have been exhaustive in ensuring the key learnings from these incidents have been shared across the Group to reduce this number to zero.
We are committed to ensuring that every single person entering our facilities – whether an employee or a visitor – returns home safe. We will continue our mission to find ways to prevent serious incidents and keep our people safe.
DP World Group – safety performance
Lost Time Injuries
(LTIs)
Reportable Injuries
(RIs)
Lost Time Injury
Frequency Rate (LTIFR)
Reportable Injury
Frequency Rate
(RIFR)
2017 422 700 3.2 5.32018 452 783 2.9 5.1
We record and report all safety incidents within the Group where we have operational control. The 2018 safety performance for the Group shows a reduction in some indicators, while an increase in others. This trend is due to an intensified focus on safety across our business which has resulted in increased actual and near miss incident reporting. At the same time, we have seen an increase in our hours of exposure which reduces on the safety frequency indicating that whilst reporting increases we are still making positive progress in reducing our safety impact.
Capability programme DP World has aligned with the International Network of Safety & Health Practitioner Organisations (INSHPO) capability framework for health and safety practitioners and professionals. Aligning with the INSHPO framework will enable us to further develop the knowledge and skills of our HSE practitioners beyond our existing industry-specific competency modules.
In addition to the INSHPO technical criteria we have added soft skill components to the new capability framework. Acknowledging that our safety teams require a multitude of non-technical skills to be successful, we have included components to measure and improve soft skills such as communication and influencing skills.
S U S TA I N A B I L I T Y A N D I M P A C T
S A F E T Y
Group performance
Lost Time Injuries (LTIs) 2018
422
452
383
436
537
2017
2016
2015
2014
Lost Time Injury Frequency Rate (LTIFR)2018
2017
2016
2015
2014
2.9
3.2
3.7
4.3
5.2
In 2018, our lost time injuries increased by 7% whilst lost time injury frequency rate reduced by 9% compared to 2017. The total reduction for lost time injuries against our 2014 baseline is 16%, and the reduction of our lost time injury frequency rate is 44% over the same period.
Reportable Injuries (RIs)2018
700
783
643
727
948
2017
2016
2015
2014
Reported Injury Frequency Rate (RIFR)2018
2017
2016
2015
2014
5.1
5.3
6.3
7.2
9.3
In 2018, our reportable injuries increased by 12% whilst our reportable injury frequency rate reduced by 4% compared to 2017. The total reduction for reportable injuries and injury frequency rate against our 2014 baseline is 17% and 45% respectively.
Having one framework across the Group not only helps us build individual development plans but also ensures that our baseline is comparable no matter the background or origin of our practitioners’ vocational training. It is also helping us identify and develop talent for personal growth beyond the immediate geographic boundaries of individual employment. This supports our vision of succession planning that retains our safety talent, and is an important focus in driving our safety performance forward.
DP World is steadfast in our commitment towards zero harm and in sustaining a positive safety culture throughout the Group. To achieve this, we continue to drive improvement and awareness in our health and safety practices for businesses under our operational control.
2018 Key Actions and Achievements
HSE governance In 2018, we added increased leadership elements to our corporate HSE auditing. In line with our corporate commitment that safety is driven from the top down, we enhanced our existing governance mechanisms by introducing additional focus on how our safety teams are supported by our business leadership teams.
Corporate HSE assessments are conducted at each business under our operational control, at intervals of no more than once every three years. They provide an independent deep dive to check compliance and align with Group HSE Policy commitments.
Positive incident outcomes Working safely is at the heart of our business but unfortunately incidents do occur. When they happen, we want to ensure that we are correctly identifying the underlying causes so as to obtain the greatest learning outcomes and ultimately ensure these incidents do not reoccur.
In 2018, we increased our authorised lead investigators by 30% within the business. Incident investigation is an essential skill for the business so that we learn the right lessons from incidents. The additional investigators will ensure that investigations are undertaken in a timely manner and that opportunities to improve are not delayed.
Risk baseline A fundamental of safety is a comprehensive understanding of business risks. When risks are identified controls can be implemented to eliminate or reduce them. DP World has a good understanding of its core risks, however, as we grow into new business streams it has become apparent that incidents are occurring from previously unidentified risks. These often arise from tasks or activities which are infrequent but not uncommon for an organisation of our size.
As a proactive measure in 2018, DP World began a global exercise which identifies those infrequent high consequence risks that may lie dormant or undiscovered within local businesses. This process will continue into 2019 where all risks that are identified will be incorporated into current control plans and shared across the Group.

DP World Annual Report and Accounts 2018 | 5554 | DP World Annual Report and Accounts 2018
Strategic Report Financial StatementsCorporate GovernanceCompany OverviewS U S TA I N A B I L I T Y A N D I M P A C T
E N V I R O N M E N T
DP World is committed to preventing and minimising negative impact on the environment. We believe that a long term outlook and responsible attitude to business are the only ways
to ensure our future corporate success.
Reducing the overall environmental footprint of the organisation is the key focus of DP World. We are committed to minimising our impact on the environment by better managing natural resources and emissions. We are proactive in reducing our carbon emissions and in promoting the efficient use of energy, renewable energy, the responsible use of natural resources and waste management. We also take an industry leading position on environmental policy and practice.
In 2018, DP World has been awarded a leadership A score by the UK-based Carbon Disclosure Project (CDP). This is the first year we made it to the A list. We are one of 127 leaders globally in the A list, demonstrating our commitment to the environment and our actions and approaches in managing climate change.
DP World Group – carbon emissions DP World Group carbon dioxide equivalent emissions (CO2e) in tonnes, by scope:
Emissions Scope (CO2e) 2017 2018
Scope 1 596,470 563,112 Scope 2 546,736 541,362 Biodiesel 260 1,745 Total Emissions 1,143,466 1,106,229
DP World Group – energy consumption DP World Group energy consumption in giga joules (GJ) by division and source:
Emission Scope (CO2e) 2017 2018
Diesel 6,800,302 6,204,581Electricity 3,714,336 3,345,730Total Energy 10,514,638 9,550,311
Ports and Terminals Performance
Emissions Intensity 2018
2017
2016
2015
2014
14.9
15.1
15.4
15.8
15.8
Despite our continued Company growth and correspondingly increasing energy use, our carbon intensity has steadily decreased year-on-year since 2009. From 2014 to 2018, our carbon intensity per Modified TEU (kilograms of carbon dioxide equivalent per 20-foot equivalent unit) decreased by 5%.
Energy Use 2018
2017
2016
2015
2014
63.0
69.6
63.8
68.1
70.3
Our energy performance is one of our key performance indicator in reducing our carbon emissions and in promoting efficient use of energy. Furthermore, we continue to find innovative ways of being more energy efficient and working towards reducing emissions across our global supply chain. In 2018, we once again reduced our energy use, which we measured as mega joules of energy used per total business unit move (MJ Energy/TTM). Over the past five years, we have reduced our energy use by 13%.
Our ultimate goal is to create a zero emission supply chain across our networks, helping the communities we serve and creating a cleaner society. In 2018, we were able to offset more than 55,738 tonnes of CO2e emission through our promotion of renewable energy sources and our investment in low-carbon fuels such as liquefied natural gas and compressed natural gas.
E N V I R O N M E N TA L F O O T P R I N T
SOUTH KOREA Conversion of over 80 truck trailers from diesel to Liquefied Natural Gas (LNG) (equivalent to 11,245,103kg of carbon emissions saved)
INDIA0.9 million kWh generated from the Solar Rooftop Programme
PAKISTAN126,000 kWh generated from the Solar Rooftop Programme
NETHERLANDS100% green energy is purchased to power our operation
PHILIPPINES102,000 litres of biodiesel used in our operations (equivalent to 20,078kg of carbon emissions saved)
DOMINICAN REPUBLIC1.8 million kWh generated from the solar rooftop installed on the warehouses
CHINA0.9 million litres of Liquefied Natural Gas (LNG) used in our operations (equivalent to 1,200,000kg of carbon emissions saved)
GERMANY100% of energy used in our operations is generated from renewable resources
BELGIUM6.8 million kWh generated through wind power for our operations
UAE11 million kWh generated from DP World Solar Rooftop Programme

DP World Annual Report and Accounts 2018 | 5756 | DP World Annual Report and Accounts 2018
Company Overview Corporate Governance Financial StatementsStrategic Report
E N V I R O N M E N T C O N T I N U E D
S O C I E T Y
In 2018, DP World launched two sustainability priority focus areas: Women’s empowerment and Oceans.
Women’s empowermentSupporting SDG Goal 5: Gender equalityWomen make up more than half of the world’s population, yet today inequality and discrimination continue to be global issues, which stagnate social and economic progress. We are working with leading organisations to support and empower women in their right to education, health and employment. At the start of the year, we used the UN Women’s Empowerment Principles (WEPs) Gender Gap Analysis tool to identify our strengths and where further actions can be taken at a local level. We used the WEPs as our roadmap for 2018 to drive gender equality performance across our workplace, marketplace and community.
S U S TA I N A B I L I T Y A N D I M P A C T
2018 Key Actions and Achievements
OceansSupporting SDG Goal 14: Life below waterAs a local port operator and global trade enabler, Oceans are a key focus area for our business operations and activities. We are working with organisations such as the World Ocean Council (WOC) to support ocean health and the communities that depend on marine and costal biodiversity. We became the first company in our sector to join the WOC in 2018 and our first area of collaboration will focus on port resilience to sea level rises to bring best practice mitigation strategies to coastal communities in developing countries.
2018 Key Actions and Achievements
Launch a global Sustainability and Impact Policy
The purpose of the Sustainability and Impact Policy is to set out DP World’s approach to sustainability and the importance of the UN SDGs. The new policy will also increase volunteering leave by encouraging employees to spend at least 16 working hours (equivalent to two working days per year) on a volunteering activity.
As a company committed to building a legacy that takes pride in being a global citizen, DP World encourages employees to contribute time to local community activities. We know the benefits it can bring to both communities and our people’s sense of pride and fulfilment. Impact measurement of our community investment programmes shows that 86% of beneficiaries improve their skills. Beyond this, 78% of employees reported feeling more committed to the Company and 74% felt more motivated from volunteering. Team working skills also improved by 80% on average for participants.
Reduce carbon emissions and energy use
The reduction of carbon emissions and energy use is part of DP World’s larger goal to create a better future for our people and the communities in which we operate. Our Low Carbon Transition focus starts with the alignment of our plan with low carbon economy policies and principles. This has been evident in our low carbon fuel investment projects. For example, we are currently implementing a Low Carbon Transition plan via a conversion of Diesel fuel to Liquified Natural Gas (LNG) as fuel for heavy equipment in Pusan in South Korea. The LNG YT Conversion Project started in 2014 and has been supported by government incentives. 72 vehicles have already been converted, ten of which were already replaced with new engines. There are a total of 144 vehicles targeted for LNG conversion in the coming two years. We are projecting a return on investment around 3-4 years and a fuel saving cost estimated at $2 million.
As we proceed in implementing our Low Carbon Transition Plan, we take into account the availability and dependability of experts by honing their technical expertise. One of the challenges we identified during the process of transferring our fleet to low carbon engine is finding specialised technicians who can do the work/job. Since we intend to implement our Low Carbon Transition Plan in all terminals, we are also considering a Training and Development programme to help facilitate the low carbon transition. Aside from the human element in this project, the cost of conversion was another significant challenge especially relating to engine conversion and acquisition of low carbon vehicles. The strong drive of management support is critical for this kind of project. DP World is fortunate to have a management team that believes in the integration of climate change with business strategy, and so requesting for financial support is easily justifiable. We also find the supply of Compressed Natural Gas (CNG) and Liquefied Natural Gas (LNG) to be a concern because we need to have an ample supply of LNG and CNG in order to support low carbon vehicles.
Promote renewable energy Creating a sustainable business model through the implementation of green technology is a core focus for DP World. One of our key initiatives is our ground-breaking Solar Power Programme in the UAE that will generate enough clean energy to power 4,600 homes on completion.
In 2018, the Company launched the UAE’s first green storage and warehouse facilities. Phase one is nearly complete, with 90% of the 88,000 solar panels installed. Phase two has been awarded and will see the installation of panels in early 2019.
DP World’s global headquarters in Jebel Ali is now carbon neutral as the result of solar photovoltaic (PV) panels installed on the building’s rooftop and car park. The issuing of the Net Zero Carbon Emissions Certificate further strengthens DP World’s commitment to solar energy, reflecting the goals of both the Dubai Integrated Energy Strategy (DIES) 2030 and The Dubai Clean Energy Strategy 2050.
Responsible use of natural resources and waste management
In 2018, a zero waste initiative was launched in JAFZA (a free zone entity within DP World) to eliminate waste leaving the border of the free zone to landfill. Solutions include encouraging waste reduction, converting food waste to compost, recycling and allowing only recyclable waste to be exported through Jebel Ali Port if necessary. JAFZA recycles more than 9,700 tonnes of waste each year, the equivalent of 10 million average sized garbage bags used in homes.
During the fifth annual Go Green Initiative, 8,332 employees of DP World, Hutchison Ports, PSA International, Port of Rotterdam and Shanghai International Port Group collected a total of 1,966 kg of aluminum cans and 2,227 mobile phones for recycling. The choice of two very different waste products for collection and recycling was intentional. Aluminium cans are one of the most recyclable waste items, while mobile phones contain many valuable resources as well as toxic components that can negatively impact both human health and the environment if improperly disposed of. The purpose of the project was to reinforce a simple message among participating employees – that of the need to think twice about the consequences of waste.
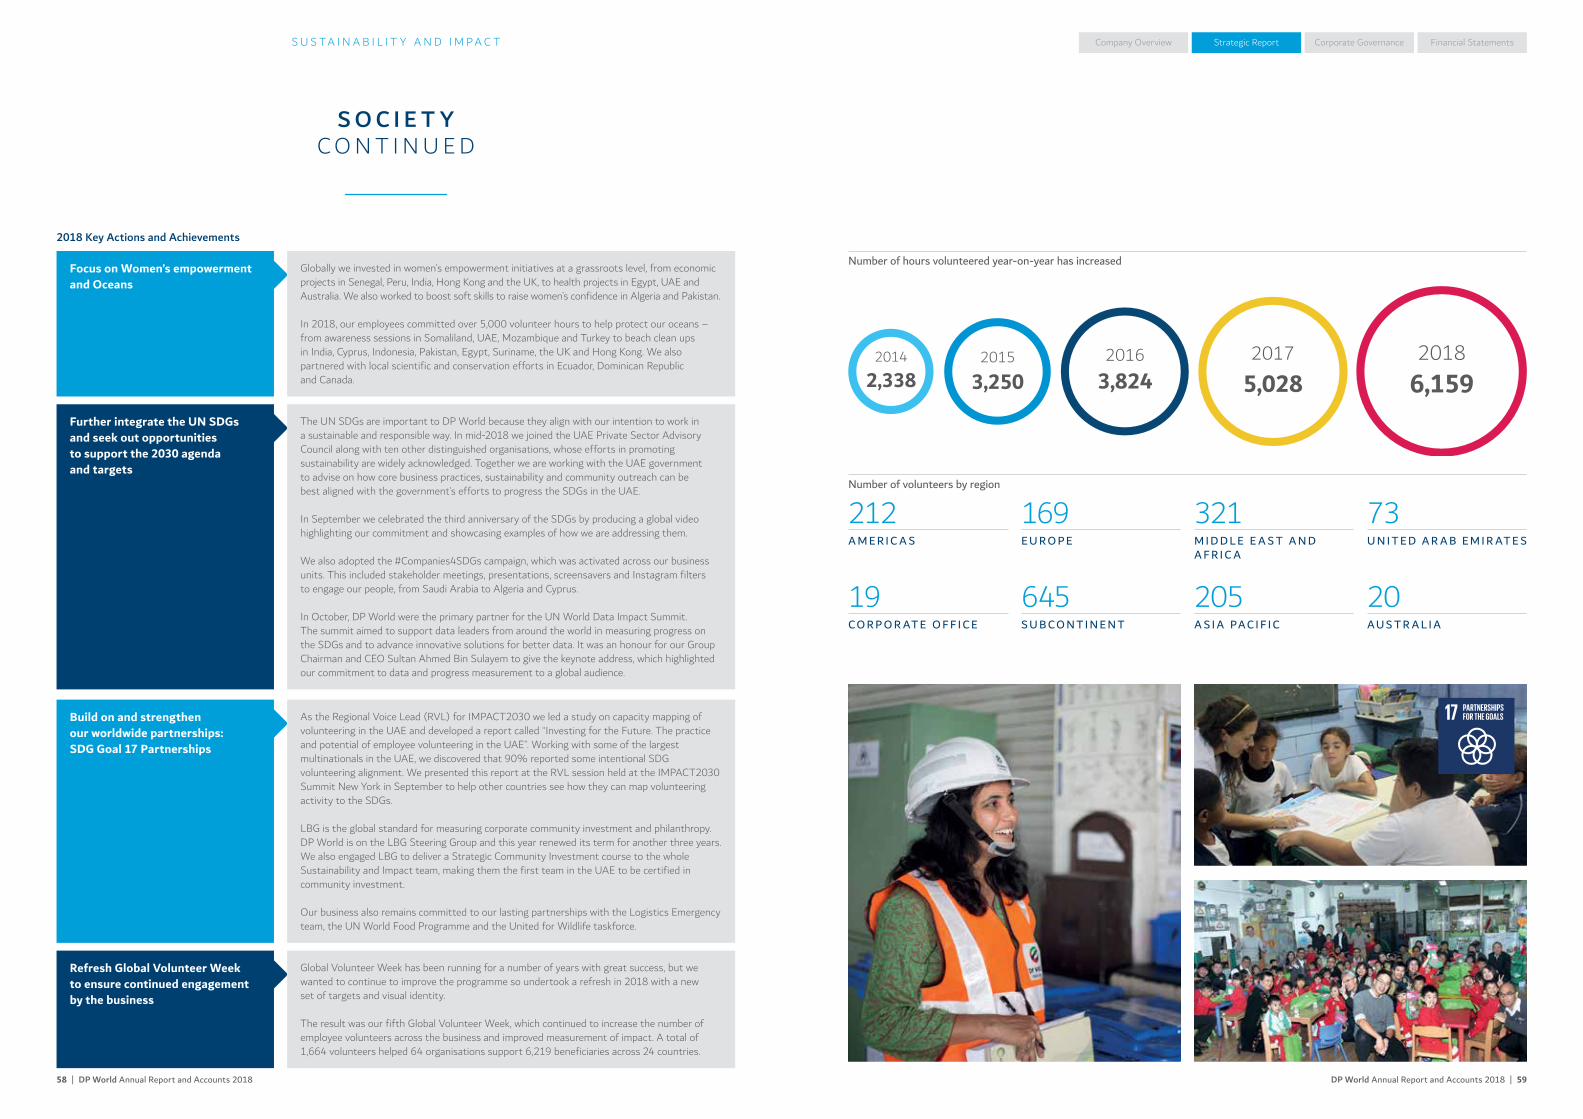
DP World Annual Report and Accounts 2018 | 5958 | DP World Annual Report and Accounts 2018
Company Overview Corporate Governance Financial StatementsStrategic Report
2014
2,3382015
3,2502016
3,8242017
5,0282018
6,159
S O C I E T Y C O N T I N U E D
Number of hours volunteered year-on-year has increased
Number of volunteers by region
212A M E R I C A S
169E U R O P E
321M I D D L E E A S T A N D A F R I C A
73U N I T E D A R A B E M I R AT E S
19C O R P O R AT E O F F I C E
645S U B C O N T I N E N T
205A S I A PAC I F I C
20AU S T R A L I A
S U S TA I N A B I L I T Y A N D I M P A C T
Focus on Women’s empowerment and Oceans
Globally we invested in women’s empowerment initiatives at a grassroots level, from economic projects in Senegal, Peru, India, Hong Kong and the UK, to health projects in Egypt, UAE and Australia. We also worked to boost soft skills to raise women’s confidence in Algeria and Pakistan.
In 2018, our employees committed over 5,000 volunteer hours to help protect our oceans – from awareness sessions in Somaliland, UAE, Mozambique and Turkey to beach clean ups in India, Cyprus, Indonesia, Pakistan, Egypt, Suriname, the UK and Hong Kong. We also partnered with local scientific and conservation efforts in Ecuador, Dominican Republic and Canada.
Further integrate the UN SDGs and seek out opportunities to support the 2030 agenda and targets
The UN SDGs are important to DP World because they align with our intention to work in a sustainable and responsible way. In mid-2018 we joined the UAE Private Sector Advisory Council along with ten other distinguished organisations, whose efforts in promoting sustainability are widely acknowledged. Together we are working with the UAE government to advise on how core business practices, sustainability and community outreach can be best aligned with the government’s efforts to progress the SDGs in the UAE.
In September we celebrated the third anniversary of the SDGs by producing a global video highlighting our commitment and showcasing examples of how we are addressing them.
We also adopted the #Companies4SDGs campaign, which was activated across our business units. This included stakeholder meetings, presentations, screensavers and Instagram filters to engage our people, from Saudi Arabia to Algeria and Cyprus.
In October, DP World were the primary partner for the UN World Data Impact Summit. The summit aimed to support data leaders from around the world in measuring progress on the SDGs and to advance innovative solutions for better data. It was an honour for our Group Chairman and CEO Sultan Ahmed Bin Sulayem to give the keynote address, which highlighted our commitment to data and progress measurement to a global audience.
Build on and strengthen our worldwide partnerships: SDG Goal 17 Partnerships
As the Regional Voice Lead (RVL) for IMPACT2030 we led a study on capacity mapping of volunteering in the UAE and developed a report called “Investing for the Future. The practice and potential of employee volunteering in the UAE”. Working with some of the largest multinationals in the UAE, we discovered that 90% reported some intentional SDG volunteering alignment. We presented this report at the RVL session held at the IMPACT2030 Summit New York in September to help other countries see how they can map volunteering activity to the SDGs.
LBG is the global standard for measuring corporate community investment and philanthropy. DP World is on the LBG Steering Group and this year renewed its term for another three years. We also engaged LBG to deliver a Strategic Community Investment course to the whole Sustainability and Impact team, making them the first team in the UAE to be certified in community investment.
Our business also remains committed to our lasting partnerships with the Logistics Emergency team, the UN World Food Programme and the United for Wildlife taskforce.
Refresh Global Volunteer Week to ensure continued engagement by the business
Global Volunteer Week has been running for a number of years with great success, but we wanted to continue to improve the programme so undertook a refresh in 2018 with a new set of targets and visual identity.
The result was our fifth Global Volunteer Week, which continued to increase the number of employee volunteers across the business and improved measurement of impact. A total of 1,664 volunteers helped 64 organisations support 6,219 beneficiaries across 24 countries.
2018 Key Actions and Achievements

DP World Annual Report and Accounts 2018 | 6160 | DP World Annual Report and Accounts 2018
Company Overview Corporate Governance Financial StatementsStrategic ReportC O R P O R AT E G O V E R N A N C E
B O A R D O F D I R E C T O R S
Sultan Ahmed Bin SulayemGroup Chairman and Chief Executive Officer
Yuvraj NarayanGroup Chief Financial Officer
Deepak ParekhSenior Independent Non-Executive Director
Nadya KamaliIndependent Non-Executive Director
Abdulla GhobashIndependent Non-Executive Director
Mohamed Al SuwaidiIndependent Non-Executive Director
Mark RussellIndependent Non-Executive Director
Robert WoodsIndependent Non-Executive Director
Skill
s and
exp
erie
nce With a career spanning three decades
across a wide range of industries, Sultan Ahmed Bin Sulayem brings a wealth of leadership experience to the Boardroom. In his previous role as Chairman of Dubai World, he established and led diverse businesses, including Nakheel, a real estate and tourism property development firm; and Istithmar World, a major global private equity investment house.
He oversaw the rapid development of the Jebel Ali Free Zone into an unrivalled business park of more than 7,000 companies and pioneered the Dubai Multi Commodities Centre.
As Chairman of DP World, he has been at the forefront of the Company’s international expansion, including the $6.85 billion acquisition of P&O Group. Mr. Bin Sulayem holds a BS in Economics from Temple University, United States.
Mr. Narayan has an extensive senior executive career with more than 23 years’ experience in the ports and international banking sectors. Prior to joining DP World he held executive positions with ANZ Group, as Head of Corporate and Project Finance for South Asia, and Salalah Port Services in Oman, as Chief Financial Officer. He has also served as Non-Executive Director of Istithmar World PJSC and IDFC Securities. As Group Chief Financial Officer of DP World he has been instrumental in ensuring the success of a number of initiatives including the Group’s IPO in 2007. He is a qualified Chartered Accountant.
Mr. Parekh has an extensive and highly-commended executive career, including serving on the Boards of several Indian and international corporations. He has been a member of Indian Government-appointed advisory committees and task forces on matters ranging from infrastructure reform to capital markets and financial services. His contributions to business have been recognised on numerous occasions and he was the first international recipient of the Outstanding Achievement Award from the Institute of Chartered Accountants in England and Wales, in 2010.
Mrs. Kamali has over 25 years’ experience in information technology, IT governance, compliance and risk management.
She is currently the Chairperson and Managing Director of Dutech, a leading ICT company, this is in addition to her role as CEO of Customs World, a Ports Customs and Free Zone Corporation (PCFC) entity. She holds an MBA from American University of Sharjah and a BS degree from College of Engineering from Michigan State University.
Mr. Ghobash has over 30 years’ experience in the international finance and banking industry. He has served on various Boards in the region, including Etisalat, Borse Dubai, Nasdaq Dubai and Emaar. He holds a Bachelor’s degree from UAE University, Executive Management Program from Wharton Business School and banking diploma from Citibank NA in Athens, Greece.
Mr. Al Suwaidi has extensive experience working across a diverse range of industries, including agriculture, banking and construction. He holds a number of Executive and Non-Executive positions across the United Arab Emirates. Mr. Al Suwaidi holds a BSc in Business Administration from California Baptist University.
Following an extensive career in corporate finance, including as Partner in the corporate finance departments of KPMG in London and Frankfurt and senior positions at PwC Corporate Finance, Robert Fleming, Lazard Brothers and A.T. Kearney, Mr Russell joined the Shareholder Executive of the UK Government (now UK Government Investments) as head of its Corporate Finance Practice in 2004, and was subsequently appointed Deputy Chief Executive in 2008, and Chief Executive in 2013. He was also formerly a Non-Executive Director of Eurostar International Limited.
Mr. Woods has over 40 years’ experience in the shipping and port industry. He was formerly the Chief Executive of The Peninsular and Oriental Steam Navigation Company, and a Non-Executive Director of Cathay Pacific Airways, Tilbury Container Services Limited and John Swire & Sons. In 2012, he was appointed President of the Chartered Institute of Shipbrokers and he is an Honorary Captain of the Royal Naval Reserve.
Dat
e of
ap
poin
tmen
t Appointed to the Board as Chairman on 30 May 2007. Appointed to the Board as Group Chairman and Chief Executive Officer on 8 February 2016.
Served as Group Chief Financial Officer since 2005 and appointed to the Board as an Executive Director on 9 August 2006.
Appointed to the Board as an Independent Non-Executive Director on 22 March 2011.
Appointed to the Board as a Senior Independent Non-Executive Director on 1 July 2015.
Appointed to the Board as an Independent Non-Executive Director on 28 April 2016.
Appointed to the Board as an Independent Non-Executive Director on 28 April 2016.
Appointed to the Board as an Independent Non-Executive Director on 28 April 2016.
Appointed to the Board as an Independent Non-Executive Director on 11 August 2014.
Appointed to the Board as an Independent Non-Executive Director on 1 January 2014.
Exte
rnal
ap
poin
tmen
ts Member of the Dubai Executive Council, Member of the UAE Federal Tax Authority Board, Member of the Dubai Free Zones Council, Chairman of Ports, Customs and Free Zone Corporation (PCFC), Non-Executive Chairman of Virgin Hyperloop One.
Non-Executive Director on HDFC International Life and Re Company Limited.
Non-Executive Chairman of HDFC Ltd, GlaxoSmithkline Pharmaceuticals Ltd, Siemens India, BAE Systems India (Services) Pvt. Limited.Director of Vedanta Resources PLC, and the Indian Hotels Co Ltd.
Chief Executive Officer of Customs World FZE, Chairperson and Managing Director of Dutech.
Board member of the Dubai International Financial Centre (“DIFC”).
Director General of Abu Dhabi Fund for Development, Chairman of Al Ain Farms for Livestock Production, Vice Chairman of Arab Bank for Investment and Foreign Trade, Board member of First Abu Dhabi Bank, Raysut Cement (SAOG), UAE Red Crescent, Center of Food Security of Abu Dhabi, Al Jazira Sport & Cultural Club and Aghtia Group.
Chief Executive of UK Government Investments, Non-Executive Director of the Submarine Development Agency.
Director at the Chamber of Shipping of the United Kingdom, the Greenham Common Trust, and St. George’s House Trust (Windsor Castle), Chairman of the Navy League, Chairman of the Sea Cadet Association.
Com
mit
tee
mem
bers
hip
N R A N N A R A R N R
Committee Membership Key
A Audit CommitteeN Nominations and Governance CommitteeR Remuneration Committee
Indicates Committee Chair

DP World Annual Report and Accounts 2018 | 6362 | DP World Annual Report and Accounts 2018
Company Overview Corporate Governance Financial StatementsStrategic ReportC O R P O R AT E G O V E R N A N C E
The Directors present their report and accounts for the year ended 31 December 2018.
The Corporate Governance section, commencing on page 60, and the Audit Committee Report, commencing on page 75, form part of this Directors’ Report. Disclosures elsewhere in the Annual Report and Accounts are cross-referenced where appropriate. Taken together, they fulfil disclosure requirements as discussed in the Corporate Governance section, commencing on page 60.
The Strategic Report, commencing on page 4, describes the principal activities, operations, performance and financial position of DP World PLC (the “Company”) and its subsidiaries (collectively, the “Group”). The results of the Group are set out in detail in the Consolidated Financial Statements and accompanying notes, commencing on page 84.
The principal subsidiaries, joint ventures and associates are listed on pages 129 to 131.
DirectorsThe Directors of the Company as at 31 December 2018 are detailed on pages 60 to 61.
These pages contain their biographical details along with the details of their Board Committee memberships.
The Corporate Governance Report, which commences on page 60, includes details of the Board and Committee membership changes that occurred during the financial year ending 31 December 2018.
In accordance with the Company’s Articles of Association, all Directors offer themselves annually for re-election at the Annual General Meeting (“AGM”). The Corporate Governance section of this report contains details of the Directors’ remuneration and their interests in the Company’s shares, this information can be found on page 82.
Financial InstrumentsDetails regarding the use of financial instruments and financial risk management are included in the Notes to Consolidated Financial Statements commencing on page 94.
ResultsThe Group’s Consolidated Financial Statements for the year ending 31 December 2018 are shown on pages 89 to 93.
DividendThe Directors recommend a final dividend in respect of the year ended 31 December 2018 of 43.0 US cents per share, up from 41.0 US cents in the prior year. Subject to approval by shareholders, the dividend will be paid on 1 May 2019 to shareholders on the Register at close of business on 26 March 2019.
Events after the Reporting PeriodOn 13 January 2019, the Group entered into an agreement to acquire 71.3% stake in Puertos y Logistica S.A. (“Pulogsa”), Chile. Pulogsa is listed on the Santiago stock exchange, and the acquisition of the remaining outstanding shares of the business will be effected via a tender offer. The total consideration for 100% acquisition will be $502 million, subject to relevant third party consents and certain adjustments contained in the share purchase agreement. This transaction is expected to close in the first half of 2019.
On 23 January 2019, the Group announced the acquisition of additional controlling stake in DP World Australia (Holding) Pty Ltd (DP World Australia), valuing DP World Australia at an enterprise value of approximately $997 million (A$1.4 billion). The transaction is subject to regulatory approval and is expected to close in the first half of 2019.
R E P O R T O F T H E D I R E C T O R S
On 20 February 2019, the Group announced the acquisition of the holding company of P&O Ferries and P&O Ferrymasters for a purchase consideration of $421 million (£322 million). The transaction is subject to customary completion conditions and is expected to close in the first half of 2019.
(See note 35 to the Consolidated Financial Statements.)
SustainabilityThe Group is committed to integrating responsible business practices in all aspects of our operations. Further information regarding our approach to sustainability is contained in the Sustainability and Impact section of this report commencing on page 48. This section of the report outlines our commitment to invest in our people, protect our environment, ensure the highest safety standards and build a vibrant, secure and resilient society.
Board DiversityThe Company recognises and embraces the benefits of having a diverse Board, and seeks to increase diversity at Board level which it sees as an essential element in maintaining the Company’s competitive advantage. A Diversity Policy was developed for the Board, which recognises that a truly diverse board includes and makes good use of differences in the skills, regional and industry experience, background, race, gender and other qualities of Directors. These differences are considered in determining the optimum composition of the Board. The Board considered its diversity as part of the annual evaluation of the performance and effectiveness of the Board and Board Committees.
The Nominations and Governance Committee reviews and assesses Board composition on behalf of the Board and recommends the appointment of new Directors. In reviewing Board composition, the Nominations and Governance Committee considers the benefits of all aspects of diversity including, but not limited to, those described above, in order to maintain an appropriate range and balance of skills, experience and background on the Board. In identifying suitable candidates for appointment to the Board, the Nominations and Governance Committee considers candidates on merit against objective criteria and with due regard to the benefits of maintaining a balanced and diverse Board.
Substantial ShareholdingsAs at the date of this report, the Company has been notified that the following entity has an interest in the Company’s shares amounting to 5% or more.
Class SharesPercentage
of class
Port & Free Zone World FZE Ordinary 667,735,000 80.45%
Going ConcernThe Directors, having made enquiries, consider that the Company and the Group have adequate resources to continue in operational existence for the foreseeable future and therefore they consider it appropriate to adopt the going concern basis in preparing the accounts.
Further details can be found under note 2 to the Consolidated Financial Statements.
Audit InformationHaving made the required enquiries, so far as the Directors in office at the date of the signing of this report are aware, there is no relevant audit information of which the auditors are unaware and each Director has taken all reasonable steps to make themselves aware of any relevant audit information and to establish that the auditors are aware of that information.
Articles of AssociationThe Articles set out the internal regulation of the Company and cover such matters as the rights of shareholders, the appointment and removal of Directors and the conduct of the Board and general meetings. Subject to DIFC Companies Law and the Articles, the Directors may exercise all the powers of the Company and may delegate authorities to Committees and day-to-day management and decision making to individual Executive Directors. Details of the main Board Committees can be found on pages 75 to 79.
IndemnityAll Directors are entitled to indemnification from the Company, to the extent permitted by the law, against claims and legal expenses incurred in the course of their duties.
Authority to Purchase SharesAt the Company’s AGM on 26 April 2018, the Company was authorised to make market purchases of up to 29,050,000 ordinary shares (representing approximately 3.5% of the Company’s issued shares). No such purchases were made during 2018. Shareholders will be asked to approve the renewal of a similar authority at the Company’s AGM to be held on 25 April 2019. AuditorsThe auditors, KPMG LLP, have indicated their willingness to continue in office. A resolution to reappoint them as auditors will be proposed at the AGM to be held on 25 April 2019.
Share CapitalAs at 31 December 2018, the Company’s issued share capital was $1,660,000,000 comprising 830,000,000 ordinary shares of $2.00 each.
Annual General MeetingThis year the Company will conduct its second hybrid AGM, giving shareholders the opportunity to attend the AGM in person or participate online using a smartphone, tablet or computer. We believe that this continues to improve accessibility to the AGM process and makes it inclusive for all our shareholders, and we are proud that we were the first listed company in the UAE to offer online participation to our shareholders last year. The AGM shall be held on 25 April 2019 both online and at The Wheelhouse, Jebel Ali Port, Dubai, United Arab Emirates. Full details are set out in the Notice of AGM.
By order of the Board
M O H A M M A D A L H A S H I M YD E P U T Y G RO U P G E N E R A L CO U N S E L & CO M PA N Y S EC R E TA RY 21 M A RC H 2 019
Mohammad Al HashimyDeputy Group General Counsel & Company Secretary

DP World Annual Report and Accounts 2018 | 6564 | DP World Annual Report and Accounts 2018
Company Overview Corporate Governance Financial StatementsStrategic ReportC O R P O R AT E G O V E R N A N C E
“The implementation of good governance practices adds value to our performance, improves our strategic thinking, and allows us to run our business more effectively and better monitor the risks we face.”
Good governance and risk management are core to our business achieving its objectives. The DP World business model integrates best practice in these areas and is the blueprint to achieving our vision as a Group: to lead the future of world trade.
The implementation of good governance practices adds value to our performance, improves our strategic thinking, and allows us to run our business more effectively and better monitor the risks we face.
The Corporate Governance Report has been structured to align with the principles set out in the Corporate Governance Best Practice Standards as detailed in the Dubai Financial Services Authority (the “DFSA”) Markets Rules. It sets out the actions that we have taken in 2018 to implement these practices.
LeadershipA balanced Board with the necessary skills, knowledge and industry experience to lead our Group is key to achieving our strategic objectives and long term goals. Details of the role of the Board, the Directors’ responsibilities, the Board composition and activities during the year are
given in the Corporate Governance section on pages 66 to 71. The membership and work of the principal Board Committees are included on pages 75 to 79.
The Board remains committed to effectively leading the Company, ensuring that our business is managed prudently and soundly to drive sustained long term value for our shareholders. The balance of skills and expertise on our Board will allow us to continue creating value as we expand our horizons and lead the future of world trade.
AccountabilityOur Corporate Governance practices lay down the framework for creating long term trust between us and all our stakeholders — our shareholders, customers, employees, suppliers, governments and communities. We will continue to engage with our stakeholders and encourage effective dialogue with our shareholders.
As the Board, we are ultimately responsible for determining the Group’s risk appetite and its willingness to accept certain risks in pursuit of achieving the Group’s strategic objectives. The Board is also responsible for maintaining appropriate risk management and internal
control systems. During 2018, we continued to review the Group’s principal risks that could have material effects on our business, financial condition and reputation. The principal risks and our approach to managing them are discussed on pages 38 to 45 of the Strategic Report and an outline of our internal controls and compliance procedures is contained on pages 72 to 73 in this Corporate Governance section. We also report on the remuneration structures and their alignment with the long term interests of the Group on pages 80 to 81 in the Remuneration Committee Report.
We look forward to another prosperous year as we strive to be leaders in world trade by undertaking our business with the highest standards of good governance.
S U LTA N A H M E D B I N S U L AY E MG RO U P C H A I R M A N A N D C H I E F E X EC U T I V E O FFI C E R 21 M A RC H 2 019
C H A I R M A N ’ S I N T R O D U C T I O N
See page 78 for the Nominations and Governance Committee report
See page 75 for the Audit Committee report
To read more about our Board’s Leadership see page 66
See the Statement of Directors’ Responsibilities on page 83
To read more see our Remuneration Committee report on page 79
To read more about our internal controls and compliance framework see pages 72 to 73
To read more about our shareholder engagement, see page 74
See page 79 for the Remuneration Committee report
DP World PLC1 (the “Company”) is incorporated in the Dubai International Financial Centre (the “DIFC”) and was admitted in 2007 to the official list of securities on Nasdaq Dubai. The Company must therefore comply with the regulatory obligations of the DIFC Markets Law and the various rules made by the DFSA thereunder (together with DIFC Markets Law, the “Nasdaq Dubai Rules”). The Board reviewed and monitored the policies and procedures in place during the year to ensure compliance with the Corporate Governance principles of the Nasdaq Dubai Rules as briefly summarised below.
The Directors believe that these rules, including the mandatory Corporate Governance principles enshrined in them and the best practice standards which support the principles, provide a robust basis on which to maintain corporate governance best practice for the benefit of the Company’s shareholders.
Board Committees ReportsA separate section of a company’s Annual Report should, under the Nasdaq Dubai Rules, describe the work carried out by each of the Audit, the Remuneration and the Nominations and Governance committees in discharging their responsibilities.
Principle 1Requires an effective Board of Directors which is collectively accountable for ensuring that the Reporting Entity’s business is managed prudently and soundly.
Principle 2Requires a clear division between the responsibilities of the Board and senior management.
Principle3The Board and its committees must have an appropriate balance of knowledge, experience and adequate resources.
Principle 6The Board must ensure any reports present an accurate, balanced and understandable assessment of the Company’s financial position and prospects.
Principle 7The Board must ensure that the Company’s remuneration structures and strategies are well aligned with the long term interests of the Company.
Principle 4The Board must ensure that there is an adequate, effective, well defined and well integrated risk management, internal control and compliance framework.
Principle 5The Board must ensure that the rights of shareholders are properly safeguarded and that there is effective dialogue between the Board and the Company’s shareholders.
Leadership
Position and prospects
Remuneration
Accountability
O V E R V I E W
1 DP World Limited has been automatically converted to DP World PLC with effect from 12 November 2018, following the enactment of DIFC Law No. 5 of 2018
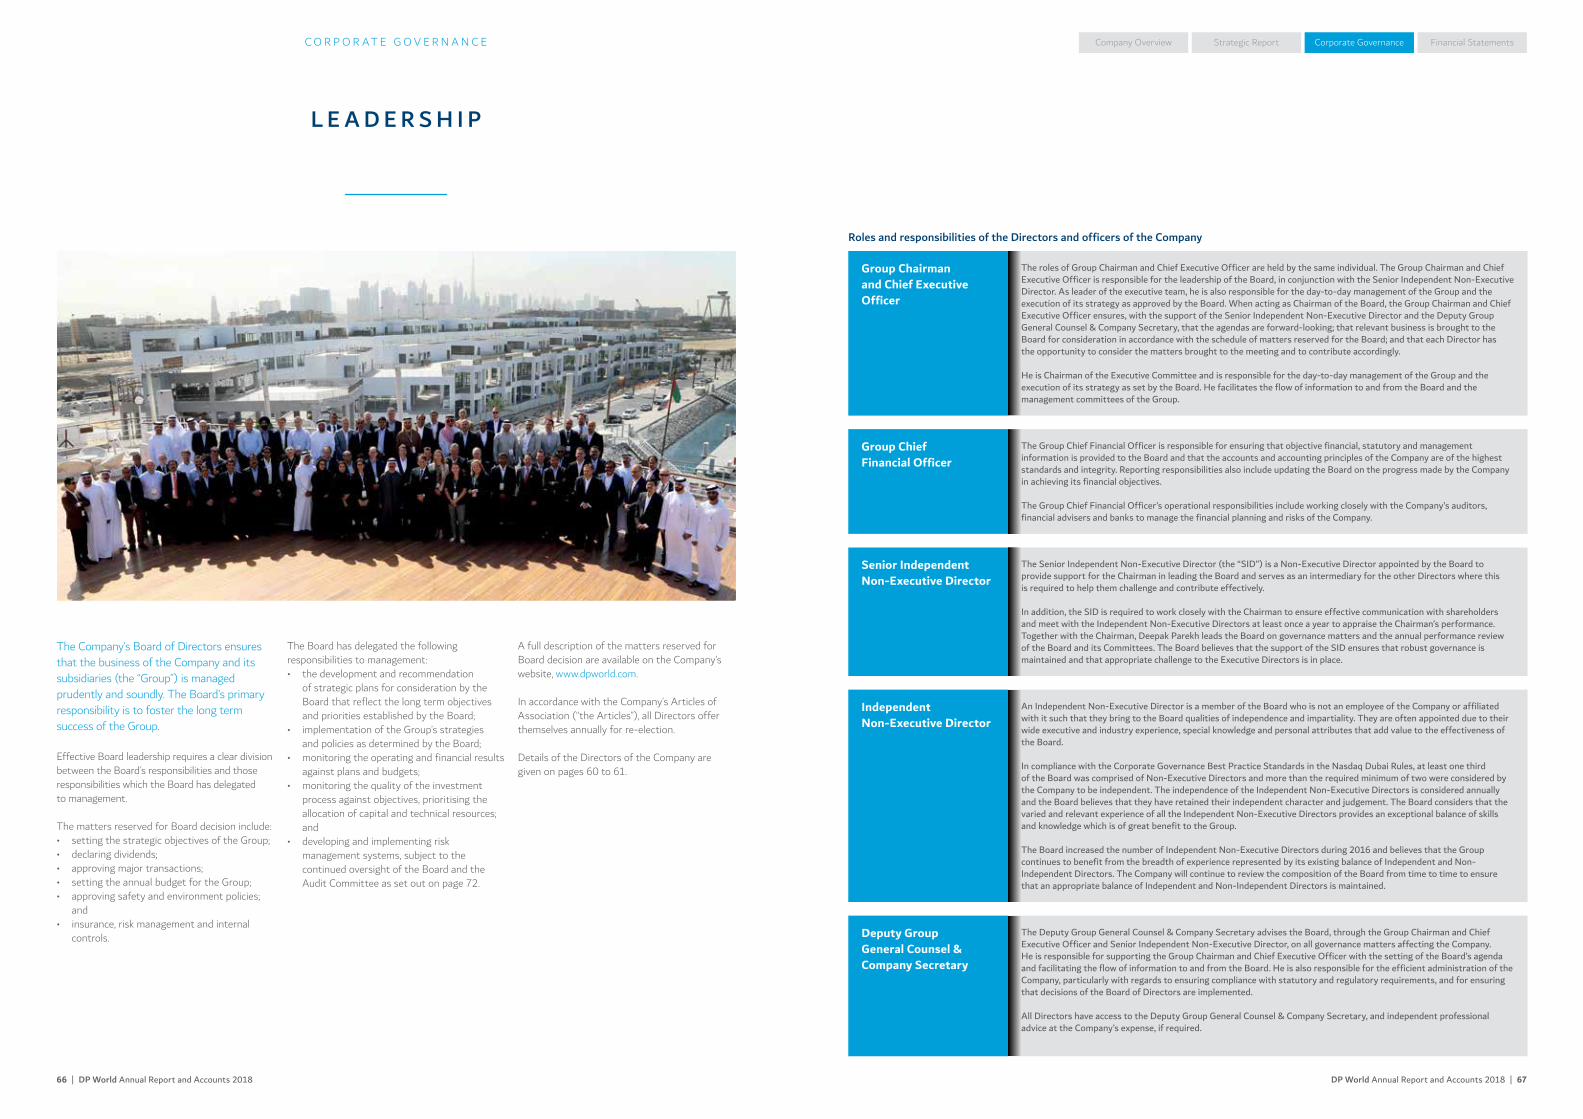
DP World Annual Report and Accounts 2018 | 6766 | DP World Annual Report and Accounts 2018
Company Overview Corporate Governance Financial StatementsStrategic Report
L E A D E R S H I P
The Company’s Board of Directors ensures that the business of the Company and its subsidiaries (the “Group”) is managed prudently and soundly. The Board’s primary responsibility is to foster the long term success of the Group.
Effective Board leadership requires a clear division between the Board’s responsibilities and those responsibilities which the Board has delegated to management.
The matters reserved for Board decision include:• setting the strategic objectives of the Group;• declaring dividends;• approving major transactions;• setting the annual budget for the Group;• approving safety and environment policies;
and• insurance, risk management and internal
controls.
The Board has delegated the following responsibilities to management:• the development and recommendation
of strategic plans for consideration by the Board that reflect the long term objectives and priorities established by the Board;
• implementation of the Group’s strategies and policies as determined by the Board;
• monitoring the operating and financial results against plans and budgets;
• monitoring the quality of the investment process against objectives, prioritising the allocation of capital and technical resources; and
• developing and implementing risk management systems, subject to the continued oversight of the Board and the Audit Committee as set out on page 72.
A full description of the matters reserved for Board decision are available on the Company’s website, www.dpworld.com.
In accordance with the Company’s Articles of Association (“the Articles”), all Directors offer themselves annually for re-election.
Details of the Directors of the Company are given on pages 60 to 61.
Roles and responsibilities of the Directors and officers of the Company
C O R P O R AT E G O V E R N A N C E
Group Chairman and Chief Executive Officer
The roles of Group Chairman and Chief Executive Officer are held by the same individual. The Group Chairman and Chief Executive Officer is responsible for the leadership of the Board, in conjunction with the Senior Independent Non-Executive Director. As leader of the executive team, he is also responsible for the day-to-day management of the Group and the execution of its strategy as approved by the Board. When acting as Chairman of the Board, the Group Chairman and Chief Executive Officer ensures, with the support of the Senior Independent Non-Executive Director and the Deputy Group General Counsel & Company Secretary, that the agendas are forward-looking; that relevant business is brought to the Board for consideration in accordance with the schedule of matters reserved for the Board; and that each Director has the opportunity to consider the matters brought to the meeting and to contribute accordingly.
He is Chairman of the Executive Committee and is responsible for the day-to-day management of the Group and the execution of its strategy as set by the Board. He facilitates the flow of information to and from the Board and the management committees of the Group.
Group Chief Financial Officer
The Group Chief Financial Officer is responsible for ensuring that objective financial, statutory and management information is provided to the Board and that the accounts and accounting principles of the Company are of the highest standards and integrity. Reporting responsibilities also include updating the Board on the progress made by the Company in achieving its financial objectives.
The Group Chief Financial Officer’s operational responsibilities include working closely with the Company’s auditors, financial advisers and banks to manage the financial planning and risks of the Company.
Senior Independent Non-Executive Director
The Senior Independent Non-Executive Director (the “SID”) is a Non-Executive Director appointed by the Board to provide support for the Chairman in leading the Board and serves as an intermediary for the other Directors where this is required to help them challenge and contribute effectively.
In addition, the SID is required to work closely with the Chairman to ensure effective communication with shareholders and meet with the Independent Non-Executive Directors at least once a year to appraise the Chairman’s performance. Together with the Chairman, Deepak Parekh leads the Board on governance matters and the annual performance review of the Board and its Committees. The Board believes that the support of the SID ensures that robust governance is maintained and that appropriate challenge to the Executive Directors is in place.
Independent Non-Executive Director
An Independent Non-Executive Director is a member of the Board who is not an employee of the Company or affiliated with it such that they bring to the Board qualities of independence and impartiality. They are often appointed due to their wide executive and industry experience, special knowledge and personal attributes that add value to the effectiveness of the Board.
In compliance with the Corporate Governance Best Practice Standards in the Nasdaq Dubai Rules, at least one third of the Board was comprised of Non-Executive Directors and more than the required minimum of two were considered by the Company to be independent. The independence of the Independent Non-Executive Directors is considered annually and the Board believes that they have retained their independent character and judgement. The Board considers that the varied and relevant experience of all the Independent Non-Executive Directors provides an exceptional balance of skills and knowledge which is of great benefit to the Group.
The Board increased the number of Independent Non-Executive Directors during 2016 and believes that the Group continues to benefit from the breadth of experience represented by its existing balance of Independent and Non-Independent Directors. The Company will continue to review the composition of the Board from time to time to ensure that an appropriate balance of Independent and Non-Independent Directors is maintained.
Deputy Group General Counsel & Company Secretary
The Deputy Group General Counsel & Company Secretary advises the Board, through the Group Chairman and Chief Executive Officer and Senior Independent Non-Executive Director, on all governance matters affecting the Company. He is responsible for supporting the Group Chairman and Chief Executive Officer with the setting of the Board’s agenda and facilitating the flow of information to and from the Board. He is also responsible for the efficient administration of the Company, particularly with regards to ensuring compliance with statutory and regulatory requirements, and for ensuring that decisions of the Board of Directors are implemented.
All Directors have access to the Deputy Group General Counsel & Company Secretary, and independent professional advice at the Company’s expense, if required.
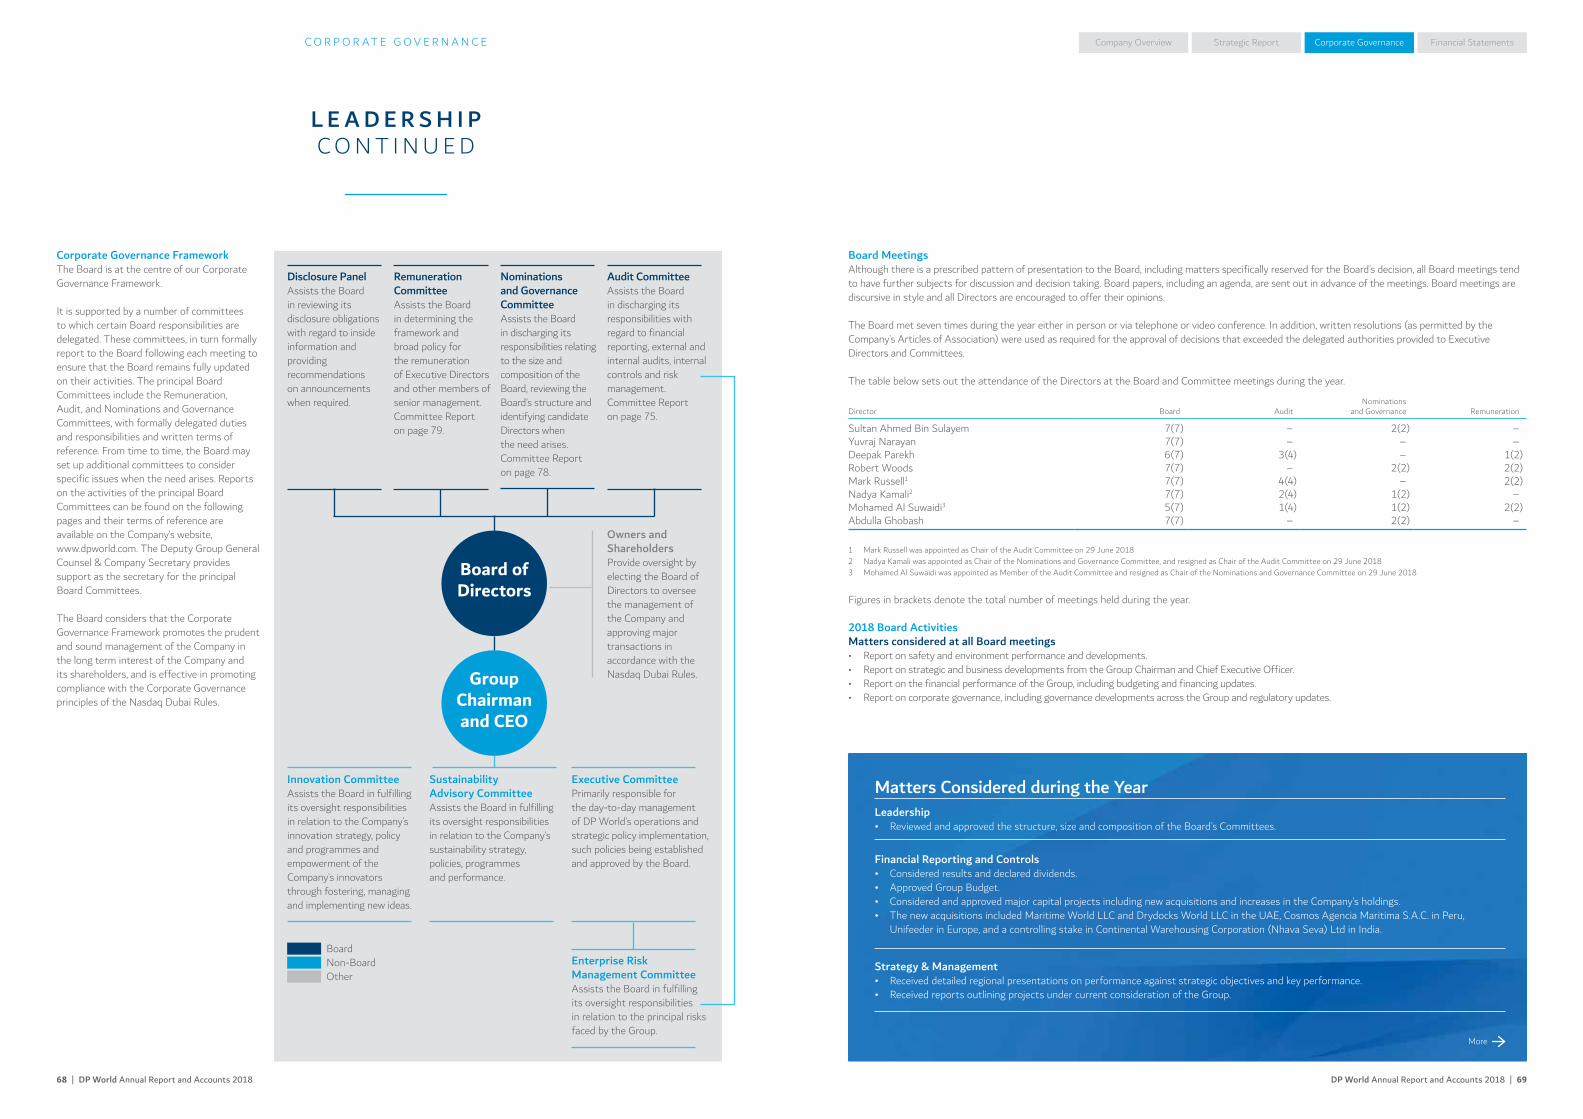
DP World Annual Report and Accounts 2018 | 6968 | DP World Annual Report and Accounts 2018
Company Overview Corporate Governance Financial StatementsStrategic Report
L E A D E R S H I P C O N T I N U E D
Corporate Governance FrameworkThe Board is at the centre of our Corporate Governance Framework.
It is supported by a number of committees to which certain Board responsibilities are delegated. These committees, in turn formally report to the Board following each meeting to ensure that the Board remains fully updated on their activities. The principal Board Committees include the Remuneration, Audit, and Nominations and Governance Committees, with formally delegated duties and responsibilities and written terms of reference. From time to time, the Board may set up additional committees to consider specific issues when the need arises. Reports on the activities of the principal Board Committees can be found on the following pages and their terms of reference are available on the Company’s website, www.dpworld.com. The Deputy Group General Counsel & Company Secretary provides support as the secretary for the principal Board Committees.
The Board considers that the Corporate Governance Framework promotes the prudent and sound management of the Company in the long term interest of the Company and its shareholders, and is effective in promoting compliance with the Corporate Governance principles of the Nasdaq Dubai Rules.
Disclosure PanelAssists the Board in reviewing its disclosure obligations with regard to inside information and providing recommendations on announcements when required.
Remuneration CommitteeAssists the Board in determining the framework and broad policy for the remuneration of Executive Directors and other members of senior management.Committee Report on page 79.
Nominations and Governance CommitteeAssists the Board in discharging its responsibilities relating to the size and composition of the Board, reviewing the Board’s structure and identifying candidate Directors when the need arises.Committee Report on page 78.
Audit CommitteeAssists the Board in discharging its responsibilities with regard to financial reporting, external and internal audits, internal controls and risk management.Committee Report on page 75.
Innovation CommitteeAssists the Board in fulfilling its oversight responsibilities in relation to the Company’s innovation strategy, policy and programmes and empowerment of the Company’s innovators through fostering, managing and implementing new ideas.
Sustainability Advisory CommitteeAssists the Board in fulfilling its oversight responsibilities in relation to the Company’s sustainability strategy, policies, programmes and performance.
Executive CommitteePrimarily responsible for the day-to-day management of DP World’s operations and strategic policy implementation, such policies being established and approved by the Board.
Enterprise Risk Management CommitteeAssists the Board in fulfilling its oversight responsibilities in relation to the principal risks faced by the Group.
Owners and ShareholdersProvide oversight by electing the Board of Directors to oversee the management of the Company and approving major transactions in accordance with the Nasdaq Dubai Rules.
Board Non-Board Other
Board MeetingsAlthough there is a prescribed pattern of presentation to the Board, including matters specifically reserved for the Board’s decision, all Board meetings tend to have further subjects for discussion and decision taking. Board papers, including an agenda, are sent out in advance of the meetings. Board meetings are discursive in style and all Directors are encouraged to offer their opinions.
The Board met seven times during the year either in person or via telephone or video conference. In addition, written resolutions (as permitted by the Company’s Articles of Association) were used as required for the approval of decisions that exceeded the delegated authorities provided to Executive Directors and Committees.
The table below sets out the attendance of the Directors at the Board and Committee meetings during the year.
Director Board AuditNominations
and Governance Remuneration
Sultan Ahmed Bin Sulayem 7(7) – 2(2) –Yuvraj Narayan 7(7) – – –Deepak Parekh 6(7) 3(4) – 1(2)Robert Woods 7(7) – 2(2) 2(2)Mark Russell1 7(7) 4(4) – 2(2)Nadya Kamali2 7(7) 2(4) 1(2) –Mohamed Al Suwaidi3 5(7) 1(4) 1(2) 2(2)Abdulla Ghobash 7(7) – 2(2) –
1 Mark Russell was appointed as Chair of the Audit Committee on 29 June 20182 Nadya Kamali was appointed as Chair of the Nominations and Governance Committee, and resigned as Chair of the Audit Committee on 29 June 20183 Mohamed Al Suwaidi was appointed as Member of the Audit Committee and resigned as Chair of the Nominations and Governance Committee on 29 June 2018
Figures in brackets denote the total number of meetings held during the year.
2018 Board ActivitiesMatters considered at all Board meetings• Report on safety and environment performance and developments.• Report on strategic and business developments from the Group Chairman and Chief Executive Officer.• Report on the financial performance of the Group, including budgeting and financing updates.• Report on corporate governance, including governance developments across the Group and regulatory updates.
Board of Directors
Group Chairman and CEO
C O R P O R AT E G O V E R N A N C E
Matters Considered during the YearLeadership• Reviewed and approved the structure, size and composition of the Board’s Committees.
Financial Reporting and Controls• Considered results and declared dividends.• Approved Group Budget.• Considered and approved major capital projects including new acquisitions and increases in the Company’s holdings.• The new acquisitions included Maritime World LLC and Drydocks World LLC in the UAE, Cosmos Agencia Maritima S.A.C. in Peru,
Unifeeder in Europe, and a controlling stake in Continental Warehousing Corporation (Nhava Seva) Ltd in India.
Strategy & Management• Received detailed regional presentations on performance against strategic objectives and key performance.• Received reports outlining projects under current consideration of the Group.
More

DP World Annual Report and Accounts 2018 | 7170 | DP World Annual Report and Accounts 2018
Company Overview Corporate Governance Financial StatementsStrategic Report
L E A D E R S H I P C O N T I N U E D
Board EvaluationThe Board undertakes a formal and rigorous annual evaluation of its own performance and that of its Committees and individual Directors. The evaluation of the Board and its Committees is a key component of effective corporate governance. It is a vital tool to ensure that the Board discharges its responsibilities effectively and assists in identifying possible ways for improving the performance of the Board.
For the financial year ended 31 December 2018, the Board evaluation was facilitated internally by the Deputy Group General Counsel & Company Secretary in accordance with the opposite process.
The evaluation process covered a wide range of issues including leadership, Board meeting dynamics, competency of Board members, succession planning, information quality and flow, relationship with senior management, quality of Board supervision and decision making with emphasis on the Board’s role in strategic decisions.
C O R P O R AT E G O V E R N A N C E
Matters Considered during the Year continuedRisk Management• Received the risk reviews, as considered by the Audit Committee.• Monitored the status of legal claims.• Received updates on insurance matters and approved the renewal of the Directors’ and Officers’ insurance.
Corporate Governance• Reviewed and re-affirmed the terms of reference of the Board Committees.• Approved a revised Modern Slavery and Human Trafficking Statement.
Shareholders• Reviewed and approved throughput announcements released during the year.• Reviewed and approved preliminary, full and half-year results announcements.• Approved the Company’s Annual Report and Accounts.• Received Annual General Meeting briefing, approved the notice and ancillary documents to be sent to shareholders
and attended the meeting.
Evaluation process
STEP 1SELF-EVALUATIONQuestionnaire completed by each Director to review Board and Committee performance.
STEP 3CONSOLIDATE AND REPORTDeputy Group General Counsel & Company Secretary consolidates responses and presents results to the Board for its consideration.
STEP 2INTERVIEW WITH SENIOR INDEPENDENT NON-EXECUTIVE DIRECTOR AND CHAIRMANIndividual meetings held with Chairman and Senior Independent Non-Executive Director to review responses.
STEP 4REVIEW AND PLANBoard reviews the evaluation results and prepares an action plan for the following year.
The Committee evaluations focused on the following areas:• Assessing the balance and skills within each Committee.• Identifying attributes required for any new appointments.• Reviewing practice and process to improve efficiency and effectiveness.• Considering the effectiveness of each Committee’s decision making processes.• Recognising each Committee’s outputs and achievements.
Tracking from previous evaluation and action for 2019As a result of the evaluation of the Board’s performance in December 2017 and the action plan that was subsequently developed, the Company reviewed the Board composition to ensure that it included the optimum balance of skills, experience and diversity and reviewed the succession planning and Board training programme.
The table below illustrates the findings from the December 2017 performance review, the actions taken by the Board and principal Committees during 2018, and the actions identified for 2019 as a result of the December 2018 performance review.
During the year, and as part of the Performance Evaluation Cycle, the composition of each of the Board’s main sub-committees was reviewed. A new Chair was appointed to the Audit Committee and the Nominations and Governance Committee. For further details about the membership and activities of each sub-Committee please refer to the Committees’ Report.
See page 75 for the Audit Committee report
See page 78 for the Nominations and Governance Committee report
See page 79 for the Remuneration Committee report
FINDINGS IN DECEMBER 2017
The following were identified during the review as areas for potential improvement:• Review the Board composition to ensure the Board has the optimum balance of skills, experience and diversity.• Review the Company’s succession planning and improve the Board’s interaction with members of
senior management.• Continue to focus on communication with institutional investors.
PROGRESS IN 2018
• Board members attended the Global Leadership Meeting in January 2018 and the location of Board meetings was rotated to give Board members the opportunity to visit DP World’s global operations and meet with local senior management.
• The Company has an ongoing commitment to open communications with institutional investors and shareholders – see the “Relations with shareholders” section starting on page 74.
ACTIONS FOR 2019
• Continue to optimise the Board’s exposure to and familiarity with senior management.• Enhance the succession planning and talent development to build a generation of future leaders and Directors.• Optimise the strategic and market review to gain further competitive advantage.
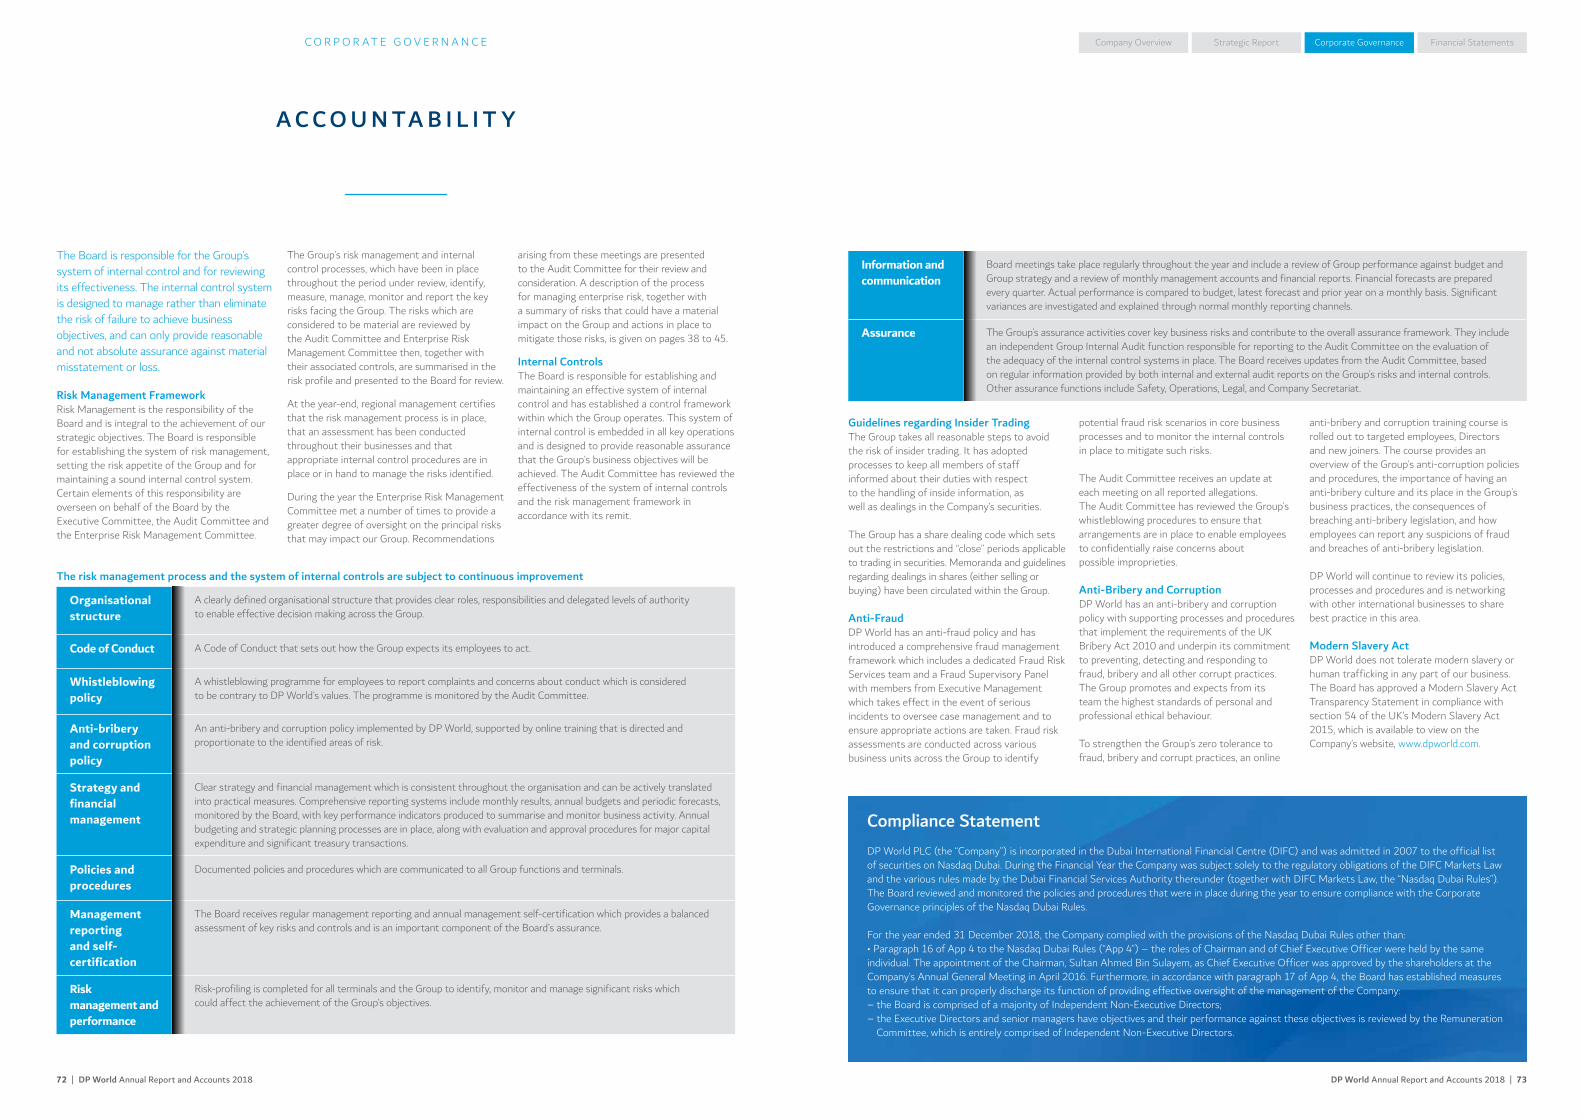
DP World Annual Report and Accounts 2018 | 7372 | DP World Annual Report and Accounts 2018
Company Overview Corporate Governance Financial StatementsStrategic Report
A C C O U N TA B I L I T Y
C O R P O R AT E G O V E R N A N C E
The Board is responsible for the Group’s system of internal control and for reviewing its effectiveness. The internal control system is designed to manage rather than eliminate the risk of failure to achieve business objectives, and can only provide reasonable and not absolute assurance against material misstatement or loss.
Risk Management FrameworkRisk Management is the responsibility of the Board and is integral to the achievement of our strategic objectives. The Board is responsible for establishing the system of risk management, setting the risk appetite of the Group and for maintaining a sound internal control system. Certain elements of this responsibility are overseen on behalf of the Board by the Executive Committee, the Audit Committee and the Enterprise Risk Management Committee.
The Group’s risk management and internal control processes, which have been in place throughout the period under review, identify, measure, manage, monitor and report the key risks facing the Group. The risks which are considered to be material are reviewed by the Audit Committee and Enterprise Risk Management Committee then, together with their associated controls, are summarised in the risk profile and presented to the Board for review.
At the year-end, regional management certifies that the risk management process is in place, that an assessment has been conducted throughout their businesses and that appropriate internal control procedures are in place or in hand to manage the risks identified.
During the year the Enterprise Risk Management Committee met a number of times to provide a greater degree of oversight on the principal risks that may impact our Group. Recommendations
arising from these meetings are presented to the Audit Committee for their review and consideration. A description of the process for managing enterprise risk, together with a summary of risks that could have a material impact on the Group and actions in place to mitigate those risks, is given on pages 38 to 45.
Internal ControlsThe Board is responsible for establishing and maintaining an effective system of internal control and has established a control framework within which the Group operates. This system of internal control is embedded in all key operations and is designed to provide reasonable assurance that the Group’s business objectives will be achieved. The Audit Committee has reviewed the effectiveness of the system of internal controls and the risk management framework in accordance with its remit.
Organisational structure
A clearly defined organisational structure that provides clear roles, responsibilities and delegated levels of authority to enable effective decision making across the Group.
Code of Conduct A Code of Conduct that sets out how the Group expects its employees to act.
Whistleblowing policy
A whistleblowing programme for employees to report complaints and concerns about conduct which is considered to be contrary to DP World’s values. The programme is monitored by the Audit Committee.
Anti-bribery and corruption policy
An anti-bribery and corruption policy implemented by DP World, supported by online training that is directed and proportionate to the identified areas of risk.
Strategy and financial management
Clear strategy and financial management which is consistent throughout the organisation and can be actively translated into practical measures. Comprehensive reporting systems include monthly results, annual budgets and periodic forecasts, monitored by the Board, with key performance indicators produced to summarise and monitor business activity. Annual budgeting and strategic planning processes are in place, along with evaluation and approval procedures for major capital expenditure and significant treasury transactions.
Policies and procedures
Documented policies and procedures which are communicated to all Group functions and terminals.
Management reporting and self-certification
The Board receives regular management reporting and annual management self-certification which provides a balanced assessment of key risks and controls and is an important component of the Board’s assurance.
Risk management and performance
Risk-profiling is completed for all terminals and the Group to identify, monitor and manage significant risks which could affect the achievement of the Group’s objectives.
The risk management process and the system of internal controls are subject to continuous improvement
Guidelines regarding Insider TradingThe Group takes all reasonable steps to avoid the risk of insider trading. It has adopted processes to keep all members of staff informed about their duties with respect to the handling of inside information, as well as dealings in the Company’s securities.
The Group has a share dealing code which sets out the restrictions and “close” periods applicable to trading in securities. Memoranda and guidelines regarding dealings in shares (either selling or buying) have been circulated within the Group.
Anti-FraudDP World has an anti-fraud policy and has introduced a comprehensive fraud management framework which includes a dedicated Fraud Risk Services team and a Fraud Supervisory Panel with members from Executive Management which takes effect in the event of serious incidents to oversee case management and to ensure appropriate actions are taken. Fraud risk assessments are conducted across various business units across the Group to identify
potential fraud risk scenarios in core business processes and to monitor the internal controls in place to mitigate such risks.
The Audit Committee receives an update at each meeting on all reported allegations. The Audit Committee has reviewed the Group’s whistleblowing procedures to ensure that arrangements are in place to enable employees to confidentially raise concerns about possible improprieties.
Anti-Bribery and CorruptionDP World has an anti-bribery and corruption policy with supporting processes and procedures that implement the requirements of the UK Bribery Act 2010 and underpin its commitment to preventing, detecting and responding to fraud, bribery and all other corrupt practices. The Group promotes and expects from its team the highest standards of personal and professional ethical behaviour. To strengthen the Group’s zero tolerance to fraud, bribery and corrupt practices, an online
anti-bribery and corruption training course is rolled out to targeted employees, Directors and new joiners. The course provides an overview of the Group’s anti-corruption policies and procedures, the importance of having an anti-bribery culture and its place in the Group’s business practices, the consequences of breaching anti-bribery legislation, and how employees can report any suspicions of fraud and breaches of anti-bribery legislation.
DP World will continue to review its policies, processes and procedures and is networking with other international businesses to share best practice in this area.
Modern Slavery ActDP World does not tolerate modern slavery or human trafficking in any part of our business. The Board has approved a Modern Slavery Act Transparency Statement in compliance with section 54 of the UK’s Modern Slavery Act 2015, which is available to view on the Company’s website, www.dpworld.com.
Information and communication
Board meetings take place regularly throughout the year and include a review of Group performance against budget and Group strategy and a review of monthly management accounts and financial reports. Financial forecasts are prepared every quarter. Actual performance is compared to budget, latest forecast and prior year on a monthly basis. Significant variances are investigated and explained through normal monthly reporting channels.
Assurance The Group’s assurance activities cover key business risks and contribute to the overall assurance framework. They include an independent Group Internal Audit function responsible for reporting to the Audit Committee on the evaluation of the adequacy of the internal control systems in place. The Board receives updates from the Audit Committee, based on regular information provided by both internal and external audit reports on the Group’s risks and internal controls. Other assurance functions include Safety, Operations, Legal, and Company Secretariat.
Compliance StatementDP World PLC (the “Company”) is incorporated in the Dubai International Financial Centre (DIFC) and was admitted in 2007 to the official list of securities on Nasdaq Dubai. During the Financial Year the Company was subject solely to the regulatory obligations of the DIFC Markets Law and the various rules made by the Dubai Financial Services Authority thereunder (together with DIFC Markets Law, the “Nasdaq Dubai Rules”). The Board reviewed and monitored the policies and procedures that were in place during the year to ensure compliance with the Corporate Governance principles of the Nasdaq Dubai Rules.
For the year ended 31 December 2018, the Company complied with the provisions of the Nasdaq Dubai Rules other than: • Paragraph 16 of App 4 to the Nasdaq Dubai Rules (“App 4”) – the roles of Chairman and of Chief Executive Officer were held by the same individual. The appointment of the Chairman, Sultan Ahmed Bin Sulayem, as Chief Executive Officer was approved by the shareholders at the Company’s Annual General Meeting in April 2016. Furthermore, in accordance with paragraph 17 of App 4, the Board has established measures to ensure that it can properly discharge its function of providing effective oversight of the management of the Company: – the Board is comprised of a majority of Independent Non-Executive Directors; – the Executive Directors and senior managers have objectives and their performance against these objectives is reviewed by the Remuneration
Committee, which is entirely comprised of Independent Non-Executive Directors.
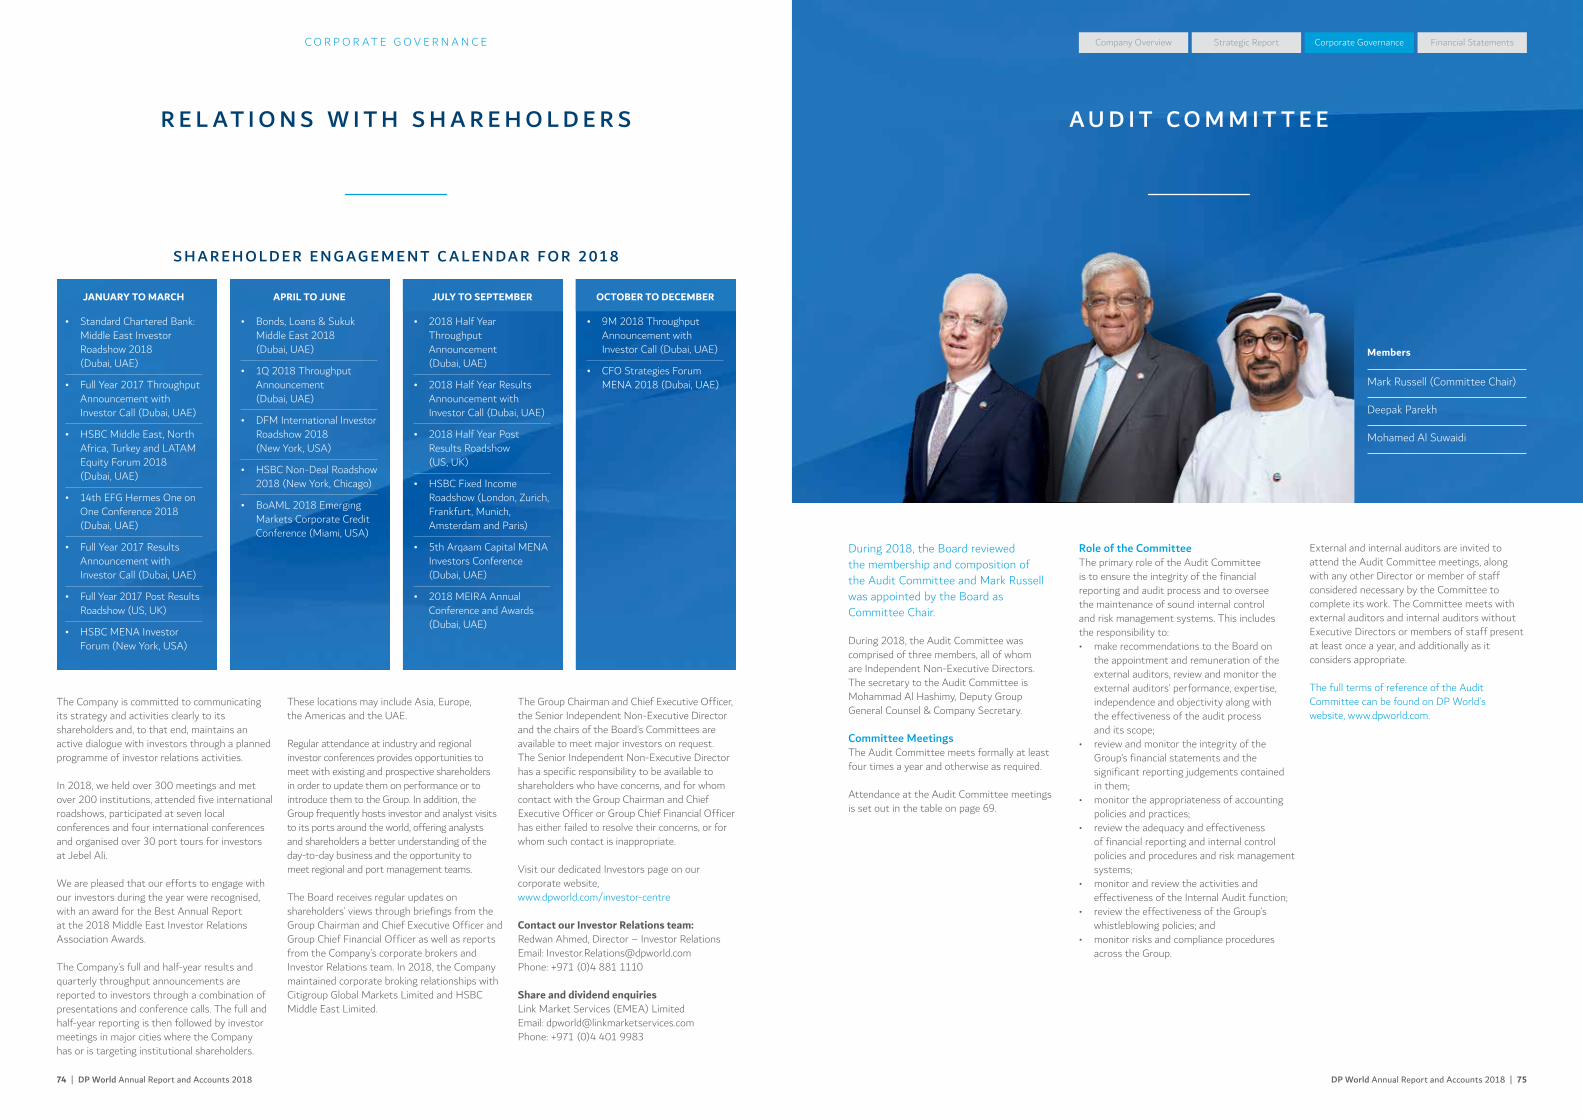
DP World Annual Report and Accounts 2018 | 7574 | DP World Annual Report and Accounts 2018
Company Overview Corporate Governance Financial StatementsStrategic Report
R E L AT I O N S W I T H S H A R E H O L D E R S
S H A R E H O L D E R E N G AG E M E N T C A L E N DA R F O R 2 01 8
The Company is committed to communicating its strategy and activities clearly to its shareholders and, to that end, maintains an active dialogue with investors through a planned programme of investor relations activities.
In 2018, we held over 300 meetings and met over 200 institutions, attended five international roadshows, participated at seven local conferences and four international conferences and organised over 30 port tours for investors at Jebel Ali.
We are pleased that our efforts to engage with our investors during the year were recognised, with an award for the Best Annual Report at the 2018 Middle East Investor Relations Association Awards.
The Company’s full and half-year results and quarterly throughput announcements are reported to investors through a combination of presentations and conference calls. The full and half-year reporting is then followed by investor meetings in major cities where the Company has or is targeting institutional shareholders.
These locations may include Asia, Europe, the Americas and the UAE.
Regular attendance at industry and regional investor conferences provides opportunities to meet with existing and prospective shareholders in order to update them on performance or to introduce them to the Group. In addition, the Group frequently hosts investor and analyst visits to its ports around the world, offering analysts and shareholders a better understanding of the day-to-day business and the opportunity to meet regional and port management teams.
The Board receives regular updates on shareholders’ views through briefings from the Group Chairman and Chief Executive Officer and Group Chief Financial Officer as well as reports from the Company’s corporate brokers and Investor Relations team. In 2018, the Company maintained corporate broking relationships with Citigroup Global Markets Limited and HSBC Middle East Limited.
The Group Chairman and Chief Executive Officer, the Senior Independent Non-Executive Director and the chairs of the Board’s Committees are available to meet major investors on request. The Senior Independent Non-Executive Director has a specific responsibility to be available to shareholders who have concerns, and for whom contact with the Group Chairman and Chief Executive Officer or Group Chief Financial Officer has either failed to resolve their concerns, or for whom such contact is inappropriate.
Visit our dedicated Investors page on our corporate website, www.dpworld.com/investor-centre
Contact our Investor Relations team: Redwan Ahmed, Director – Investor Relations Email: [email protected] Phone: +971 (0)4 881 1110
Share and dividend enquiriesLink Market Services (EMEA) Limited Email: [email protected] Phone: +971 (0)4 401 9983
JANUARY TO MARCH
• Standard Chartered Bank: Middle East Investor Roadshow 2018 (Dubai, UAE)
• Full Year 2017 Throughput Announcement with Investor Call (Dubai, UAE)
• HSBC Middle East, North Africa, Turkey and LATAM Equity Forum 2018 (Dubai, UAE)
• 14th EFG Hermes One on One Conference 2018 (Dubai, UAE)
• Full Year 2017 Results Announcement with Investor Call (Dubai, UAE)
• Full Year 2017 Post Results Roadshow (US, UK)
• HSBC MENA Investor Forum (New York, USA)
APRIL TO JUNE
• Bonds, Loans & Sukuk Middle East 2018 (Dubai, UAE)
• 1Q 2018 Throughput Announcement (Dubai, UAE)
• DFM International Investor Roadshow 2018 (New York, USA)
• HSBC Non-Deal Roadshow 2018 (New York, Chicago)
• BoAML 2018 Emerging Markets Corporate Credit Conference (Miami, USA)
JULY TO SEPTEMBER
• 2018 Half Year Throughput Announcement (Dubai, UAE)
• 2018 Half Year Results Announcement with Investor Call (Dubai, UAE)
• 2018 Half Year Post Results Roadshow (US, UK)
• HSBC Fixed Income Roadshow (London, Zurich, Frankfurt, Munich, Amsterdam and Paris)
• 5th Arqaam Capital MENA Investors Conference (Dubai, UAE)
• 2018 MEIRA Annual Conference and Awards (Dubai, UAE)
OCTOBER TO DECEMBER
• 9M 2018 Throughput Announcement with Investor Call (Dubai, UAE)
• CFO Strategies Forum MENA 2018 (Dubai, UAE)
During 2018, the Board reviewed the membership and composition of the Audit Committee and Mark Russell was appointed by the Board as Committee Chair.
During 2018, the Audit Committee was comprised of three members, all of whom are Independent Non-Executive Directors. The secretary to the Audit Committee is Mohammad Al Hashimy, Deputy Group General Counsel & Company Secretary.
Committee MeetingsThe Audit Committee meets formally at least four times a year and otherwise as required.
Attendance at the Audit Committee meetings is set out in the table on page 69.
Role of the CommitteeThe primary role of the Audit Committee is to ensure the integrity of the financial reporting and audit process and to oversee the maintenance of sound internal control and risk management systems. This includes the responsibility to:• make recommendations to the Board on
the appointment and remuneration of the external auditors, review and monitor the external auditors’ performance, expertise, independence and objectivity along with the effectiveness of the audit process and its scope;
• review and monitor the integrity of the Group’s financial statements and the significant reporting judgements contained in them;
• monitor the appropriateness of accounting policies and practices;
• review the adequacy and effectiveness of financial reporting and internal control policies and procedures and risk management systems;
• monitor and review the activities and effectiveness of the Internal Audit function;
• review the effectiveness of the Group’s whistleblowing policies; and
• monitor risks and compliance procedures across the Group.
External and internal auditors are invited to attend the Audit Committee meetings, along with any other Director or member of staff considered necessary by the Committee to complete its work. The Committee meets with external auditors and internal auditors without Executive Directors or members of staff present at least once a year, and additionally as it considers appropriate.
The full terms of reference of the Audit Committee can be found on DP World’s website, www.dpworld.com.
A U D I T C O M M I T T E E
Members
Mark Russell (Committee Chair)
Deepak Parekh
Mohamed Al Suwaidi
Chairman’s Introduction
C O R P O R AT E G O V E R N A N C E
DP World Annual Report and Accounts 2018 | 7776 | DP World Annual Report and Accounts 2018
Company Overview Corporate Governance Financial StatementsStrategic Report
A U D I T C O M M I T T E E C O N T I N U E D
Significant IssuesWe identified the issues below as significant in the context of the 2018 financial statements. We consider these areas to be significant, taking into account the level of materiality and the degree of judgement exercised by management. We debated the issues in detail to ensure that the approaches taken were appropriate.
IMPAIRMENT TESTING (SEE NOTE 16 TO THE FINANCIAL STATEMENTS)
Area of focusAn impairment review is carried out annually by management to identify cash generating units (CGU – operating port or group of ports) in which the recoverable amount of the CGU is less than the value of the assets carried in the Group’s accounts. Impairment results in a charge to the Group income statement.
Key judgements and assumptions need to be made when valuing the assets of the cash generating units and the quantum of potential future cash flows arising from those assets.
Committee actionWe considered the significant judgements, assumptions and estimates made by management in preparing the impairment review to ensure that they were appropriate. In particular, the cash flow projections, budgeted margins, discount rates, inflation, perpetuity growth rates and sensitivity analysis were reviewed. We obtained the external auditors’ view in relation to the appropriateness of the approach and outcome of the review. Taking this into account, together with the documentation presented and the explanations given by management, we were satisfied with the thoroughness of the approach and judgements taken. The review did not result in any impairment during the year.
ACQUISITION ACCOUNTING
Area of focusDuring the year, the Group acquired the following entities which are consolidated in the Group’s financial statements:
• 100% stake in Maritime World LLC, the sole owner of Dubai Maritime City (DMC), a world-class maritime service facility and industrial business zone located in Dubai.
• 100% of Drydocks World LLC, Dubai, a market leader in the ship repair business with the largest ship repair yard in the Middle East with specialist capabilities in niche ship new builds and conversions.
• 100% of Cosmos Agencia Maritima S.A.C., a fully integrated logistics services provider in Peru.
• A controlling stake in Continental Warehousing Corporation (Nhava Seva) Ltd, an integrated multimodal logistics player in India.
• 100% of Unifeeder, the largest container feeder and growing shortsea network operator in Europe.
Acquisition accounting involves estimating the fair value of assets and liabilities acquired on the date of acquisition, including the identification and valuation of intangible assets and goodwill. Significant judgement is involved in relation to the assumptions used in the valuation and purchase price allocation process.
Committee actionWe considered the significant judgements made by management in concluding the classification of Continental Warehousing Corporation (Nhava Seva) Ltd as a subsidiary of the Group. We reviewed management’s assumptions in relation to the valuation and allocation of purchase price on the above acquisitions, based on valuation reports and were satisfied with the assumptions, judgements and conclusions reached.
CONTINGENCIES (SEE NOTE 34 TO THE FINANCIAL STATEMENTS)
Area of focusThere are various factors that could result in a contingent liability being disclosed if the probability of any outflow in settlement is not remote. The assessment of the outcome and financial effect is based upon management’s best knowledge and judgement of current facts as at the reporting date.
Committee actionWe focused on the potential liabilities arising from litigation claims. To determine whether the level of provisioning in the balance sheet or disclosure in the financial statements was appropriate, we considered inputs from the Group’s legal counsel and external lawyers. We obtained external auditors’ comments on this area and concluded that the approach taken in respect of provisioning and disclosure continued to be appropriate.
TAX PROVISION
Area of focusThe Group is subject to income taxes in numerous jurisdictions. Significant judgement is required in determining the worldwide provision for income taxes.
Committee actionWe reviewed the updates from the Tax Director and reports from the external auditors and tax consultants. We considered the appropriateness of tax provisions in relation to the updates and reports received and concluded that the treatment adopted was fair and reasonable.
POST-EMPLOYMENT OBLIGATIONS (PENSIONS)
Area of focusDetermining the current value of the Group’s future pension obligations requires a number of assumptions. These assumptions relate principally to life expectancy, discount rates applied to future cash flows and rates of inflation and future salary increases.
Committee actionValuation assumptions, prepared by external actuaries and adopted by management, were considered in light of prevailing economic indicators and the view of the external auditors. These were accepted as appropriate.
Financial ReportingThe Audit Committee reviewed the annual update to the Group’s Accounting Policies. The significant accounting judgements and policies adopted in respect of the Group’s financial statements were agreed and considered appropriate. The appropriateness of the transactions separately identified as Separately Disclosed Items (“SDI”) in the financial statements in order to highlight the underlying performance for the period were discussed and approved. The Committee also reviewed external auditors’ reports and documentation prepared to support the going concern judgement.
Internal AuditThe scope of activity of internal audit is monitored and reviewed at each Audit Committee meeting.An annual plan was agreed by the Audit Committee in December 2017 which covers the activities during the year ended 31 December 2018.
During the year, the SVP Group Internal Audit (or delegate) attended each Audit Committee meeting and provided the Committee with a detailed report on Internal Audit activities which the Committee reviewed and discussed in detail. The Audit Committee considered the matters raised and the adequacy of management’s response to them, including the time taken to resolve any such matters.
The Audit Committee discussed and reviewed the SVP Group Internal Audit’s plans for continuing to improve the effectiveness of the function including enhancing our data analytics assurance, further focus on information security assessments, a slight increase in headcount for more effective audit coverage and training and development programmes. This included a global guest auditor programme which invited talent from within the Group to join the Internal Audit team on assignments to promote mutual exchange of experience and ideas across the business.
Based on its ongoing review, the Committee was satisfied with the effectiveness of the Group’s Internal Audit function.
Risk ManagementThe Enterprise Risk Management Framework is designed to identify, measure, manage, monitor and report the principal risks to the Group in achieving its business objectives and is embedded throughout the Group.
During 2018, we continued to monitor and review the principal risks relating to the Group’s business
performance that could materially affect our business, financial performance and reputation. A summary of our principal risks can be found on pages 40 to 45. The principle committees that oversee risk management are the Enterprise Risk Management Committee and the Audit Committee. The Audit Committee works closely with the Enterprise Risk Committee and is responsible for assisting the Board in its oversight of risk and risk management across the Group.
Risk management reports, prepared by the Group Head of Enterprise Risk Management, were submitted to the Audit Committee in March 2018, August 2018 and December 2018. These reports summarise submissions from all areas of the Group and were also reviewed by the Enterprise Risk Management Committee and senior management. The reports highlight the risk mitigation strategies that are employed to reduce potential risk exposure to the acceptable risk tolerance levels.
In December 2018, the Audit Committee reviewed the effectiveness of the Group’s overall Enterprise Risk Management (“ERM”) Policy and Framework, including the Group-wide approach to the identification, assessment, mitigation, monitoring and reporting of risks for the year ended 31 December 2018.
Internal ControlsDuring the year, the Audit Committee monitored and reviewed the effectiveness of the Group’s internal control systems, accounting policies and practices, standards of risk management and risk management procedures and compliance controls, as well as the Company’s statements on internal controls, before they were agreed by the Board for this Annual Report.
The Group’s internal control systems are designed to manage rather than eliminate business risk. They provide reasonable but not absolute assurance against material misstatement or loss. Such systems are necessary to safeguard shareholders’ investment and the Company’s assets and depend on regular evaluation of the extent of the risks to which the Company is exposed.
The Audit Committee can confirm that the Company’s systems and their effectiveness have been in place for the full financial year and up to the date on which the financial statements were approved, and are regularly reviewed by the Board. The Audit Committee is of the view that the Company has a well designed system of internal control. The Chairperson of the Audit
Committee reports any matters arising from the Audit Committee’s review to the Board following each meeting. This update covers the way in which the risk management and internal control processes are applied and on any breakdowns in, or exceptions to, these processes. There were no significant failings or weaknesses identified. These processes have been in place throughout the year ended 31 December 2018 and have continued to the date of this report.
Whistleblowing and FraudDP World’s Whistleblowing policy, which supports the Group-wide Code of Conduct, is monitored by the Audit Committee. A copy of the Group’s Code of Conduct is available on DP World’s website www.dpworld.com.
The Audit Committee received reports at each Audit Committee meeting providing details of matters reported through the Group’s international confidential whistleblowing reporting mechanism (telephone, email, web application) which is operated on its behalf by an independent third party. All matters reported are investigated by DP World’s Fraud Risk Services team and, where appropriate, reported to the Committee, together with details of any corrective action taken. The Committee also received reports at each meeting providing details of fraud losses in each quarter.
External AuditThroughout the year, the Audit Committee monitored the cost and nature of non-audit work undertaken by the auditors and was in a position to take action if it believed that there was a threat to the auditors’ independence through the award of this work.
KPMG LLP are the Company’s external auditors. The Audit Committee’s Chairperson meets the lead audit partner before each meeting and the whole Audit Committee meets with KPMG in private at least once a year.
The Audit Committee has undertaken an annual review of the independence and objectivity of the auditors and an assessment of the effectiveness of the audit process, which included a report from the external auditors of their own internal quality procedures. It also received assurances from the auditors regarding their independence. On the basis of this review, the Audit Committee recommended to the Board that it recommends to the shareholders that they support the re-appointment of the auditors at the AGM on 25 April 2019.
C O R P O R AT E G O V E R N A N C E
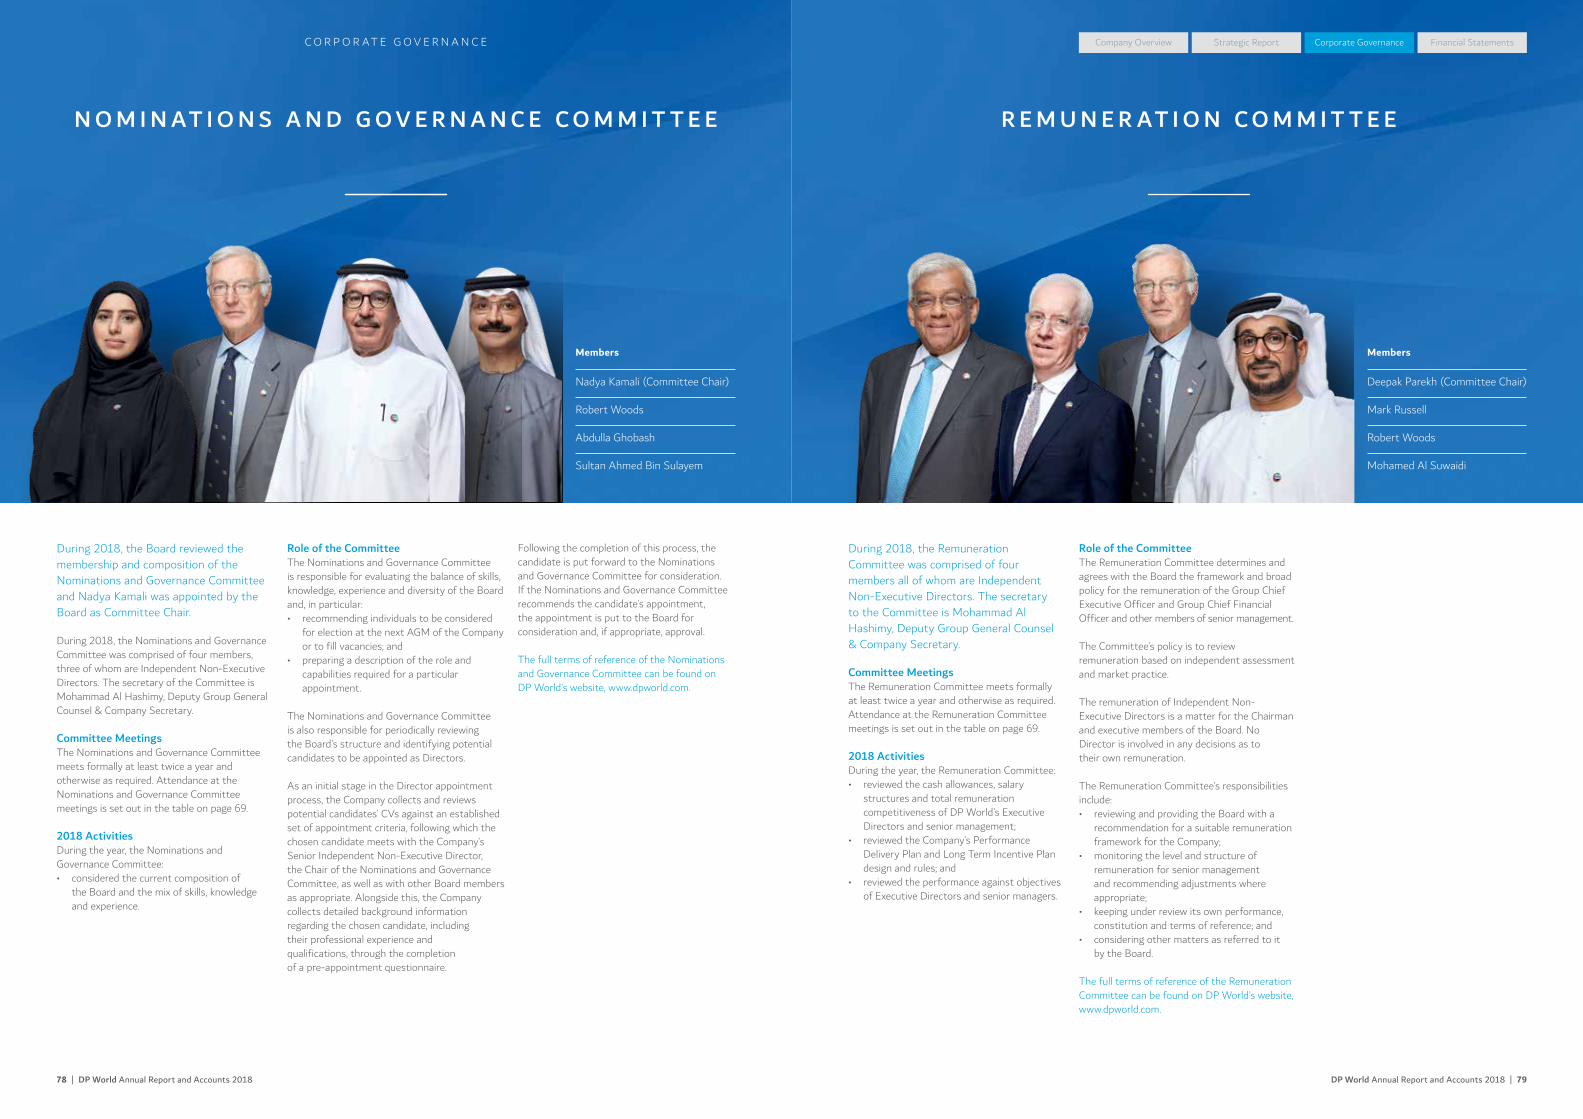
C O R P O R AT E G O V E R N A N C E
DP World Annual Report and Accounts 2018 | 7978 | DP World Annual Report and Accounts 2018
Company Overview Corporate Governance Financial StatementsStrategic Report
N O M I N AT I O N S A N D G O V E R N A N C E C O M M I T T E E
During 2018, the Board reviewed the membership and composition of the Nominations and Governance Committee and Nadya Kamali was appointed by the Board as Committee Chair.
During 2018, the Nominations and Governance Committee was comprised of four members, three of whom are Independent Non-Executive Directors. The secretary of the Committee is Mohammad Al Hashimy, Deputy Group General Counsel & Company Secretary.
Committee MeetingsThe Nominations and Governance Committee meets formally at least twice a year and otherwise as required. Attendance at the Nominations and Governance Committee meetings is set out in the table on page 69.
2018 ActivitiesDuring the year, the Nominations and Governance Committee:• considered the current composition of
the Board and the mix of skills, knowledge and experience.
Role of the CommitteeThe Nominations and Governance Committee is responsible for evaluating the balance of skills, knowledge, experience and diversity of the Board and, in particular:• recommending individuals to be considered
for election at the next AGM of the Company or to fill vacancies; and
• preparing a description of the role and capabilities required for a particular appointment.
The Nominations and Governance Committee is also responsible for periodically reviewing the Board’s structure and identifying potential candidates to be appointed as Directors.
As an initial stage in the Director appointment process, the Company collects and reviews potential candidates’ CVs against an established set of appointment criteria, following which the chosen candidate meets with the Company’s Senior Independent Non-Executive Director, the Chair of the Nominations and Governance Committee, as well as with other Board members as appropriate. Alongside this, the Company collects detailed background information regarding the chosen candidate, including their professional experience and qualifications, through the completion of a pre-appointment questionnaire.
Following the completion of this process, the candidate is put forward to the Nominations and Governance Committee for consideration. If the Nominations and Governance Committee recommends the candidate’s appointment, the appointment is put to the Board for consideration and, if appropriate, approval.
The full terms of reference of the Nominations and Governance Committee can be found on DP World’s website, www.dpworld.com.
During 2018, the Remuneration Committee was comprised of four members all of whom are Independent Non-Executive Directors. The secretary to the Committee is Mohammad Al Hashimy, Deputy Group General Counsel & Company Secretary.
Committee MeetingsThe Remuneration Committee meets formally at least twice a year and otherwise as required. Attendance at the Remuneration Committee meetings is set out in the table on page 69.
2018 ActivitiesDuring the year, the Remuneration Committee:• reviewed the cash allowances, salary
structures and total remuneration competitiveness of DP World’s Executive Directors and senior management;
• reviewed the Company’s Performance Delivery Plan and Long Term Incentive Plan design and rules; and
• reviewed the performance against objectives of Executive Directors and senior managers.
Role of the CommitteeThe Remuneration Committee determines and agrees with the Board the framework and broad policy for the remuneration of the Group Chief Executive Officer and Group Chief Financial Officer and other members of senior management.
The Committee’s policy is to review remuneration based on independent assessment and market practice.
The remuneration of Independent Non-Executive Directors is a matter for the Chairman and executive members of the Board. No Director is involved in any decisions as to their own remuneration.
The Remuneration Committee’s responsibilities include:• reviewing and providing the Board with a
recommendation for a suitable remuneration framework for the Company;
• monitoring the level and structure of remuneration for senior management and recommending adjustments where appropriate;
• keeping under review its own performance, constitution and terms of reference; and
• considering other matters as referred to it by the Board.
The full terms of reference of the Remuneration Committee can be found on DP World’s website, www.dpworld.com.
R E M U N E R AT I O N C O M M I T T E E
Members
Deepak Parekh (Committee Chair) Mark Russell
Robert Woods
Mohamed Al Suwaidi
Members
Nadya Kamali (Committee Chair) Robert Woods
Abdulla Ghobash
Sultan Ahmed Bin Sulayem
DP World Annual Report and Accounts 2018 | 8180 | DP World Annual Report and Accounts 2018
Company Overview Corporate Governance Financial StatementsStrategic Report
R E M U N E R AT I O N
Executive Reward PolicyThe reward policy for Executive Directors and senior management (Executive Committee and other experienced managers) is guided by the following key principles:• business strategy support: aligned with our
business strategy with focus on both short term goals and the creation of long term value ensuring alignment to shareholders’ interests;
• competitive pay: ensures competitiveness against our target market;
• fair pay: ensures consistent, equitable and fair treatment within the organisation; and
• performance-related pay: linked to performance targets via short and long term incentive plans and the pay review process.
The reward policy for Executive Directors and senior management consists of the following key components:
1. Market benchmark:• the target market position is between median
and upper quartile on a total remuneration basis;
• for Executive Directors and senior management based in Dubai, practice and policy reflect the structure of the Dubai pay market, whilst at the same time ensuring competitiveness on an international basis. Variable pay is also reviewed and balanced against the total remuneration package; and
• DP World engages the services of Korn Ferry Hay Group as the main provider of market information and as advisers on particular remuneration matters. This is subject to periodic review.
2. Base salary:• fixed cash compensation based on level
of responsibility as determined by applying a formal job evaluation methodology;
• reflects local practice in each of the geographies in which DP World operates, but is also set against common market policy positions; and
• reviewed annually on 1 April to take into account market pay movements, individual performance, relativity to market on an individual basis and DP World’s ability to pay.
Allowances and Benefits• Can either be cash or non-cash elements
based on level of responsibility as determined by applying a formal job evaluation methodology.
• Reflect local practice in each of the geographies in which DP World operates, but are also set against common market policy positions.
• For Executive Directors and senior management based in Dubai, cash allowances are a normal component of the package and typically cover accommodation, utility, transport and club elements in line with Dubai market practice. Benefits include providing children’s education assistance, travel assistance, medical and dental insurance and post-retirement benefits.
• Reviewed annually to ensure that DP World remains competitive within the market place and that it continues to provide the reward mechanisms to aid retention in line with its ability to pay.
Incentive PlansThe Company has adopted a short term performance delivery plan and a long term incentive plan for its Executive Directors and senior managers. Details of these plans are outlined below.
C O R P O R AT E G O V E R N A N C E
Description 2018 Implementation
Performance Delivery Plan (“PDP”)
Cash-based incentive plan to motivate, drive and reward performance over an operating cycle of one year.
The PDP combines business financial performance and individual performance objectives. Levels of awards, financial and personal measures and weightings will vary depending on the individual’s role, geography and level of responsibility. For individuals outside the Executive Directors and senior management category, the principle is then typically cascaded throughout the terminals’ organisational levels in line with local policies.
Appropriateness of the levels of awards, financial and personal measures and weightings are reviewed on an annual basis to ensure they continue to support our business strategy.
Payment is in cash and is expected to be made in April each year for performance over the previous financial year, subject to review and sign-off by the Remuneration Committee.
The PDP for the financial year ended 2018 (award to be paid in 2019) and 2017 (award paid in 2018) is worth a maximum of 150% of annual base salary. It is made up of two components: a financial component worth 70% of the overall award value and a personal component worth 30% of the overall award value.
The financial component is based on performance assessed against a budgeted Profit After Tax (PAT) measure. Payout on the financial component is triggered if the Company achieves 95% of its target. Maximum payout on the financial component will occur if the Company achieves 105% of its target. The payout for performance between the 95% and 105% of target is on a straight-line basis.
The personal component is based on performance assessed against Specific, Measurable, Attainable, Relevant and Timebound (SMART) objectives for 70% of the personal award and against the Founder’s Principles for 30% of the personal award. The objectives are particular to each individual role and can include financial based objectives and more qualitative ones.
Long Term Incentive Plan (“LTIP”)
Cash-based rolling incentive plan to motivate, drive and reward sustained performance over the long term operating cycle of three years.
The LTIP reflects business financial performance only. Levels of awards, financial measures and weightings will vary depending on the individual’s role, geography and levels of responsibility. In addition to the Executive Directors and senior managers, employees performing the top 100 jobs (as determined by job size) are also eligible to participate in the LTIP in line with the same financial metrics as described for Executive Directors and senior managers with varying levels of award in line with their job size.
Appropriateness of the levels of awards, financial measures and weightings are reviewed on an annual basis to ensure they continue to support our business strategy.
Payment is in cash and is expected to be made in April each year for performance over the previous three financial years, subject to review and sign-off by the Remuneration Committee.
The LTIP for the 2016-2018 (award to be paid in 2019) and 2017-2019 (award to be paid in 2020) and 2018-2020 (award to be paid in 2021) performance cycles is based on performance over three years assessed against two budgeted measures with 70% of the award linked to a Return On Capital Employed measure and 30% linked to an Earnings Per Share measure.
The LTIP for the cycles described above is worth a maximum of 100% of average annual base salary for the Executive Directors and a maximum of 75% of average annual base salary for other senior managers.
DP World Annual Report and Accounts 2018 | 8382 | DP World Annual Report and Accounts 2018
Company Overview Corporate Governance Financial StatementsStrategic Report
R E M U N E R AT I O N C O N T I N U E D
Executive Directors’ Service Contracts and Remuneration as at 31 December 2018As mentioned above, the Executive Directors’ remuneration structure follows the market practice in the UAE, and all payments are made tax-free reflecting the UAE’s status.
Each of the Executive Directors is employed pursuant to a service agreement.
Sultan Ahmed Bin SulayemSultan Ahmed Bin Sulayem’s service agreement is with DP World FZE. It can be terminated on six months’ notice by either party. In addition, DP World FZE can terminate the agreement, without notice, on payment of six months’ base salary.
Sultan Ahmed Bin Sulayem is entitled to receive a base salary and certain other benefits under his service agreement.
He was also granted a Performance Delivery Plan award of 150% (out of a maximum of 150%) for performance linked to the 2017 financial year and a Long Term Incentive Plan award of 149.5% (out of a maximum of 150%) for performance linked to the 2015-2017 cycle. His total remuneration for the year ended 31 December 2018 (which includes his base salary and these other benefits) was $6,126,063.00.
Yuvraj NarayanYuvraj Narayan’s service agreement is with DP World FZE. It can be terminated on six months’ notice by either party. In addition, DP World FZE can terminate the agreement, without notice, on payment of six months’ base salary.
Yuvraj Narayan is entitled to receive a base salary and certain other benefits under his service agreement.
He was also granted a Performance Delivery Plan award of 100% (out of a maximum of 100%) for performance linked to the 2017 financial year and a Long Term Incentive Plan award of 99.7% (out of a maximum of 100%) for performance linked to the 2015-2017 cycle.
His total remuneration for the year ended 31 December 2018 (which includes his base salary and these other benefits) was $1,977,564.00.
Post-Retirement BenefitsSultan Ahmed Bin Sulayem participates in the Government pension scheme in accordance with local labour law. Yuvraj Narayan participates in an end of service benefit scheme in accordance with local labour law.
Non-Executive Directors’ Letters of Appointment and FeesThe Non-Executive Directors do not have service contracts with the Company. Their terms
of appointment are governed by letters of appointment. The Company has no contractual obligation to provide any benefits to any of the Non-Executive Directors upon termination of their directorship.
Each Non-Executive Director’s letter of appointment is with the Company and is envisaged to be for a period of three years, subject to annual re-election by the shareholders at each AGM. It can be terminated on six months’ notice by either party.
For the year ended 31 December 2018, the fees and other remuneration payable to each of the Non-Executive Directors, which includes remuneration for their services in being a member of, or chairing, a Board Committee are set out below:• Deepak Parekh received a Non-Executive
Director fee of $207,815.00 • Robert Woods received a Non-Executive
Director fee of $172,455.00• Mark Russell received a Non-Executive
Director fee of $157,396.001
• Abdulla Ghobash received a Non-Executive Director fee of $152,975.00
• Nadya Kamali received a Non-Executive Director fee of $196,270.00
• Mohamed Al Suwaidi received a Non-Executive Director fee of $182,127.00
Interests In SharesThe following is a table of the Directors’ and senior managers’ shareholdings:
The following statement, which should be read in conjunction with the auditors’ responsibility section of the Independent Auditors’ Report, is made with a view to distinguishing the respective responsibilities of the Directors and of the Auditors in relation to the Consolidated Financial Statements.
The Directors are required to prepare Consolidated Financial Statements for each financial year which present fairly the state of affairs of DP World PLC (the “Company”) and its subsidiaries (collectively referred to as the “Group”) as at the end of the financial year and of the profit and loss for the financial year.
The Consolidated Financial Statements are prepared in accordance with International Financial Reporting Standards and the applicable provisions of the DIFC Companies Law. In preparing the Consolidated Financial Statements, the Directors are required to select appropriate accounting policies and then apply them consistently, make judgements and estimates that are reasonable and prudent and state whether all accounting standards which they consider to be applicable have been followed, subject to any material departures disclosed and explained in the Consolidated Financial Statements. The Directors also use a going concern basis in preparing the Consolidated Financial Statements unless this is inappropriate.
The Directors have responsibility for ensuring that the Company keeps accounting records which disclose with reasonable accuracy at any time the financial position of the Company and which enable them to ensure that the Consolidated Financial Statements comply with the applicable laws in the relevant jurisdiction.The Directors have general responsibility for taking such steps as are reasonably open to them to safeguard the assets of the Group and to prevent and detect fraud and other irregularities.
The Directors are also responsible for preparing a Directors’ Report and Corporate Governance Statement in accordance with applicable law and regulations.
The Directors consider the Annual Report and the Consolidated Financial Statements, taken as a whole, to be fair, balanced and understandable, and provide necessary information for shareholders to assess the Company’s performance, business model and strategy.
By order of the Board
M O H A M M A D A L H A S H I M YD E P U T Y G RO U P G E N E R A L CO U N S E L & CO M PA N Y S EC R E TA RY 21 M A RC H 2 019
$2.00 ordinary shares held as at 1 January 2018
$2.00 ordinary shares held as at
31 December 2018 Change
Yuvraj Narayan 13,864 13,864 –
Mohammed Al Muallem 4,712 4,712 –
Robert Woods 2,700 2,700 –
1 Mark Russell has waived the fees due to him for the year 2018 in full. An amount equivalent to these fees was donated to the Cardinal Hume Centre, UK registered charity number 1090836
C O R P O R AT E G O V E R N A N C E
S TAT E M E N T O F D I R E C T O R S ’ R E S P O N S I B I L I T I E S

DP World Annual Report and Accounts 2018 | 8584 | DP World Annual Report and Accounts 2018
Company Overview Corporate Governance Financial StatementsStrategic ReportF I N A N C I A L S TAT E M E N T SF I N A N C I A L S TAT E M E N T S
I N D E P E N D E N T A U D I T O R S ’ R E P O R TT O T H E S H A R E H O L D E R S O F D P W O R L D P L C
( F O R M E R LY D P W O R L D L I M I T E D)
Report on the Audit of the Consolidated Financial StatementsOpinionWe have audited the consolidated financial statements of DP World PLC (“the Company”) and its subsidiaries (“the Group”), which comprise the consolidated statement of financial position as at 31 December 2018, the consolidated statements of profit or loss, other comprehensive income, changes in equity and cash flows for the year then ended, and notes, comprising significant accounting policies and other explanatory information.
In our opinion, the accompanying consolidated financial statements present fairly, in all material respects, the consolidated financial position of the Group as at 31 December 2018, and its consolidated financial performance and its consolidated cash flows for the year then ended in accordance with International Financial Reporting Standards (IFRS).
Basis for OpinionWe conducted our audit in accordance with International Standards on Auditing (ISAs). Our responsibilities under those standards are further described in the Auditors’ Responsibilities for the Audit of the Consolidated Financial Statements section of our report. We are independent of the Group in accordance with International Ethics Standards Board for Accountants Code of Ethics for Professional Accountants (IESBA Code) together with the ethical requirements that are relevant to our audit of the consolidated financial statements in the Dubai International Financial Centre (“DIFC”), and we have fulfilled our other ethical responsibilities in accordance with these requirements and the IESBA Code. We believe that the audit evidence we have obtained is sufficient and appropriate to provide a basis for our opinion.
Key Audit MattersKey audit matters are those matters that, in our professional judgement, were of most significance in our audit of the consolidated financial statements of the current year. These matters were addressed in the context of our audit of the consolidated financial statements as a whole, and in forming our opinion thereon, and we do not provide a separate opinion on these matters.
Impairment assessment of carrying value of goodwill, port concession rights and other intangible assetsRefer to notes 3 and 16 of the consolidated financial statements.
The Group has significant goodwill, port concession rights and other intangible assets arising from the acquisition of businesses. The Group’s annual impairment testing on goodwill, port concession rights and other intangible assets with indefinite useful lives requires the Group to identify Cash Generating Units (CGUs) in accordance with the requirements of IAS 36 – Impairment of Assets. Impairment testing is then performed using free cash flow projections based on three year financial budgets approved by the Board and a further five year future forecasts estimated by the Group’s management. Due to the inherent uncertainty involved in forecasting and discounting future cash flows, which forms the basis of the assessment of recoverability, along with the judgemental aspects of the assessment of appropriate CGUs, these are the key areas that our audit concentrated on.
Our response to address the key audit matterOur procedures included:
In respect of the assessment of CGUs: We challenged the identification of CGUs by reference to the Group’s operating and management structure, our understanding of the business and requirements of IAS 36 - Impairment of Assets.
In respect of the cash flows: We considered the Group’s procedures used to develop the forecasts and the principles and integrity of the Group’s discounted cash flow model and re-performed the calculations of the model results to test their mathematical accuracy. To challenge the reasonableness of those cash flow estimates, we assessed the historical accuracy of the Group’s forecasting activities and corroborated the forecasts with reference to publicly available information and other evidence that has been made available during the course of the audit. We conducted our own assessments to challenge other key inputs, such as the projected growth rate and terminal value growth rate.
In respect of the discount rates: We compared the Group’s assumptions to externally derived data (for example, bond yields and inflation statistics) where appropriate. We used our valuation specialists to assist us in assessing the reasonableness of the significant assumptions used in arriving at the discount rates.
In respect of the sensitivity to key assumptions: We assessed the impact to the calculated recoverable amount of the CGUs by changing discount rates and forecast future cash flows.
We assessed the adequacy of the Group’s disclosure in these respects.
Accounting for business acquisitionsRefer to notes 3 and 24 of the consolidated financial statements.
During the year, the Group has acquired 100% stake in Drydocks World LLC, Dubai Maritime City LLC, Cosmos Agencia Marítima S.A.C., Unifeeder Group, an effective stake of 58.5% in Continental Warehousing Corporation Ltd and a 51% stake in LBS B.V.
For the acquisitions, in accordance with IFRS 3 – Business Combinations, the accounting involves estimating the fair value of the assets and liabilities at the acquisition date, the identification and valuation of intangible assets and recognition of goodwill. Significant judgement is involved in relation to the assumptions used in the valuation (using discounted future cash flows) and the purchase price allocation process. Due to the inherent uncertainty involved in discounting future cash flows, there is a risk that these assumptions are inappropriate.
Furthermore, an assessment is required to be made as to the classification of an investment as a subsidiary, joint venture or associate based on whether the Group has determined to have control, joint control or significant influence respectively.
Our response to address the key audit matterOur procedures included:
For the acquisitions, we challenged the Group’s critical assumptions in relation to the identification and recognition of the assets and liabilities acquired and the associated fair values by involving our valuation specialists to assess the reasonableness of the key assumptions used in the fair value and purchase price allocation process as determined by the Group. We reviewed the resulting adjustments for reasonableness.
We inspected the key terms in the share purchase agreements to assess the control classification of the investments as per IFRS 10 – Consolidated Financial Statements. We agreed the consideration paid by comparing relevant amounts to bank records and considered the appropriateness of costs associated with the purchase.
We assessed the adequacy of the Group’s disclosure in these respects.
Provisions in respect of litigation and claimsRefer to notes 3 and 25 of the consolidated financial statements.
The Group enters into individually significant contracts which may extend to many years and are often directly or indirectly associated with governments. As a result, the Group is subject to a number of potentially material ongoing litigation actions and claims, therefore, the recognition and measurement of provisions and the measurement and disclosure of contingent liabilities in respect of litigation and claims requires significant judgement and accordingly is a key area of focus in our audit.
Our response to address the key audit matterOur procedures included:
Evaluation of the Group’s policies, procedures and controls in relation to litigations, claims and provision assessments.
Furthermore, we obtained written representations from the Group’s legal counsel, made independent enquiries and obtained confirmations from external lawyers to understand the legal positions and exposure to the Group.
The outcome of our evaluation was used as a basis to determine the adequacy of the level of provisioning and disclosure in the consolidated financial statements.

DP World Annual Report and Accounts 2018 | 8786 | DP World Annual Report and Accounts 2018
Company Overview Corporate Governance Financial StatementsStrategic ReportF I N A N C I A L S TAT E M E N T S
Taxation provisionsRefer to notes 3 and 8 of the consolidated financial statements.
The Group operates in a number of tax jurisdictions whereby the Group has to estimate the tax effect of applying local legislation which can be complex, uncertain and involve cross border transactions, including transfer pricing arrangements.
Where the precise nature of the tax legislation is unclear, the Group has to make reasonable estimates of the likely tax charge that will arise.
Tax provisions have been estimated by the Group with respect to the tax exposures identified but there is the potential risk that the eventual resolution of a matter with the tax authorities is at an amount materially different to the provision recognised.
Our response to address the key audit matterOur procedures included:
We have considered any large or unusual items affecting the effective tax rate and whether or not any current year items would result in an increased or reduced provision. We have assessed the Group’s deferred tax position and ensured that any change in tax rates enacted as at the reporting date have been appropriately considered.
In considering the judgements and estimates of tax provisions, we used our tax specialists to assess the Group’s tax positions including assessing correspondence with the relevant tax authorities. We challenged the positions taken by the Group based on our knowledge and experience of the jurisdiction in which the Group operates specifically relating to the adequacy of provisions and disclosure within the consolidated financial statements.
PensionsRefer to notes 3 and 21 of the consolidated financial statements.
The Group operates a number of defined benefit pension schemes. In accordance with IAS 19 – Employee Benefits, the valuation of the pension deficit requires significant levels of judgement and technical expertise in choosing the appropriate assumptions. Changes in a number of the key assumptions including estimated salary increases, inflation, discount rates and mortality assumptions can have a material impact on the calculation of the net pension position. Due to the size of the pension scheme deficit and the judgements inherent in the actuarial assumptions used in the valuation of the pension benefit obligations, we considered this to be an area of focus.
Our response to address the key audit matterOur procedures included:
The Group engages independent external actuaries to assist them in calculating the appropriate pension scheme position. We obtained the actuary’s report and, with the assistance of our pension specialists, assessed the discount and inflation rates used in calculating the pension deficit to our internally developed benchmarks, which are based on externally available data to assess whether these assumptions were within our expected range. We compared the mortality assumption to national and industry averages to assess that these were reasonable.
We also compared the assumptions with those used in previous years, to assess whether the methodology used in arriving at the assumptions year on year was consistent.
We agreed the material assets of the scheme to third party confirmations and where applicable, recalculated asset valuations based on the quoted prices.
We assessed the adequacy of the disclosures in this area.
Other InformationManagement is responsible for the other information. The other information comprises the information included in the Annual report, but does not include the consolidated financial statements and our auditors’ report thereon. The Annual report is expected to be made available to us after the date of this auditors’ report.
Our opinion on the consolidated financial statements does not cover the other information and we do not express any form of assurance conclusion thereon.
In connection with our audit of the consolidated financial statements, our responsibility is to read the other information identified above when it becomes available and, in doing so, consider whether the other information is materially inconsistent with the consolidated financial statements or our knowledge obtained in the audit, or otherwise appears to be materially misstated.
When we read the Annual report, if we conclude that there is a material misstatement therein, we are required to communicate the matter to those charged with governance and take appropriate actions in accordance with ISAs.
Responsibilities of Management and Those Charged with Governance for the Consolidated Financial StatementsManagement is responsible for the preparation and fair presentation of the consolidated financial statements in accordance with IFRS, and their preparation in compliance with the applicable provisions of the Companies Law pursuant to DIFC Law No. 5 of 2018 and for such internal control as management determines is necessary to enable the preparation of consolidated financial statements that are free from material misstatement, whether due to fraud or error.
In preparing the consolidated financial statements, management is responsible for assessing the Group’s ability to continue as a going concern, disclosing, as applicable, matters related to going concern and using the going concern basis of accounting unless management either intends to liquidate the Group or to cease operations, or has no realistic alternative but to do so.
Those charged with governance are responsible for overseeing the Group’s financial reporting process.
Auditors’ Responsibilities for the Audit of the Consolidated Financial StatementsOur objectives are to obtain reasonable assurance about whether the consolidated financial statements as a whole are free from material misstatement, whether due to fraud or error, and to issue an auditors’ report that includes our opinion. Reasonable assurance is a high level of assurance, but is not a guarantee that an audit conducted in accordance with ISAs will always detect a material misstatement when it exists. Misstatements can arise from fraud or error and are considered material if, individually or in the aggregate, they could reasonably be expected to influence the economic decisions of users taken on the basis of these consolidated financial statements.
As part of an audit in accordance with ISAs, we exercise professional judgement and maintain professional skepticism throughout the audit. We also:• Identify and assess the risks of material misstatement of the consolidated financial statements, whether due to fraud or error, design and perform
audit procedures responsive to those risks, and obtain audit evidence that is sufficient and appropriate to provide a basis for our opinion. The risk of not detecting a material misstatement resulting from fraud is higher than for one resulting from error, as fraud may involve collusion, forgery, intentional omissions, misrepresentations, or override of internal control.
• Obtain an understanding of internal control relevant to the audit in order to design audit procedures that are appropriate in the circumstances, but not for the purpose of expressing an opinion on the effectiveness of the Group’s internal control.
• Evaluate the appropriateness of accounting policies used and the reasonableness of accounting estimates and related disclosures made by management.
• Conclude on the appropriateness of management’s use of the going concern basis of accounting and, based on the audit evidence obtained, whether a material uncertainty exists related to events or conditions that may cast significant doubt on the Group’s ability to continue as a going concern. If we conclude that a material uncertainty exists, we are required to draw attention in our auditors’ report to the related disclosures in the consolidated financial statements or, if such disclosures are inadequate, to modify our opinion. Our conclusions are based on the audit evidence obtained up to the date of our auditors’ report. However, future events or conditions may cause the Group to cease to continue as a going concern.
• Evaluate the overall presentation, structure and content of the consolidated financial statements, including the disclosures, and whether the consolidated financial statements represent the underlying transactions and events in a manner that achieves fair presentation.
• Obtain sufficient appropriate audit evidence regarding the financial information of the entities and business activities within the Group to express an opinion on the consolidated financial statements. We are responsible for the direction, supervision and performance of the group audit. We remain solely responsible for our audit opinion.
I N D E P E N D E N T A U D I T O R S ’ R E P O R T C O N T I N U E DT O T H E S H A R E H O L D E R S O F D P W O R L D P L C
( F O R M E R LY D P W O R L D L I M I T E D)

DP World Annual Report and Accounts 2018 | 8988 | DP World Annual Report and Accounts 2018
Company Overview Corporate Governance Financial StatementsStrategic ReportF I N A N C I A L S TAT E M E N T S
We communicate with those charged with governance regarding, among other matters, the planned scope and timing of the audit and significant audit findings, including any significant deficiencies in internal control that we identify during our audit.
We also provide those charged with governance with a statement that we have complied with relevant ethical requirements regarding independence, and to communicate with them all relationships and other matters that may reasonably be thought to bear on our independence, and where applicable, related safeguards.
From the matters communicated with those charged with governance, we determine those matters that were of most significance in the audit of the consolidated financial statements of the current period and are therefore the key audit matters. We describe these matters in our auditors’ report unless law or regulation precludes public disclosure about the matter or when, in extremely rare circumstances, we determine that a matter should not be communicated in our report because the adverse consequences of doing so would reasonably be expected to outweigh the public interest benefits of such communication.
Report on Other Legal and Regulatory RequirementsWe further report that the consolidated financial statements comply, in all material respects, with the applicable provisions of the Companies Law pursuant to DIFC Law No. 5 of 2018.
KPMG LLPRO H I T R A J VA N S H ID U BA I , U N IT ED A R A B EM IR AT E S
DAT E : 14 M A RC H 2019
I N D E P E N D E N T A U D I T O R S ’ R E P O R T C O N T I N U E DT O T H E S H A R E H O L D E R S O F D P W O R L D P L C
( F O R M E R LY D P W O R L D L I M I T E D)
C O N S O L I D AT E D S TAT E M E N T O F P R O F I T O R L O S S
Year ended 31 December 2018 Year ended 31 December 2017
Note
Before separately
discloseditems
USD’000
Separatelydisclosed
items(Note 9)
USD’000Total
USD’000
Beforeseparatelydisclosed
itemsUSD’000
Separatelydisclosed
items(Note 9)
USD’000Total
USD’000
Revenue 5 5,646,280 – 5,646,280 4,714,733 14,053 4,728,786Cost of sales (3,138,749) – (3,138,749) (2,359,467) (14,053) (2,373,520)
Gross profit 2,507,531 – 2,507,531 2,355,266 – 2,355,266General and administrative expenses (738,233) (56,264) (794,497) (693,878) (14,699) (708,577)Other income 56,595 – 56,595 51,844 3,433 55,277Loss on disposal and change in ownership
of business 9 – (3,591) (3,591) – (28,234) (28,234)Share of profit/(loss) from equity-accounted
investees (net of tax) 17 165,067 (9,578) 155,489 123,592 4,172 127,764
Results from operating activities 1,990,960 (69,433) 1,921,527 1,836,824 (35,328) 1,801,496
Finance income 7 141,328 127,916 269,244 95,540 550 96,090Finance costs 7 (575,891) (33,656) (609,547) (425,410) (98,100) (523,510)
Net finance costs (434,563) 94,260 (340,303) (329,870) (97,550) (427,420)
Profit before tax 1,556,397 24,827 1,581,224 1,506,954 (132,878) 1,374,076Income tax expense 8 (223,607) – (223,607) (144,406) 101,076 (43,330)
Profit for the year 6 1,332,790 24,827 1,357,617 1,362,548 (31,802) 1,330,746
Profit attributable to:Owners of the Company 1,270,116 26,365 1,296,481 1,208,517 (31,802) 1,176,715Non-controlling interests 62,674 (1,538) 61,136 154,031 – 154,031
1,332,790 24,827 1,357,617 1,362,548 (31,802) 1,330,746
Earnings per share
Basic earnings per share – US cents 11 153.03 156.20 145.60 141.77Diluted earnings per share – US cents 11 148.59 140.63 141.58 141.77
The accompanying notes 1 to 35 form an integral part of these consolidated financial statements.
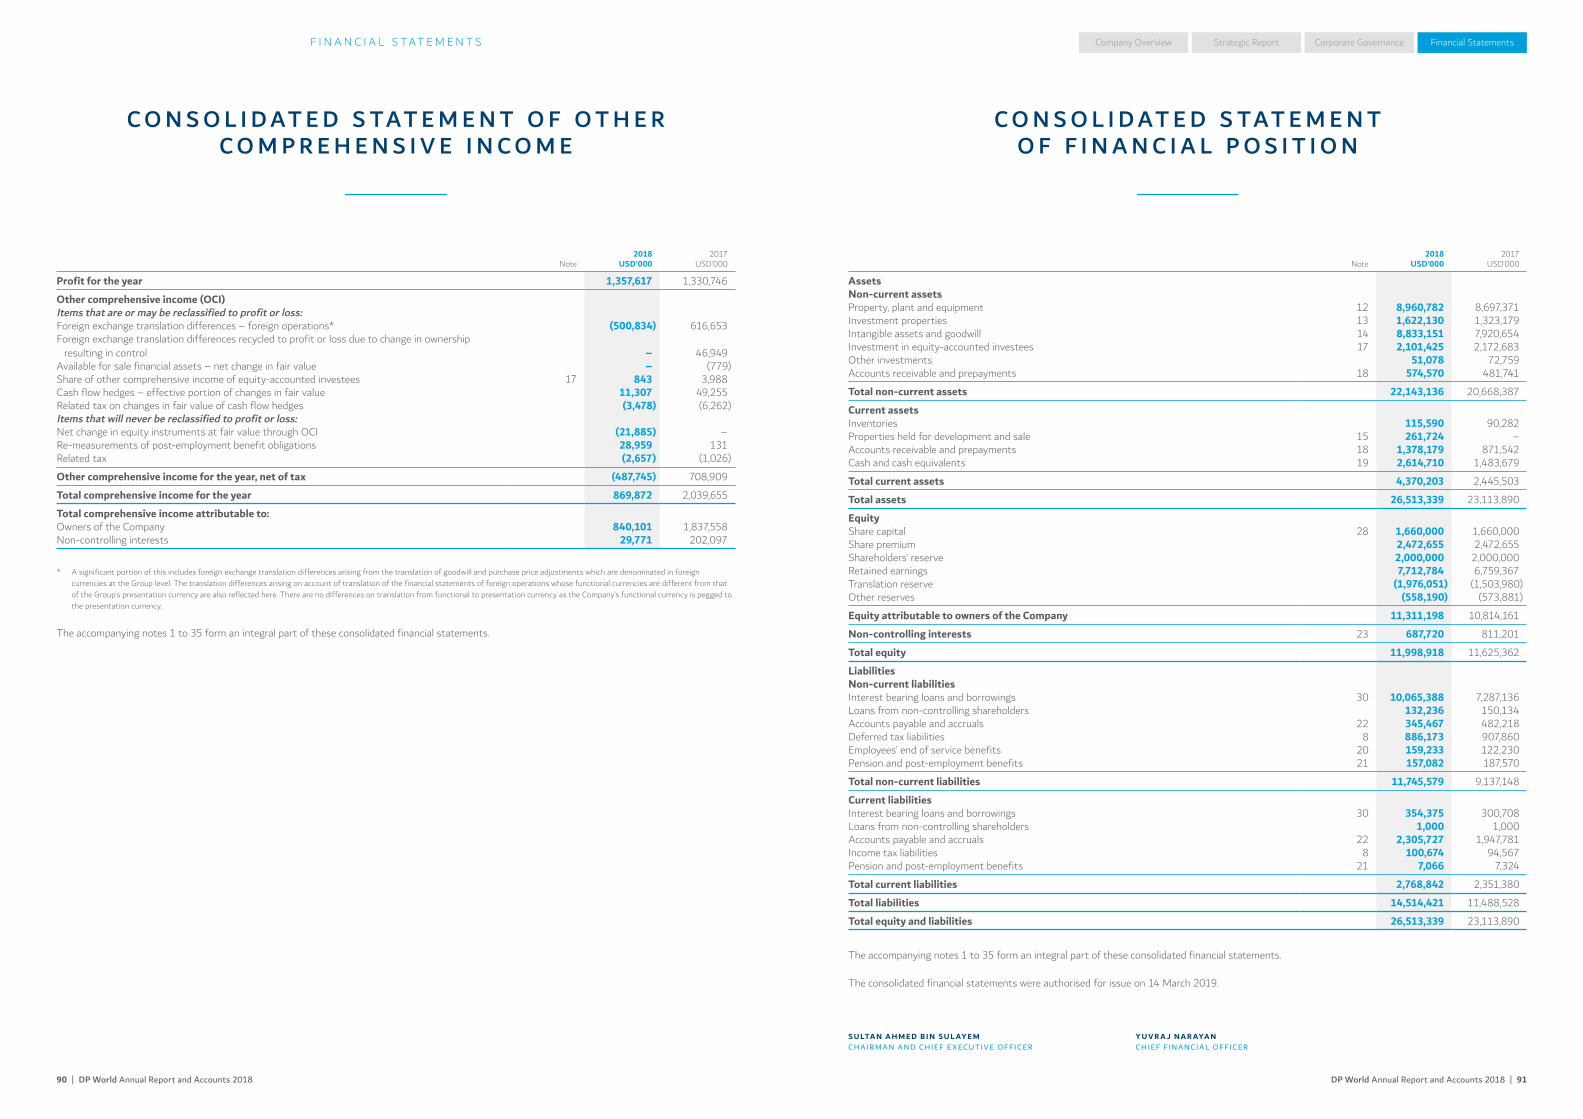
DP World Annual Report and Accounts 2018 | 9190 | DP World Annual Report and Accounts 2018
Company Overview Corporate Governance Financial StatementsStrategic ReportF I N A N C I A L S TAT E M E N T S
Note2018
USD’0002017
USD’000
Profit for the year 1,357,617 1,330,746
Other comprehensive income (OCI)Items that are or may be reclassified to profit or loss:Foreign exchange translation differences – foreign operations* (500,834) 616,653Foreign exchange translation differences recycled to profit or loss due to change in ownership
resulting in control – 46,949Available for sale financial assets – net change in fair value – (779)Share of other comprehensive income of equity-accounted investees 17 843 3,988Cash flow hedges – effective portion of changes in fair value 11,307 49,255Related tax on changes in fair value of cash flow hedges (3,478) (6,262)Items that will never be reclassified to profit or loss:Net change in equity instruments at fair value through OCI (21,885) –Re-measurements of post-employment benefit obligations 28,959 131Related tax (2,657) (1,026)
Other comprehensive income for the year, net of tax (487,745) 708,909
Total comprehensive income for the year 869,872 2,039,655
Total comprehensive income attributable to:Owners of the Company 840,101 1,837,558Non-controlling interests 29,771 202,097
* A significant portion of this includes foreign exchange translation differences arising from the translation of goodwill and purchase price adjustments which are denominated in foreign currencies at the Group level. The translation differences arising on account of translation of the financial statements of foreign operations whose functional currencies are different from that of the Group’s presentation currency are also reflected here. There are no differences on translation from functional to presentation currency as the Company’s functional currency is pegged to the presentation currency.
The accompanying notes 1 to 35 form an integral part of these consolidated financial statements.
C O N S O L I D AT E D S TAT E M E N T O F O T H E R C O M P R E H E N S I V E I N C O M E
C O N S O L I D AT E D S TAT E M E N T O F F I N A N C I A L P O S I T I O N
Note2018
USD’0002017
USD’000
AssetsNon-current assetsProperty, plant and equipment 12 8,960,782 8,697,371Investment properties 13 1,622,130 1,323,179Intangible assets and goodwill 14 8,833,151 7,920,654Investment in equity-accounted investees 17 2,101,425 2,172,683Other investments 51,078 72,759Accounts receivable and prepayments 18 574,570 481,741
Total non-current assets 22,143,136 20,668,387
Current assetsInventories 115,590 90,282Properties held for development and sale 15 261,724 –Accounts receivable and prepayments 18 1,378,179 871,542Cash and cash equivalents 19 2,614,710 1,483,679
Total current assets 4,370,203 2,445,503
Total assets 26,513,339 23,113,890
EquityShare capital 28 1,660,000 1,660,000Share premium 2,472,655 2,472,655Shareholders’ reserve 2,000,000 2,000,000Retained earnings 7,712,784 6,759,367Translation reserve (1,976,051) (1,503,980)Other reserves (558,190) (573,881)
Equity attributable to owners of the Company 11,311,198 10,814,161
Non-controlling interests 23 687,720 811,201
Total equity 11,998,918 11,625,362
LiabilitiesNon-current liabilitiesInterest bearing loans and borrowings 30 10,065,388 7,287,136Loans from non-controlling shareholders 132,236 150,134Accounts payable and accruals 22 345,467 482,218Deferred tax liabilities 8 886,173 907,860Employees’ end of service benefits 20 159,233 122,230Pension and post-employment benefits 21 157,082 187,570
Total non-current liabilities 11,745,579 9,137,148
Current liabilitiesInterest bearing loans and borrowings 30 354,375 300,708Loans from non-controlling shareholders 1,000 1,000Accounts payable and accruals 22 2,305,727 1,947,781Income tax liabilities 8 100,674 94,567Pension and post-employment benefits 21 7,066 7,324
Total current liabilities 2,768,842 2,351,380
Total liabilities 14,514,421 11,488,528
Total equity and liabilities 26,513,339 23,113,890
The accompanying notes 1 to 35 form an integral part of these consolidated financial statements.
The consolidated financial statements were authorised for issue on 14 March 2019.
S U LTA N A H M E D B I N S U L AY E M Y U V R A J N A R AYA NC H A IR M A N A N D C H IEF E X EC U T I V E O FFI C ER C H IEF F IN A N C I A L O FFI C ER
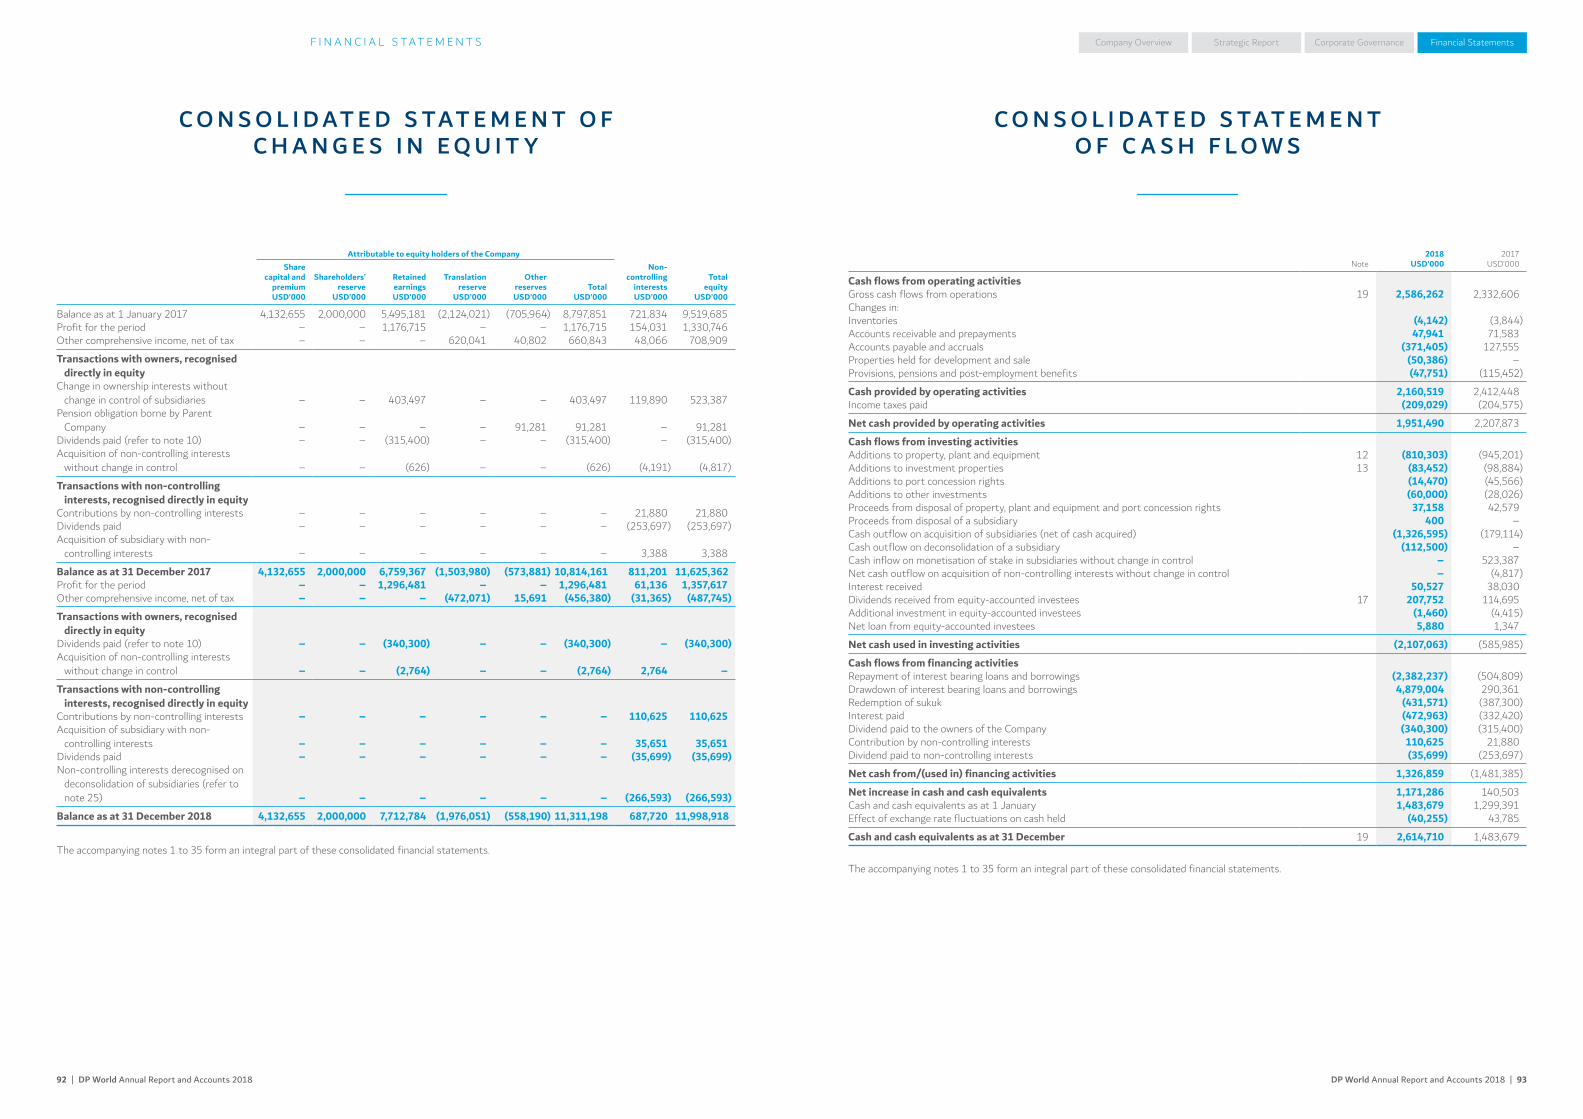
DP World Annual Report and Accounts 2018 | 9392 | DP World Annual Report and Accounts 2018
Company Overview Corporate Governance Financial StatementsStrategic ReportF I N A N C I A L S TAT E M E N T S
Attributable to equity holders of the CompanyShare
capital and premiumUSD’000
Shareholders’reserve
USD’000
Retained earningsUSD’000
Translationreserve
USD’000
OtherreservesUSD’000
TotalUSD’000
Non-controlling
interests USD’000
Totalequity
USD’000
Balance as at 1 January 2017 4,132,655 2,000,000 5,495,181 (2,124,021) (705,964) 8,797,851 721,834 9,519,685Profit for the period – – 1,176,715 – – 1,176,715 154,031 1,330,746Other comprehensive income, net of tax – – – 620,041 40,802 660,843 48,066 708,909
Transactions with owners, recognised directly in equity
Change in ownership interests without change in control of subsidiaries – – 403,497 – – 403,497 119,890 523,387
Pension obligation borne by Parent Company – – – – 91,281 91,281 – 91,281
Dividends paid (refer to note 10) – – (315,400) – – (315,400) – (315,400)Acquisition of non-controlling interests
without change in control – – (626) – – (626) (4,191) (4,817)
Transactions with non-controlling interests, recognised directly in equity
Contributions by non-controlling interests – – – – – – 21,880 21,880Dividends paid – – – – – – (253,697) (253,697)Acquisition of subsidiary with non-
controlling interests – – – – – – 3,388 3,388
Balance as at 31 December 2017 4,132,655 2,000,000 6,759,367 (1,503,980) (573,881) 10,814,161 811,201 11,625,362Profit for the period – – 1,296,481 – – 1,296,481 61,136 1,357,617Other comprehensive income, net of tax – – – (472,071) 15,691 (456,380) (31,365) (487,745)
Transactions with owners, recognised directly in equity
Dividends paid (refer to note 10) – – (340,300) – – (340,300) – (340,300)Acquisition of non-controlling interests
without change in control – – (2,764) – – (2,764) 2,764 –
Transactions with non-controlling interests, recognised directly in equity
Contributions by non-controlling interests – – – – – – 110,625 110,625Acquisition of subsidiary with non-
controlling interests – – – – – – 35,651 35,651Dividends paid – – – – – – (35,699) (35,699)Non-controlling interests derecognised on
deconsolidation of subsidiaries (refer to note 25) – – – – – – (266,593) (266,593)
Balance as at 31 December 2018 4,132,655 2,000,000 7,712,784 (1,976,051) (558,190) 11,311,198 687,720 11,998,918
The accompanying notes 1 to 35 form an integral part of these consolidated financial statements.
C O N S O L I D AT E D S TAT E M E N T O F C H A N G E S I N E Q U I T Y
C O N S O L I D AT E D S TAT E M E N T O F C A S H F L O W S
Note2018
USD’0002017
USD’000
Cash flows from operating activitiesGross cash flows from operations 19 2,586,262 2,332,606Changes in:Inventories (4,142) (3,844)Accounts receivable and prepayments 47,941 71,583Accounts payable and accruals (371,405) 127,555Properties held for development and sale (50,386) –Provisions, pensions and post-employment benefits (47,751) (115,452)
Cash provided by operating activities 2,160,519 2,412,448Income taxes paid (209,029) (204,575)
Net cash provided by operating activities 1,951,490 2,207,873
Cash flows from investing activitiesAdditions to property, plant and equipment 12 (810,303) (945,201)Additions to investment properties 13 (83,452) (98,884)Additions to port concession rights (14,470) (45,566)Additions to other investments (60,000) (28,026)Proceeds from disposal of property, plant and equipment and port concession rights 37,158 42,579Proceeds from disposal of a subsidiary 400 –Cash outflow on acquisition of subsidiaries (net of cash acquired) (1,326,595) (179,114)Cash outflow on deconsolidation of a subsidiary (112,500) –Cash inflow on monetisation of stake in subsidiaries without change in control – 523,387Net cash outflow on acquisition of non-controlling interests without change in control – (4,817)Interest received 50,527 38,030Dividends received from equity-accounted investees 17 207,752 114,695Additional investment in equity-accounted investees (1,460) (4,415)Net loan from equity-accounted investees 5,880 1,347
Net cash used in investing activities (2,107,063) (585,985)
Cash flows from financing activitiesRepayment of interest bearing loans and borrowings (2,382,237) (504,809)Drawdown of interest bearing loans and borrowings 4,879,004 290,361Redemption of sukuk (431,571) (387,300)Interest paid (472,963) (332,420)Dividend paid to the owners of the Company (340,300) (315,400)Contribution by non-controlling interests 110,625 21,880Dividend paid to non-controlling interests (35,699) (253,697)
Net cash from/(used in) financing activities 1,326,859 (1,481,385)
Net increase in cash and cash equivalents 1,171,286 140,503Cash and cash equivalents as at 1 January 1,483,679 1,299,391Effect of exchange rate fluctuations on cash held (40,255) 43,785
Cash and cash equivalents as at 31 December 19 2,614,710 1,483,679
The accompanying notes 1 to 35 form an integral part of these consolidated financial statements.

DP World Annual Report and Accounts 2018 | 9594 | DP World Annual Report and Accounts 2018
Company Overview Corporate Governance Financial StatementsStrategic ReportF I N A N C I A L S TAT E M E N T S
2. Basis of preparation of the consolidated financial statements continuedb) New standards and interpretations not yet effective continuedi. IFRS 16 Leases (effective from 1 January 2019)The Group is required to adopt IFRS 16 Leases from 1 January 2019. The new standard requires the lessee to recognise the operating lease commitment on the balance sheet. The standard requires future lease commitments to be recognised as a liability, with a corresponding right of use asset. This will impact the EBITDA and debt to equity ratios of the Group. In addition, depending on the stage of lease, there will be a different pattern of expense recognition on leases. Currently, lease expenses are recognised in cost of sales, however, in future the lease expense would be replaced by an amortisation charge and finance expense. The Group has reviewed all the leasing arrangements over the last year in light of the new lease accounting rules in IFRS 16. The standard will affect primarily the accounting of the Group’s operating leases.
The Group will apply IFRS 16 initially on 1 January 2019, using the modified retrospective approach. The cumulative effect of adopting IFRS 16 will be recognised as an adjustment to the opening balance of retained earnings at 1 January 2019, with no restatement of comparative information. The Group has assessed the estimated impact that initial application of IFRS 16 will have on its consolidated financial statements, as described below.
As at the reporting date, the Group has non-cancellable operating lease commitments of USD 7.8 billion (refer to note 32). These are mainly terminal operating leases which are long term in nature, arising out of the concession arrangements. The Group expects to recognise right-of-use assets of approximately USD 1.5 billion on 1 January 2019 and lease liabilities of USD 1.9 billion. The Group expects that net profit after tax will decrease by approximately USD 49 million for 2019 as a result of adopting the new rules. Adjusted EBITDA is expected to increase by approximately USD 120 million, as the operating lease payments were included in EBITDA earlier, but the amortisation of the right-of-use assets and interest on the lease liability are excluded from this measure now. This change will have no overall impact on Group’s cash flows, except that operating cash flows will increase and financing cash flows will decrease as repayment of the principal portion of the lease liabilities will be classified as cash flows from financing activities.
The Group’s activities as a lessor are not material and hence the Group does not expect any significant impact on the financial statements.
c) New standards, amendments and interpretations adopted by the GroupThe Group has initially applied IFRS 9 and IFRS 15 from 1 January 2018. A number of other new standards are also effective from 1 January 2018, but they do not have a material effect on the Group’s financial statements.
IFRS 9IFRS 9 sets out requirements for recognising and measuring financial assets, financial liabilities and some contracts to buy or sell non-financial items. This standard replaces IAS 39 Financial Instruments: Recognition and Measurement.
IFRS 9 contains three principal classification categories for financial assets: measured at amortised cost, fair value through other comprehensive income (FVOCI) and fair value through profit or loss (FVTPL). The classification of financial assets under IFRS 9 is generally based on the business model in which a financial asset is managed and its contractual cash flow characteristics. IFRS 9 eliminates the previous IAS 39 categories of held to maturity, loans and receivables and available for sale. Under IFRS 9, derivatives embedded in contracts where the host is a financial asset in the scope of the standard are never separated. Instead, the hybrid financial instrument as a whole is assessed for classification.
IFRS 9 replaces the ‘incurred loss’ model in IAS 39 with an ‘expected credit loss’ (ECL) model. The new impairment model applies to financial assets measured at amortised cost, contract assets and debt investments at FVOCI, but not to investments in equity instruments. Under IFRS 9, credit losses are recognised earlier than under IAS 39.
IFRS 9 did not have a significant impact on the Group’s financial statements.
IFRS 15IFRS 15 establishes a comprehensive framework for determining whether, how much and when revenue is recognised. It replaced IAS 18 Revenue, IAS 11 Construction Contracts and related interpretations. Under IFRS 15, revenue is recognised when a customer obtains control of the goods or services. Revenue is recognised to the extent that it is probable that the Group will collect the consideration to which it is entitled. Determining the timing of the transfer of control – at a point in time or over time – requires judgement.
The Group has adopted IFRS 15 using the cumulative effect method (without practical expedients), with the effect of initially applying this standard recognised at the date of initial application (i.e. 1 January 2018). Accordingly, the information presented for 2017 has not been restated.
The Group’s revenue mainly consists of revenue from ports and terminals, lease rentals and services from economic zones, Drydocking services and Logistics services. The Group’s current practises for recognising revenue have shown to comply in all material aspects with the concepts and principles encompassed by the new standard. Therefore, IFRS 15 did not have a significant impact on the Group’s accounting for revenue recognition.
1. Corporate informationDP World PLC (“the Company”) formerly known as DP World Limited, was incorporated on 9 August 2006 as a Company Limited by Shares with the Registrar of Companies of the Dubai International Financial Centre (“DIFC”) under the DIFC Companies Law. The consolidated financial statements for the year ended 31 December 2018 comprise the Company and its subsidiaries (collectively referred to as “the Group”) and the Group’s interests in equity-accounted investees. The Group is engaged in the business of development and management of international marine and inland terminal operations, maritime services, maritime transport, industrial parks and economic zones, logistics and ancillary services to technology-driven trade solutions.
Port & Free Zone World FZE (“the Parent Company”), which originally held 100% of the Company’s issued and outstanding share capital, made an initial public offer of 19.55% of its share capital to the public and the Company was listed on the Nasdaq Dubai with effect from 26 November 2007. The Company was further admitted to trade on the London Stock Exchange with effect from 1 June 2011 and voluntarily delisted from the London Stock Exchange on 21 January 2015.
Port & Free Zone World FZE is a wholly owned subsidiary of Dubai World Corporation (“the Ultimate Parent Company”).
The Company’s registered office address is P.O. Box 17000, Dubai, United Arab Emirates.
2. Basis of preparation of the consolidated financial statementsThe consolidated financial statements have been prepared on going concern basis in accordance with International Financial Reporting Standards (“IFRS”) and the applicable provisions of the DIFC Companies Law.
The consolidated financial statements have been prepared on the historical cost basis, except for financial instruments which are measured at fair value.
a) Use of estimates and judgementsThe management makes estimates and judgements affecting the application of accounting policies and reported numbers in the consolidated financial statements. The significant estimates and judgements are listed below:
i. Estimate of useful lives of property, plant and equipment and port concession rights with finite lives.ii. Estimate of expected future cash flows and discount rates for calculating present value of such cash flows used to compute value-in-use of
cash-generating units.iii. Estimate of fair value of derivatives for which an active market is not available, is computed using various generally accepted valuation techniques.
Such techniques require inputs from observable markets and judgements on market risk and credit risk.iv. Estimates of cost to complete the projects for the purpose of valuation of the properties held for development and sale and investment properties
under construction.v. Estimate of level of probability of a contingent liability becoming an actual liability and resulting cash outflow based on the information available on
the reporting date.vi. Judgement is required for recognition of revenue under the new accounting standard.vii. Judgement is required on recognition of an identifiable intangible asset separate from goodwill in case of business combination at its estimated fair
value. This is based on information available and management’s expectations on the date of acquisition.viii. Judgements required by actuaries in respect of discount rates, future salary increments, mortality rates and inflation rates used for computation of
defined benefit liability.ix. Judgement is required for consolidation of entities in which the Group holds less than 50% shareholding and non-consolidation of entities in which
the Group holds more than 50% shareholding (refer to note 25).x. Judgement is required in determining the worldwide provision for income taxes.xi. Judgement is required to determine the amount of deferred tax assets that can be recognised, based upon the likely timing and level of future taxable
profits together with future tax planning strategies.xii. Judgement is required for measurement of expected credit losses for financial assets.
The actual results may differ from the estimates and judgements made by the management in the above matters. Revisions to the accounting estimates are recognised in the period in which the estimate is revised and in any future periods affected.
b) New standards and interpretations not yet effectiveA number of new standards, amendments to standards and interpretations are not effective for annual periods beginning 1 January 2018, and have not been applied in preparing these consolidated financial statements. Those which may be relevant to the Group are set out below. The Group does not plan to adopt these standards early.
N O T E S T O T H E C O N S O L I D AT E D F I N A N C I A L S TAT E M E N T S
DP World Annual Report and Accounts 2018 | 9796 | DP World Annual Report and Accounts 2018
Company Overview Corporate Governance Financial StatementsStrategic ReportF I N A N C I A L S TAT E M E N T S
N O T E S T O T H E C O N S O L I D AT E D F I N A N C I A L S TAT E M E N T S
C O N T I N U E D
3. Significant accounting policies continuedb) Foreign currencyi. Functional and presentation currencyThe functional currency of the Company is UAE Dirhams. Items included in the financial statements of each of the Group’s entities are measured using the currency of the primary environment in which it operates (functional currency). These consolidated financial statements are presented in USD, which is the Group’s presentation currency.
ii. Foreign currency transactions and balancesForeign currency transactions are translated into the functional currency using the exchange rates at the dates of the transactions. Foreign exchange gains and losses resulting from the settlement of such transactions and from the translation of monetary assets and liabilities denominated in foreign currencies at year end exchange rates are generally recognised in the consolidated statement of profit or loss.
Non-monetary assets and liabilities denominated in foreign currency are translated to the functional currency of each entity at the foreign exchange rate ruling at the date of transaction with no further re-measurement in future.
iii. Foreign operationsFor the preparation of consolidated financial statements, the differences arising on translation of financial statements of foreign operations into USD are recognised in other comprehensive income and accumulated in the translation reserve except to the extent of share of non-controlling interests in such differences. Accumulated translation differences are recycled to profit or loss on de-recognition of foreign operations as part of the gain or loss on such derecognition. In case of partial derecognition, accumulated differences proportionate to the stake derecognised are recycled.
If the settlement of a monetary item receivable from or payable to a foreign operation is neither planned nor likely to occur in the foreseeable future, then foreign currency differences arising from such item form part of the net investment in the foreign operation. Accordingly, such differences are recognised in the consolidated statement of other comprehensive income and accumulated in the translation reserve.
Foreign currency differences arising on the retranslation of a financial liability designated as a hedge of a net investment in a foreign operation are recognised in the consolidated statement of other comprehensive income, to the extent that the hedge is effective.
c) Financial instrumentsi. Non-derivative financial assetsClassification and subsequent measurement of financial assets (policy applicable under IAS 39 until 31 December 2017)Until 31 December 2017, the Group classified its financial assets in the following categories:• financial assets at fair value through profit or loss (FVPL);• loans and receivables;• held-to-maturity investments, and• available-for-sale financial assets.
The classification depended on the purpose for which the investments were acquired. Management determined the classification of its investments at initial recognition.
Subsequent measurementSubsequent to the initial recognition, loans and receivables and held-to-maturity investments were carried at amortised cost using the effective interest method.
Available-for-sale financial assets and financial assets at FVPL were subsequently carried at fair value. Gains or losses arising from changes in the fair value were recognised as follows:• for financial assets at FVPL – in profit or loss.• for available-for-sale financial assets, changes in the carrying amount were recognised in other comprehensive income.
Classification of financial assets (Policy applicable under IFRS 9 from 1 January 2018)IFRS 9 eliminates the previous IAS 39 categories for financial assets such as held to maturity, loans and receivables, fair value through profit or loss and available for sale.
Under IFRS 9, on initial recognition, a financial asset is classified and measured at:• Amortised cost;• Fair value through other comprehensive income (‘FVOCI’) – debt instrument;• FVOCI – equity instrument; or• Fair value through profit or loss (‘FVTPL’).
3. Significant accounting policiesThe following significant accounting policies have been consistently applied in the preparation of these consolidated financial statements throughout the Group to all the years presented, unless otherwise stated.
a) Basis of consolidationi. SubsidiariesSubsidiaries are entities controlled by the Group. The Group controls an entity when it is exposed to, or has rights to, variable returns from its involvement with the entity and has the ability to affect those returns through its power over the entity.
The acquisition method of accounting is used to account for business combinations including common control transactions by the Group on the date of acquisition.
ii. Business combination achieved in stagesOn business combination achieved in stages, the acquirer’s previously held interest in the acquiree is remeasured to fair value at the date of acquisition with any resulting gain or loss recognised in the consolidated statement of profit or loss.
iii. Change in ownership interests in subsidiaries without loss of controlChanges in the Group’s interests in a subsidiary that does not result in a loss of control are accounted for as transactions with owners in their capacity as owners and therefore no goodwill is recognised as a result of such transactions. The difference between the fair value of any consideration paid or received and relevant shares acquired or disposed off in the carrying value of net assets of the subsidiary is recorded in equity under retained earnings.
iv. Disposal of subsidiaries (loss of control)On the loss of control, the Group derecognises the subsidiary and recognises any surplus or deficit arising on the loss of control in the consolidated statement of profit or loss. Any retained interest is re-measured at fair value on the date control is lost and is subsequently accounted as an equity-accounted investee or as a FVOCI-equity instrument depending on the level of influence retained.
v. Non-controlling interestsFor each business combination, the Group elects to measure any non-controlling interests at their proportionate share of the acquiree’s identifiable net assets at the date of acquisition.
vi. Structured entitiesThe Group established DP World Crescent Limited (a limited liability company incorporated in the Cayman Islands) as a structured entity (“SE”) for the issue of Sukuk Certificates. These certificates are listed on Nasdaq Dubai and London Stock Exchange. The Group does not have any direct or indirect shareholding in this entity.
The Group has also incorporated JAFZ Sukuk (2019) Limited as a SE for issuing New JAFZ Sukuk which are currently listed on Nasdaq Dubai and the Irish Stock Exchange.
vi. Investments in equity-accounted investees (associates and joint ventures)The Group’s interest in equity-accounted investees comprise interest in associates and joint ventures. An associate is an entity over which the Group has significant influence. A joint venture is a type of joint arrangement whereby the parties that have joint control of the arrangement have rights to the net assets of the joint venture.
Investments in equity-accounted investees are accounted for using the equity method and are initially recorded at cost including transaction costs. The Group’s investment includes fair value adjustments (including goodwill) net of any accumulated impairment losses.
At each reporting date, the Group determines whether there is any objective evidence that the investments in the equity-accounted investees are impaired. If this is the case, the Group calculates the amount of impairment as the difference between the recoverable amount of the equity-accounted investees and its carrying value and recognises the same in the consolidated statement of profit or loss.
vii. Transactions eliminated on consolidationIntra-group balances and transactions, and any unrealised income and expenses arising from intra-group transactions, are eliminated in preparing the consolidated financial statements. Unrealised gains arising from the transactions with equity-accounted investees are eliminated against the investment to the extent of the Group’s interest in the investee. Unrealised losses are eliminated in the same way as unrealised gains, but only to the extent that there is no evidence of impairment.
DP World Annual Report and Accounts 2018 | 9998 | DP World Annual Report and Accounts 2018
Company Overview Corporate Governance Financial StatementsStrategic ReportF I N A N C I A L S TAT E M E N T S
N O T E S T O T H E C O N S O L I D AT E D F I N A N C I A L S TAT E M E N T S
C O N T I N U E D
3. Significant accounting policies continuedc) Financial instruments continuedThe following table and the accompanying notes below explain the original measurement categories under IAS 39 and the new measurement categories under IFRS 9 for each class of the Group’s financial assets as at 1 January 2018:
Original classification under IAS 39 New classification under IFRS 9
Original carrying value under IAS 39
USD’000
Equity securities* Available-for-sale financial assets FVOCI – equity investment 69,935Convertible debt instrument** Loans and receivables Financial assets at FVTPL 30,000Equity securities Financial assets at FVTPL Financial assets at FVTPL 2,824Derivative instruments for hedging Fair value – hedging instruments Fair value – hedging instruments 8,952Trade and other receivables Loans and receivables Financial assets at amortised cost 1,188,037Cash and cash equivalents Loans and receivables Financial assets at amortised cost 1,483,679
* These equity securities represent investments that the Group intends to hold for the long-term for strategic purposes. As permitted by IFRS 9, the Group has designated these investments at the date of initial application as measured at FVOCI. Unlike IAS 39, the accumulated fair value movement related to these investments will never be reclassified to profit or loss.
** Convertible debt instrument has been reclassified as financial asset at FVTPL due to its exposure to equity price risk.
The new classification above did not result in any significant change in measurement of values under IFRS 9.
Derecognition of financial assetsThe Group derecognises a financial asset when the contractual rights to the cash flows from the asset expire, or it transfers the rights to receive the contractual cash flows on the financial asset in a transaction in which substantially all the risks and rewards of ownership of the financial asset are transferred and it does not retain control of the financial asset.
ii. Impairment of non-derivative financial assets (Policy applicable under IFRS 9 from 1 January 2018)IFRS 9 replaces the ‘incurred loss’ model in IAS 39 with an ‘expected credit loss’ (ECL) model. The new impairment model applies to financial assets measured at amortised cost, contract assets and debt investments at FVOCI, but not to investments in equity instruments. Under IFRS 9, credit losses are recognised earlier than under IAS 39.
The financial assets at amortised cost consist of trade receivables and cash and cash equivalents.
Under IFRS 9, loss allowances are measured on either of the following bases:• 12-month ECLs: these are ECLs that result from possible default events within the 12 months after the reporting date; and• lifetime ECLs: these are ECLs that result from all possible default events over the expected life of a financial instrument.
The Group measures loss allowances at an amount equal to lifetime ECLs. When determining whether the credit risk of a financial asset has increased significantly since initial recognition and when estimating ECLs, the Group considers reasonable and supportable information that is relevant and available without undue cost or effort. This includes both quantitative and qualitative information and analysis, based on the Group’s historical experience and informed credit assessment and including forward-looking information.
The Group assumes that the credit risk on a financial asset increases significantly if it is more than 30 days past due.
The Group considers a financial asset to be in default when:• the borrower is unlikely to pay credit obligations to the Group in full, without recourse by the Group to actions such as realising security (if any are
held); or• the financial asset is more than 180 days past due.
The maximum period considered when estimating ECLs is the maximum contractual period over which the Group is exposed to credit risk.
The application of IFRS 9’s impairment requirements at 1 January 2018 did not result in any significant additional impairment allowance.
3. Significant accounting policies continuedc) Financial instruments continuedThe classification of financial assets under IFRS 9 is generally based on the business model in which a financial asset is managed and also on the basis of the contractual cash flows characteristics of the financial instrument.
A financial asset is measured at amortised cost if it meets both of the following conditions and is not designated as at FVTPL:• it is held within a business model whose objective is to hold assets to collect contractual cash flows; and• its contractual terms give rise on specified dates to cash flows that are solely payments of principal and interest on the principal amount outstanding.
A debt investment is measured at FVOCI if it meets both of the following conditions and is not designated as at FVTPL:• it is held within a business model whose objective is achieved by both collecting contractual cash flows and selling financial assets; and• its contractual terms give rise on specified dates to cash flows that are solely payments of principal and interest on the principal amount outstanding.
On initial recognition of an equity investment that is not held for trading, the Group may irrevocably elect to present subsequent changes in the investment’s fair value in OCI. This election is made on an investment-by-investment basis.
All financial assets not classified as measured at amortised cost or FVOCI as described above are measured at FVTPL.
In addition, on initial recognition, the Group may irrevocably designate a financial asset that otherwise meets the requirements to be measured at amortised cost or at FVOCI as at FVTPL if doing so eliminates or significantly reduces an accounting mismatch that would otherwise arise.
Derivatives embedded in contracts where the host is a financial asset in the scope of the IFRS 9 is never separated. Instead, the hybrid financial instrument as a whole is classified and measured at FVTPL.
Financial assets are not reclassified subsequent to their initial recognition unless the Group changes its business model for managing financial assets, in which case all affected financial assets are reclassified on the first day of the first reporting period following the change in the business model.
Initial recognition of financial assetsA financial asset (unless it is a trade receivable without a significant financing component that is initially measured at the transaction price) is initially measured at fair value plus, for an item not at FVTPL, transaction costs that are directly attributable to its acquisition.
Subsequent measurement of financial assets
Financial assets at amortised cost These assets are subsequently measured at amortised cost using the effective interest method. Interest income, foreign exchange gains and losses and impairment are recognised in profit or loss. Any gain or loss on derecognition is recognised in profit or loss.
FVOCI – debt instrument These assets are subsequently measured at fair value. Interest income calculated using the effective interest method, foreign exchange gains and losses and impairment are recognised in profit or loss. Other net gains and losses are recognised in OCI. On derecognition, gains and losses accumulated in OCI are reclassified to profit or loss.
FVOCI – equity instrument These assets are subsequently measured at fair value. Dividends are recognised as income in profit or loss unless the dividend clearly represents a recovery of part of the cost of the investment. Other net gains and losses are recognised in OCI and are never reclassified to profit or loss.
Financial assets at FVTPL These assets are subsequently measured at fair value. Net gains and losses, including any interest or dividend income, are recognised in profit or loss.
DP World Annual Report and Accounts 2018 | 101100 | DP World Annual Report and Accounts 2018
Company Overview Corporate Governance Financial StatementsStrategic ReportF I N A N C I A L S TAT E M E N T S
N O T E S T O T H E C O N S O L I D AT E D F I N A N C I A L S TAT E M E N T S
C O N T I N U E D
3. Significant accounting policies continuedc) Financial instruments continuedWhen a derivative instrument or a non-derivative financial liability is designated as the hedging instrument in a hedge of a net investment in a foreign operation, the effective portion of, for a derivative, changes in the fair value of the hedging instrument or, for a non-derivative, foreign exchange gains and losses is recognised in OCI and presented in the translation reserve within equity. Any ineffective portion of the changes in the fair value of the derivative or foreign exchange gains and losses on the non-derivative is recognised immediately in profit or loss. The amount recognised in OCI is reclassified to profit or loss as a reclassification adjustment on disposal of the foreign operation.
Derivative instruments that are not designated as hedging instruments in hedge relationships are classified as financial liabilities or assets at fair value through profit or loss.
DerecognitionIf the hedging instrument no longer meets the criteria for hedge accounting, expires or is sold, terminated or exercised, or the designation is revoked, then hedge accounting is discontinued prospectively. The cumulative gain or loss previously recognised in consolidated statement of other comprehensive income remains there until the forecast transaction or firm commitment occurs. If the forecast transaction or firm commitment is no longer expected to occur, then the balance in equity is reclassified to the consolidated statement of profit or loss.
The policies applied for initial recognition and subsequent measurement in the comparative information presented for 2017 is similar to that applied for 2018.
d) Property, plant and equipmenti. Recognition and measurementItems of property, plant and equipment are measured at cost less accumulated depreciation and impairment losses (refer to note 3(j) (i)).
Cost includes expenditure that is directly attributable to the acquisition of the asset. The cost of a self-constructed asset includes the cost of materials and direct labour, any other costs directly attributable to bringing the asset to a working condition for its intended use and the cost of dismantling and removing the items and restoring the site on which they are located. Such property, plant and equipment does not directly increase the future economic benefits of any particular existing item of property, plant and equipment, but may be necessary for an entity to obtain the future economic benefits from its other assets.
Purchased software that is integral to the functionality of the related equipment is capitalised as part of that equipment.
Capital work-in-progress is measured at cost less impairment losses and not depreciated until such time the assets are ready for intended use and transferred to the respective category under property, plant and equipment.
DredgingDredging expenditure is categorised into capital dredging and major maintenance dredging. Capital dredging is expenditure which includes creation of a new harbour, deepening or extension of the channel berths or waterways in order to allow access to larger ships which will result in future economic benefits for the Group. This expenditure is capitalised and amortised over the expected period of the relevant concession agreement. Major maintenance dredging is expenditure incurred to restore the channel to its previous condition and depth. Maintenance dredging is regarded as a separate component of the asset and is capitalised and amortised evenly over 10 years.
ii. Subsequent costsThe cost of replacing part of an item of property, plant and equipment is recognised in the carrying amount of the item if it is probable that the future economic benefits embodied within the part will flow to the Group and its cost can be measured reliably.
iii. DepreciationLand and capital work in progress is not depreciated. Depreciation on other assets is recognised in the consolidated statement of profit or loss on a straight-line basis over the estimated useful lives of each part of an item of property, plant and equipment and is based on cost less residual value. Leased assets are depreciated on straight-line basis over their estimated useful lives or lease term whichever is shorter.
3. Significant accounting policies continuedc) Financial instruments continuediii. Non-derivative financial liabilitiesClassification, initial recognition and measurementIFRS 9 largely retains the existing requirements in IAS 39 for the classification and measurement of financial liabilities at amortised cost or FVTPL.
The Group’s non-derivative financial liabilities consist of loans and borrowings, bank overdrafts, amounts due to related parties, and trade and other payables. All non-derivative financial liabilities are recognised initially at fair value less any directly attributable transaction costs. The Group classifies all its non-derivative financial liabilities as financial liabilities to be carried at amortised cost using effective interest method.
The subsequent measurement of non-derivative financial liabilities are carried at their amortised cost using the effective interest method.
The Group derecognises a financial liability when its contractual obligations are discharged or cancelled or expired. The Group also derecognises a financial liability when its terms are modified and the cash flows of the modified liability are substantially different, in which case a new financial liability based on the modified terms is recognised at fair value.
Convertible bondConvertible bonds issued by the Group are denominated in USD and can be converted into ordinary shares. Convertible bonds are split into two components: a debt component and a component representing the embedded derivative in the convertible bond. The debt component represents a non-derivative financial liability for future coupon payments and the redemption of the principal amount. The embedded derivative, a financial derivative liability, represents the value of the option that bond holders can convert into ordinary shares. The Group has not recorded the embedded derivative within equity due to the existence of cash settlement terms with the Company.
iv. Derivative financial instruments and hedge accounting – (Policy applicable under IFRS 9 from 1 January 2018)The Group holds derivative financial instruments such as forward currency contracts and interest rate swaps to hedge its cash flows exposed to risk of fluctuations in foreign currencies and interest rates.
The Group has elected to adopt the new general hedge accounting model in IFRS 9. This requires the Group to ensure that hedge accounting relationships are aligned with its risk management objectives and strategy and to apply a more qualitative and forward-looking approach to assessing hedge effectiveness.
All hedging relationships designated under IAS 39 at 31 December 2017 met the criteria for hedge accounting under IFRS 9 at 1 January 2018 and are therefore regarded as continuing hedging relationships.
Initial recognitionDerivatives are recognised initially at fair value. Subsequent to initial recognition, derivatives are measured at fair value, and changes therein are either recognised in the consolidated statement of profit or loss or the consolidated statement of other comprehensive income.
The Group designates certain derivatives as hedging instruments to hedge the variability in cash flows associated with highly probable forecast transactions arising from changes in foreign exchange rates and interest rates and certain derivatives and non-derivative financial liabilities as hedges of foreign exchange risk on a net investment in a foreign operation.
On initial designation of the derivatives as the hedging instrument, the Group formally documents the risk management objective and strategy for undertaking the hedge. The Group also documents the economic relationship between the hedging instrument and hedged item, including whether the changes in cash flows of the hedged item and hedging instrument are expected to offset each other together with the methods that will be used to assess the effectiveness of the hedging relationship.
Subsequent measurementChanges in the fair value of the derivative hedging instrument designated as a cash flow hedge are recognised directly in consolidated statement of other comprehensive income to the extent that the hedge is effective and presented in the hedging reserve in equity. Any ineffective portion of changes in the fair value of the derivative is recognised immediately in the consolidated statement of profit or loss.
When the hedged item is a non-financial asset, the amount recognised in the consolidated statement of other comprehensive income is transferred to the carrying amount of the asset when it is recognised. In other cases, the amount recognised in consolidated statement of other comprehensive income is transferred to the consolidated statement of profit or loss in the same period that the hedged item affects the consolidated statement of profit or loss.
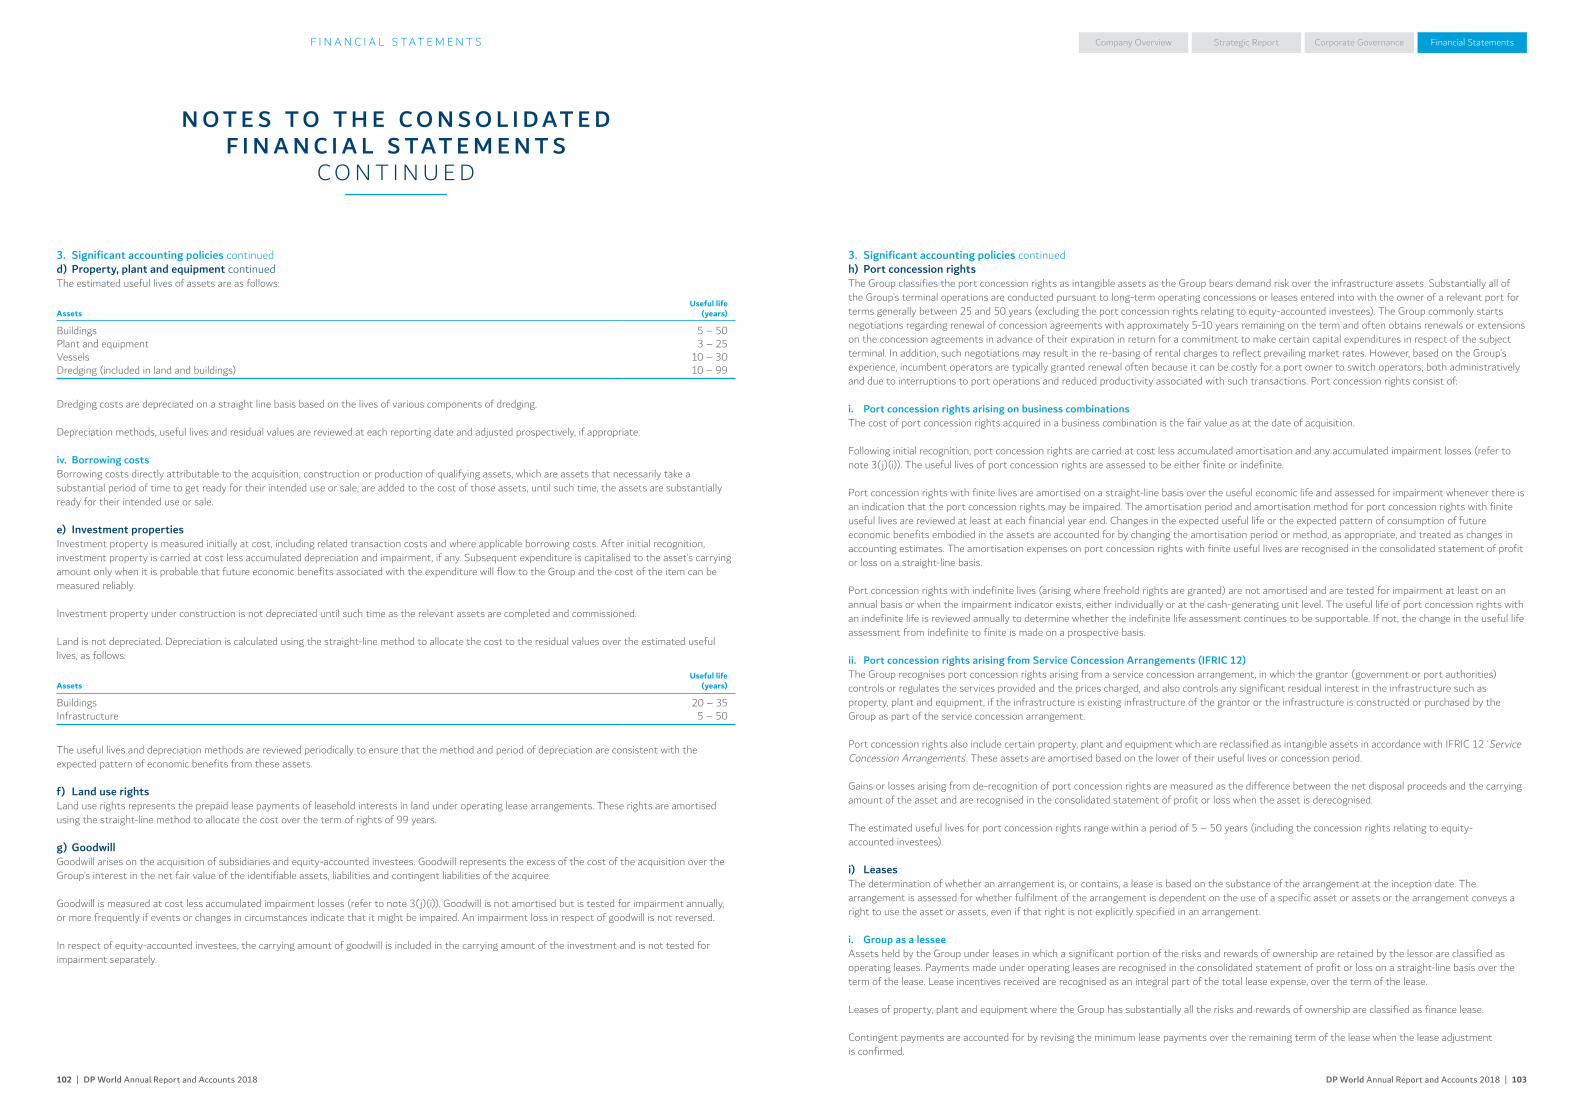
DP World Annual Report and Accounts 2018 | 103102 | DP World Annual Report and Accounts 2018
Company Overview Corporate Governance Financial StatementsStrategic ReportF I N A N C I A L S TAT E M E N T S
N O T E S T O T H E C O N S O L I D AT E D F I N A N C I A L S TAT E M E N T S
C O N T I N U E D
3. Significant accounting policies continuedh) Port concession rightsThe Group classifies the port concession rights as intangible assets as the Group bears demand risk over the infrastructure assets. Substantially all of the Group’s terminal operations are conducted pursuant to long-term operating concessions or leases entered into with the owner of a relevant port for terms generally between 25 and 50 years (excluding the port concession rights relating to equity-accounted investees). The Group commonly starts negotiations regarding renewal of concession agreements with approximately 5-10 years remaining on the term and often obtains renewals or extensions on the concession agreements in advance of their expiration in return for a commitment to make certain capital expenditures in respect of the subject terminal. In addition, such negotiations may result in the re-basing of rental charges to reflect prevailing market rates. However, based on the Group’s experience, incumbent operators are typically granted renewal often because it can be costly for a port owner to switch operators, both administratively and due to interruptions to port operations and reduced productivity associated with such transactions. Port concession rights consist of:
i. Port concession rights arising on business combinationsThe cost of port concession rights acquired in a business combination is the fair value as at the date of acquisition.
Following initial recognition, port concession rights are carried at cost less accumulated amortisation and any accumulated impairment losses (refer to note 3(j)(i)). The useful lives of port concession rights are assessed to be either finite or indefinite.
Port concession rights with finite lives are amortised on a straight-line basis over the useful economic life and assessed for impairment whenever there is an indication that the port concession rights may be impaired. The amortisation period and amortisation method for port concession rights with finite useful lives are reviewed at least at each financial year end. Changes in the expected useful life or the expected pattern of consumption of future economic benefits embodied in the assets are accounted for by changing the amortisation period or method, as appropriate, and treated as changes in accounting estimates. The amortisation expenses on port concession rights with finite useful lives are recognised in the consolidated statement of profit or loss on a straight-line basis.
Port concession rights with indefinite lives (arising where freehold rights are granted) are not amortised and are tested for impairment at least on an annual basis or when the impairment indicator exists, either individually or at the cash-generating unit level. The useful life of port concession rights with an indefinite life is reviewed annually to determine whether the indefinite life assessment continues to be supportable. If not, the change in the useful life assessment from indefinite to finite is made on a prospective basis.
ii. Port concession rights arising from Service Concession Arrangements (IFRIC 12)The Group recognises port concession rights arising from a service concession arrangement, in which the grantor (government or port authorities) controls or regulates the services provided and the prices charged, and also controls any significant residual interest in the infrastructure such as property, plant and equipment, if the infrastructure is existing infrastructure of the grantor or the infrastructure is constructed or purchased by the Group as part of the service concession arrangement.
Port concession rights also include certain property, plant and equipment which are reclassified as intangible assets in accordance with IFRIC 12 ‘Service Concession Arrangements’. These assets are amortised based on the lower of their useful lives or concession period.
Gains or losses arising from de-recognition of port concession rights are measured as the difference between the net disposal proceeds and the carrying amount of the asset and are recognised in the consolidated statement of profit or loss when the asset is derecognised.
The estimated useful lives for port concession rights range within a period of 5 – 50 years (including the concession rights relating to equity-accounted investees).
i) LeasesThe determination of whether an arrangement is, or contains, a lease is based on the substance of the arrangement at the inception date. The arrangement is assessed for whether fulfilment of the arrangement is dependent on the use of a specific asset or assets or the arrangement conveys a right to use the asset or assets, even if that right is not explicitly specified in an arrangement.
i. Group as a lesseeAssets held by the Group under leases in which a significant portion of the risks and rewards of ownership are retained by the lessor are classified as operating leases. Payments made under operating leases are recognised in the consolidated statement of profit or loss on a straight-line basis over the term of the lease. Lease incentives received are recognised as an integral part of the total lease expense, over the term of the lease.
Leases of property, plant and equipment where the Group has substantially all the risks and rewards of ownership are classified as finance lease.
Contingent payments are accounted for by revising the minimum lease payments over the remaining term of the lease when the lease adjustment is confirmed.
3. Significant accounting policies continuedd) Property, plant and equipment continuedThe estimated useful lives of assets are as follows:
AssetsUseful life
(years)
Buildings 5 – 50Plant and equipment 3 – 25Vessels 10 – 30Dredging (included in land and buildings) 10 – 99
Dredging costs are depreciated on a straight line basis based on the lives of various components of dredging.
Depreciation methods, useful lives and residual values are reviewed at each reporting date and adjusted prospectively, if appropriate.
iv. Borrowing costsBorrowing costs directly attributable to the acquisition, construction or production of qualifying assets, which are assets that necessarily take a substantial period of time to get ready for their intended use or sale, are added to the cost of those assets, until such time, the assets are substantially ready for their intended use or sale.
e) Investment propertiesInvestment property is measured initially at cost, including related transaction costs and where applicable borrowing costs. After initial recognition, investment property is carried at cost less accumulated depreciation and impairment, if any. Subsequent expenditure is capitalised to the asset’s carrying amount only when it is probable that future economic benefits associated with the expenditure will flow to the Group and the cost of the item can be measured reliably.
Investment property under construction is not depreciated until such time as the relevant assets are completed and commissioned.
Land is not depreciated. Depreciation is calculated using the straight-line method to allocate the cost to the residual values over the estimated useful lives, as follows:
AssetsUseful life
(years)
Buildings 20 – 35Infrastructure 5 – 50
The useful lives and depreciation methods are reviewed periodically to ensure that the method and period of depreciation are consistent with the expected pattern of economic benefits from these assets.
f) Land use rightsLand use rights represents the prepaid lease payments of leasehold interests in land under operating lease arrangements. These rights are amortised using the straight-line method to allocate the cost over the term of rights of 99 years.
g) GoodwillGoodwill arises on the acquisition of subsidiaries and equity-accounted investees. Goodwill represents the excess of the cost of the acquisition over the Group’s interest in the net fair value of the identifiable assets, liabilities and contingent liabilities of the acquiree.
Goodwill is measured at cost less accumulated impairment losses (refer to note 3(j)(i)). Goodwill is not amortised but is tested for impairment annually, or more frequently if events or changes in circumstances indicate that it might be impaired. An impairment loss in respect of goodwill is not reversed.
In respect of equity-accounted investees, the carrying amount of goodwill is included in the carrying amount of the investment and is not tested for impairment separately.

DP World Annual Report and Accounts 2018 | 105104 | DP World Annual Report and Accounts 2018
Company Overview Corporate Governance Financial StatementsStrategic ReportF I N A N C I A L S TAT E M E N T S
N O T E S T O T H E C O N S O L I D AT E D F I N A N C I A L S TAT E M E N T S
C O N T I N U E D
3. Significant accounting policies continuedk. Employee benefitsi. Pension and post-employment benefitsDefined contribution plansA defined contribution plan is a post-employment benefit plan in which the Company pays the fixed contribution to a separate entity and will have no legal or constructive obligation to pay further amounts. Obligations for contributions to defined contribution plans are recognised as an expense in the consolidated statement of profit or loss during which the services are rendered by employees.
Defined benefit plansA defined benefit plan is a post-employment benefit plan other than a defined contribution plan.
The Group’s net obligation in respect of defined benefit pension plans is calculated separately for each plan by estimating the amount of future benefit that employees have earned in return for their service in the current and prior periods. That benefit is discounted to determine the present value, and the fair value of any plan asset is deducted to arrive at net obligation. The calculation is performed annually by a qualified actuary using the projected unit credit method which attributes entitlement to benefits to the current period (to determine current service cost) and to the current and prior periods (to determine the present value of defined benefit obligation) and is based on actuarial advice.
Re-measurements of the net defined benefit liability, which comprise actuarial gains and losses, the return on plan assets (excluding interest) and the effect of the asset ceiling (if any, excluding interest) are recognised directly in the consolidated statement of other comprehensive income. The cost of providing benefits under the defined benefit plans is determined separately for each plan.
Contributions, including lump sum payments, in respect of defined contribution pension schemes and multi-employer defined benefit schemes where it is not possible to identify the Group’s share of the scheme, are charged to the consolidated statement of profit or loss as they fall due.
ii. Short-term employee benefitsShort-term employee benefits are expensed as the related service is provided. A liability is recognised for the amount expected to be paid if the Group has a present legal or constructive obligation to pay this amount as a result of past service provided by the employee and the obligation can be estimated reliably.
l. ProvisionsProvisions for environmental restoration, restructuring costs and legal claims are recognised when: the Group has a present legal or constructive obligation as a result of past events; it is probable that an outflow of resources will be required to settle the obligation; and the amount has been reliably estimated. Restructuring provisions comprise lease termination penalties and employee termination payments. Provisions are not recognised for future operating losses.
Provisions are measured at the present value of the expenditures expected to be required to settle the obligation using a pre-tax rate that reflects current market assessments of the time value of money and the risks specific to the liability. The unwinding of the discount is recognised as a finance cost in the consolidated statement of profit or loss.
m. RevenueRevenue from contracts with customers is recognised when control of the goods or services are transferred to the customer at an amount that reflects the consideration to which the Group expects to be entitled in exchange for those goods or services.
The Group’s revenue mainly consists of port related services (containerised stevedoring, break bulk and general cargo), service concession revenue, lease rentals, drydocking and logistic services revenue.
The following specific recognition criteria must also be met before revenue is recognised:
i. Rendering of port related servicesRevenue from providing containerised stevedoring, other containerised services and non-containerised services is recognised at the point in time when the services are rendered to the customer. However, storage revenue is recognised over a period of time.
3. Significant accounting policies continuedi) Leases continuedii. Group as a lessorLeases where the Group retains substantially all the risks and benefits of ownership of the asset are classified as operating leases. Initial direct costs incurred in negotiating an operating lease are added to the carrying amount of the leased asset and recognised over the lease term on the same basis as rental income. Contingent rents are recognised as income in the period in which they are earned.
iii. Leasing and sub-leasing transactionsLeasing and sub-leasing transactions are designed to achieve certain benefits for the third parties in overseas locations in return for a cash benefit to the Group. Such cash benefit is accounted in the consolidated statement of profit or loss based on its economic substance.
iv. Leases of land in port concessionLeases of land have not been classified as finance leases as the Group believes that the substantial risks and rewards of ownership of the land have not been transferred. Accordingly, these are accounted as operating leases. The existence of a significant exposure of the lessor to performance of the asset through contingent rentals is the basis of concluding that substantially all the risks and rewards of ownership have not passed.
j) Impairmenti. Non-financial assetsThe carrying amounts of the Group’s non-financial assets, other than inventories and deferred tax assets are reviewed for impairment whenever there is an indication of impairment. If any such indication exists, then the asset’s recoverable amount is estimated.
For impairment testing, the assets are grouped together into smallest group of assets (cash generating unit or “CGU”) that generates cash inflows from continuing use that are largely independent of the cash inflows of other assets or CGU’s.
Goodwill and port concession rights with infinite useful lives, as part of their respective cash-generating units, are also reviewed for impairment at each reporting date or at least once in a year regardless of any indicators of impairment. The recoverable amount of an asset or cash-generating unit is the greater of its value in use and its fair value less costs to sell. In assessing value in use, the estimated future cash flows are discounted to their present value using a pre-tax discount rate that reflects current market assessments of the time value of money and the risks specific to the asset or cash generating unit.
Impairment losses recognised in respect of cash-generating units are allocated first to reduce the carrying amount of any goodwill allocated to the units and then to reduce the carrying amount of the other assets in the unit (group of units) on a pro-rata basis.
In respect of non-financial assets (other than goodwill), impairment losses recognised in prior periods are assessed at each reporting date for any indications that the loss has decreased or no longer exists. An impairment loss is reversed if there has been a change in the estimates used to determine the recoverable amount. An impairment loss is reversed only to the extent that the asset’s carrying amount does not exceed the carrying amount, which would have been determined, net of depreciation or amortisation, if no impairment loss had been recognised.
ii. Financial assetsFinancial assets not classified at fair value through profit or loss are assessed by management at each reporting date to determine whether there is objective evidence of impairment.
Financial assets measured at amortised costThe Group considers evidence of impairment for financial assets measured at amortised cost at both a specific asset level and collective level. All individually significant receivables and held to maturity investment securities are assessed for specific impairment.
An impairment loss in respect of a financial asset measured at amortised cost is calculated as the difference between its carrying amount and the present value of the estimated future cash flows discounted at the original effective interest rate.
Available-for-sale financial assetsA significant or prolonged decline in the fair value of an equity investment is considered as objective evidence of impairment. The Group considers that generally a decline of 20% will be considered as significant and a decline of over 9 months will be considered as prolonged.
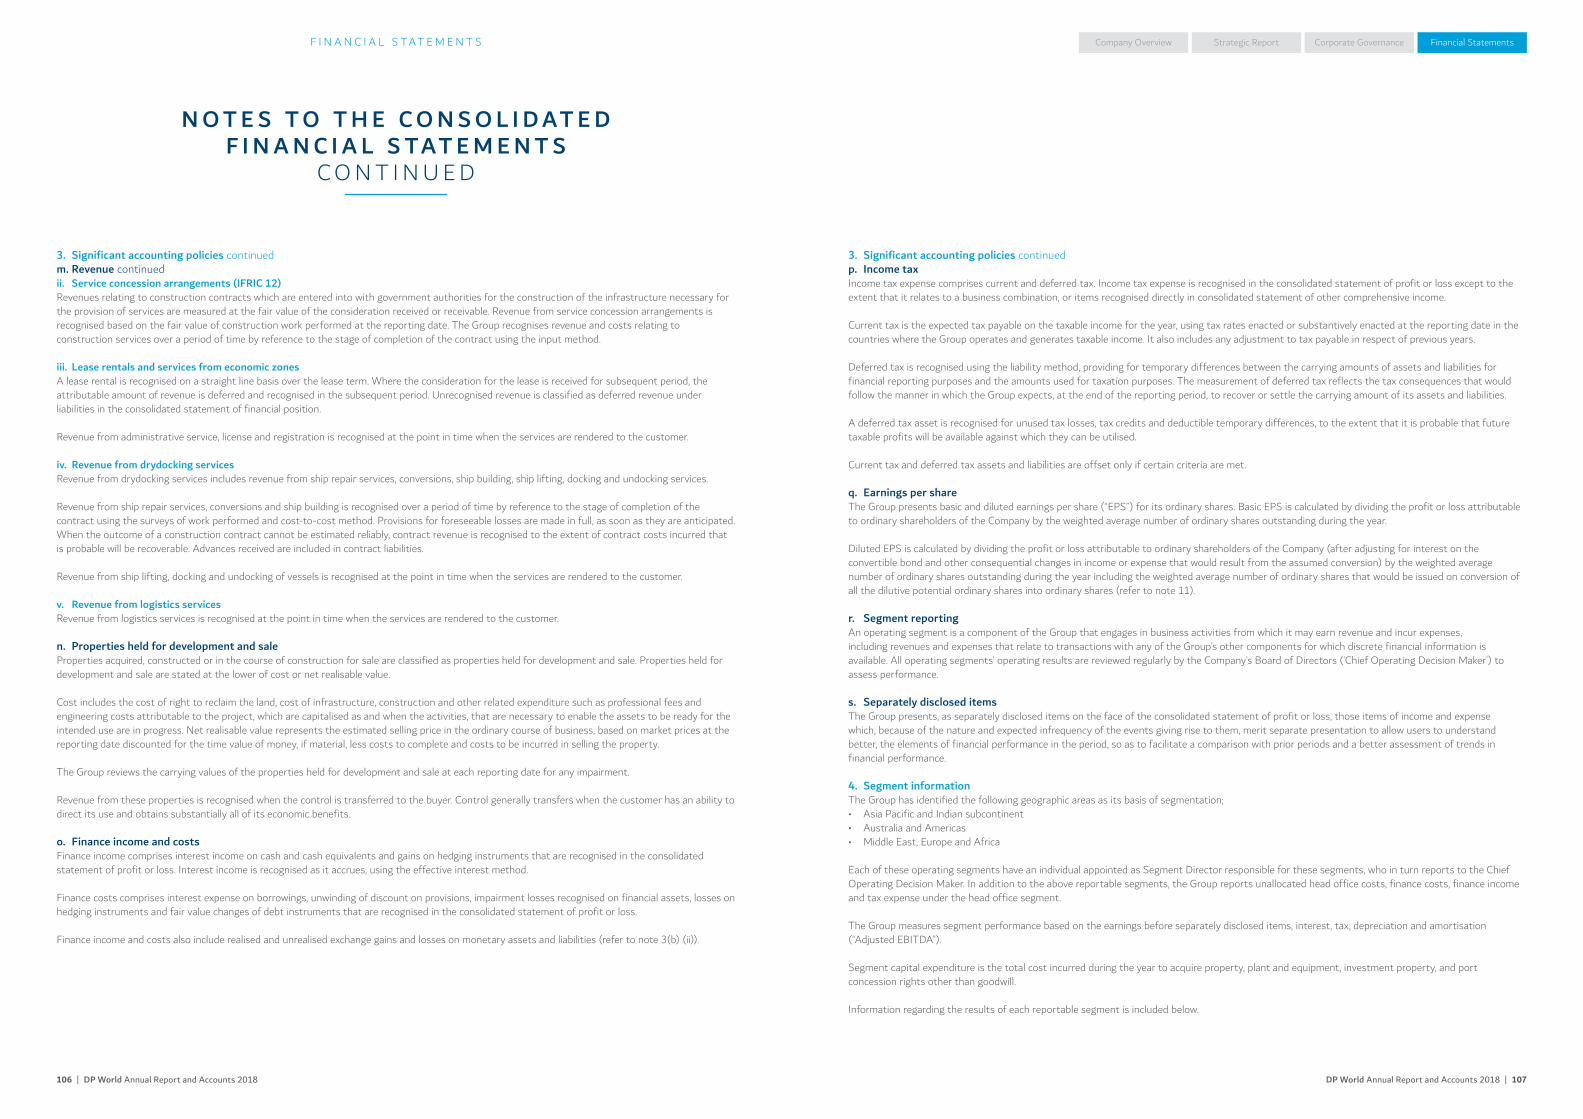
DP World Annual Report and Accounts 2018 | 107106 | DP World Annual Report and Accounts 2018
Company Overview Corporate Governance Financial StatementsStrategic ReportF I N A N C I A L S TAT E M E N T S
N O T E S T O T H E C O N S O L I D AT E D F I N A N C I A L S TAT E M E N T S
C O N T I N U E D
3. Significant accounting policies continuedp. Income taxIncome tax expense comprises current and deferred tax. Income tax expense is recognised in the consolidated statement of profit or loss except to the extent that it relates to a business combination, or items recognised directly in consolidated statement of other comprehensive income.
Current tax is the expected tax payable on the taxable income for the year, using tax rates enacted or substantively enacted at the reporting date in the countries where the Group operates and generates taxable income. It also includes any adjustment to tax payable in respect of previous years.
Deferred tax is recognised using the liability method, providing for temporary differences between the carrying amounts of assets and liabilities for financial reporting purposes and the amounts used for taxation purposes. The measurement of deferred tax reflects the tax consequences that would follow the manner in which the Group expects, at the end of the reporting period, to recover or settle the carrying amount of its assets and liabilities.
A deferred tax asset is recognised for unused tax losses, tax credits and deductible temporary differences, to the extent that it is probable that future taxable profits will be available against which they can be utilised.
Current tax and deferred tax assets and liabilities are offset only if certain criteria are met.
q. Earnings per shareThe Group presents basic and diluted earnings per share (“EPS”) for its ordinary shares. Basic EPS is calculated by dividing the profit or loss attributable to ordinary shareholders of the Company by the weighted average number of ordinary shares outstanding during the year.
Diluted EPS is calculated by dividing the profit or loss attributable to ordinary shareholders of the Company (after adjusting for interest on the convertible bond and other consequential changes in income or expense that would result from the assumed conversion) by the weighted average number of ordinary shares outstanding during the year including the weighted average number of ordinary shares that would be issued on conversion of all the dilutive potential ordinary shares into ordinary shares (refer to note 11).
r. Segment reportingAn operating segment is a component of the Group that engages in business activities from which it may earn revenue and incur expenses, including revenues and expenses that relate to transactions with any of the Group’s other components for which discrete financial information is available. All operating segments’ operating results are reviewed regularly by the Company’s Board of Directors (‘Chief Operating Decision Maker’) to assess performance.
s. Separately disclosed itemsThe Group presents, as separately disclosed items on the face of the consolidated statement of profit or loss, those items of income and expense which, because of the nature and expected infrequency of the events giving rise to them, merit separate presentation to allow users to understand better, the elements of financial performance in the period, so as to facilitate a comparison with prior periods and a better assessment of trends in financial performance.
4. Segment informationThe Group has identified the following geographic areas as its basis of segmentation;• Asia Pacific and Indian subcontinent• Australia and Americas• Middle East, Europe and Africa
Each of these operating segments have an individual appointed as Segment Director responsible for these segments, who in turn reports to the Chief Operating Decision Maker. In addition to the above reportable segments, the Group reports unallocated head office costs, finance costs, finance income and tax expense under the head office segment.
The Group measures segment performance based on the earnings before separately disclosed items, interest, tax, depreciation and amortisation (“Adjusted EBITDA”).
Segment capital expenditure is the total cost incurred during the year to acquire property, plant and equipment, investment property, and port concession rights other than goodwill.
Information regarding the results of each reportable segment is included below.
3. Significant accounting policies continuedm. Revenue continuedii. Service concession arrangements (IFRIC 12)Revenues relating to construction contracts which are entered into with government authorities for the construction of the infrastructure necessary for the provision of services are measured at the fair value of the consideration received or receivable. Revenue from service concession arrangements is recognised based on the fair value of construction work performed at the reporting date. The Group recognises revenue and costs relating to construction services over a period of time by reference to the stage of completion of the contract using the input method.
iii. Lease rentals and services from economic zonesA lease rental is recognised on a straight line basis over the lease term. Where the consideration for the lease is received for subsequent period, the attributable amount of revenue is deferred and recognised in the subsequent period. Unrecognised revenue is classified as deferred revenue under liabilities in the consolidated statement of financial position.
Revenue from administrative service, license and registration is recognised at the point in time when the services are rendered to the customer.
iv. Revenue from drydocking servicesRevenue from drydocking services includes revenue from ship repair services, conversions, ship building, ship lifting, docking and undocking services.
Revenue from ship repair services, conversions and ship building is recognised over a period of time by reference to the stage of completion of the contract using the surveys of work performed and cost-to-cost method. Provisions for foreseeable losses are made in full, as soon as they are anticipated. When the outcome of a construction contract cannot be estimated reliably, contract revenue is recognised to the extent of contract costs incurred that is probable will be recoverable. Advances received are included in contract liabilities.
Revenue from ship lifting, docking and undocking of vessels is recognised at the point in time when the services are rendered to the customer.
v. Revenue from logistics servicesRevenue from logistics services is recognised at the point in time when the services are rendered to the customer.
n. Properties held for development and saleProperties acquired, constructed or in the course of construction for sale are classified as properties held for development and sale. Properties held for development and sale are stated at the lower of cost or net realisable value.
Cost includes the cost of right to reclaim the land, cost of infrastructure, construction and other related expenditure such as professional fees and engineering costs attributable to the project, which are capitalised as and when the activities, that are necessary to enable the assets to be ready for the intended use are in progress. Net realisable value represents the estimated selling price in the ordinary course of business, based on market prices at the reporting date discounted for the time value of money, if material, less costs to complete and costs to be incurred in selling the property.
The Group reviews the carrying values of the properties held for development and sale at each reporting date for any impairment.
Revenue from these properties is recognised when the control is transferred to the buyer. Control generally transfers when the customer has an ability to direct its use and obtains substantially all of its economic benefits.
o. Finance income and costsFinance income comprises interest income on cash and cash equivalents and gains on hedging instruments that are recognised in the consolidated statement of profit or loss. Interest income is recognised as it accrues, using the effective interest method.
Finance costs comprises interest expense on borrowings, unwinding of discount on provisions, impairment losses recognised on financial assets, losses on hedging instruments and fair value changes of debt instruments that are recognised in the consolidated statement of profit or loss.
Finance income and costs also include realised and unrealised exchange gains and losses on monetary assets and liabilities (refer to note 3(b) (ii)).
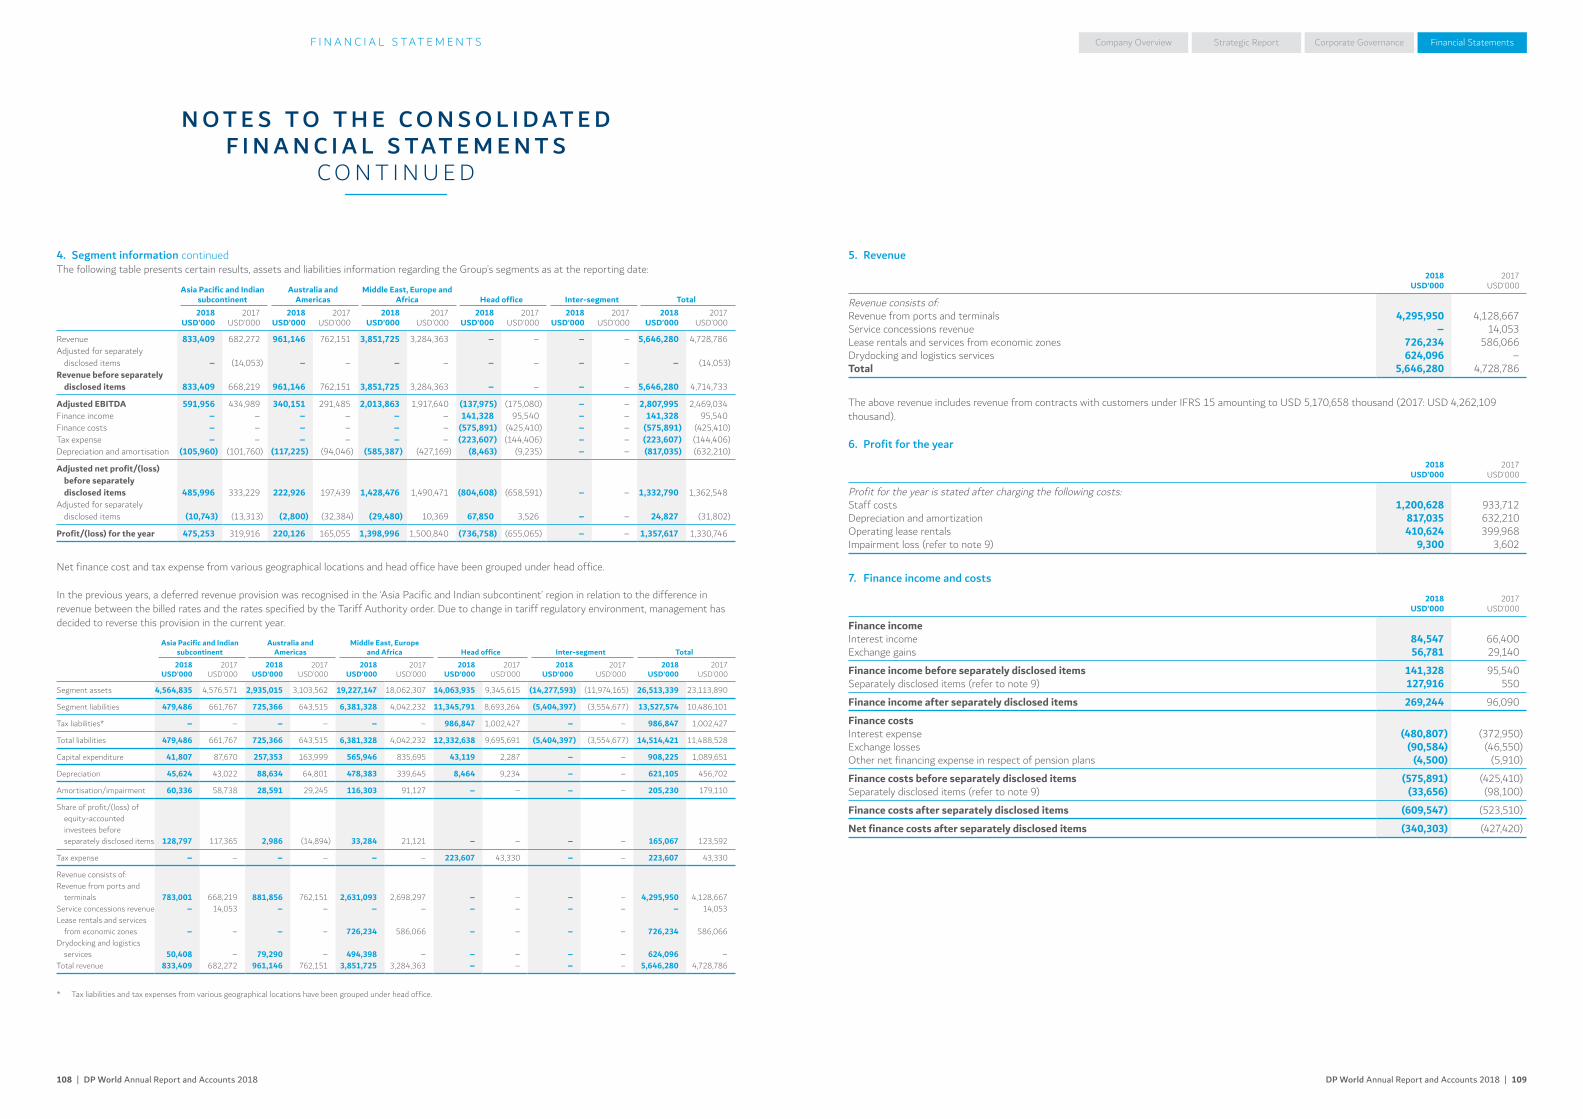
DP World Annual Report and Accounts 2018 | 109108 | DP World Annual Report and Accounts 2018
Company Overview Corporate Governance Financial StatementsStrategic ReportF I N A N C I A L S TAT E M E N T S
N O T E S T O T H E C O N S O L I D AT E D F I N A N C I A L S TAT E M E N T S
C O N T I N U E D
5. Revenue
2018USD’000
2017USD’000
Revenue consists of:Revenue from ports and terminals 4,295,950 4,128,667Service concessions revenue – 14,053Lease rentals and services from economic zones 726,234 586,066Drydocking and logistics services 624,096 –Total 5,646,280 4,728,786
The above revenue includes revenue from contracts with customers under IFRS 15 amounting to USD 5,170,658 thousand (2017: USD 4,262,109 thousand).
6. Profit for the year
2018USD’000
2017USD’000
Profit for the year is stated after charging the following costs:Staff costs 1,200,628 933,712Depreciation and amortization 817,035 632,210Operating lease rentals 410,624 399,968Impairment loss (refer to note 9) 9,300 3,602
7. Finance income and costs
2018USD’000
2017USD’000
Finance incomeInterest income 84,547 66,400Exchange gains 56,781 29,140
Finance income before separately disclosed items 141,328 95,540Separately disclosed items (refer to note 9) 127,916 550
Finance income after separately disclosed items 269,244 96,090
Finance costsInterest expense (480,807) (372,950)Exchange losses (90,584) (46,550)Other net financing expense in respect of pension plans (4,500) (5,910)
Finance costs before separately disclosed items (575,891) (425,410)Separately disclosed items (refer to note 9) (33,656) (98,100)
Finance costs after separately disclosed items (609,547) (523,510)
Net finance costs after separately disclosed items (340,303) (427,420)
4. Segment information continuedThe following table presents certain results, assets and liabilities information regarding the Group’s segments as at the reporting date:
Asia Pacific and Indian subcontinent
Australia and Americas
Middle East, Europe and Africa Head office Inter-segment Total
2018USD’000
2017USD’000
2018USD’000
2017USD’000
2018USD’000
2017USD’000
2018USD’000
2017USD’000
2018USD’000
2017USD’000
2018USD’000
2017USD’000
Revenue 833,409 682,272 961,146 762,151 3,851,725 3,284,363 – – – – 5,646,280 4,728,786Adjusted for separately
disclosed items – (14,053) – – – – – – – – – (14,053)Revenue before separately
disclosed items 833,409 668,219 961,146 762,151 3,851,725 3,284,363 – – – – 5,646,280 4,714,733
Adjusted EBITDA 591,956 434,989 340,151 291,485 2,013,863 1,917,640 (137,975) (175,080) – – 2,807,995 2,469,034Finance income – – – – – – 141,328 95,540 – – 141,328 95,540Finance costs – – – – – – (575,891) (425,410) – – (575,891) (425,410)Tax expense – – – – – – (223,607) (144,406) – – (223,607) (144,406)Depreciation and amortisation (105,960) (101,760) (117,225) (94,046) (585,387) (427,169) (8,463) (9,235) – – (817,035) (632,210)
Adjusted net profit/(loss) before separately disclosed items 485,996 333,229 222,926 197,439 1,428,476 1,490,471 (804,608) (658,591) – – 1,332,790 1,362,548
Adjusted for separately disclosed items (10,743) (13,313) (2,800) (32,384) (29,480) 10,369 67,850 3,526 – – 24,827 (31,802)
Profit/(loss) for the year 475,253 319,916 220,126 165,055 1,398,996 1,500,840 (736,758) (655,065) – – 1,357,617 1,330,746
Net finance cost and tax expense from various geographical locations and head office have been grouped under head office.
In the previous years, a deferred revenue provision was recognised in the ‘Asia Pacific and Indian subcontinent’ region in relation to the difference in revenue between the billed rates and the rates specified by the Tariff Authority order. Due to change in tariff regulatory environment, management has decided to reverse this provision in the current year.
Asia Pacific and Indian subcontinent
Australia and Americas
Middle East, Europe and Africa Head office Inter-segment Total
2018USD’000
2017USD’000
2018USD’000
2017USD’000
2018USD’000
2017USD’000
2018USD’000
2017USD’000
2018USD’000
2017USD’000
2018USD’000
2017USD’000
Segment assets 4,564,835 4,576,571 2,935,015 3,103,562 19,227,147 18,062,307 14,063,935 9,345,615 (14,277,593) (11,974,165) 26,513,339 23,113,890
Segment liabilities 479,486 661,767 725,366 643,515 6,381,328 4,042,232 11,345,791 8,693,264 (5,404,397) (3,554,677) 13,527,574 10,486,101
Tax liabilities* – – – – – – 986,847 1,002,427 – – 986,847 1,002,427
Total liabilities 479,486 661,767 725,366 643,515 6,381,328 4,042,232 12,332,638 9,695,691 (5,404,397) (3,554,677) 14,514,421 11,488,528
Capital expenditure 41,807 87,670 257,353 163,999 565,946 835,695 43,119 2,287 – – 908,225 1,089,651
Depreciation 45,624 43,022 88,634 64,801 478,383 339,645 8,464 9,234 – – 621,105 456,702
Amortisation/impairment 60,336 58,738 28,591 29,245 116,303 91,127 – – – – 205,230 179,110
Share of profit/(loss) of equity-accounted investees before separately disclosed items 128,797 117,365 2,986 (14,894) 33,284 21,121 – – – – 165,067 123,592
Tax expense – – – – – – 223,607 43,330 – – 223,607 43,330
Revenue consists of:Revenue from ports and
terminals 783,001 668,219 881,856 762,151 2,631,093 2,698,297 – – – – 4,295,950 4,128,667Service concessions revenue – 14,053 – – – – – – – – – 14,053Lease rentals and services
from economic zones – – – – 726,234 586,066 – – – – 726,234 586,066Drydocking and logistics
services 50,408 – 79,290 – 494,398 – – – – – 624,096 –Total revenue 833,409 682,272 961,146 762,151 3,851,725 3,284,363 – – – – 5,646,280 4,728,786
* Tax liabilities and tax expenses from various geographical locations have been grouped under head office.
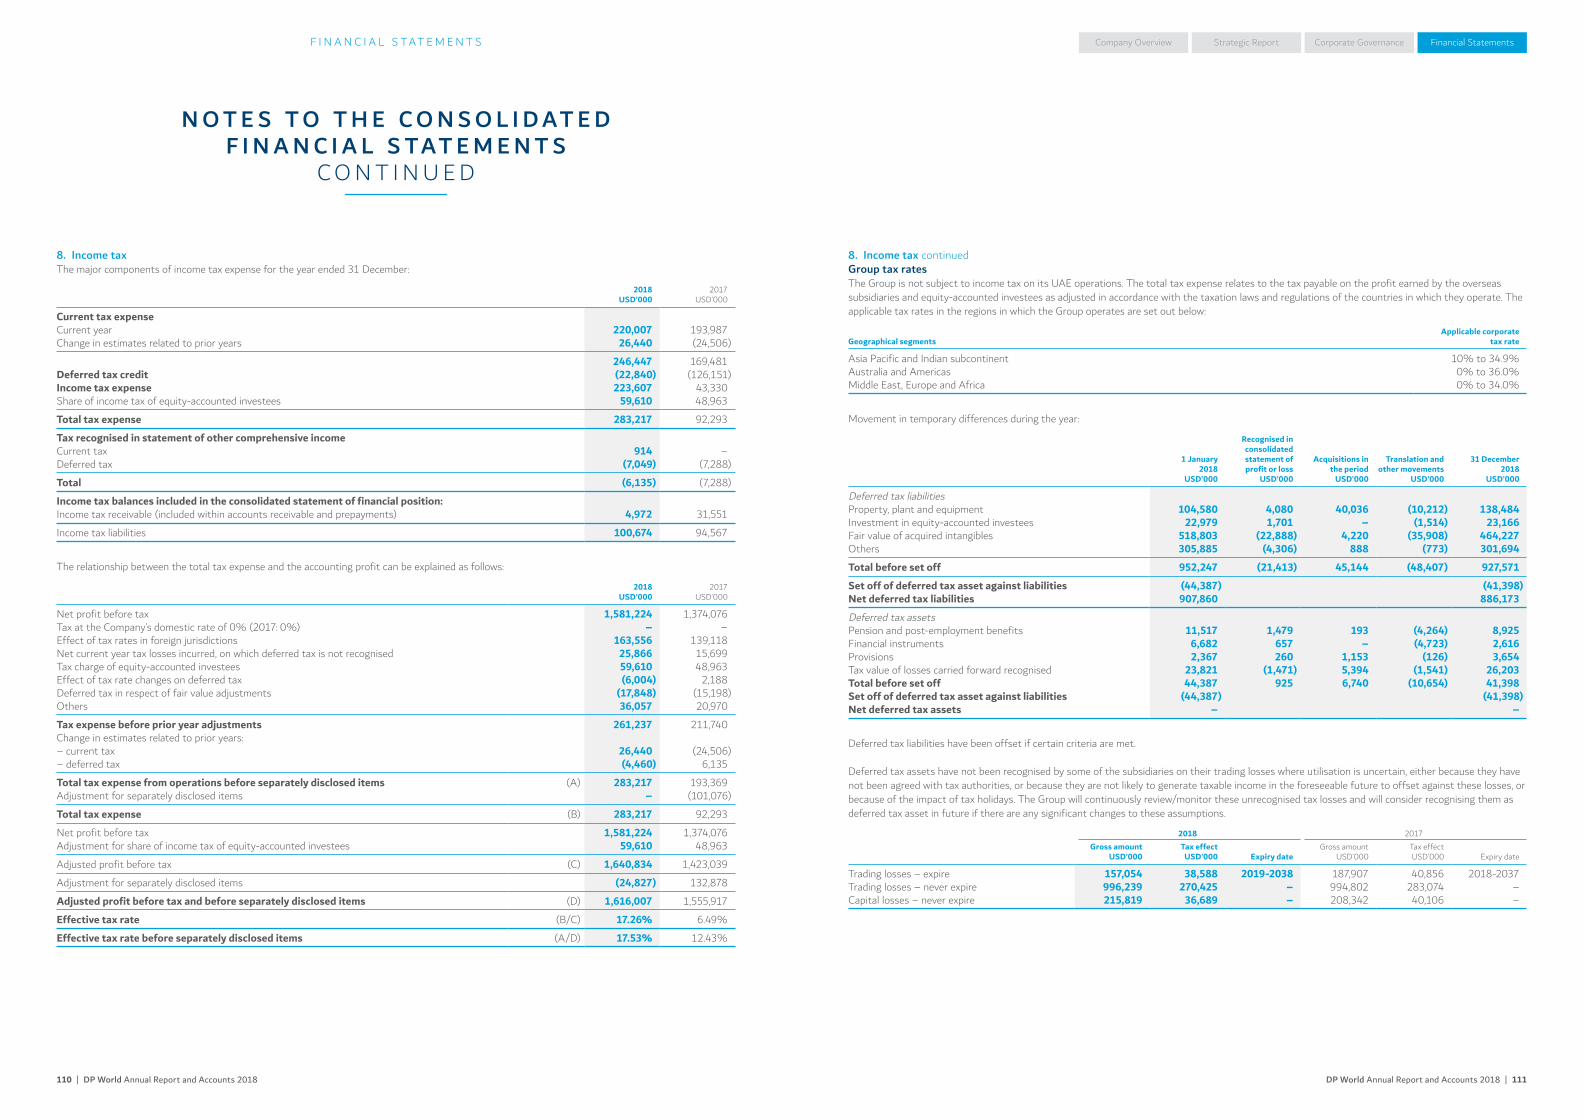
DP World Annual Report and Accounts 2018 | 111110 | DP World Annual Report and Accounts 2018
Company Overview Corporate Governance Financial StatementsStrategic ReportF I N A N C I A L S TAT E M E N T S
N O T E S T O T H E C O N S O L I D AT E D F I N A N C I A L S TAT E M E N T S
C O N T I N U E D
8. Income tax continuedGroup tax ratesThe Group is not subject to income tax on its UAE operations. The total tax expense relates to the tax payable on the profit earned by the overseas subsidiaries and equity-accounted investees as adjusted in accordance with the taxation laws and regulations of the countries in which they operate. The applicable tax rates in the regions in which the Group operates are set out below:
Geographical segmentsApplicable corporate
tax rate
Asia Pacific and Indian subcontinent 10% to 34.9%Australia and Americas 0% to 36.0%Middle East, Europe and Africa 0% to 34.0%
Movement in temporary differences during the year:
1 January2018
USD’000
Recognised in consolidated statement of profit or loss
USD’000
Acquisitions in the period
USD’000
Translation and other movements
USD’000
31 December2018
USD’000
Deferred tax liabilitiesProperty, plant and equipment 104,580 4,080 40,036 (10,212) 138,484Investment in equity-accounted investees 22,979 1,701 – (1,514) 23,166Fair value of acquired intangibles 518,803 (22,888) 4,220 (35,908) 464,227Others 305,885 (4,306) 888 (773) 301,694
Total before set off 952,247 (21,413) 45,144 (48,407) 927,571
Set off of deferred tax asset against liabilities (44,387) (41,398)Net deferred tax liabilities 907,860 886,173
Deferred tax assetsPension and post-employment benefits 11,517 1,479 193 (4,264) 8,925Financial instruments 6,682 657 – (4,723) 2,616Provisions 2,367 260 1,153 (126) 3,654Tax value of losses carried forward recognised 23,821 (1,471) 5,394 (1,541) 26,203Total before set off 44,387 925 6,740 (10,654) 41,398Set off of deferred tax asset against liabilities (44,387) (41,398)Net deferred tax assets – –
Deferred tax liabilities have been offset if certain criteria are met.
Deferred tax assets have not been recognised by some of the subsidiaries on their trading losses where utilisation is uncertain, either because they have not been agreed with tax authorities, or because they are not likely to generate taxable income in the foreseeable future to offset against these losses, or because of the impact of tax holidays. The Group will continuously review/monitor these unrecognised tax losses and will consider recognising them as deferred tax asset in future if there are any significant changes to these assumptions.
2018 2017
Gross amount
USD’000Tax effectUSD’000 Expiry date
Gross amountUSD’000
Tax effectUSD’000 Expiry date
Trading losses – expire 157,054 38,588 2019-2038 187,907 40,856 2018-2037Trading losses – never expire 996,239 270,425 – 994,802 283,074 –Capital losses – never expire 215,819 36,689 – 208,342 40,106 –
8. Income taxThe major components of income tax expense for the year ended 31 December:
2018USD’000
2017USD’000
Current tax expenseCurrent year 220,007 193,987Change in estimates related to prior years 26,440 (24,506)
246,447 169,481Deferred tax credit (22,840) (126,151)Income tax expense 223,607 43,330Share of income tax of equity-accounted investees 59,610 48,963
Total tax expense 283,217 92,293
Tax recognised in statement of other comprehensive incomeCurrent tax 914 –Deferred tax (7,049) (7,288)
Total (6,135) (7,288)
Income tax balances included in the consolidated statement of financial position:Income tax receivable (included within accounts receivable and prepayments) 4,972 31,551
Income tax liabilities 100,674 94,567
The relationship between the total tax expense and the accounting profit can be explained as follows:
2018USD’000
2017USD’000
Net profit before tax 1,581,224 1,374,076Tax at the Company’s domestic rate of 0% (2017: 0%) – –Effect of tax rates in foreign jurisdictions 163,556 139,118Net current year tax losses incurred, on which deferred tax is not recognised 25,866 15,699Tax charge of equity-accounted investees 59,610 48,963Effect of tax rate changes on deferred tax (6,004) 2,188Deferred tax in respect of fair value adjustments (17,848) (15,198)Others 36,057 20,970
Tax expense before prior year adjustments 261,237 211,740Change in estimates related to prior years:– current tax 26,440 (24,506)– deferred tax (4,460) 6,135
Total tax expense from operations before separately disclosed items (A) 283,217 193,369Adjustment for separately disclosed items – (101,076)
Total tax expense (B) 283,217 92,293
Net profit before tax 1,581,224 1,374,076Adjustment for share of income tax of equity-accounted investees 59,610 48,963
Adjusted profit before tax (C) 1,640,834 1,423,039
Adjustment for separately disclosed items (24,827) 132,878
Adjusted profit before tax and before separately disclosed items (D) 1,616,007 1,555,917
Effective tax rate (B/C) 17.26% 6.49%
Effective tax rate before separately disclosed items (A/D) 17.53% 12.43%

DP World Annual Report and Accounts 2018 | 113112 | DP World Annual Report and Accounts 2018
Company Overview Corporate Governance Financial StatementsStrategic ReportF I N A N C I A L S TAT E M E N T S
N O T E S T O T H E C O N S O L I D AT E D F I N A N C I A L S TAT E M E N T S
C O N T I N U E D
9. Separately disclosed items continuedFinance costs comprises:a) USD 22,068 thousand interest accretion on convertible bond represents the accretion of the liability component as at the reporting date to the
amount that will be payable on redemption of the convertible bond. (2017: USD 21,066 thousand interest accretion on convertible bond and USD 77,034 thousand change in fair value of convertible bond option based on the re-measured fair value of the embedded derivative liability of the convertible bonds).
b) USD 5,885 thousand deferred transaction costs written off on early settlement and restructuring of loans in the ‘Middle East, Europe and Africa’ region.
c) USD 1,432 thousand ineffective elements of hedges in subsidiaries in the ‘Middle East, Europe and Africa’ region.d) USD 4,271 thousand impairment loss recognised on present valuation of receivables in a subsidiary in the ‘Middle East, Europe and Africa’ region.
Income tax credit relates to the release of deferred tax liability on account of a tax rate change in 2017.
10. Dividends
2018USD’000
2017USD’000
Declared and paid during the year:Final dividend: 41 US cents per share/38 US cents per share 340,300 315,400Proposed for approval at the annual general meeting(not recognised as a liability as at 31 December):Final dividend: 43 US cents per share/41 US cents per share 356,900 340,300
11. Earnings per shareThe calculation of basic and diluted earnings per share is based on the profit attributable to ordinary shareholders and the weighted average number of ordinary shares outstanding.
2018Before separately
disclosed itemsUSD’000
2018Adjusted for
separately disclosed items
USD’000
2017Before separately
disclosed itemsUSD’000
2017Adjusted for
separatelydisclosed items
USD’000
Profit attributable to the ordinary shareholders of the Company (a) 1,270,116 1,296,481 1,208,517 1,176,715Adjustment for costs/(income) related to convertible bonds saved as a result of
the conversion 18,885 (76,521) 18,772 116,872Profit attributable to the ordinary shareholders of the Company after
conversion (b) 1,289,001 1,219,960 1,227,289 1,293,587Weighted average number of basic shares outstanding as at 31 December (c) 830,000,000 830,000,000 830,000,000 830,000,000Weighted average numbers of shares due to conversion of convertible bond** 37,475,985 37,475,985 36,846,510 36,846,510Total weighted average number of ordinary shares (diluted) outstanding – (d) 867,475,985 867,475,985 866,846,510 866,846,510Basic earnings per share US cents – (a/c) 153.03 156.20 145.60 141.77Diluted earnings per share US cents – (b/d) 148.59 140.63 141.58 141.77*Anti-diluted earnings per share US cents – (b/d) – – – 149.23
* Diluted earnings per share (adjusted for separately disclosed items) for the year ended 31 December 2017 is equal to basic earnings per share (adjusted for separately disclosed items) as it is antidilutive.
** Effective 26 March 2018, the weighted average numbers of shares due to conversion of convertible bond has increased due to the reduction of conversion price from USD 27.1396 per share to USD 26.6837 on account of increase in dividend to USD 0.41 per share.
9. Separately disclosed items
2018USD’000
2017USD’000
Revenue Construction contract revenue relating to service concessions – 14,053Cost of sales Construction contract costs relating to service concessions – (14,053)General and administrative expenses – Acquisition costs, restructuring and other provisions (28,520) (14,699)– Guaranteed minimum pension costs (27,744) –Other income – 3,433Loss on disposal and change in ownership of business (3,591) (28,234)Share of (loss)/profit from equity-accounted investees (9,578) 4,172Finance income 127,916 550Finance costs (33,656) (98,100)Income tax – 101,076
Total 24,827 (31,802)
Construction contract revenue and costs: In 2017, the Group has recorded revenue on the construction of a port in the ‘Asia Pacific and Indian subcontinent’ region in accordance with IFRIC 12 ‘Service Concession Arrangements’. The construction revenue represents the fair value of the construction services provided in developing the port. No margin has been recognised, as in management’s opinion the fair value of the construction services provided approximates the construction cost.
Acquisition costs, restructuring and other provisions represent advisory, legal, valuation, professional consulting, general and administrative costs directly related to various business acquisitions in the Group and other restructuring provisions. (2017 represent advisory, legal, valuation, professional consulting, general and administrative costs directly related to various business acquisitions in the Group and reversal of excess restructuring provisions in a subsidiary in the ‘Middle East, Europe and Africa’ region).
Guaranteed minimum pension costs relates to additional costs arising in respect of “guaranteed minimum pension” (GMP) based on a landmark High Court judgment confirming that UK pension schemes are required to equalise male and female members’ benefits for the effect of unequal GMPs.
Other income represents non-recurring income for subsidiaries in the ‘Middle East, Europe and Africa’ region in 2017.
Loss on disposal and change in ownership of business relates to the loss on sale of a subsidiary in the ‘Middle East, Europe and Africa’ region. (2017 relates to the loss on re-measurement to fair value of the existing stake resulting from the acquisition of a controlling stake in an equity-accounted investee in the ‘Australia and Americas’ region).
Share of (loss)/profit from equity-accounted investees relates to transaction costs written off on extinguishment of debt and impairment of property, plant and equipment in equity-accounted investees in the ‘Middle East, Europe and Africa’ region and loss on termination of hedge in an equity-accounted investee in the ‘Middle East, Europe and Africa’ region. (2017 relates to release of deferred tax liability due to tax rate change in an equity-accounted investee in the ‘Middle East, Europe and Africa’ region offset by impairment of goodwill in an equity-accounted investee in the ‘Asia Pacific and Indian subcontinent’ region).
Finance income comprises:a) USD 117,474 thousand change in fair value of convertible bond option relates to the movement based on the re-measured fair value of the embedded
derivative liability of the convertible bonds.b) USD 869 thousand (2017: USD 550 thousand) ineffective elements of hedges in subsidiaries in the ‘Middle East, Europe and Africa’ region and ‘Asia
Pacific and Indian subcontinent’ region.c) USD 9,573 thousand gain on early settlement of loans in a subsidiary in the ‘Middle East, Europe and Africa’ region.
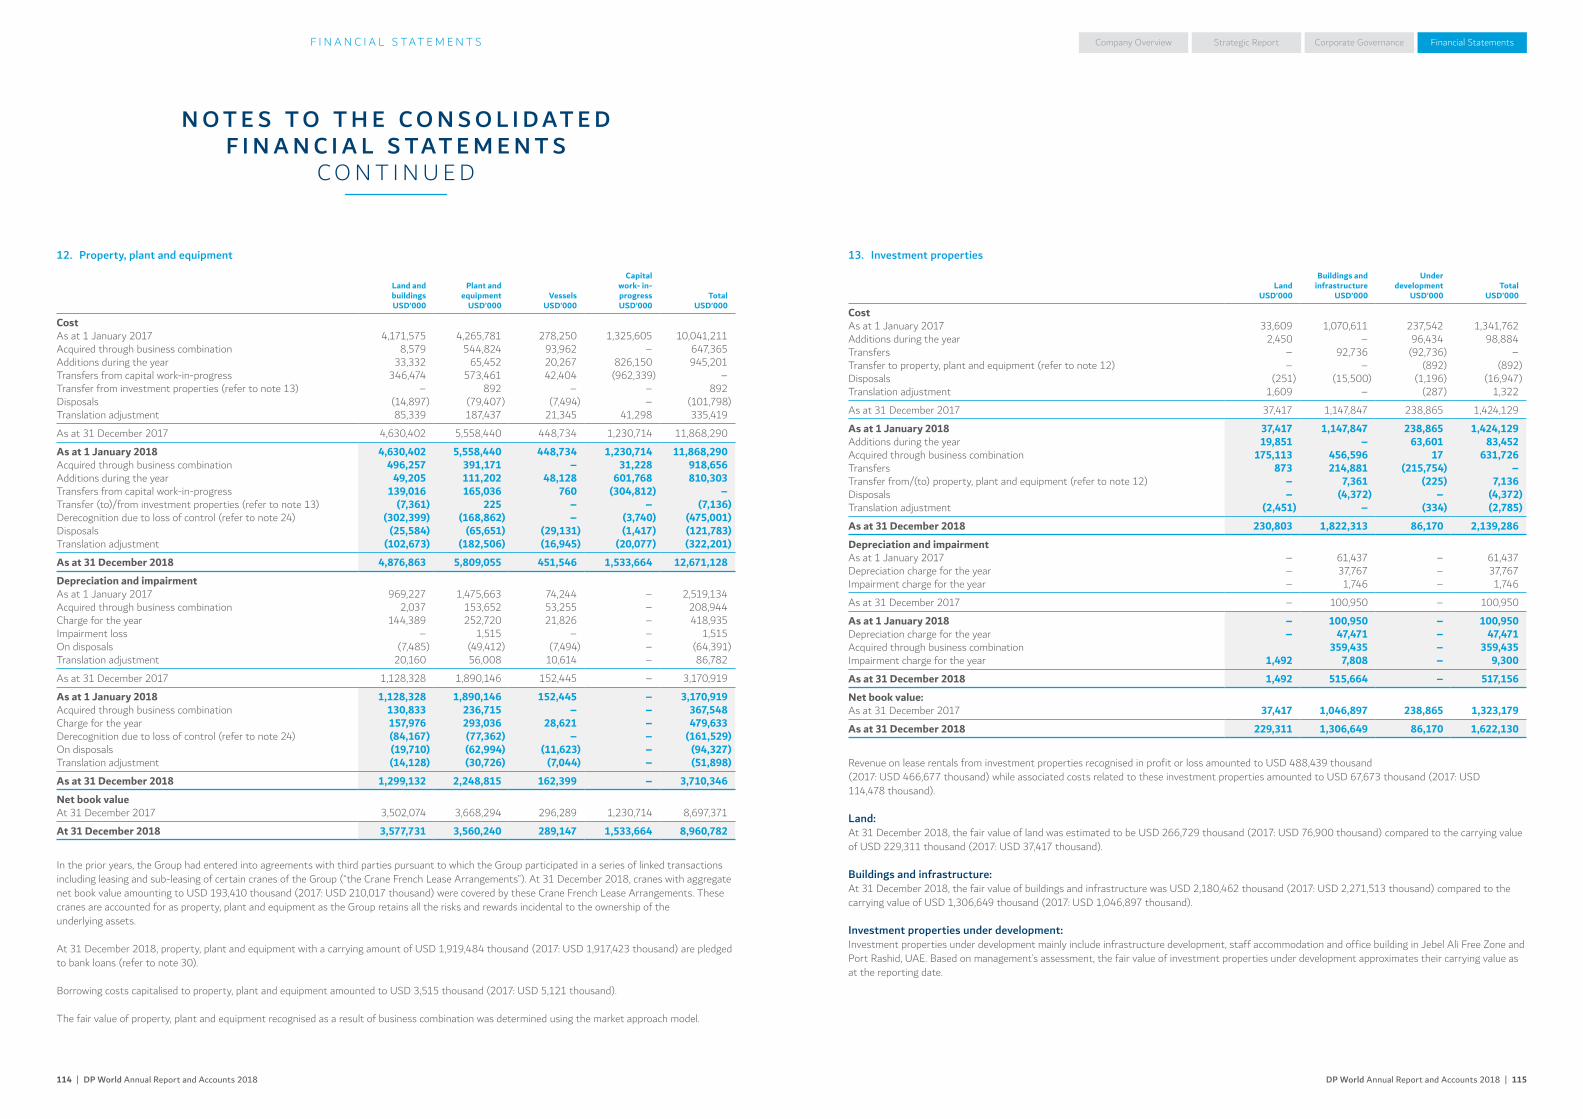
DP World Annual Report and Accounts 2018 | 115114 | DP World Annual Report and Accounts 2018
Company Overview Corporate Governance Financial StatementsStrategic ReportF I N A N C I A L S TAT E M E N T S
N O T E S T O T H E C O N S O L I D AT E D F I N A N C I A L S TAT E M E N T S
C O N T I N U E D
13. Investment properties
LandUSD’000
Buildings and infrastructure
USD’000
Under development
USD’000Total
USD’000
CostAs at 1 January 2017 33,609 1,070,611 237,542 1,341,762Additions during the year 2,450 – 96,434 98,884Transfers – 92,736 (92,736) –Transfer to property, plant and equipment (refer to note 12) – – (892) (892)Disposals (251) (15,500) (1,196) (16,947)Translation adjustment 1,609 – (287) 1,322
As at 31 December 2017 37,417 1,147,847 238,865 1,424,129
As at 1 January 2018 37,417 1,147,847 238,865 1,424,129Additions during the year 19,851 – 63,601 83,452Acquired through business combination 175,113 456,596 17 631,726Transfers 873 214,881 (215,754) –Transfer from/(to) property, plant and equipment (refer to note 12) – 7,361 (225) 7,136Disposals – (4,372) – (4,372)Translation adjustment (2,451) – (334) (2,785)
As at 31 December 2018 230,803 1,822,313 86,170 2,139,286
Depreciation and impairmentAs at 1 January 2017 – 61,437 – 61,437Depreciation charge for the year – 37,767 – 37,767Impairment charge for the year – 1,746 – 1,746
As at 31 December 2017 – 100,950 – 100,950
As at 1 January 2018 – 100,950 – 100,950Depreciation charge for the year – 47,471 – 47,471Acquired through business combination 359,435 – 359,435Impairment charge for the year 1,492 7,808 – 9,300
As at 31 December 2018 1,492 515,664 – 517,156
Net book value:As at 31 December 2017 37,417 1,046,897 238,865 1,323,179
As at 31 December 2018 229,311 1,306,649 86,170 1,622,130
Revenue on lease rentals from investment properties recognised in profit or loss amounted to USD 488,439 thousand (2017: USD 466,677 thousand) while associated costs related to these investment properties amounted to USD 67,673 thousand (2017: USD 114,478 thousand).
Land:At 31 December 2018, the fair value of land was estimated to be USD 266,729 thousand (2017: USD 76,900 thousand) compared to the carrying value of USD 229,311 thousand (2017: USD 37,417 thousand).
Buildings and infrastructure:At 31 December 2018, the fair value of buildings and infrastructure was USD 2,180,462 thousand (2017: USD 2,271,513 thousand) compared to the carrying value of USD 1,306,649 thousand (2017: USD 1,046,897 thousand).
Investment properties under development:Investment properties under development mainly include infrastructure development, staff accommodation and office building in Jebel Ali Free Zone and Port Rashid, UAE. Based on management’s assessment, the fair value of investment properties under development approximates their carrying value as at the reporting date.
12. Property, plant and equipment
Land and buildingsUSD’000
Plant and equipment
USD’000Vessels
USD’000
Capital work- in- progressUSD’000
TotalUSD’000
CostAs at 1 January 2017 4,171,575 4,265,781 278,250 1,325,605 10,041,211Acquired through business combination 8,579 544,824 93,962 – 647,365Additions during the year 33,332 65,452 20,267 826,150 945,201Transfers from capital work-in-progress 346,474 573,461 42,404 (962,339) –Transfer from investment properties (refer to note 13) – 892 – – 892Disposals (14,897) (79,407) (7,494) – (101,798)Translation adjustment 85,339 187,437 21,345 41,298 335,419
As at 31 December 2017 4,630,402 5,558,440 448,734 1,230,714 11,868,290
As at 1 January 2018 4,630,402 5,558,440 448,734 1,230,714 11,868,290Acquired through business combination 496,257 391,171 – 31,228 918,656Additions during the year 49,205 111,202 48,128 601,768 810,303Transfers from capital work-in-progress 139,016 165,036 760 (304,812) –Transfer (to)/from investment properties (refer to note 13) (7,361) 225 – – (7,136)Derecognition due to loss of control (refer to note 24) (302,399) (168,862) – (3,740) (475,001)Disposals (25,584) (65,651) (29,131) (1,417) (121,783)Translation adjustment (102,673) (182,506) (16,945) (20,077) (322,201)
As at 31 December 2018 4,876,863 5,809,055 451,546 1,533,664 12,671,128
Depreciation and impairmentAs at 1 January 2017 969,227 1,475,663 74,244 – 2,519,134Acquired through business combination 2,037 153,652 53,255 – 208,944Charge for the year 144,389 252,720 21,826 – 418,935Impairment loss – 1,515 – – 1,515On disposals (7,485) (49,412) (7,494) – (64,391)Translation adjustment 20,160 56,008 10,614 – 86,782
As at 31 December 2017 1,128,328 1,890,146 152,445 – 3,170,919
As at 1 January 2018 1,128,328 1,890,146 152,445 – 3,170,919Acquired through business combination 130,833 236,715 – – 367,548Charge for the year 157,976 293,036 28,621 – 479,633Derecognition due to loss of control (refer to note 24) (84,167) (77,362) – – (161,529)On disposals (19,710) (62,994) (11,623) – (94,327)Translation adjustment (14,128) (30,726) (7,044) – (51,898)
As at 31 December 2018 1,299,132 2,248,815 162,399 – 3,710,346
Net book valueAt 31 December 2017 3,502,074 3,668,294 296,289 1,230,714 8,697,371
At 31 December 2018 3,577,731 3,560,240 289,147 1,533,664 8,960,782
In the prior years, the Group had entered into agreements with third parties pursuant to which the Group participated in a series of linked transactions including leasing and sub-leasing of certain cranes of the Group (“the Crane French Lease Arrangements”). At 31 December 2018, cranes with aggregate net book value amounting to USD 193,410 thousand (2017: USD 210,017 thousand) were covered by these Crane French Lease Arrangements. These cranes are accounted for as property, plant and equipment as the Group retains all the risks and rewards incidental to the ownership of the underlying assets.
At 31 December 2018, property, plant and equipment with a carrying amount of USD 1,919,484 thousand (2017: USD 1,917,423 thousand) are pledged to bank loans (refer to note 30).
Borrowing costs capitalised to property, plant and equipment amounted to USD 3,515 thousand (2017: USD 5,121 thousand).
The fair value of property, plant and equipment recognised as a result of business combination was determined using the market approach model.
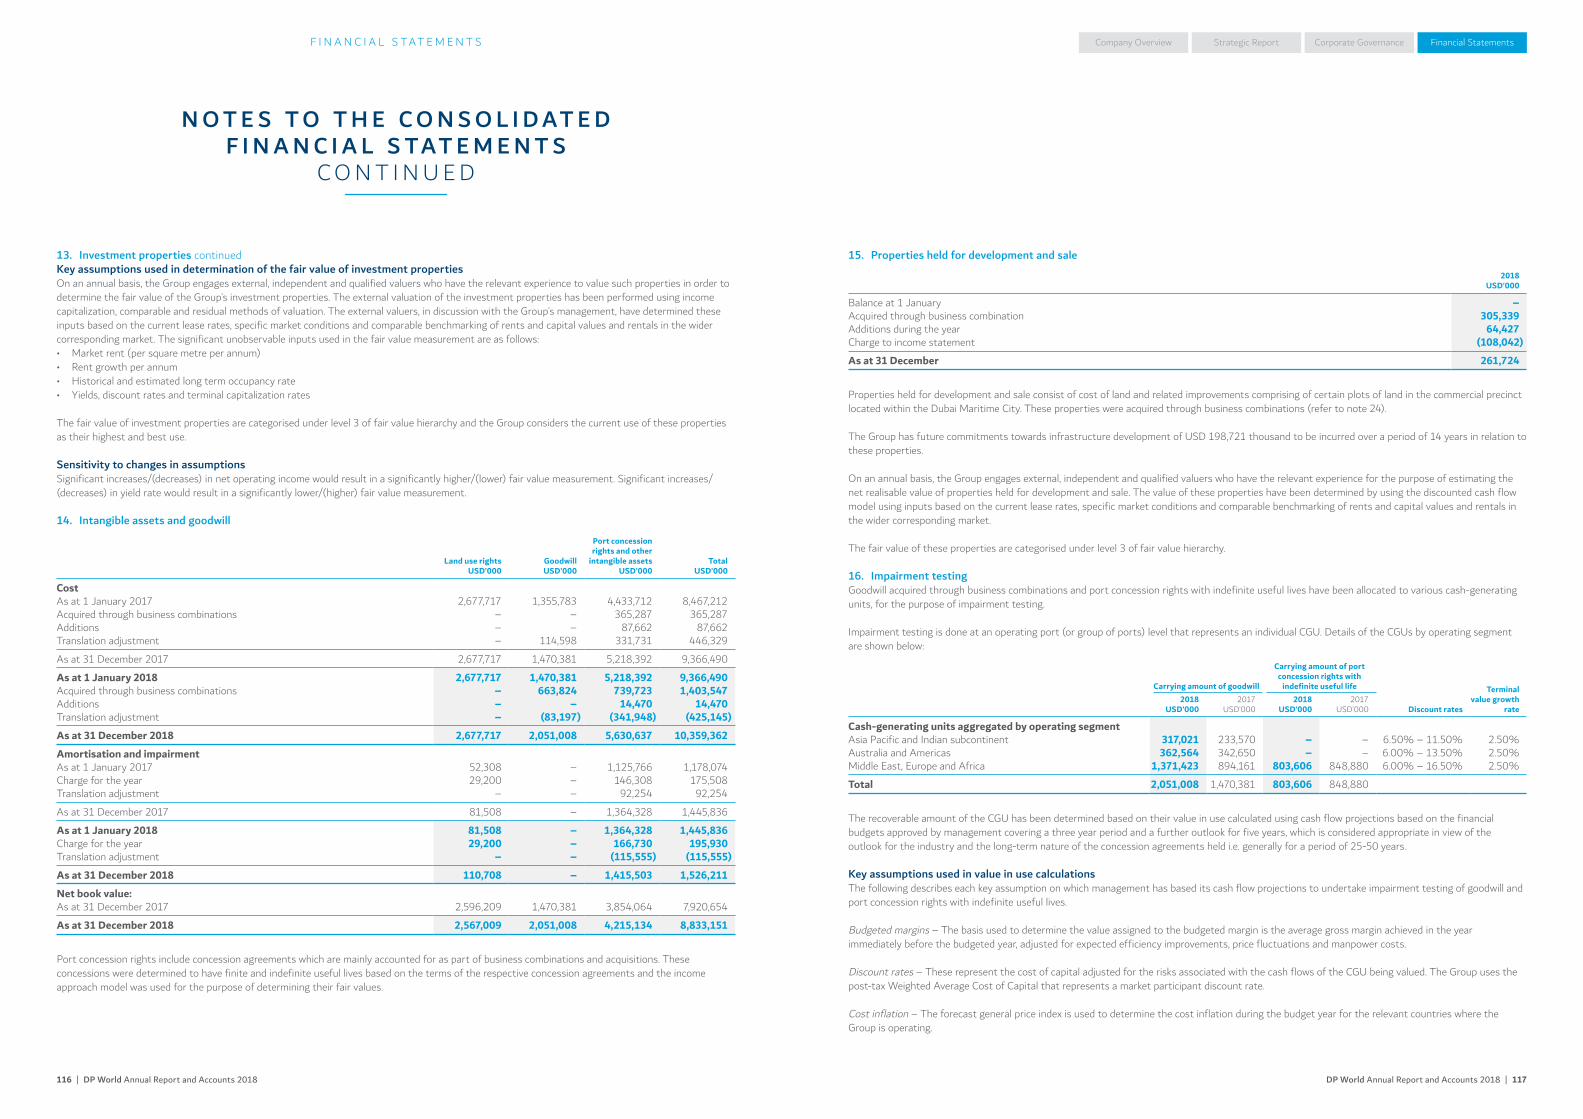
DP World Annual Report and Accounts 2018 | 117116 | DP World Annual Report and Accounts 2018
Company Overview Corporate Governance Financial StatementsStrategic ReportF I N A N C I A L S TAT E M E N T S
N O T E S T O T H E C O N S O L I D AT E D F I N A N C I A L S TAT E M E N T S
C O N T I N U E D
15. Properties held for development and sale
2018USD’000
Balance at 1 January –Acquired through business combination 305,339Additions during the year 64,427Charge to income statement (108,042)
As at 31 December 261,724
Properties held for development and sale consist of cost of land and related improvements comprising of certain plots of land in the commercial precinct located within the Dubai Maritime City. These properties were acquired through business combinations (refer to note 24).
The Group has future commitments towards infrastructure development of USD 198,721 thousand to be incurred over a period of 14 years in relation to these properties.
On an annual basis, the Group engages external, independent and qualified valuers who have the relevant experience for the purpose of estimating the net realisable value of properties held for development and sale. The value of these properties have been determined by using the discounted cash flow model using inputs based on the current lease rates, specific market conditions and comparable benchmarking of rents and capital values and rentals in the wider corresponding market.
The fair value of these properties are categorised under level 3 of fair value hierarchy.
16. Impairment testingGoodwill acquired through business combinations and port concession rights with indefinite useful lives have been allocated to various cash-generating units, for the purpose of impairment testing.
Impairment testing is done at an operating port (or group of ports) level that represents an individual CGU. Details of the CGUs by operating segment are shown below:
Carrying amount of goodwill
Carrying amount of port concession rights with
indefinite useful life
Discount rates
Terminal value growth
rate2018
USD’0002017
USD’0002018
USD’0002017
USD’000
Cash-generating units aggregated by operating segmentAsia Pacific and Indian subcontinent 317,021 233,570 – – 6.50% – 11.50% 2.50% Australia and Americas 362,564 342,650 – – 6.00% – 13.50% 2.50%Middle East, Europe and Africa 1,371,423 894,161 803,606 848,880 6.00% – 16.50% 2.50%
Total 2,051,008 1,470,381 803,606 848,880
The recoverable amount of the CGU has been determined based on their value in use calculated using cash flow projections based on the financial budgets approved by management covering a three year period and a further outlook for five years, which is considered appropriate in view of the outlook for the industry and the long-term nature of the concession agreements held i.e. generally for a period of 25-50 years.
Key assumptions used in value in use calculationsThe following describes each key assumption on which management has based its cash flow projections to undertake impairment testing of goodwill and port concession rights with indefinite useful lives.
Budgeted margins – The basis used to determine the value assigned to the budgeted margin is the average gross margin achieved in the year immediately before the budgeted year, adjusted for expected efficiency improvements, price fluctuations and manpower costs.
Discount rates – These represent the cost of capital adjusted for the risks associated with the cash flows of the CGU being valued. The Group uses the post-tax Weighted Average Cost of Capital that represents a market participant discount rate.
Cost inflation – The forecast general price index is used to determine the cost inflation during the budget year for the relevant countries where the Group is operating.
13. Investment properties continuedKey assumptions used in determination of the fair value of investment propertiesOn an annual basis, the Group engages external, independent and qualified valuers who have the relevant experience to value such properties in order to determine the fair value of the Group’s investment properties. The external valuation of the investment properties has been performed using income capitalization, comparable and residual methods of valuation. The external valuers, in discussion with the Group’s management, have determined these inputs based on the current lease rates, specific market conditions and comparable benchmarking of rents and capital values and rentals in the wider corresponding market. The significant unobservable inputs used in the fair value measurement are as follows:• Market rent (per square metre per annum)• Rent growth per annum• Historical and estimated long term occupancy rate• Yields, discount rates and terminal capitalization rates
The fair value of investment properties are categorised under level 3 of fair value hierarchy and the Group considers the current use of these properties as their highest and best use.
Sensitivity to changes in assumptionsSignificant increases/(decreases) in net operating income would result in a significantly higher/(lower) fair value measurement. Significant increases/(decreases) in yield rate would result in a significantly lower/(higher) fair value measurement.
14. Intangible assets and goodwill
Land use rightsUSD’000
GoodwillUSD’000
Port concession rights and other
intangible assetsUSD’000
TotalUSD’000
CostAs at 1 January 2017 2,677,717 1,355,783 4,433,712 8,467,212Acquired through business combinations – – 365,287 365,287Additions – – 87,662 87,662Translation adjustment – 114,598 331,731 446,329
As at 31 December 2017 2,677,717 1,470,381 5,218,392 9,366,490
As at 1 January 2018 2,677,717 1,470,381 5,218,392 9,366,490Acquired through business combinations – 663,824 739,723 1,403,547Additions – – 14,470 14,470Translation adjustment – (83,197) (341,948) (425,145)
As at 31 December 2018 2,677,717 2,051,008 5,630,637 10,359,362
Amortisation and impairmentAs at 1 January 2017 52,308 – 1,125,766 1,178,074Charge for the year 29,200 – 146,308 175,508Translation adjustment – – 92,254 92,254
As at 31 December 2017 81,508 – 1,364,328 1,445,836
As at 1 January 2018 81,508 – 1,364,328 1,445,836Charge for the year 29,200 – 166,730 195,930Translation adjustment – – (115,555) (115,555)
As at 31 December 2018 110,708 – 1,415,503 1,526,211
Net book value:As at 31 December 2017 2,596,209 1,470,381 3,854,064 7,920,654
As at 31 December 2018 2,567,009 2,051,008 4,215,134 8,833,151
Port concession rights include concession agreements which are mainly accounted for as part of business combinations and acquisitions. These concessions were determined to have finite and indefinite useful lives based on the terms of the respective concession agreements and the income approach model was used for the purpose of determining their fair values.
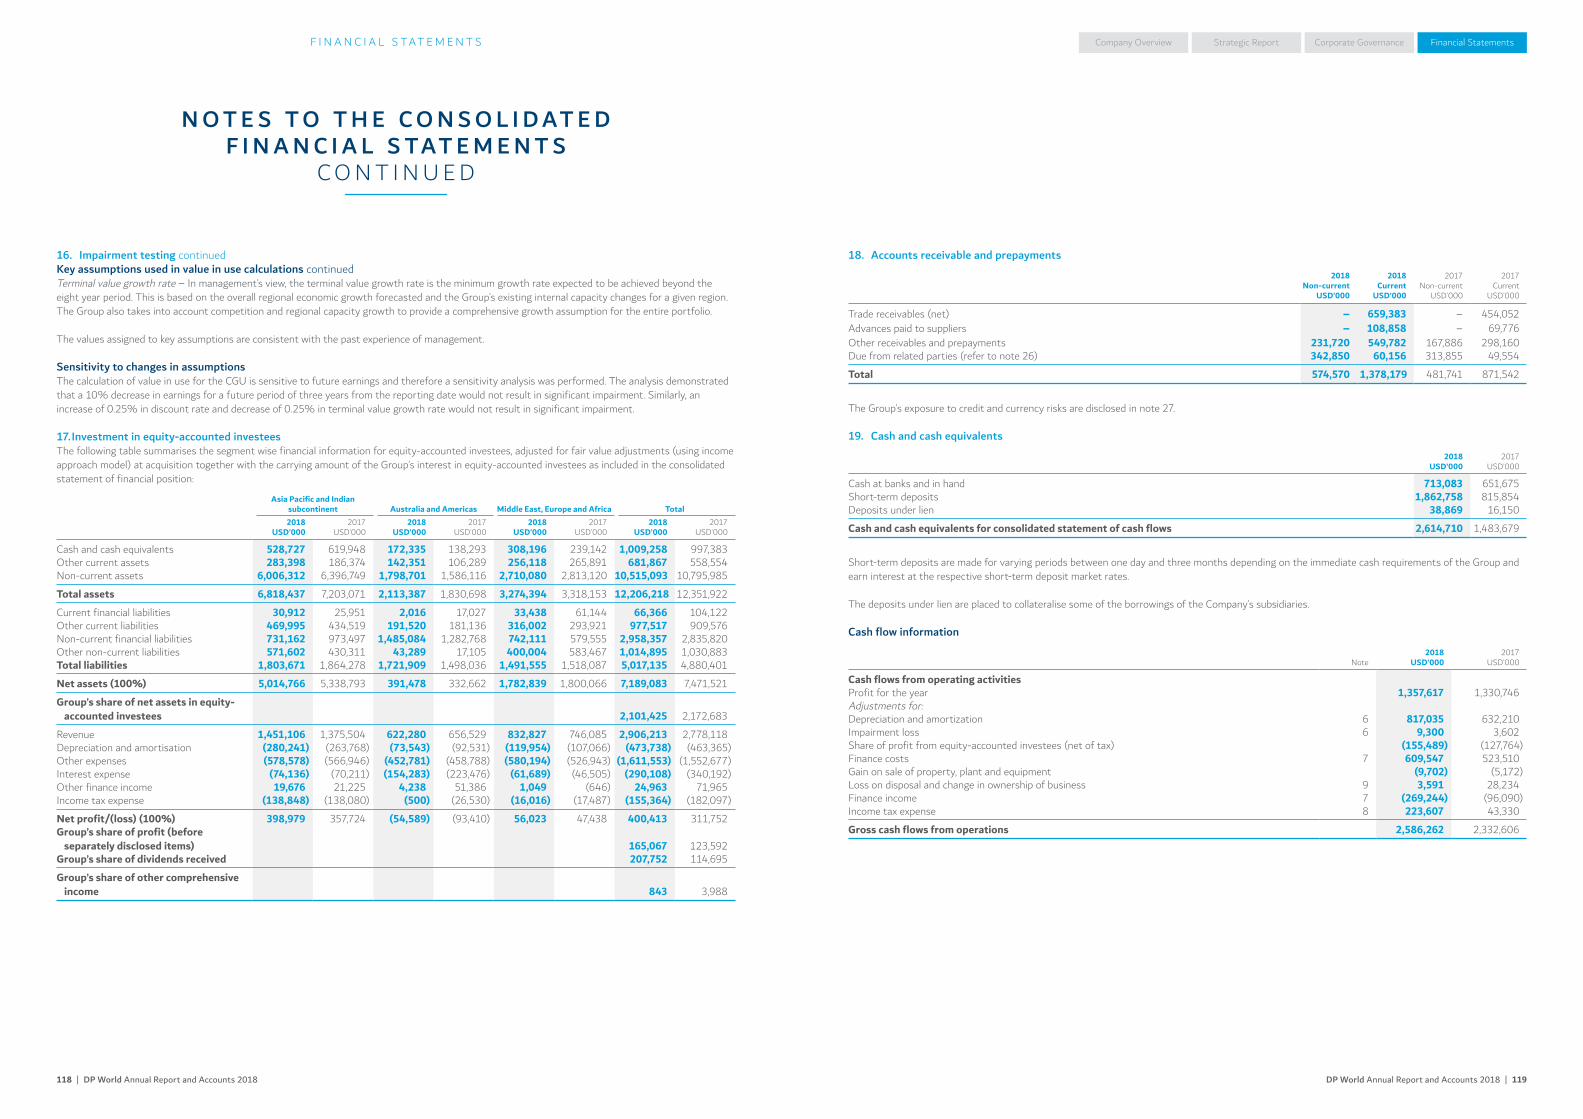
DP World Annual Report and Accounts 2018 | 119118 | DP World Annual Report and Accounts 2018
Company Overview Corporate Governance Financial StatementsStrategic ReportF I N A N C I A L S TAT E M E N T S
N O T E S T O T H E C O N S O L I D AT E D F I N A N C I A L S TAT E M E N T S
C O N T I N U E D
18. Accounts receivable and prepayments
2018Non-current
USD’000
2018Current
USD’000
2017Non-current
USD’000
2017Current
USD’000
Trade receivables (net) – 659,383 – 454,052Advances paid to suppliers – 108,858 – 69,776Other receivables and prepayments 231,720 549,782 167,886 298,160Due from related parties (refer to note 26) 342,850 60,156 313,855 49,554
Total 574,570 1,378,179 481,741 871,542
The Group’s exposure to credit and currency risks are disclosed in note 27.
19. Cash and cash equivalents
2018USD’000
2017USD’000
Cash at banks and in hand 713,083 651,675Short-term deposits 1,862,758 815,854Deposits under lien 38,869 16,150
Cash and cash equivalents for consolidated statement of cash flows 2,614,710 1,483,679
Short-term deposits are made for varying periods between one day and three months depending on the immediate cash requirements of the Group and earn interest at the respective short-term deposit market rates.
The deposits under lien are placed to collateralise some of the borrowings of the Company’s subsidiaries.
Cash flow information
Note2018
USD’0002017
USD’000
Cash flows from operating activitiesProfit for the year 1,357,617 1,330,746Adjustments for:Depreciation and amortization 6 817,035 632,210Impairment loss 6 9,300 3,602Share of profit from equity-accounted investees (net of tax) (155,489) (127,764)Finance costs 7 609,547 523,510Gain on sale of property, plant and equipment (9,702) (5,172)Loss on disposal and change in ownership of business 9 3,591 28,234Finance income 7 (269,244) (96,090)Income tax expense 8 223,607 43,330
Gross cash flows from operations 2,586,262 2,332,606
16. Impairment testing continuedKey assumptions used in value in use calculations continuedTerminal value growth rate – In management’s view, the terminal value growth rate is the minimum growth rate expected to be achieved beyond the eight year period. This is based on the overall regional economic growth forecasted and the Group’s existing internal capacity changes for a given region. The Group also takes into account competition and regional capacity growth to provide a comprehensive growth assumption for the entire portfolio.
The values assigned to key assumptions are consistent with the past experience of management.
Sensitivity to changes in assumptionsThe calculation of value in use for the CGU is sensitive to future earnings and therefore a sensitivity analysis was performed. The analysis demonstrated that a 10% decrease in earnings for a future period of three years from the reporting date would not result in significant impairment. Similarly, an increase of 0.25% in discount rate and decrease of 0.25% in terminal value growth rate would not result in significant impairment.
17. Investment in equity-accounted investeesThe following table summarises the segment wise financial information for equity-accounted investees, adjusted for fair value adjustments (using income approach model) at acquisition together with the carrying amount of the Group’s interest in equity-accounted investees as included in the consolidated statement of financial position:
Asia Pacific and Indian subcontinent Australia and Americas Middle East, Europe and Africa Total2018
USD’0002017
USD’0002018
USD’0002017
USD’0002018
USD’0002017
USD’0002018
USD’0002017
USD’000
Cash and cash equivalents 528,727 619,948 172,335 138,293 308,196 239,142 1,009,258 997,383Other current assets 283,398 186,374 142,351 106,289 256,118 265,891 681,867 558,554Non-current assets 6,006,312 6,396,749 1,798,701 1,586,116 2,710,080 2,813,120 10,515,093 10,795,985
Total assets 6,818,437 7,203,071 2,113,387 1,830,698 3,274,394 3,318,153 12,206,218 12,351,922
Current financial liabilities 30,912 25,951 2,016 17,027 33,438 61,144 66,366 104,122Other current liabilities 469,995 434,519 191,520 181,136 316,002 293,921 977,517 909,576Non-current financial liabilities 731,162 973,497 1,485,084 1,282,768 742,111 579,555 2,958,357 2,835,820Other non-current liabilities 571,602 430,311 43,289 17,105 400,004 583,467 1,014,895 1,030,883Total liabilities 1,803,671 1,864,278 1,721,909 1,498,036 1,491,555 1,518,087 5,017,135 4,880,401
Net assets (100%) 5,014,766 5,338,793 391,478 332,662 1,782,839 1,800,066 7,189,083 7,471,521
Group’s share of net assets in equity-accounted investees 2,101,425 2,172,683
Revenue 1,451,106 1,375,504 622,280 656,529 832,827 746,085 2,906,213 2,778,118Depreciation and amortisation (280,241) (263,768) (73,543) (92,531) (119,954) (107,066) (473,738) (463,365)Other expenses (578,578) (566,946) (452,781) (458,788) (580,194) (526,943) (1,611,553) (1,552,677)Interest expense (74,136) (70,211) (154,283) (223,476) (61,689) (46,505) (290,108) (340,192)Other finance income 19,676 21,225 4,238 51,386 1,049 (646) 24,963 71,965Income tax expense (138,848) (138,080) (500) (26,530) (16,016) (17,487) (155,364) (182,097)
Net profit/(loss) (100%) 398,979 357,724 (54,589) (93,410) 56,023 47,438 400,413 311,752Group’s share of profit (before
separately disclosed items) 165,067 123,592Group’s share of dividends received 207,752 114,695
Group’s share of other comprehensive income 843 3,988

DP World Annual Report and Accounts 2018 | 121120 | DP World Annual Report and Accounts 2018
Company Overview Corporate Governance Financial StatementsStrategic ReportF I N A N C I A L S TAT E M E N T S
N O T E S T O T H E C O N S O L I D AT E D F I N A N C I A L S TAT E M E N T S
C O N T I N U E D
21. Pension and post-employment benefits continuedb) Merchant Navy Officers’ Pension Fund (“MNOPF Scheme”) continuedFollowing earlier actuarial valuations in 2009 and 2012 the Trustee and Employers agreed contributions to be paid to the Section by participating employers over the period to 30 September 2023. These contributions included an allowance for the impact of irrecoverable contributions in respect of companies no longer in existence or not able to pay their share. In September 2017, the Trustee offered a settlement sum of USD 18,839 thousand to the Group which would clear the outstanding contributions (due payable bi-annually to September 2023) and save the Group USD 2,653 thousand in future interest payments. The Group agreed and settled the payment on 28 September 2017. There are no outstanding contributions due by the Group in 2019.
The triennial actuarial valuation as at 31 March 2018 is yet to be finalised. The initial indications given by the Trustee Board is that, there is an immaterial deficit.
In 2016, Group has accounted for an amount of USD 91,281 thousand as an additional defined benefit obligation with regards to reapportionment of deficit contribution from a related party. In April 2017, this liability was borne and paid by the Parent Company.
The Group’s share of the net deficit of the MNOPF Scheme at 31 December 2018 is estimated at 5.36%.
c) Merchant Navy Ratings’ Pension Fund (“MNRPF Scheme”)The MNRPF Scheme is an industry wide multi-employer defined benefit pension scheme in which sea staff employed by companies within the Group have participated. The scheme has a significant funding deficit and has been closed to further benefit accrual from 2001.
Certain Group companies, which are no longer current employers in the MNRPF Scheme had settled their statutory debt obligation and were not considered to have any legal obligation with respect to the on-going deficit in the fund. However, following a legal challenge, by Stena Line Limited, the High Court decided that the Trustee could require all employers that had ever participated in the scheme to make contributions to fund the deficit. Although the Group appealed, the decision was not overturned.
The Group’s deficit contributions arising from the 31 March 2014 valuation totalled USD 36,187 thousand. The most recent formal actuarial valuation was carried out as at 31 March 2017. The Group’s deficit contributions arising from this valuation totalled USD 9,874 thousand. The contributions due to the Scheme in respect of this valuation will be paid over the period to 31 October 2023. The combined total annual deficit contributions arising from the 2014 and 2017 actuarial valuations to be paid in 2019 of USD 5,862 thousand, in 2020 to 2022 of USD 5,716 thousand per annum and USD 1,181 thousand in 2023.
The Trustee set the payment terms for each participating employer in accordance with the Trustee’s Contribution Collection Policy which includes credit vetting.
The Group’s share of the net deficit of the New Section at 31 December 2018 is estimated at 7.38%.
d) OthersThe Group also operates a number of smaller defined benefit and defined contribution schemes.
The board of a pension scheme in the UK is required by law to act in the best interests of the fund participants and is responsible for setting certain policies (e.g. investment, contributions and indexation policies) and determining recovery plans, if appropriate.
These defined benefit schemes expose the Group to actuarial risks, such as longevity risk, currency risk, interest rate risk and market (investment) risk. In addition, by participating in certain multi-employer industry schemes, the Group can be exposed to a pro-rata share of the credit risk of other participating employers.
20. Employees’ end of service benefitsMovements in the provision recognised in the consolidated statement of financial position are as follows:
2018USD’000
2017USD’000
As at 1 January 122,230 112,594Transferred on acquisition of entities under common control 35,612 –Provision made during the year 35,446 20,560Amounts paid during the year (31,659) (12,607)Actuarial loss on defined benefit plan 2,048 –Translation (4,444) 1,683
As at 31 December 159,233 122,230
In accordance with the provisions of IAS 19, management has carried out an exercise to assess the present value of its obligations at 31 December 2018 in respect of employees’ end of service benefits payable under relevant local regulations and contractual arrangements. The assessment assumed expected salary increases averaging 3.50% and a discount rate of 3.75% per annum. The present values of the defined benefit obligations at 31 December 2018 were computed using the actuarial assumptions set out above.
In addition to the above, the Group contributes 15% of the ‘contribution calculation salary’ in case of those employees who are UAE nationals. These employees are also required to contribute 5% of the ‘contribution calculation salary’ to the scheme. The Group’s contribution is recognised as an expense in the consolidated statement of profit or loss as incurred.
21. Pension and post-employment benefitsThe Group participates in a number of pension schemes throughout the world.
a) P&O Pension SchemeThis principal scheme is located in the UK (the “P&O UK Scheme”). The P&O UK Scheme is a funded defined benefit scheme and was closed to routine new members on 1 January 2002 and to future accrual on 31 December 2015. The pension fund is legally separated from the Group and managed by a Trustee board. The assets of the scheme are managed on behalf of the Trustee by independent fund managers.
Formal actuarial valuations of the P&O UK scheme are normally carried out triennially by qualified independent actuaries, the most recent valuation was at 31 March 2016 using the projected unit credit method. The deficit on a statutory funding objectives basis was USD 116,362 thousand. The Group agreed with the Trustee to a new monthly deficit payment plan effective from 1 April 2016 of USD 11,508 thousand until 31 March 2020, then increasing to a total of USD 13,107 thousand until 31 March 2024 and then increasing to USD 15,344 thousand a year until 30 November 2026.
In December 2007, as part of a process developed with the Group to de-risk the pension scheme, the Trustee transferred USD 1,600,000 thousand of P&O UK Scheme assets to Paternoster (UK) Ltd, in exchange for a bulk annuity insurance policy to ensure that the assets (in the Company’s statement of financial position and in the Scheme) will always be equal to the current value of the liability of the pensions in payment at 30 June 2007, thus removing the funding risks for these liabilities.
In 2017, the Group entered into a Flexible Apportionment Arrangement which enabled a related party to withdraw as an employer from the P&O Pension Scheme, following which all current and future deficit liabilities of the Scheme were taken over by the Group with an additional cash contribution of USD 17,583 thousand.
b) Merchant Navy Officers’ Pension Fund (“MNOPF Scheme”)The Group participates in various industry multi-employer schemes, the most significant of which is the New Section of the MNOPF Scheme and is in the UK. These generally have assets held in separate trustee administered funds which are legally separated from the Group.
It is an industry wide multi-employer defined benefit scheme in which officers employed by companies within the Group have participated.
The most recent formal actuarial valuation of the New Section of MNOPF Scheme was carried out as at 31 March 2015. This resulted in a deficit of USD 4,058 thousand. The Trustee Board believe their investment strategy will address this deficit and therefore has not issued deficit contribution notices to employers in respect of the 2015 actuarial valuation. The New Section of the MNOPF Scheme closed to future accrual in April 2016.
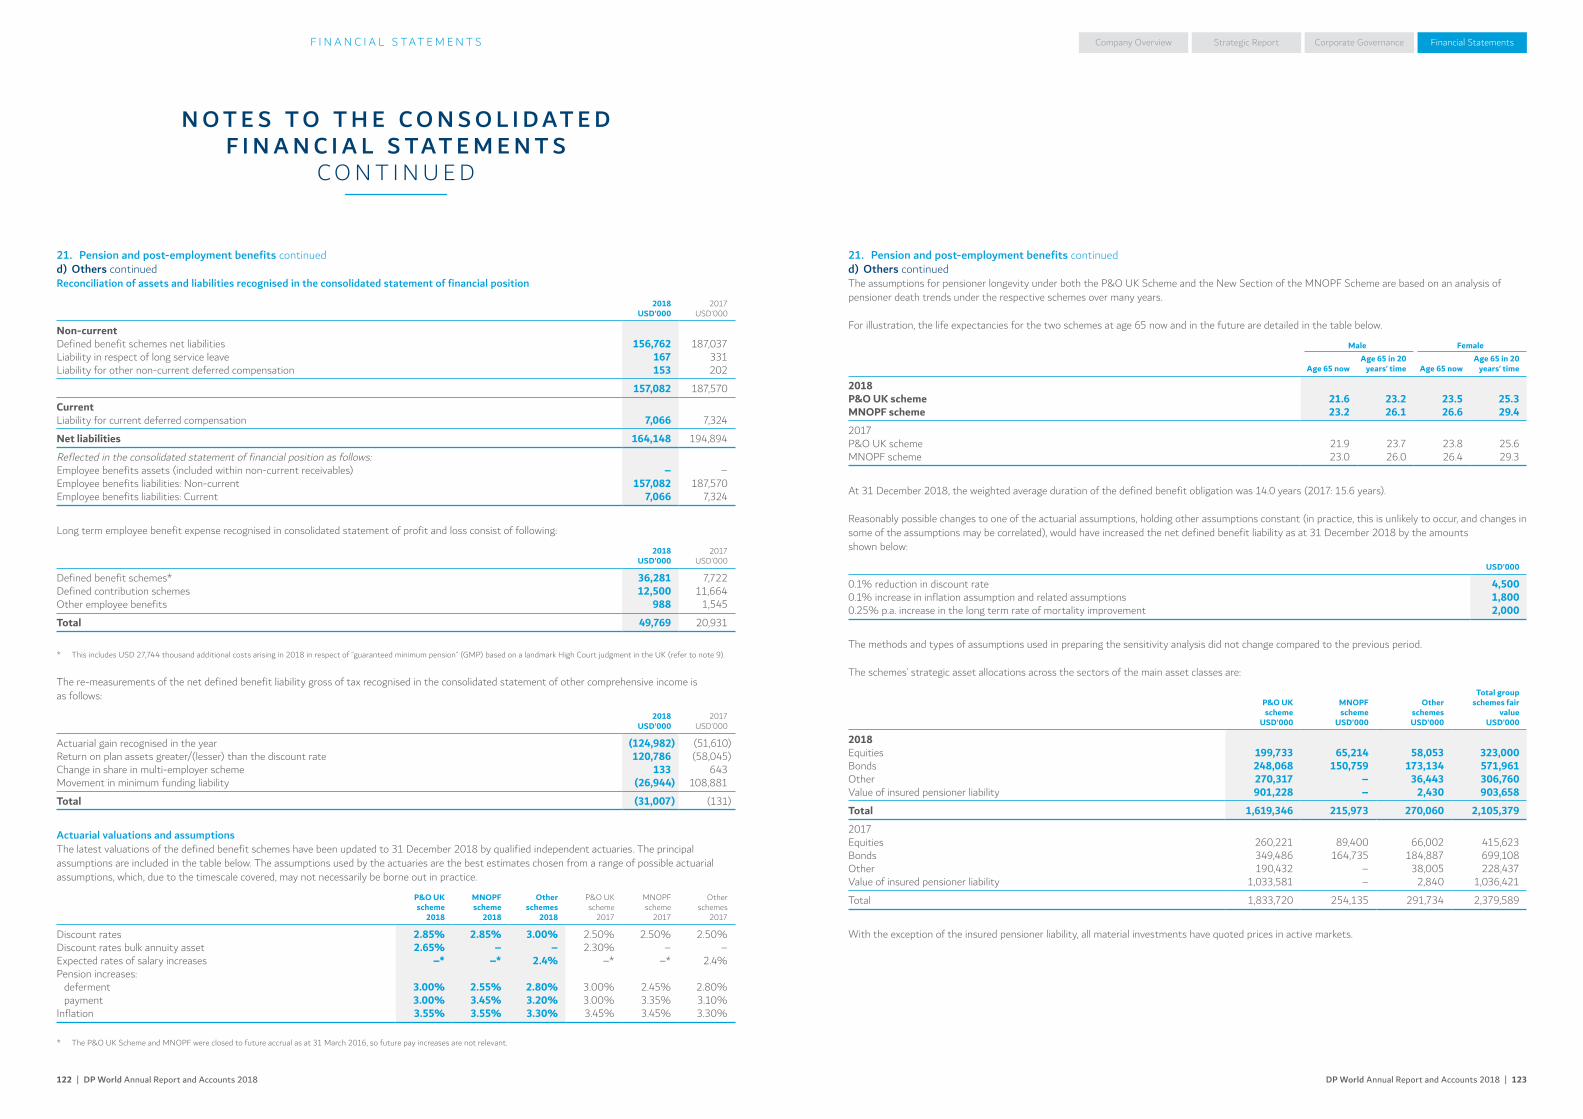
DP World Annual Report and Accounts 2018 | 123122 | DP World Annual Report and Accounts 2018
Company Overview Corporate Governance Financial StatementsStrategic ReportF I N A N C I A L S TAT E M E N T S
N O T E S T O T H E C O N S O L I D AT E D F I N A N C I A L S TAT E M E N T S
C O N T I N U E D
21. Pension and post-employment benefits continuedd) Others continuedThe assumptions for pensioner longevity under both the P&O UK Scheme and the New Section of the MNOPF Scheme are based on an analysis of pensioner death trends under the respective schemes over many years.
For illustration, the life expectancies for the two schemes at age 65 now and in the future are detailed in the table below.
Male Female
Age 65 nowAge 65 in 20
years’ time Age 65 nowAge 65 in 20
years’ time
2018P&O UK scheme 21.6 23.2 23.5 25.3MNOPF scheme 23.2 26.1 26.6 29.4
2017P&O UK scheme 21.9 23.7 23.8 25.6MNOPF scheme 23.0 26.0 26.4 29.3
At 31 December 2018, the weighted average duration of the defined benefit obligation was 14.0 years (2017: 15.6 years).
Reasonably possible changes to one of the actuarial assumptions, holding other assumptions constant (in practice, this is unlikely to occur, and changes in some of the assumptions may be correlated), would have increased the net defined benefit liability as at 31 December 2018 by the amounts shown below:
USD’000
0.1% reduction in discount rate 4,5000.1% increase in inflation assumption and related assumptions 1,8000.25% p.a. increase in the long term rate of mortality improvement 2,000
The methods and types of assumptions used in preparing the sensitivity analysis did not change compared to the previous period.
The schemes’ strategic asset allocations across the sectors of the main asset classes are:
P&O UK scheme
USD’000
MNOPF scheme
USD’000
Other schemesUSD’000
Total group schemes fair
valueUSD’000
2018Equities 199,733 65,214 58,053 323,000 Bonds 248,068 150,759 173,134 571,961 Other 270,317 – 36,443 306,760 Value of insured pensioner liability 901,228 – 2,430 903,658
Total 1,619,346 215,973 270,060 2,105,379
2017Equities 260,221 89,400 66,002 415,623Bonds 349,486 164,735 184,887 699,108Other 190,432 – 38,005 228,437Value of insured pensioner liability 1,033,581 – 2,840 1,036,421
Total 1,833,720 254,135 291,734 2,379,589
With the exception of the insured pensioner liability, all material investments have quoted prices in active markets.
21. Pension and post-employment benefits continuedd) Others continuedReconciliation of assets and liabilities recognised in the consolidated statement of financial position
2018USD’000
2017USD’000
Non-currentDefined benefit schemes net liabilities 156,762 187,037Liability in respect of long service leave 167 331Liability for other non-current deferred compensation 153 202
157,082 187,570
CurrentLiability for current deferred compensation 7,066 7,324
Net liabilities 164,148 194,894
Reflected in the consolidated statement of financial position as follows:Employee benefits assets (included within non-current receivables) – –Employee benefits liabilities: Non-current 157,082 187,570Employee benefits liabilities: Current 7,066 7,324
Long term employee benefit expense recognised in consolidated statement of profit and loss consist of following:
2018USD’000
2017USD’000
Defined benefit schemes* 36,281 7,722Defined contribution schemes 12,500 11,664Other employee benefits 988 1,545
Total 49,769 20,931
* This includes USD 27,744 thousand additional costs arising in 2018 in respect of “guaranteed minimum pension” (GMP) based on a landmark High Court judgment in the UK (refer to note 9).
The re-measurements of the net defined benefit liability gross of tax recognised in the consolidated statement of other comprehensive income is as follows:
2018USD’000
2017USD’000
Actuarial gain recognised in the year (124,982) (51,610)Return on plan assets greater/(lesser) than the discount rate 120,786 (58,045)Change in share in multi-employer scheme 133 643Movement in minimum funding liability (26,944) 108,881
Total (31,007) (131)
Actuarial valuations and assumptionsThe latest valuations of the defined benefit schemes have been updated to 31 December 2018 by qualified independent actuaries. The principal assumptions are included in the table below. The assumptions used by the actuaries are the best estimates chosen from a range of possible actuarial assumptions, which, due to the timescale covered, may not necessarily be borne out in practice.
P&O UK scheme
2018
MNOPF scheme
2018
Other schemes
2018
P&O UK scheme
2017
MNOPFscheme
2017
Otherschemes
2017
Discount rates 2.85% 2.85% 3.00% 2.50% 2.50% 2.50%Discount rates bulk annuity asset 2.65% – – 2.30% – –Expected rates of salary increases –* –* 2.4% –* –* 2.4%Pension increases:
deferment 3.00% 2.55% 2.80% 3.00% 2.45% 2.80%payment 3.00% 3.45% 3.20% 3.00% 3.35% 3.10%
Inflation 3.55% 3.55% 3.30% 3.45% 3.45% 3.30%
* The P&O UK Scheme and MNOPF were closed to future accrual as at 31 March 2016, so future pay increases are not relevant.
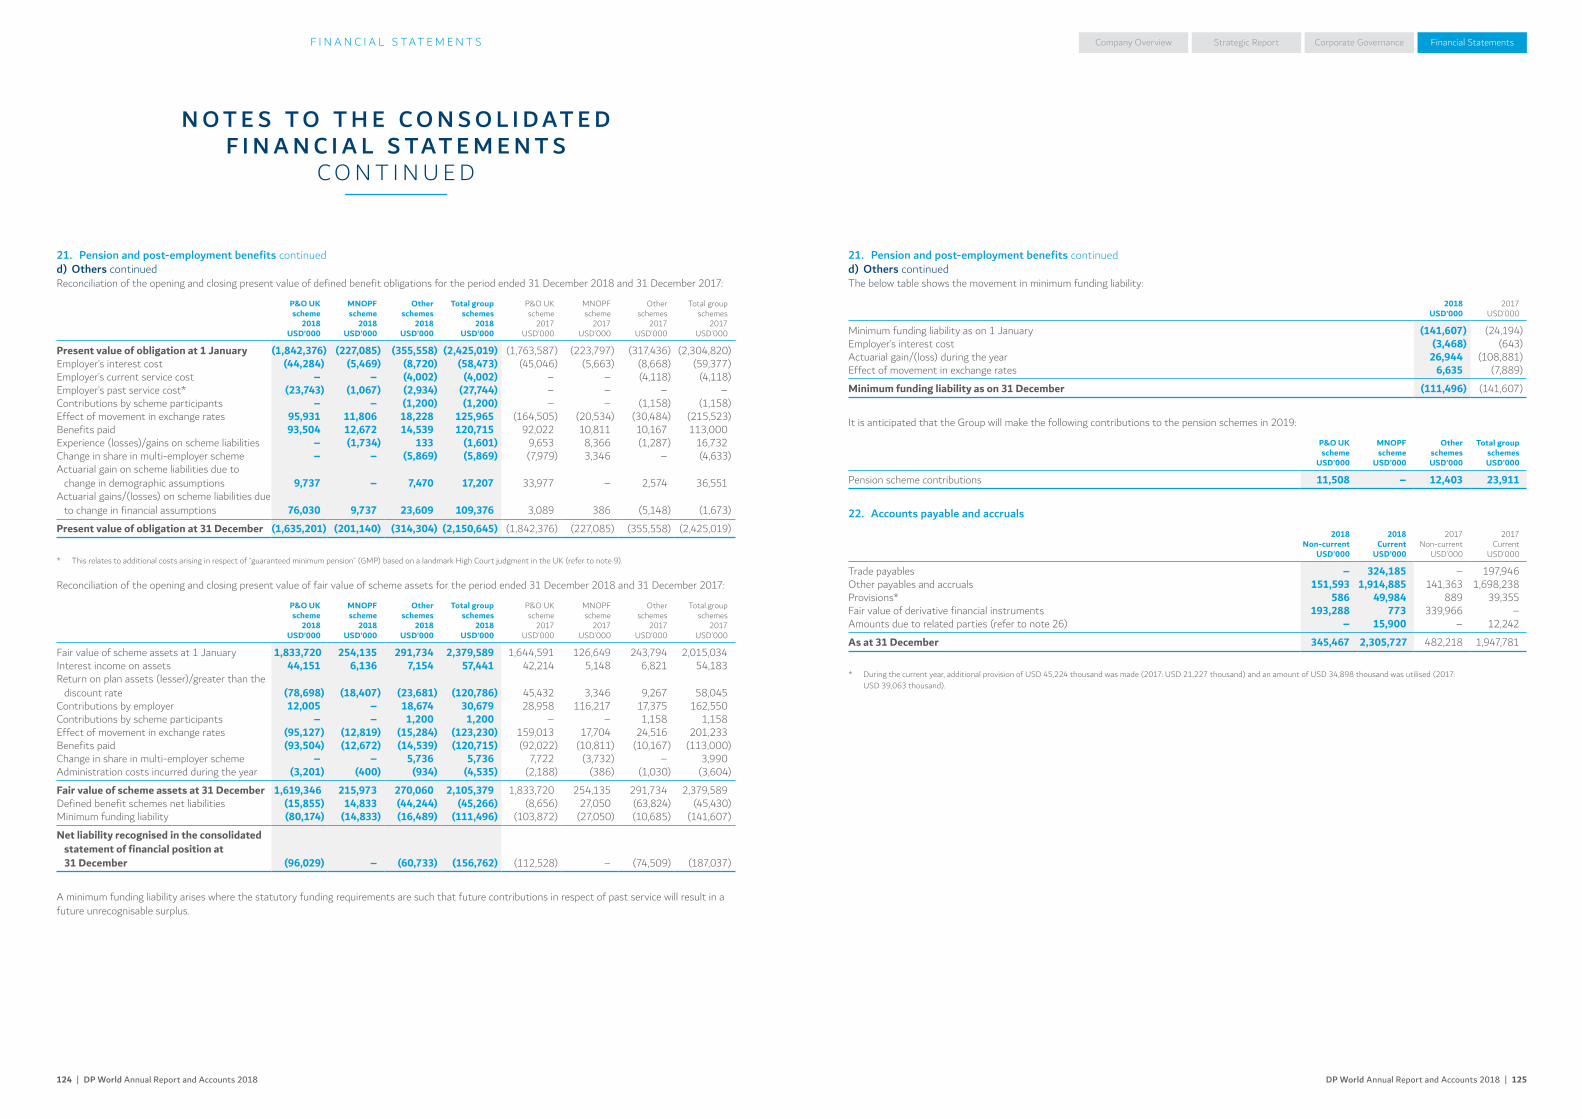
DP World Annual Report and Accounts 2018 | 125124 | DP World Annual Report and Accounts 2018
Company Overview Corporate Governance Financial StatementsStrategic ReportF I N A N C I A L S TAT E M E N T S
N O T E S T O T H E C O N S O L I D AT E D F I N A N C I A L S TAT E M E N T S
C O N T I N U E D
21. Pension and post-employment benefits continuedd) Others continuedThe below table shows the movement in minimum funding liability:
2018USD’000
2017USD’000
Minimum funding liability as on 1 January (141,607) (24,194)Employer’s interest cost (3,468) (643)Actuarial gain/(loss) during the year 26,944 (108,881)Effect of movement in exchange rates 6,635 (7,889)
Minimum funding liability as on 31 December (111,496) (141,607)
It is anticipated that the Group will make the following contributions to the pension schemes in 2019:
P&O UK scheme
USD’000
MNOPFscheme
USD’000
OtherschemesUSD’000
Total group schemesUSD’000
Pension scheme contributions 11,508 – 12,403 23,911
22. Accounts payable and accruals
2018 Non-current
USD’000
2018 Current
USD’000
2017 Non-current
USD’000
2017 Current
USD’000
Trade payables – 324,185 – 197,946Other payables and accruals 151,593 1,914,885 141,363 1,698,238Provisions* 586 49,984 889 39,355Fair value of derivative financial instruments 193,288 773 339,966 –Amounts due to related parties (refer to note 26) – 15,900 – 12,242
As at 31 December 345,467 2,305,727 482,218 1,947,781
* During the current year, additional provision of USD 45,224 thousand was made (2017: USD 21,227 thousand) and an amount of USD 34,898 thousand was utilised (2017: USD 39,063 thousand).
21. Pension and post-employment benefits continuedd) Others continuedReconciliation of the opening and closing present value of defined benefit obligations for the period ended 31 December 2018 and 31 December 2017:
P&O UKscheme
2018USD’000
MNOPFscheme
2018USD’000
Otherschemes
2018USD’000
Total groupschemes
2018USD’000
P&O UKscheme
2017USD’000
MNOPFscheme
2017USD’000
Otherschemes
2017USD’000
Total groupschemes
2017USD’000
Present value of obligation at 1 January (1,842,376) (227,085) (355,558) (2,425,019) (1,763,587) (223,797) (317,436) (2,304,820)Employer’s interest cost (44,284) (5,469) (8,720) (58,473) (45,046) (5,663) (8,668) (59,377)Employer’s current service cost – – (4,002) (4,002) – – (4,118) (4,118)Employer’s past service cost* (23,743) (1,067) (2,934) (27,744) – – – –Contributions by scheme participants – – (1,200) (1,200) – – (1,158) (1,158)Effect of movement in exchange rates 95,931 11,806 18,228 125,965 (164,505) (20,534) (30,484) (215,523)Benefits paid 93,504 12,672 14,539 120,715 92,022 10,811 10,167 113,000Experience (losses)/gains on scheme liabilities – (1,734) 133 (1,601) 9,653 8,366 (1,287) 16,732Change in share in multi-employer scheme – – (5,869) (5,869) (7,979) 3,346 – (4,633)Actuarial gain on scheme liabilities due to
change in demographic assumptions 9,737 – 7,470 17,207 33,977 – 2,574 36,551Actuarial gains/(losses) on scheme liabilities due
to change in financial assumptions 76,030 9,737 23,609 109,376 3,089 386 (5,148) (1,673)
Present value of obligation at 31 December (1,635,201) (201,140) (314,304) (2,150,645) (1,842,376) (227,085) (355,558) (2,425,019)
* This relates to additional costs arising in respect of “guaranteed minimum pension” (GMP) based on a landmark High Court judgment in the UK (refer to note 9).
Reconciliation of the opening and closing present value of fair value of scheme assets for the period ended 31 December 2018 and 31 December 2017:
P&O UKscheme
2018USD’000
MNOPFscheme
2018USD’000
Otherschemes
2018USD’000
Total groupschemes
2018USD’000
P&O UKscheme
2017USD’000
MNOPFscheme
2017USD’000
Otherschemes
2017USD’000
Total.groupschemes
2017USD’000
Fair value of scheme assets at 1 January 1,833,720 254,135 291,734 2,379,589 1,644,591 126,649 243,794 2,015,034Interest income on assets 44,151 6,136 7,154 57,441 42,214 5,148 6,821 54,183Return on plan assets (lesser)/greater than the
discount rate (78,698) (18,407) (23,681) (120,786) 45,432 3,346 9,267 58,045Contributions by employer 12,005 – 18,674 30,679 28,958 116,217 17,375 162,550Contributions by scheme participants – – 1,200 1,200 – – 1,158 1,158Effect of movement in exchange rates (95,127) (12,819) (15,284) (123,230) 159,013 17,704 24,516 201,233Benefits paid (93,504) (12,672) (14,539) (120,715) (92,022) (10,811) (10,167) (113,000)Change in share in multi-employer scheme – – 5,736 5,736 7,722 (3,732) – 3,990Administration costs incurred during the year (3,201) (400) (934) (4,535) (2,188) (386) (1,030) (3,604)
Fair value of scheme assets at 31 December 1,619,346 215,973 270,060 2,105,379 1,833,720 254,135 291,734 2,379,589Defined benefit schemes net liabilities (15,855) 14,833 (44,244) (45,266) (8,656) 27,050 (63,824) (45,430)Minimum funding liability (80,174) (14,833) (16,489) (111,496) (103,872) (27,050) (10,685) (141,607)
Net liability recognised in the consolidated statement of financial position at 31 December (96,029) – (60,733) (156,762) (112,528) – (74,509) (187,037)
A minimum funding liability arises where the statutory funding requirements are such that future contributions in respect of past service will result in a future unrecognisable surplus.
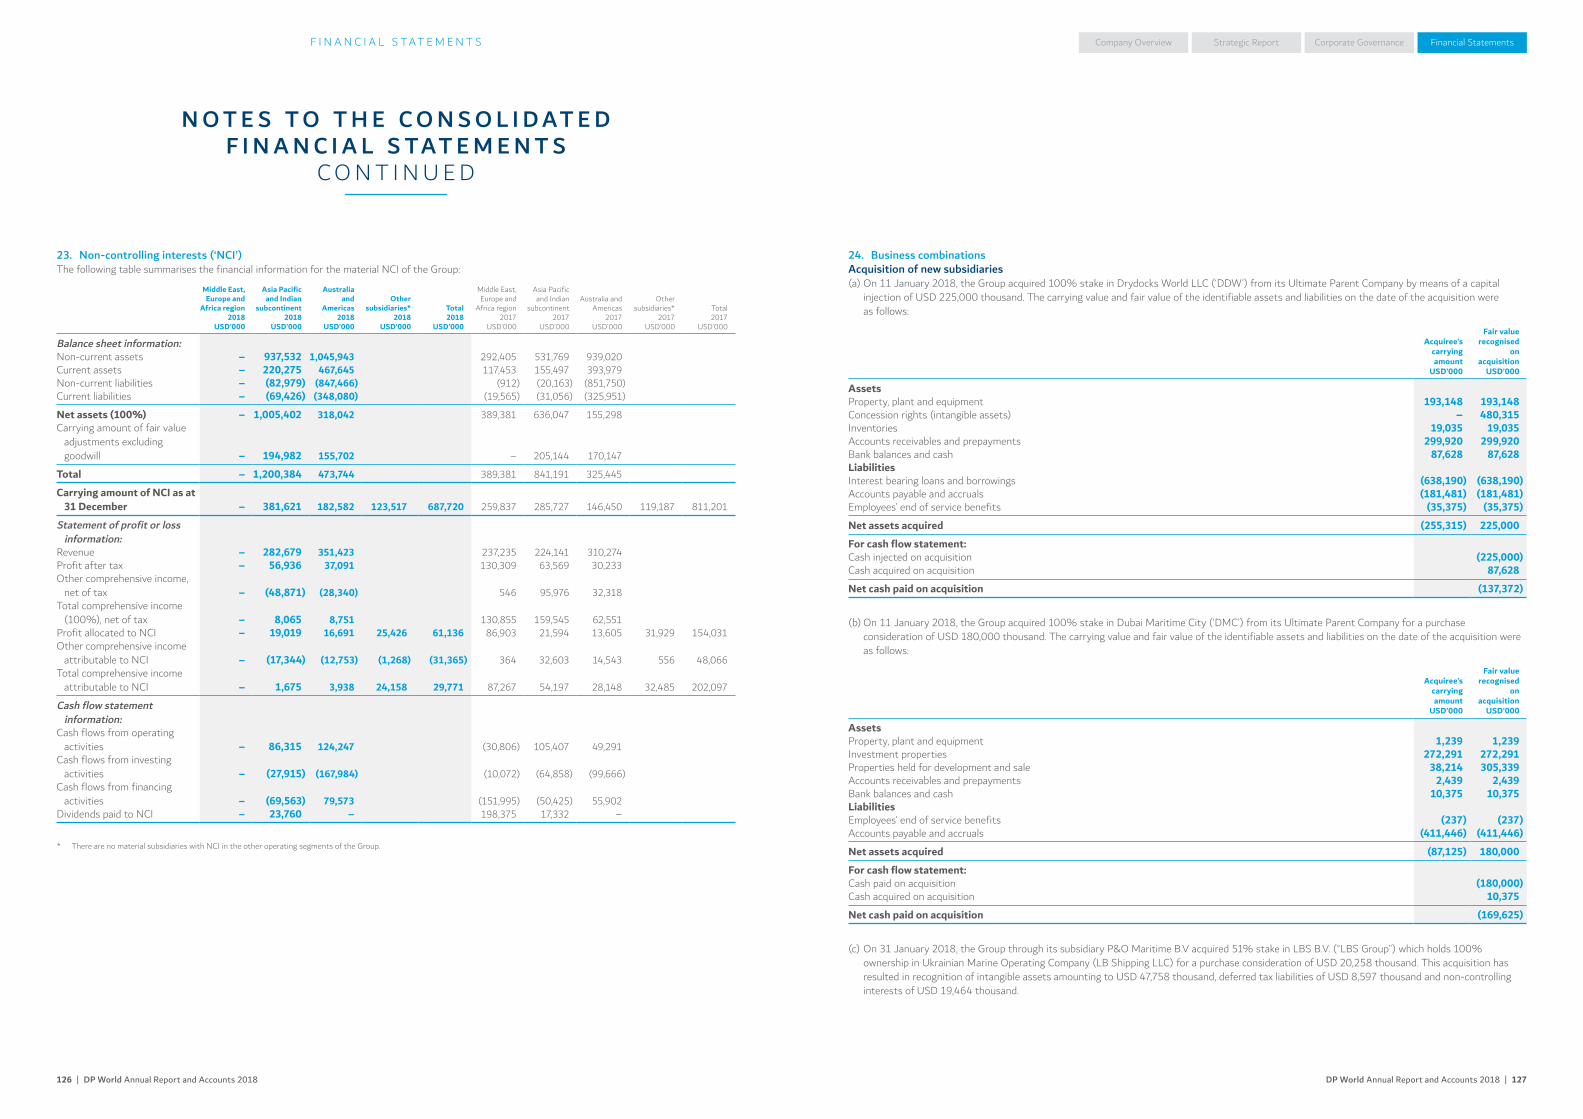
DP World Annual Report and Accounts 2018 | 127126 | DP World Annual Report and Accounts 2018
Company Overview Corporate Governance Financial StatementsStrategic ReportF I N A N C I A L S TAT E M E N T S
N O T E S T O T H E C O N S O L I D AT E D F I N A N C I A L S TAT E M E N T S
C O N T I N U E D
24. Business combinationsAcquisition of new subsidiaries(a) On 11 January 2018, the Group acquired 100% stake in Drydocks World LLC (‘DDW’) from its Ultimate Parent Company by means of a capital
injection of USD 225,000 thousand. The carrying value and fair value of the identifiable assets and liabilities on the date of the acquisition were as follows:
Acquiree’s carrying amount
USD’000
Fair value recognised
on acquisition
USD’000
AssetsProperty, plant and equipment 193,148 193,148Concession rights (intangible assets) – 480,315Inventories 19,035 19,035Accounts receivables and prepayments 299,920 299,920Bank balances and cash 87,628 87,628LiabilitiesInterest bearing loans and borrowings (638,190) (638,190)Accounts payable and accruals (181,481) (181,481)Employees’ end of service benefits (35,375) (35,375)
Net assets acquired (255,315) 225,000
For cash flow statement:Cash injected on acquisition (225,000)Cash acquired on acquisition 87,628
Net cash paid on acquisition (137,372)
(b) On 11 January 2018, the Group acquired 100% stake in Dubai Maritime City (‘DMC’) from its Ultimate Parent Company for a purchase consideration of USD 180,000 thousand. The carrying value and fair value of the identifiable assets and liabilities on the date of the acquisition were as follows:
Acquiree’s carrying amount
USD’000
Fair value recognised
on acquisition
USD’000
AssetsProperty, plant and equipment 1,239 1,239Investment properties 272,291 272,291Properties held for development and sale 38,214 305,339Accounts receivables and prepayments 2,439 2,439Bank balances and cash 10,375 10,375LiabilitiesEmployees’ end of service benefits (237) (237)Accounts payable and accruals (411,446) (411,446)
Net assets acquired (87,125) 180,000
For cash flow statement:Cash paid on acquisition (180,000)Cash acquired on acquisition 10,375
Net cash paid on acquisition (169,625)
(c) On 31 January 2018, the Group through its subsidiary P&O Maritime B.V acquired 51% stake in LBS B.V. (“LBS Group”) which holds 100% ownership in Ukrainian Marine Operating Company (LB Shipping LLC) for a purchase consideration of USD 20,258 thousand. This acquisition has resulted in recognition of intangible assets amounting to USD 47,758 thousand, deferred tax liabilities of USD 8,597 thousand and non-controlling interests of USD 19,464 thousand.
23. Non-controlling interests (‘NCI’)The following table summarises the financial information for the material NCI of the Group:
Middle East, Europe and
Africa region2018
USD’000
Asia Pacific and Indian
subcontinent2018
USD’000
Australia and
Americas2018
USD’000
Othersubsidiaries*
2018USD’000
Total2018
USD’000
Middle East,Europe and
Africa region2017
USD’000
Asia Pacific and Indian
subcontinent2017
USD’000
Australia and Americas
2017USD’000
Other subsidiaries*
2017USD’000
Total2017
USD’000
Balance sheet information:Non-current assets – 937,532 1,045,943 292,405 531,769 939,020Current assets – 220,275 467,645 117,453 155,497 393,979Non-current liabilities – (82,979) (847,466) (912) (20,163) (851,750)Current liabilities – (69,426) (348,080) (19,565) (31,056) (325,951)
Net assets (100%) – 1,005,402 318,042 389,381 636,047 155,298Carrying amount of fair value
adjustments excluding goodwill – 194,982 155,702 – 205,144 170,147
Total – 1,200,384 473,744 389,381 841,191 325,445
Carrying amount of NCI as at 31 December – 381,621 182,582 123,517 687,720 259,837 285,727 146,450 119,187 811,201
Statement of profit or loss information:
Revenue – 282,679 351,423 237,235 224,141 310,274Profit after tax – 56,936 37,091 130,309 63,569 30,233Other comprehensive income,
net of tax – (48,871) (28,340) 546 95,976 32,318Total comprehensive income
(100%), net of tax – 8,065 8,751 130,855 159,545 62,551Profit allocated to NCI – 19,019 16,691 25,426 61,136 86,903 21,594 13,605 31,929 154,031Other comprehensive income
attributable to NCI – (17,344) (12,753) (1,268) (31,365) 364 32,603 14,543 556 48,066Total comprehensive income
attributable to NCI – 1,675 3,938 24,158 29,771 87,267 54,197 28,148 32,485 202,097
Cash flow statement information:
Cash flows from operating activities – 86,315 124,247 (30,806) 105,407 49,291
Cash flows from investing activities – (27,915) (167,984) (10,072) (64,858) (99,666)
Cash flows from financing activities – (69,563) 79,573 (151,995) (50,425) 55,902
Dividends paid to NCI – 23,760 – 198,375 17,332 –
* There are no material subsidiaries with NCI in the other operating segments of the Group.
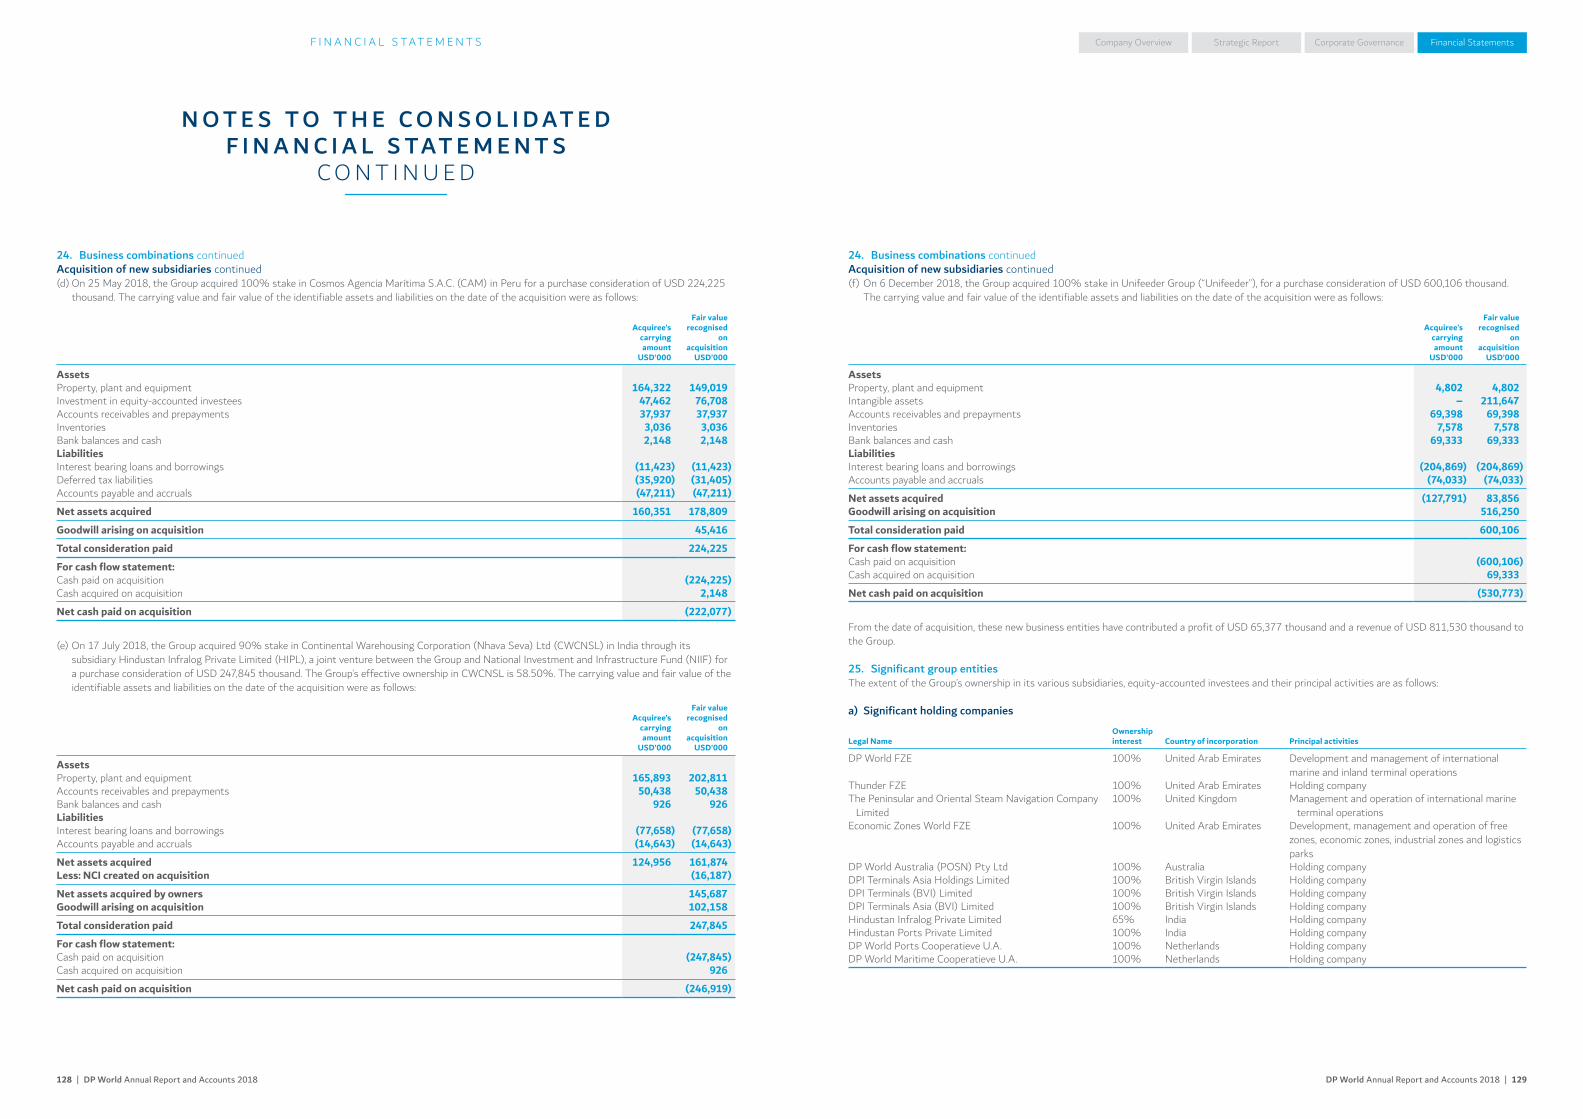
DP World Annual Report and Accounts 2018 | 129128 | DP World Annual Report and Accounts 2018
Company Overview Corporate Governance Financial StatementsStrategic ReportF I N A N C I A L S TAT E M E N T S
N O T E S T O T H E C O N S O L I D AT E D F I N A N C I A L S TAT E M E N T S
C O N T I N U E D
24. Business combinations continuedAcquisition of new subsidiaries continued(f) On 6 December 2018, the Group acquired 100% stake in Unifeeder Group (“Unifeeder”), for a purchase consideration of USD 600,106 thousand.
The carrying value and fair value of the identifiable assets and liabilities on the date of the acquisition were as follows:
Acquiree’s carrying amount
USD’000
Fair value recognised
on acquisition
USD’000
AssetsProperty, plant and equipment 4,802 4,802Intangible assets – 211,647Accounts receivables and prepayments 69,398 69,398Inventories 7,578 7,578Bank balances and cash 69,333 69,333LiabilitiesInterest bearing loans and borrowings (204,869) (204,869)Accounts payable and accruals (74,033) (74,033)
Net assets acquired (127,791) 83,856Goodwill arising on acquisition 516,250
Total consideration paid 600,106
For cash flow statement:Cash paid on acquisition (600,106)Cash acquired on acquisition 69,333
Net cash paid on acquisition (530,773)
From the date of acquisition, these new business entities have contributed a profit of USD 65,377 thousand and a revenue of USD 811,530 thousand to the Group.
25. Significant group entitiesThe extent of the Group’s ownership in its various subsidiaries, equity-accounted investees and their principal activities are as follows:
a) Significant holding companies
Legal NameOwnership interest Country of incorporation Principal activities
DP World FZE 100% United Arab Emirates Development and management of international marine and inland terminal operations
Thunder FZE 100% United Arab Emirates Holding companyThe Peninsular and Oriental Steam Navigation Company
Limited100% United Kingdom Management and operation of international marine
terminal operationsEconomic Zones World FZE 100% United Arab Emirates Development, management and operation of free
zones, economic zones, industrial zones and logisticsparks
DP World Australia (POSN) Pty Ltd 100% Australia Holding companyDPI Terminals Asia Holdings Limited 100% British Virgin Islands Holding companyDPI Terminals (BVI) Limited 100% British Virgin Islands Holding companyDPI Terminals Asia (BVI) Limited 100% British Virgin Islands Holding companyHindustan Infralog Private Limited 65% India Holding companyHindustan Ports Private Limited 100% India Holding companyDP World Ports Cooperatieve U.A. 100% Netherlands Holding companyDP World Maritime Cooperatieve U.A. 100% Netherlands Holding company
24. Business combinations continuedAcquisition of new subsidiaries continued(d) On 25 May 2018, the Group acquired 100% stake in Cosmos Agencia Marítima S.A.C. (CAM) in Peru for a purchase consideration of USD 224,225
thousand. The carrying value and fair value of the identifiable assets and liabilities on the date of the acquisition were as follows:
Acquiree’s carrying amount
USD’000
Fair value recognised
on acquisition
USD’000
AssetsProperty, plant and equipment 164,322 149,019Investment in equity-accounted investees 47,462 76,708Accounts receivables and prepayments 37,937 37,937Inventories 3,036 3,036Bank balances and cash 2,148 2,148LiabilitiesInterest bearing loans and borrowings (11,423) (11,423)Deferred tax liabilities (35,920) (31,405)Accounts payable and accruals (47,211) (47,211)
Net assets acquired 160,351 178,809
Goodwill arising on acquisition 45,416
Total consideration paid 224,225
For cash flow statement:Cash paid on acquisition (224,225)Cash acquired on acquisition 2,148
Net cash paid on acquisition (222,077)
(e) On 17 July 2018, the Group acquired 90% stake in Continental Warehousing Corporation (Nhava Seva) Ltd (CWCNSL) in India through its subsidiary Hindustan Infralog Private Limited (HIPL), a joint venture between the Group and National Investment and Infrastructure Fund (NIIF) for a purchase consideration of USD 247,845 thousand. The Group’s effective ownership in CWCNSL is 58.50%. The carrying value and fair value of the identifiable assets and liabilities on the date of the acquisition were as follows:
Acquiree’s carrying amount
USD’000
Fair value recognised
on acquisition
USD’000
AssetsProperty, plant and equipment 165,893 202,811Accounts receivables and prepayments 50,438 50,438Bank balances and cash 926 926LiabilitiesInterest bearing loans and borrowings (77,658) (77,658)Accounts payable and accruals (14,643) (14,643)
Net assets acquired 124,956 161,874Less: NCI created on acquisition (16,187)
Net assets acquired by owners 145,687Goodwill arising on acquisition 102,158
Total consideration paid 247,845
For cash flow statement:Cash paid on acquisition (247,845)Cash acquired on acquisition 926
Net cash paid on acquisition (246,919)
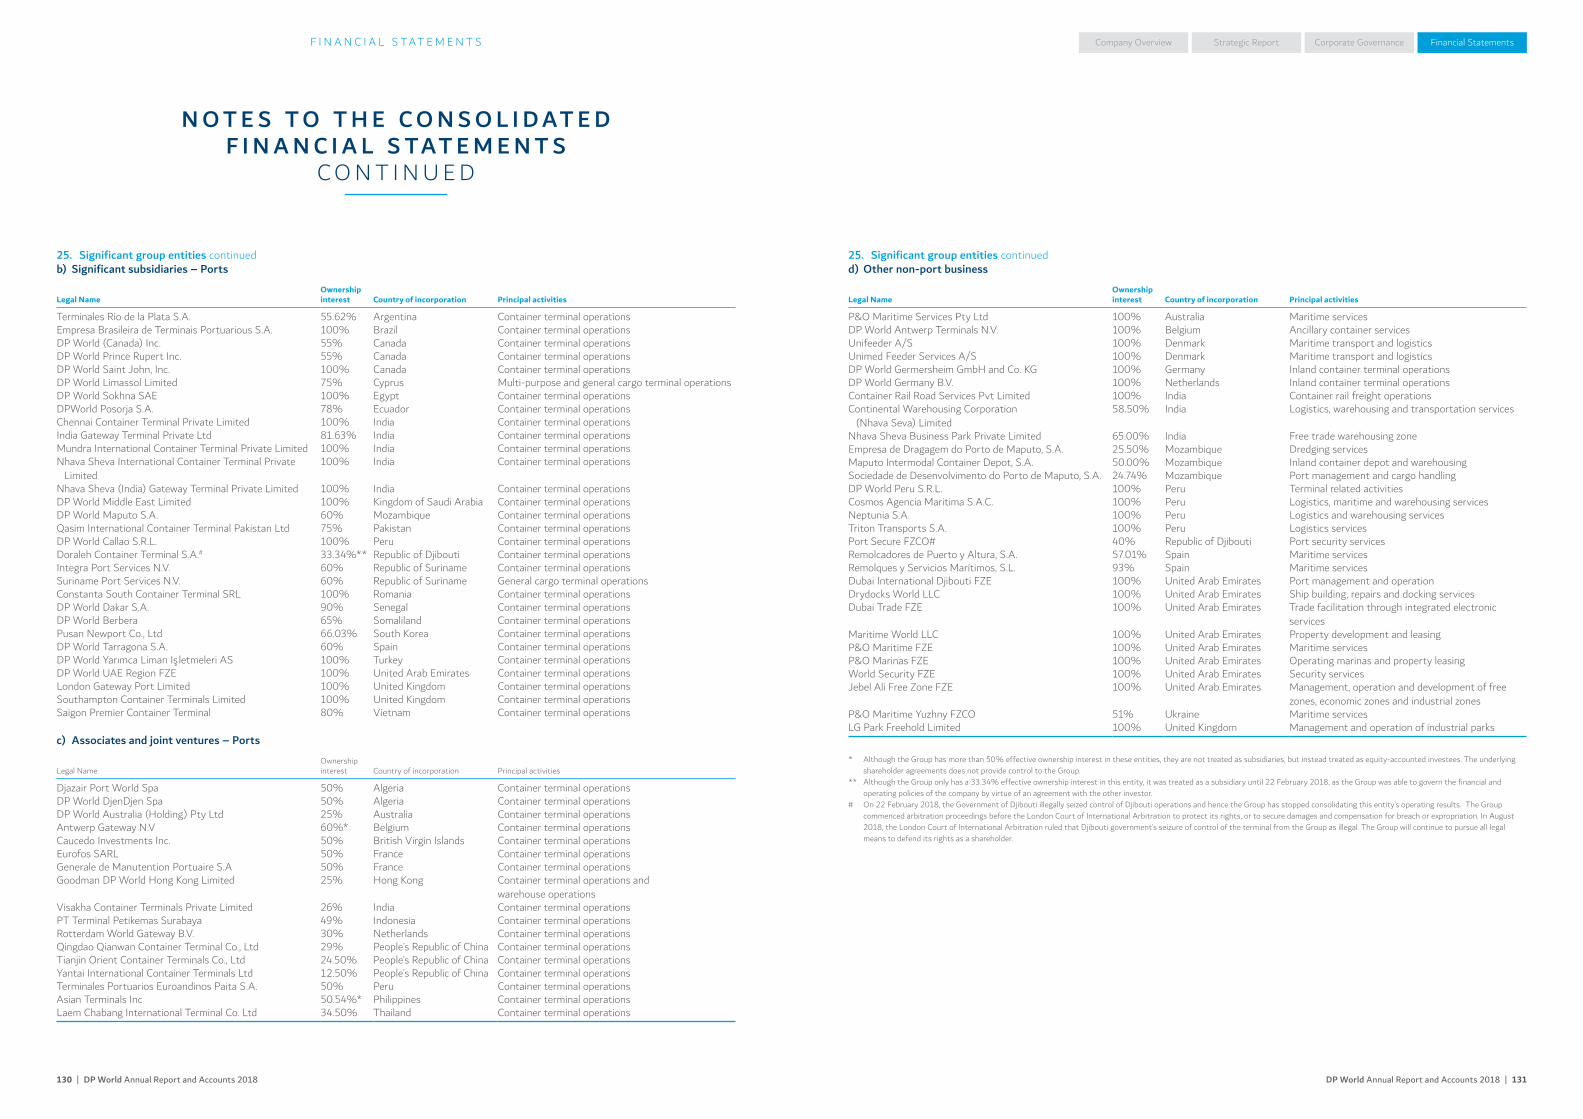
DP World Annual Report and Accounts 2018 | 131130 | DP World Annual Report and Accounts 2018
Company Overview Corporate Governance Financial StatementsStrategic ReportF I N A N C I A L S TAT E M E N T S
N O T E S T O T H E C O N S O L I D AT E D F I N A N C I A L S TAT E M E N T S
C O N T I N U E D
25. Significant group entities continuedd) Other non-port business
Legal NameOwnershipinterest Country of incorporation Principal activities
P&O Maritime Services Pty Ltd 100% Australia Maritime servicesDP World Antwerp Terminals N.V. 100% Belgium Ancillary container servicesUnifeeder A/S 100% Denmark Maritime transport and logisticsUnimed Feeder Services A/S 100% Denmark Maritime transport and logisticsDP World Germersheim GmbH and Co. KG 100% Germany Inland container terminal operationsDP World Germany B.V. 100% Netherlands Inland container terminal operationsContainer Rail Road Services Pvt Limited 100% India Container rail freight operationsContinental Warehousing Corporation
(Nhava Seva) Limited58.50% India Logistics, warehousing and transportation services
Nhava Sheva Business Park Private Limited 65.00% India Free trade warehousing zoneEmpresa de Dragagem do Porto de Maputo, S.A. 25.50% Mozambique Dredging servicesMaputo Intermodal Container Depot, S.A. 50.00% Mozambique Inland container depot and warehousingSociedade de Desenvolvimento do Porto de Maputo, S.A. 24.74% Mozambique Port management and cargo handlingDP World Peru S.R.L. 100% Peru Terminal related activitiesCosmos Agencia Maritima S.A.C. 100% Peru Logistics, maritime and warehousing servicesNeptunia S.A. 100% Peru Logistics and warehousing servicesTriton Transports S.A. 100% Peru Logistics servicesPort Secure FZCO# 40% Republic of Djibouti Port security servicesRemolcadores de Puerto y Altura, S.A. 57.01% Spain Maritime servicesRemolques y Servicios Marítimos, S.L. 93% Spain Maritime servicesDubai International Djibouti FZE 100% United Arab Emirates Port management and operationDrydocks World LLC 100% United Arab Emirates Ship building, repairs and docking servicesDubai Trade FZE 100% United Arab Emirates Trade facilitation through integrated electronic
servicesMaritime World LLC 100% United Arab Emirates Property development and leasingP&O Maritime FZE 100% United Arab Emirates Maritime servicesP&O Marinas FZE 100% United Arab Emirates Operating marinas and property leasingWorld Security FZE 100% United Arab Emirates Security servicesJebel Ali Free Zone FZE 100% United Arab Emirates Management, operation and development of free
zones, economic zones and industrial zonesP&O Maritime Yuzhny FZCO 51% Ukraine Maritime servicesLG Park Freehold Limited 100% United Kingdom Management and operation of industrial parks
* Although the Group has more than 50% effective ownership interest in these entities, they are not treated as subsidiaries, but instead treated as equity-accounted investees. The underlying shareholder agreements does not provide control to the Group.
** Although the Group only has a 33.34% effective ownership interest in this entity, it was treated as a subsidiary until 22 February 2018, as the Group was able to govern the financial and operating policies of the company by virtue of an agreement with the other investor.
# On 22 February 2018, the Government of Djibouti illegally seized control of Djibouti operations and hence the Group has stopped consolidating this entity’s operating results. The Group commenced arbitration proceedings before the London Court of International Arbitration to protect its rights, or to secure damages and compensation for breach or expropriation. In August 2018, the London Court of International Arbitration ruled that Djibouti government’s seizure of control of the terminal from the Group as illegal. The Group will continue to pursue all legal means to defend its rights as a shareholder.
25. Significant group entities continuedb) Significant subsidiaries – Ports
Legal NameOwnershipinterest Country of incorporation Principal activities
Terminales Rio de la Plata S.A. 55.62% Argentina Container terminal operationsEmpresa Brasileira de Terminais Portuarious S.A. 100% Brazil Container terminal operationsDP World (Canada) Inc. 55% Canada Container terminal operationsDP World Prince Rupert Inc. 55% Canada Container terminal operationsDP World Saint John, Inc. 100% Canada Container terminal operationsDP World Limassol Limited 75% Cyprus Multi-purpose and general cargo terminal operationsDP World Sokhna SAE 100% Egypt Container terminal operationsDPWorld Posorja S.A. 78% Ecuador Container terminal operationsChennai Container Terminal Private Limited 100% India Container terminal operationsIndia Gateway Terminal Private Ltd 81.63% India Container terminal operationsMundra International Container Terminal Private Limited 100% India Container terminal operationsNhava Sheva International Container Terminal Private
Limited100% India Container terminal operations
Nhava Sheva (India) Gateway Terminal Private Limited 100% India Container terminal operationsDP World Middle East Limited 100% Kingdom of Saudi Arabia Container terminal operationsDP World Maputo S.A. 60% Mozambique Container terminal operationsQasim International Container Terminal Pakistan Ltd 75% Pakistan Container terminal operationsDP World Callao S.R.L. 100% Peru Container terminal operationsDoraleh Container Terminal S.A.# 33.34%** Republic of Djibouti Container terminal operationsIntegra Port Services N.V. 60% Republic of Suriname Container terminal operationsSuriname Port Services N.V. 60% Republic of Suriname General cargo terminal operationsConstanta South Container Terminal SRL 100% Romania Container terminal operationsDP World Dakar S.A. 90% Senegal Container terminal operationsDP World Berbera 65% Somaliland Container terminal operationsPusan Newport Co., Ltd 66.03% South Korea Container terminal operationsDP World Tarragona S.A. 60% Spain Container terminal operationsDP World Yarımca Liman Is letmeleri AS 100% Turkey Container terminal operationsDP World UAE Region FZE 100% United Arab Emirates Container terminal operationsLondon Gateway Port Limited 100% United Kingdom Container terminal operationsSouthampton Container Terminals Limited 100% United Kingdom Container terminal operationsSaigon Premier Container Terminal 80% Vietnam Container terminal operations
c) Associates and joint ventures – Ports
Legal NameOwnership interest Country of incorporation Principal activities
Djazair Port World Spa 50% Algeria Container terminal operationsDP World DjenDjen Spa 50% Algeria Container terminal operationsDP World Australia (Holding) Pty Ltd 25% Australia Container terminal operationsAntwerp Gateway N.V 60%* Belgium Container terminal operationsCaucedo Investments Inc. 50% British Virgin Islands Container terminal operationsEurofos SARL 50% France Container terminal operationsGenerale de Manutention Portuaire S.A 50% France Container terminal operationsGoodman DP World Hong Kong Limited 25% Hong Kong Container terminal operations and
warehouse operationsVisakha Container Terminals Private Limited 26% India Container terminal operationsPT Terminal Petikemas Surabaya 49% Indonesia Container terminal operationsRotterdam World Gateway B.V. 30% Netherlands Container terminal operationsQingdao Qianwan Container Terminal Co., Ltd 29% People’s Republic of China Container terminal operationsTianjin Orient Container Terminals Co., Ltd 24.50% People’s Republic of China Container terminal operationsYantai International Container Terminals Ltd 12.50% People’s Republic of China Container terminal operationsTerminales Portuarios Euroandinos Paita S.A. 50% Peru Container terminal operationsAsian Terminals Inc 50.54%* Philippines Container terminal operationsLaem Chabang International Terminal Co. Ltd 34.50% Thailand Container terminal operations
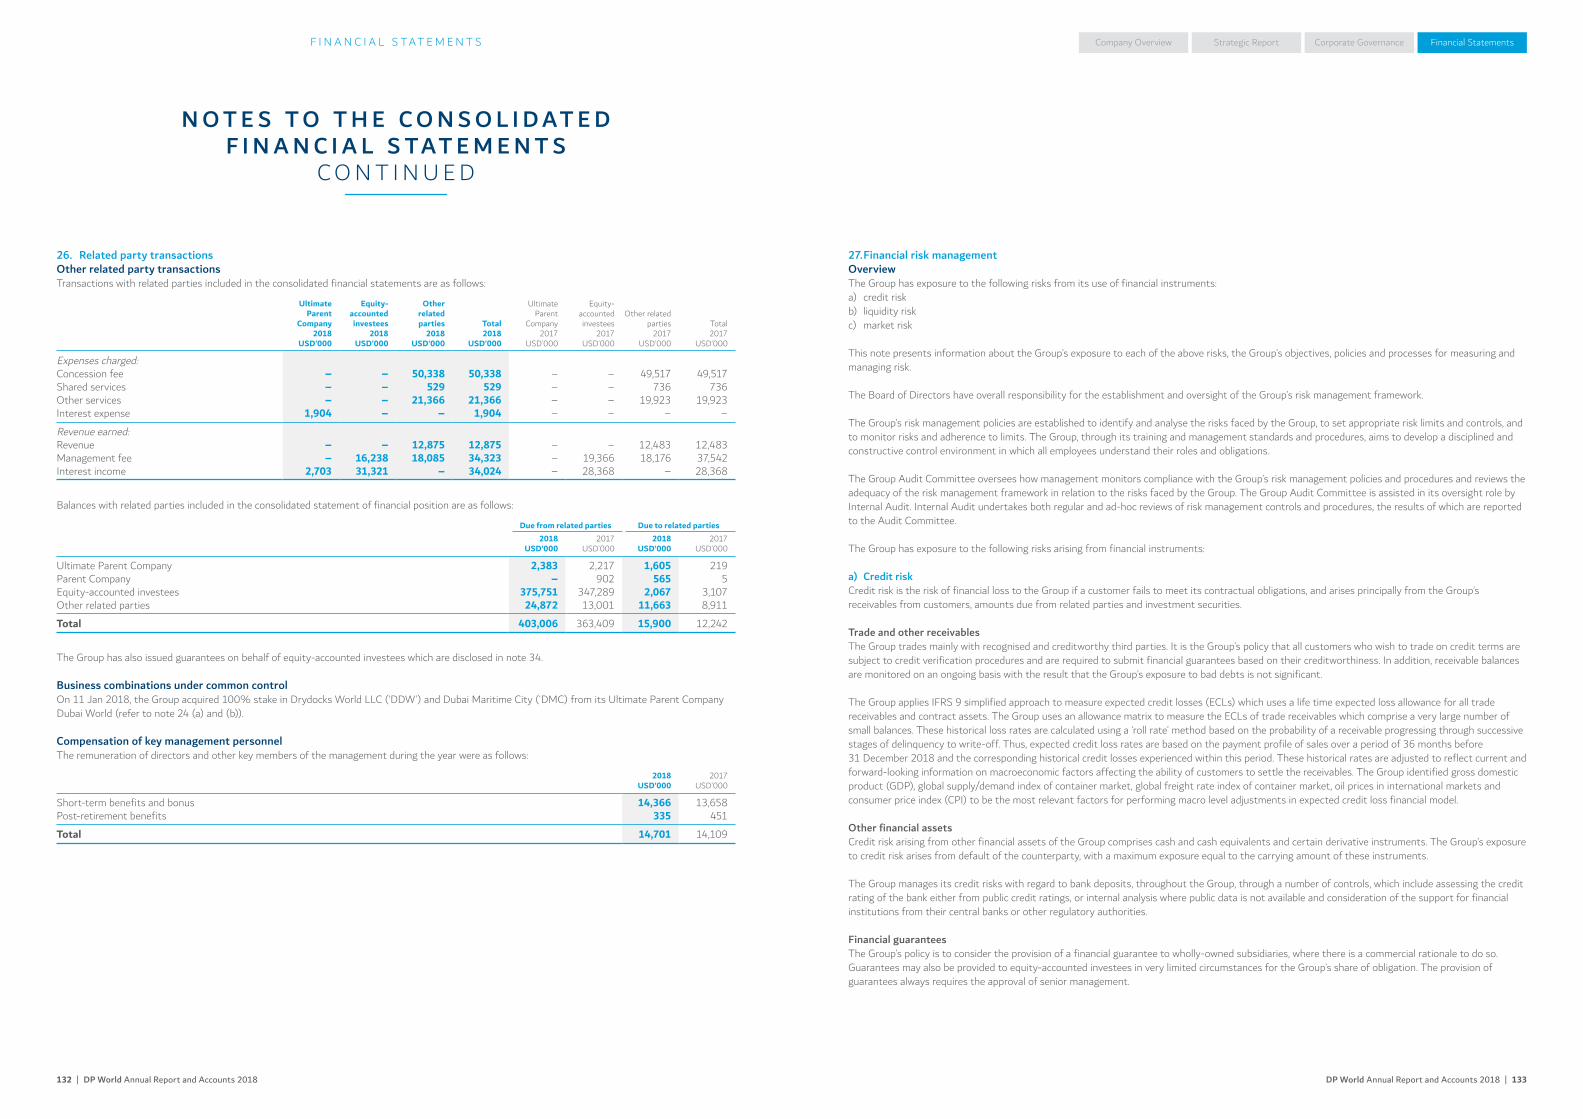
DP World Annual Report and Accounts 2018 | 133132 | DP World Annual Report and Accounts 2018
Company Overview Corporate Governance Financial StatementsStrategic ReportF I N A N C I A L S TAT E M E N T S
N O T E S T O T H E C O N S O L I D AT E D F I N A N C I A L S TAT E M E N T S
C O N T I N U E D
27. Financial risk managementOverviewThe Group has exposure to the following risks from its use of financial instruments:a) credit riskb) liquidity riskc) market risk
This note presents information about the Group’s exposure to each of the above risks, the Group’s objectives, policies and processes for measuring and managing risk.
The Board of Directors have overall responsibility for the establishment and oversight of the Group’s risk management framework.
The Group’s risk management policies are established to identify and analyse the risks faced by the Group, to set appropriate risk limits and controls, and to monitor risks and adherence to limits. The Group, through its training and management standards and procedures, aims to develop a disciplined and constructive control environment in which all employees understand their roles and obligations.
The Group Audit Committee oversees how management monitors compliance with the Group’s risk management policies and procedures and reviews the adequacy of the risk management framework in relation to the risks faced by the Group. The Group Audit Committee is assisted in its oversight role by Internal Audit. Internal Audit undertakes both regular and ad-hoc reviews of risk management controls and procedures, the results of which are reported to the Audit Committee.
The Group has exposure to the following risks arising from financial instruments:
a) Credit riskCredit risk is the risk of financial loss to the Group if a customer fails to meet its contractual obligations, and arises principally from the Group’s receivables from customers, amounts due from related parties and investment securities.
Trade and other receivablesThe Group trades mainly with recognised and creditworthy third parties. It is the Group’s policy that all customers who wish to trade on credit terms are subject to credit verification procedures and are required to submit financial guarantees based on their creditworthiness. In addition, receivable balances are monitored on an ongoing basis with the result that the Group’s exposure to bad debts is not significant.
The Group applies IFRS 9 simplified approach to measure expected credit losses (ECLs) which uses a life time expected loss allowance for all trade receivables and contract assets. The Group uses an allowance matrix to measure the ECLs of trade receivables which comprise a very large number of small balances. These historical loss rates are calculated using a ‘roll rate’ method based on the probability of a receivable progressing through successive stages of delinquency to write-off. Thus, expected credit loss rates are based on the payment profile of sales over a period of 36 months before 31 December 2018 and the corresponding historical credit losses experienced within this period. These historical rates are adjusted to reflect current and forward-looking information on macroeconomic factors affecting the ability of customers to settle the receivables. The Group identified gross domestic product (GDP), global supply/demand index of container market, global freight rate index of container market, oil prices in international markets and consumer price index (CPI) to be the most relevant factors for performing macro level adjustments in expected credit loss financial model.
Other financial assetsCredit risk arising from other financial assets of the Group comprises cash and cash equivalents and certain derivative instruments. The Group’s exposure to credit risk arises from default of the counterparty, with a maximum exposure equal to the carrying amount of these instruments.
The Group manages its credit risks with regard to bank deposits, throughout the Group, through a number of controls, which include assessing the credit rating of the bank either from public credit ratings, or internal analysis where public data is not available and consideration of the support for financial institutions from their central banks or other regulatory authorities.
Financial guaranteesThe Group’s policy is to consider the provision of a financial guarantee to wholly-owned subsidiaries, where there is a commercial rationale to do so. Guarantees may also be provided to equity-accounted investees in very limited circumstances for the Group’s share of obligation. The provision of guarantees always requires the approval of senior management.
26. Related party transactionsOther related party transactionsTransactions with related parties included in the consolidated financial statements are as follows:
Ultimate Parent
Company2018
USD’000
Equity- accounted investees
2018USD’000
Other related parties
2018USD’000
Total2018
USD’000
Ultimate Parent
Company2017
USD’000
Equity- accounted investees
2017USD’000
Other related parties
2017USD’000
Total2017
USD’000
Expenses charged:Concession fee – – 50,338 50,338 – – 49,517 49,517Shared services – – 529 529 – – 736 736Other services – – 21,366 21,366 – – 19,923 19,923Interest expense 1,904 – – 1,904 – – – –
Revenue earned:Revenue – – 12,875 12,875 – – 12,483 12,483 Management fee – 16,238 18,085 34,323 – 19,366 18,176 37,542Interest income 2,703 31,321 – 34,024 – 28,368 – 28,368
Balances with related parties included in the consolidated statement of financial position are as follows:
Due from related parties Due to related parties2018
USD’0002017
USD’0002018
USD’0002017
USD’000
Ultimate Parent Company 2,383 2,217 1,605 219Parent Company – 902 565 5Equity-accounted investees 375,751 347,289 2,067 3,107Other related parties 24,872 13,001 11,663 8,911
Total 403,006 363,409 15,900 12,242
The Group has also issued guarantees on behalf of equity-accounted investees which are disclosed in note 34.
Business combinations under common controlOn 11 Jan 2018, the Group acquired 100% stake in Drydocks World LLC (‘DDW’) and Dubai Maritime City (‘DMC) from its Ultimate Parent Company Dubai World (refer to note 24 (a) and (b)).
Compensation of key management personnelThe remuneration of directors and other key members of the management during the year were as follows:
2018USD’000
2017USD’000
Short-term benefits and bonus 14,366 13,658Post-retirement benefits 335 451
Total 14,701 14,109

DP World Annual Report and Accounts 2018 | 135134 | DP World Annual Report and Accounts 2018
Company Overview Corporate Governance Financial StatementsStrategic ReportF I N A N C I A L S TAT E M E N T S
N O T E S T O T H E C O N S O L I D AT E D F I N A N C I A L S TAT E M E N T S
C O N T I N U E D
27. Financial risk management continuedOverview continuedb) Liquidity riskLiquidity risk is the risk that the Group will not be able to meet its financial obligations as they fall due. The Group’s approach to managing liquidity is to ensure, as far as possible, that it will always have sufficient cash to meet its liabilities as they fall due, under both normal and stressed conditions, without incurring unacceptable losses or risking damage to the Group’s reputation.
The Group’s objective is to maintain a balance between continuity of funding and flexibility through the use of bank facilities and by ensuring adequate internally generated funds. The Group’s terms of business require amounts to be paid within 60 days of the date of provision of the service. Trade payables are normally settled within 45 days of the date of purchase.
The following are the undiscounted contractual maturities of financial liabilities, including estimated interest payments and the impact of netting agreements:
Carryingamount
USD’000
Contractualcash flows
USD’000
Less than1 year
USD’000
1 – 2years
USD’000
2 – 5years
USD’000
More than5 years
USD’000
Non derivative financial liabilities 2017Issued bonds 4,119,001 (6,903,324) (230,552) (857,756) (1,014,968) (4,800,048)Convertible bonds 825,412 (1,113,750) (17,500) (17,500) (52,500) (1,026,250)Bank loans 2,609,656 (3,977,590) (400,133) (198,386) (645,307) (2,733,764)Loans from non-controlling shareholders 151,134 (201,952) (1,000) (11,970) (51,119) (137,863)Finance lease liabilities 33,775 (41,794) (11,437) (7,344) (15,441) (7,572)Trade and other payables 1,706,464 (1,711,148) (1,589,903) (26,387) (30,119) (64,739)Financial guarantees and letters of credit* – (152,315) – – – –Derivative financial liabilitiesInterest rate swaps used for hedging 89,453 (124,302) (26,180) (25,528) (60,886) (11,708)Embedded derivative option 250,513 – – – – –
Total 9,785,408 (14,226,175) (2,276,705) (1,144,871) (1,870,340) (8,781,944)
Non derivative financial liabilities 2018Issued bonds 6,937,592 (12,149,956) (570,850) (823,503) (2,119,742) (8,635,861)Convertible bonds 848,865 (1,096,250) (17,500) (17,500) (52,500) (1,008,750)Bank loans 2,610,099 (3,725,203) (208,898) (177,171) (1,100,230) (2,238,904)Loans from non-controlling shareholders 133,236 (174,905) (1,000) (10,904) (45,070) (117,931)Finance lease liabilities 23,207 (29,657) (7,031) (9,525) (6,350) (6,751)Trade and other payables 1,964,732 (1,965,388) (1,851,740) (49,187) (27,471) (36,990)Financial guarantees and letters of credit* – (199,358) – – – –Derivative financial liabilitiesInterest rate swaps used for hedging 61,021 (86,593) (22,555) (21,564) (40,520) (1,954)Embedded derivative option 133,040 – – – – –
Total 12,711,792 (19,427,310) (2,679,574) (1,109,354) (3,391,883) (12,047,141)
* Refer to note 34 for further details.
c) Market riskMarket risk is the risk that changes in market prices such as foreign exchange rates and interest rates will affect the Group’s income or the value of its holdings of financial instruments. The objective of market risk management is to manage and control market risk exposures within acceptable parameters, while optimising the return.
The Group enters into derivative contracts, in order to manage market risks. All such transactions are carried out within the guidelines set by the Board of Directors in the Group Treasury policy. Generally, the Group seeks to apply hedge accounting in order to manage the volatility in the consolidated statement of profit or loss.
27. Financial risk management continuedOverview continuedi. Exposure to credit riskThe carrying amount of financial assets represents the maximum credit exposure as at 31 December:
2018USD’000
2017USD’000
FVOCI – equity instruments 48,050 69,935FVTPL – equity instruments 3,028 2,824Derivative assets 8,735 8,952Trade and other receivables excluding prepayments 1,727,101 1,218,037Cash and cash equivalents 2,614,710 1,483,679
Total 4,401,624 2,783,427
The maximum exposure to credit risk for trade receivables (net) at the reporting date by operating segments are as follows:
2018USD’000
2017USD’000
Asia Pacific and Indian subcontinent 81,335 45,369Australia and Americas 122,828 97,593Middle East, Europe and Africa 455,220 311,090
Total 659,383 454,052
The ageing of trade receivables (net) at the reporting date was:
2018USD’000
2017USD’000
Neither past due nor impaired on the reporting date: 376,486 247,923Past due on the reporting datePast due 0-30 days 161,656 135,340Past due 31-60 days 46,692 44,286Past due 61-90 days 26,597 13,430Past due > 90 days 47,952 13,073
Total 659,383 454,052
The Group believes that the unimpaired amounts that are past due by more than 30 days are still collectible, based on the historic collection trends.
Movement in the allowance for impairment in respect of trade receivables during the year was:
2018USD’000
2017USD’000
As at 1 January 106,685 108,435Acquired through business combinations 19,471 976Provision recognised/(reversed) during the year 3,824 (2,726)
As at 31 December 129,980 106,685
Based on historic default rates, the Group believes that, apart from the above, no impairment allowance is necessary in respect of trade receivables not past due or past due.
Trade receivables with the top ten customers represent 39% (2017: 54%) of the trade receivables.
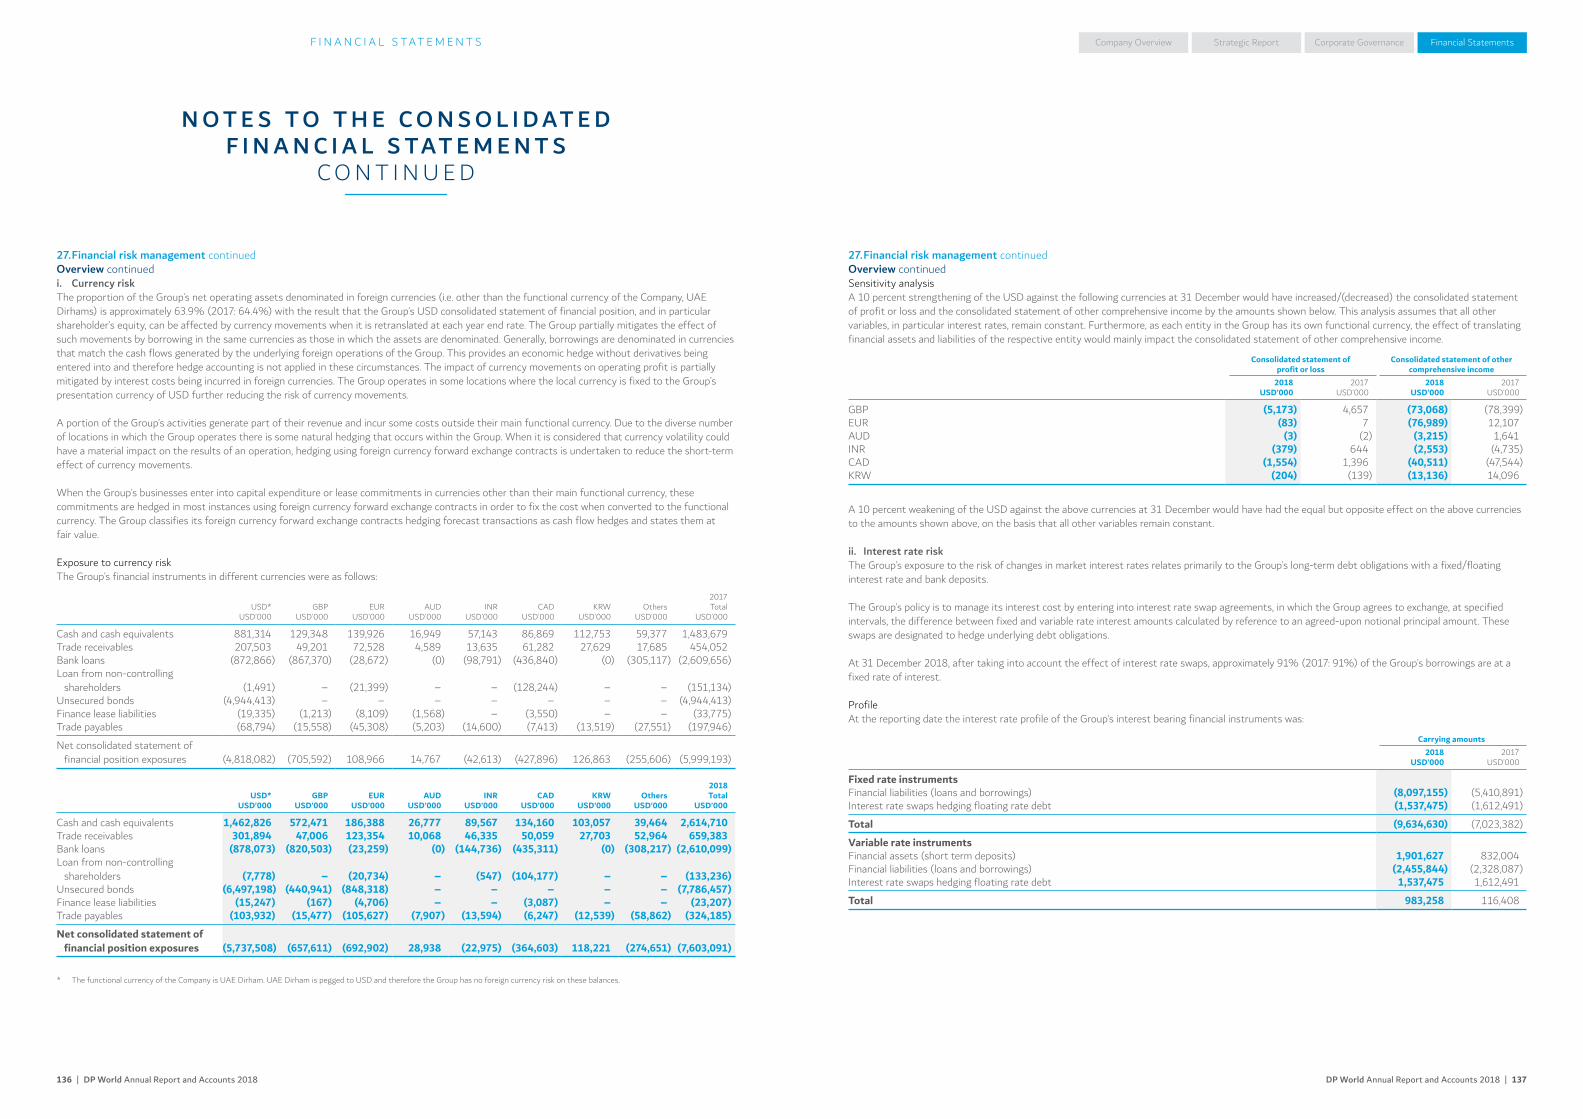
DP World Annual Report and Accounts 2018 | 137136 | DP World Annual Report and Accounts 2018
Company Overview Corporate Governance Financial StatementsStrategic ReportF I N A N C I A L S TAT E M E N T S
N O T E S T O T H E C O N S O L I D AT E D F I N A N C I A L S TAT E M E N T S
C O N T I N U E D
27. Financial risk management continuedOverview continuedSensitivity analysisA 10 percent strengthening of the USD against the following currencies at 31 December would have increased/(decreased) the consolidated statement of profit or loss and the consolidated statement of other comprehensive income by the amounts shown below. This analysis assumes that all other variables, in particular interest rates, remain constant. Furthermore, as each entity in the Group has its own functional currency, the effect of translating financial assets and liabilities of the respective entity would mainly impact the consolidated statement of other comprehensive income.
Consolidated statement of profit or loss
Consolidated statement of other comprehensive income
2018USD’000
2017USD’000
2018USD’000
2017 USD’000
GBP (5,173) 4,657 (73,068) (78,399)EUR (83) 7 (76,989) 12,107AUD (3) (2) (3,215) 1,641INR (379) 644 (2,553) (4,735)CAD (1,554) 1,396 (40,511) (47,544)KRW (204) (139) (13,136) 14,096
A 10 percent weakening of the USD against the above currencies at 31 December would have had the equal but opposite effect on the above currencies to the amounts shown above, on the basis that all other variables remain constant.
ii. Interest rate riskThe Group’s exposure to the risk of changes in market interest rates relates primarily to the Group’s long-term debt obligations with a fixed/floating interest rate and bank deposits.
The Group’s policy is to manage its interest cost by entering into interest rate swap agreements, in which the Group agrees to exchange, at specified intervals, the difference between fixed and variable rate interest amounts calculated by reference to an agreed-upon notional principal amount. These swaps are designated to hedge underlying debt obligations.
At 31 December 2018, after taking into account the effect of interest rate swaps, approximately 91% (2017: 91%) of the Group’s borrowings are at a fixed rate of interest.
ProfileAt the reporting date the interest rate profile of the Group’s interest bearing financial instruments was:
Carrying amounts2018
USD’0002017
USD’000
Fixed rate instrumentsFinancial liabilities (loans and borrowings) (8,097,155) (5,410,891)Interest rate swaps hedging floating rate debt (1,537,475) (1,612,491)
Total (9,634,630) (7,023,382)
Variable rate instrumentsFinancial assets (short term deposits) 1,901,627 832,004Financial liabilities (loans and borrowings) (2,455,844) (2,328,087)Interest rate swaps hedging floating rate debt 1,537,475 1,612,491
Total 983,258 116,408
27. Financial risk management continuedOverview continuedi. Currency riskThe proportion of the Group’s net operating assets denominated in foreign currencies (i.e. other than the functional currency of the Company, UAE Dirhams) is approximately 63.9% (2017: 64.4%) with the result that the Group’s USD consolidated statement of financial position, and in particular shareholder’s equity, can be affected by currency movements when it is retranslated at each year end rate. The Group partially mitigates the effect of such movements by borrowing in the same currencies as those in which the assets are denominated. Generally, borrowings are denominated in currencies that match the cash flows generated by the underlying foreign operations of the Group. This provides an economic hedge without derivatives being entered into and therefore hedge accounting is not applied in these circumstances. The impact of currency movements on operating profit is partially mitigated by interest costs being incurred in foreign currencies. The Group operates in some locations where the local currency is fixed to the Group’s presentation currency of USD further reducing the risk of currency movements.
A portion of the Group’s activities generate part of their revenue and incur some costs outside their main functional currency. Due to the diverse number of locations in which the Group operates there is some natural hedging that occurs within the Group. When it is considered that currency volatility could have a material impact on the results of an operation, hedging using foreign currency forward exchange contracts is undertaken to reduce the short-term effect of currency movements.
When the Group’s businesses enter into capital expenditure or lease commitments in currencies other than their main functional currency, these commitments are hedged in most instances using foreign currency forward exchange contracts in order to fix the cost when converted to the functional currency. The Group classifies its foreign currency forward exchange contracts hedging forecast transactions as cash flow hedges and states them at fair value.
Exposure to currency riskThe Group’s financial instruments in different currencies were as follows:
USD*USD’000
GBPUSD’000
EURUSD’000
AUDUSD’000
INRUSD’000
CADUSD’000
KRWUSD’000
OthersUSD’000
2017Total
USD’000
Cash and cash equivalents 881,314 129,348 139,926 16,949 57,143 86,869 112,753 59,377 1,483,679Trade receivables 207,503 49,201 72,528 4,589 13,635 61,282 27,629 17,685 454,052Bank loans (872,866) (867,370) (28,672) (0) (98,791) (436,840) (0) (305,117) (2,609,656)Loan from non-controlling
shareholders (1,491) – (21,399) – – (128,244) – – (151,134)Unsecured bonds (4,944,413) – – – – – – – (4,944,413)Finance lease liabilities (19,335) (1,213) (8,109) (1,568) – (3,550) – – (33,775)Trade payables (68,794) (15,558) (45,308) (5,203) (14,600) (7,413) (13,519) (27,551) (197,946)
Net consolidated statement of financial position exposures (4,818,082) (705,592) 108,966 14,767 (42,613) (427,896) 126,863 (255,606) (5,999,193)
USD*USD’000
GBPUSD’000
EURUSD’000
AUDUSD’000
INRUSD’000
CADUSD’000
KRWUSD’000
OthersUSD’000
2018Total
USD’000
Cash and cash equivalents 1,462,826 572,471 186,388 26,777 89,567 134,160 103,057 39,464 2,614,710Trade receivables 301,894 47,006 123,354 10,068 46,335 50,059 27,703 52,964 659,383Bank loans (878,073) (820,503) (23,259) (0) (144,736) (435,311) (0) (308,217) (2,610,099)Loan from non-controlling
shareholders (7,778) – (20,734) – (547) (104,177) – – (133,236)Unsecured bonds (6,497,198) (440,941) (848,318) – – – – – (7,786,457)Finance lease liabilities (15,247) (167) (4,706) – – (3,087) – – (23,207)Trade payables (103,932) (15,477) (105,627) (7,907) (13,594) (6,247) (12,539) (58,862) (324,185)
Net consolidated statement of financial position exposures (5,737,508) (657,611) (692,902) 28,938 (22,975) (364,603) 118,221 (274,651) (7,603,091)
* The functional currency of the Company is UAE Dirham. UAE Dirham is pegged to USD and therefore the Group has no foreign currency risk on these balances.
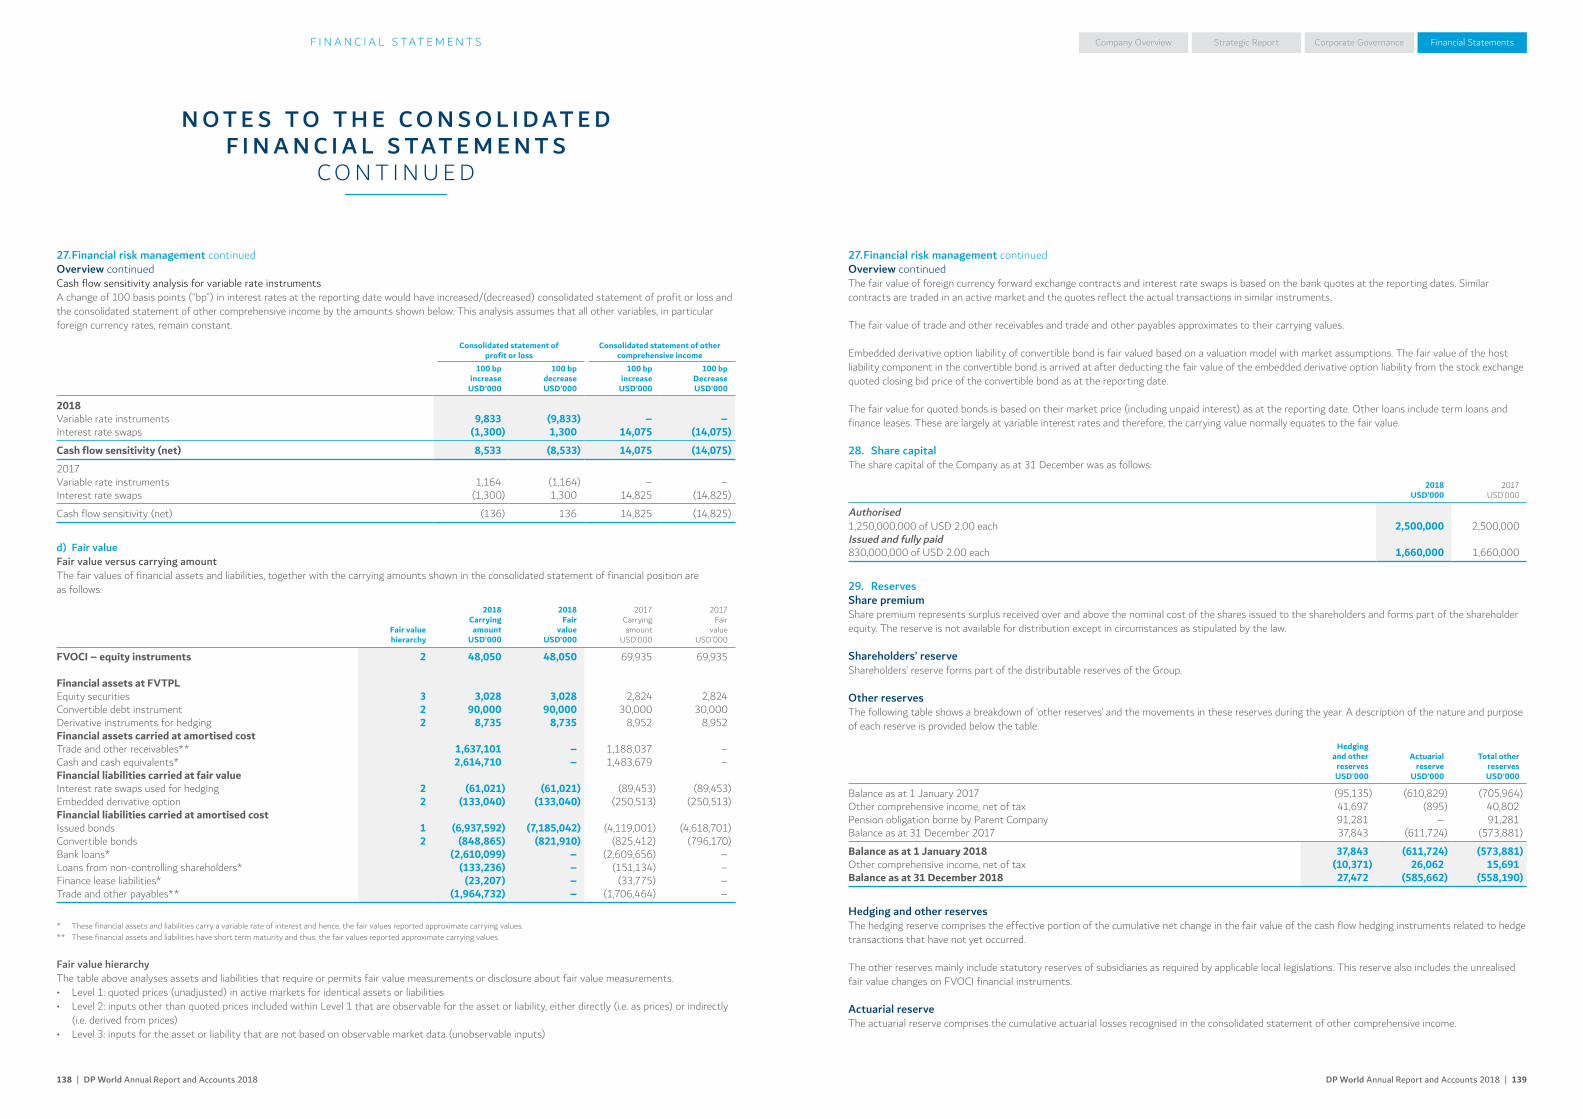
DP World Annual Report and Accounts 2018 | 139138 | DP World Annual Report and Accounts 2018
Company Overview Corporate Governance Financial StatementsStrategic ReportF I N A N C I A L S TAT E M E N T S
N O T E S T O T H E C O N S O L I D AT E D F I N A N C I A L S TAT E M E N T S
C O N T I N U E D
27. Financial risk management continuedOverview continuedCash flow sensitivity analysis for variable rate instrumentsA change of 100 basis points (“bp”) in interest rates at the reporting date would have increased/(decreased) consolidated statement of profit or loss and the consolidated statement of other comprehensive income by the amounts shown below. This analysis assumes that all other variables, in particular foreign currency rates, remain constant.
Consolidated statement of profit or loss
Consolidated statement of other comprehensive income
100 bpincrease
USD’000
100 bpdecreaseUSD’000
100 bpincrease
USD’000
100 bpDecreaseUSD’000
2018Variable rate instruments 9,833 (9,833) – –Interest rate swaps (1,300) 1,300 14,075 (14,075)
Cash flow sensitivity (net) 8,533 (8,533) 14,075 (14,075)
2017Variable rate instruments 1,164 (1,164) – –Interest rate swaps (1,300) 1,300 14,825 (14,825)
Cash flow sensitivity (net) (136) 136 14,825 (14,825)
d) Fair valueFair value versus carrying amountThe fair values of financial assets and liabilities, together with the carrying amounts shown in the consolidated statement of financial position are as follows:
Fair valuehierarchy
2018Carryingamount
USD’000
2018Fair
valueUSD’000
2017Carryingamount
USD’000
2017Fair
valueUSD’000
FVOCI – equity instruments 2 48,050 48,050 69,935 69,935
Financial assets at FVTPLEquity securities 3 3,028 3,028 2,824 2,824Convertible debt instrument 2 90,000 90,000 30,000 30,000Derivative instruments for hedging 2 8,735 8,735 8,952 8,952Financial assets carried at amortised costTrade and other receivables** 1,637,101 – 1,188,037 –Cash and cash equivalents* 2,614,710 – 1,483,679 –Financial liabilities carried at fair valueInterest rate swaps used for hedging 2 (61,021) (61,021) (89,453) (89,453)Embedded derivative option 2 (133,040) (133,040) (250,513) (250,513)Financial liabilities carried at amortised costIssued bonds 1 (6,937,592) (7,185,042) (4,119,001) (4,618,701)Convertible bonds 2 (848,865) (821,910) (825,412) (796,170)Bank loans* (2,610,099) – (2,609,656) –Loans from non-controlling shareholders* (133,236) – (151,134) –Finance lease liabilities* (23,207) – (33,775) –Trade and other payables** (1,964,732) – (1,706,464) –
* These financial assets and liabilities carry a variable rate of interest and hence, the fair values reported approximate carrying values.** These financial assets and liabilities have short term maturity and thus, the fair values reported approximate carrying values.
Fair value hierarchyThe table above analyses assets and liabilities that require or permits fair value measurements or disclosure about fair value measurements.• Level 1: quoted prices (unadjusted) in active markets for identical assets or liabilities• Level 2: inputs other than quoted prices included within Level 1 that are observable for the asset or liability, either directly (i.e. as prices) or indirectly
(i.e. derived from prices)• Level 3: inputs for the asset or liability that are not based on observable market data (unobservable inputs)
27. Financial risk management continuedOverview continuedThe fair value of foreign currency forward exchange contracts and interest rate swaps is based on the bank quotes at the reporting dates. Similar contracts are traded in an active market and the quotes reflect the actual transactions in similar instruments.
The fair value of trade and other receivables and trade and other payables approximates to their carrying values.
Embedded derivative option liability of convertible bond is fair valued based on a valuation model with market assumptions. The fair value of the host liability component in the convertible bond is arrived at after deducting the fair value of the embedded derivative option liability from the stock exchange quoted closing bid price of the convertible bond as at the reporting date.
The fair value for quoted bonds is based on their market price (including unpaid interest) as at the reporting date. Other loans include term loans and finance leases. These are largely at variable interest rates and therefore, the carrying value normally equates to the fair value.
28. Share capitalThe share capital of the Company as at 31 December was as follows:
2018USD’000
2017USD’000
Authorised 1,250,000,000 of USD 2.00 each 2,500,000 2,500,000Issued and fully paid 830,000,000 of USD 2.00 each 1,660,000 1,660,000
29. ReservesShare premiumShare premium represents surplus received over and above the nominal cost of the shares issued to the shareholders and forms part of the shareholder equity. The reserve is not available for distribution except in circumstances as stipulated by the law.
Shareholders’ reserveShareholders’ reserve forms part of the distributable reserves of the Group.
Other reservesThe following table shows a breakdown of ‘other reserves’ and the movements in these reserves during the year. A description of the nature and purpose of each reserve is provided below the table.
Hedgingand other
reserves USD’000
Actuarialreserve
USD’000
Total other reservesUSD’000
Balance as at 1 January 2017 (95,135) (610,829) (705,964)Other comprehensive income, net of tax 41,697 (895) 40,802Pension obligation borne by Parent Company 91,281 – 91,281Balance as at 31 December 2017 37,843 (611,724) (573,881)
Balance as at 1 January 2018 37,843 (611,724) (573,881)Other comprehensive income, net of tax (10,371) 26,062 15,691Balance as at 31 December 2018 27,472 (585,662) (558,190)
Hedging and other reservesThe hedging reserve comprises the effective portion of the cumulative net change in the fair value of the cash flow hedging instruments related to hedge transactions that have not yet occurred.
The other reserves mainly include statutory reserves of subsidiaries as required by applicable local legislations. This reserve also includes the unrealised fair value changes on FVOCI financial instruments.
Actuarial reserveThe actuarial reserve comprises the cumulative actuarial losses recognised in the consolidated statement of other comprehensive income.

DP World Annual Report and Accounts 2018 | 141140 | DP World Annual Report and Accounts 2018
Company Overview Corporate Governance Financial StatementsStrategic ReportF I N A N C I A L S TAT E M E N T S
N O T E S T O T H E C O N S O L I D AT E D F I N A N C I A L S TAT E M E N T S
C O N T I N U E D
31. Capital managementThe Board’s policy is to maintain a strong capital base so as to maintain investor, creditor and market confidence and to sustain future development of the business. Capital consists of share capital, share premium, shareholders’ reserve, retained earnings, hedging and other reserves, actuarial reserve and translation reserve. The primary objective of the Group’s capital management strategy is to ensure that it maintains a strong credit rating and healthy capital ratios in order to support its business and maximise shareholder value. The Board seeks to maintain a balance between the higher returns that might be possible with higher levels of borrowings and the advantages and security afforded by a sound capital position.
Neither the Company nor any of its subsidiaries are subject to externally imposed capital requirements.
The key performance ratios as at 31 December are as follows:
2018USD’000
2017USD’000
Total interest-bearing loans and borrowings 10,552,999 7,738,978Less: loans from non-controlling shareholders (133,236) (151,134)Less: cash and cash equivalents (refer to note 19) (2,614,710) (1,483,679)Total adjusted net debt 7,805,053 6,104,165Total equity 11,998,918 11,625,362Adjusted EBITDA (refer to note 4) 2,807,995 2,469,034Net finance cost before separately disclosed items 434,563 329,870Adjusted net debt/equity 0.65 0.53Adjusted net debt/adjusted EBITDA 2.78 2.47Interest cover before separately disclosed items (Adjusted EBITDA/net finance cost before separately disclosed items) 6.46 7.48
* Loans from non-controlling shareholders are excluded as they are unsecured and subordinated to external debt as per the terms of the shareholder agreements and shareholder loan notes.
32. Operating leasesOperating lease commitments – Group as a lesseeFuture minimum rentals payable under non-cancellable operating leases as at 31 December are as follows:
2018USD’000
2017USD’000
Within one year 308,574 326,223Between one to five years 894,337 1,273,277Between five to ten years 861,275 1,195,744Between ten to twenty years 1,585,474 1,833,876Between twenty to thirty years 1,260,988 1,396,953Between thirty to fifty years 1,056,831 1,134,517Between fifty to seventy years 1,060,964 914,908More than seventy years 788,099 800,551
Total 7,816,542 8,876,049
The above operating leases (Group as a lessee) mainly consist of terminal operating leases arising out of concession arrangements which are long term in nature. In addition, there are also leases of plant, equipment and vehicles included above.
Operating lease commitments – Group as a lessorFuture minimum rentals receivable under non-cancellable operating leases as at 31 December are as follows:
2018USD’000
2017USD’000
Within one year 361,105 360,983Between one to five years 854,514 816,391More than five years 1,010,247 950,846
Total 2,225,866 2,128,220
The above operating leases (Group as a lessor) mainly consist of commercial properties leased consisting of land, office accommodation, warehouses and staff accommodation. Besides these, certain property, plant and equipment are also leased out by the Group. The leases contain renewal options for additional lease periods at rental rates based on negotiations or prevailing market rates.
29. Reserves continuedTranslation reserveThe translation reserve comprises all foreign currency differences arising from the translation of the financial statements of foreign operations whose functional currencies are different from that of the Group’s presentation currency. It mainly includes foreign exchange translation differences arising from the translation of goodwill and purchase price adjustments which are denominated in foreign currencies at the Group level.
30. Interest bearing loans and borrowings
2018USD’000
2017USD’000
Issued bonds* 6,937,592 4,119,001Convertible bonds** 848,865 825,412Bank loans 2,610,099 2,609,656Finance lease liabilities 23,207 33,775
10,419,763 7,587,844of which:Classified as non-current 10,065,388 7,287,136Classified as current 354,375 300,708of which:Secured interest bearing loans and borrowings 2,078,666 2,068,490Unsecured interest bearing loans and borrowings 8,341,097 5,519,354
The below table provides movement of interest bearing loans and borrowings:
2018USD’000
2017USD’000
Balance at 1 January 7,587,844 7,605,027Cash flow itemsAcquired through business combinations 932,140 484,918Additional borrowings during the year 1,590,940 283,402Proceeds from issue of bonds (net of transaction cost paid)* 3,263,326 –Redemption of sukuk (431,571) (387,300)Repayment of borrowings during the year (2,382,237) (504,809)
Other non-cash itemsInterest accretion on convertible bonds 22,068 21,066Transaction cost written off/amortised during the year (23,819) (17,272)Translation adjustments (138,928) 102,812Balance at 31 December 10,419,763 7,587,844
* On 25 September 2018, the Group issued multi-currency bonds and sukuk under the USD 5 billion GMTN Programme and USD 3 billion Trust Certificate Issuance Programme respectively, of which USD 440,000 thousand was used to repurchase and cancel JAFZ sukuk certificates and accrued interest on 26 September 2018 as part of the liability management exercise.
** These 10 year USD 1 billion unsecured convertible bonds have an option of converting into 37.48 million ordinary shares of DP World PLC. These bonds are currently listed on the Frankfurt Stock Exchange with a coupon rate of 1.75% per annum. These bonds include an investor put option which can be exercised at par in June 2021 (Year 7). There is also an issuer call option which can be exercised on or after July 2017 (Year 3), subject to a 130% trigger on the initial conversion price of USD 27.14.
Certain property, plant and equipment and port concession rights are pledged against the facilities obtained from the banks (refer to note 12). The deposits under lien amounting to USD 38,869 thousand (2017: USD 16,150 thousand) are placed to collateralise some of the borrowings of the Company’s subsidiaries (refer to note 19).
At 31 December 2018, the undrawn committed borrowing facilities of USD 2,000,000 thousand (2017: USD 2,055,686 thousand) were available to the Group, in respect of which all conditions precedent had been met.
Information about the Group’s exposure to interest rate, foreign currency and liquidity risk are described in note 27.
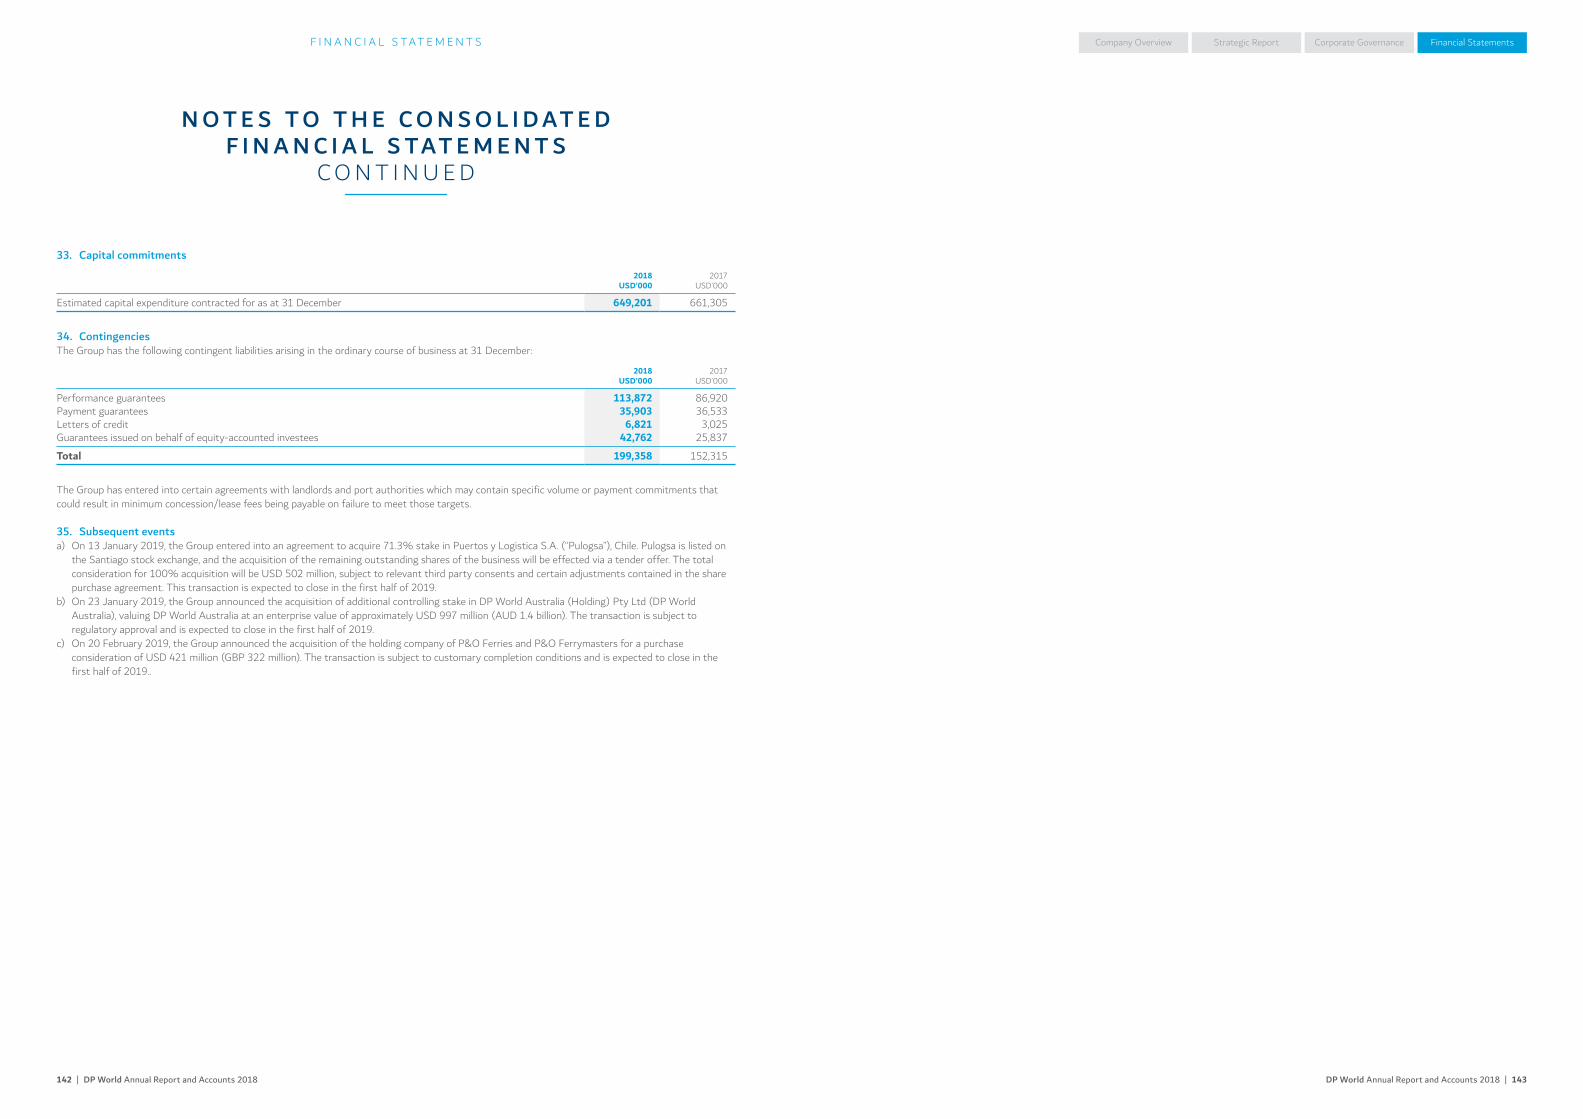
DP World Annual Report and Accounts 2018 | 143142 | DP World Annual Report and Accounts 2018
Company Overview Corporate Governance Financial StatementsStrategic ReportF I N A N C I A L S TAT E M E N T S
N O T E S T O T H E C O N S O L I D AT E D F I N A N C I A L S TAT E M E N T S
C O N T I N U E D
33. Capital commitments
2018USD’000
2017USD’000
Estimated capital expenditure contracted for as at 31 December 649,201 661,305
34. ContingenciesThe Group has the following contingent liabilities arising in the ordinary course of business at 31 December:
2018USD’000
2017USD’000
Performance guarantees 113,872 86,920Payment guarantees 35,903 36,533Letters of credit 6,821 3,025Guarantees issued on behalf of equity-accounted investees 42,762 25,837
Total 199,358 152,315
The Group has entered into certain agreements with landlords and port authorities which may contain specific volume or payment commitments that could result in minimum concession/lease fees being payable on failure to meet those targets.
35. Subsequent eventsa) On 13 January 2019, the Group entered into an agreement to acquire 71.3% stake in Puertos y Logistica S.A. (“Pulogsa”), Chile. Pulogsa is listed on
the Santiago stock exchange, and the acquisition of the remaining outstanding shares of the business will be effected via a tender offer. The total consideration for 100% acquisition will be USD 502 million, subject to relevant third party consents and certain adjustments contained in the share purchase agreement. This transaction is expected to close in the first half of 2019.
b) On 23 January 2019, the Group announced the acquisition of additional controlling stake in DP World Australia (Holding) Pty Ltd (DP World Australia), valuing DP World Australia at an enterprise value of approximately USD 997 million (AUD 1.4 billion). The transaction is subject to regulatory approval and is expected to close in the first half of 2019.
c) On 20 February 2019, the Group announced the acquisition of the holding company of P&O Ferries and P&O Ferrymasters for a purchase consideration of USD 421 million (GBP 322 million). The transaction is subject to customary completion conditions and is expected to close in the first half of 2019..

T: +971 (0)56 150 8292