Smarter City Vision
30
Smarter City Vision An opportunity to think and act in new ways John Drewry John Rowland, P.E. Client Executive Intelligent Transportation State of Texas, Public Sector Solutions IBM Corporation IBM Corporation + +
Transcript of Smarter City Vision

Smarter City Vision
An opportunity to think and act in new ways
John Drewry John Rowland, P.E. Client Executive Intelligent TransportationState of Texas, Public Sector Solutions IBM Corporation IBM Corporation
+ +

Smarter Planet is about a continuing transformation enabled by some important technology and societal changes:
InstrumentedWe can measure, sense and see the
condition of practically everything.
InterconnectedPeople, systems and
objects can communicate and
interact with each other in entirely new ways.
IntelligentWe can analyze and derive insight from larger and more
diverse sources of information, to predict and respond better to change.

INSTRUMENTED
Sensors are being embedded across entire ecosystems – supply chains, healthcare networks, cities, natural systems.
We will be able to sense, measure and see the condition of everything.

In 2001, there were 60 million transistors for every human on the planet…
…in 2010 there will be 1 billion per human…
…each costing 1/10 millionth of a cent.
In 2005 there were 1.3 billion RFID tags in circulation…
…in 2010 there will be 33 billion.

People, systems and objects are communicating and interacting with each other in entirely new ways.
Cars, appliances, cameras, roadways, pipelines…even pharmaceuticals and livestock.
INTERCONNECTED

An estimated 2 billion people will be on the Web by 2011...
…and a trillion connected objects – cars, appliances, cameras, roadways, pipelines – will comprise the "Internet of Things."
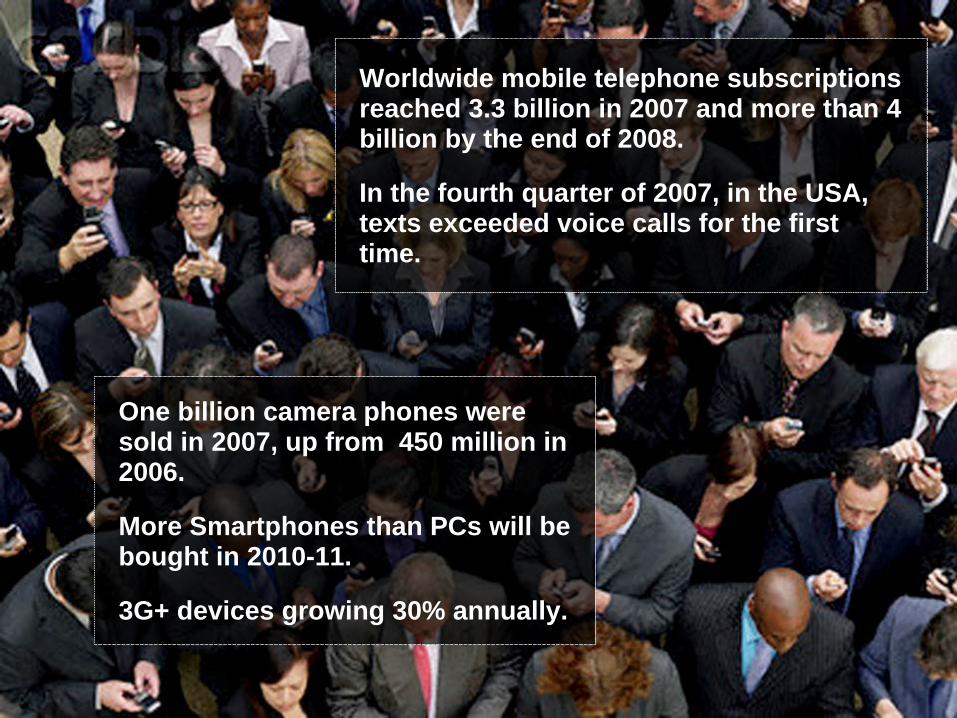
Worldwide mobile telephone subscriptions reached 3.3 billion in 2007 and more than 4 billion by the end of 2008.
In the fourth quarter of 2007, in the USA, texts exceeded voice calls for the first time.
One billion camera phones were sold in 2007, up from 450 million in 2006.
More Smartphones than PCs will be bought in 2010-11.
3G+ devices growing 30% annually.

The amount of information produced by the interaction of all those things will be unprecedented.
Analyzed effectively, it can provide important new insights on different timescales.
INTELLIGENT
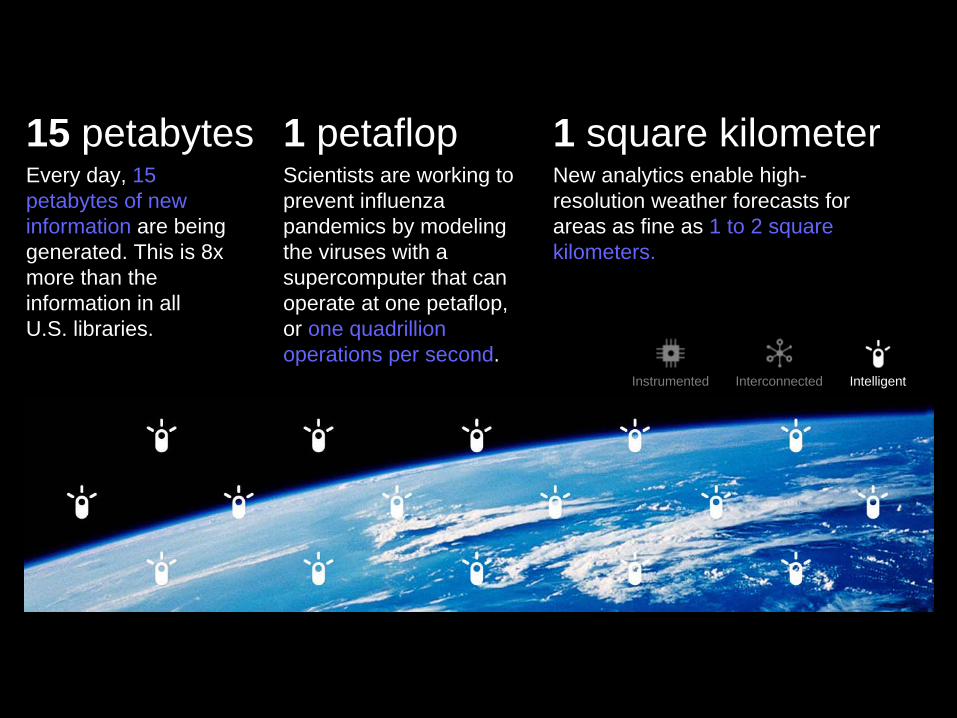
Every day, 15 petabytes of new information are being generated. This is 8x more than the information in all U.S. libraries.
15 petabytesScientists are working to prevent influenza pandemics by modeling the viruses with a supercomputer that can operate at one petaflop, or one quadrillion operations per second.
1 petaflopNew analytics enable high- resolution weather forecasts for areas as fine as 1 to 2 square kilometers.
1 square kilometer
Instrumented Interconnected Intelligent

New computing models handle the proliferation of end-user devices, sensors and actuators and connect them with back-end systems…
………while advanced analytics turn these new mountains of data into intelligence and insight…
………which is translated into action, making our systems, processes and infrastructures more efficient, productive and responsive.

Why Cities?

2007 was the first year in which more than half the world was living in cities.
By 2050 it will be 70%.
Every minute for the next 20 years, 30 people will leave rural India for urban India.
They will need 500 new cities.
Our Smarter Planet will be built by the cities of the world
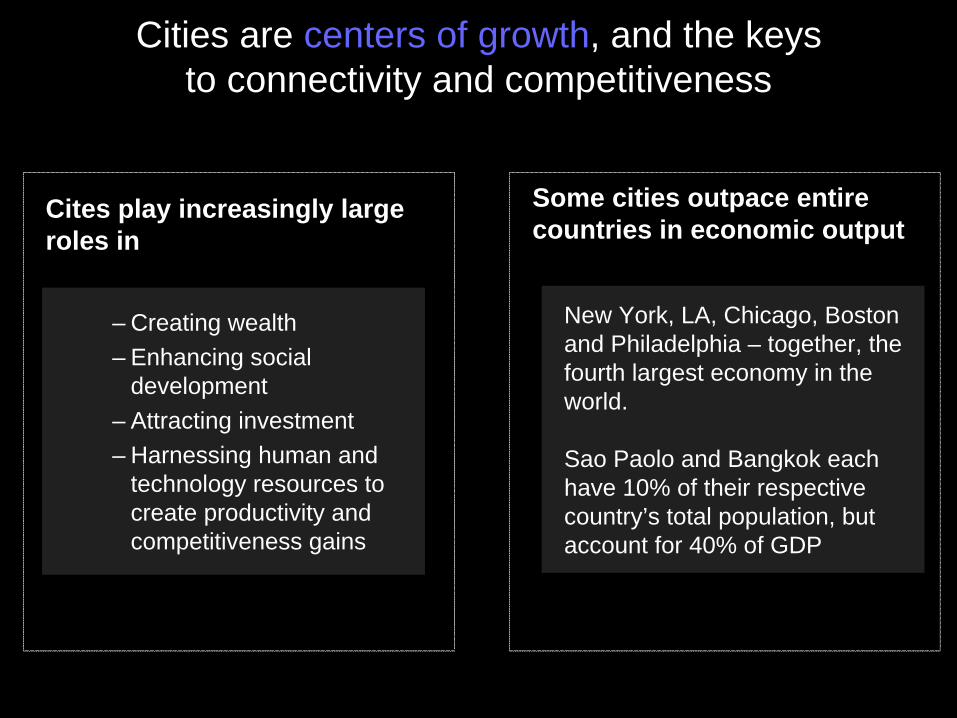
Cities are centers of growth, and the keys to connectivity and competitiveness
Cites play increasingly large roles in
New York, LA, Chicago, Boston and Philadelphia – together, the fourth largest economy in the world.
Sao Paolo and Bangkok each have 10% of their respective country’s total population, but account for 40% of GDP
Some cities outpace entire countries in economic output
– Creating wealth– Enhancing social
development– Attracting investment– Harnessing human and
technology resources to create productivity and competitiveness gains

The pace of urbanization is unprecedented…
Urban population is projected to nearly double from 3.3B (2007) to
6.4B (2050)
0
1,000
2,000
3,000
4,000
5,000
6,000
7,000
1960 1970 1980 1990 2000 2010 2020 2030 2040 2050 2060
Pop
ulat
ion
(mill
ions
)
Urban Population Rural Population
Figure I.1 Urban and Rural populations of the world, 1950-2050
Asia’s urban areas will grow by more than 100,000 people a day

…and growth is stressing every piece of our infrastructure
Energy
In the near term we’ll need to extract more oil and natural gas than ever
before. Projections show energy consumption
increasing by 50% in the next 25 years.
820 million people around the world are undernourished.
Yet 50% of the food we produce is wasted between
field and fork.
In the last 100 years global water usage has increased
at twice the rate of population growth. Today,
one in five people still lacks clean drinking water.
Food Water

The city is a microcosm of the major challenges and opportunities facing the planet today— intensified and accelerated.
Public Safety
Government Services
Education
Healthcare
Transportation
Energy and Utilities

A Smarter City connects physical, digital, social and business infrastructures to leverage collective intelligence and abilities.
Benefits? Optimizations and integration to reduce costs of service operation, cut emissions, reduce wastage of time, energy, and materials, improve public safety, enable pursuit of sustainable prosperity.
How? Gather data on service consumption or the behavior of individuals, crowds, vehicles, etcMake more data available, faster, to city systems. Apply analytics and optimization.Deliver insight in “ever more near real time”.
Which Systems? Energy, water, transportation, buildings, public safety, health, education, constituent services.
What? Improve the planning and operation of city systems - and thus the quality of life and work in the city.

Intelligent Transportation Systems- Integrated Fare Management- Road Usage Charging- Traffic Information Management
Energy Management- Network Monitoring and Stability- Smart Grid – Demand
Management- Intelligent Building Management- Automated Meter Management
Environmental Management- City-wide Measurements- KPI’s- Carbon Management- Scorecards- Reporting
Water Management- Water purity monitoring- Water use optimization- Waste water treatment
optimization
Public Safety- Surveillance Systems- Emergency Management
Integration- Micro-Weather Forecasting
Telecommunications- Fixed and mobile
operators- Media
Broadcasters
All cities benefit from advanced information and communications technologies
19
Transportation

Congestion within cities is accelerating at a rapid pace – an increasing issue for more cities and governments

Americans experienced travel delays of 4.2 Billion Hours in 2007 - - equivalent to a week of work per traveler
Productivity and Quality of Life
Congestion cost Americans $87 Billion in 2007 - - an increase of 50% in the past decade
Fuel and Time Cost
Gross Regional Product is reduced by up to 10% as a result of transportation congestion
Economic Impact
Prior to the implementation of its congestion pricing program, London traffic and CO2 emissions were 20% higher
Environmental Impact
Chronic traffic congestion creates significant impact to cities and citizens

The intersection of the ‘physical’ with the ‘digital’ provides the ability to create a Smarter City
Measuring, Monitoring, Modeling and Managing
Metering
SensingReal Time
Data Integration
Real Timeand Historical
Data
Data Modeling and Analytics
Visualization and Decision Support(Traveler Advice,
Network Response, etc.)
Data modeling and analytics to create
insights from data to feed decision support
and actions
Feedback to user and data source - actions to change behavior
Comparison of historical data,
with newly collected data
Data Collection
Data Integration
Feedback to user and data source - actions to change behavior
PHYSICAL DOMAIN DIGITAL DOMAIN

The accumulation of real-world data contains valuable information about patterns of behavior
Operational/Transactional
Road Usage Optimization,
GHG emission models
• More granular charging, by location
• Analysis of traffic patterns to manage city congestion.
• Modeling traffic to predict and manage entire system
• Dynamic and congestion based pricing
• Route planning and advice, shippers, concrete haulers, limo companies, theatres, taxis etc
• City-wide, dynamic traffic optimization
• Toll collection only - disconnected operational data
• Transaction data from the management of payments
• Little automated use is made of real-time traffic data
Operational/ Transactional Insights System wide control

London, Singapore, Stockholm and others are deploying smarter traffic systems.
Stockholm has seen approximately 20 percent less traffic, a 12 percent drop in emissions and a reported 40,000 additional daily users of public transportation.
Cleaner mobility…

Queensland: free flow cashless tolling using transponder and video methods, using business intelligence, demand management, and advanced video algorithms.
…easier traffic…
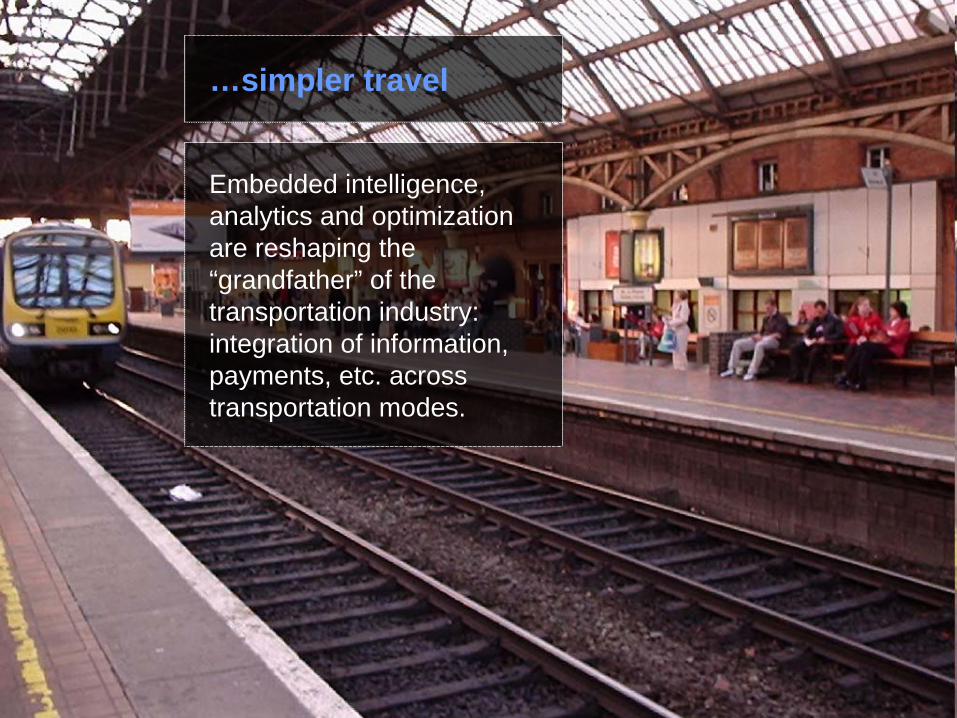
Embedded intelligence, analytics and optimization are reshaping the “grandfather” of the transportation industry: integration of information, payments, etc. across transportation modes.
…simpler travel
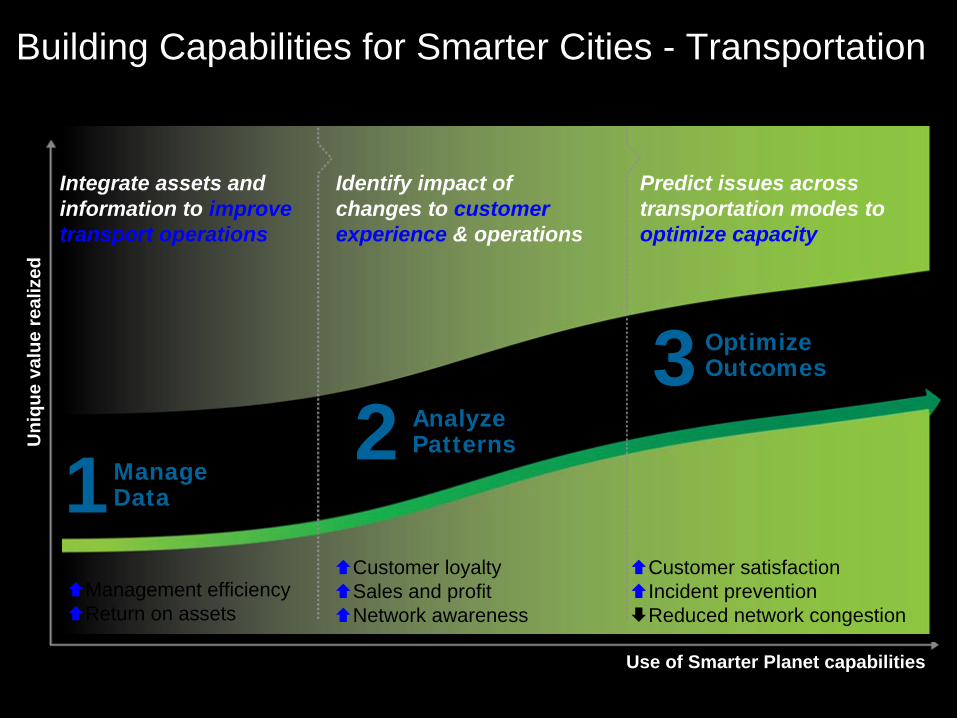
Building Capabilities for Smarter Cities - TransportationU
niqu
e va
lue
real
ized
Use of Smarter Planet capabilities
Manage Data1
Analyze Patterns2
Optimize Outcomes3
Enabled by the IBM Government Industry Framework
Integrate assets and information to improve transport operations
Identify impact of changes to customer experience & operations
Predict issues across transportation modes to optimize capacity
Management efficiencyReturn on assets
Customer loyaltySales and profitNetwork awareness
Customer satisfactionIncident preventionReduced network congestion

“Gentlemen, we have run out of money. Now we must think”
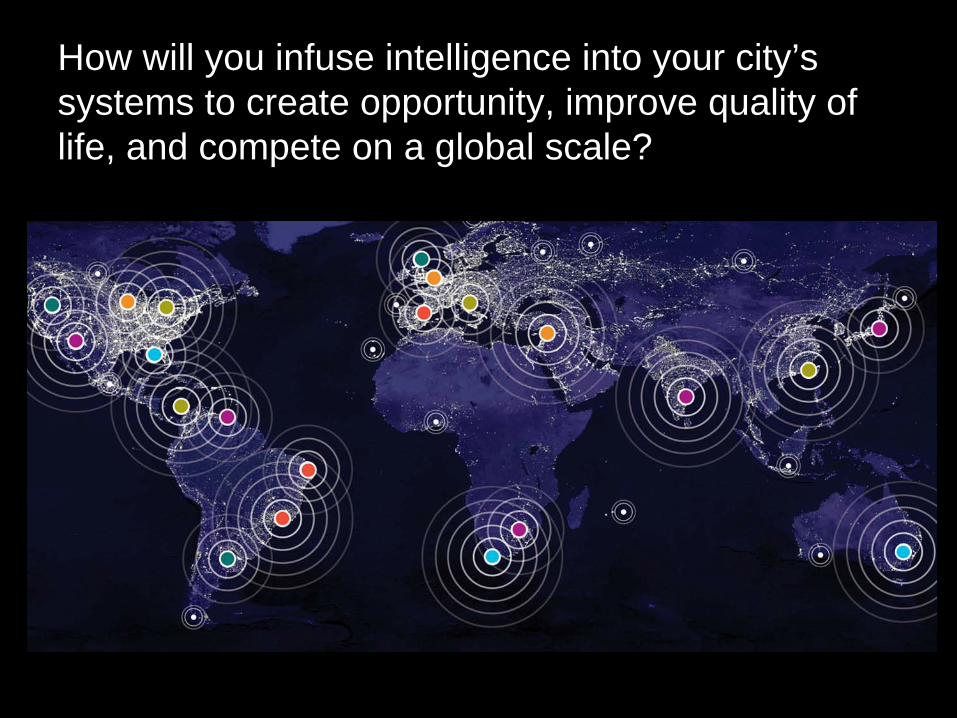
How will you infuse intelligence into your city’s systems to create opportunity, improve quality of life, and compete on a global scale?