SMART SURVEY FINAL REPORT 2017 LAISAMIS AND NORTH …
39
SMART SURVEY FINAL REPORT – 2017 LAISAMIS AND NORTH HORR SURVEY ZONES MARSABIT COUNTY 18 th JANUARY – 29 TH JANUARY, 2017
Transcript of SMART SURVEY FINAL REPORT 2017 LAISAMIS AND NORTH …

SMART SURVEY FINAL REPORT – 2017
LAISAMIS AND NORTH HORR SURVEY ZONES
MARSABIT COUNTY
18th JANUARY – 29TH JANUARY, 2017

i

i
ACKNOWLEDGEMENT
This survey has been carried out with the support and participation of many partners at different levels
who are highly acknowledged. These include; UNICEF for funding the survey, Ministry of Health,
National Drought Management Authority (NDMA), Ministry of Agriculture, Department of Health
Marsabit County, Food for the Hungry - Kenya, World Vision – Kenya, Concern Worldwide-Kenya,
KNHP Plus and ILRI for the active participation and the supervision roles they played during the survey.
At the community level, special gratitude is due to the households which participated in the survey. The
local administrators are also acknowledged for their role in mobilizing the community and acting as
guides to the enumerators during the exercise.
The survey teams composed of the enumerators and team leaders are highly appreciated for the hard
work of collecting the high quality data to the best of their abilities.

ii
Contents
ACKNOWLEDGEMENT ---------------------------------------------------------------------------------------------------- i
ACCROYNM AND ABBREVIATIONS --------------------------------------------------------------------------------- i
EXECUTIVE SUMMARY ----------------------------------------------------------------------------------------------------- ii
CHAPTER ONE ------------------------------------------------------------------------------------------------------------------ 1
INTRODUCTION --------------------------------------------------------------------------------------------------------------- 1
1.1 Background ------------------------------------------------------------------------------------------------------------------- 1
1.2 Survey Objectives ----------------------------------------------------------------------------------------------------------- 2
1.2.1 General Objective------------------------------------------------------------------------------------------------------ 2
1.2.2 Specific Objectives ---------------------------------------------------------------------------------------------------- 2
1.3 Timing of the Survey ------------------------------------------------------------------------------------------------------- 2
1.4 Seasonal Calendar ----------------------------------------------------------------------------------------------------------- 3
CHAPTER TWO ----------------------------------------------------------------------------------------------------------------- 4
METHODOLOGY --------------------------------------------------------------------------------------------------------------- 4
2.1 Geographic Target Area and Population Group ---------------------------------------------------------------------- 4
2.2 Survey Design ---------------------------------------------------------------------------------------------------------------- 4
2.3 Study Population------------------------------------------------------------------------------------------------------------- 4
2.4 Anthropometric Sample Size --------------------------------------------------------------------------------------------- 4
2.5 Cluster and Household Selection ---------------------------------------------------------------------------------------- 5
2.6 Variables Collected --------------------------------------------------------------------------------------------------------- 5
2.7 Organization of the Survey ------------------------------------------------------------------------------------------------ 6
2.8 Data Entry, Analysis and Report Writing ------------------------------------------------------------------------------ 7
CHAPTER THREE -------------------------------------------------------------------------------------------------------------- 8
3.0 SURVEY RESULTS AND DISCUSSION --------------------------------------------------------------------------- 8
3.1 Demographic Results ------------------------------------------------------------------------------------------------------- 8
3.2 Highest Education Level of the Household Head -------------------------------------------------------------------- 8
3.3 Main Occupation of the Household head ------------------------------------------------------------------------------ 9
3.4 Main Source of income of the Household Head --------------------------------------------------------------------- 9
3.5 Nutritional Status of Under-Five Children --------------------------------------------------------------------------- 10
3.5.1 Prevalence of acute malnutrition (weight-for-height z-score –WHO Standards 2006) -------------- 10
3.5.2 Prevalence of Acute malnutrition by MUAC ------------------------------------------------------------------ 11
3.5.3 Prevalence of Underweight ----------------------------------------------------------------------------------------- 11
iii
3.5.4 Prevalence of Stunting ----------------------------------------------------------------------------------------------- 11
3.6 Maternal Nutrition Status ------------------------------------------------------------------------------------------------- 12
3.7 CHILD HEALTH AND IMMUNIZATION ------------------------------------------------------------------------- 13
3.7.1 Morbidity and Health Seeking Behaviour ---------------------------------------------------------------------- 13
3.7.2 Immunization Coverage --------------------------------------------------------------------------------------------- 14
3.7.3 Zinc & Vitamin A Supplementation and Deworming Coverage ------------------------------------------ 14
3.8 Household Water Access Sanitation and Hygiene------------------------------------------------------------------ 15
3.8.1 Main Sources of Drinking Water --------------------------------------------------------------------------------- 15
3.8.2 Trekking distance to Water point --------------------------------------------------------------------------------- 16
3.8.3 Queuing time at water points -------------------------------------------------------------------------------------- 16
3.8.4 Water treatment and hand washing ------------------------------------------------------------------------------- 17
3.8.5 Payment and water storage ----------------------------------------------------------------------------------------- 18
3.8.6 Access to toilet -------------------------------------------------------------------------------------------------------- 18
3.9 Food Security ---------------------------------------------------------------------------------------------------------------- 19
3.9.1 Women dietary Diversity ------------------------------------------------------------------------------------------- 19
3.9.2 Minimum Dietary Diversity for Women ------------------------------------------------------------------------ 19
3.9.3 Household Dietary Diversity --------------------------------------------------------------------------------------- 20
3.9.4 Minimum Household Dietary Diversity ------------------------------------------------------------------------- 21
3.9.5 Household Food Consumption Score ---------------------------------------------------------------------------- 22
3.9.6 Food Consumption Score –Nutrition ---------------------------------------------------------------------------- 22
3.9.7 Micro Nutrient --------------------------------------------------------------------------------------------------------- 23
4.0 Livelihood -------------------------------------------------------------------------------------------------------------------- 25
4.1 Coping strategy Index ----------------------------------------------------------------------------------------------------- 25
Chapter 4 -------------------------------------------------------------------------------------------------------------------------- 26
CONCLUSION AND RECOMMENDATIONS ------------------------------------------------------------------------ 26
ANNEXES ------------------------------------------------------------------------------------------------------------------------ 28
Annex 1: Overall Score of the Survey -------------------------------------------------------------------------------------- 28
Annex 2: MAP of Marsabit County ----------------------------------------------------------------------------------------- 29

iv
List of Figures
Figure 1: Map of Marsabit County ............................................................................................................... 2
Figure 2: Respondents Marital Status ........................................................................................................... 8
Figure 3: Highest Education Level of the HH Head ..................................................................................... 8
Figure 4: Main Occupation of the HH Head ................................................................................................. 9
Figure 5: main Source of Income of the HH head ........................................................................................ 9
Figure 6: Maternal Nutrition by MUAC ..................................................................................................... 12
Figure 7: Children Morbidity ...................................................................................................................... 13
Figure 8: Health seeking Behavior.............................................................................................................. 13
Figure 9: Zinc and Vitamin A supplementation and Deworming Coverage ............................................... 15
Figure 10: main source of drinking water ................................................................................................... 16
Figure 11: Trekking distance to water points .............................................................................................. 16
Figure 12: Queuing time at water points ..................................................................................................... 17
Figure 13: Water treatment and Handwashing............................................................................................ 17
Figure 14: Water storage ............................................................................................................................. 18
Figure 15: Access to toilet .......................................................................................................................... 18
Figure 16: Food groups consumed by women ............................................................................................ 19
Figure 17: Minimum Women Dietary Diversity Score............................................................................... 20
Figure 18: 12 Food groups Consumed by the HH ...................................................................................... 21
Figure 19: Minimum Household Dietary Diversity .................................................................................... 21
Figure 20: Household Food Consumption Score ........................................................................................ 22
Figure 21: Frequency Consumption of Protein, Vitamin A and Iron rich foods in North Horr Sub County
.................................................................................................................................................................... 23
Figure 22: Frequency Consumption of Protein, Vitamin A and Iron rich Foods in Laisamis Sub County 23
Figure 23: Household Consumption of Micro nutrients rich foods in North Horr Sub County ................. 24
Figure 24: Household Consumption of Micro nutrient rich foods in Laisamis Sub County ...................... 25
Figure 25: Mean Strategy Coping Index ..................................................................................................... 25

v
List of Tables
Table 1: Summary of Survey Findings ......................................................................................................... ii
Table 2: Anthropometric Sample Size for the North Horr and Laisamis survey .......................................... 4
Table 3: Prevalence of acute malnutrition by WHZ ................................................................................... 10
Table 4: Prevalence of acute Malnutrition by MUAC ................................................................................ 11
Table 5: Prevalence of Underweight ........................................................................................................... 11
Table 6: Prevalence of Stunting .................................................................................................................. 12
Table 7: Immunization Coverage ................................................................................................................ 14

i
ACCROYNM AND ABBREVIATIONS
BPHS: Basic Package of Health Services
CI: Confidence Interval
CNO: County Nutrition Officer
CSI: Coping Strategy Index
DEFF: Design Effect
ENA: Emergency Nutrition Assessment
FGD: Focus Group Discussion
GAM: Global Acute Malnutrition
HAZ: Weight-for-Age Z score
HH: Household
HiNi: High Impact Nutrition Intervention
KII: Key Informant Interview
MAM: Moderate Acute Malnutrition
MoH: Ministry of Health
MUAC: Mid Upper Arm Circumference
NDMA: National Draught Management Authority
NGO: Non-Governmental Organization
PPS: Probability Proportional to Population Size
SAM: Severe Acute Malnutrition
SCHMT: Sub-County Health Management Team
SMART: Standardized Monitoring and Assessment in Relief and Transition
UN: United Nations
UNICEF: United Nation Children Fund
WHO: World Health Organization
WAZ: Weight-for-Age Z score
WASH: Water, Sanitation and Hygiene
WFA: Weight-for-Age
WHZ: Weight-for-Height Z score

ii
EXECUTIVE SUMMARY
Marsabit County is located in the former Eastern province of Kenya and covers an area of 70,961.3 Km2.
It borders Isiolo County to the South West, Samburu County to the South, Lake Turkana to the West,
Ethiopia to the North and Wajir County to the North West. The County consists of four sub-counties;
Laisamis, North Horr, Marsabit Central, and Moyale. Although ranked as the largest county in the
country, it has an estimated population of 341,091 from an estimated 65,906 households. The county
remains amongst the counties with the highest poverty index in the in Kenya and is ranked position 44 out
of 47 counties with a poverty index rate of 83.2%. The county has three major livelihoods; Pastoral with
81%, agro-pastoral with about 16% and Business population at around Marsabit and Moyale towns. Other
minor livelihood Zones at 3% include formal employment and fisher folk along Lake Turkana.
The County experiences poor health and nutrition outcomes which are mainly related to house hold food
insecurity as a result of recurrent drought.
This Integrated SMART survey was conducted to establish the current nutrition status in the North Horr
and Laisamis Sub counties.
Specific objectives of the survey were:
To estimate the current prevalence of acute malnutrition in children aged 6 – 59 months
To compare the overall nutritional changes with the previous GAM and SAM.
To determine the morbidity rates amongst children aged 0-59 months over a two week recall
period.
To estimate the immunization coverage of Measles, BCG and Oral polio vaccines (OPV1 and 3).
To determine the coverage for deworming, zinc supplementation for diarrhea and vitamin A
supplementation among children 6-59 months.
To estimate the nutritional status of women of reproductive age 15-49 years using MUAC
measurements
To collect information on possible underlying causes of malnutrition such as household food
security, water, sanitation, and hygiene practices
The survey was conducted in two Sub-Counties: Laisamis and North Horr. Each Sub county had its own
independent sample. Sampling was done using the SMART methodology and applied two stage cluster
sampling methodology with the clusters being selected using the probability proportional to population size
(PPS). Stage one sampling involved the sampling of the clusters while the second stage sampling involved
the selection of the households from the sampled clusters.
The number of clusters sampled was; 36 in Laisamis and 42 in North Horr. The total sample size for children
aged between 6 and 59 month was; 371 in Laisamis and 407 in North Horr. The data collected during the
survey included: anthropometry, morbidity, vaccination and de-worming status, Vitamin A
supplementation, hygiene and sanitation practices, other indicators assessed were household food security
and livelihood. The standard data collection tool recommended by the National Nutrition Information
Working Group was used. All the sampled clusters were visited. In total 1,046 households were sampled
from 78 clusters and 857 children aged 6 to 59 months were assessed for anthropometry. Anthropometric
data was analyzed using the ENA software version (July 9th, 2015) while other indicators were analyzed
using SPSS Version 20.0. The table below presents the summary of the key finding
Table 1: Summary of Survey Findings
Indicators Laisamis North Horr
Clusters 36 42
HHs covered 502 544
Nutritional Status (6 – 59 months) Weight- for-Height Z – scores (Wasting) WHO 2006
Standards
Global Acute Malnutrition (<-2 Z- 24.7% (19.3-31.0 ) 31.5% (25.3-38.5)

iii
score)
Severe Acute malnutrition (<-3 Z-score) 5.5% (3.5- 8.5) 9.8% ( 6.6-14.3)
Nutritional Status (6 – 59 months) Weight- for-Age Z – scores (Underweight) WHO 2006
Standards
Prevalence of Global Underweight (<-2
Z-score)
40.0% (33.6-46.9) 36.5% (30.5-43.0)
Nutritional Status (6 – 59 months) Height- for-Age Z – scores (Stunting) WHO 2006 Standards
Prevalence of Global Stunting (<-2 Z-
score)
31.4% (25.9-37.4 ) 23.5% (19.5-28.1 )
Immunization Coverage (6-59 months)
Measles Coverage at 9 Months 91.2% 87.6%
Measles Coverage at 18 Months 63.1% 55.9%
BCG by scar 98.1% 96.2%
OPV 1 97.9% 94.7%
OPV 3 93.6% 87.0%
Zinc Supplementation 75.0% 43.9%
Vitamin A (12 – 59 months) – twice 39.2% 19.5%
Deworming (12-59 months) 45.2% 41.2%
Child Morbidity (0 – 59 months)
Sickness two weeks prior to survey 43.2% 25.2%
Acute Respiratory Infection 52.7% 41.8%
Fever 35.2% 73.6%
Watery diarrhoea 28.6% 34.5%
Bloody diarrhoea 0.0% 2.7%
Prevalence of diarrhoea 28.6% 37.3%
Maternal Health and Nutrition
MUAC <21cm 23.5% 11.5%
MUAC (21 < 23 cm) 33.0% 32.9%
Iron Folate Supplementation 61.6% 47.7%
Household Food Consumption
Food Consumption Score (FCS)
Poor FCS
Border FCS
Good FCS
25.3%
32.5%
42.2%
14.9%
9.2%
75.9%
Water and Sanitation (WASH)
Water sources
Protected source
Unprotected source
56.0%
44.0%
38.8%
61.2%
Methods of relieving
Open defecation
Shared latrine
Own latrine
85.1%
7.6%
7.2%
74.8%
14.7%
10.1%
Water treatment 6.4% 9.4%

1 | P a g e
CHAPTER ONE
INTRODUCTION
1.1 Background
Marsabit County is located in the former Eastern province of Kenya and covers an area of 70,961.3 Km2
and is ranked as the largest county in the country. The county border Ethiopia to the North, Lake Turkana
to the West, Samburu County to the South West, Isiolo County to the South East and Wajir County to the
North East. Marsabit County borders Isiolo County to the South West. Marsabit County consists of four
sub-counties namely Laisamis, North Horr, Marsabit Central, and Moyale. The county has an estimated
population of 341,091 from an estimated 65,906 households. Additionally, it is the least populated county
in the country in terms people per km2 with a density of 4 people per km2. The county remains amongst
the counties with the highest poverty index in the in Kenya and ranked position 44 out of 47 counties with
a poverty rate of 83.2%. The county has three major livelihoods where the pastoral livelihood zone forms
the bulk of the main livelihood zones at 81% and the other significant livelihood type is the agro-pastoral
system which accounts for about 16% of the population. Other minor livelihood Zones at 3% include
formal employment and fisher folk along Lake Turkana. The main source of income in the pastoral
livelihood Zone is from the sale of livestock and livestock products, which accounts for about 85% of all
county Income. In the Agro-pastoral livelihood Zone, livestock and food crop production account for 50%
of all income.
The county experiences poor health and Nutrition outcomes especially due to Community Referral system
is poor since community units are there but semi Functional and community Health services are poor
hence most health facilities are not able to reach their catchment population. Thirdly, Vastness of the
county and rough terrain i.e. in North Horr and Laisamis hence SCHMT operations have been narrowed
to a limited scope of health facilities and with limited visits to far health facilities which are occasionally
support by partners. Another major contributing factor of high malnutrition levels are: poor dietary
diversity especially for women and poor child care and feeding practices which are related to hygiene and
sanitation and cultural beliefs. To try to improve the health and nutrition status in the county, various
partners have been working with the Ministry of Health in the implementation and up scaling the High
Impact Nutrition Intervention (HiNi) in the County. For instance Concern Worldwide has been supporting
the County Health Department in the implementation of the HiNi services in Moyale and North Horr Sub
counties. On the other hand Food for the Hungry Kenya (FHK) has been supporting the MoH in the
implementation and scaling up of HiNi in North Horr, Saku and Laisamis sub counties while World
Vision has been supporting the same activities in Laisamis Sub counties. Additionally, Concern
Worldwide has been implementing integrated health programs in Marsabit Central and Moyale Districts.

2 | P a g e
Figure 1: Map of Marsabit County
1.2 Survey Objectives
1.2.1 General Objective
The general objective of the survey was to establish the current health & nutrition status in the North Horr
and Laisamis Sub counties.
1.2.2 Specific Objectives
i. To estimate the current prevalence of acute malnutrition in children aged 6 – 59 months
ii. To compare the overall nutritional changes with the previous GAM and SAM
iii. To determine the morbidity rates amongst children aged 0‐59 months over a two week recall
period
iv. To estimate the coverage of Measles, BCG vaccination and deworming for children 9-59 months,
6-59 months and 12-59 months respectively
v. To determine the coverage for zinc supplementation and vitamin A supplementation among the
children 6-59 months
vi. To estimate the nutritional status of female caregivers aged 15-49 years using MUAC
measurements
vii. To assess household food security and livelihoods
viii. To assess water sanitation and hygiene practices
1.3 Timing of the Survey
The survey was undertaken from 18th January, 2017. Training and piloting of the survey materials and
standardization test was conducted from 18th to 21st January, 2017 and thereafter data collection from 22nd
January, 2017. This survey was conducted in the middle of the short dry period as shown in the section
below:

3 | P a g e
1.4 Seasonal Calendar
Jan Feb Mar Apr May Jun Jul Aug Sep Oct Nov Dec
Short Dry Season Long Rain Long dry spell Short Rains
4 | P a g e
CHAPTER TWO
METHODOLOGY
2.1 Geographic Target Area and Population Group
The survey was conducted in the Marsabit County and covered two sub-counties; North Horr and Laisamis.
This was based on an emergency response initiated by UNICEF due to the prevailing hunger and drought
reported in the neighboring counties evidenced by the high prevalence of malnutrition. Each of the sub-
counties had its own independent sample. The primary respondent for the survey was the mother/care taker
of the child for both household and child questionnaire
Data was collected on the following variables; anthropometry, morbidity, vaccination and de-worming
status, Vitamin A supplementation, hygiene and sanitation practices. Other indicators assessed were,
household food security and livelihood. In addition, the nutritional status of child aged 6 – 59 months
mother/care taker aged 15 – 49 years was also determined.
2.2 Survey Design
The survey applied a two stage stratified cluster sampling using the SMART methodology with the clusters
being selected using the probability proportional to population size (PPS). Stage one sampling involved the
sampling of the clusters to be included in the survey while the second stage sampling involved the selection
of the households from the sampled clusters.
2.3 Study Population
The target population for the survey was children aged 6 – 59 months for the anthropometric component
and women of reproductive age between 15 – 49 years for the maternal health component.
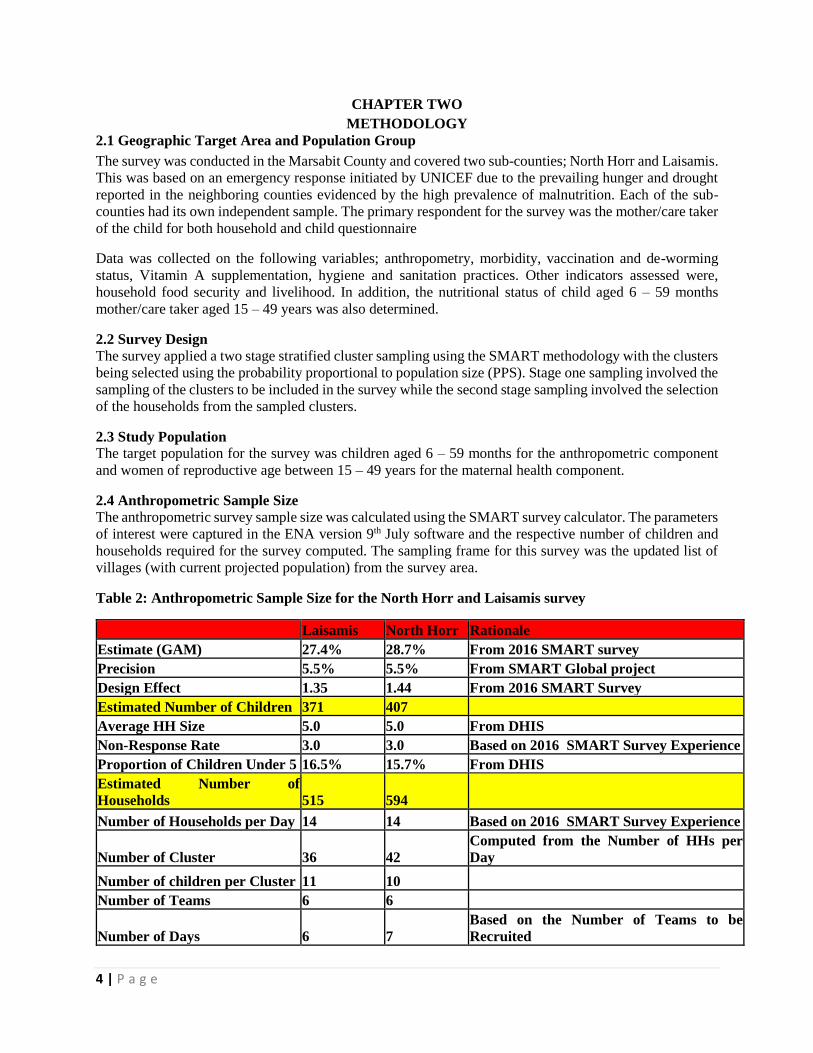
2.4 Anthropometric Sample Size
The anthropometric survey sample size was calculated using the SMART survey calculator. The parameters
of interest were captured in the ENA version 9th July software and the respective number of children and
households required for the survey computed. The sampling frame for this survey was the updated list of
villages (with current projected population) from the survey area.
Table 2: Anthropometric Sample Size for the North Horr and Laisamis survey
Laisamis North Horr Rationale
Estimate (GAM) 27.4% 28.7% From 2016 SMART survey
Precision 5.5% 5.5% From SMART Global project
Design Effect 1.35 1.44 From 2016 SMART Survey
Estimated Number of Children 371 407
Average HH Size 5.0 5.0 From DHIS
Non-Response Rate 3.0 3.0 Based on 2016 SMART Survey Experience
Proportion of Children Under 5 16.5% 15.7% From DHIS
Estimated Number of
Households 515 594
Number of Households per Day 14 14 Based on 2016 SMART Survey Experience
Number of Cluster 36 42
Computed from the Number of HHs per
Day
Number of children per Cluster 11 10 Number of Teams 6 6
Number of Days 6 7
Based on the Number of Teams to be
Recruited

5 | P a g e
Rationale for Parameters Used for the Survey
GAM – 2016 SMART Survey for the two sub-counties but with higher confidence intervals since
the situation was expected to have deteriorated
Precision –5.5 percent as recommended by the Nutrition Survey Guidelines 2012
Design Effect – 1.35 for Laisamis and 1.44 for North Horr based on the 2016 SMART Survey in
the Survey Zones
Non-Response Rate – 3.0 percent based on prior SMART survey experience in the same areas
Average HH Size – Kenya Health Information System Population estimates
Proportion of children under five years obtained from Kenya Health Information System population
estimates
Household to be sampled per day – based on the previous 2016 SMART survey experience and
based on the number of teams to be recruited.
2.5 Cluster and Household Selection
All the villages that were accessible were included in the sampling Frame and sampled with probability
proportional to size. At the second stage, each team listed all the households in a village and used the
simple random sampling method in households to visit. Within the selected households all children 6-59
months fitting the inclusion criteria were measured.
A household was defined as a group of people who lived together and shared a common cooking pot. In
polygamous families with several structures within the same compound but with different wives having
their own cooking pots, the structures were considered as separate households and assessed separately.
In cases where there was no eligible child, a household was still considered part of the sample. If a
respondent was absent during the time of household visit, the teams left a message and re-visited later to
collect data for the missing person, with no substitution of households allowed.
2.6 Variables Collected
Age: the age of the child was recorded based on a combination of child health cards, the
mothers’/caretakers’ knowledge of the birth date and use of a calendar of events for the district developed
in collaboration with the survey team.
Sex: it was recorded whether a child was male or female.
Bilateral Oedema: normal thumb pressure was applied on the top part of both feet for 3 seconds. If pitting
occurred on both feet upon release of the fingers, nutritional oedema was indicated.
Weight: the weights of children were taken with minimal or light clothing on, using Bathroom scale (SECA
digital model with a threshold of 150kgs and recorded to the nearest 0.1kg.
Length/Height: children were measured bareheaded and barefooted using wooden UNICEF height boards
with a precision of 0.1cm. Children under the age of two years were measured while lying down (length)
and those over two years while standing upright (height). If child age could not be accurately determined,
proxy heights were used to determine cases where height would be taken in a supine position (<87cm) or
in an upright position (≥87cm).
Mid Upper Arm Circumference (MUAC): the MUAC of children were taken at the midpoint of the upper
left arm using a MUAC tape and recorded to the nearest 0.1cm.
Retrospective Morbidity of Children: A 2-week morbidity recall was conducted for all children (6-59
months) to assess the prevalence of common diseases (e.g. malaria, diarrhoea).
Vaccination Status and Coverage:
For all children 6-59 months, information on BCG, Oral polio Vaccine (OPV) 1, OPV 3 and measles

6 | P a g e
vaccination was collected using health cards and recall from caregivers. The vaccination coverage was
calculated as the proportion of children immunized based on card and recall.
Vitamin A Supplementation Status: For all children 6-59 months of age, information on Vitamin A
supplementation was collected using the child welfare cards and recall from caregivers. Information on
whether the child had received supplementation in the last 6 months was collected. Vitamin A capsules
were also shown to the mothers to aid in recall.
De-worming Status: Information was solicited from the care takers as to whether their child/children 6-59
months had been de-wormed in the last 6 months.
Household Food Diversity: Dietary diversity is a qualitative measure of food consumption that reflects
household access to a wide variety of foods, and is also a proxy of the nutrient intake adequacy of the diet
for individuals. Dietary diversity scores were created by summing the number of food groups consumed
over a 24- hour period to aid in understanding if and how the diets are diversified. Household dietary
diversity score (HDDS) is meant to reflect, in a snap shot the economic ability of a household to consume
a variety of foods. A score of 1 was allocated to each food group that was consumed by the household and
a score of 0 for each of the food groups not consumed by the household, and thus the highest possible score
was 12.
Household Water Consumption and Utilization: The indicators used were main source of drinking and
household water, time taken to water source and back, cost of water per 20-litre jerry-can and treatment
given to drinking water.
Sanitation: Information on household accessibility to a toilet/latrine, disposal of children’s faeces and
occasions when the respondents wash their hands was obtained.
2.7 Organization of the Survey
Coordination/Collaboration: before the survey was conducted meetings were held with the respective
county authorities and key stakeholders briefed them about the purpose, objectives and methods for the
survey. The survey details were discussed with the County Steering Group, the National Draught
Management Authority, key partners on the ground (NGO and UN) and conducted in collaboration
with the County and Sub-Counties Health Offices. The authorities were requested to officially inform
the communities (villages) that were involved in the assessment.
Recruiting the Survey Team: recruitment was done by the Ministry of Health office at the County
level in order to give ownership and participation in the assessment.
Training of the Survey Team: the teams were given 4-days training prior to field work, including a
standardization test to ensure standardization of measurement and recording practice. All data
collectors were trained on taking anthropometric measurements, completion of questionnaires and
sampling methodology. The data collection forms and questionnaires were pilot tested in clusters not
selected to be part of the larger survey, to ensure that the interviewers and respondents understand the
questions and that interviewers follow correct protocols. One training was conducted and facilitated by
Ministry of Health and Nutrition Information Working Group supported by Concern Worldwide, World
Vision and Food for the Hungry.
Team work in the field: The teams each with four members who have experience in data collection
were organized/ selected from the survey area with each team consisting of 1 team leader, interviewer
and 2 measurers. In addition, supervisors from MoH, NDMA, World Vision, Concern Worldwide, and
Food for the Hungry, closely supervised the team throughout the survey. In moving from one randomly
selected household to another, the teams were guided by a village leader, or a community volunteer,
depending on the village and who was available.
7 | P a g e
2.8 Data Entry, Analysis and Report Writing
Data Analysis: the data downloading and analysis was done using ENA for SMART, Excel and SPSS
Statistical software version 17. The Concern Worldwide Survey and Surveillance Officer and
Monitoring and Evaluation Officer of World Vision were responsible for the Data downloading,
analysis and report writing. Results are presented using the new WHO reference levels.
Preliminary Results and Final Report: the preliminary findings were submitted by Survey and
Surveillance Officer of Concern Worldwide and Monitoring and Evaluation Officer of World Vision
to the CHMTs, stakeholders and the Nutrition Information Working Group (NIWG) within two weeks
of completion of the survey fieldwork at County and National level and included the prevalence of
global acute malnutrition as well as the prevalence of moderate and severe acute malnutrition,
vaccination and other relevant information.

8 | P a g e
CHAPTER THREE
3.0 SURVEY RESULTS AND DISCUSSION
3.1 Demographic Results
All the respondents from households in Laisamis and North Horr were residents. Majority of the
respondents were married as shown in the figure below:
Figure 2: Respondents Marital Status
3.2 Highest Education Level of the Household Head
Majority of the Household head in both North Horr and Laisamis Sub Counties have no Education as
shown below.
Figure 3: Highest Education Level of the HH Head
80.9%
85.1%
15.3%
11.6%
0.0% 20.0% 40.0% 60.0% 80.0% 100.0% 120.0%
North Horr
Laisamis
Proportion
Surv
ey Z
on
e
Marital Status
Married Single Widow Divorced Separated
6.8%
7.2%
84.9%
85.9%
0.0% 20.0% 40.0% 60.0% 80.0% 100.0% 120.0%
North Horr
Laisamis
Proportion
Surv
ey Z
on
e
Highest Education Level of the HH Head
Pre primary Primary Secondary Tertiary None Others

9 | P a g e
3.3 Main Occupation of the Household head
The main source of Livelihood of the Household Head in Laisamis and North Horr is livestock herding at
86.9% and 86.2 % respectively followed by Casual Labor.
Figure 4: Main Occupation of the HH Head
3.4 Main Source of income of the Household Head
The main source of income of the Household Head in Laisamis and North Horr is sale of livestock at
82.9% and 71.5 % respectively followed by Casual Labor.
Figure 5: main Source of Income of the HH head
86.2%
86.9%
2.6%
2.0%
5.7%
5.0%
2.8%
2.0%
75.0% 80.0% 85.0% 90.0% 95.0% 100.0% 105.0%
North Horr
Laisamis
Proportion
Surv
ey Z
on
e
Main Occupation Of the HH Head Livestock Herding
Own Farm labor
Employed
Casual labour
Petty trade
Merchant/Trader
Firewood/Charcoal
Fishing
Bee Keeping
71.5%
82.9%
5.1%
6.4%
0.0% 20.0% 40.0% 60.0% 80.0% 100.0% 120.0%
NorthHorr
Laisamis
Proportion
Surv
ey Z
on
e
Source of Income of the HH Head No income
Sale of livestock
Sale of livestockproducts
Sale of crops
Petty trading
Casual labour
Permanent Job
Sale of Personnelassets
Remittance
Bee Keeping
Others

10 | P a g e
3.5 Nutritional Status of Under-Five Children
3.5.1 Prevalence of acute malnutrition (weight-for-height z-score –WHO Standards 2006)
The survey managed to reach a total of 421 and 436 children aged between 6 to 59 months in Laisamis and
North Horr Sub Counties respectively whose anthropometric measurements were taken.
In this survey, GAM was defined as the proportion of children with a z-score of less than -2 z-scores weight-
for-height and/or presence of bilateral edema. Severe Acute Malnutrition (SAM) was defined as the
proportion of children with a z-score of less than -3 z-score and/or presence of edema.
Further, using the mid-upper arm circumference (MUAC), GAM was defined as the proportion of children
with a MUAC of less than 125 mm and/or presence of edema while SAM was defined as the proportion of
children with a MUAC of less than 115 mm and/or presence of edema.
Malnutrition by Z-Score: WHO (2006) Standard
• Severe acute malnutrition is defined by WFH < -3 SD and/or existing bilateral edema on the lower
limbs
• Moderate acute malnutrition is defined by WFH < -2 SD and >-3 SD and no edema
• Global acute malnutrition is defined by WFH < -2 SD and/or existing bilateral edema
Malnutrition by MUAC
• Severe malnutrition is defined by MUAC<115 mm and/or presence of bilateral edema
• Moderate malnutrition is defined by MUAC < 125 mm and ≥115 mm and no edema
• Global acute malnutrition is defined by MUAC <125 mm and/or existing bilateral edema
The Global Acute malnutrition levels in Laisamis, North Horr, Sub Counties were above the emergency
GAM thresholds (15.0%) indicating a critical situation. North Horr Sub County recorded the highest level
of malnutrition of 31.5 percent (95% CI: 25.3-38.5) with Laisamis Sub County at 24.7 percent (95% CI:
19.3-31.0).
The nutrition situation is interpreted as very critical in North Horr and Laisamis Sub Counties with the
GAM rates being >20%. In relation to the children who were severely malnourished, the nutrition situation
in Laisamis and North Horr is classified as critical. The classification is based on the WHO growth
standards. There were no cases of edema that were reported.
The high levels of acute malnutrition in North Horr and Laisamis sub counties can be attributed mainly to
the drought condition being experienced across the Marsabit County and lack of functional community
units’ hence poor community health services. In addition, Low nutrition activities funding from the health
department are highly contributing to high malnutrition levels.
Table 3: Prevalence of acute malnutrition by WHZ
North Horr July
2016
North Horr
January 2017
Laisamis July
2016
Laisamis
January 2017
Global Acute
Malnutrition (GAM)
22.8% (17.8-28.7) 31.5%(25.3-38.5) 22.5%(18.2-27.4) 24.7% (19.3-31.0 )
Severe Acute
Malnutrition (SAM)
3.6% (1.8- 6.9) 9.8% (6.6-14.3) 4.7%( 2.6- 8.3) 5.5%( 3.5- 8.5)
% of Oedema 0.0% 0.0% 0.0% 0.0%
11 | P a g e
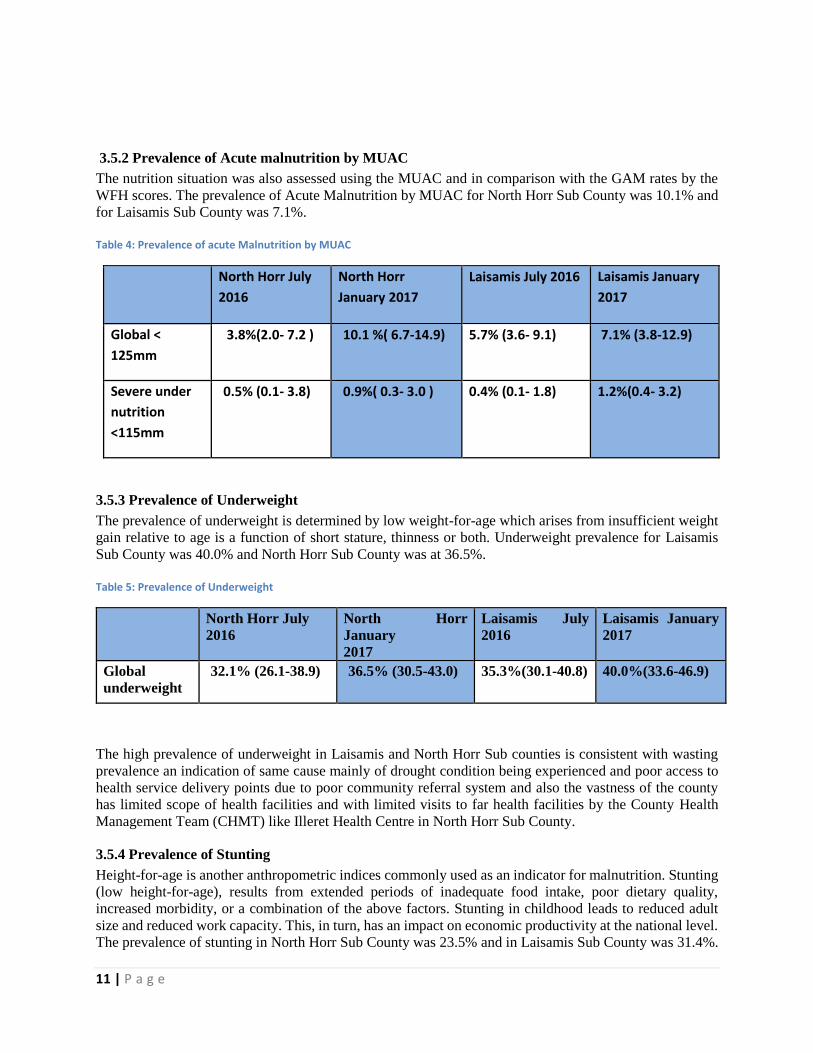
3.5.2 Prevalence of Acute malnutrition by MUAC
The nutrition situation was also assessed using the MUAC and in comparison with the GAM rates by the
WFH scores. The prevalence of Acute Malnutrition by MUAC for North Horr Sub County was 10.1% and
for Laisamis Sub County was 7.1%.
Table 4: Prevalence of acute Malnutrition by MUAC
North Horr July
2016
North Horr
January 2017
Laisamis July 2016 Laisamis January
2017
Global <
125mm
3.8%(2.0- 7.2 ) 10.1 %( 6.7-14.9) 5.7% (3.6- 9.1) 7.1% (3.8-12.9)
Severe under
nutrition
<115mm
0.5% (0.1- 3.8) 0.9%( 0.3- 3.0 ) 0.4% (0.1- 1.8) 1.2%(0.4- 3.2)
3.5.3 Prevalence of Underweight
The prevalence of underweight is determined by low weight-for-age which arises from insufficient weight
gain relative to age is a function of short stature, thinness or both. Underweight prevalence for Laisamis
Sub County was 40.0% and North Horr Sub County was at 36.5%.
Table 5: Prevalence of Underweight
North Horr July
2016
North Horr
January
2017
Laisamis July
2016
Laisamis January
2017
Global
underweight
32.1% (26.1-38.9) 36.5% (30.5-43.0) 35.3%(30.1-40.8) 40.0%(33.6-46.9)
The high prevalence of underweight in Laisamis and North Horr Sub counties is consistent with wasting
prevalence an indication of same cause mainly of drought condition being experienced and poor access to
health service delivery points due to poor community referral system and also the vastness of the county
has limited scope of health facilities and with limited visits to far health facilities by the County Health
Management Team (CHMT) like Illeret Health Centre in North Horr Sub County.
3.5.4 Prevalence of Stunting
Height-for-age is another anthropometric indices commonly used as an indicator for malnutrition. Stunting
(low height-for-age), results from extended periods of inadequate food intake, poor dietary quality,
increased morbidity, or a combination of the above factors. Stunting in childhood leads to reduced adult
size and reduced work capacity. This, in turn, has an impact on economic productivity at the national level.
The prevalence of stunting in North Horr Sub County was 23.5% and in Laisamis Sub County was 31.4%.
12 | P a g e
Table 6: Prevalence of Stunting
North Horr July
2016
North Horr January
2017
Laisamis July 2016 Laisamis January
2017
Global
Stunting
25.4% (20.6-30.8) 23.5%(19.5-28.1 ) 30.4%(24.5-37.1) 31.4%(25.9-37.4 )
The high stunting levels could be attributed to the poor dietary intake both in terms of quantity and quality
as evidenced by the household dietary diversity score which showed that the survey population relied
heavily on 4 major food groups (cereals, legumes, fats & oils and sugars) which are predominantly high in
energy but lack in the essential micronutrients required for proper growth and development mainly found
in vegetables, fruits and protein-rich foods of animal sources e.g. meat, eggs, fish etc.
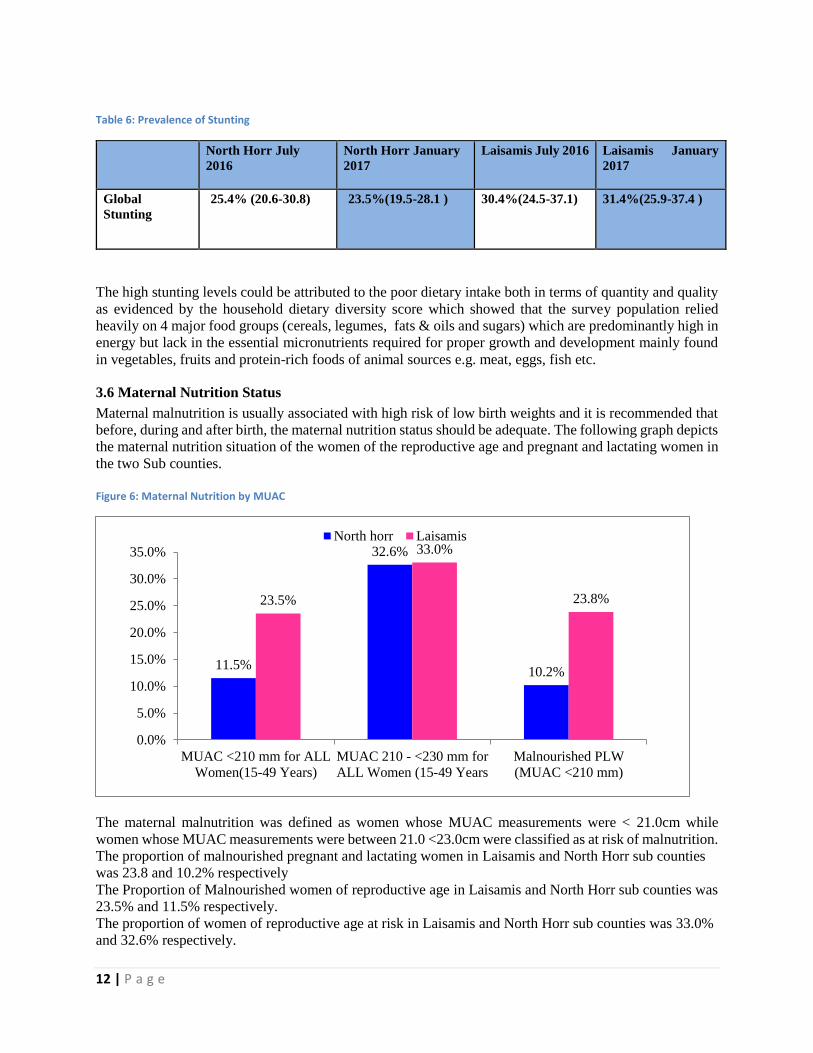
3.6 Maternal Nutrition Status
Maternal malnutrition is usually associated with high risk of low birth weights and it is recommended that
before, during and after birth, the maternal nutrition status should be adequate. The following graph depicts
the maternal nutrition situation of the women of the reproductive age and pregnant and lactating women in
the two Sub counties.
Figure 6: Maternal Nutrition by MUAC
The maternal malnutrition was defined as women whose MUAC measurements were < 21.0cm while
women whose MUAC measurements were between 21.0 <23.0cm were classified as at risk of malnutrition.
The proportion of malnourished pregnant and lactating women in Laisamis and North Horr sub counties
was 23.8 and 10.2% respectively
The Proportion of Malnourished women of reproductive age in Laisamis and North Horr sub counties was
23.5% and 11.5% respectively.
The proportion of women of reproductive age at risk in Laisamis and North Horr sub counties was 33.0%
and 32.6% respectively.
11.5%
32.6%
10.2%
23.5%
33.0%
23.8%
0.0%
5.0%
10.0%
15.0%
20.0%
25.0%
30.0%
35.0%
MUAC <210 mm for ALL
Women(15-49 Years)
MUAC 210 - <230 mm for
ALL Women (15-49 Years
Malnourished PLW
(MUAC <210 mm)
North horr Laisamis

13 | P a g e
3.7 CHILD HEALTH AND IMMUNIZATION
3.7.1 Morbidity and Health Seeking Behaviour
The morbidity of the children in the survey area was determined within a 2 week recall period. 25.2% (110)
and 43.2% (182) of children in North Horr and Laisamis respectively were reported to have been ill two
weeks prior to survey. Upon further analysis, it was found out that the leading causes of morbidity in North
Horr was fever which accounted for 73.6% of the cases while in Laisamis was acute respiratory infections-
ARI which accounted for 52.7% of the cases. The prevalence of watery diarrhoea was reported highest in
North Horr at 34.5%. The prevalence of bloody diarrhoea was only reported in North Horr at 2.7%. This is
depicted in the graph below.
Figure 7: Children Morbidity
In terms of the health seeking behaviour of the caregivers who had sick children with a period of 2 weeks
before the survey, 49.1% and 72.5% of caregivers reported to have sought medical assistance when their
children were ill in North Horr and Laisamis respectively.
Figure 8: Health seeking Behavior
73.6%41.8% 34.5%
2.7% 7.3%
35.2%
52.7%
28.6%
4.4%0.0%
50.0%
100.0%
150.0%
Fever ARI Waterly Diarrhoea Bloody Diarrhoea Others
Children Morbidity
North Horr Laisamis
1.9% 5.6%
6.1%5.3%
79.6%
77.3%
0.0% 20.0% 40.0% 60.0% 80.0% 100.0% 120.0%
North
Horr
Laisamis
Percent of Children
Su
rvey
Zon
e
Health Seeking Behaviour Traditional Healer
Community Health
workerMobile Clinic
Relative/Friend
Private Clinic/Pharmacy
Shops/kiosk
Local herbs
NGO/FBO
Public Clinic
Others
14 | P a g e
77.3% and 79.6% of the caregivers in Laisamis and North Horr respectively sought health assistance from
Public Clinic when their children were ill while 1.9% in North Horr sought health assistance from traditional
healers and 5.3%in Laisamis sought health assistance from Local Herbs.
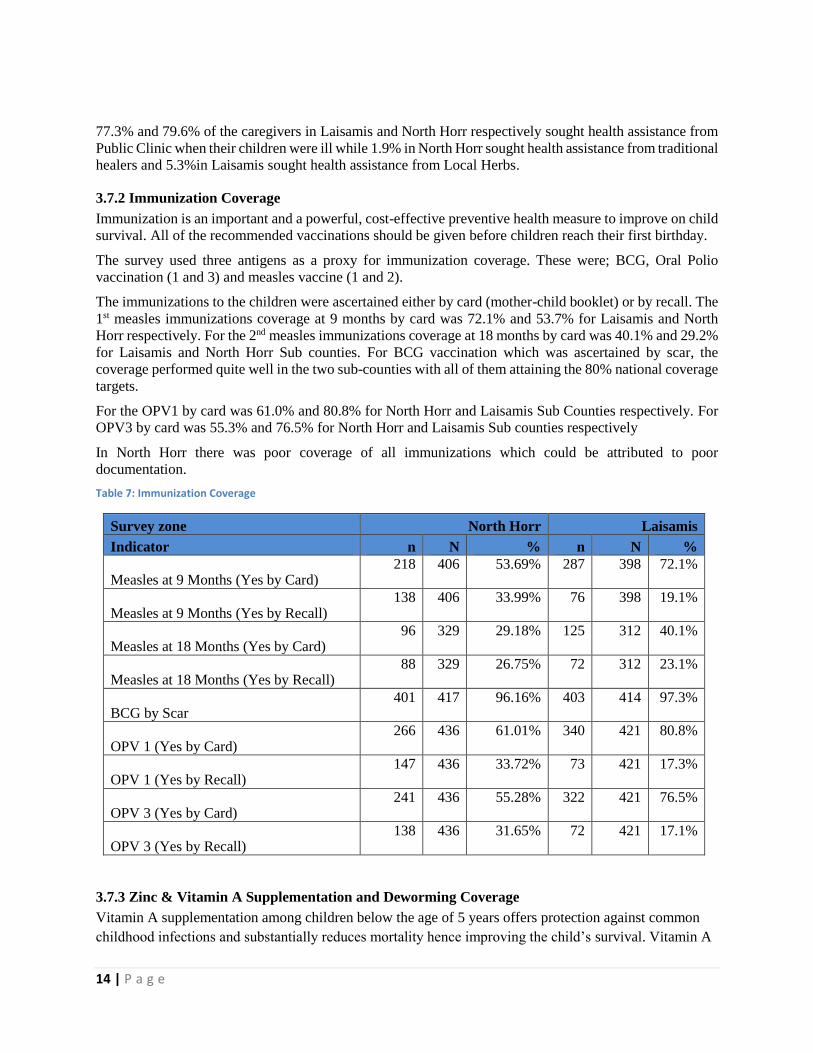
3.7.2 Immunization Coverage
Immunization is an important and a powerful, cost-effective preventive health measure to improve on child
survival. All of the recommended vaccinations should be given before children reach their first birthday.
The survey used three antigens as a proxy for immunization coverage. These were; BCG, Oral Polio
vaccination (1 and 3) and measles vaccine (1 and 2).
The immunizations to the children were ascertained either by card (mother-child booklet) or by recall. The
1st measles immunizations coverage at 9 months by card was 72.1% and 53.7% for Laisamis and North
Horr respectively. For the 2nd measles immunizations coverage at 18 months by card was 40.1% and 29.2%
for Laisamis and North Horr Sub counties. For BCG vaccination which was ascertained by scar, the
coverage performed quite well in the two sub-counties with all of them attaining the 80% national coverage
targets.
For the OPV1 by card was 61.0% and 80.8% for North Horr and Laisamis Sub Counties respectively. For
OPV3 by card was 55.3% and 76.5% for North Horr and Laisamis Sub counties respectively
In North Horr there was poor coverage of all immunizations which could be attributed to poor
documentation.
Table 7: Immunization Coverage
Survey zone North Horr Laisamis
Indicator n N % n N %
Measles at 9 Months (Yes by Card) 218 406 53.69% 287 398 72.1%
Measles at 9 Months (Yes by Recall) 138 406 33.99% 76 398 19.1%
Measles at 18 Months (Yes by Card) 96 329 29.18% 125 312 40.1%
Measles at 18 Months (Yes by Recall) 88 329 26.75% 72 312 23.1%
BCG by Scar 401 417 96.16% 403 414 97.3%
OPV 1 (Yes by Card) 266 436 61.01% 340 421 80.8%
OPV 1 (Yes by Recall) 147 436 33.72% 73 421 17.3%
OPV 3 (Yes by Card) 241 436 55.28% 322 421 76.5%
OPV 3 (Yes by Recall) 138 436 31.65% 72 421 17.1%
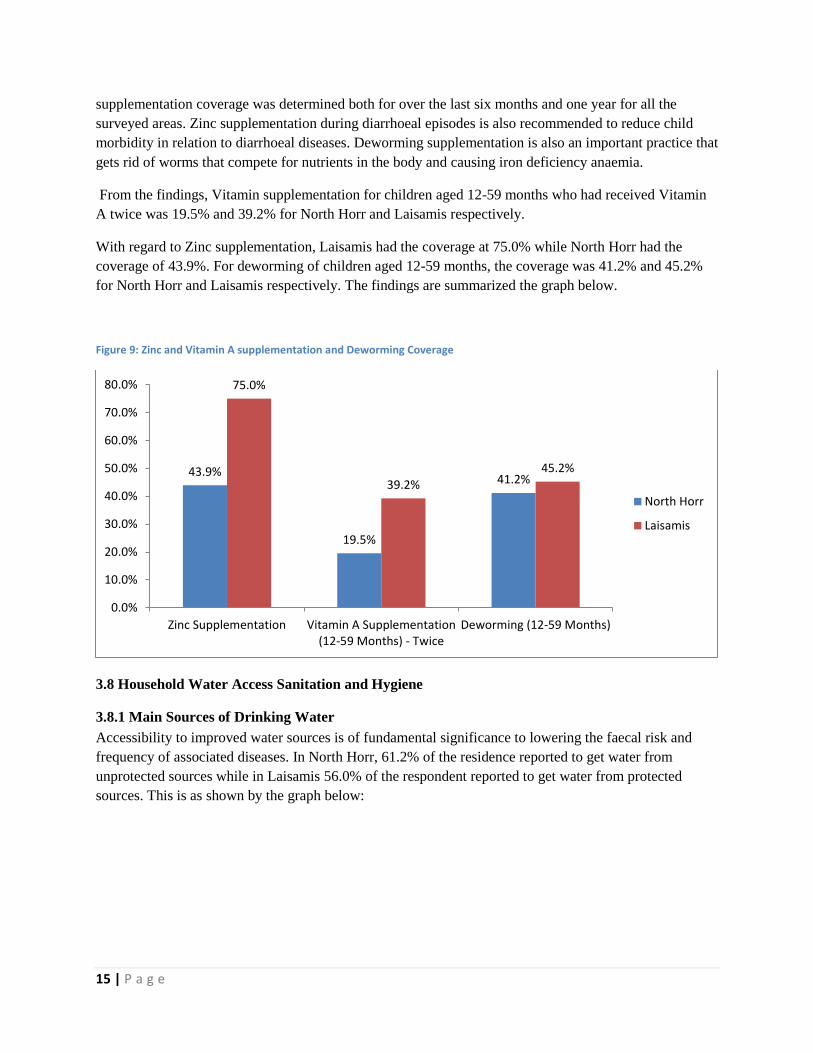
3.7.3 Zinc & Vitamin A Supplementation and Deworming Coverage
Vitamin A supplementation among children below the age of 5 years offers protection against common
childhood infections and substantially reduces mortality hence improving the child’s survival. Vitamin A
15 | P a g e
supplementation coverage was determined both for over the last six months and one year for all the
surveyed areas. Zinc supplementation during diarrhoeal episodes is also recommended to reduce child
morbidity in relation to diarrhoeal diseases. Deworming supplementation is also an important practice that
gets rid of worms that compete for nutrients in the body and causing iron deficiency anaemia.
From the findings, Vitamin supplementation for children aged 12-59 months who had received Vitamin
A twice was 19.5% and 39.2% for North Horr and Laisamis respectively.
With regard to Zinc supplementation, Laisamis had the coverage at 75.0% while North Horr had the
coverage of 43.9%. For deworming of children aged 12-59 months, the coverage was 41.2% and 45.2%
for North Horr and Laisamis respectively. The findings are summarized the graph below.
Figure 9: Zinc and Vitamin A supplementation and Deworming Coverage
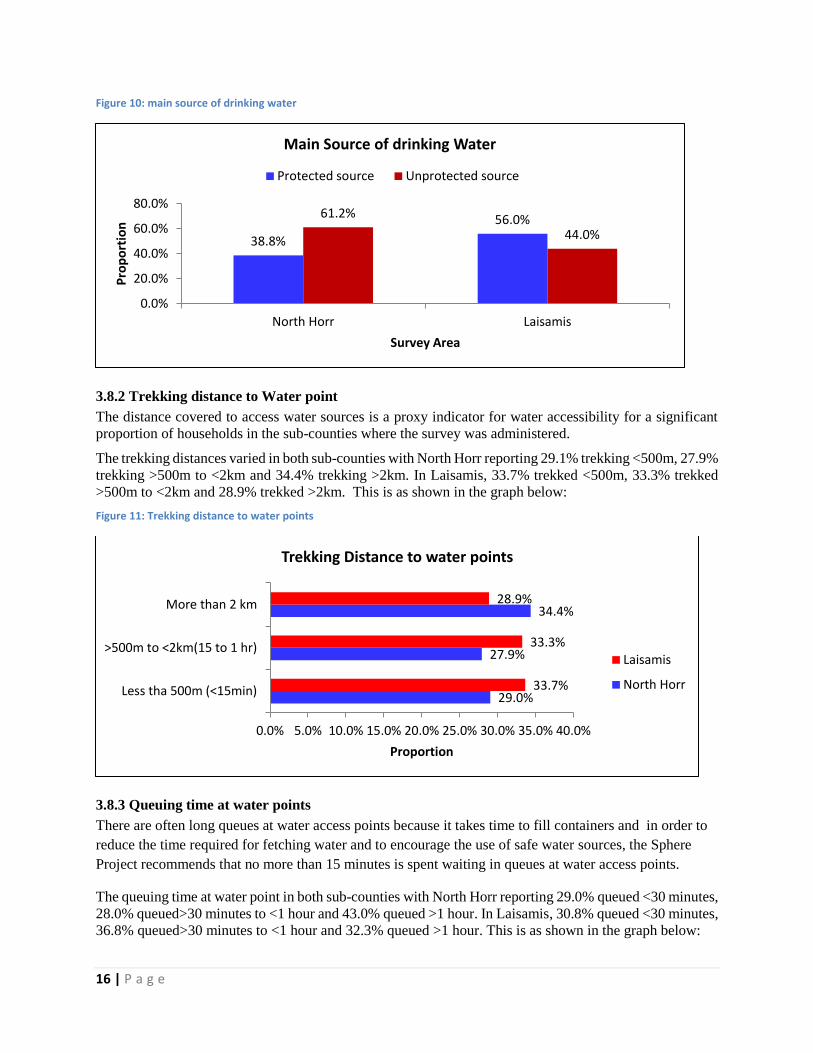
3.8 Household Water Access Sanitation and Hygiene
3.8.1 Main Sources of Drinking Water
Accessibility to improved water sources is of fundamental significance to lowering the faecal risk and
frequency of associated diseases. In North Horr, 61.2% of the residence reported to get water from
unprotected sources while in Laisamis 56.0% of the respondent reported to get water from protected
sources. This is as shown by the graph below:
43.9%
19.5%
41.2%
75.0%
39.2%
45.2%
0.0%
10.0%
20.0%
30.0%
40.0%
50.0%
60.0%
70.0%
80.0%
Zinc Supplementation Vitamin A Supplementation(12-59 Months) - Twice
Deworming (12-59 Months)
North Horr
Laisamis
16 | P a g e
Figure 10: main source of drinking water
3.8.2 Trekking distance to Water point
The distance covered to access water sources is a proxy indicator for water accessibility for a significant
proportion of households in the sub-counties where the survey was administered.
The trekking distances varied in both sub-counties with North Horr reporting 29.1% trekking <500m, 27.9%
trekking >500m to <2km and 34.4% trekking >2km. In Laisamis, 33.7% trekked <500m, 33.3% trekked
>500m to <2km and 28.9% trekked >2km. This is as shown in the graph below:
Figure 11: Trekking distance to water points
3.8.3 Queuing time at water points
There are often long queues at water access points because it takes time to fill containers and in order to
reduce the time required for fetching water and to encourage the use of safe water sources, the Sphere
Project recommends that no more than 15 minutes is spent waiting in queues at water access points.
The queuing time at water point in both sub-counties with North Horr reporting 29.0% queued <30 minutes,
28.0% queued>30 minutes to <1 hour and 43.0% queued >1 hour. In Laisamis, 30.8% queued <30 minutes,
36.8% queued>30 minutes to <1 hour and 32.3% queued >1 hour. This is as shown in the graph below:
38.8%
56.0%61.2%
44.0%
0.0%
20.0%
40.0%
60.0%
80.0%
North Horr Laisamis
Pro
po
rtio
n
Survey Area
Main Source of drinking Water
Protected source Unprotected source
29.0%
27.9%
34.4%
33.7%
33.3%
28.9%
0.0% 5.0% 10.0% 15.0% 20.0% 25.0% 30.0% 35.0% 40.0%
Less tha 500m (<15min)
>500m to <2km(15 to 1 hr)
More than 2 km
Proportion
Trekking Distance to water points
Laisamis
North Horr

17 | P a g e
Figure 12: Queuing time at water points
3.8.4 Water treatment and hand washing
With regard to treatment of the water before consumption, the situation varied in both sub-counties. In
North Horr Sub County 9.4% while in Laisamis Sub county only 6.4% of the respondent who treated water
before consumption.
Handwashing with soap is one of the most effective and inexpensive interventions for preventing
diarrheal diseases and pneumonia, which together account for 3.5 million child deaths annually
worldwide.1 Handwashing is important for good health. Effective washing can be practiced with
alternatives to soap and using a variety of different hygienic facilities. Overall, interventions to promote
handwashing might save a million lives a year. Each person should be able to wash hands with water and
soap after toilet use, before food preparation, before eating and after cleaning babies.
With regard to hand washing at 4 critical times, the practice was poor in both sub-counties with 10.2% in
North Horr and 4.8% in Laisamis reported to have washed their hands at the critical times. This is as shown
by the following graph:
Figure 13: Water treatment and Handwashing
1 Cairncross, S. and Valdmanis V. (2006) Chapter 41: Water Supply, Sanitation, and Hygiene Promotion. In D.T. Jamison, J.G. Breman, A.R. Measham, et al. (Editors), Disease Control Priorities in Developing Countries, 2nd edition (771-792). Washington (DC): World Bank.
29.0%
28.0%
43.0%
30.8%
36.8%
32.3%
0.0% 10.0% 20.0% 30.0% 40.0% 50.0%
Less than 30 minutes
30-1 hr
More than 1 hr
Proportion
Queuing time at water Points
Laisamis
North Horr
10.20%
4.80%
9.40%
6.40%
0.00%
2.00%
4.00%
6.00%
8.00%
10.00%
12.00%
North Horr Laisamis
Handwashing at 4 critical times Water Treatment
18 | P a g e
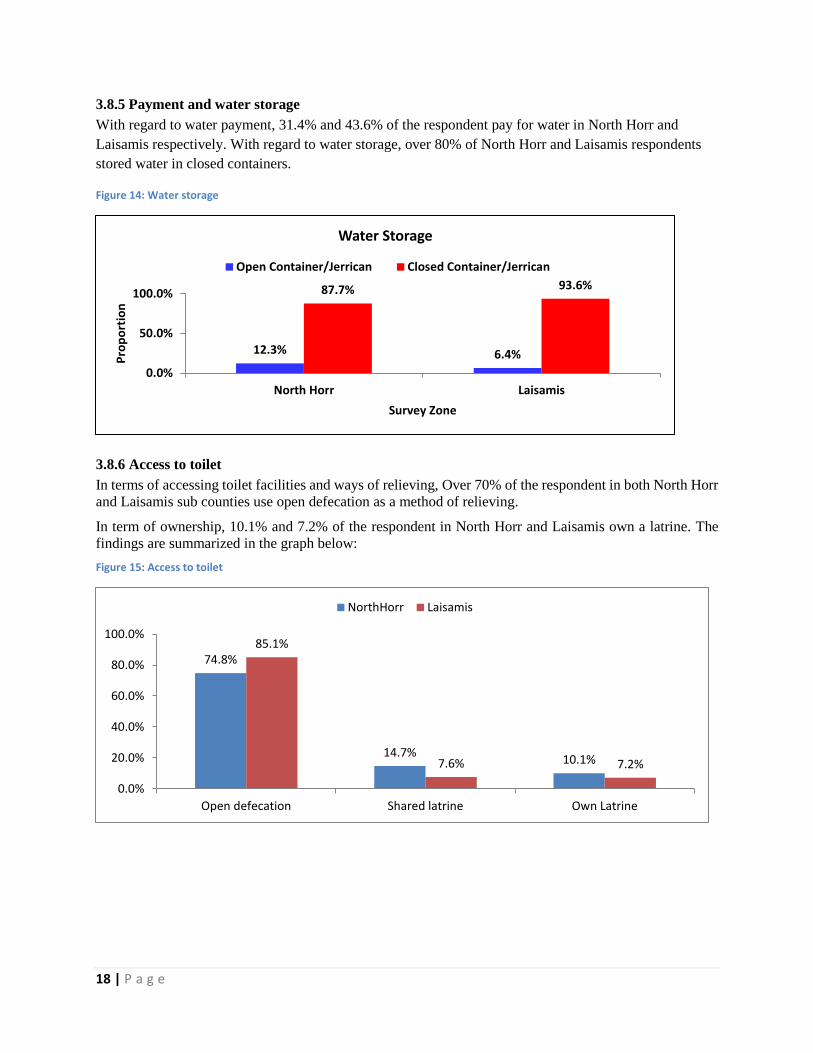
3.8.5 Payment and water storage
With regard to water payment, 31.4% and 43.6% of the respondent pay for water in North Horr and
Laisamis respectively. With regard to water storage, over 80% of North Horr and Laisamis respondents
stored water in closed containers.
Figure 14: Water storage
3.8.6 Access to toilet
In terms of accessing toilet facilities and ways of relieving, Over 70% of the respondent in both North Horr
and Laisamis sub counties use open defecation as a method of relieving.
In term of ownership, 10.1% and 7.2% of the respondent in North Horr and Laisamis own a latrine. The
findings are summarized in the graph below:
Figure 15: Access to toilet
12.3% 6.4%
87.7% 93.6%
0.0%
50.0%
100.0%
North Horr Laisamis
Pro
po
rtio
n
Survey Zone
Water Storage
Open Container/Jerrican Closed Container/Jerrican
74.8%
14.7%10.1%
85.1%
7.6% 7.2%
0.0%
20.0%
40.0%
60.0%
80.0%
100.0%
Open defecation Shared latrine Own Latrine
NorthHorr Laisamis

19 | P a g e
3.9 Food Security
3.9.1 Women dietary Diversity
Women of reproductive age (WRA)2 are often nutritionally vulnerable because of the physiological
demands of pregnancy and lactation. Requirements for most nutrients are higher for pregnant and
lactating women than for adult men3. Outside of pregnancy and lactation, other than for iron,
requirements for WRA may be similar to or lower than those of adult men, but because women may be
smaller and eat less (fewer calories), they require a more nutrient-dense diet 4 Insufficient nutrient intakes
before and during pregnancy and lactation can affect both women and their infants. Yet in many resource
poor environments, diet quality for WRA is very poor, and there are gaps between intakes and
requirements for a range of micronutrients5. In assessing the nutritional quality and quantity of the food
consumed by the surveyed women of reproductive age, a 24 hour recall period household dietary diversity
questionnaire was administered and consumption of 10 food groups in the both Sub Counties is depicted
in the graph below. In Laisamis, starch is the most consumed by women at 81.3% while in North Horr,
dairy Products and legumes and pulses were the most consumed food groups by women at 93.4%. In
Laisamis, Nuts and seeds were the least fed on food group at 1.5% while in North Horr; eggs were the
least fed on food group at 1.7% by the Women within the last 24 hours. This is as shown in the graph
below:
Figure 16: Food groups consumed by women
3.9.2 Minimum Dietary Diversity for Women
MDD-W6 is a dichotomous indicator of whether or not women 15-49 years of age have consumed at least
five out of ten defined food groups the previous day or night. The proportion of women 15–49 years of
age who reach this minimum in a population can be used as a proxy indicator for higher micronutrient
2 For the purposes of this document and indicator, WRA are defined as those 15–49 years of age. 3 National Research Council, 2006; World Health Organization [WHO]/Food and Agriculture Organization of the United Nations [FAO], 2004 4 “Nutrient density” refers to the ratio of nutrients (such as vitamins and minerals) to the energy content of foods. 5 Arimond et al., 2010; Lee et al. 2013 6 Additional background on the indicator is available at: http://www.fantaproject.org/monitoring-and-evaluation/ minimum-dietary-diversity-
women-indicator-mddw.
63.2%
81.3%
93.4%
48.6%
93.4%
78.9%
36.0%
21.1%
0.0% 50.0% 100.0% 150.0% 200.0% 250.0% 300.0% 350.0%
North Horr
Laisamis
Percent
Surv
ey
Zon
e
Food groups consumed by women starch
Dairy products
Vit A veges
legume/ pulses
Other veges
flesh foods
Vit A Fruits
eggs
Other fruits
nuts/ seeds

20 | P a g e
adequacy, one important dimension of diet quality. The indicator constitutes an important step towards
filling the need for indicators for use in national and subnational assessments. It is a population-level
indicator based on a recall period of a single day and night, so although data are collected from individual
women, the indicator cannot be used to describe diet quality for an individual woman. This is because of
normal day-to-day variability in individual intakes.
With regard to Minimum WDDS, Over 90% of the women surveyed had consumed less than 5 food
groups in both North Horr and Laisamis Sub counties. 10.0% and 6.7% of the women surveyed had
consumed 5 and more food groups in both North Horr and Laisamis Sub counties respectively. This is as
shown in the graph below:
Figure 17: Minimum Women Dietary Diversity Score
3.9.3 Household Dietary Diversity
In assessing the nutritional quality and quantity of the food consumed by the survey population, a 1 week
retrospective household dietary diversity questionnaire was administered that would also help to
determine the households’ economic capacity to consume various foods in the sub-counties.
Four main food groups were consumed and were consistent in both sub-counties where the survey was
conducted. This were cereals, legumes and pulses, fats and oils and sweets which were consumed by at
least >80% of the population that was surveyed within the last 7 days. Iron rich foods, fish, eggs, fruits
and vegetables was consumed by at least >15% of the surveyed population and was consistent in both
sub-counties. This is as shown in the graph below:
90.0% 93.3%
10.0% 6.7%
0.0%
50.0%
100.0%
North Horr Laisamis
Pro
po
rtio
n
Survey Zone
Minimum WDD Score
< 5 Food groups 5 and more food groups

21 | P a g e
Figure 18: 12 Food groups Consumed by the HH
The proportion of households consuming cereals and cereal products and pulses and legumes was high and
could be attributed to general food distribution during the drought period.
3.9.4 Minimum Household Dietary Diversity
Minimum Household Dietary Diversity is indicator of whether or not a household has consumed at least
three out of twelve defined food groups within the last 7 days. Over 70% of the household surveyed had
consumed 3 to 5 food groups in both Sub counties. 8.6% and 14.7% of the household surveyed had
consumed more than 5 food groups in North Horr and Laisamis sub counties respectively.
Figure 19: Minimum Household Dietary Diversity
93.6%
6.8%
2.8%
9.7%
20.6%
0.7%
11.2%
82.0%
76.3%
90.8%
86.8%
29.8%
0.0% 20.0% 40.0% 60.0% 80.0% 100.0%
Cereals and cereal Products
Vegetables
Fruits
Iron rich Foods
flesh foods
eggs
Fish
Pulses and Legumes
Milk and milk products
Oils/fats
Sweets
Condiments
Proportion
12 food groups consumed by the HH
Laisamis North Horr
11.9%
79.6%
8.6%13.5%
71.7%
14.7%
0.0%
20.0%
40.0%
60.0%
80.0%
100.0%
<3 food groups 3 to 5 food groups >5 Food groups
Pro
po
rtio
n
Minimum Household Dietary Diversity
North Horr
Laisamis

22 | P a g e
3.9.5 Household Food Consumption Score
The food consumption score is an acceptable proxy indicator to measure caloric intake and diet quality at
household level, giving an indication of food security status of the household. It’s a composite score based
on dietary diversity, food frequency and relative nutritional importance of different food groups. Laisamis
had the highest proportion with poor food consumption (25.3%) and North Horr at 14.9%. Laisamis had
the highest proportion with border food consumption at risk to poor food consumption (32.5%) and North
Horr at 9.2%. This is as shown in the figure below:
Figure 20: Household Food Consumption Score
3.9.6 Food Consumption Score –Nutrition
WFP’s key corporate indicator for measuring food insecurity is the Food Consumption Score (FCS) used
to define categories of household (HH) food insecurity. The information gathered to develop the FCS
additionally provides a wealth of unexploited data that can be used to inform on nutrient rich groups
consumed by the HH and which are essential for nutritional health and well-being: protein, iron and
vitamin A.
All macronutrients (carbohydrates, proteins and lipids) and micronutrients (vitamins and minerals) are
important to ensure a healthy life, and all nutrients should be represented in a sufficient quantity for a
balanced diet.
Macronutrients are good sources of energy. A lack in energy quickly leads to acute undernutrition. An
insufficient intake of protein (essential for growth) is a risk for wasting and stunting. It also has an impact
on micronutrient intake as protein foods are rich sources of vitamins and minerals.
Deficiencies in micronutrients, such as vitamin A and iron, over a long period of time, lead to chronic
undernutrition. Iron deficiency leads to anaemia and Vitamin A deficiency leads to blindness and
interferes with the normal functioning of the immune system, growth and development as well as
reproduction.
This tool chooses to focus on three key nutrients; Protein, Vitamin A and Iron (hem iron) primarily for
their nutritional importance but also those foods rich in these nutrients can be easily grouped from food
consumption data.
With Regard to Food consumption Score Nutrition, among the household surveyed in North Horr Sub
Counties, 81.8% consumed protein Rich foods, 1.7% consumed Vitamin A rich foods and 4.4%
consumed Hem Iron rich foods for 7 days.
14.9%25.3%
9.2%
32.5%
75.9%
42.2%
0.0%
20.0%
40.0%
60.0%
80.0%
North Horr Laisamis
Pro
po
rtio
n
Survey Zone
Household Food consumption Score
Poor Food Consumption Border Food Consumption Good Food Consumption

23 | P a g e
Figure 21: Frequency Consumption of Protein, Vitamin A and Iron rich foods in North Horr Sub County
With Regard to Food consumption Score Nutrition, among the household surveyed in Laisamis Sub
Counties, 52.4% consumed protein Rich foods, 4.2% consumed Vitamin A rich foods, and 6.0%
consumed Hem Iron rich foods for 7 days.
Figure 22: Frequency Consumption of Protein, Vitamin A and Iron rich Foods in Laisamis Sub County
3.9.7 Micro Nutrient
The poor quality of the habitual diet and the lack of dietary diversity in much of the developing world
contribute to deficiencies of micronutrients. Micronutrient malnutrition is a global problem much bigger
than hunger and imposes enormous costs on societies in terms of ill health, lives lost, reduced economic
productivity and poor quality of life. Addressing the global challenge of micronutrient malnutrition
requires the need for many strategies – both short- and intermediate-term and long-term sustainable
approaches. In addition to the conventional approaches of micronutrient supplementation and
fortification, promoting sustainable food based approaches to enable adequate intakes of micronutrients
5.70%
88.40%71.00%
81.80%
1.70% 4.40%
0.00%
20.00%
40.00%
60.00%
80.00%
100.00%
120.00%
Protein Rich Foods Vitamin A rich Foods Hem Iron Rich Foods
Pe
rce
nt
of
HH
s
Frequency Consumption of Protein, Vitamin A and Iron rich Foods North Horr Sub County
None Some(1-5 Days) Frequent(6-7Days)
10.60%
85.90% 78.30%
52.40%
4.20% 6.00%
0.00%
20.00%
40.00%
60.00%
80.00%
100.00%
120.00%
Protein Rich Foods Vitamin A rich Foods Hem Iron Rich Foods
Frequency Consumption of Protein, Vitamin A and Iron rich Foods For Laisamis Sub County
None Some(1-5 Days) Frequent(6-7Days)

24 | P a g e
by much of the population includes dietary diversification strategies and agriculture-based approaches.
Dietary diversification is possible by the promotion of homestead food production, which includes home
gardening, small livestock rearing and fishing as well as the processing and preservation of food.
Agriculture and agricultural biotechnology offer the opportunity of increasing crop yields and have the
potential to improve the micronutrient content of staple foods and cereal crops, thus contributing to better
nutrition of populations and thereby helping to achieve nutrition security. By ensuring food and nutrition
security and by reducing the widespread problem of micronutrient malnutrition we may hope to achieve
the targets set for the Millennium Development Goals.
With Regard to Household Consumption of micronutrient rich Foods, among the household surveyed in
North Horr Sub County, 3.5% had consumed Fruits and Vegetables, 6.3% had consumed Iron rich Foods
and 0.7% had consumed Vitamin A rich foods, 82.7 % had consumed protein rich foods and 47.8% had
consumed staples for 7 days.
Figure 23: Household Consumption of Micro nutrients rich foods in North Horr Sub County
With Regard to Household Consumption of micronutrient rich Foods, among the household surveyed in
Laisamis Sub County, 9.4% had consumed Fruits and Vegetables, 5.4% had consumed Iron rich Foods
and 1.0% had consumed Vitamin A rich foods, 57.4 % had consumed protein rich foods and 38.8% had
consumed staples for 7 days.
6.40% 5.70%
91.70%78.10%
97.40%
9.20%
47.80%
82.70%
3.50% 6.30% 0.70%
60.30%
0.00%
20.00%
40.00%
60.00%
80.00%
100.00%
120.00%
Staples Protein FRUITS &VEGES Iron Vitamin A Oils/Fats
Pe
rce
nt
of
HH
s
Household Consumption of micronutrient rich Foods in North Horr
None Some(1-5 Days) Frequent(6-7Days)

25 | P a g e
Figure 24: Household Consumption of Micro nutrient rich foods in Laisamis Sub County
4.0 Livelihood
4.1 Coping strategy Index
The Coping Strategy Index (CSI), a tool developed by the World Food Programme, is commonly used as
a proxy indicator for access to food.7 It is a weighted score that allows one to measure the frequency and
severity of coping strategies. Data is collected on the number of days in the last seven days a household
used a specific coping strategy due to a shortage of food and/or income.
The mean coping strategy Index for Laisamis Sub County was 26.47 and for North Horr Sub county was
12.07.
Figure 25: Mean Strategy Coping Index
7 ‘Access to food’ is just one of the three pillars of food security. Other pillars include, ‘food availability’ and ‘food utilization’.
5.80% 10.60%
78.50% 78.70%94.40%
7.60%
38.80%57.40%
9.40% 5.40% 1.00%
45.40%
0.00%
20.00%
40.00%
60.00%
80.00%
100.00%
120.00%
Staples Protein FRUITS&VEGES
Iron Vitamin A Oils/Fats
Pe
rce
nt
of
HH
s
Household Consumption of micronutrient rich Foods in Laisamis
None Some(1-5 Days) Frequent(6-7Days)
12.07
26.47
0
5
10
15
20
25
30
North Horr Laisamis
CSI
Sco
re
Survey Zone
Mean Strategy Coping Index

26 | P a g e
Chapter 4
CONCLUSION AND RECOMMENDATIONS
FINDINGS RECOMMENDATION ACTOR (BY
WHOM?)
TIME
LINE
Very Critical Levels of
GAM in North Horr
and Laisamis of 31.5%
and 24.7%
Respectively
Conduct Mass screening in all the
hotspots (screening of the
Malnourished children and
treatment through existing Health
facilities and outreach sites)
Scaling up of the NACS
(Nutrition assessment, counselling
and Support) in all the health
Facilities within the hotspot areas.
Scale up of integrated outreach
services in both sub counties by
mapping of the Old and New
Health Facilities/Outreaches in the
area and then identify any Gaps in
services provision.
Rolling out and strengthening the
Community Health Strategy
There is need to promote the
consumption of the least
consumed food groups such as
eggs, fish, fruits, and vegetables.
Low consumption of eggs and fish
has been attached to cultural
practices and hence it’s important
to design a BCC approach to
address the issues.
IPs and the MoH Ongoing
Low Vitamin A,
Deworming Coverage
and Zinc
Supplementation for
Diarrhoea Management
Sensitization of health workers on
the need for documentation of
both Vitamin A and Deworming
Services on Child Health Booklet
Integrate Vitamin A and
Deworming in the outreaches.
Targeting the Early Childhood
Education Centres for both
All IPS and
County health
department
Immediately

27 | P a g e
Vitamin A and Deworming
Activities.
Strengthen the health system for
monitoring of the nutrition
indicators.
Inadequate household
water access and poor
water treatment as well
as poor hand washing
practices
Conduct/scale up health education
targeting behaviour change on
part of handwashing at critical
times.
Provision of water treatment
chemicals to households obtaining
water from unsafe sources
All IPS and
County health
department
Immediately
Poor access to health
service delivery points
Remapping of Outreaches to
match the hotspot areas in the Sub
Counties.
Strengthening community referral
system through the community
units.
All IPS and
County health
department
Immediately
.
Few health facilities
have implementing
IMAM surge
Approach
Full role out of IMAM surge
Approach in all the health
facilities
MoH and IPS Ongoing
Poor mobilization in
hygiene and sanitation
related issues
Community sensitization on the
importance of proper human
waste disposal through
community based forums and
schools
MoH and IPS
Low latrine coverage Scaling up of latrine coverage
using the CLTS approach
MoH and
WASH Partners
Inadequate HR in
Health Facilities.
Employment of CHEWs to
monitor community level
interventions
MoH
ANNEXES
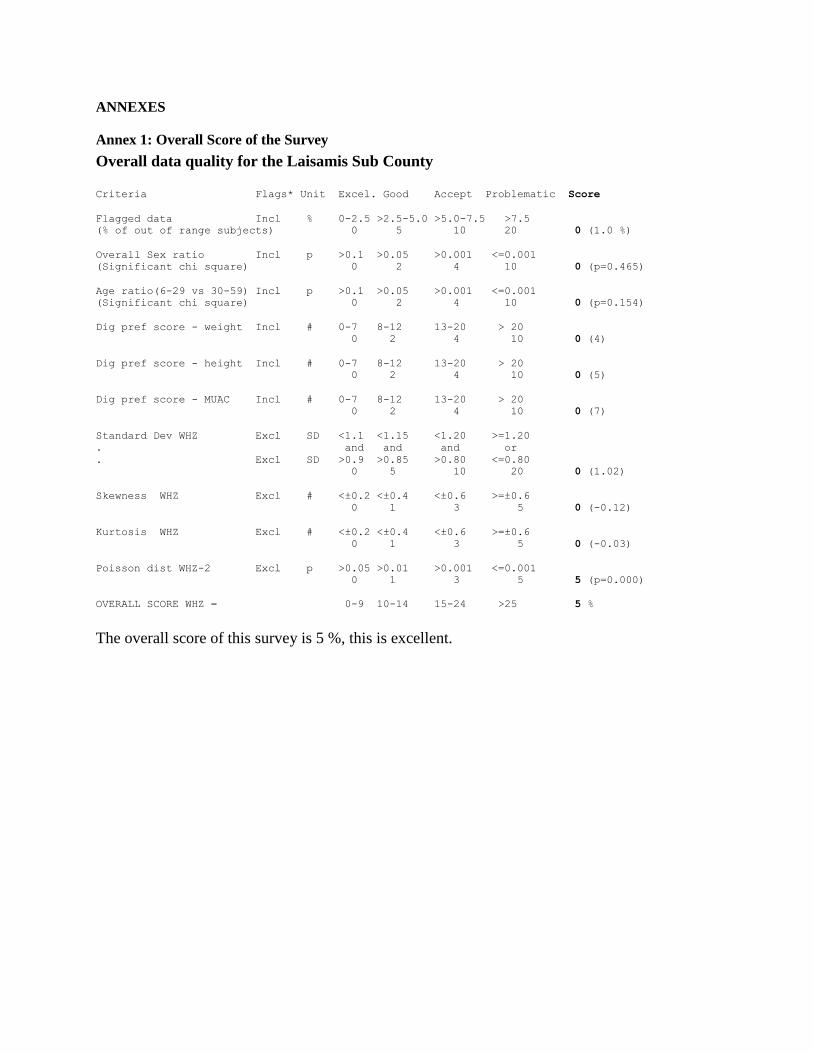
Annex 1: Overall Score of the Survey
Overall data quality for the Laisamis Sub County
Criteria Flags* Unit Excel. Good Accept Problematic Score
Flagged data Incl % 0-2.5 >2.5-5.0 >5.0-7.5 >7.5
(% of out of range subjects) 0 5 10 20 0 (1.0 %)
Overall Sex ratio Incl p >0.1 >0.05 >0.001 <=0.001
(Significant chi square) 0 2 4 10 0 (p=0.465)
Age ratio(6-29 vs 30-59) Incl p >0.1 >0.05 >0.001 <=0.001
(Significant chi square) 0 2 4 10 0 (p=0.154)
Dig pref score - weight Incl # 0-7 8-12 13-20 > 20
0 2 4 10 0 (4)
Dig pref score - height Incl # 0-7 8-12 13-20 > 20
0 2 4 10 0 (5)
Dig pref score - MUAC Incl # 0-7 8-12 13-20 > 20
0 2 4 10 0 (7)
Standard Dev WHZ Excl SD <1.1 <1.15 <1.20 >=1.20
. and and and or
. Excl SD >0.9 >0.85 >0.80 <=0.80
0 5 10 20 0 (1.02)
Skewness WHZ Excl # <±0.2 <±0.4 <±0.6 >=±0.6
0 1 3 5 0 (-0.12)
Kurtosis WHZ Excl # <±0.2 <±0.4 <±0.6 >=±0.6
0 1 3 5 0 (-0.03)
Poisson dist WHZ-2 Excl p >0.05 >0.01 >0.001 <=0.001
0 1 3 5 5 (p=0.000)
OVERALL SCORE WHZ = 0-9 10-14 15-24 >25 5 %
The overall score of this survey is 5 %, this is excellent.

Annex 2: MAP of Marsabit County