
Smart Specialisation at work: The entrepreneurial...
25
1 Smart Specialisation at work: The entrepreneurial discovery as a continuous process S3 Working Paper Series No. 12/2017 Elisabetta Marinelli Inmaculada Perianez Forte 2017 EUR 28838 EN
-
Upload
nguyendiep -
Category
Documents
-
view
217 -
download
1
Transcript of Smart Specialisation at work: The entrepreneurial...
1
Smart Specialisation at work
The entrepreneurial discovery
as a continuous process
S3 Working Paper Series
No 122017
Elisabetta Marinelli
Inmaculada Perianez Forte
2017
EUR 28838 EN
This publication is a Technical report by the Joint Research Centre (JRC) the European Commissionrsquos science
and knowledge service It aims to provide evidence-based scientific support to the European policymaking
process The scientific output expressed does not imply a policy position of the European Commission Neither
the European Commission nor any person acting on behalf of the Commission is responsible for the use that
might be made of this publication
Contact information
Name Elisabetta Marinelli
Address C Inca Garcilaso 3 E-41092 SEVILLA
Email ElisabettaMarinellieceuropaeu
Tel +34-95-4488323
JRC Science Hub
httpseceuropaeujrc
JRC108571
EUR 28838 EN
PDF ISBN 978-92-79-74377-1 ISSN 1831-9424 doi102760514714
Luxembourg Publications Office of the European Union 2017
copy European Union 2017
The reuse of the document is authorised provided the source is acknowledged and the original meaning or
message of the texts are not distorted The European Commission shall not be held liable for any consequences
stemming from the reuse
How to cite this report Marinelli E Perianez-Forte I (2017) Smart Specialisation at work The
entrepreneurial discovery as a continuous process Publications Office of the European Union Luxembourg 2017 ISBN 978-92-79-74377-1 doi102760514714 JRC108571
All images copy European Union 2017 except the cover picture copy maccc image 117683424 2017 Source
fotoliacom
2
Smart Specialisation at work Empirical insights
on the Entrepreneurial Discovery Process ndash from
RIS3 design to RIS3 implementation
Elisabetta Marinelli and Inmaculada Perianez-Forte
European Commission Joint Research Centre
Territorial Development Unit Seville (Spain)
S3 Working Paper Series No 122017 ndash June 2017
Abstract
The term Entrepreneurial Discovery Process (or EDP) originally referred to the identification of areas for
investment in research and innovation (ie priority-areas) through an inclusive and evidence-based process grounded in stakeholdersrsquo engagement The experience of the S3 Platform has highlighted on the one hand that the concept itself has evolved from being a process limited to the identification of investment-priorities in the design-phase of a Smart Specialisation Strategy into a continuous activity which keeps going throughout the strategyrsquos implementation on the other that there was a significant gap in understanding how different actors engaged in the EDP Such continuous EDP implies that stakeholders are kept engaged in the refinement of priority-areas the identification of instruments that would implement them as well as the RIS3 governance and monitoring mechanisms that would allow the expected competitive advantages to emerge With this report we address both issues Firstly we submit the concept of continuous EDP to an empirical test Secondly we look in depth at the role of different stakeholders in the EDP (especially in the design phase of RIS3) To do so we present the results of a survey run in the S3 Platform aimed at monitoring current practices in the EDP The survey provides information on how the 4-ple helix has taken part in the EDP and provides insights on the relationship between the different actors and the public body responsible for the EDP The results confirm that once investment priorities have been identified with the involvement of stakeholders various mechanisms that keep them engaged in following the development of such priorities are often put in place Finally the results indicate that the EDP as a continuous process is proving positive and satisfactory
Keywords Entrepreneurial discovery process (EDP) regional innovation strategies stakeholders
involvement investment priorities smart specialisation prioritisation
Disclaimer The views expressed are purely those of the authors and may not in any circumstances be regarded as stating an official position of the European Commission
Acknowledgements The authors wish to thank the Spanish Regional Development Agencies (Foro ADR) as well as the interregional consortium for the Interreg project Beyond EDP The regions represented in the two organisations reviewed several drafts of the survey and provided valuable suggestions to the survey used to write this paper The authors also wish to thank colleagues at the S3 Platform in particular Carlo Gianelle Krzysztof Mieszkowski Fabrizio Guzzo and Gabriel Rissola for their valuable comments to the survey
3
Contents
Abstract 2
1 Introduction understanding the Entrepreneurial Discovery Process 4
2 The survey on EDP structure and aims 4
3 Survey results 6
31 A continuous EDP 7
311 EDP during the design phase 7
312 EDP during the implementation phase 9
32 Engagement of stakeholders in the EDP 12
a) Research and Higher education ndash 1st Helix 14
b) Public Sector ndash 2nd Helix 15
c) Private Sector ndash 3rd Helix 16
d) Civil Society ndash 4th Helix 17
e) Other actors 18
33 EDP self-evaluation 19
4 Conclusions and next steps 20
4
1 Introduction understanding the Entrepreneurial Discovery
Process
The term Entrepreneurial Discovery Process (EDP) was introduced to refer to the bottom-
up identification of investment-priorities on research and innovation within the design of
a Smart Specialisation Strategy In the EDP stakeholdersrsquo interaction -accompanied by
sound evidence- is used to explore new techno-economic opportunities and to feed into
public decision-making processes
Six years since the onset of S3 the S3 Platform of the Joint Research Centre has
detected a demand for a deeper understanding of how EU regions have engaged in such
process
In particular it has appeared necessary to map more rigorously two aspects
the EDP as a continuous process starting from the way in which the process had
been organised in the design phase and moving to the ramifications of the EDP
throughout the strategiesrsquo implementation
the actors that took part to the EDPs in EU regions and their role within the EDP
As for the former point Periantildeez et al (2016) highlighted the need for a reflection and
update of the EDP concept itself The EDP appears to have evolved from an activity
conceived exclusively for choosing investments priorities under the ERDF Thematic
Objective 1 into a continuous process permeating S3 implementation (ibid) Such
continuous EDP does start with the identification of broad priorities during the definition
of RIS3 yet keeps going throughout the strategyrsquos implementation stakeholders are
kept engaged in different ways in the refinement of the priority-areas the identification
of instruments that would implement them as well as the RIS3 governance and
monitoring mechanisms that should deliver the expected competitive advantages in each
area
To explore such knowledge gaps the S3 Platform in collaboration with the project
Targeted Support to Lagging Regions launched a survey in early 2017 and this report
presents the results of this study The report is organised as follows section 2 describes
the structure and aims of the survey as well as the information on the response rate and
geographical distribution of respondents Section 3 delves into the results of the survey
covering three parts (31) the way the EDP has developed during the RIS3 design phase
and continues during RIS3 implementation (32) the role of different stakeholders in
the EDP and (33) an evaluation of the EDP Section 4 concludes and identifies future
steps for research and policy-support1
2 The survey on EDP structure and aims
The unit of analysis of the S3 Platform survey is the Entrepreneurial Discovery Process
itself from the onset of RIS3 design to its implementation
The survey explores various elements of the policy cycle to identify the role of different
stakeholders within it and their ability to keep reflecting on investment-priorities and feeding into the policy process The survey is organised in 3 parts2
1 The thorough understanding of the EDP derived from the survey will serve as a basis for planning further
activities of the S3 platform and of the project ldquoRIS3 Targeted Support in Lagging Regionsrdquo 2 The whole survey is annexed to the report
5
Part 1 looks at the EDP during the design phase of RIS3 (ie until the
approval of the RIS3 OPs and Action Plans) This part focusses on how the
identification of investment priorities was organised paying attention to the
actual desired and expected role of different stakeholders This part of the survey
provides on the one hand an in-depth understanding of how the 4-ple helix took
part on the EDP on the other it explores the mechanisms structures and
methods that were put in place to identify the first broad set of investment
priorities
Part 2 looks at the EDP during the implementation-phase of RIS3 policy
cycle This part effectively tests the concept of continuous entrepreneurial
discovery It explores how regions are keeping (or planning to keep) stakeholders
engaged with the implementation and the evolution of the priority areas allowing
further discovery to take place This is done by looking at the instruments chosen
for implementation as well as the governance system It also looks at broader
stakeholdersrsquo involvement in RIS3 as a pre-condition for continuous EDP
Part 3 gives the respondents the opportunity to self-evaluate the EDP-
experience along four different dimensions
Throughout the survey we cover a wide array of stakeholders going beyond the
traditional private public and research sector and including the 4th helix and other
actors whose role remains still unknown yet deserves to be explored The actors covered
are listed in the table below
Table 1 Stakeholders list and abbreviation
Stakeholder invited Short name
Higher education institutions High edu Research sector (1st Helix) Research organisations Research org
Regional government and agencies Reg gov Public sector (2nd Helix) Local government Loc gov
National government Nat gov
European Commission EC
Regional SMEs Reg SMEs Private sector (3rd Helix) Regional Large firms Reg l firms
Business associationsChambers of commerce
Buss Assoc
Clusters organisations Clusters
Incubators accelerators and business parks Inc acc bus parks
Foreign firms For Firms
National firms Nat firms
Civil society organisations (NGOs etc) Civil society Civil society (4th Helix) Labor unions Labor unions
User-centered communities and labs User-centred spaces
Communication media Media Other
Financial entities (eg banks) Financial ent
Risk capital Risk cap
6
The survey was targeted to the bodies implementing EDP and was sent to all entities
registered in the S3 platform It was open for approximately 7 weeks between January and February 20173 The JRC received a total of 59 answers4
Table 2 provides information on the distribution of the respondents and geographical
location As indicated in the table respondents cluster largely around less development
(424) and more developed regions (458) with only 5 transition regions replying to
the survey Interestingly 2 non-EU regions also took part
Table 2 Respondents by level of development of the region
Type
of region
Freq
Geographical distribution
LESS
DEVELOPED
(of which 2
NUTS3)
25 424
MORE
DEVELOPED
27 458
TRANSITION 5 85
NOT EU 2 34
All the responses including those from NUTS3 and non-EU regions have been included in
the analysis in the remaining of the document
3 Survey results
The wealth of results produced by the survey have been organised in three sections
3 In designing and implementing the survey the JRC benefited from the close collaboration with the Spanish Regional Development Agencies (Foro ADR) the interregional consortium of the Interreg project acuteBeyond EDPacute as well as with the regions participating in the JRC projects ldquoRIS3 Targeted Support in Lagging Regionsrdquo and ldquoHigher Education and Smart Specialisationrdquo who all answered the questionnaire 4 Assessing the appropriateness of the response rate required some reflection The universe of EDPs our
research subject is unknown in size because the EDPs were developed in different territorial and administrative context including
NUTS2 level as part of the regional RIS3 and linked to regionally managed OPs
NUTS2 level as part to national RIS3 and hence linked to national OPs
NUTS3 level independently from structural funds
Outside the EU independently from structural funds
Without including NUTS3 and non-EU responses we have assumed that
at the very least there are as many EDPs as there are Operational Programmes tackling TO1 (176)
at the very most there are as many EDPs as there are NUTS2 regions (276) The response rate hence lies between 199 (55276) in the latter hypothesis and 3125 (55176) in the former This rate can be considered satisfactory
7
In section 31 acuteA continuous EDPacutewe explore the organisation of the EDP in the design
phase and tests the concept of continuous EDP by looking at how the discovery in given
priority areas continues throughout RIS3 implementation
In section 32 acuteEngagement of stakeholders in the EDPacute we explore in depth the role of
different stakeholders within the EDP and their relationship with the public body in
charge of it
Finally section 33 covers the regions Self-evaluation of the EDP process exploring its
utility challenges and the overall satisfaction with the process
31 A continuous EDP
Understand the EDP and testing its continuous nature requires looking at
The EDP during the RIS3 design phase (ie until the approval of the RIS3
OPs and Action Plans) focussing on how the bottom-up identification of
investment priorities was organised
The EDP during the RIS3 implementation phase detecting the mechanisms
throughout the policy cycle that allow stakeholders to be kept engaged with the
evolution and implementation of the previously identified priority areas
311 EDP during the design phase
To understand how stakeholders were involved during the RIS3 design phase and how
priorities were identified we have looked at a) Which stakeholders were invited b) The
methods employed to engage them c) The institutional set-up used to deploy the EDP
d) The use made of stakeholdersrsquo input These aspects give insights on the efforts and
changes undertaken by the public administration to ensure an active participation of a
diverse and new portfolio of stakeholders in the policy cycle
Which stakeholders
Graph 1 reports the frequency with which different stakeholders were invited to take part
to the EDP during the RIS3 design
Graph 1 Stakeholders invited to the EDP in the RIS3 design phase
0
10
20
30
40
50
60
Hig
h e
du
Res
ear
ch o
rg
Reg
go
v
Loc
go
v
Nat
go
v EC
Reg
SM
Es
Reg
l f
irm
s
Bu
ss A
sso
c
Clu
ste
rs
Inc
acc
b
us
par
ks
For
Fir
ms
Nat
fir
ms
Civ
il so
cie
ty
Lab
or
un
ion
s
Use
r-ce
ntr
ed
Me
dia
Fin
anci
al e
nt
Ris
k ca
p
8
It highlights that research actors were virtually always included in the EDP As for the
public sector the survey unsurprisingly shows a preference for regional and local actors
which were invited more often than national and EC representatives in line with the
place-based nature of RIS3 As for the private sector almost all respondents declared
inviting regional SMEs large firms business associations and clusters Innovation actors
such as incubators accelerators and business parks have partaken to the EDP in 42 out
of the 59 cases reported Inviting national or foreign firms present in the territory was
less common with just over 50 of respondents declaring to have involved foreign
firms and only 19 having involved national firms When looking at the fourth helix we
notice that civil society organisations have been invited in over 60 of the cases
whereas the proportion for labour unions and user-centred facilities is respectively 44
and 37
Media financial entities and risk capital organisations appear ndashunsurprisingly- as
peripheral actors in the EDP and RIS3 process being invited in only 16 13 and 11 cases
respectively out of the 59 responses
All in all the EDP emerges as largely a 3-ple helix business with some interesting signals
emerging from the 4th helix
How to engage stakeholders to identify investment priorities
When exploring the methods applied to engage stakeholders to identify investment
priorities during the RIS3 design respondents were asked to choose between
informative and interactive methods The former referred to those methods by which
the public administration received inputsinformation from selected actors (eg surveys
bilateral dialogue) whereas the latter try to capture participatory methods that allowed
interaction across participating actors (eg Public meetings Workshops) With exception
of 6 regions which indicated that only informative methods were used the rest of
regions opted for a combination of both types of methods
Institutional set-up does the EDP need something new
Respondents were asked to indicate whether to implement the EDP the bodyinstitution
responsible for the RIS3 created new structures or adapted previous ones More
than three quarters of the respondents (763) indicated that the EDP had an impact on
the existing structures with 373 of respondents adapting existing structures 254
creating new structures and 136 both adapting and creating new structures In those
regions which have created new structures or adapted previous ones to facilitate
interaction among the public administration and different stakeholders those structures
are kept also during the RIS3 implementation This proves the willingness of regions in
keeping the EDP ongoing
These results clearly show that EDP has required and received a significant institutional
response to accommodate the demands of bottom-up processes This is illustrated in
table 3
Table 3 Structures for EDP
Responders
Adapted previous structures 373
Created new structures 254
Created amp adapted 136
None of the above 237
9
Stakeholdersrsquo input what and what for
Table 4 shows the result of a multiple-choice question where responders indicated that
the EDP was used to gather information actors views on investment for regional
development (83) and to generate consensus among them in relation to investment-
priorities (76)
Table 4 Aims of stakeholderrsquos interaction
Responders
Collect views on regional development 83
Build consensus on investment 76
Both 63
Likewise respondents were asked whether the outcomes of the EDP discussions were
used simply as advice or as a binding opinion (thereby committing the regional
authorities) Table 5 shows that the outcomes of the stakeholders interaction has
provided a binding opinion in 474 of the cases and only advice in the remaining
525 of responses The fact that in many regions the outcomes of the process were
considered binding opinions should be taken as an important success of the process5
Table 5 Use of EDP Outcomes
Responders
Providing advice 525
Providing advice and binding opinion 254
Providing binding opinion 22
All these results confirm that the EDP in the priority-identification phase was indeed
organised with the intention to allow a bottom-up opinion to emerge and to embed it in
the policy decision making
312 EDP during the implementation phase
Testing the concept of continuous entrepreneurial discovery during the RIS3
implementation requires looking at the involvement of stakeholders in the follow-up of
the identification of priorities in particular (a) the ability of stakeholders to review and
refine investment priorities within the governance system of RIS3 (b) the deployment
of implementation instruments that allow different stakeholders to keep exploring
priority-areas (c) the broader participation of stakeholders in RIS3 implementation
including monitoring and calls management as a pre-condition for a continuous EDP
Which stakeholders in RIS3 implementation
Compared to Graph 1 graph 2 reports the frequency with which different stakeholders
are being (or will be) engaged or in the EDP during the RIS3 implementation phase
It highlights that for research actors there is a strong expectation for their involvement
in governance and monitoring However they are ndash unsurprisingly- most frequently seen
as active in relation to calls for proposals as potential beneficiariesA similar pattern
emerges for private sector actors They are mainly perceived as beneficiaries to be
5 It would be interesting to follow up the regional development in those regions where the outcomes of the EDP
were binding opinion to assess the success of the process
10
engaged in activities related to calls for proposals Interesting private-sector
representative bodies (ie business associations and clusters) are those most often
perceived as engaged (or to be engaged) in monitoring and governance followed by
regional firms As for the public sector it is interesting to highlight how for regional
government National government and the EC their main role is in supporting
monitoring Whereas this is the least frequent aspect mentioned for local government
As for the quadruple helix the role of Civil Society (NGOs community organisations) is
more or less balanced across monitoring governance and calls for proposals Unions on
the other hand are more frequently considered as relevant for monitoring (in 17 cases)
as compared to calls for proposalsimplementation (15) or governance (14) Interestingly
user-centred facilities emerge as important beneficiaries with 26 regions considering
them important in relation to call for proposals and only 12 and 8 for monitoring and
governance respectivelyFinally financial entities risk capital and media which are
infrequent participants to RIS3 are taken into account mainly as their role with
investmentcall for proposals likely as supplementary sources of finance
Graph 2 Engagement of stakeholders during the EDP elements of RIS3 implementation
A continuous EDP in the RIS3 governance system
For the EDP to be considered as a continuous process there must be a governance
system that allows a continuous reflection with the stakeholders on the status of current
priorities (their refinement or review) and on the identification of new ones
The survey explored these aspects foreseeing three different levels of stakeholdersrsquo
involvement simple consultation (consisting of sharing information and providing
clarification to stakeholders) interaction (allowing for more in depth dialogue between
stakeholders and with the public administration) or consensus building (a more intense
form of exchange)
Table 6 shows that simpler forms of stakeholdersrsquo engagement (consultation and
interactive dialogue) are the most common On the other hand processes of consensus
building are reported only in 49 of the cases for the refinement of priorities and
4070 in the review of priorities All in all however the vast majority of regions have
governance mechanisms that engage stakeholders in the refinement (881) and review
(831) of priorities supporting the hypothesis that the EDP is best conceived as a
continuous process
31 31
40
30
20
10
19 18
29
25
20
8 8
18
14
86
4
8
35
31
44
25
32
24 23 22
3331
23
13
8
20
17
12
9 86
4846
40
36
19
11
4240
38 38 37
32
25
15
26
1513
15
Hig
h ed
u
Rese
arch
org
Reg
gov
Loc
gov
Nat
gov
EC
Reg
SM
Es
Reg
l fi
rms
Buss
Ass
oc
Clus
ters
Inc
acc
bu
shellip
For
Fir
ms
Nat
fir
ms
Civi
l soc
iety
Labo
r uni
ons
Use
r-ce
ntre
dhellip
Med
ia
Fina
ncia
l ent
Risk
cap
Governance Monitoring Calls for proposal
11
Table 6 Levels of stakeholderacutes involvement
Refinement
of priorities
Review
of priorities
Consultation 661 559
Interactive dialogue 559 492
Consensus building 492 4070
Any of the above 881 831
A continuous EDP in the RIS3 implementation instruments
The EDP can continue through the implementation phase also by deploying instruments
that implement innovation projects based on triple or quadruple helix collaboration
linked to market needs
To this aim the survey asks respondents whether they used policy instruments targeted
at consortia of actors and more specifically whether the consortia are asked to (a)
respond to public demand needs (for instance with calls for Pre-Commercial Public
Procurement) (b) develop and pursue shared action plans or (c) respond to the needs
expressed by users or consumersrsquo groups
These instruments effectively embody the EDP by allowing stakeholders to experiment in
previously identified (broad) priorities areas to refine them and to further the discovery
of new market segments
The results are highlighted in table 7
Table 7 EDP instruments
EDP-type instruments Frequency
Stakeholdersacute Consortia as beneficiaries of RIS3 calls 881
Consortia addressing public demands needs (PCPP) 45
Consortia implementing shared action plans 22
Consortia focussing on usersrsquo needs and participation 61
Either of the three 78
Results indicate that it is fairly common to target consortia as beneficiaries of RIS3 calls
(881) as well as applying instruments where consortia need to target usersrsquo needs
(61) Pre-commercial Public Procurement which can also be considered as an EDP
instrument is used in 45 whereas only 22 of respondents have instruments
supporting consortia implementing shared action plans
All in all 78 of the regions implement at least one of the instruments identified
validating the hypothesis of a continuous EDP process
12
Supporting a continuous EDP through monitoring and calls management
A continuous EDP needs to be embedded in a broader engagement of stakeholders
throughout RIS3 implementation Stakeholders involvement is a pre-condition for a
successful continuous EDP This section illustrates how the engagement of stakeholders
is ensured in different phases of the RIS3 implementation guaranteeing the continuity of
the EDP
Stakeholdersrsquo contribution to the monitoring phase
To this aim the survey has explored two complementary aspects of RIS3
implementation the monitoring process and the management of calls for proposals
As for the monitoring process the survey explored two ways of stakeholdersrsquo
involvement in the process a direct way whereby actors participate in the definition of
indicators or in the monitoring committee an indirect way whereby stakeholders are
passive in terms of producing monitoring outcomes but are informed about them andor
are engaged in decisions that build on monitoring results The results of the analysis are
provided in table 8 which also highlights that 100 of the regions engage stakeholders
in monitoring in at least one of the four ways identified
Table 8 Role of stakeholderacutes involvement during the monitoring
Role Level Direct Indirect Either direct
or indirect
Definition of indicators 475
100 Monitoring committee 339
Informed about monitoring outcomes 400
Involved in decisions based on monitoring 576
Stakeholdersrsquo engagement and callsrsquo management
In relation to calls management a good approach to stakeholdersrsquo engagement which
is supportive of a continuous EDP requires that they are duly informed of the investment
plans and if possible are able to provide feedback on the way calls are being organised
This should make sure that the funds will be appropriately taken-up and the RIS3
priorities implemented The survey highlighted that 644 of regions do publicly present
calls to stakeholders and that 576 present pre-calls providing the opportunity to
receive feedback before they are published In turn 881 of the regions engage in
either or both of these practices
The results of this paragraph indicate that RIS3 is commonly being implemented keeping
stakeholders engaged hence supporting a continuous EDP
32 Engagement of stakeholders in the EDP
This section analyses stakeholdersrsquo participation and engagement in the EDP process
For each stakeholder that had been invited to the EDP in the RIS3 design phase
respondents were asked to rate the level of engagement that they desired expected
and actually received6
6 (eg in answering emails participating in meetingsworkshops providing information to the public authorities
or engaging in any other EDP activity)
13
The type of engagement is defined as follows
Actual engagement effective and real participation of the stakeholder in the
EDP activities
Desired engagement level of contribution to the EDP activities that the public
administration would ideally receive from the stakeholder
Expected engagement involvement of the stakeholder in the EDP activities
realistically foreseen
Answers were organised on a 4-level scale from 0 to 3 with 0 indicating no engagement
and 3 indicating high engagement
Table 9 provides the average for the three scores for actual expected and desired
engagement
Table 9 Type of participation by stakeholders
Stakeholder invited Actual Desired Expected
Higher education institutions 255 279 260
Research organisations 254 280 262
Regional government and agencies 251 279 258
Local government 209 262 240
National government 207 231 221
European Commission 225 245 242
Regional SMEs 222 272 242
Regional Large firms 204 267 232
Business associationsChambers of commerce 225 265 242
Clusters organisations 243 283 264
Incubators accelerators and business parks 222 278 253
Foreign firms 170 243 197
National firms 189 239 206
Civil society 144 214 168
Labour unions 148 188 172
User-centered communities and labs 173 250 223
Independent experts 197 230 231
Media 113 247 180
Financial entities (eg banks) 122 211 167
Risk capital 167 250 218
Higher Education institutions have the highest average score for actual engagement
(255) shortly followed by Research Organisations (254) and Regional government
(251) Clusters come shortly after these three actors with an average of 243
Interestingly when it comes to desired engagement it is clusters to have the highest
average score (283) followed shortly after by research organisations (28) regional
government279) higher education (279) and incubators accelerators etc (278)
In terms of expected engagement we see again that clusters top the rank with an
average score of 264 shortly followed by research organisations (262) higher
education (260) and regional government (258) All in all clusters research and higher
14
education together with regional government appear as the main actors in terms of
engagement in the EDP process
321 Insights on stakeholdersrsquo engagement comparing actual desired and expected engagement
By looking at the difference between actual and expected engagement we are able to
draw useful insights on the relationships between the EDP organisers and the different
stakeholders
In particular when comparing the actual and the expected level of engagement we can
evaluate whether the EDP organiser has a good understanding of local actors
Specifically if the expected engagement is
the same as the actual one it means that the EDP organiser understands well
the behaviour of the stakeholders
higher than the actual one it indicates that the EDP organiser is
overestimating the interest of the stakeholders
lower than the actual one it suggests that the region had underestimated the
level of interest of a given actor This can be considered as a positive surprise
In formulas
119860119888119905119906119886119897119864119899119892119886119892119890119898119890119899119905 minus 119864119909119901119890119888119905119890119889119864119899119892119886119892119890119898119890119899119905 = 0 rarr 119866119900119900119889 119870119899119900119908119897119890119889119892119890 119900119891 119905ℎ119890 119878119905119886119896119890ℎ119900119897119889119890119903
119860119888119905119906119886119897119864119899119892119886119892119890119898119890119899119905 minus 119864119909119901119890119888119905119890119889119864119899119892119886119892119890119898119890119899119905 gt 0 rarr 119880119899119889119890119903119890119904119905119894119898119886119905119890119889 119878119905119886119896119890ℎ119900119897119889119890119903prime119904 119894119899119905119890119903119890119904119905
119860119888119905119906119886119897119864119899119892119886119892119890119898119890119899119905 minus 119864119909119901119890119888119905119890119889119864119899119892119886119892119890119898119890119899119905 lt 0 rarr 119874119907119890119903119890119904119905119894119898119886119905119890119889 119878119905119886119896119890ℎ119900119897119889119890119903prime119904 119894119899119905119890119903119890119904119905
Following a similar reasoning comparing the actual and desired level of engagement
allows evaluating how positive the relationship between the EDP organiser and the
individual stakeholders is Thus when the actual is
the same as the desired engagement it means the region has a satisfactory
relationship with stakeholders the region gets what they want from the actors (be
it a large or small level engagement)
higher than the desired engagement it suggests an intrusive relationship
with stakeholders participating in unwarranted ways to the process of
entrepreneurial discovery
lower than the desired engagement it indicates an unsatisfactory
relationship with the EDP organisers wishing more from the exchange with given
actors
In formulas
119860119888119905119906119886119897119864119899119892119886119892119890119898119890119899119905 minus 119863119890119904119894119903119890119889119864119899119892119886119892119890119898119890119899119905 = 0 rarr 119878119886119905119894119904119891119886119888119905119900119903119910 119903119890119897119886119905119894119900119899119904ℎ119894119901
119860119888119905119906119886119897119864119899119892119886119892119890119898119890119899119905 minus 119863119890119904119894119903119890119889119864119899119892119886119892119890119898119890119899119905 gt 0 rarr 119868119899119905119903119906119904119894119907119890 119903119890119897119886119905119894119900119899119904ℎ119894119901
119860119888119905119906119886119897119864119899119892119886119892119890119898119890119899119905 minus 119863119890119904119894119903119890119889119864119899119892119886119892119890119898119890119899119905 lt 0 rarr 119880119899119904119886119905119894119904119891119886119888119905119900119903119910 119903119890119897119886119905119894119900119899119904ℎ119894119901
The graphs below report for each group of stakeholders the proportion of regions
having scores equal bigger or lower than 0 in the difference between actual and
desired and actual and expected engagement
a) Research and Higher education ndash 1st Helix
Research organisations and higher education institutions are two of the main
stakeholders in the EDP for which the actual desired and expected engagement
emerged as the one of the highest in table 9 above
15
In graph 3 we notice that these stakeholders are well known in over 70 of the cases
the actual engagement matched the expected one Whilst the relationship with these
actors is often satisfactory (as reported by 714 and 745 of the regions for higher
education institutions and research organisations respectively) as shown in graph 4
approximately a quarter of respondents have found the relationship between universities
and research centres unsatisfactory (232 and 255 respectively) that is they
desired a higher engagement than the one actually experienced
b) Public Sector ndash 2nd Helix
Graphs 5 and 6 below reveal the patterns of relationship that the EDP organisers have
with public-sector stakeholders It emerges that whilst regional national and EC public
actors follow similar patterns local government has a somewhat different behaviour
Graph 5 Actual vs Expected engagement ndash 2nd
Helix
Notably in graph 5 a high majority of respondents revealed a good knowledge of
stakeholders of the public sector with the lowest proportion emerging for the EC
750667 690 632
104
48103
105
146286
207 263
Reg gov Loc gov Nat gov EC
Good Knowledge Underestimated interest
Overestimated interest
Graph 3 Actual vs Expected engagement ndash 1st
Helix
Graph 4 Actual vs Desired engagementndash 1st
Helix
714 745
54 00
232 255
High edu Research org
Satisfactory Intrusive Unsatisfactory
16
(632) and local government (667) Interestingly in the case of local government
there were fewer cases in which interest in the EDP was underestimated (48 as
compared to more than 10 for the other actors) whereas overestimation was most
common (286) This suggest a disengagement from the sub-regional level which is
confirmed in graph 6 where the relationship emerges as unsatisfactory in 523 of the
caseas as compared to 276 25 and 235 for National government the EC and
Regional government
c) Private Sector ndash 3rd Helix
As indicated in graph 7 in the case of the private sector the proportion of regions with a
good knowledge of and a satisfactory relationshop with stakeholders is in general lower
than in the case of research and higher education actors Only for clusters for more than
70 of respondents the actual engagement reflected the expected one
Graph 7 Actual vs Expected engagement ndash 3rd Helix
A satisfactory relationship one in which desired and actual enagement coincide emerges
most often with regional SMEs business associations clusters and incubators as shown
in graph 8 below The relationship emerges as unsatisfactory most often for foreign firms
434 472612
711
550414
588
208 151
12267
75207
118
358 377265 222
375 379294
Reg SMEs Reg L firms Buss Assoc Clusters Inc accbus parks
For Firms Nat firms
Good Knowledge Underestimated interest
Overestimated interest
Graph 6 Actual vs Desired engagement ndash 2nd
Helix
745
432
621 650
20
45
103 100
235
523
276 250
Reg gov Loc gov Nat gov EC
Satisfactory Intrusive Unsatisfactory
17
with facilities in the region (567) Interestingly more than 1 in 5 regions
underestimated the interest of local SMEs and foreign firms indicating that there is
scope for attempting to engage these actors further
Graph 8 Actual vs Desired engagement ndash 3rd Helix
d) Civil Society ndash 4th Helix
The graphs below refer to peripheral actors in the EDP which have infrequently been
invited or taken part to the process
Graph 9 Actual vs Expected engagement ndash 4th
Helix
Graph 10 Actual vs Desired engagement ndash 4th
Helix
Among the actors classified as part of the 4th helix we find that labour unions are the
ones that regions know best (68) and those where a satisfactory relationship is most
common (583) Civil society organisations are the least known (only in 333 of the
cases expected and actual engagement coincided) and the ones where an unsatisfactory
or intrusive relationship is most common and (83 of cases)The findings indicate that
much needs to be done to untap the potential of the 4-ple helix for innovation with
583 and 591 of regions finding the relationship with civil society organisations and
user-centered spaces unsatisfactory
500 481 529 553 525400 389
37 1959 43
00
33 111
463 500412 404
475567
500
Reg SMEs Reg L firms Buss Assoc Clusters Inc accbus parks
For Firms Nat firms
Satisfactory Intrusive Unsatisfactory
441
680500
176
40
45
382280
455
Civil society Labor unions User-centred spaces
Good Knowledge Underestimated interest
Overestimated interest
333
583409
83
42
00
583
375
591
Civil society Labor unions User-centred spaces
Satisfactory Intrusive Unsatisfactory
18
e) Other actors
Graph 11 and 12 below report information related to actors that have so far been
peripheral to the EDP namely media financial entities and risk capital
Graph 11 Actual vs Expected engagement ndash Other Graph 12 Actual vs Desired engagement ndash Other
The relationship with these actors is most often unsatisfactory as indicated on the right
hand graph with 80 889 and 593 of the regions not meeting their desires in
terms of engagement with media financial entities and risk capital respectively Media
and risk capital emerged as poorly known in graph 11 with approximately one third of
the regions displaying a good knowledge of this actor On the other hand nearly 56 of
the regions who engaged with financial entities gauged their expectations correctly
Despite the overall peripheral role of these actors some interesting dynamics emerge in
relation to Risk Capital with 182 of the regions engaging them finding them more
interested in the EDP process than expected
322 Stakeholdersrsquo engagement future desires
The graph below evaluates how the respondents would like the future engagement with
the different types of actors to be7
Whilst as shown in the previous sections of the report research actors are well known
and enjoy a good relationship with regional bodies in charge of RIS3 and whilst they
have been actively engaged throughout the process the survey highlights that more
engagement from their side is desired In the case of universities over 47 of
respondents would like them to be either somewhat more engaged (309) or
substantially more engaged (164) The pattern is similar for research organisations
where 377 of respondents would like them to be somewhat more engaged and 170
would like them to be substantially more engaged
Among the core EDP actors in the private sector it is interesting to notice that it is
regional SMEs and Regional firms where most often respondents are unsatisfied with
their past level of engagement and would like a significantly higher participation For
SMEs 15 regions (288) indicated that whereas for large firms 13 (25)Among public
actors it is interesting to notice a few cases in which local government national
government and the EC are welcome to be less engaged in the future (23 and 4
respondents respectively)
7 Only respondents who had invited a given stakeholders were asked to evaluate their future desired
engagement with the latter
333
556
364
67
00
182
600444 455
Media Financial ent Risk cap
Good Knowledge Underestimated interest
Overestimated interest
200111
333
83
800889
583
Media Financial ent Risk cap
Satisfactory Intrusive Unsatisfactory
19
Some interesting dynamics emerge in the 4-ple helix where user-centred facilities and
civil society feature as the second and fourth actor which in relative terms regions
would like to be somewhat more engaged (476 and 438 of regions which engaged
them in EDP for the design phase of RIS3 would like to have them participate more in the
implementation phase)
As for the remaining actors it is interesting to notice that experiences with Risk Capital
emerge as difficult with 6 out of the 12 regions that engaged them previously desiring a
lower engagement in the future As for financial entities 7 out of 10 would like them to
be more engaged In the case of media 9 out of 15 would like this actor to be somewhat
or significantly more engaged in the process
Graph 13 Future desired engagement in RIS3 implementation
33 EDP self-evaluation
To help assessing the impact of the EDP during the elaboration of the RIS3 the first part
of the survey asked participants to reflect on the effectiveness and overall experience of
the process When participants were asked if the process was effective in
identifying investment priorities for regional development 932 provided a positive
answer Likewise when asked to consider the EDP as a positive or negative experience
during the elaboration of RIS3 966 referred to the process as positive Interestingly
39 of the responses pointed out that the EDP had brought conflicts among stakeholders
(or between stakeholders and the public administration) during the elaboration of RIS3
Although the survey didnrsquot go in depth into the kind of conflicts it generated this feature
could led to further research in order to understand if the conflicts were due to lack of
understanding conflict of interests or other relevant criteria
The survey also allowed for some self-reflection on other outcomes of the EDP When
asked whether the EDP represented a novelty in the policy process 51 out of the 59
respondents indicated that this was the case Furthermore as the graph below shows
the EDP is considered a satisfactory process in its ability to
0
10
20
30
40
50
60
70
80
90
100
Substantially more engaged Somewhat more engaged
Equally engaged Less engaged than in the previous phase
20
Increase trust among stakeholders where nearly 80 of respondents are
either satisfied or very satisfied
Increase trust towards the public sector where just over 75 of
respondents reveal to be either satisfied or very satisfied
Engage stakeholders in regional development where again three quarters of
respondents are either satisfied or very satisfied
Improve public-policy decision making where again nearly 75 report being
satisfied or very satisfied
Graph 14 EDP self-evaluation
4 Conclusions and next steps
When the term Entrepreneurial Discovery Process (or EDP) was introduced it referred to
the identification of areas for investment in research and innovation (ie priority-areas)
through an inclusive and evidence-based process grounded in stakeholdersrsquo engagement
(Foray et al 2009) Six years later the experience of the S3 Platform has required a
conceptual reflection on the EDP itself and an empirical investigation on the role of
stakeholders within it Conceptually the EDP has evolved from being a process limited
to the identification of investment-priorities in the design-phase of a strategy into a
continuous activity Empirically whilst the EDP was always defined as a bottom-up
participatory process there was a significant gap in understanding how different actors
engaged in it
This report based on a survey on EDP-practices run within the S3 Platform has
addressed both issues Firstly it submits the concept of continuous EDP developed in
Perianez-Forte et al (2016) to an empirical test Secondly it looks in depth at the role of
different stakeholders in the EDP
The data confirms that the EDP has evolved from an activity conceived exclusively for
choosing investments priorities under the ERDF Thematic Objective 1 into a continuous
process permeating S3 implementation
34
203 237 237220
593593
475 475
203 169
288 271
Increase trust amongstakeholders
Increase trust towards thepublic sector
Engage stakeholders inreg development
Ability to improve policydecision making
Not satisfied Somewhat satisfied Satisfied Very satisfied
21
A continuous EDP implies that once investment priorities have been identified with the
involvement of stakeholders the EDP keeps going throughout the strategyrsquos
implementation stakeholders are kept engaged in different ways in the refinement of
the priority-areas the identification of instruments that implement them as well as the
RIS3 governance and monitoring mechanisms that should deliver the expected
competitive advantages in each area The data collected clearly indicates that this is
happening
The survey results indicate that the EDP -as bottom up process- has required and it is
still requiring adjustments to the governance system Regions have responded to the
EDP by finding ways to favour an in depth interaction and engagement with local actors
in the development of S3 priorities Our survey has also given insights on the
participation and role of stakeholders in the EDP as well as on the relationship
between the latter and the EDP organisers (ie how well the stakeholder is understood
and how satisfactory is the relationship)
In terms of participation the data indicates that the EDP is mainly a triple-helix business
The research private and public sectors are much more frequently involved than other
societal actors Furthermore research actors are generally well known by the EDP
organisers and their relationship is very often satisfactory A similar picture emerges with
public actors such as regional bodies national government and the EC Interestingly
whilst local government is an actor that is often well known by EDP organisers the
relationship is often unsatisfactory As for the private sector our survey suggests that
EDP organisers are better able to understand associations of businesses (ie clusters or
representative organisations business parks) than individual firms Furthermore the
relationship with the private sector is in general less satisfactory than with the research
and public actors As for the fourth-helix a peripheral actor in the EDP our data
indicates some untapped potential Regions which have engaged with civil society
revealed to have often underestimated their interest and would like to increase their
involvement in the future
In terms of stakeholdersrsquo role in the EDP during RIS3 implementation we see that
the research and business sector are indeed expected to take part to governance and
monitoring activities however their involvement in the continuous EDP is most frequent
related to calls management (ie commenting on pre-calls etc) This reflects the
importance of these actors as beneficiaries of RIS3 investment As for the public sector
and specifically regional and national governments and EC institutions their main role is
in supporting monitoring revealing a demand for guidance on this crucial aspect of RIS3
implementation
To conclude the survey reveals that the EDP has been a positive experience for regions
across different dimensions and stakeholdersrsquo engagement across the whole 4-ple helix
continues to be desired
In delivering a much clearer picture of EDP practices the survey has unavoidably raised
further questions In particular further investigation and policy support should
reveal what is behind a satisfactoryunsatisfactory relationship or a goodpoor
understanding of a given actor
clarify the institutional and stakeholdersrsquo characteristics that favour a good
interaction and a functioning EDP
identify the mechanisms through which stakeholdersrsquo engagement can be
sustained especially in activities like monitoring governance or the management
of calls
recognise and share policy instruments mechanisms andor structures and good
practices that are effective in supporting a continuous EDP
Future activities of the S3 Platform and the project Targeted Support to Lagging Regions
will take these results into account to address the most pressing demands related to
RIS3 implementation
22
References
European Union (2013) Regulation (EU) No 13032013 of the European Parliament and
of the Council of 17 December 2013 laying down common provisions on the
European Regional Development Fund the European Social Fund the Cohesion
Fund the European Agricultural Fund for Rural Development and the European
Maritime and Fisheries Fund and laying down general provisions on the European
Regional Development Fund the European Social Fund the Cohesion Fund and the
European Maritime and Fisheries Fund and repealing Council Regulation (EC) No
10832006 Brussels European Union
Foray D David P and Hall B (2009) lsquoSmart Specialisation ndash The Concept rsquo in
Knowledge Economists Policy Brief ndeg 9 June 2009
Foray D and Goenaga X (2013) The Goals of Smart Specialisationrsquo JRC Scientific and
Policy Reports n JRC82213 doi10279120158
Gianelle C Kyriakou D Cohen C and Przeor M (eds) (2016) Implementing Smart
Specialisation A Handbook Brussels European Commission EUR 28053 EN
doi10279153569
Gianelle C Guzzo F and Mieszkowski K (2017) Smart Specialisation at work Analysis
of the calls launched under ERDF Operational Programmes JRC Technical Reports
JRC106974
Perianez-Forte I Marinelli E Foray D (2016) The Entrepreneurial Discovery Process
(EDP) cyclefrom priority selection to strategy implementation in Gianelle C
Kyriakou D Cohen C and Przeor M (eds) Implementing Smart Specialisation A
Handbook Brussels European Commission EUR 28053 EN doi10279153569
Europe Direct is a service to help you find answers
to your questions about the European Union
Freephone number ()
00 800 6 7 8 9 10 11 () The information given is free as are most calls (though some operators phone boxes or hotels may
charge you)
More information on the European Union is available on the internet (httpeuropaeu)
HOW TO OBTAIN EU PUBLICATIONS
Free publications
bull one copy
via EU Bookshop (httpbookshopeuropaeu)
bull more than one copy or postersmaps
from the European Unionrsquos representations (httpeceuropaeurepresent_enhtm)from the delegations in non-EU countries (httpeeaseuropaeudelegationsindex_enhtm)by contacting the Europe Direct service (httpeuropaeueuropedirectindex_enhtm) orcalling 00 800 6 7 8 9 10 11 (freephone number from anywhere in the EU) ()
() The information given is free as are most calls (though some operators phone boxes or hotels may charge you)
Priced publications
bull via EU Bookshop (httpbookshopeuropaeu)
24 doi102760514714
ISBN 978-92-79-74377-1
KJ-N
A-2
8838-E
N-N
4
1 Introduction understanding the Entrepreneurial Discovery
Process
The term Entrepreneurial Discovery Process (EDP) was introduced to refer to the bottom-
up identification of investment-priorities on research and innovation within the design of
a Smart Specialisation Strategy In the EDP stakeholdersrsquo interaction -accompanied by
sound evidence- is used to explore new techno-economic opportunities and to feed into
public decision-making processes
Six years since the onset of S3 the S3 Platform of the Joint Research Centre has
detected a demand for a deeper understanding of how EU regions have engaged in such
process
In particular it has appeared necessary to map more rigorously two aspects
the EDP as a continuous process starting from the way in which the process had
been organised in the design phase and moving to the ramifications of the EDP
throughout the strategiesrsquo implementation
the actors that took part to the EDPs in EU regions and their role within the EDP
As for the former point Periantildeez et al (2016) highlighted the need for a reflection and
update of the EDP concept itself The EDP appears to have evolved from an activity
conceived exclusively for choosing investments priorities under the ERDF Thematic
Objective 1 into a continuous process permeating S3 implementation (ibid) Such
continuous EDP does start with the identification of broad priorities during the definition
of RIS3 yet keeps going throughout the strategyrsquos implementation stakeholders are
kept engaged in different ways in the refinement of the priority-areas the identification
of instruments that would implement them as well as the RIS3 governance and
monitoring mechanisms that should deliver the expected competitive advantages in each
area
To explore such knowledge gaps the S3 Platform in collaboration with the project
Targeted Support to Lagging Regions launched a survey in early 2017 and this report
presents the results of this study The report is organised as follows section 2 describes
the structure and aims of the survey as well as the information on the response rate and
geographical distribution of respondents Section 3 delves into the results of the survey
covering three parts (31) the way the EDP has developed during the RIS3 design phase
and continues during RIS3 implementation (32) the role of different stakeholders in
the EDP and (33) an evaluation of the EDP Section 4 concludes and identifies future
steps for research and policy-support1
2 The survey on EDP structure and aims
The unit of analysis of the S3 Platform survey is the Entrepreneurial Discovery Process
itself from the onset of RIS3 design to its implementation
The survey explores various elements of the policy cycle to identify the role of different
stakeholders within it and their ability to keep reflecting on investment-priorities and feeding into the policy process The survey is organised in 3 parts2
1 The thorough understanding of the EDP derived from the survey will serve as a basis for planning further
activities of the S3 platform and of the project ldquoRIS3 Targeted Support in Lagging Regionsrdquo 2 The whole survey is annexed to the report
5
Part 1 looks at the EDP during the design phase of RIS3 (ie until the
approval of the RIS3 OPs and Action Plans) This part focusses on how the
identification of investment priorities was organised paying attention to the
actual desired and expected role of different stakeholders This part of the survey
provides on the one hand an in-depth understanding of how the 4-ple helix took
part on the EDP on the other it explores the mechanisms structures and
methods that were put in place to identify the first broad set of investment
priorities
Part 2 looks at the EDP during the implementation-phase of RIS3 policy
cycle This part effectively tests the concept of continuous entrepreneurial
discovery It explores how regions are keeping (or planning to keep) stakeholders
engaged with the implementation and the evolution of the priority areas allowing
further discovery to take place This is done by looking at the instruments chosen
for implementation as well as the governance system It also looks at broader
stakeholdersrsquo involvement in RIS3 as a pre-condition for continuous EDP
Part 3 gives the respondents the opportunity to self-evaluate the EDP-
experience along four different dimensions
Throughout the survey we cover a wide array of stakeholders going beyond the
traditional private public and research sector and including the 4th helix and other
actors whose role remains still unknown yet deserves to be explored The actors covered
are listed in the table below
Table 1 Stakeholders list and abbreviation
Stakeholder invited Short name
Higher education institutions High edu Research sector (1st Helix) Research organisations Research org
Regional government and agencies Reg gov Public sector (2nd Helix) Local government Loc gov
National government Nat gov
European Commission EC
Regional SMEs Reg SMEs Private sector (3rd Helix) Regional Large firms Reg l firms
Business associationsChambers of commerce
Buss Assoc
Clusters organisations Clusters
Incubators accelerators and business parks Inc acc bus parks
Foreign firms For Firms
National firms Nat firms
Civil society organisations (NGOs etc) Civil society Civil society (4th Helix) Labor unions Labor unions
User-centered communities and labs User-centred spaces
Communication media Media Other
Financial entities (eg banks) Financial ent
Risk capital Risk cap
6
The survey was targeted to the bodies implementing EDP and was sent to all entities
registered in the S3 platform It was open for approximately 7 weeks between January and February 20173 The JRC received a total of 59 answers4
Table 2 provides information on the distribution of the respondents and geographical
location As indicated in the table respondents cluster largely around less development
(424) and more developed regions (458) with only 5 transition regions replying to
the survey Interestingly 2 non-EU regions also took part
Table 2 Respondents by level of development of the region
Type
of region
Freq
Geographical distribution
LESS
DEVELOPED
(of which 2
NUTS3)
25 424
MORE
DEVELOPED
27 458
TRANSITION 5 85
NOT EU 2 34
All the responses including those from NUTS3 and non-EU regions have been included in
the analysis in the remaining of the document
3 Survey results
The wealth of results produced by the survey have been organised in three sections
3 In designing and implementing the survey the JRC benefited from the close collaboration with the Spanish Regional Development Agencies (Foro ADR) the interregional consortium of the Interreg project acuteBeyond EDPacute as well as with the regions participating in the JRC projects ldquoRIS3 Targeted Support in Lagging Regionsrdquo and ldquoHigher Education and Smart Specialisationrdquo who all answered the questionnaire 4 Assessing the appropriateness of the response rate required some reflection The universe of EDPs our
research subject is unknown in size because the EDPs were developed in different territorial and administrative context including
NUTS2 level as part of the regional RIS3 and linked to regionally managed OPs
NUTS2 level as part to national RIS3 and hence linked to national OPs
NUTS3 level independently from structural funds
Outside the EU independently from structural funds
Without including NUTS3 and non-EU responses we have assumed that
at the very least there are as many EDPs as there are Operational Programmes tackling TO1 (176)
at the very most there are as many EDPs as there are NUTS2 regions (276) The response rate hence lies between 199 (55276) in the latter hypothesis and 3125 (55176) in the former This rate can be considered satisfactory
7
In section 31 acuteA continuous EDPacutewe explore the organisation of the EDP in the design
phase and tests the concept of continuous EDP by looking at how the discovery in given
priority areas continues throughout RIS3 implementation
In section 32 acuteEngagement of stakeholders in the EDPacute we explore in depth the role of
different stakeholders within the EDP and their relationship with the public body in
charge of it
Finally section 33 covers the regions Self-evaluation of the EDP process exploring its
utility challenges and the overall satisfaction with the process
31 A continuous EDP
Understand the EDP and testing its continuous nature requires looking at
The EDP during the RIS3 design phase (ie until the approval of the RIS3
OPs and Action Plans) focussing on how the bottom-up identification of
investment priorities was organised
The EDP during the RIS3 implementation phase detecting the mechanisms
throughout the policy cycle that allow stakeholders to be kept engaged with the
evolution and implementation of the previously identified priority areas
311 EDP during the design phase
To understand how stakeholders were involved during the RIS3 design phase and how
priorities were identified we have looked at a) Which stakeholders were invited b) The
methods employed to engage them c) The institutional set-up used to deploy the EDP
d) The use made of stakeholdersrsquo input These aspects give insights on the efforts and
changes undertaken by the public administration to ensure an active participation of a
diverse and new portfolio of stakeholders in the policy cycle
Which stakeholders
Graph 1 reports the frequency with which different stakeholders were invited to take part
to the EDP during the RIS3 design
Graph 1 Stakeholders invited to the EDP in the RIS3 design phase
0
10
20
30
40
50
60
Hig
h e
du
Res
ear
ch o
rg
Reg
go
v
Loc
go
v
Nat
go
v EC
Reg
SM
Es
Reg
l f
irm
s
Bu
ss A
sso
c
Clu
ste
rs
Inc
acc
b
us
par
ks
For
Fir
ms
Nat
fir
ms
Civ
il so
cie
ty
Lab
or
un
ion
s
Use
r-ce
ntr
ed
Me
dia
Fin
anci
al e
nt
Ris
k ca
p
8
It highlights that research actors were virtually always included in the EDP As for the
public sector the survey unsurprisingly shows a preference for regional and local actors
which were invited more often than national and EC representatives in line with the
place-based nature of RIS3 As for the private sector almost all respondents declared
inviting regional SMEs large firms business associations and clusters Innovation actors
such as incubators accelerators and business parks have partaken to the EDP in 42 out
of the 59 cases reported Inviting national or foreign firms present in the territory was
less common with just over 50 of respondents declaring to have involved foreign
firms and only 19 having involved national firms When looking at the fourth helix we
notice that civil society organisations have been invited in over 60 of the cases
whereas the proportion for labour unions and user-centred facilities is respectively 44
and 37
Media financial entities and risk capital organisations appear ndashunsurprisingly- as
peripheral actors in the EDP and RIS3 process being invited in only 16 13 and 11 cases
respectively out of the 59 responses
All in all the EDP emerges as largely a 3-ple helix business with some interesting signals
emerging from the 4th helix
How to engage stakeholders to identify investment priorities
When exploring the methods applied to engage stakeholders to identify investment
priorities during the RIS3 design respondents were asked to choose between
informative and interactive methods The former referred to those methods by which
the public administration received inputsinformation from selected actors (eg surveys
bilateral dialogue) whereas the latter try to capture participatory methods that allowed
interaction across participating actors (eg Public meetings Workshops) With exception
of 6 regions which indicated that only informative methods were used the rest of
regions opted for a combination of both types of methods
Institutional set-up does the EDP need something new
Respondents were asked to indicate whether to implement the EDP the bodyinstitution
responsible for the RIS3 created new structures or adapted previous ones More
than three quarters of the respondents (763) indicated that the EDP had an impact on
the existing structures with 373 of respondents adapting existing structures 254
creating new structures and 136 both adapting and creating new structures In those
regions which have created new structures or adapted previous ones to facilitate
interaction among the public administration and different stakeholders those structures
are kept also during the RIS3 implementation This proves the willingness of regions in
keeping the EDP ongoing
These results clearly show that EDP has required and received a significant institutional
response to accommodate the demands of bottom-up processes This is illustrated in
table 3
Table 3 Structures for EDP
Responders
Adapted previous structures 373
Created new structures 254
Created amp adapted 136
None of the above 237
9
Stakeholdersrsquo input what and what for
Table 4 shows the result of a multiple-choice question where responders indicated that
the EDP was used to gather information actors views on investment for regional
development (83) and to generate consensus among them in relation to investment-
priorities (76)
Table 4 Aims of stakeholderrsquos interaction
Responders
Collect views on regional development 83
Build consensus on investment 76
Both 63
Likewise respondents were asked whether the outcomes of the EDP discussions were
used simply as advice or as a binding opinion (thereby committing the regional
authorities) Table 5 shows that the outcomes of the stakeholders interaction has
provided a binding opinion in 474 of the cases and only advice in the remaining
525 of responses The fact that in many regions the outcomes of the process were
considered binding opinions should be taken as an important success of the process5
Table 5 Use of EDP Outcomes
Responders
Providing advice 525
Providing advice and binding opinion 254
Providing binding opinion 22
All these results confirm that the EDP in the priority-identification phase was indeed
organised with the intention to allow a bottom-up opinion to emerge and to embed it in
the policy decision making
312 EDP during the implementation phase
Testing the concept of continuous entrepreneurial discovery during the RIS3
implementation requires looking at the involvement of stakeholders in the follow-up of
the identification of priorities in particular (a) the ability of stakeholders to review and
refine investment priorities within the governance system of RIS3 (b) the deployment
of implementation instruments that allow different stakeholders to keep exploring
priority-areas (c) the broader participation of stakeholders in RIS3 implementation
including monitoring and calls management as a pre-condition for a continuous EDP
Which stakeholders in RIS3 implementation
Compared to Graph 1 graph 2 reports the frequency with which different stakeholders
are being (or will be) engaged or in the EDP during the RIS3 implementation phase
It highlights that for research actors there is a strong expectation for their involvement
in governance and monitoring However they are ndash unsurprisingly- most frequently seen
as active in relation to calls for proposals as potential beneficiariesA similar pattern
emerges for private sector actors They are mainly perceived as beneficiaries to be
5 It would be interesting to follow up the regional development in those regions where the outcomes of the EDP
were binding opinion to assess the success of the process
10
engaged in activities related to calls for proposals Interesting private-sector
representative bodies (ie business associations and clusters) are those most often
perceived as engaged (or to be engaged) in monitoring and governance followed by
regional firms As for the public sector it is interesting to highlight how for regional
government National government and the EC their main role is in supporting
monitoring Whereas this is the least frequent aspect mentioned for local government
As for the quadruple helix the role of Civil Society (NGOs community organisations) is
more or less balanced across monitoring governance and calls for proposals Unions on
the other hand are more frequently considered as relevant for monitoring (in 17 cases)
as compared to calls for proposalsimplementation (15) or governance (14) Interestingly
user-centred facilities emerge as important beneficiaries with 26 regions considering
them important in relation to call for proposals and only 12 and 8 for monitoring and
governance respectivelyFinally financial entities risk capital and media which are
infrequent participants to RIS3 are taken into account mainly as their role with
investmentcall for proposals likely as supplementary sources of finance
Graph 2 Engagement of stakeholders during the EDP elements of RIS3 implementation
A continuous EDP in the RIS3 governance system
For the EDP to be considered as a continuous process there must be a governance
system that allows a continuous reflection with the stakeholders on the status of current
priorities (their refinement or review) and on the identification of new ones
The survey explored these aspects foreseeing three different levels of stakeholdersrsquo
involvement simple consultation (consisting of sharing information and providing
clarification to stakeholders) interaction (allowing for more in depth dialogue between
stakeholders and with the public administration) or consensus building (a more intense
form of exchange)
Table 6 shows that simpler forms of stakeholdersrsquo engagement (consultation and
interactive dialogue) are the most common On the other hand processes of consensus
building are reported only in 49 of the cases for the refinement of priorities and
4070 in the review of priorities All in all however the vast majority of regions have
governance mechanisms that engage stakeholders in the refinement (881) and review
(831) of priorities supporting the hypothesis that the EDP is best conceived as a
continuous process
31 31
40
30
20
10
19 18
29
25
20
8 8
18
14
86
4
8
35
31
44
25
32
24 23 22
3331
23
13
8
20
17
12
9 86
4846
40
36
19
11
4240
38 38 37
32
25
15
26
1513
15
Hig
h ed
u
Rese
arch
org
Reg
gov
Loc
gov
Nat
gov
EC
Reg
SM
Es
Reg
l fi
rms
Buss
Ass
oc
Clus
ters
Inc
acc
bu
shellip
For
Fir
ms
Nat
fir
ms
Civi
l soc
iety
Labo
r uni
ons
Use
r-ce
ntre
dhellip
Med
ia
Fina
ncia
l ent
Risk
cap
Governance Monitoring Calls for proposal
11
Table 6 Levels of stakeholderacutes involvement
Refinement
of priorities
Review
of priorities
Consultation 661 559
Interactive dialogue 559 492
Consensus building 492 4070
Any of the above 881 831
A continuous EDP in the RIS3 implementation instruments
The EDP can continue through the implementation phase also by deploying instruments
that implement innovation projects based on triple or quadruple helix collaboration
linked to market needs
To this aim the survey asks respondents whether they used policy instruments targeted
at consortia of actors and more specifically whether the consortia are asked to (a)
respond to public demand needs (for instance with calls for Pre-Commercial Public
Procurement) (b) develop and pursue shared action plans or (c) respond to the needs
expressed by users or consumersrsquo groups
These instruments effectively embody the EDP by allowing stakeholders to experiment in
previously identified (broad) priorities areas to refine them and to further the discovery
of new market segments
The results are highlighted in table 7
Table 7 EDP instruments
EDP-type instruments Frequency
Stakeholdersacute Consortia as beneficiaries of RIS3 calls 881
Consortia addressing public demands needs (PCPP) 45
Consortia implementing shared action plans 22
Consortia focussing on usersrsquo needs and participation 61
Either of the three 78
Results indicate that it is fairly common to target consortia as beneficiaries of RIS3 calls
(881) as well as applying instruments where consortia need to target usersrsquo needs
(61) Pre-commercial Public Procurement which can also be considered as an EDP
instrument is used in 45 whereas only 22 of respondents have instruments
supporting consortia implementing shared action plans
All in all 78 of the regions implement at least one of the instruments identified
validating the hypothesis of a continuous EDP process
12
Supporting a continuous EDP through monitoring and calls management
A continuous EDP needs to be embedded in a broader engagement of stakeholders
throughout RIS3 implementation Stakeholders involvement is a pre-condition for a
successful continuous EDP This section illustrates how the engagement of stakeholders
is ensured in different phases of the RIS3 implementation guaranteeing the continuity of
the EDP
Stakeholdersrsquo contribution to the monitoring phase
To this aim the survey has explored two complementary aspects of RIS3
implementation the monitoring process and the management of calls for proposals
As for the monitoring process the survey explored two ways of stakeholdersrsquo
involvement in the process a direct way whereby actors participate in the definition of
indicators or in the monitoring committee an indirect way whereby stakeholders are
passive in terms of producing monitoring outcomes but are informed about them andor
are engaged in decisions that build on monitoring results The results of the analysis are
provided in table 8 which also highlights that 100 of the regions engage stakeholders
in monitoring in at least one of the four ways identified
Table 8 Role of stakeholderacutes involvement during the monitoring
Role Level Direct Indirect Either direct
or indirect
Definition of indicators 475
100 Monitoring committee 339
Informed about monitoring outcomes 400
Involved in decisions based on monitoring 576
Stakeholdersrsquo engagement and callsrsquo management
In relation to calls management a good approach to stakeholdersrsquo engagement which
is supportive of a continuous EDP requires that they are duly informed of the investment
plans and if possible are able to provide feedback on the way calls are being organised
This should make sure that the funds will be appropriately taken-up and the RIS3
priorities implemented The survey highlighted that 644 of regions do publicly present
calls to stakeholders and that 576 present pre-calls providing the opportunity to
receive feedback before they are published In turn 881 of the regions engage in
either or both of these practices
The results of this paragraph indicate that RIS3 is commonly being implemented keeping
stakeholders engaged hence supporting a continuous EDP
32 Engagement of stakeholders in the EDP
This section analyses stakeholdersrsquo participation and engagement in the EDP process
For each stakeholder that had been invited to the EDP in the RIS3 design phase
respondents were asked to rate the level of engagement that they desired expected
and actually received6
6 (eg in answering emails participating in meetingsworkshops providing information to the public authorities
or engaging in any other EDP activity)
13
The type of engagement is defined as follows
Actual engagement effective and real participation of the stakeholder in the
EDP activities
Desired engagement level of contribution to the EDP activities that the public
administration would ideally receive from the stakeholder
Expected engagement involvement of the stakeholder in the EDP activities
realistically foreseen
Answers were organised on a 4-level scale from 0 to 3 with 0 indicating no engagement
and 3 indicating high engagement
Table 9 provides the average for the three scores for actual expected and desired
engagement
Table 9 Type of participation by stakeholders
Stakeholder invited Actual Desired Expected
Higher education institutions 255 279 260
Research organisations 254 280 262
Regional government and agencies 251 279 258
Local government 209 262 240
National government 207 231 221
European Commission 225 245 242
Regional SMEs 222 272 242
Regional Large firms 204 267 232
Business associationsChambers of commerce 225 265 242
Clusters organisations 243 283 264
Incubators accelerators and business parks 222 278 253
Foreign firms 170 243 197
National firms 189 239 206
Civil society 144 214 168
Labour unions 148 188 172
User-centered communities and labs 173 250 223
Independent experts 197 230 231
Media 113 247 180
Financial entities (eg banks) 122 211 167
Risk capital 167 250 218
Higher Education institutions have the highest average score for actual engagement
(255) shortly followed by Research Organisations (254) and Regional government
(251) Clusters come shortly after these three actors with an average of 243
Interestingly when it comes to desired engagement it is clusters to have the highest
average score (283) followed shortly after by research organisations (28) regional
government279) higher education (279) and incubators accelerators etc (278)
In terms of expected engagement we see again that clusters top the rank with an
average score of 264 shortly followed by research organisations (262) higher
education (260) and regional government (258) All in all clusters research and higher
14
education together with regional government appear as the main actors in terms of
engagement in the EDP process
321 Insights on stakeholdersrsquo engagement comparing actual desired and expected engagement
By looking at the difference between actual and expected engagement we are able to
draw useful insights on the relationships between the EDP organisers and the different
stakeholders
In particular when comparing the actual and the expected level of engagement we can
evaluate whether the EDP organiser has a good understanding of local actors
Specifically if the expected engagement is
the same as the actual one it means that the EDP organiser understands well
the behaviour of the stakeholders
higher than the actual one it indicates that the EDP organiser is
overestimating the interest of the stakeholders
lower than the actual one it suggests that the region had underestimated the
level of interest of a given actor This can be considered as a positive surprise
In formulas
119860119888119905119906119886119897119864119899119892119886119892119890119898119890119899119905 minus 119864119909119901119890119888119905119890119889119864119899119892119886119892119890119898119890119899119905 = 0 rarr 119866119900119900119889 119870119899119900119908119897119890119889119892119890 119900119891 119905ℎ119890 119878119905119886119896119890ℎ119900119897119889119890119903
119860119888119905119906119886119897119864119899119892119886119892119890119898119890119899119905 minus 119864119909119901119890119888119905119890119889119864119899119892119886119892119890119898119890119899119905 gt 0 rarr 119880119899119889119890119903119890119904119905119894119898119886119905119890119889 119878119905119886119896119890ℎ119900119897119889119890119903prime119904 119894119899119905119890119903119890119904119905
119860119888119905119906119886119897119864119899119892119886119892119890119898119890119899119905 minus 119864119909119901119890119888119905119890119889119864119899119892119886119892119890119898119890119899119905 lt 0 rarr 119874119907119890119903119890119904119905119894119898119886119905119890119889 119878119905119886119896119890ℎ119900119897119889119890119903prime119904 119894119899119905119890119903119890119904119905
Following a similar reasoning comparing the actual and desired level of engagement
allows evaluating how positive the relationship between the EDP organiser and the
individual stakeholders is Thus when the actual is
the same as the desired engagement it means the region has a satisfactory
relationship with stakeholders the region gets what they want from the actors (be
it a large or small level engagement)
higher than the desired engagement it suggests an intrusive relationship
with stakeholders participating in unwarranted ways to the process of
entrepreneurial discovery
lower than the desired engagement it indicates an unsatisfactory
relationship with the EDP organisers wishing more from the exchange with given
actors
In formulas
119860119888119905119906119886119897119864119899119892119886119892119890119898119890119899119905 minus 119863119890119904119894119903119890119889119864119899119892119886119892119890119898119890119899119905 = 0 rarr 119878119886119905119894119904119891119886119888119905119900119903119910 119903119890119897119886119905119894119900119899119904ℎ119894119901
119860119888119905119906119886119897119864119899119892119886119892119890119898119890119899119905 minus 119863119890119904119894119903119890119889119864119899119892119886119892119890119898119890119899119905 gt 0 rarr 119868119899119905119903119906119904119894119907119890 119903119890119897119886119905119894119900119899119904ℎ119894119901
119860119888119905119906119886119897119864119899119892119886119892119890119898119890119899119905 minus 119863119890119904119894119903119890119889119864119899119892119886119892119890119898119890119899119905 lt 0 rarr 119880119899119904119886119905119894119904119891119886119888119905119900119903119910 119903119890119897119886119905119894119900119899119904ℎ119894119901
The graphs below report for each group of stakeholders the proportion of regions
having scores equal bigger or lower than 0 in the difference between actual and
desired and actual and expected engagement
a) Research and Higher education ndash 1st Helix
Research organisations and higher education institutions are two of the main
stakeholders in the EDP for which the actual desired and expected engagement
emerged as the one of the highest in table 9 above
15
In graph 3 we notice that these stakeholders are well known in over 70 of the cases
the actual engagement matched the expected one Whilst the relationship with these
actors is often satisfactory (as reported by 714 and 745 of the regions for higher
education institutions and research organisations respectively) as shown in graph 4
approximately a quarter of respondents have found the relationship between universities
and research centres unsatisfactory (232 and 255 respectively) that is they
desired a higher engagement than the one actually experienced
b) Public Sector ndash 2nd Helix
Graphs 5 and 6 below reveal the patterns of relationship that the EDP organisers have
with public-sector stakeholders It emerges that whilst regional national and EC public
actors follow similar patterns local government has a somewhat different behaviour
Graph 5 Actual vs Expected engagement ndash 2nd
Helix
Notably in graph 5 a high majority of respondents revealed a good knowledge of
stakeholders of the public sector with the lowest proportion emerging for the EC
750667 690 632
104
48103
105
146286
207 263
Reg gov Loc gov Nat gov EC
Good Knowledge Underestimated interest
Overestimated interest
Graph 3 Actual vs Expected engagement ndash 1st
Helix
Graph 4 Actual vs Desired engagementndash 1st
Helix
714 745
54 00
232 255
High edu Research org
Satisfactory Intrusive Unsatisfactory
16
(632) and local government (667) Interestingly in the case of local government
there were fewer cases in which interest in the EDP was underestimated (48 as
compared to more than 10 for the other actors) whereas overestimation was most
common (286) This suggest a disengagement from the sub-regional level which is
confirmed in graph 6 where the relationship emerges as unsatisfactory in 523 of the
caseas as compared to 276 25 and 235 for National government the EC and
Regional government
c) Private Sector ndash 3rd Helix
As indicated in graph 7 in the case of the private sector the proportion of regions with a
good knowledge of and a satisfactory relationshop with stakeholders is in general lower
than in the case of research and higher education actors Only for clusters for more than
70 of respondents the actual engagement reflected the expected one
Graph 7 Actual vs Expected engagement ndash 3rd Helix
A satisfactory relationship one in which desired and actual enagement coincide emerges
most often with regional SMEs business associations clusters and incubators as shown
in graph 8 below The relationship emerges as unsatisfactory most often for foreign firms
434 472612
711
550414
588
208 151
12267
75207
118
358 377265 222
375 379294
Reg SMEs Reg L firms Buss Assoc Clusters Inc accbus parks
For Firms Nat firms
Good Knowledge Underestimated interest
Overestimated interest
Graph 6 Actual vs Desired engagement ndash 2nd
Helix
745
432
621 650
20
45
103 100
235
523
276 250
Reg gov Loc gov Nat gov EC
Satisfactory Intrusive Unsatisfactory
17
with facilities in the region (567) Interestingly more than 1 in 5 regions
underestimated the interest of local SMEs and foreign firms indicating that there is
scope for attempting to engage these actors further
Graph 8 Actual vs Desired engagement ndash 3rd Helix
d) Civil Society ndash 4th Helix
The graphs below refer to peripheral actors in the EDP which have infrequently been
invited or taken part to the process
Graph 9 Actual vs Expected engagement ndash 4th
Helix
Graph 10 Actual vs Desired engagement ndash 4th
Helix
Among the actors classified as part of the 4th helix we find that labour unions are the
ones that regions know best (68) and those where a satisfactory relationship is most
common (583) Civil society organisations are the least known (only in 333 of the
cases expected and actual engagement coincided) and the ones where an unsatisfactory
or intrusive relationship is most common and (83 of cases)The findings indicate that
much needs to be done to untap the potential of the 4-ple helix for innovation with
583 and 591 of regions finding the relationship with civil society organisations and
user-centered spaces unsatisfactory
500 481 529 553 525400 389
37 1959 43
00
33 111
463 500412 404
475567
500
Reg SMEs Reg L firms Buss Assoc Clusters Inc accbus parks
For Firms Nat firms
Satisfactory Intrusive Unsatisfactory
441
680500
176
40
45
382280
455
Civil society Labor unions User-centred spaces
Good Knowledge Underestimated interest
Overestimated interest
333
583409
83
42
00
583
375
591
Civil society Labor unions User-centred spaces
Satisfactory Intrusive Unsatisfactory
18
e) Other actors
Graph 11 and 12 below report information related to actors that have so far been
peripheral to the EDP namely media financial entities and risk capital
Graph 11 Actual vs Expected engagement ndash Other Graph 12 Actual vs Desired engagement ndash Other
The relationship with these actors is most often unsatisfactory as indicated on the right
hand graph with 80 889 and 593 of the regions not meeting their desires in
terms of engagement with media financial entities and risk capital respectively Media
and risk capital emerged as poorly known in graph 11 with approximately one third of
the regions displaying a good knowledge of this actor On the other hand nearly 56 of
the regions who engaged with financial entities gauged their expectations correctly
Despite the overall peripheral role of these actors some interesting dynamics emerge in
relation to Risk Capital with 182 of the regions engaging them finding them more
interested in the EDP process than expected
322 Stakeholdersrsquo engagement future desires
The graph below evaluates how the respondents would like the future engagement with
the different types of actors to be7
Whilst as shown in the previous sections of the report research actors are well known
and enjoy a good relationship with regional bodies in charge of RIS3 and whilst they
have been actively engaged throughout the process the survey highlights that more
engagement from their side is desired In the case of universities over 47 of
respondents would like them to be either somewhat more engaged (309) or
substantially more engaged (164) The pattern is similar for research organisations
where 377 of respondents would like them to be somewhat more engaged and 170
would like them to be substantially more engaged
Among the core EDP actors in the private sector it is interesting to notice that it is
regional SMEs and Regional firms where most often respondents are unsatisfied with
their past level of engagement and would like a significantly higher participation For
SMEs 15 regions (288) indicated that whereas for large firms 13 (25)Among public
actors it is interesting to notice a few cases in which local government national
government and the EC are welcome to be less engaged in the future (23 and 4
respondents respectively)
7 Only respondents who had invited a given stakeholders were asked to evaluate their future desired
engagement with the latter
333
556
364
67
00
182
600444 455
Media Financial ent Risk cap
Good Knowledge Underestimated interest
Overestimated interest
200111
333
83
800889
583
Media Financial ent Risk cap
Satisfactory Intrusive Unsatisfactory
19
Some interesting dynamics emerge in the 4-ple helix where user-centred facilities and
civil society feature as the second and fourth actor which in relative terms regions
would like to be somewhat more engaged (476 and 438 of regions which engaged
them in EDP for the design phase of RIS3 would like to have them participate more in the
implementation phase)
As for the remaining actors it is interesting to notice that experiences with Risk Capital
emerge as difficult with 6 out of the 12 regions that engaged them previously desiring a
lower engagement in the future As for financial entities 7 out of 10 would like them to
be more engaged In the case of media 9 out of 15 would like this actor to be somewhat
or significantly more engaged in the process
Graph 13 Future desired engagement in RIS3 implementation
33 EDP self-evaluation
To help assessing the impact of the EDP during the elaboration of the RIS3 the first part
of the survey asked participants to reflect on the effectiveness and overall experience of
the process When participants were asked if the process was effective in
identifying investment priorities for regional development 932 provided a positive
answer Likewise when asked to consider the EDP as a positive or negative experience
during the elaboration of RIS3 966 referred to the process as positive Interestingly
39 of the responses pointed out that the EDP had brought conflicts among stakeholders
(or between stakeholders and the public administration) during the elaboration of RIS3
Although the survey didnrsquot go in depth into the kind of conflicts it generated this feature
could led to further research in order to understand if the conflicts were due to lack of
understanding conflict of interests or other relevant criteria
The survey also allowed for some self-reflection on other outcomes of the EDP When
asked whether the EDP represented a novelty in the policy process 51 out of the 59
respondents indicated that this was the case Furthermore as the graph below shows
the EDP is considered a satisfactory process in its ability to
0
10
20
30
40
50
60
70
80
90
100
Substantially more engaged Somewhat more engaged
Equally engaged Less engaged than in the previous phase
20
Increase trust among stakeholders where nearly 80 of respondents are
either satisfied or very satisfied
Increase trust towards the public sector where just over 75 of
respondents reveal to be either satisfied or very satisfied
Engage stakeholders in regional development where again three quarters of
respondents are either satisfied or very satisfied
Improve public-policy decision making where again nearly 75 report being
satisfied or very satisfied
Graph 14 EDP self-evaluation
4 Conclusions and next steps
When the term Entrepreneurial Discovery Process (or EDP) was introduced it referred to
the identification of areas for investment in research and innovation (ie priority-areas)
through an inclusive and evidence-based process grounded in stakeholdersrsquo engagement
(Foray et al 2009) Six years later the experience of the S3 Platform has required a
conceptual reflection on the EDP itself and an empirical investigation on the role of
stakeholders within it Conceptually the EDP has evolved from being a process limited
to the identification of investment-priorities in the design-phase of a strategy into a
continuous activity Empirically whilst the EDP was always defined as a bottom-up
participatory process there was a significant gap in understanding how different actors
engaged in it
This report based on a survey on EDP-practices run within the S3 Platform has
addressed both issues Firstly it submits the concept of continuous EDP developed in
Perianez-Forte et al (2016) to an empirical test Secondly it looks in depth at the role of
different stakeholders in the EDP
The data confirms that the EDP has evolved from an activity conceived exclusively for
choosing investments priorities under the ERDF Thematic Objective 1 into a continuous
process permeating S3 implementation
34
203 237 237220
593593
475 475
203 169
288 271
Increase trust amongstakeholders
Increase trust towards thepublic sector
Engage stakeholders inreg development
Ability to improve policydecision making
Not satisfied Somewhat satisfied Satisfied Very satisfied
21
A continuous EDP implies that once investment priorities have been identified with the
involvement of stakeholders the EDP keeps going throughout the strategyrsquos
implementation stakeholders are kept engaged in different ways in the refinement of
the priority-areas the identification of instruments that implement them as well as the
RIS3 governance and monitoring mechanisms that should deliver the expected
competitive advantages in each area The data collected clearly indicates that this is
happening
The survey results indicate that the EDP -as bottom up process- has required and it is
still requiring adjustments to the governance system Regions have responded to the
EDP by finding ways to favour an in depth interaction and engagement with local actors
in the development of S3 priorities Our survey has also given insights on the
participation and role of stakeholders in the EDP as well as on the relationship
between the latter and the EDP organisers (ie how well the stakeholder is understood
and how satisfactory is the relationship)
In terms of participation the data indicates that the EDP is mainly a triple-helix business
The research private and public sectors are much more frequently involved than other
societal actors Furthermore research actors are generally well known by the EDP
organisers and their relationship is very often satisfactory A similar picture emerges with
public actors such as regional bodies national government and the EC Interestingly
whilst local government is an actor that is often well known by EDP organisers the
relationship is often unsatisfactory As for the private sector our survey suggests that
EDP organisers are better able to understand associations of businesses (ie clusters or
representative organisations business parks) than individual firms Furthermore the
relationship with the private sector is in general less satisfactory than with the research
and public actors As for the fourth-helix a peripheral actor in the EDP our data
indicates some untapped potential Regions which have engaged with civil society
revealed to have often underestimated their interest and would like to increase their
involvement in the future
In terms of stakeholdersrsquo role in the EDP during RIS3 implementation we see that
the research and business sector are indeed expected to take part to governance and
monitoring activities however their involvement in the continuous EDP is most frequent
related to calls management (ie commenting on pre-calls etc) This reflects the
importance of these actors as beneficiaries of RIS3 investment As for the public sector
and specifically regional and national governments and EC institutions their main role is
in supporting monitoring revealing a demand for guidance on this crucial aspect of RIS3
implementation
To conclude the survey reveals that the EDP has been a positive experience for regions
across different dimensions and stakeholdersrsquo engagement across the whole 4-ple helix
continues to be desired
In delivering a much clearer picture of EDP practices the survey has unavoidably raised
further questions In particular further investigation and policy support should
reveal what is behind a satisfactoryunsatisfactory relationship or a goodpoor
understanding of a given actor
clarify the institutional and stakeholdersrsquo characteristics that favour a good
interaction and a functioning EDP
identify the mechanisms through which stakeholdersrsquo engagement can be
sustained especially in activities like monitoring governance or the management
of calls
recognise and share policy instruments mechanisms andor structures and good
practices that are effective in supporting a continuous EDP
Future activities of the S3 Platform and the project Targeted Support to Lagging Regions
will take these results into account to address the most pressing demands related to
RIS3 implementation
22
References
European Union (2013) Regulation (EU) No 13032013 of the European Parliament and
of the Council of 17 December 2013 laying down common provisions on the
European Regional Development Fund the European Social Fund the Cohesion
Fund the European Agricultural Fund for Rural Development and the European
Maritime and Fisheries Fund and laying down general provisions on the European
Regional Development Fund the European Social Fund the Cohesion Fund and the
European Maritime and Fisheries Fund and repealing Council Regulation (EC) No
10832006 Brussels European Union
Foray D David P and Hall B (2009) lsquoSmart Specialisation ndash The Concept rsquo in
Knowledge Economists Policy Brief ndeg 9 June 2009
Foray D and Goenaga X (2013) The Goals of Smart Specialisationrsquo JRC Scientific and
Policy Reports n JRC82213 doi10279120158
Gianelle C Kyriakou D Cohen C and Przeor M (eds) (2016) Implementing Smart
Specialisation A Handbook Brussels European Commission EUR 28053 EN
doi10279153569
Gianelle C Guzzo F and Mieszkowski K (2017) Smart Specialisation at work Analysis
of the calls launched under ERDF Operational Programmes JRC Technical Reports
JRC106974
Perianez-Forte I Marinelli E Foray D (2016) The Entrepreneurial Discovery Process
(EDP) cyclefrom priority selection to strategy implementation in Gianelle C
Kyriakou D Cohen C and Przeor M (eds) Implementing Smart Specialisation A
Handbook Brussels European Commission EUR 28053 EN doi10279153569
Europe Direct is a service to help you find answers
to your questions about the European Union
Freephone number ()
00 800 6 7 8 9 10 11 () The information given is free as are most calls (though some operators phone boxes or hotels may
charge you)
More information on the European Union is available on the internet (httpeuropaeu)
HOW TO OBTAIN EU PUBLICATIONS
Free publications
bull one copy
via EU Bookshop (httpbookshopeuropaeu)
bull more than one copy or postersmaps
from the European Unionrsquos representations (httpeceuropaeurepresent_enhtm)from the delegations in non-EU countries (httpeeaseuropaeudelegationsindex_enhtm)by contacting the Europe Direct service (httpeuropaeueuropedirectindex_enhtm) orcalling 00 800 6 7 8 9 10 11 (freephone number from anywhere in the EU) ()
() The information given is free as are most calls (though some operators phone boxes or hotels may charge you)
Priced publications
bull via EU Bookshop (httpbookshopeuropaeu)
24 doi102760514714
ISBN 978-92-79-74377-1
KJ-N
A-2
8838-E
N-N
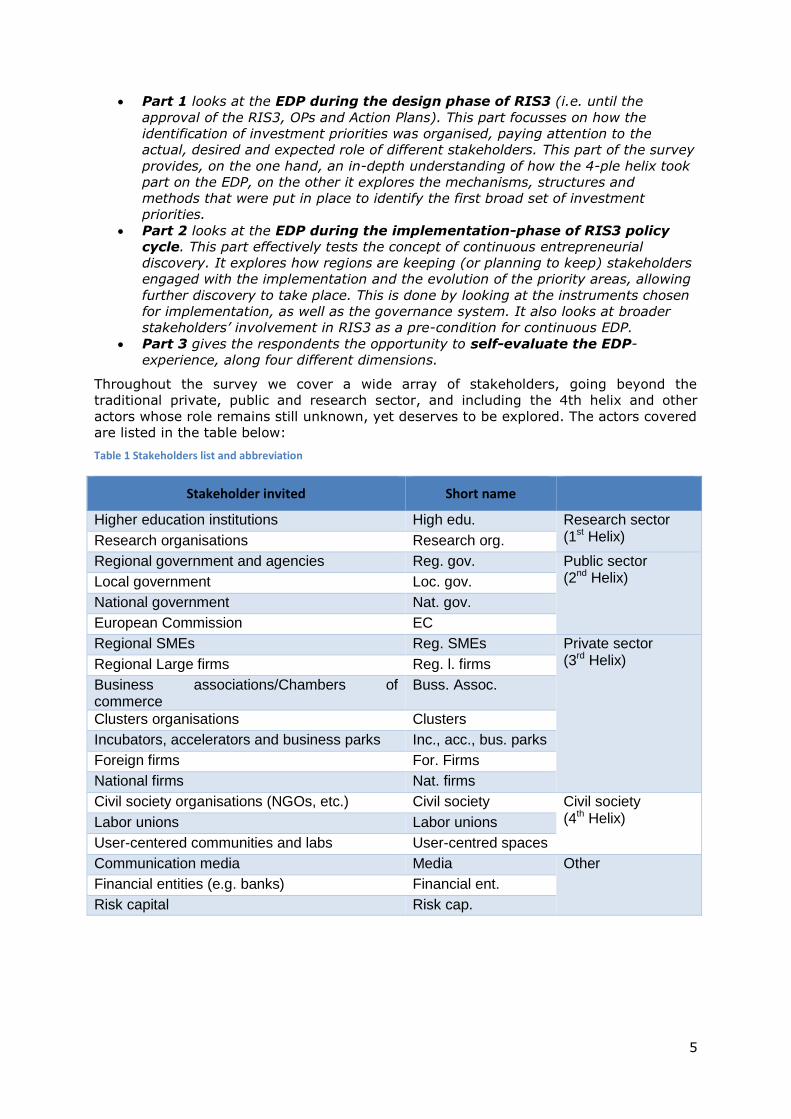
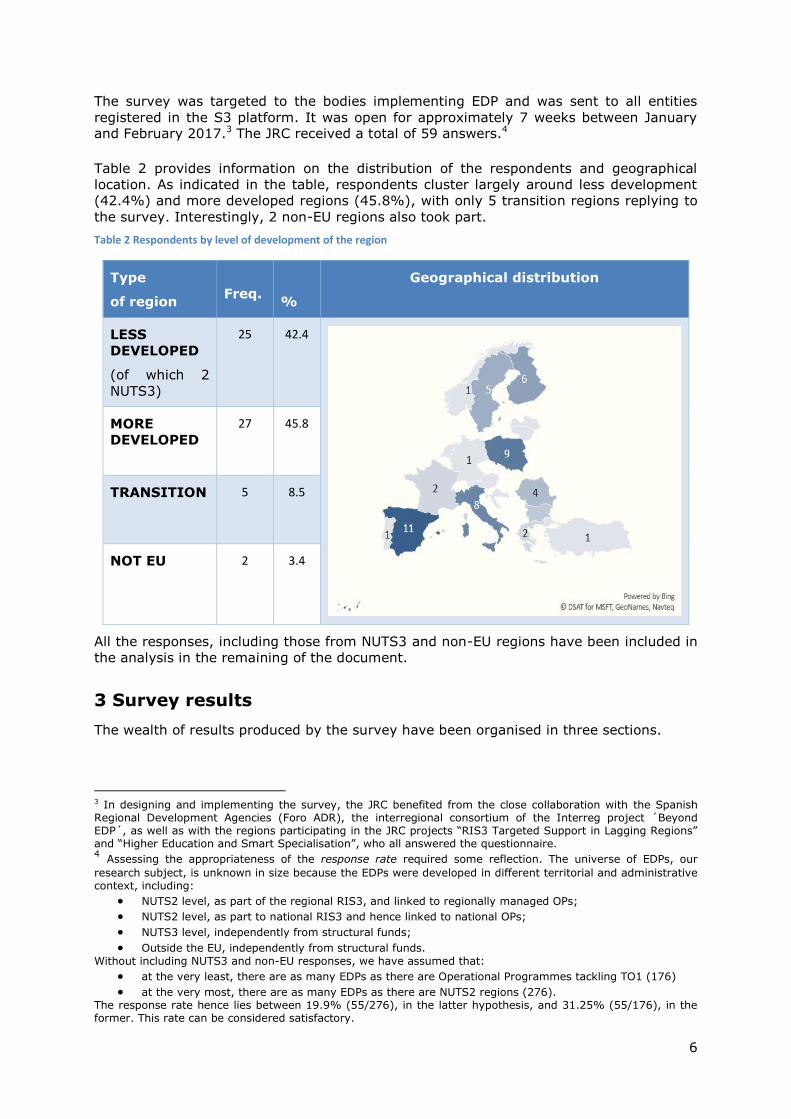
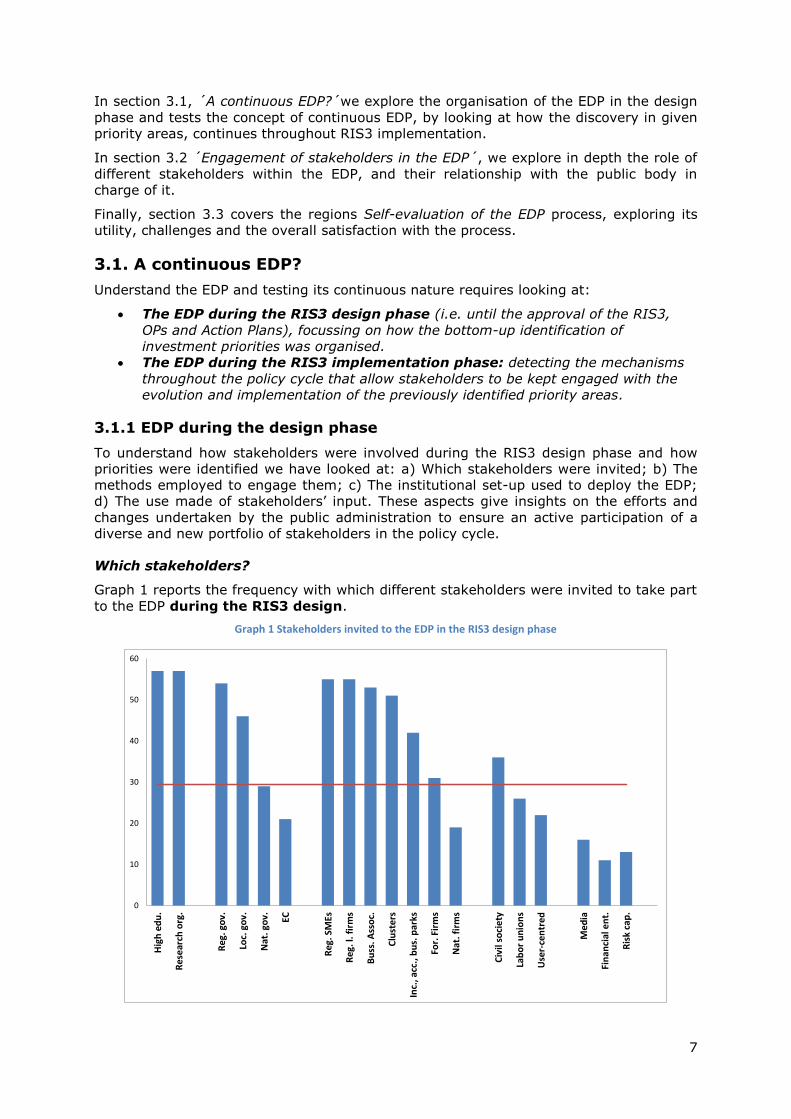
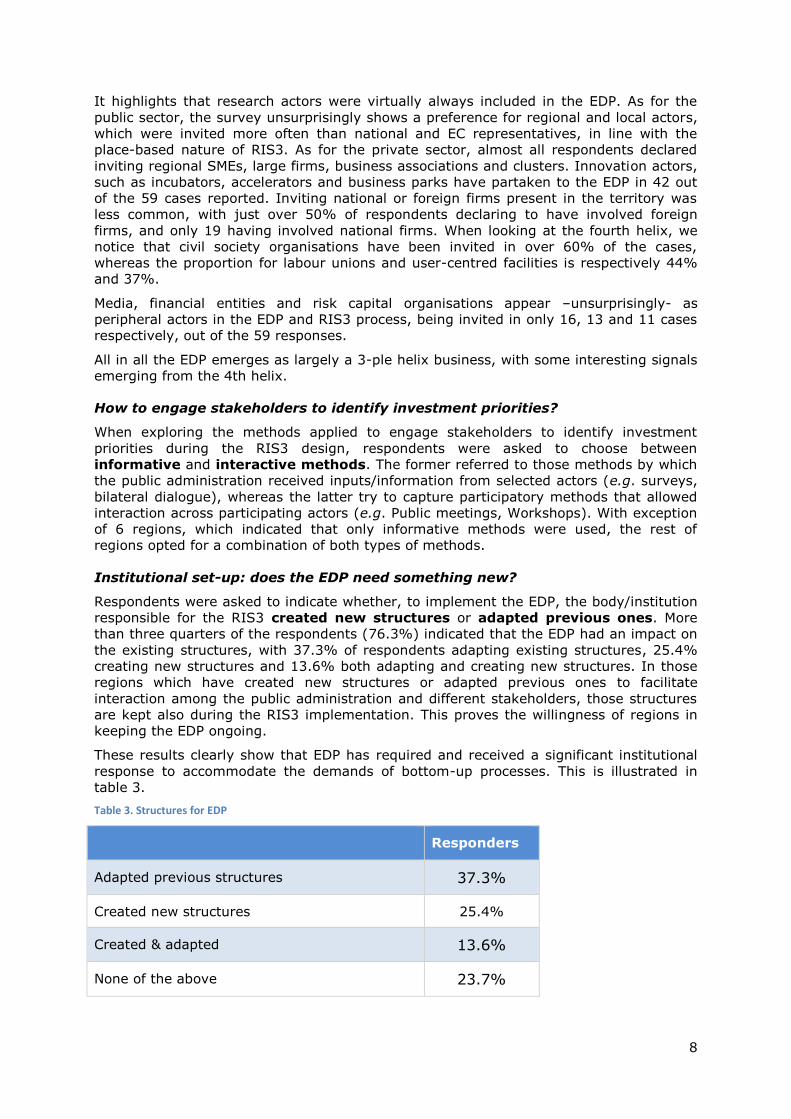
8
It highlights that research actors were virtually always included in the EDP As for the
public sector the survey unsurprisingly shows a preference for regional and local actors
which were invited more often than national and EC representatives in line with the
place-based nature of RIS3 As for the private sector almost all respondents declared
inviting regional SMEs large firms business associations and clusters Innovation actors
such as incubators accelerators and business parks have partaken to the EDP in 42 out
of the 59 cases reported Inviting national or foreign firms present in the territory was
less common with just over 50 of respondents declaring to have involved foreign
firms and only 19 having involved national firms When looking at the fourth helix we
notice that civil society organisations have been invited in over 60 of the cases
whereas the proportion for labour unions and user-centred facilities is respectively 44
and 37
Media financial entities and risk capital organisations appear ndashunsurprisingly- as
peripheral actors in the EDP and RIS3 process being invited in only 16 13 and 11 cases
respectively out of the 59 responses
All in all the EDP emerges as largely a 3-ple helix business with some interesting signals
emerging from the 4th helix
How to engage stakeholders to identify investment priorities
When exploring the methods applied to engage stakeholders to identify investment
priorities during the RIS3 design respondents were asked to choose between
informative and interactive methods The former referred to those methods by which
the public administration received inputsinformation from selected actors (eg surveys
bilateral dialogue) whereas the latter try to capture participatory methods that allowed
interaction across participating actors (eg Public meetings Workshops) With exception
of 6 regions which indicated that only informative methods were used the rest of
regions opted for a combination of both types of methods
Institutional set-up does the EDP need something new
Respondents were asked to indicate whether to implement the EDP the bodyinstitution
responsible for the RIS3 created new structures or adapted previous ones More
than three quarters of the respondents (763) indicated that the EDP had an impact on
the existing structures with 373 of respondents adapting existing structures 254
creating new structures and 136 both adapting and creating new structures In those
regions which have created new structures or adapted previous ones to facilitate
interaction among the public administration and different stakeholders those structures
are kept also during the RIS3 implementation This proves the willingness of regions in
keeping the EDP ongoing
These results clearly show that EDP has required and received a significant institutional
response to accommodate the demands of bottom-up processes This is illustrated in
table 3
Table 3 Structures for EDP
Responders
Adapted previous structures 373
Created new structures 254
Created amp adapted 136
None of the above 237
9
Stakeholdersrsquo input what and what for
Table 4 shows the result of a multiple-choice question where responders indicated that
the EDP was used to gather information actors views on investment for regional
development (83) and to generate consensus among them in relation to investment-
priorities (76)
Table 4 Aims of stakeholderrsquos interaction
Responders
Collect views on regional development 83
Build consensus on investment 76
Both 63
Likewise respondents were asked whether the outcomes of the EDP discussions were
used simply as advice or as a binding opinion (thereby committing the regional
authorities) Table 5 shows that the outcomes of the stakeholders interaction has
provided a binding opinion in 474 of the cases and only advice in the remaining
525 of responses The fact that in many regions the outcomes of the process were
considered binding opinions should be taken as an important success of the process5
Table 5 Use of EDP Outcomes
Responders
Providing advice 525
Providing advice and binding opinion 254
Providing binding opinion 22
All these results confirm that the EDP in the priority-identification phase was indeed
organised with the intention to allow a bottom-up opinion to emerge and to embed it in
the policy decision making
312 EDP during the implementation phase
Testing the concept of continuous entrepreneurial discovery during the RIS3
implementation requires looking at the involvement of stakeholders in the follow-up of
the identification of priorities in particular (a) the ability of stakeholders to review and
refine investment priorities within the governance system of RIS3 (b) the deployment
of implementation instruments that allow different stakeholders to keep exploring
priority-areas (c) the broader participation of stakeholders in RIS3 implementation
including monitoring and calls management as a pre-condition for a continuous EDP
Which stakeholders in RIS3 implementation
Compared to Graph 1 graph 2 reports the frequency with which different stakeholders
are being (or will be) engaged or in the EDP during the RIS3 implementation phase
It highlights that for research actors there is a strong expectation for their involvement
in governance and monitoring However they are ndash unsurprisingly- most frequently seen
as active in relation to calls for proposals as potential beneficiariesA similar pattern
emerges for private sector actors They are mainly perceived as beneficiaries to be
5 It would be interesting to follow up the regional development in those regions where the outcomes of the EDP
were binding opinion to assess the success of the process
10
engaged in activities related to calls for proposals Interesting private-sector
representative bodies (ie business associations and clusters) are those most often
perceived as engaged (or to be engaged) in monitoring and governance followed by
regional firms As for the public sector it is interesting to highlight how for regional
government National government and the EC their main role is in supporting
monitoring Whereas this is the least frequent aspect mentioned for local government
As for the quadruple helix the role of Civil Society (NGOs community organisations) is
more or less balanced across monitoring governance and calls for proposals Unions on
the other hand are more frequently considered as relevant for monitoring (in 17 cases)
as compared to calls for proposalsimplementation (15) or governance (14) Interestingly
user-centred facilities emerge as important beneficiaries with 26 regions considering
them important in relation to call for proposals and only 12 and 8 for monitoring and
governance respectivelyFinally financial entities risk capital and media which are
infrequent participants to RIS3 are taken into account mainly as their role with
investmentcall for proposals likely as supplementary sources of finance
Graph 2 Engagement of stakeholders during the EDP elements of RIS3 implementation
A continuous EDP in the RIS3 governance system
For the EDP to be considered as a continuous process there must be a governance
system that allows a continuous reflection with the stakeholders on the status of current
priorities (their refinement or review) and on the identification of new ones
The survey explored these aspects foreseeing three different levels of stakeholdersrsquo
involvement simple consultation (consisting of sharing information and providing
clarification to stakeholders) interaction (allowing for more in depth dialogue between
stakeholders and with the public administration) or consensus building (a more intense
form of exchange)
Table 6 shows that simpler forms of stakeholdersrsquo engagement (consultation and
interactive dialogue) are the most common On the other hand processes of consensus
building are reported only in 49 of the cases for the refinement of priorities and
4070 in the review of priorities All in all however the vast majority of regions have
governance mechanisms that engage stakeholders in the refinement (881) and review
(831) of priorities supporting the hypothesis that the EDP is best conceived as a
continuous process
31 31
40
30
20
10
19 18
29
25
20
8 8
18
14
86
4
8
35
31
44
25
32
24 23 22
3331
23
13
8
20
17
12
9 86
4846
40
36
19
11
4240
38 38 37
32
25
15
26
1513
15
Hig
h ed
u
Rese
arch
org
Reg
gov
Loc
gov
Nat
gov
EC
Reg
SM
Es
Reg
l fi
rms
Buss
Ass
oc
Clus
ters
Inc
acc
bu
shellip
For
Fir
ms
Nat
fir
ms
Civi
l soc
iety
Labo
r uni
ons
Use
r-ce
ntre
dhellip
Med
ia
Fina
ncia
l ent
Risk
cap
Governance Monitoring Calls for proposal
11
Table 6 Levels of stakeholderacutes involvement
Refinement
of priorities
Review
of priorities
Consultation 661 559
Interactive dialogue 559 492
Consensus building 492 4070
Any of the above 881 831
A continuous EDP in the RIS3 implementation instruments
The EDP can continue through the implementation phase also by deploying instruments
that implement innovation projects based on triple or quadruple helix collaboration
linked to market needs
To this aim the survey asks respondents whether they used policy instruments targeted
at consortia of actors and more specifically whether the consortia are asked to (a)
respond to public demand needs (for instance with calls for Pre-Commercial Public
Procurement) (b) develop and pursue shared action plans or (c) respond to the needs
expressed by users or consumersrsquo groups
These instruments effectively embody the EDP by allowing stakeholders to experiment in
previously identified (broad) priorities areas to refine them and to further the discovery
of new market segments
The results are highlighted in table 7
Table 7 EDP instruments
EDP-type instruments Frequency
Stakeholdersacute Consortia as beneficiaries of RIS3 calls 881
Consortia addressing public demands needs (PCPP) 45
Consortia implementing shared action plans 22
Consortia focussing on usersrsquo needs and participation 61
Either of the three 78
Results indicate that it is fairly common to target consortia as beneficiaries of RIS3 calls
(881) as well as applying instruments where consortia need to target usersrsquo needs
(61) Pre-commercial Public Procurement which can also be considered as an EDP
instrument is used in 45 whereas only 22 of respondents have instruments
supporting consortia implementing shared action plans
All in all 78 of the regions implement at least one of the instruments identified
validating the hypothesis of a continuous EDP process
12
Supporting a continuous EDP through monitoring and calls management
A continuous EDP needs to be embedded in a broader engagement of stakeholders
throughout RIS3 implementation Stakeholders involvement is a pre-condition for a
successful continuous EDP This section illustrates how the engagement of stakeholders
is ensured in different phases of the RIS3 implementation guaranteeing the continuity of
the EDP
Stakeholdersrsquo contribution to the monitoring phase
To this aim the survey has explored two complementary aspects of RIS3
implementation the monitoring process and the management of calls for proposals
As for the monitoring process the survey explored two ways of stakeholdersrsquo
involvement in the process a direct way whereby actors participate in the definition of
indicators or in the monitoring committee an indirect way whereby stakeholders are
passive in terms of producing monitoring outcomes but are informed about them andor
are engaged in decisions that build on monitoring results The results of the analysis are
provided in table 8 which also highlights that 100 of the regions engage stakeholders
in monitoring in at least one of the four ways identified
Table 8 Role of stakeholderacutes involvement during the monitoring
Role Level Direct Indirect Either direct
or indirect
Definition of indicators 475
100 Monitoring committee 339
Informed about monitoring outcomes 400
Involved in decisions based on monitoring 576
Stakeholdersrsquo engagement and callsrsquo management
In relation to calls management a good approach to stakeholdersrsquo engagement which
is supportive of a continuous EDP requires that they are duly informed of the investment
plans and if possible are able to provide feedback on the way calls are being organised
This should make sure that the funds will be appropriately taken-up and the RIS3
priorities implemented The survey highlighted that 644 of regions do publicly present
calls to stakeholders and that 576 present pre-calls providing the opportunity to
receive feedback before they are published In turn 881 of the regions engage in
either or both of these practices
The results of this paragraph indicate that RIS3 is commonly being implemented keeping
stakeholders engaged hence supporting a continuous EDP
32 Engagement of stakeholders in the EDP
This section analyses stakeholdersrsquo participation and engagement in the EDP process
For each stakeholder that had been invited to the EDP in the RIS3 design phase
respondents were asked to rate the level of engagement that they desired expected
and actually received6
6 (eg in answering emails participating in meetingsworkshops providing information to the public authorities
or engaging in any other EDP activity)
13
The type of engagement is defined as follows
Actual engagement effective and real participation of the stakeholder in the
EDP activities
Desired engagement level of contribution to the EDP activities that the public
administration would ideally receive from the stakeholder
Expected engagement involvement of the stakeholder in the EDP activities
realistically foreseen
Answers were organised on a 4-level scale from 0 to 3 with 0 indicating no engagement
and 3 indicating high engagement
Table 9 provides the average for the three scores for actual expected and desired
engagement
Table 9 Type of participation by stakeholders
Stakeholder invited Actual Desired Expected
Higher education institutions 255 279 260
Research organisations 254 280 262
Regional government and agencies 251 279 258
Local government 209 262 240
National government 207 231 221
European Commission 225 245 242
Regional SMEs 222 272 242
Regional Large firms 204 267 232
Business associationsChambers of commerce 225 265 242
Clusters organisations 243 283 264
Incubators accelerators and business parks 222 278 253
Foreign firms 170 243 197
National firms 189 239 206
Civil society 144 214 168
Labour unions 148 188 172
User-centered communities and labs 173 250 223
Independent experts 197 230 231
Media 113 247 180
Financial entities (eg banks) 122 211 167
Risk capital 167 250 218
Higher Education institutions have the highest average score for actual engagement
(255) shortly followed by Research Organisations (254) and Regional government
(251) Clusters come shortly after these three actors with an average of 243
Interestingly when it comes to desired engagement it is clusters to have the highest
average score (283) followed shortly after by research organisations (28) regional
government279) higher education (279) and incubators accelerators etc (278)
In terms of expected engagement we see again that clusters top the rank with an
average score of 264 shortly followed by research organisations (262) higher
education (260) and regional government (258) All in all clusters research and higher
14
education together with regional government appear as the main actors in terms of
engagement in the EDP process
321 Insights on stakeholdersrsquo engagement comparing actual desired and expected engagement
By looking at the difference between actual and expected engagement we are able to
draw useful insights on the relationships between the EDP organisers and the different
stakeholders
In particular when comparing the actual and the expected level of engagement we can
evaluate whether the EDP organiser has a good understanding of local actors
Specifically if the expected engagement is
the same as the actual one it means that the EDP organiser understands well
the behaviour of the stakeholders
higher than the actual one it indicates that the EDP organiser is
overestimating the interest of the stakeholders
lower than the actual one it suggests that the region had underestimated the
level of interest of a given actor This can be considered as a positive surprise
In formulas
119860119888119905119906119886119897119864119899119892119886119892119890119898119890119899119905 minus 119864119909119901119890119888119905119890119889119864119899119892119886119892119890119898119890119899119905 = 0 rarr 119866119900119900119889 119870119899119900119908119897119890119889119892119890 119900119891 119905ℎ119890 119878119905119886119896119890ℎ119900119897119889119890119903
119860119888119905119906119886119897119864119899119892119886119892119890119898119890119899119905 minus 119864119909119901119890119888119905119890119889119864119899119892119886119892119890119898119890119899119905 gt 0 rarr 119880119899119889119890119903119890119904119905119894119898119886119905119890119889 119878119905119886119896119890ℎ119900119897119889119890119903prime119904 119894119899119905119890119903119890119904119905
119860119888119905119906119886119897119864119899119892119886119892119890119898119890119899119905 minus 119864119909119901119890119888119905119890119889119864119899119892119886119892119890119898119890119899119905 lt 0 rarr 119874119907119890119903119890119904119905119894119898119886119905119890119889 119878119905119886119896119890ℎ119900119897119889119890119903prime119904 119894119899119905119890119903119890119904119905
Following a similar reasoning comparing the actual and desired level of engagement
allows evaluating how positive the relationship between the EDP organiser and the
individual stakeholders is Thus when the actual is
the same as the desired engagement it means the region has a satisfactory
relationship with stakeholders the region gets what they want from the actors (be
it a large or small level engagement)
higher than the desired engagement it suggests an intrusive relationship
with stakeholders participating in unwarranted ways to the process of
entrepreneurial discovery
lower than the desired engagement it indicates an unsatisfactory
relationship with the EDP organisers wishing more from the exchange with given
actors
In formulas
119860119888119905119906119886119897119864119899119892119886119892119890119898119890119899119905 minus 119863119890119904119894119903119890119889119864119899119892119886119892119890119898119890119899119905 = 0 rarr 119878119886119905119894119904119891119886119888119905119900119903119910 119903119890119897119886119905119894119900119899119904ℎ119894119901
119860119888119905119906119886119897119864119899119892119886119892119890119898119890119899119905 minus 119863119890119904119894119903119890119889119864119899119892119886119892119890119898119890119899119905 gt 0 rarr 119868119899119905119903119906119904119894119907119890 119903119890119897119886119905119894119900119899119904ℎ119894119901
119860119888119905119906119886119897119864119899119892119886119892119890119898119890119899119905 minus 119863119890119904119894119903119890119889119864119899119892119886119892119890119898119890119899119905 lt 0 rarr 119880119899119904119886119905119894119904119891119886119888119905119900119903119910 119903119890119897119886119905119894119900119899119904ℎ119894119901
The graphs below report for each group of stakeholders the proportion of regions
having scores equal bigger or lower than 0 in the difference between actual and
desired and actual and expected engagement
a) Research and Higher education ndash 1st Helix
Research organisations and higher education institutions are two of the main
stakeholders in the EDP for which the actual desired and expected engagement
emerged as the one of the highest in table 9 above
15
In graph 3 we notice that these stakeholders are well known in over 70 of the cases
the actual engagement matched the expected one Whilst the relationship with these
actors is often satisfactory (as reported by 714 and 745 of the regions for higher
education institutions and research organisations respectively) as shown in graph 4
approximately a quarter of respondents have found the relationship between universities
and research centres unsatisfactory (232 and 255 respectively) that is they
desired a higher engagement than the one actually experienced
b) Public Sector ndash 2nd Helix
Graphs 5 and 6 below reveal the patterns of relationship that the EDP organisers have
with public-sector stakeholders It emerges that whilst regional national and EC public
actors follow similar patterns local government has a somewhat different behaviour
Graph 5 Actual vs Expected engagement ndash 2nd
Helix
Notably in graph 5 a high majority of respondents revealed a good knowledge of
stakeholders of the public sector with the lowest proportion emerging for the EC
750667 690 632
104
48103
105
146286
207 263
Reg gov Loc gov Nat gov EC
Good Knowledge Underestimated interest
Overestimated interest
Graph 3 Actual vs Expected engagement ndash 1st
Helix
Graph 4 Actual vs Desired engagementndash 1st
Helix
714 745
54 00
232 255
High edu Research org
Satisfactory Intrusive Unsatisfactory
16
(632) and local government (667) Interestingly in the case of local government
there were fewer cases in which interest in the EDP was underestimated (48 as
compared to more than 10 for the other actors) whereas overestimation was most
common (286) This suggest a disengagement from the sub-regional level which is
confirmed in graph 6 where the relationship emerges as unsatisfactory in 523 of the
caseas as compared to 276 25 and 235 for National government the EC and
Regional government
c) Private Sector ndash 3rd Helix
As indicated in graph 7 in the case of the private sector the proportion of regions with a
good knowledge of and a satisfactory relationshop with stakeholders is in general lower
than in the case of research and higher education actors Only for clusters for more than
70 of respondents the actual engagement reflected the expected one
Graph 7 Actual vs Expected engagement ndash 3rd Helix
A satisfactory relationship one in which desired and actual enagement coincide emerges
most often with regional SMEs business associations clusters and incubators as shown
in graph 8 below The relationship emerges as unsatisfactory most often for foreign firms
434 472612
711
550414
588
208 151
12267
75207
118
358 377265 222
375 379294
Reg SMEs Reg L firms Buss Assoc Clusters Inc accbus parks
For Firms Nat firms
Good Knowledge Underestimated interest
Overestimated interest
Graph 6 Actual vs Desired engagement ndash 2nd
Helix
745
432
621 650
20
45
103 100
235
523
276 250
Reg gov Loc gov Nat gov EC
Satisfactory Intrusive Unsatisfactory
17
with facilities in the region (567) Interestingly more than 1 in 5 regions
underestimated the interest of local SMEs and foreign firms indicating that there is
scope for attempting to engage these actors further
Graph 8 Actual vs Desired engagement ndash 3rd Helix
d) Civil Society ndash 4th Helix
The graphs below refer to peripheral actors in the EDP which have infrequently been
invited or taken part to the process
Graph 9 Actual vs Expected engagement ndash 4th
Helix
Graph 10 Actual vs Desired engagement ndash 4th
Helix
Among the actors classified as part of the 4th helix we find that labour unions are the
ones that regions know best (68) and those where a satisfactory relationship is most
common (583) Civil society organisations are the least known (only in 333 of the
cases expected and actual engagement coincided) and the ones where an unsatisfactory
or intrusive relationship is most common and (83 of cases)The findings indicate that
much needs to be done to untap the potential of the 4-ple helix for innovation with
583 and 591 of regions finding the relationship with civil society organisations and
user-centered spaces unsatisfactory
500 481 529 553 525400 389
37 1959 43
00
33 111
463 500412 404
475567
500
Reg SMEs Reg L firms Buss Assoc Clusters Inc accbus parks
For Firms Nat firms
Satisfactory Intrusive Unsatisfactory
441
680500
176
40
45
382280
455
Civil society Labor unions User-centred spaces
Good Knowledge Underestimated interest
Overestimated interest
333
583409
83
42
00
583
375
591
Civil society Labor unions User-centred spaces
Satisfactory Intrusive Unsatisfactory
18
e) Other actors
Graph 11 and 12 below report information related to actors that have so far been
peripheral to the EDP namely media financial entities and risk capital
Graph 11 Actual vs Expected engagement ndash Other Graph 12 Actual vs Desired engagement ndash Other
The relationship with these actors is most often unsatisfactory as indicated on the right
hand graph with 80 889 and 593 of the regions not meeting their desires in
terms of engagement with media financial entities and risk capital respectively Media
and risk capital emerged as poorly known in graph 11 with approximately one third of
the regions displaying a good knowledge of this actor On the other hand nearly 56 of
the regions who engaged with financial entities gauged their expectations correctly
Despite the overall peripheral role of these actors some interesting dynamics emerge in
relation to Risk Capital with 182 of the regions engaging them finding them more
interested in the EDP process than expected
322 Stakeholdersrsquo engagement future desires
The graph below evaluates how the respondents would like the future engagement with
the different types of actors to be7
Whilst as shown in the previous sections of the report research actors are well known
and enjoy a good relationship with regional bodies in charge of RIS3 and whilst they
have been actively engaged throughout the process the survey highlights that more
engagement from their side is desired In the case of universities over 47 of
respondents would like them to be either somewhat more engaged (309) or
substantially more engaged (164) The pattern is similar for research organisations
where 377 of respondents would like them to be somewhat more engaged and 170
would like them to be substantially more engaged
Among the core EDP actors in the private sector it is interesting to notice that it is
regional SMEs and Regional firms where most often respondents are unsatisfied with
their past level of engagement and would like a significantly higher participation For
SMEs 15 regions (288) indicated that whereas for large firms 13 (25)Among public
actors it is interesting to notice a few cases in which local government national
government and the EC are welcome to be less engaged in the future (23 and 4
respondents respectively)
7 Only respondents who had invited a given stakeholders were asked to evaluate their future desired
engagement with the latter
333
556
364
67
00
182
600444 455
Media Financial ent Risk cap
Good Knowledge Underestimated interest
Overestimated interest
200111
333
83
800889
583
Media Financial ent Risk cap
Satisfactory Intrusive Unsatisfactory
19
Some interesting dynamics emerge in the 4-ple helix where user-centred facilities and
civil society feature as the second and fourth actor which in relative terms regions
would like to be somewhat more engaged (476 and 438 of regions which engaged
them in EDP for the design phase of RIS3 would like to have them participate more in the
implementation phase)
As for the remaining actors it is interesting to notice that experiences with Risk Capital
emerge as difficult with 6 out of the 12 regions that engaged them previously desiring a
lower engagement in the future As for financial entities 7 out of 10 would like them to
be more engaged In the case of media 9 out of 15 would like this actor to be somewhat
or significantly more engaged in the process
Graph 13 Future desired engagement in RIS3 implementation
33 EDP self-evaluation
To help assessing the impact of the EDP during the elaboration of the RIS3 the first part
of the survey asked participants to reflect on the effectiveness and overall experience of
the process When participants were asked if the process was effective in
identifying investment priorities for regional development 932 provided a positive
answer Likewise when asked to consider the EDP as a positive or negative experience
during the elaboration of RIS3 966 referred to the process as positive Interestingly
39 of the responses pointed out that the EDP had brought conflicts among stakeholders
(or between stakeholders and the public administration) during the elaboration of RIS3
Although the survey didnrsquot go in depth into the kind of conflicts it generated this feature
could led to further research in order to understand if the conflicts were due to lack of
understanding conflict of interests or other relevant criteria
The survey also allowed for some self-reflection on other outcomes of the EDP When
asked whether the EDP represented a novelty in the policy process 51 out of the 59
respondents indicated that this was the case Furthermore as the graph below shows
the EDP is considered a satisfactory process in its ability to
0
10
20
30
40
50
60
70
80
90
100
Substantially more engaged Somewhat more engaged
Equally engaged Less engaged than in the previous phase
20
Increase trust among stakeholders where nearly 80 of respondents are
either satisfied or very satisfied
Increase trust towards the public sector where just over 75 of
respondents reveal to be either satisfied or very satisfied
Engage stakeholders in regional development where again three quarters of
respondents are either satisfied or very satisfied
Improve public-policy decision making where again nearly 75 report being
satisfied or very satisfied
Graph 14 EDP self-evaluation
4 Conclusions and next steps
When the term Entrepreneurial Discovery Process (or EDP) was introduced it referred to
the identification of areas for investment in research and innovation (ie priority-areas)
through an inclusive and evidence-based process grounded in stakeholdersrsquo engagement
(Foray et al 2009) Six years later the experience of the S3 Platform has required a
conceptual reflection on the EDP itself and an empirical investigation on the role of
stakeholders within it Conceptually the EDP has evolved from being a process limited
to the identification of investment-priorities in the design-phase of a strategy into a
continuous activity Empirically whilst the EDP was always defined as a bottom-up
participatory process there was a significant gap in understanding how different actors
engaged in it
This report based on a survey on EDP-practices run within the S3 Platform has
addressed both issues Firstly it submits the concept of continuous EDP developed in
Perianez-Forte et al (2016) to an empirical test Secondly it looks in depth at the role of
different stakeholders in the EDP
The data confirms that the EDP has evolved from an activity conceived exclusively for
choosing investments priorities under the ERDF Thematic Objective 1 into a continuous
process permeating S3 implementation
34
203 237 237220
593593
475 475
203 169
288 271
Increase trust amongstakeholders
Increase trust towards thepublic sector
Engage stakeholders inreg development
Ability to improve policydecision making
Not satisfied Somewhat satisfied Satisfied Very satisfied
21
A continuous EDP implies that once investment priorities have been identified with the
involvement of stakeholders the EDP keeps going throughout the strategyrsquos
implementation stakeholders are kept engaged in different ways in the refinement of
the priority-areas the identification of instruments that implement them as well as the
RIS3 governance and monitoring mechanisms that should deliver the expected
competitive advantages in each area The data collected clearly indicates that this is
happening
The survey results indicate that the EDP -as bottom up process- has required and it is
still requiring adjustments to the governance system Regions have responded to the
EDP by finding ways to favour an in depth interaction and engagement with local actors
in the development of S3 priorities Our survey has also given insights on the
participation and role of stakeholders in the EDP as well as on the relationship
between the latter and the EDP organisers (ie how well the stakeholder is understood
and how satisfactory is the relationship)
In terms of participation the data indicates that the EDP is mainly a triple-helix business
The research private and public sectors are much more frequently involved than other
societal actors Furthermore research actors are generally well known by the EDP
organisers and their relationship is very often satisfactory A similar picture emerges with
public actors such as regional bodies national government and the EC Interestingly
whilst local government is an actor that is often well known by EDP organisers the
relationship is often unsatisfactory As for the private sector our survey suggests that
EDP organisers are better able to understand associations of businesses (ie clusters or
representative organisations business parks) than individual firms Furthermore the
relationship with the private sector is in general less satisfactory than with the research
and public actors As for the fourth-helix a peripheral actor in the EDP our data
indicates some untapped potential Regions which have engaged with civil society
revealed to have often underestimated their interest and would like to increase their
involvement in the future
In terms of stakeholdersrsquo role in the EDP during RIS3 implementation we see that
the research and business sector are indeed expected to take part to governance and
monitoring activities however their involvement in the continuous EDP is most frequent
related to calls management (ie commenting on pre-calls etc) This reflects the
importance of these actors as beneficiaries of RIS3 investment As for the public sector
and specifically regional and national governments and EC institutions their main role is
in supporting monitoring revealing a demand for guidance on this crucial aspect of RIS3
implementation
To conclude the survey reveals that the EDP has been a positive experience for regions
across different dimensions and stakeholdersrsquo engagement across the whole 4-ple helix
continues to be desired
In delivering a much clearer picture of EDP practices the survey has unavoidably raised
further questions In particular further investigation and policy support should
reveal what is behind a satisfactoryunsatisfactory relationship or a goodpoor
understanding of a given actor
clarify the institutional and stakeholdersrsquo characteristics that favour a good
interaction and a functioning EDP
identify the mechanisms through which stakeholdersrsquo engagement can be
sustained especially in activities like monitoring governance or the management
of calls
recognise and share policy instruments mechanisms andor structures and good
practices that are effective in supporting a continuous EDP
Future activities of the S3 Platform and the project Targeted Support to Lagging Regions
will take these results into account to address the most pressing demands related to
RIS3 implementation
22
References
European Union (2013) Regulation (EU) No 13032013 of the European Parliament and
of the Council of 17 December 2013 laying down common provisions on the
European Regional Development Fund the European Social Fund the Cohesion
Fund the European Agricultural Fund for Rural Development and the European
Maritime and Fisheries Fund and laying down general provisions on the European
Regional Development Fund the European Social Fund the Cohesion Fund and the
European Maritime and Fisheries Fund and repealing Council Regulation (EC) No
10832006 Brussels European Union
Foray D David P and Hall B (2009) lsquoSmart Specialisation ndash The Concept rsquo in
Knowledge Economists Policy Brief ndeg 9 June 2009
Foray D and Goenaga X (2013) The Goals of Smart Specialisationrsquo JRC Scientific and
Policy Reports n JRC82213 doi10279120158
Gianelle C Kyriakou D Cohen C and Przeor M (eds) (2016) Implementing Smart
Specialisation A Handbook Brussels European Commission EUR 28053 EN
doi10279153569
Gianelle C Guzzo F and Mieszkowski K (2017) Smart Specialisation at work Analysis
of the calls launched under ERDF Operational Programmes JRC Technical Reports
JRC106974
Perianez-Forte I Marinelli E Foray D (2016) The Entrepreneurial Discovery Process
(EDP) cyclefrom priority selection to strategy implementation in Gianelle C
Kyriakou D Cohen C and Przeor M (eds) Implementing Smart Specialisation A
Handbook Brussels European Commission EUR 28053 EN doi10279153569
Europe Direct is a service to help you find answers
to your questions about the European Union
Freephone number ()
00 800 6 7 8 9 10 11 () The information given is free as are most calls (though some operators phone boxes or hotels may
charge you)
More information on the European Union is available on the internet (httpeuropaeu)
HOW TO OBTAIN EU PUBLICATIONS
Free publications
bull one copy
via EU Bookshop (httpbookshopeuropaeu)
bull more than one copy or postersmaps
from the European Unionrsquos representations (httpeceuropaeurepresent_enhtm)from the delegations in non-EU countries (httpeeaseuropaeudelegationsindex_enhtm)by contacting the Europe Direct service (httpeuropaeueuropedirectindex_enhtm) orcalling 00 800 6 7 8 9 10 11 (freephone number from anywhere in the EU) ()
() The information given is free as are most calls (though some operators phone boxes or hotels may charge you)
Priced publications
bull via EU Bookshop (httpbookshopeuropaeu)
24 doi102760514714
ISBN 978-92-79-74377-1
KJ-N
A-2
8838-E
N-N
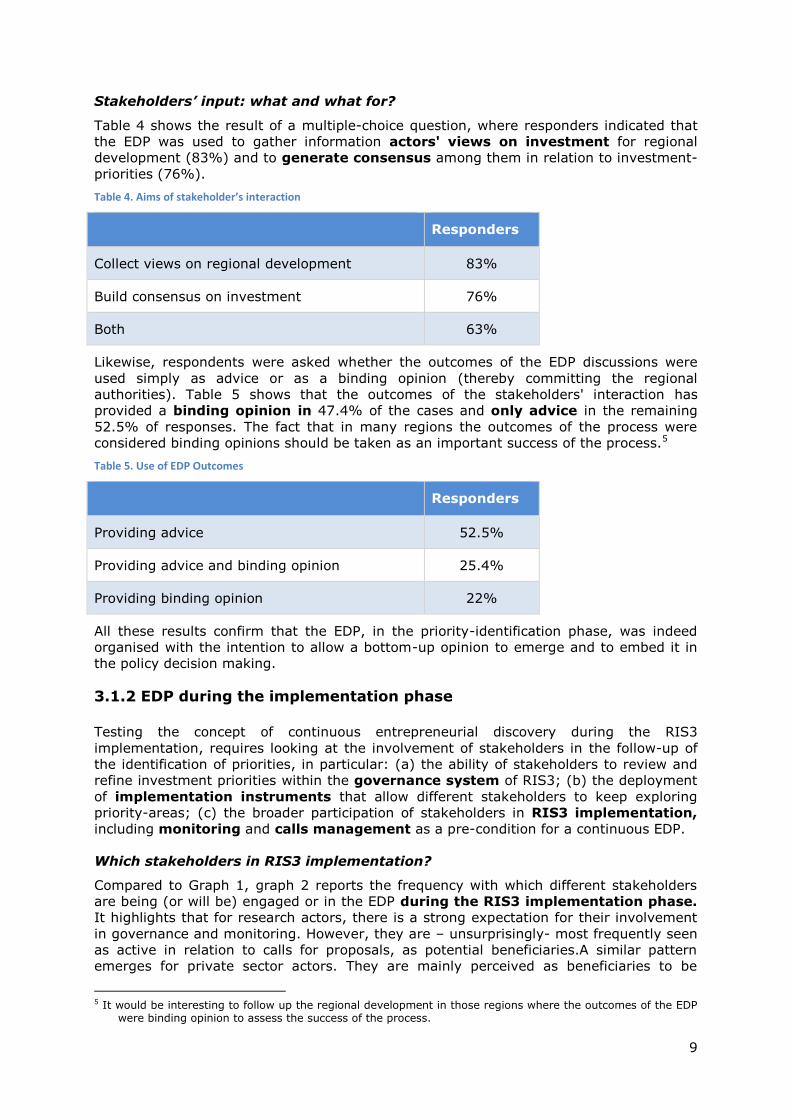
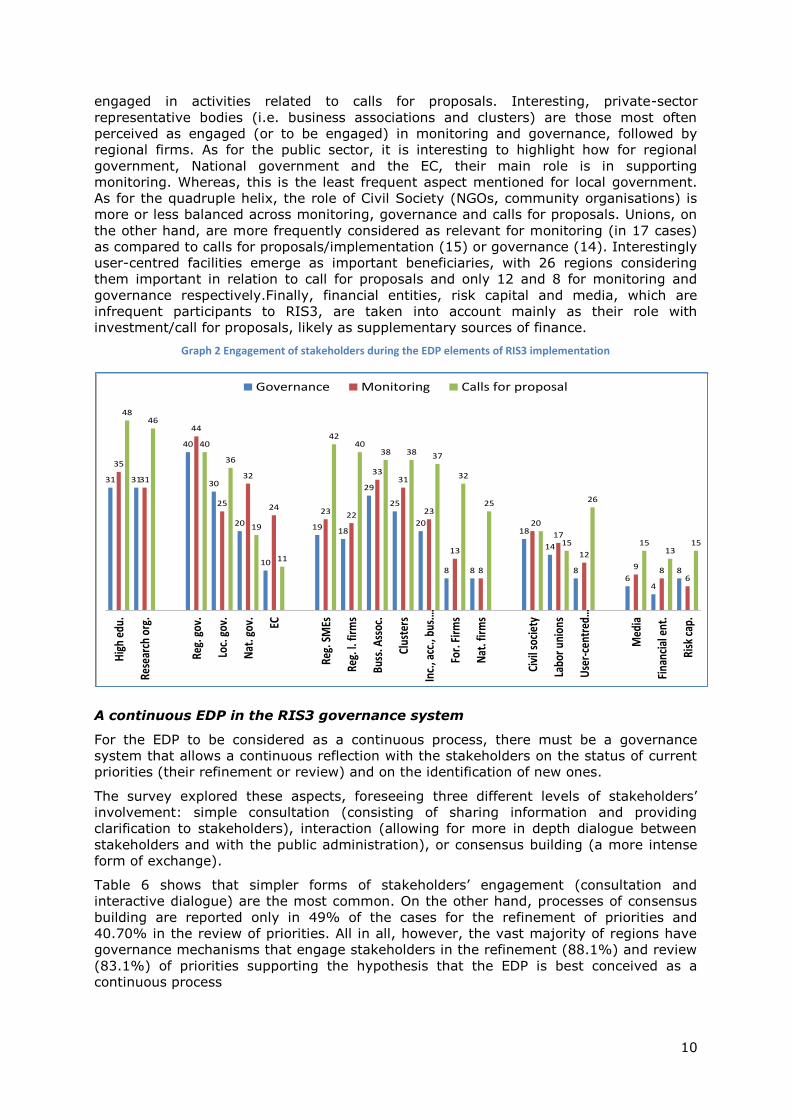
10
engaged in activities related to calls for proposals Interesting private-sector
representative bodies (ie business associations and clusters) are those most often
perceived as engaged (or to be engaged) in monitoring and governance followed by
regional firms As for the public sector it is interesting to highlight how for regional
government National government and the EC their main role is in supporting
monitoring Whereas this is the least frequent aspect mentioned for local government
As for the quadruple helix the role of Civil Society (NGOs community organisations) is
more or less balanced across monitoring governance and calls for proposals Unions on
the other hand are more frequently considered as relevant for monitoring (in 17 cases)
as compared to calls for proposalsimplementation (15) or governance (14) Interestingly
user-centred facilities emerge as important beneficiaries with 26 regions considering
them important in relation to call for proposals and only 12 and 8 for monitoring and
governance respectivelyFinally financial entities risk capital and media which are
infrequent participants to RIS3 are taken into account mainly as their role with
investmentcall for proposals likely as supplementary sources of finance
Graph 2 Engagement of stakeholders during the EDP elements of RIS3 implementation
A continuous EDP in the RIS3 governance system
For the EDP to be considered as a continuous process there must be a governance
system that allows a continuous reflection with the stakeholders on the status of current
priorities (their refinement or review) and on the identification of new ones
The survey explored these aspects foreseeing three different levels of stakeholdersrsquo
involvement simple consultation (consisting of sharing information and providing
clarification to stakeholders) interaction (allowing for more in depth dialogue between
stakeholders and with the public administration) or consensus building (a more intense
form of exchange)
Table 6 shows that simpler forms of stakeholdersrsquo engagement (consultation and
interactive dialogue) are the most common On the other hand processes of consensus
building are reported only in 49 of the cases for the refinement of priorities and
4070 in the review of priorities All in all however the vast majority of regions have
governance mechanisms that engage stakeholders in the refinement (881) and review
(831) of priorities supporting the hypothesis that the EDP is best conceived as a
continuous process
31 31
40
30
20
10
19 18
29
25
20
8 8
18
14
86
4
8
35
31
44
25
32
24 23 22
3331
23
13
8
20
17
12
9 86
4846
40
36
19
11
4240
38 38 37
32
25
15
26
1513
15
Hig
h ed
u
Rese
arch
org
Reg
gov
Loc
gov
Nat
gov
EC
Reg
SM
Es
Reg
l fi
rms
Buss
Ass
oc
Clus
ters
Inc
acc
bu
shellip
For
Fir
ms
Nat
fir
ms
Civi
l soc
iety
Labo
r uni
ons
Use
r-ce
ntre
dhellip
Med
ia
Fina
ncia
l ent
Risk
cap
Governance Monitoring Calls for proposal
11
Table 6 Levels of stakeholderacutes involvement
Refinement
of priorities
Review
of priorities
Consultation 661 559
Interactive dialogue 559 492
Consensus building 492 4070
Any of the above 881 831
A continuous EDP in the RIS3 implementation instruments
The EDP can continue through the implementation phase also by deploying instruments
that implement innovation projects based on triple or quadruple helix collaboration
linked to market needs
To this aim the survey asks respondents whether they used policy instruments targeted
at consortia of actors and more specifically whether the consortia are asked to (a)
respond to public demand needs (for instance with calls for Pre-Commercial Public
Procurement) (b) develop and pursue shared action plans or (c) respond to the needs
expressed by users or consumersrsquo groups
These instruments effectively embody the EDP by allowing stakeholders to experiment in
previously identified (broad) priorities areas to refine them and to further the discovery
of new market segments
The results are highlighted in table 7
Table 7 EDP instruments
EDP-type instruments Frequency
Stakeholdersacute Consortia as beneficiaries of RIS3 calls 881
Consortia addressing public demands needs (PCPP) 45
Consortia implementing shared action plans 22
Consortia focussing on usersrsquo needs and participation 61
Either of the three 78
Results indicate that it is fairly common to target consortia as beneficiaries of RIS3 calls
(881) as well as applying instruments where consortia need to target usersrsquo needs
(61) Pre-commercial Public Procurement which can also be considered as an EDP
instrument is used in 45 whereas only 22 of respondents have instruments
supporting consortia implementing shared action plans
All in all 78 of the regions implement at least one of the instruments identified
validating the hypothesis of a continuous EDP process
12
Supporting a continuous EDP through monitoring and calls management
A continuous EDP needs to be embedded in a broader engagement of stakeholders
throughout RIS3 implementation Stakeholders involvement is a pre-condition for a
successful continuous EDP This section illustrates how the engagement of stakeholders
is ensured in different phases of the RIS3 implementation guaranteeing the continuity of
the EDP
Stakeholdersrsquo contribution to the monitoring phase
To this aim the survey has explored two complementary aspects of RIS3
implementation the monitoring process and the management of calls for proposals
As for the monitoring process the survey explored two ways of stakeholdersrsquo
involvement in the process a direct way whereby actors participate in the definition of
indicators or in the monitoring committee an indirect way whereby stakeholders are
passive in terms of producing monitoring outcomes but are informed about them andor
are engaged in decisions that build on monitoring results The results of the analysis are
provided in table 8 which also highlights that 100 of the regions engage stakeholders
in monitoring in at least one of the four ways identified
Table 8 Role of stakeholderacutes involvement during the monitoring
Role Level Direct Indirect Either direct
or indirect
Definition of indicators 475
100 Monitoring committee 339
Informed about monitoring outcomes 400
Involved in decisions based on monitoring 576
Stakeholdersrsquo engagement and callsrsquo management
In relation to calls management a good approach to stakeholdersrsquo engagement which
is supportive of a continuous EDP requires that they are duly informed of the investment
plans and if possible are able to provide feedback on the way calls are being organised
This should make sure that the funds will be appropriately taken-up and the RIS3
priorities implemented The survey highlighted that 644 of regions do publicly present
calls to stakeholders and that 576 present pre-calls providing the opportunity to
receive feedback before they are published In turn 881 of the regions engage in
either or both of these practices
The results of this paragraph indicate that RIS3 is commonly being implemented keeping
stakeholders engaged hence supporting a continuous EDP
32 Engagement of stakeholders in the EDP
This section analyses stakeholdersrsquo participation and engagement in the EDP process
For each stakeholder that had been invited to the EDP in the RIS3 design phase
respondents were asked to rate the level of engagement that they desired expected
and actually received6
6 (eg in answering emails participating in meetingsworkshops providing information to the public authorities
or engaging in any other EDP activity)
13
The type of engagement is defined as follows
Actual engagement effective and real participation of the stakeholder in the
EDP activities
Desired engagement level of contribution to the EDP activities that the public
administration would ideally receive from the stakeholder
Expected engagement involvement of the stakeholder in the EDP activities
realistically foreseen
Answers were organised on a 4-level scale from 0 to 3 with 0 indicating no engagement
and 3 indicating high engagement
Table 9 provides the average for the three scores for actual expected and desired
engagement
Table 9 Type of participation by stakeholders
Stakeholder invited Actual Desired Expected
Higher education institutions 255 279 260
Research organisations 254 280 262
Regional government and agencies 251 279 258
Local government 209 262 240
National government 207 231 221
European Commission 225 245 242
Regional SMEs 222 272 242
Regional Large firms 204 267 232
Business associationsChambers of commerce 225 265 242
Clusters organisations 243 283 264
Incubators accelerators and business parks 222 278 253
Foreign firms 170 243 197
National firms 189 239 206
Civil society 144 214 168
Labour unions 148 188 172
User-centered communities and labs 173 250 223
Independent experts 197 230 231
Media 113 247 180
Financial entities (eg banks) 122 211 167
Risk capital 167 250 218
Higher Education institutions have the highest average score for actual engagement
(255) shortly followed by Research Organisations (254) and Regional government
(251) Clusters come shortly after these three actors with an average of 243
Interestingly when it comes to desired engagement it is clusters to have the highest
average score (283) followed shortly after by research organisations (28) regional
government279) higher education (279) and incubators accelerators etc (278)
In terms of expected engagement we see again that clusters top the rank with an
average score of 264 shortly followed by research organisations (262) higher
education (260) and regional government (258) All in all clusters research and higher
14
education together with regional government appear as the main actors in terms of
engagement in the EDP process
321 Insights on stakeholdersrsquo engagement comparing actual desired and expected engagement
By looking at the difference between actual and expected engagement we are able to
draw useful insights on the relationships between the EDP organisers and the different
stakeholders
In particular when comparing the actual and the expected level of engagement we can
evaluate whether the EDP organiser has a good understanding of local actors
Specifically if the expected engagement is
the same as the actual one it means that the EDP organiser understands well
the behaviour of the stakeholders
higher than the actual one it indicates that the EDP organiser is
overestimating the interest of the stakeholders
lower than the actual one it suggests that the region had underestimated the
level of interest of a given actor This can be considered as a positive surprise
In formulas
119860119888119905119906119886119897119864119899119892119886119892119890119898119890119899119905 minus 119864119909119901119890119888119905119890119889119864119899119892119886119892119890119898119890119899119905 = 0 rarr 119866119900119900119889 119870119899119900119908119897119890119889119892119890 119900119891 119905ℎ119890 119878119905119886119896119890ℎ119900119897119889119890119903
119860119888119905119906119886119897119864119899119892119886119892119890119898119890119899119905 minus 119864119909119901119890119888119905119890119889119864119899119892119886119892119890119898119890119899119905 gt 0 rarr 119880119899119889119890119903119890119904119905119894119898119886119905119890119889 119878119905119886119896119890ℎ119900119897119889119890119903prime119904 119894119899119905119890119903119890119904119905
119860119888119905119906119886119897119864119899119892119886119892119890119898119890119899119905 minus 119864119909119901119890119888119905119890119889119864119899119892119886119892119890119898119890119899119905 lt 0 rarr 119874119907119890119903119890119904119905119894119898119886119905119890119889 119878119905119886119896119890ℎ119900119897119889119890119903prime119904 119894119899119905119890119903119890119904119905
Following a similar reasoning comparing the actual and desired level of engagement
allows evaluating how positive the relationship between the EDP organiser and the
individual stakeholders is Thus when the actual is
the same as the desired engagement it means the region has a satisfactory
relationship with stakeholders the region gets what they want from the actors (be
it a large or small level engagement)
higher than the desired engagement it suggests an intrusive relationship
with stakeholders participating in unwarranted ways to the process of
entrepreneurial discovery
lower than the desired engagement it indicates an unsatisfactory
relationship with the EDP organisers wishing more from the exchange with given
actors
In formulas
119860119888119905119906119886119897119864119899119892119886119892119890119898119890119899119905 minus 119863119890119904119894119903119890119889119864119899119892119886119892119890119898119890119899119905 = 0 rarr 119878119886119905119894119904119891119886119888119905119900119903119910 119903119890119897119886119905119894119900119899119904ℎ119894119901
119860119888119905119906119886119897119864119899119892119886119892119890119898119890119899119905 minus 119863119890119904119894119903119890119889119864119899119892119886119892119890119898119890119899119905 gt 0 rarr 119868119899119905119903119906119904119894119907119890 119903119890119897119886119905119894119900119899119904ℎ119894119901
119860119888119905119906119886119897119864119899119892119886119892119890119898119890119899119905 minus 119863119890119904119894119903119890119889119864119899119892119886119892119890119898119890119899119905 lt 0 rarr 119880119899119904119886119905119894119904119891119886119888119905119900119903119910 119903119890119897119886119905119894119900119899119904ℎ119894119901
The graphs below report for each group of stakeholders the proportion of regions
having scores equal bigger or lower than 0 in the difference between actual and
desired and actual and expected engagement
a) Research and Higher education ndash 1st Helix
Research organisations and higher education institutions are two of the main
stakeholders in the EDP for which the actual desired and expected engagement
emerged as the one of the highest in table 9 above
15
In graph 3 we notice that these stakeholders are well known in over 70 of the cases
the actual engagement matched the expected one Whilst the relationship with these
actors is often satisfactory (as reported by 714 and 745 of the regions for higher
education institutions and research organisations respectively) as shown in graph 4
approximately a quarter of respondents have found the relationship between universities
and research centres unsatisfactory (232 and 255 respectively) that is they
desired a higher engagement than the one actually experienced
b) Public Sector ndash 2nd Helix
Graphs 5 and 6 below reveal the patterns of relationship that the EDP organisers have
with public-sector stakeholders It emerges that whilst regional national and EC public
actors follow similar patterns local government has a somewhat different behaviour
Graph 5 Actual vs Expected engagement ndash 2nd
Helix
Notably in graph 5 a high majority of respondents revealed a good knowledge of
stakeholders of the public sector with the lowest proportion emerging for the EC
750667 690 632
104
48103
105
146286
207 263
Reg gov Loc gov Nat gov EC
Good Knowledge Underestimated interest
Overestimated interest
Graph 3 Actual vs Expected engagement ndash 1st
Helix
Graph 4 Actual vs Desired engagementndash 1st
Helix
714 745
54 00
232 255
High edu Research org
Satisfactory Intrusive Unsatisfactory
16
(632) and local government (667) Interestingly in the case of local government
there were fewer cases in which interest in the EDP was underestimated (48 as
compared to more than 10 for the other actors) whereas overestimation was most
common (286) This suggest a disengagement from the sub-regional level which is
confirmed in graph 6 where the relationship emerges as unsatisfactory in 523 of the
caseas as compared to 276 25 and 235 for National government the EC and
Regional government
c) Private Sector ndash 3rd Helix
As indicated in graph 7 in the case of the private sector the proportion of regions with a
good knowledge of and a satisfactory relationshop with stakeholders is in general lower
than in the case of research and higher education actors Only for clusters for more than
70 of respondents the actual engagement reflected the expected one
Graph 7 Actual vs Expected engagement ndash 3rd Helix
A satisfactory relationship one in which desired and actual enagement coincide emerges
most often with regional SMEs business associations clusters and incubators as shown
in graph 8 below The relationship emerges as unsatisfactory most often for foreign firms
434 472612
711
550414
588
208 151
12267
75207
118
358 377265 222
375 379294
Reg SMEs Reg L firms Buss Assoc Clusters Inc accbus parks
For Firms Nat firms
Good Knowledge Underestimated interest
Overestimated interest
Graph 6 Actual vs Desired engagement ndash 2nd
Helix
745
432
621 650
20
45
103 100
235
523
276 250
Reg gov Loc gov Nat gov EC
Satisfactory Intrusive Unsatisfactory
17
with facilities in the region (567) Interestingly more than 1 in 5 regions
underestimated the interest of local SMEs and foreign firms indicating that there is
scope for attempting to engage these actors further
Graph 8 Actual vs Desired engagement ndash 3rd Helix
d) Civil Society ndash 4th Helix
The graphs below refer to peripheral actors in the EDP which have infrequently been
invited or taken part to the process
Graph 9 Actual vs Expected engagement ndash 4th
Helix
Graph 10 Actual vs Desired engagement ndash 4th
Helix
Among the actors classified as part of the 4th helix we find that labour unions are the
ones that regions know best (68) and those where a satisfactory relationship is most
common (583) Civil society organisations are the least known (only in 333 of the
cases expected and actual engagement coincided) and the ones where an unsatisfactory
or intrusive relationship is most common and (83 of cases)The findings indicate that
much needs to be done to untap the potential of the 4-ple helix for innovation with
583 and 591 of regions finding the relationship with civil society organisations and
user-centered spaces unsatisfactory
500 481 529 553 525400 389
37 1959 43
00
33 111
463 500412 404
475567
500
Reg SMEs Reg L firms Buss Assoc Clusters Inc accbus parks
For Firms Nat firms
Satisfactory Intrusive Unsatisfactory
441
680500
176
40
45
382280
455
Civil society Labor unions User-centred spaces
Good Knowledge Underestimated interest
Overestimated interest
333
583409
83
42
00
583
375
591
Civil society Labor unions User-centred spaces
Satisfactory Intrusive Unsatisfactory
18
e) Other actors
Graph 11 and 12 below report information related to actors that have so far been
peripheral to the EDP namely media financial entities and risk capital
Graph 11 Actual vs Expected engagement ndash Other Graph 12 Actual vs Desired engagement ndash Other
The relationship with these actors is most often unsatisfactory as indicated on the right
hand graph with 80 889 and 593 of the regions not meeting their desires in
terms of engagement with media financial entities and risk capital respectively Media
and risk capital emerged as poorly known in graph 11 with approximately one third of
the regions displaying a good knowledge of this actor On the other hand nearly 56 of
the regions who engaged with financial entities gauged their expectations correctly
Despite the overall peripheral role of these actors some interesting dynamics emerge in
relation to Risk Capital with 182 of the regions engaging them finding them more
interested in the EDP process than expected
322 Stakeholdersrsquo engagement future desires
The graph below evaluates how the respondents would like the future engagement with
the different types of actors to be7
Whilst as shown in the previous sections of the report research actors are well known
and enjoy a good relationship with regional bodies in charge of RIS3 and whilst they
have been actively engaged throughout the process the survey highlights that more
engagement from their side is desired In the case of universities over 47 of
respondents would like them to be either somewhat more engaged (309) or
substantially more engaged (164) The pattern is similar for research organisations
where 377 of respondents would like them to be somewhat more engaged and 170
would like them to be substantially more engaged
Among the core EDP actors in the private sector it is interesting to notice that it is
regional SMEs and Regional firms where most often respondents are unsatisfied with
their past level of engagement and would like a significantly higher participation For
SMEs 15 regions (288) indicated that whereas for large firms 13 (25)Among public
actors it is interesting to notice a few cases in which local government national
government and the EC are welcome to be less engaged in the future (23 and 4
respondents respectively)
7 Only respondents who had invited a given stakeholders were asked to evaluate their future desired
engagement with the latter
333
556
364
67
00
182
600444 455
Media Financial ent Risk cap
Good Knowledge Underestimated interest
Overestimated interest
200111
333
83
800889
583
Media Financial ent Risk cap
Satisfactory Intrusive Unsatisfactory
19
Some interesting dynamics emerge in the 4-ple helix where user-centred facilities and
civil society feature as the second and fourth actor which in relative terms regions
would like to be somewhat more engaged (476 and 438 of regions which engaged
them in EDP for the design phase of RIS3 would like to have them participate more in the
implementation phase)
As for the remaining actors it is interesting to notice that experiences with Risk Capital
emerge as difficult with 6 out of the 12 regions that engaged them previously desiring a
lower engagement in the future As for financial entities 7 out of 10 would like them to
be more engaged In the case of media 9 out of 15 would like this actor to be somewhat
or significantly more engaged in the process
Graph 13 Future desired engagement in RIS3 implementation
33 EDP self-evaluation
To help assessing the impact of the EDP during the elaboration of the RIS3 the first part
of the survey asked participants to reflect on the effectiveness and overall experience of
the process When participants were asked if the process was effective in
identifying investment priorities for regional development 932 provided a positive
answer Likewise when asked to consider the EDP as a positive or negative experience
during the elaboration of RIS3 966 referred to the process as positive Interestingly
39 of the responses pointed out that the EDP had brought conflicts among stakeholders
(or between stakeholders and the public administration) during the elaboration of RIS3
Although the survey didnrsquot go in depth into the kind of conflicts it generated this feature
could led to further research in order to understand if the conflicts were due to lack of
understanding conflict of interests or other relevant criteria
The survey also allowed for some self-reflection on other outcomes of the EDP When
asked whether the EDP represented a novelty in the policy process 51 out of the 59
respondents indicated that this was the case Furthermore as the graph below shows
the EDP is considered a satisfactory process in its ability to
0
10
20
30
40
50
60
70
80
90
100
Substantially more engaged Somewhat more engaged
Equally engaged Less engaged than in the previous phase
20
Increase trust among stakeholders where nearly 80 of respondents are
either satisfied or very satisfied
Increase trust towards the public sector where just over 75 of
respondents reveal to be either satisfied or very satisfied
Engage stakeholders in regional development where again three quarters of
respondents are either satisfied or very satisfied
Improve public-policy decision making where again nearly 75 report being
satisfied or very satisfied
Graph 14 EDP self-evaluation
4 Conclusions and next steps
When the term Entrepreneurial Discovery Process (or EDP) was introduced it referred to
the identification of areas for investment in research and innovation (ie priority-areas)
through an inclusive and evidence-based process grounded in stakeholdersrsquo engagement
(Foray et al 2009) Six years later the experience of the S3 Platform has required a
conceptual reflection on the EDP itself and an empirical investigation on the role of
stakeholders within it Conceptually the EDP has evolved from being a process limited
to the identification of investment-priorities in the design-phase of a strategy into a
continuous activity Empirically whilst the EDP was always defined as a bottom-up
participatory process there was a significant gap in understanding how different actors
engaged in it
This report based on a survey on EDP-practices run within the S3 Platform has
addressed both issues Firstly it submits the concept of continuous EDP developed in
Perianez-Forte et al (2016) to an empirical test Secondly it looks in depth at the role of
different stakeholders in the EDP
The data confirms that the EDP has evolved from an activity conceived exclusively for
choosing investments priorities under the ERDF Thematic Objective 1 into a continuous
process permeating S3 implementation
34
203 237 237220
593593
475 475
203 169
288 271
Increase trust amongstakeholders
Increase trust towards thepublic sector
Engage stakeholders inreg development
Ability to improve policydecision making
Not satisfied Somewhat satisfied Satisfied Very satisfied
21
A continuous EDP implies that once investment priorities have been identified with the
involvement of stakeholders the EDP keeps going throughout the strategyrsquos
implementation stakeholders are kept engaged in different ways in the refinement of
the priority-areas the identification of instruments that implement them as well as the
RIS3 governance and monitoring mechanisms that should deliver the expected
competitive advantages in each area The data collected clearly indicates that this is
happening
The survey results indicate that the EDP -as bottom up process- has required and it is
still requiring adjustments to the governance system Regions have responded to the
EDP by finding ways to favour an in depth interaction and engagement with local actors
in the development of S3 priorities Our survey has also given insights on the
participation and role of stakeholders in the EDP as well as on the relationship
between the latter and the EDP organisers (ie how well the stakeholder is understood
and how satisfactory is the relationship)
In terms of participation the data indicates that the EDP is mainly a triple-helix business
The research private and public sectors are much more frequently involved than other
societal actors Furthermore research actors are generally well known by the EDP
organisers and their relationship is very often satisfactory A similar picture emerges with
public actors such as regional bodies national government and the EC Interestingly
whilst local government is an actor that is often well known by EDP organisers the
relationship is often unsatisfactory As for the private sector our survey suggests that
EDP organisers are better able to understand associations of businesses (ie clusters or
representative organisations business parks) than individual firms Furthermore the
relationship with the private sector is in general less satisfactory than with the research
and public actors As for the fourth-helix a peripheral actor in the EDP our data
indicates some untapped potential Regions which have engaged with civil society
revealed to have often underestimated their interest and would like to increase their
involvement in the future
In terms of stakeholdersrsquo role in the EDP during RIS3 implementation we see that
the research and business sector are indeed expected to take part to governance and
monitoring activities however their involvement in the continuous EDP is most frequent
related to calls management (ie commenting on pre-calls etc) This reflects the
importance of these actors as beneficiaries of RIS3 investment As for the public sector
and specifically regional and national governments and EC institutions their main role is
in supporting monitoring revealing a demand for guidance on this crucial aspect of RIS3
implementation
To conclude the survey reveals that the EDP has been a positive experience for regions
across different dimensions and stakeholdersrsquo engagement across the whole 4-ple helix
continues to be desired
In delivering a much clearer picture of EDP practices the survey has unavoidably raised
further questions In particular further investigation and policy support should
reveal what is behind a satisfactoryunsatisfactory relationship or a goodpoor
understanding of a given actor
clarify the institutional and stakeholdersrsquo characteristics that favour a good
interaction and a functioning EDP
identify the mechanisms through which stakeholdersrsquo engagement can be
sustained especially in activities like monitoring governance or the management
of calls
recognise and share policy instruments mechanisms andor structures and good
practices that are effective in supporting a continuous EDP
Future activities of the S3 Platform and the project Targeted Support to Lagging Regions
will take these results into account to address the most pressing demands related to
RIS3 implementation
22
References
European Union (2013) Regulation (EU) No 13032013 of the European Parliament and
of the Council of 17 December 2013 laying down common provisions on the
European Regional Development Fund the European Social Fund the Cohesion
Fund the European Agricultural Fund for Rural Development and the European
Maritime and Fisheries Fund and laying down general provisions on the European
Regional Development Fund the European Social Fund the Cohesion Fund and the
European Maritime and Fisheries Fund and repealing Council Regulation (EC) No
10832006 Brussels European Union
Foray D David P and Hall B (2009) lsquoSmart Specialisation ndash The Concept rsquo in
Knowledge Economists Policy Brief ndeg 9 June 2009
Foray D and Goenaga X (2013) The Goals of Smart Specialisationrsquo JRC Scientific and
Policy Reports n JRC82213 doi10279120158
Gianelle C Kyriakou D Cohen C and Przeor M (eds) (2016) Implementing Smart
Specialisation A Handbook Brussels European Commission EUR 28053 EN
doi10279153569
Gianelle C Guzzo F and Mieszkowski K (2017) Smart Specialisation at work Analysis
of the calls launched under ERDF Operational Programmes JRC Technical Reports
JRC106974
Perianez-Forte I Marinelli E Foray D (2016) The Entrepreneurial Discovery Process
(EDP) cyclefrom priority selection to strategy implementation in Gianelle C
Kyriakou D Cohen C and Przeor M (eds) Implementing Smart Specialisation A
Handbook Brussels European Commission EUR 28053 EN doi10279153569
Europe Direct is a service to help you find answers
to your questions about the European Union
Freephone number ()
00 800 6 7 8 9 10 11 () The information given is free as are most calls (though some operators phone boxes or hotels may
charge you)
More information on the European Union is available on the internet (httpeuropaeu)
HOW TO OBTAIN EU PUBLICATIONS
Free publications
bull one copy
via EU Bookshop (httpbookshopeuropaeu)
bull more than one copy or postersmaps
from the European Unionrsquos representations (httpeceuropaeurepresent_enhtm)from the delegations in non-EU countries (httpeeaseuropaeudelegationsindex_enhtm)by contacting the Europe Direct service (httpeuropaeueuropedirectindex_enhtm) orcalling 00 800 6 7 8 9 10 11 (freephone number from anywhere in the EU) ()
() The information given is free as are most calls (though some operators phone boxes or hotels may charge you)
Priced publications
bull via EU Bookshop (httpbookshopeuropaeu)
24 doi102760514714
ISBN 978-92-79-74377-1
KJ-N
A-2
8838-E
N-N
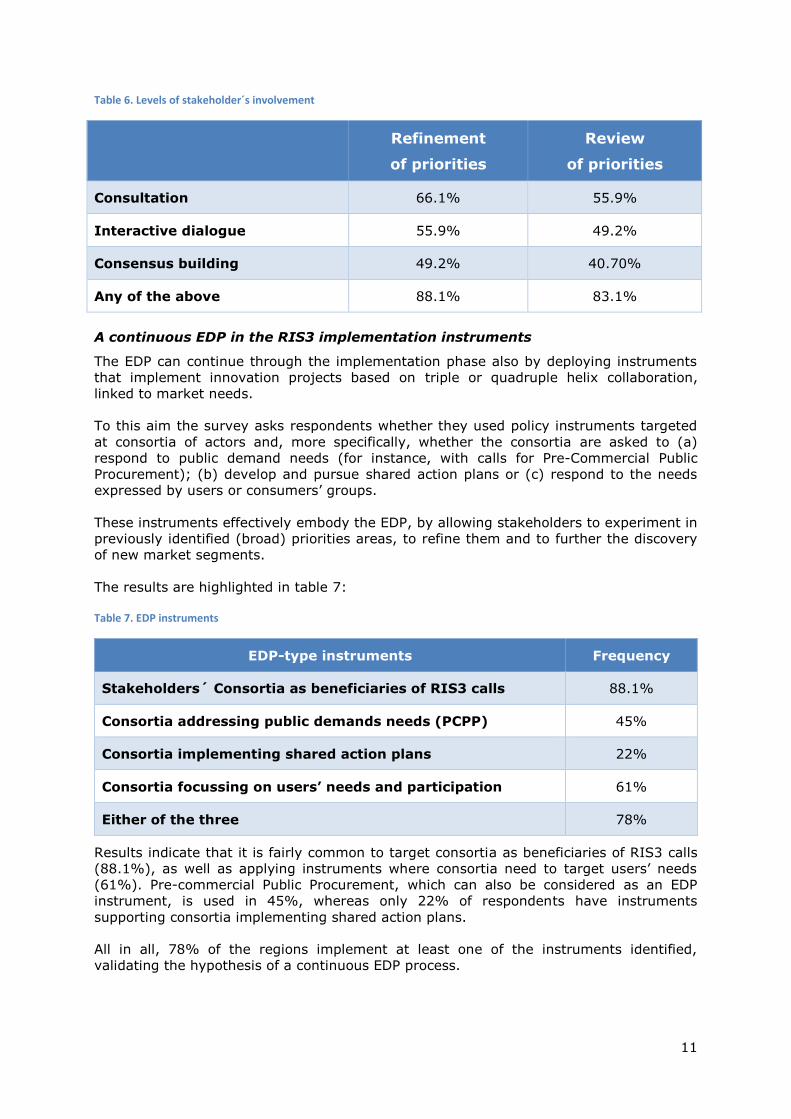
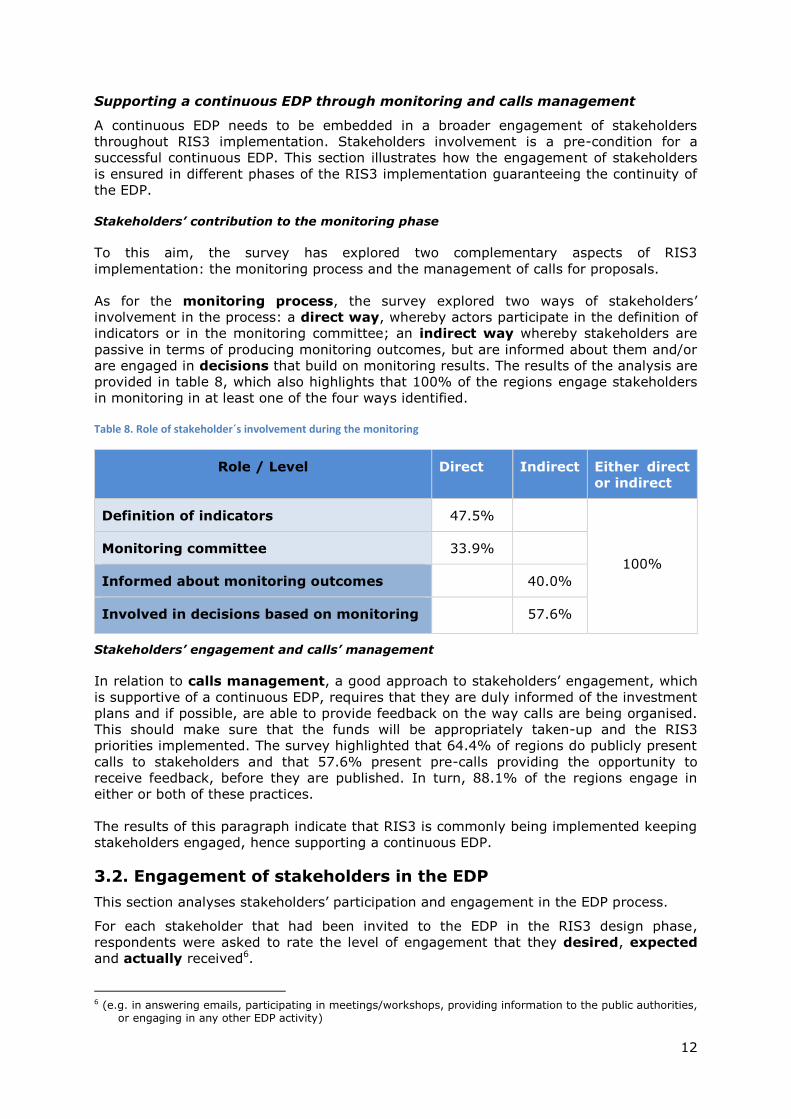
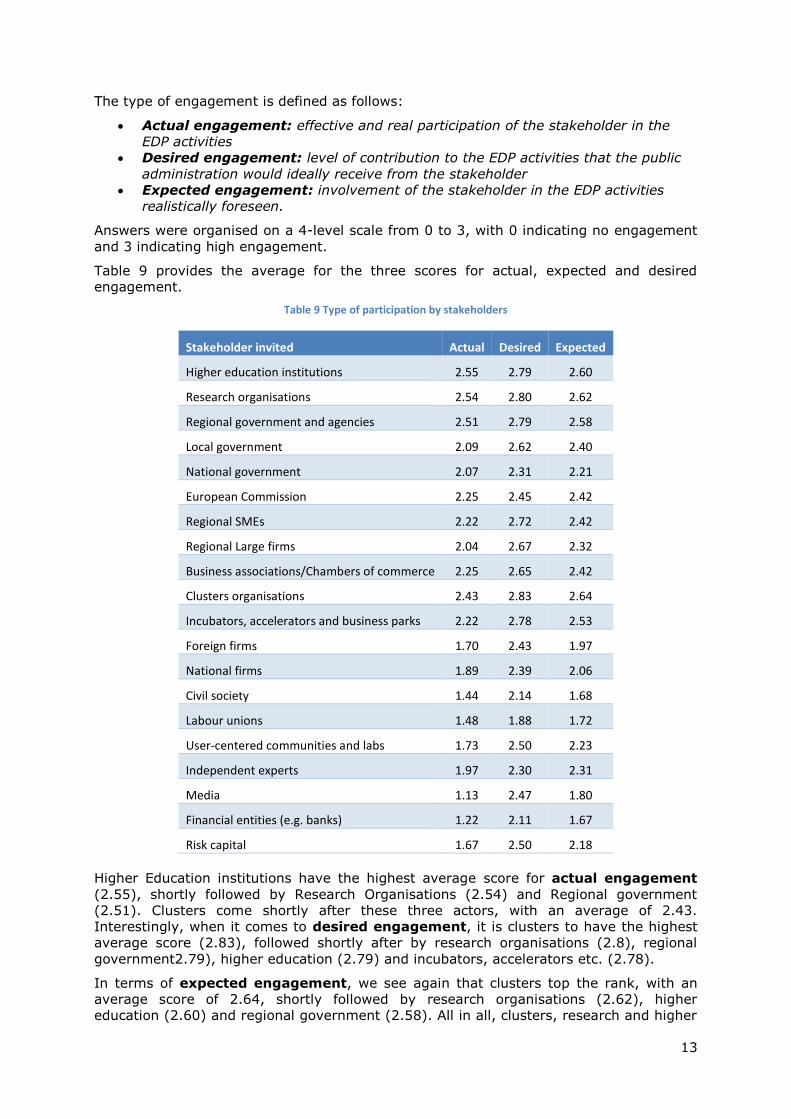
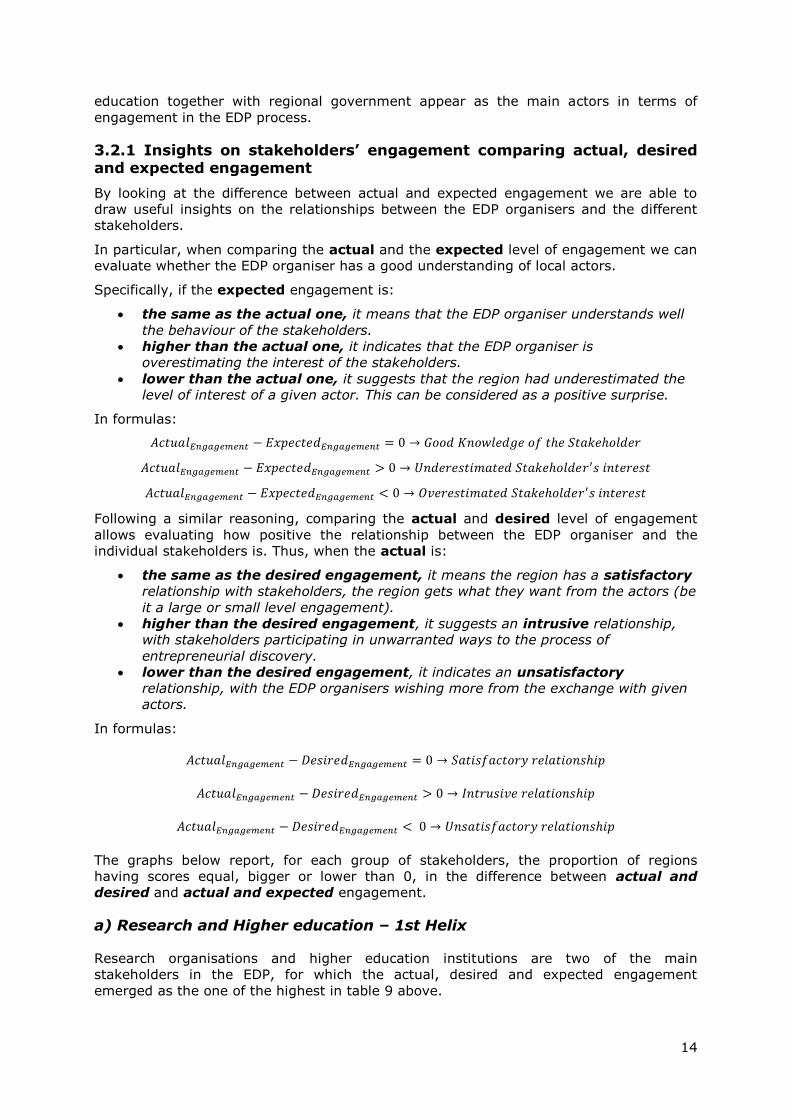
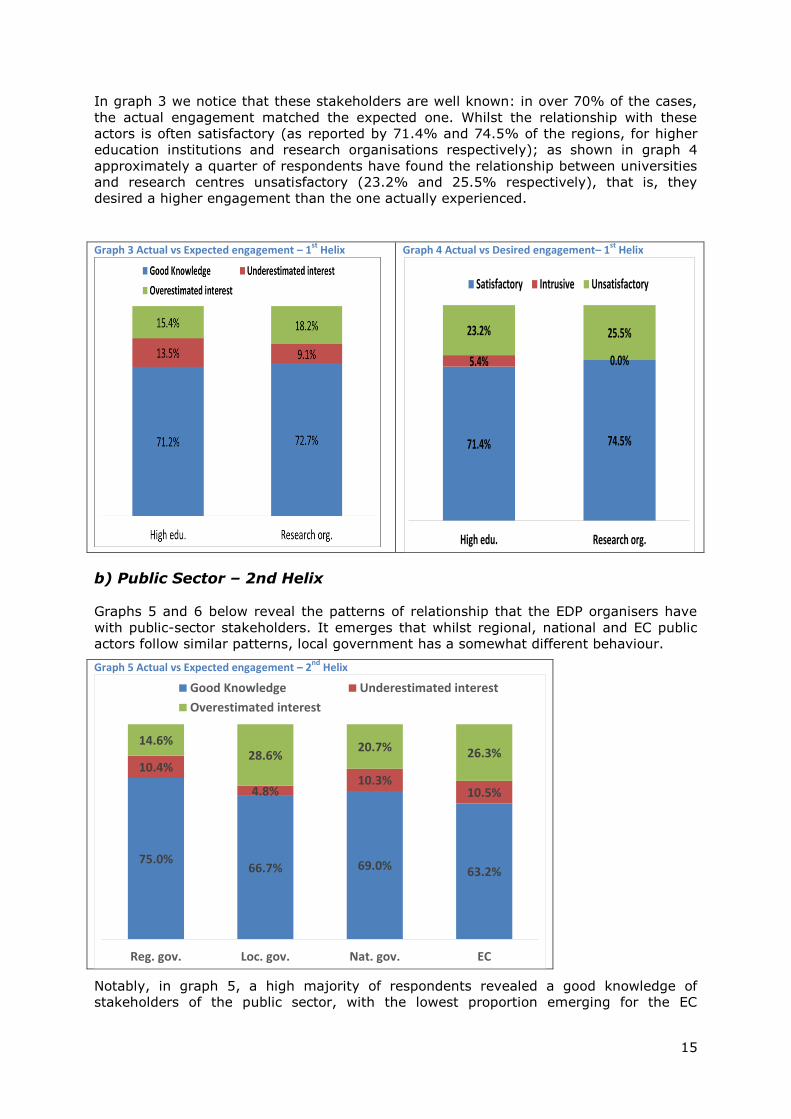
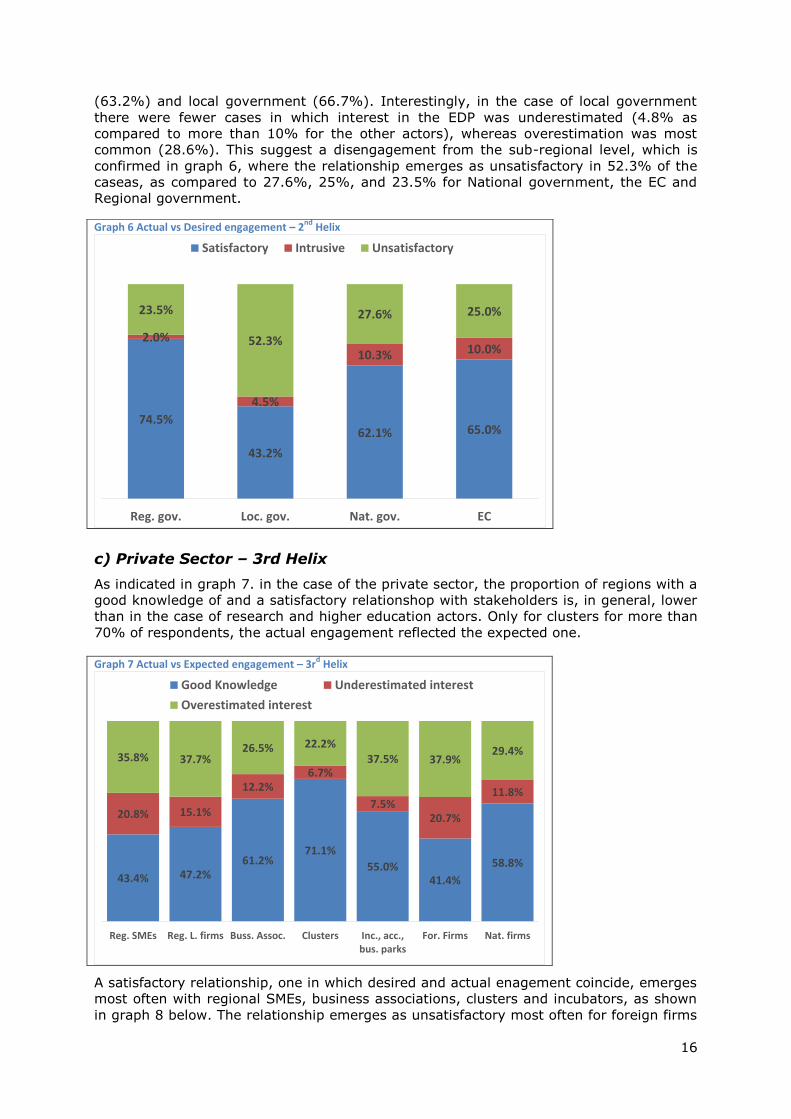
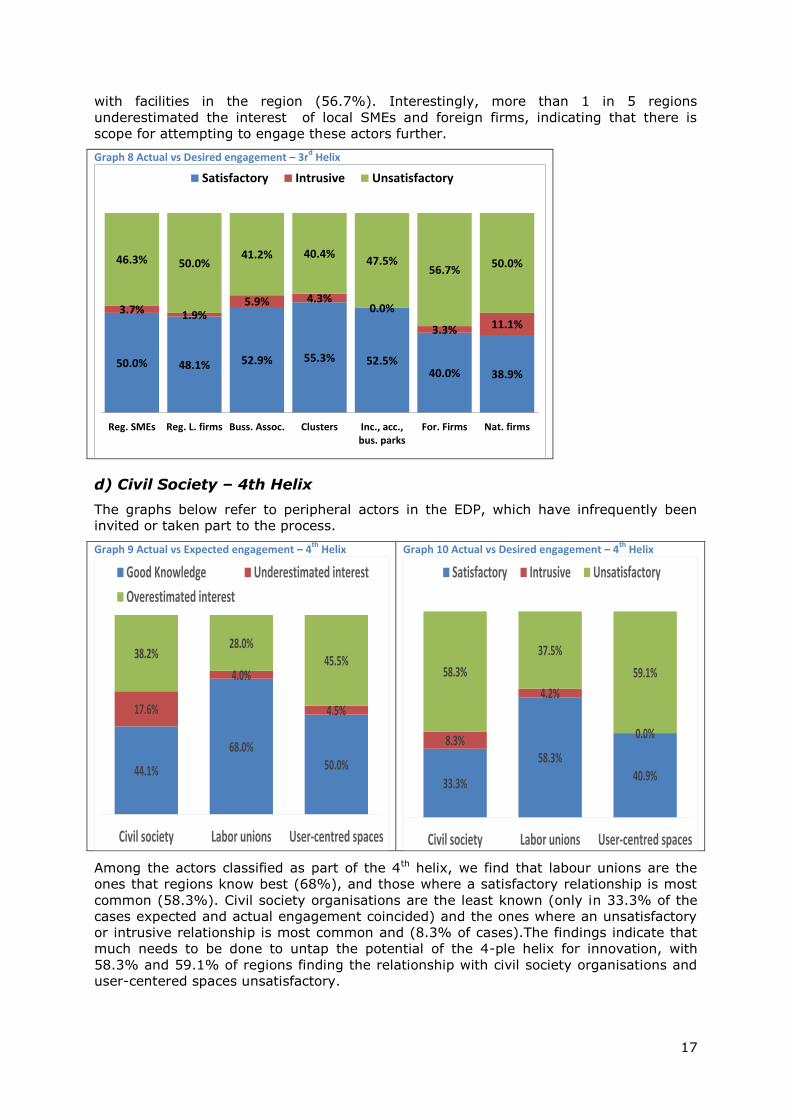
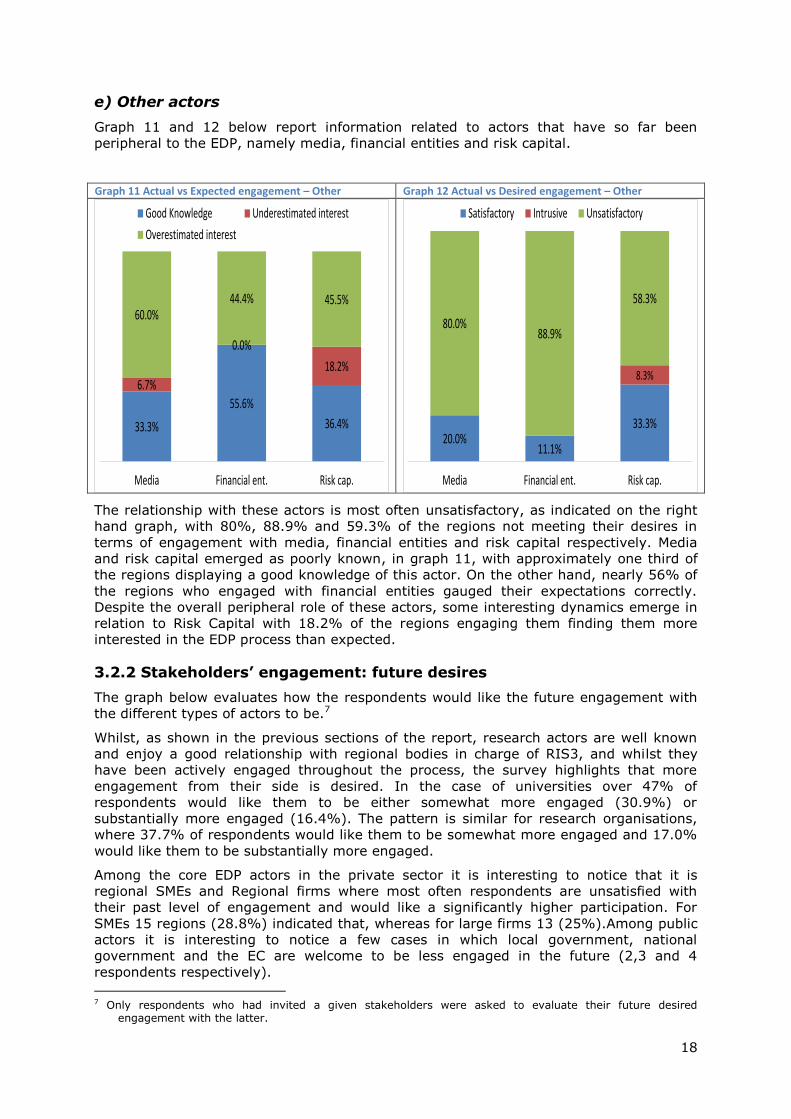
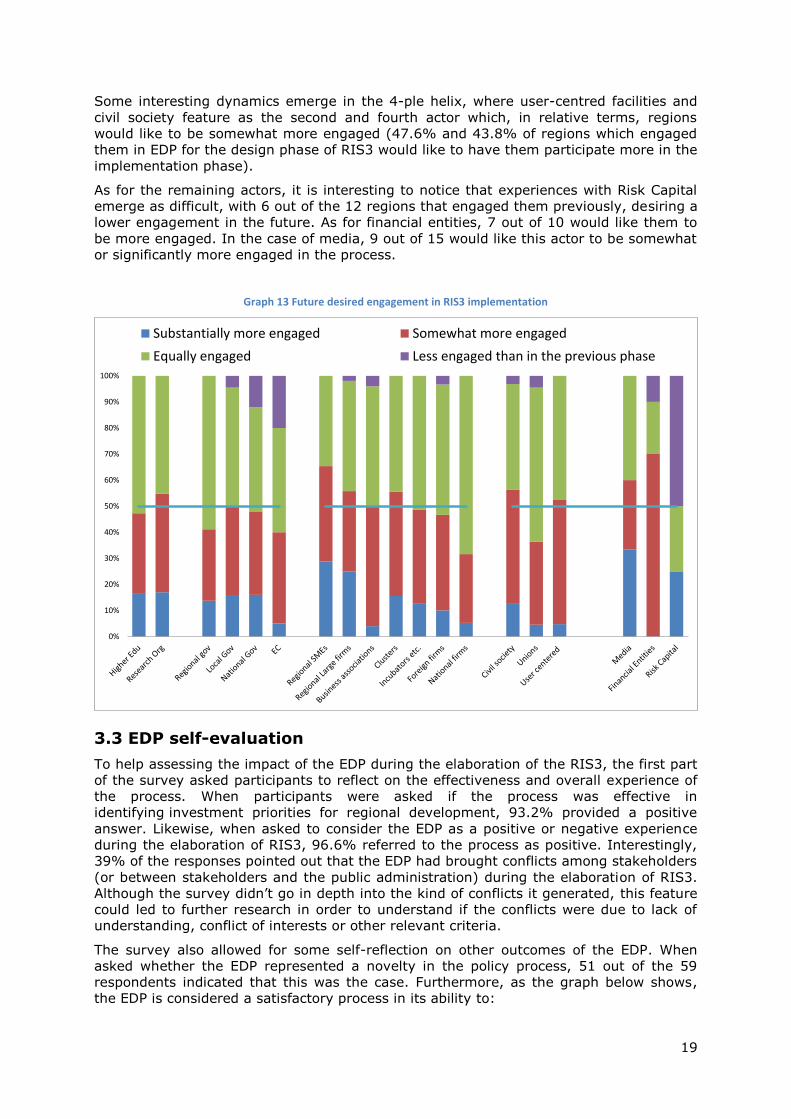
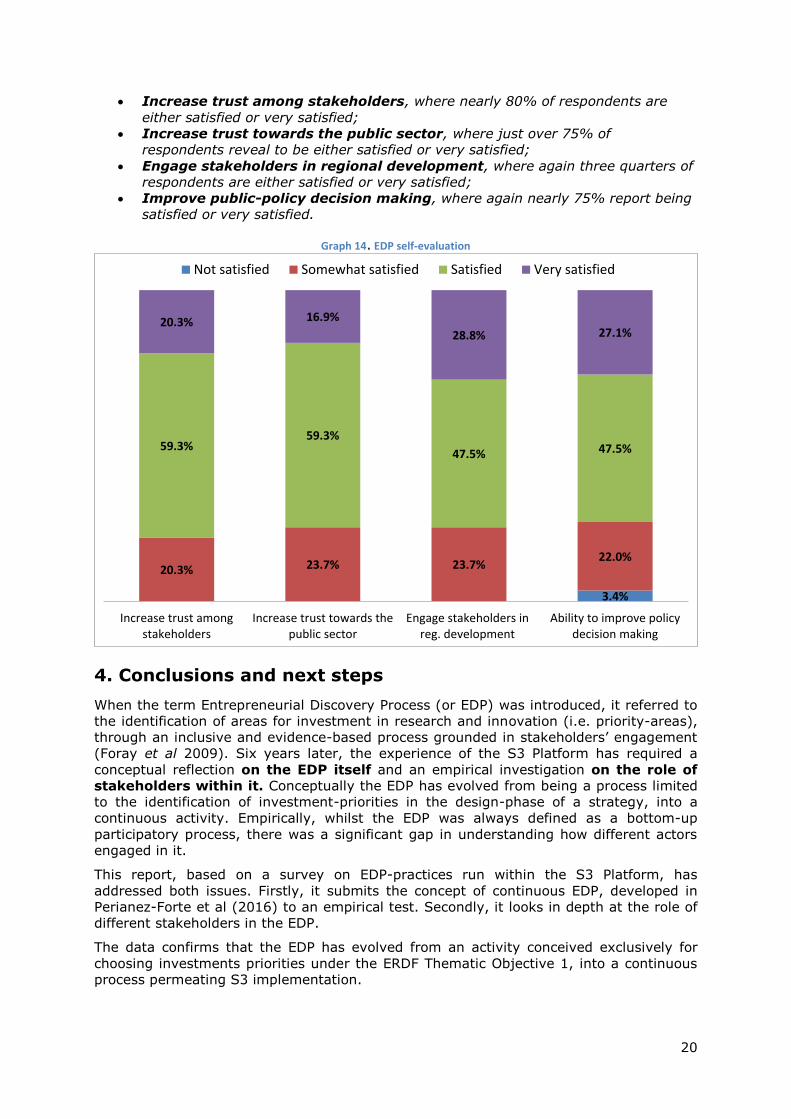
24 doi102760514714
ISBN 978-92-79-74377-1
KJ-N
A-2
8838-E
N-N