Smart Mobility Dublin City Council 03/12/16
11
Smart Mobility – Brendan O’Brien DCC
-
Upload
smart-dublin -
Category
Government & Nonprofit
-
view
305 -
download
3
Transcript of Smart Mobility Dublin City Council 03/12/16
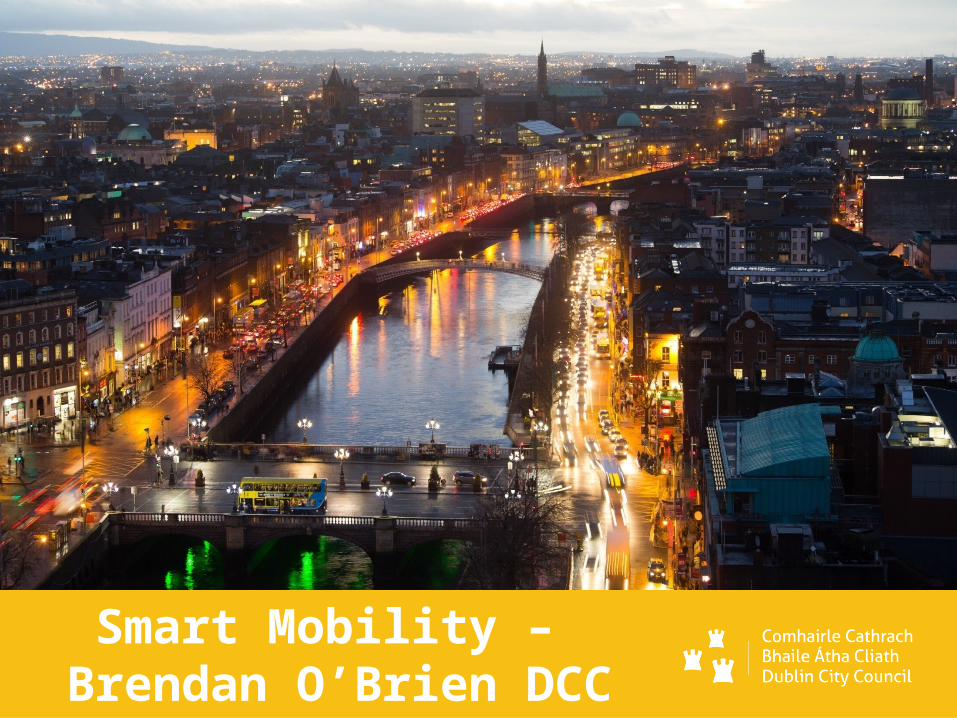
Smart Mobility – Brendan O’Brien DCC

Transportation Background • Historic City Centre core
• Population Greater Dublin Area >1.4m
• Central Business District 35% commute by private car
• Outer areas 70% - 80% commute by private car
• Policy decision in 1994 to not provide any more capacity for private cars within the CBD.
• Public Transport , Walking and cycling are priorities
• Maximise the use of Intelligent Transport System,

SCATS System Central to Dublin
Seven Other Local Authorities
DCC FMS
IBM Research Data Link
Imtech
At Present 754 sites throughout Dublin and other parts of Ireland.
v
DPTIM SCATS Centralised Bus Priority
vJourney Time Data
v

System Architecture Real time XML data
feed
Centralised Bus Priority System
Data Analysis – Virtual Detector Placement
MS-SQL ReportsTableau Dublin Bus Data

Content
QBC Performance Reports Bus Performance Report June 2014 – Segments of a Quality Bus
Corridor
Drill into segments using bus position data reveals pinch points

Unscheduled Stops Report Bus Performance Report September 2015 – Unscheduled Stops
Report
Mapping the bus position on approach to the Bus Stop data reveals pinch points
Time band Rank Stop Name Stop No.
Stops Trips % Average Stop time
Average Distance
Impact
16:00-19:00 1 Whitworth Road David Road (+) 00837 168 137 123 57 138 9587
16:00-19:00 2 Parnell Square Rotunda Hospital (+) 00007 62 143 43 87 197 5373
16:00-19:00 3 Westmoreland Street Fleet Street (+) 00319 60 77 78 73 79 4407
16:00-19:00 4 High Street St. Auden's Church (+) 02001 50 76 66 68 73 3385
16:00-19:00 5 Dorset St Eccles Place (+) 00014 45 139 32 72 52 3235
16:00-19:00 6 Mckee Avenue Finglas Village (-) 04938 28 69 41 88 -52 2463
16:00-19:00 7 Cardiffsbridge Rd Cappagh Road (+) 04583 34 71 48 72 36 2462
16:00-19:00 8 O'Connell St Henry Street (+) 00279 42 74 57 58 184 2449
Ranking on frequency to delays on approach to bus stop

Timing Plan – Multiple Junctions Week Time band Rank Stop Name Stop No. Stops Trips % Avg Stop time ImpactWeek 9 07:00-10:00 4 Mobhi Road (+) 147 104 116 90 76 7929Week 13 07:00-10:00 5 Mobhi Road (+) 147 63 115 55 62 3921
Before
After
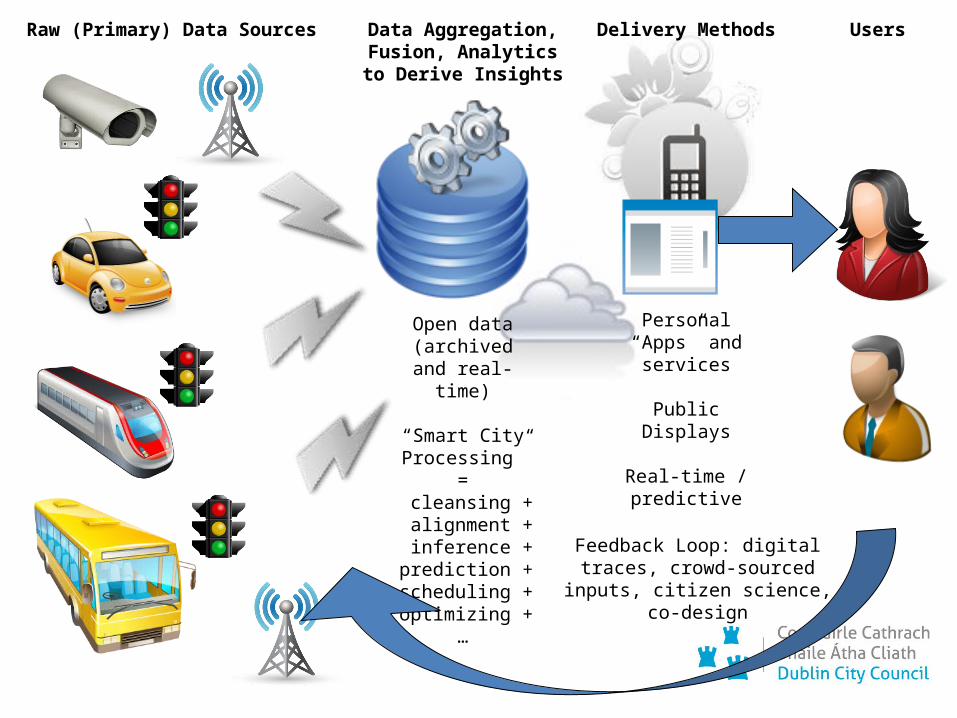
Raw (Primary) Data Sources Data Aggregation, Fusion, Analytics to
Derive Insights
Delivery Methods Users
Personal “Apps” and
services
Public Displays
Real-time / predictive
Open data (archived and
real-time)
“Smart City Processing” =
cleansing + alignment + inference + prediction +
scheduling + optimizing +
…
Feedback Loop: digital traces, crowd-sourced inputs, citizen
science, co-design

Veracity Velocity Value
H2020 VaVel

BE Good Project • Challenges are in the main how we can use Open Data and user input to a common platform.
• Emphasis is on dynamic and context sensitive data. So location, time and type of incident is geo referenced and rules are applied to determine if an legitimate event.
• All 5 + axle vehicles are banned in Dublin City and must use the Dublin Port Tunnel. 07:00- 19:00
• An electronic permit system is in place which cost 10 Euro per day, Police enforcement.
• Allow public to provide contextual information re HGVs in cordon area.
Challenges • Rate my bus stop. Use open data and user input to
determine what the level of service actually exists at any specific stop. Allow public to rate and show when service is not as expected.
• Dynamic origin and destination matrix for a city across all modes.
• Investigate how to use all open data sources and invite the citizen to participate BE a GOOD citizen and tell us where you go. Build up an OD matrix from this data,