SMART KPIs. Characteristics of good KPIs 1. Simple 2. Practical 3. Specific 4. Measurable 5....
38
SMART KPIs
-
Upload
evan-carpenter -
Category
Documents
-
view
233 -
download
0
Transcript of SMART KPIs. Characteristics of good KPIs 1. Simple 2. Practical 3. Specific 4. Measurable 5....

SMART KPIs

Characteristics of good KPIs
1. Simple2. Practical3. Specific4. Measurable5. Attainable6. Relevant7. Time-bounded8. Dynamic 2

“Simple” easily understandable and not sophisticated“Practical” easily workable and get to the point“Specific” ‘Reduce expense’ is definitely not specific KPIs should detail what expense specifically to be reduced, electric or traveling expense or….etc.“Measurable” From previous example KPIs must also be specified the target of the reduction, such as
reduce electric bills down10%.“Attainable” KPIs must be attainable and also challenging. If target is set too low or too high staff
may be de-motivated.“Relevant” KPIs must be relevant to Organization targets so everyone is heading to the same target
same direction“Time-Bounded” Indicate when the target should be reached so staff know how much time they have.“Dynamic” change overtime and benchmarking
3

Classification of KPIs
1. Efficiency / Effectiveness2. Common / Corporate / Functional3. Positive / Negative4. Balanced Scorecard 4.1 Lag indicator / Lead indicator 4.2 Financial Perspective / Customer Perspective/ Internal perspective / Learning Perspective / Growth Perspective5. Value Chain6. Strategic /Non-Strategic (Technical or Administrative)
4

FIRM INFRASTRUCTURE
HUMAN RESOURCE MANAGEMENT
TECHNOLOGY DEVELOPMENT
PROCUREMENT
INBOUNDLOGISTICS
OPERATIONSOUTBOUNDLOGISTICS
MAKETINGAND SALES
SERVICE
M
A
R
G
I
N
PRIMARY ACTIVITIES
The Generic Value ChainThe Generic Value Chain
Support activities
5
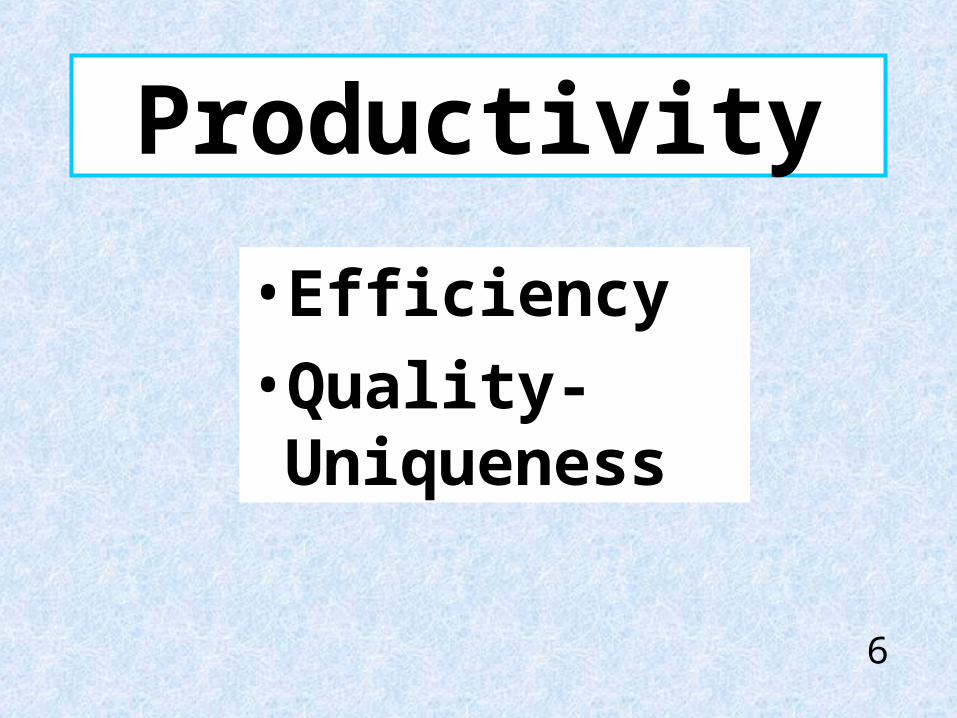
Productivity
• Efficiency
• Quality-Uniqueness
6

Strategic Positioning
Cost
Differentiation
7

Relationship
- KPI- Target- Benchmarking
8
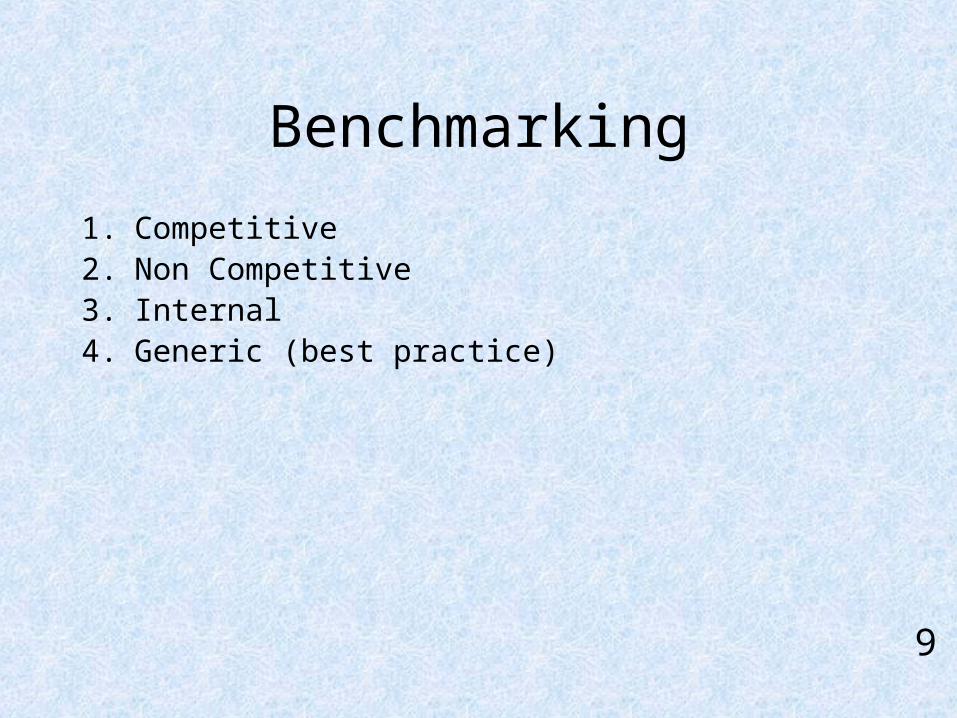
Benchmarking
1. Competitive2. Non Competitive3. Internal4. Generic (best practice)
9
Strategic Planning and KPIs
10

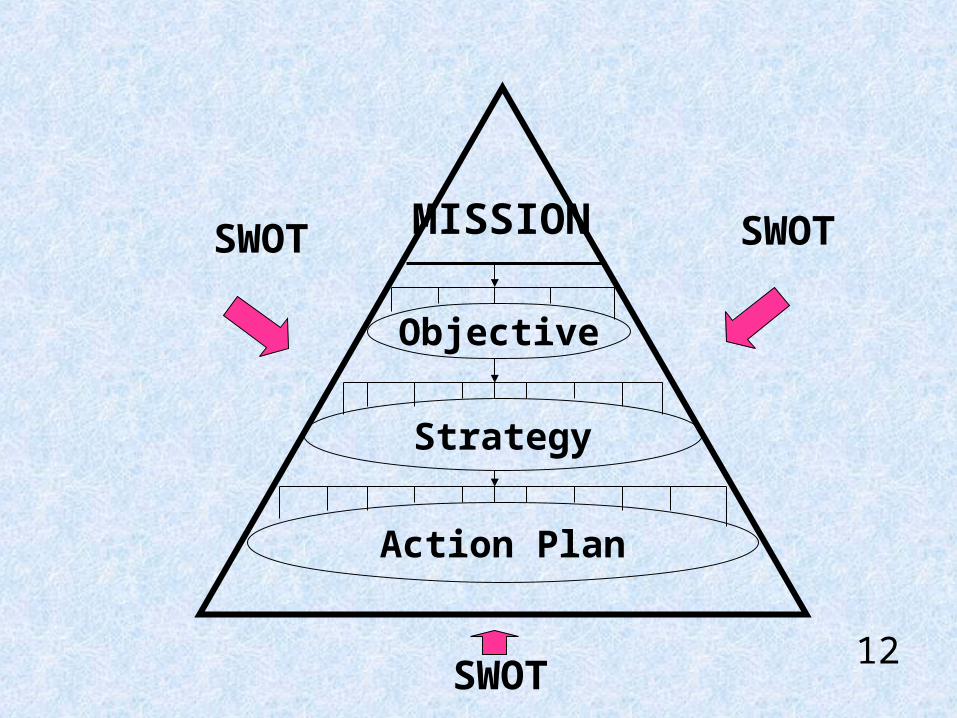
VISION
MISSION
Objective
SWOTSWOT
SWOT
Action Plan
Strategy
11
MISSION
Objective
SWOTSWOT
SWOT
Action Plan
Strategy
12

Cases in Vision and Mission
Case 1 : New Port News Shipbuilding’s Mission Statement
“ We shall build good ships here – at the profit if we can – at the loss if we must – but always good ships. ”
13

“ To improve the quality of home life by designing, building, marketing, and servicing
the best appliances in the world.”
Case 2 : Maytag Corporation’s Mission
14

Case 3 : Harley Davidson’s Vision and Mission
Vision “Harley Davidson,Inc. is an action-oriented,internationalcompany, a leader in its commitment to continuously improveour mutually beneficial relationships with stakeholders [ customers, suppliers,employees, shareholders, governmentsand society ]
We believe the key to success is to balance stakeholders’interests through the empowerment of all employees to focus on value-added activities.”
15

Case 4 : วิ�สั�ยทั�ศน์และพั�น์ธกิ�จของปตทั.
VISION The leading petroleum exploration and production company with operational excellence, international best practices, and world-class competitive strengths
MISSIONTo conduct our core business by operating and investing in petroleum exploration, development, production, and strategic related business in Thailand and overseas
16

Case 5 :Starbucks’ Mission Statement
“ Establish Starbucks as the premier purveyor of the finest coffee in the world while maintaining our uncompromising principle while we grow ”
Six Guiding Principles :
1. Provide a great work environment and treat each other with respect and dignity
2. Embrace diversity as an essential component in the way we do business.
17
Case 6 : Vermont Teddy Bear’s Mission Statement
“The Vermont Teddy Bear provides our customers with a tangible expression of their best feelings for their
family, friends, and associates. We facilitate, communicate,and therefore participate in caring events
and special occasion that celebrate and enrich our customers’ life experience.
Our products will represent unmatchable craftsmanship balanced with optimal quality and value.
We will strive to wholesomely entertain our guests while consistently exceeding our external and internal
customer service expectations. 18

Harley Davidson
“ More Than A Motorcycle ”
“ Fulfilling Dreams ”
Vermont Teddy Bear
“ A Lifetime Emotional Symbol of Love and Care”
Starbuck
“ Third Home ”
Carnival
“ Funship”19
Maytag Company
1. Mission
- Developed in 1989 for the Maytag Company : “ To provide our customers with products of unsurpassed performance that last longer,need fever repairs , and are produced at the lowest possible cost.”
- Updated in 1991 : “Our collective mission is world class quality.” Expands Maytag’s belief in product quality to all aspects of operations. 20

2. Objectives
-“To be profitability leader in industry for every product line Maytag’s manufactures.” Selected profitability rather than market share.
-“To be number one in total customer satisfaction.”
-“To grow the North American appliance business and become the third largest appliance manufacturer (in unit sales) in North America.”
21

-To increase profitable market share growth in North American appliance and floor care business, 6.5% return on sales, 10% return on assets, 20% return on equity, beat competition in satisfying customers, dealer, builder and endorser, move into third place in totals units shipped per year.
22

3. Strategies
- Global growth through acquisition and alliance with Bosch Siemens.
- Differentiate brand names for competitiveadvantage.
- Create synergy between companies, productimprovement, investment in plant and equipment.
23
24
4. Policies
- Cost reduction is secondary to high quality.
- Promotion from within.
- Slow, but sure R&D: Maytag slow to respond to
changes in market
Case in KPI
25
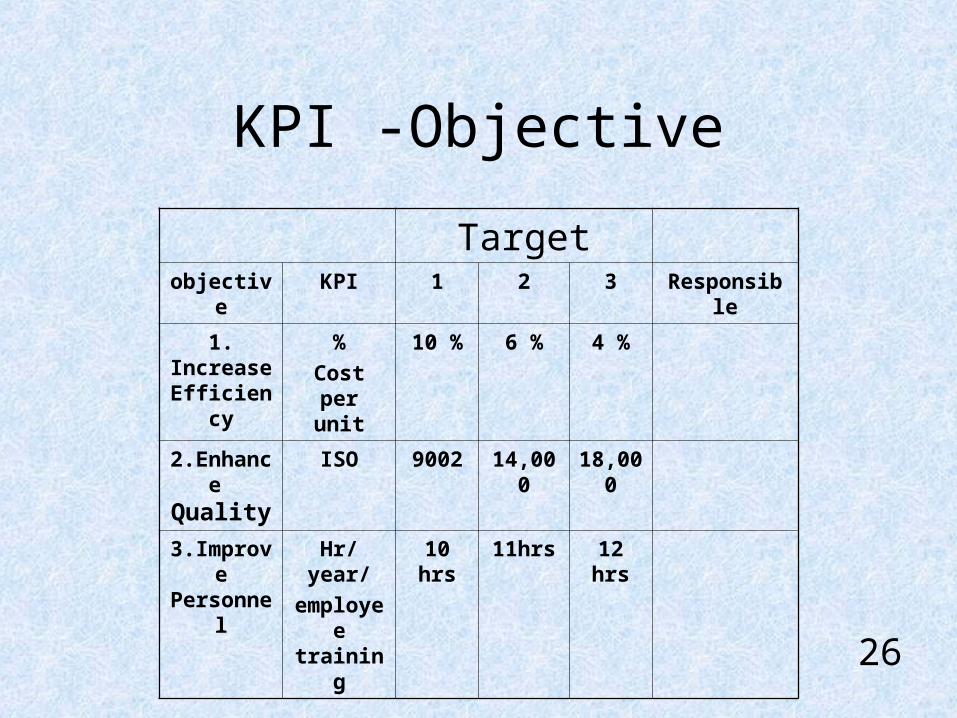
Targetobjective KPI 1 2 3 Responsible
1. Increase Efficiency
%
Cost per unit
10 % 6 % 4 %
2.Enhance Quality
ISO 9002 14,000 18,000
3.Improve Personnel
Hr/year/
employee training
10 hrs 11hrs 12 hrs
KPI -Objective
26

KPI – Strategy
Objective : Increase Efficiency
Target
Strategy KPI 1 2 3 Responsible
1. Production
Efficiency
% waste 0 % 0 % 0 %
2.Inventory Management
Efficiency
Inventory Turnover
6 days 5 days 5 days
3.Purchasing % per unit decrease
10 % 8 % 6 %
27

KPI – Strategy Objective : Enhance Quality
Target
Strategy KPI 1 2 3 Responsible
1. Hiring Consultant
Timing Within Jan
Within Jan
Within Jan
2.Training Duration Feb-Jun Feb-Jun Feb-Jun
3.Implementing Duration July-Dec July-Dec July-Dec
28
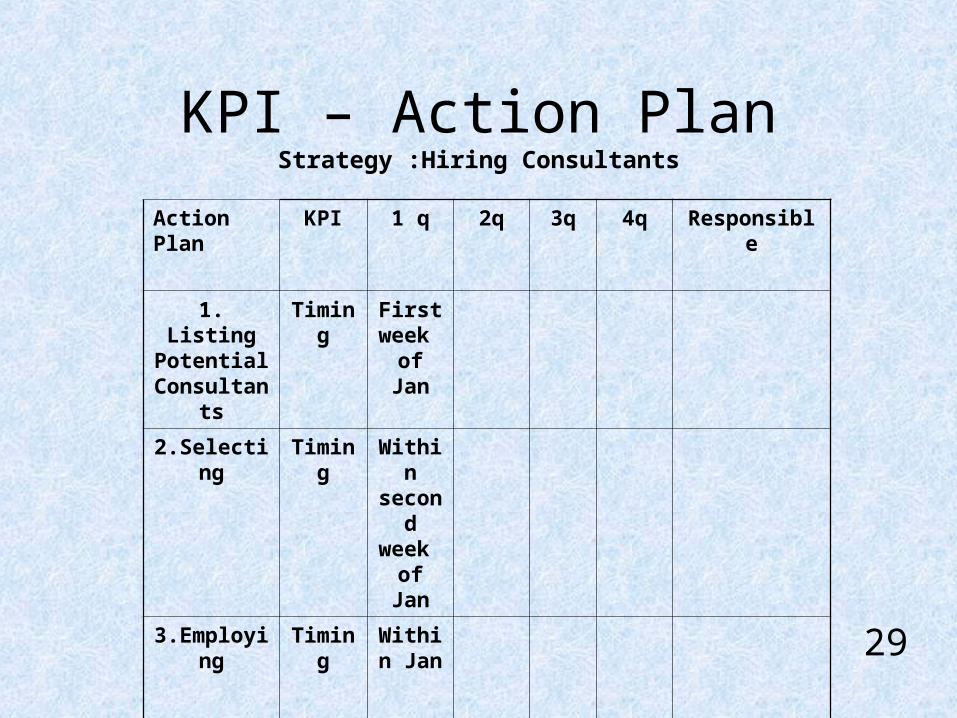
KPI – Action PlanStrategy :Hiring Consultants
Action Plan KPI 1 q 2q 3q 4q Responsible
1. Listing Potential
Consultants
Timing First week of Jan
2.Selecting Timing Within second week of Jan
3.Employing Timing Within Jan
29

KPI and Balanced Scorecard
30
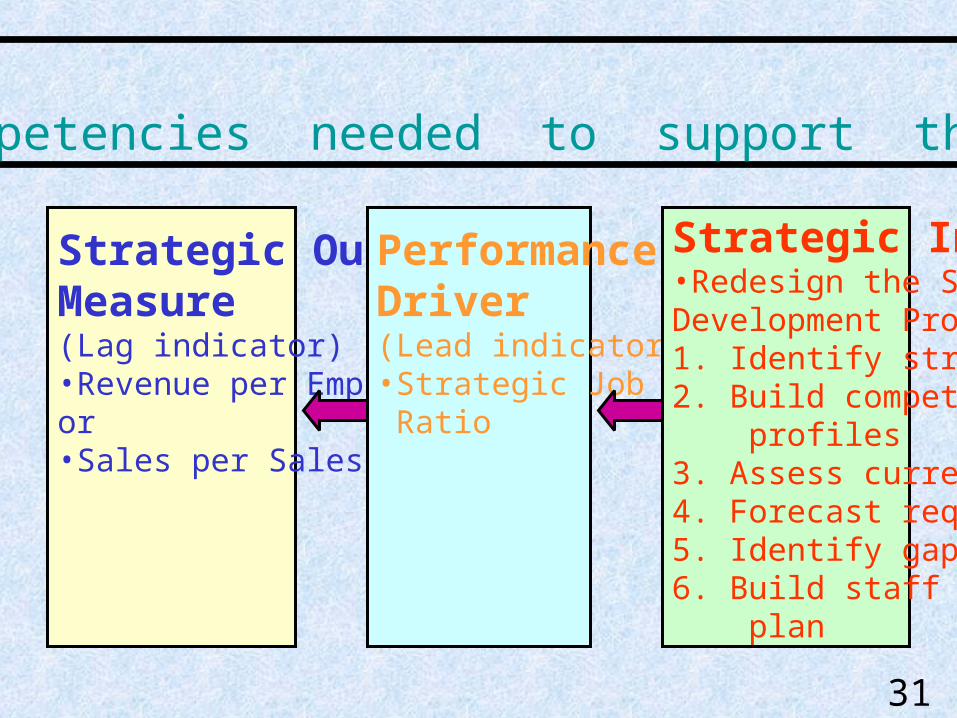
Strategic Objective :“Develop the competencies needed to support the sales process”
Strategic OutcomeMeasure(Lag indicator)•Revenue per Employeeor•Sales per Salesperson
Performance Driver(Lead indicator)•Strategic Job Coverage Ratio
Strategic Initiative•Redesign the Staff Development Process1. Identify strategic jobs2. Build competency profiles3. Assess current staff4. Forecast requirements5. Identify gap6. Build staff development plan
31

Strategic Measurements Strategic Objectives (Lag Indicators) (Lead Indicators)
Financial F1 – Improve Returns F2 – Broaden Revenue Mix F3 – Reduce Cost Structure
Return-on-Investment Revenue Growth Deposit Service Cost Change
Revenue Mix
Customer C1 – Increase Customer Satisfaction With Our Products and People C2 – Increase Satisfaction “After the Sale”
Share of Segment Customer Retention
Depth of Relationship Satisfaction Survey
Internal I1 – Understand Our Customers I2 – Create Innovation Products I3 – Cross-Sell Products I4 – Shift Customers to Cost – Effective Channels I5 – Minimize Operational Problems I6 – Responsive Service
New Product Revenue Cross-Sell Ratio Channel Mix Change Service Error Rate Request Fulfillment Time
Product Development Cycle Hours with Customers
Learning L1 – Develop Strategic Skills L2 – Provide Strategic Information L3 – Align Personal Goals
Employee Satisfaction Revenue per Employee
Strategic Job Coverage Ratio Strategic Information Availability Ratio Personal Goals Alignment (%)
32

Revenue Growth and MixCost Reduction/Productivity
Improvement Asset Utilization
Sales growth rate by segmentPercentage revenue from newproduct, services, and customers
Revenue/Employee Investment (percentageof sales)R&D (percentage ofsales)
Share of targeted customers andaccountsCross-sellingPercentage revemues from newapplicationsCustomer and product lineprofitability
Cost versus competitors’Cost reduction ratesIndirect expenses(percentage of sales)
Working capital ratios(cash-to-cash cycle)ROCE by key assetcategoriesAsset utilization rates
Customer and product lineprofitabilityPercentage unprofitable customers
Unit costs ( per unit of output,per transaction)
PaybackThroughput
Strategic ThemesG
r ow
thS
usta
inH
arv
est
Bu
sin
ess
Un
it
Str
ate
gy
Financial Perspective
33
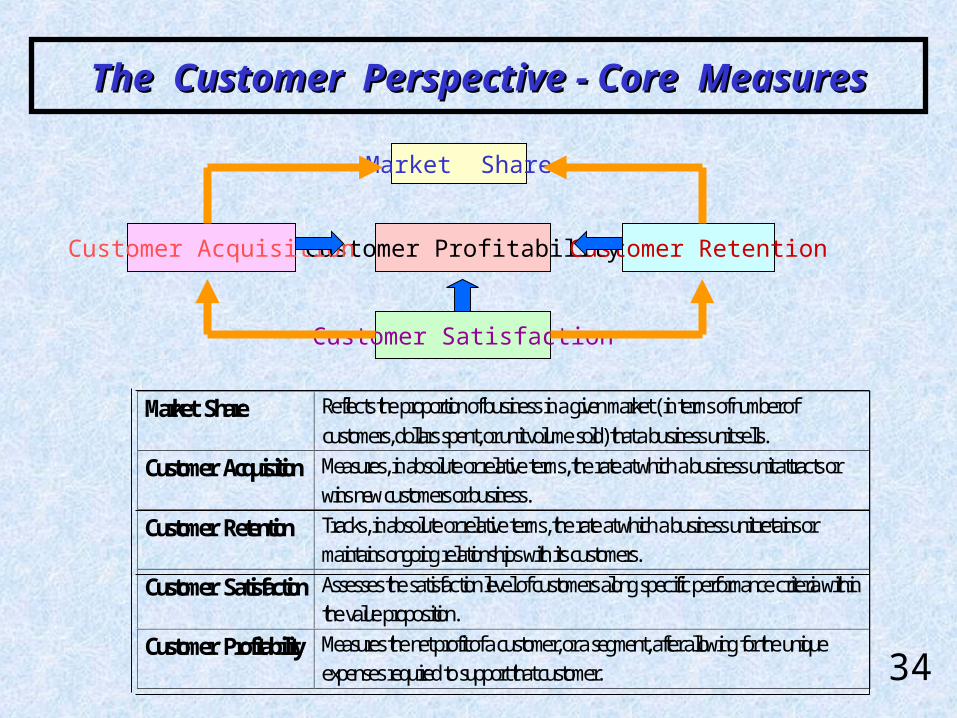
The Customer Perspective - Core MeasuresThe Customer Perspective - Core Measures
Market Share
Customer Profitability
Customer Satisfaction
Customer Acquisition Customer Retention
Market Share Reflects the proportion of business in a given market ( in terms of number ofcustomers, dollars spent, or unit volume sold) that a business unit sells.
Customer Acquisition Measures, in absolute or relative terms, the rate at which a business unit attracts orwins new customers or business.
Customer Retention Tracks, in absolute or relative terms, the rate at which a business unit retains ormaintains ongoing relationships with its customers.
Customer Satisfaction Assesses the satisfaction level of customers along specific performance criteria withinthe value proposition.
Customer Profitability Measures the net profit of a customer, or a segment, after allowing for the uniqueexpenses required to support that customer. 34

The Customer Value PropositionThe Customer Value Proposition
ResponsivePersonalAdvisor
ConvenientKnowledgeableSeamlessServices
ErrorFree
Breadth ofOffering
ValueProduct/Service Attributes
PriceFunctionalityQuality
Image Relationship
Time
Generic Model= + +
Example : Retail Banking Value Proposition
Product / Service AttributesImage Relationship
Strategic Measures* Service * Request Failure Fulfillment
Index Time35

The Customer Value The Customer Value Proposition (Tier I) - Proposition (Tier I) -
RockwaterRockwater
RelationshipProfessionalManagement
TimelinessQualityFunctionality Price
Product / Service Attributes Image Relationship
* Safety * Minimum * Hours * Meeting Schedule * Honesty and Openness Revision of Worked of Contractor * Engineering Submitted * Timely Submission Service Procedures * Value for of Procedures * Flexibility * Quality and Money
Awareness of * Contractual Performance * Innovativeness
Responsiveness * Standard of to Reduce Cost Equipment * Team
Rapport/ Provided Spirit * Quality of Personnel * Production Quality
36

The Internal - Business - The Internal - Business - Process Perspective - Process Perspective -
The Generic Value Chain ModelThe Generic Value Chain Model
CustomerNeed
Identified
CustomerNeed
Satisfied
Identified the
Market
Create the Product/Service
Offering
Build the Products/
Services
Innovation Process
Deliver the Products/
Services
Service the
Customer
Operations Process
Postsale ServiceProcess
The Internal - The Internal - BusinessBusiness - Process - Process Perspective - Perspective -
The Innovation ProcessThe Innovation ProcessCustomer
NeedIdentified
Identified the
Market
Create the Product/Service
Offering
Innovation Process
Build the Products/
Services
Deliver the Products/
Services
Operations ProcessPostsale Service
Process Customer
NeedSatisfied
Service the
Customer
37

The Learning and Growth Measurement FrameworkThe Learning and Growth Measurement Framework
Results
Employee Satisfaction
Climate for ActionTechnology
InfrastructureStaff Competencies
Employee Retention Employee Productivity
Enablers
Core Measurements
38