SMART CONCRETE BRIDGE GIRDERS USING SHAPE … · · 2016-03-11SMART CONCRETE BRIDGE GIRDERS USING...
58
SMART CONCRETE BRIDGE GIRDERS USING SHAPE MEMORY ALLOYS Morgan State University The Pennsylvania State University University of Maryland University of Virginia Virginia Polytechnic Institute & State University West Virginia University The Pennsylvania State University The Thomas D. Larson Pennsylvania Transportation Institute Transportation Research Building University Park, PA 16802-4710 Phone: 814-865-1891 Fax: 814-863-3707 www.mautc.psu.edu
Transcript of SMART CONCRETE BRIDGE GIRDERS USING SHAPE … · · 2016-03-11SMART CONCRETE BRIDGE GIRDERS USING...

SMART CONCRETE BRIDGE GIRDERS
USING SHAPE MEMORY ALLOYS
Morgan State University The Pennsylvania State University
University of Maryland University of Virginia
Virginia Polytechnic Institute & State University West Virginia University
The Pennsylvania State University The Thomas D. Larson Pennsylvania Transportation Institute
Transportation Research Building University Park, PA 16802-4710 Phone: 814-865-1891 Fax: 814-863-3707
www.mautc.psu.edu

FINAL REPORT
SMART CONCRETE BRIDGE GIRDERS USING SHAPE MEMORY ALLOYS
Osman E. Ozbulut, Ph.D. Assistant Professor University of Virginia
Reginald F. Hamilton, Ph.D. Assistant Professor
Pennsylvania State University
August 15, 2015

1
DISCLAIMER
The contents of this report reflect the views of the authors, who are responsible for the facts and the accuracy of the information presented herein. This document is disseminated under the sponsorship of the U.S. Department of Transportation’s University Transportation Centers Program, in the interest of information exchange. The U.S. Government assumes no liability for the contents or use thereof.

2
TABLE OF CONTENTS
DISCLAIMER................................................................................................................... 1 TABLE OF CONTENTS ................................................................................................. 2 LIST OF FIGURES .......................................................................................................... 3 LIST OF TABLES ............................................................................................................ 5 ABSTRACT ....................................................................................................................... 6 INTRODUCTION............................................................................................................. 7 RESEARCH APPROACH ............................................................................................... 8 SHAPE MEMORY ALLOY MATERIALS CHARACTERIZATION..................... 10 GROUT CHARACTERIZATION ................................................................................ 36 PULL-OUT TESTS ........................................................................................................ 40 DISCUSSION OF RESULTS ........................................................................................ 42 CONCLUSIONS AND RECOMMENDATIONS ........................................................ 47 REFERENCES ................................................................................................................ 50

3
LIST OF FIGURES Figure 1. Self-post-tensioning process. ........................................................................................ 9 Figure 2. Phase transformation temperatures of SMAs. .............................................................. 10 Figure 3. Strain-temperature response of as-processed Ni47.7Ti43.5Nb8.8 (at%) material at constant
stresses of 150 and 300 MPa. A Ni49.4Ti50.2 (at%) result loaded to 120 MPa is included for comparison. ........................................................................................................................... 11
Figure 4. SEM images of the cast showing (a) an overview of the cellular arrangement, (b) the matrix encompassed by the eutectic in the region within the box in (a), and (c) is a 3D AFM image showing the varying surface topology. ....................................................................... 14
Figure 5. SEM images showing (a) the deformation-processed microstructure with the Nb-rich particles oriented in the rolling direction, (b) a 3D AFM image of the smooth surface and (c) the cross-sectional view which is perpendicular to (a). ......................................................... 14
Figure 6. High-magnification SEM images showing the Nb-rich particles in (a) cast and (b) deformation-processed microstructures. ................................................................................ 14
Figure 7. Normalized heat flow vs temperature curves (i.e. thermo-grams) ................................ 15 Figure 8. Strain-temperature responses for thermal cycling under constant stress for (a) the cast
alloy and (b) the deformation-processed alloy. The single and double arrows depict the slopes during cooling and heating respectively. The symbols are defined within the text. .. 16
Figure 9. Characteristics parameters (a) forward ∆TF and reverse ∆TR transformation temperature intervals and (b) thermal hysteresis ∆TH and recovery ratio for different levels of bias stress in Figure 8. ............................................................................................................................ 17
Figure 10. Scanning electron micrographs showing white Nb-rich particles in an as-cast microstructure of Ni47.3Ti44.1Nb8.6(at%) material in (a) at 500 X magnification and (b) at 5000X magnification. (c) The microstructure of the as-processed material Ni47.7Ti43.5Nb8.8
(at%), investigated in this work, shown in the rolling direction at 500X magnification and (d) at 5000X magnification. (e) The cross-section view of the rolled strip material at 10000X magnification. In the text, (d) and (e) are contrasted with the solution annealed microstructure in Figure 11. .................................................................................................. 22
Figure 11: SEM micrographs showing the white Nb-rich particles of the annealed material (900 °C for 1hr) in the (a) rolling direction at 5000X and (b) cross-section at 10000X. These images are compared to the as-processed microstructure in Figure 10 (d) and (e). .............. 22
Figure 12: Region of interest covering the speckle pattern on the specimen surface. The ROI dimensions used in the DIC analysis are included. The dashed ovals at the top and bottom mark that the ROI extends into the specimen grip section. Consequently, those regions remain unchanged during deformation in Figures 13-15. ..................................................... 23
Figure 13. (a) The stress-strain response of as-processed material deformed at RT up to 8% average target strain and unloaded. (b) The strain-temperature response after unloading and during heating at null load. DIC strain contours are inset at selected points. The strain in the deformation fields is measured in the loading direction. In part (b), the scale has been adjusted to highlight the changes in strain contours during heating. ..................................... 25
Figure 14: (a) The stress-strain response at 60 °C, the material is deformed to 8% average strain and unloaded. (b) After unloading, the strain-temperature response during heating at null load. Inset images of strain contours are shown along selected points on both curves. The strain is in the loading direction. In part (b), the scale has been adjusted to highlight the changes in strain contours during heating. ............................................................................ 26
Figure 15. The stress-strain response when annealed material is deformed at RT along with accompanying DIC strain fields at selected points. The strain in the deformation fields is calculated in the loading direction. ........................................................................................ 27

4
Figure 16. SEM images showing (a) the microstructure and (b) the micro-constituents in a cast Ni47.3Ti44.1Nb8.6 (at%) alloy and the microstructures of (c) the Ni47.7Ti43.5Nb8.8 (at%) alloy sheet (d) theNi44.6Ti42.8Nb12.6 (at%) alloy rod materials. ........................................................ 30
Figure 17. The tensile stress-strain response of the NiTiNb alloys. ............................................. 31 Figure 18. (a) The stress-strain curves for pre-straining of sheet and rod; (b) the subsequent
strain-temperature (�−�) response during shape memory recovery for sheet and rod materials. ............................................................................................................................... 33
Figure 19. The tensile stress-strain curves for the sheet pulled to increasing pre-strain levels at room temperature................................................................................................................... 35
Figure 20. The stress-temperature response during constrained heating and cooling of specimens that have been pre-strained to (a) 5.4%, (b) 10.1% and (c) 12.2%. The double arrows indicate heating, and the single arrows cooling. .................................................................... 36
Figure 21. (a) Mixing grout with high shear Jiffler mixer. (b) Thermocouple attached to steel tendon. (c) Thermocouples on steel tendons and the data logger (d) Completed sample during temperature collection period ..................................................................................... 37
Figure 22. Temperature measured in different commercially available grouts during curing. ... 39 Figure 23. (a) Pull-out test specimen and (b) test-set-up. ........................................................... 41 Figure 24. Bond stress-slip relationship for SMA bars at free end and loaded end for (a)
Specimen 1 and (b) Specimen 2. ........................................................................................... 42 Figure 25. The variation of recovery ratio and recovery stress with pre-strain level for free and
constrained recovery experiments ......................................................................................... 45 Figure 26. The variation of *
RT∆ and *RT∆ with pre-strain level for free and constrained recovery
experiments ........................................................................................................................... 45 Figure 27. Strain and stress recovered per unit temperature increase as a function of pre-strain
level ....................................................................................................................................... 46

5
LIST OF TABLES Table 1. Mechanical properties for the NiTiNb alloys. Note that the critical and yield stresses are
based on a 0.2% offset. .......................................................................................................... 31 Table 2. Summary of grout temperature test results .................................................................... 39 Table 3. Characteristic metrics for pre-strain deformation of NiTiNb alloy sheet material. ........ 44

6
ABSTRACT
With the increasing demands for high structural performance, the use of “smart
material” have been considered in different engineering disciplines due to the appealing characteristics of these materials such as efficiency, self-actuation, adaptability, self-monitoring and self-healing, and decision making. Recently, shape memory alloys (SMAs) have received considerable attention as a class of smart materials that can be employed in bridge engineering applications. SMAs have the ability to regain their original shape after being deformed up to 6-8% strain. This shape recovery is a result of an underlying reversible solid-solid phase transformation, which can be induced by either a stress or a temperature change. Several researchers have investigated the use of heat-induced SMAs to prestress concrete. However, the previous studies have been focused on thermally activating NiTi SMA tendons by electrical heating and have been mostly at the theoretical and laboratory study levels.
This study investigates the feasibility of self-post-tensioned concrete elements by activating the SME of NiTiNb, a class of wide-hysteresis SMAs, using the heat of hydration of grout. First, the microstructure characterization of the NiTiNb wide-hysteresis shape memory alloys is discussed. Then, the tensile stress-induced martensitic transformations in NiTiNb SMA tendons are studied. Next, the temperature increase due to the heat of hydration of four commercially available grouts is investigated. Pull-out tests are also conducted to investigate the bond between the grout and SMA bar. Results show that the increase in temperature due to hydration heat can provide significant strain recovery during a free recovery experiment, while the same temperature increase only partially activates the SMAs during a constrained recovery.

7
INTRODUCTION
Post-tensioned (PT) structural elements are used quite often in structures such as office building, bridges, parking structures, and water tanks. In many cases, PT systems greatly increase structural capacities and provide an aesthetically pleasing structure. Although PT systems provide many advantages for designers and constructors, these systems have raised concerns regarding corrosion of the PT tendons. The degree of corrosion of PT tendons is critical to the structural performance of PT systems (Yuyama et al., 2007) and the cost to replace tendons can exceed several hundred thousand dollars per tendon (Evans and Bollmann, 2000).
Over the past decade, there has been an increasing interest in the use of shape memory alloys (SMAs) for various civil engineering applications (Ozbulut et al., 2011a). SMAs are a class of metallic alloys that can remember their original shape upon being deformed. This shape recovery ability is due to reversible phase transformations between different solid phases of the material. The phase transformation can be mechanically induced (superelastic effect) or thermally induced (shape memory effect). Besides their ability to recover large strains with minimal residual deformations, SMAs possess excellent corrosion resistance, good energy dissipation capacity, and high fatigue properties (Dolce and Cardone, 2001; DesRoches et al., 2004). Superelastic SMAs can undergo large strains, in the order of 7 to 8%, and recover these deformations upon removal of stress. Due to their excellent re-centering and good energy absorbing capabilities in passive nature, the superelastic SMAs have been considered in a number of seismic applications (Saiidi and Wang, 2006; Alam et al., 2009; Speicher et al., 2011; Ozbulut and Hurlebaus 2011a-f; Bitaraf et al. 2010; Shook et al. 2008)
SMAs that exhibit shape memory effect (SME) generate large residual deformations when the material is mechanically loaded over a certain stress level and unloaded. However, the SME SMAs recover those residual strains upon being heated. Several researchers have explored the use of SME SMAs as actuators for active vibration control (McGavin and Guerin, 2002; Aguilar et al., 2013). Since relatively large amount of material needs to be activated in a very short time to generate an active control force, the application of the SME SMAs for vibration control of civil structures has been mostly limited to theoretical studies. Several attempts have been made to use the SME SMAs for active confinement of reinforced concrete (RC) columns. Andrews et al. (2010) investigated the feasibility of using the SME SMA spirals to retrofit RC bridge columns through experimental and analytical studies. They found that high recovery stress associated with shape recovery of the SME SMAs can be utilized to apply an active confinement pressure on concrete columns to significantly improve the strength and ductility of the columns. In another experimental study, Choi et al. (2011) studied the bond behavior of concrete that is actively confined by the SME SMAs through

8
monotonic and cyclic tests. The potential use of thermally induced SMAs to prestress concrete has been another research topic. The use of post-tensioned SMA tendons in concrete elements can increase overall sustainability of structures by minimizing the susceptibility of post-tensioning tendons to corrosion and by enabling the adjustment of prestressing force during their service life.
Maji and Negret (1998) were the first to utilize the SME in NiTi SMAs to induce prestressing in concrete beams. SMA strands were pretensioned into the strain-hardening regime and then embedded in small-scale concrete beams. Once the beams were cured, the SMA strands were activated by the applied heat. El-Tawil and Ortega-Rosales (2004) tested mortar beam specimens prestressed with SMA tendons. They considered two types of SMA tendons: 2.5 mm and 6.3 mm diameter wires. Test results showed that significant prestressing could be achieved once the SMA tendons were heat-triggered. Sawaguchi et al. (2006) investigated the mechanical properties of mini-size concrete prizm specimens prestressed by Fe-based SMAs. Li et al. (2007) examined the performance of concrete beams with embedded SMA bundles. Through an extensive experimental program, they studied the development of smart bridge girders that can increase their prestressing force to resist the excessive load as needed. In all of these studies, SMA tendons are triggered by an electrical source.
RESEARCH APPROACH
The key characteristic of SMAs is a solid-solid, reversible phase transformation between its two main microstructural phases, namely martensite and austenite. SMAs have four characteristic temperatures at which phase transformations occur: (i) the austenite start temperature As, where the material starts to transform from twinned martensite to austenite, (ii) austenite finish temperature Af, where the material is completely transformed to austenite, (iii) martensite start temperature Ms, where austenite begins to transform into twinned martensite, (iv) martensite finish temperature Mf, where the transformation to martensite is completed. If the temperature is below Mf, the SMA is in its twinned martensite phase. When a stress above a critical level is applied at a temperature below Mf, the twinned martensitic material converts into detwinned martensite phase and retains this phase upon the removal of the load. It can regain its initial shape when the SMA material is heated to a temperature above Af. Heating the material above Af results in the formation of the austenite phase and, in the ideal case, a complete shape recovery. By a subsequent cooling, the SMA transforms to initial twinned martensite phase without any residual deformation.
Significant heat is generated during the hydration of cement products. Numerous factors such as the type and composition of cement, the proportion of the mix, and the ambient temperature affect the heat evolution during the hydration process. In concrete structures, internal temperatures of 70°C are not uncommon (Dwairi et al., 2010). Since

9
grout is generally composed of very high portion of cement, high temperature increases can be also observed during grouting applications. Therefore, hydration heat of grout can be used to trigger the SME of SMAs to obtain SPT concrete members. Figure 1 shows the process for development of the SPT concrete beams using SMAs. First, the SMA tendons, in the martensitic state, are pre-strained. Then, concrete is poured and the SMA tendons are installed in post-tensioning ducts after concrete hardening. The void between the duct and the SMA tendons is filled with grout. Due to the heat of hydration of grout, the temperature of the SMA tendons increases, which induces the transformation of the material to austenite when the temperature is over the As. A complete transformation to austenite phase occurs when the temperature reaches the Af. As the SMA tendons attempt to return back to their original shorter length, while being constrained at both ends, a tensile stress is produced in the tendons, causing pre-stress in the concrete beam.
Figure 1. Self-post-tensioning process.
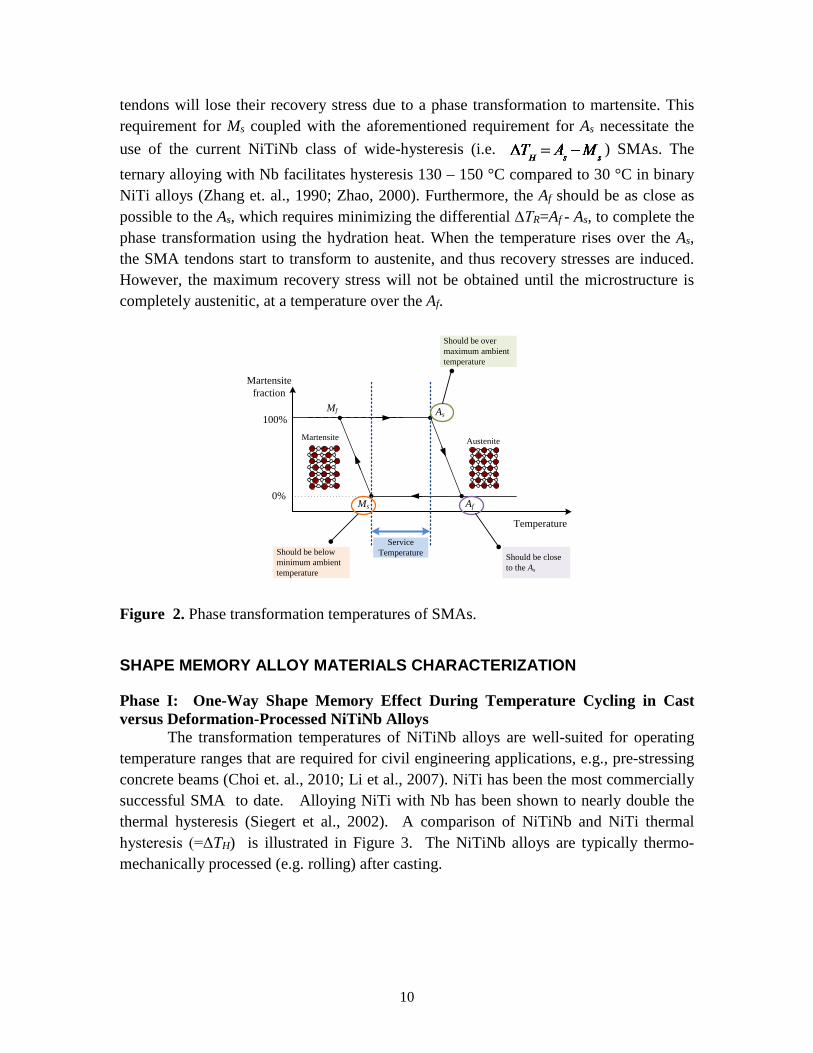
The conditions on the phase transformation temperatures and the required temperature window (service temperature) for self-stressing application are shown in Figure 2. First, the As should be larger than the highest possible ambient temperature as the pre-strained SMA tendons must stay in the martensite state at ambient temperature. This will prevent pre-stretched SMA tendons from recovering their deformations at the storage temperature or during the installation of tendons to the concrete member. Second, the Ms should be below the lowest possible ambient temperature. This will ensure that the heated SMA tendons maintain their recovery stress after cooling to the ambient temperature. If the temperature of the SMA tendons becomes lower than the Ms, the SMA
Austenite
Detwinned Martensite
Twinned Martensite
STEP 1
STEP 2
At T<As, Pre-stretch original SMA while in
martensite phase
Cast concrete, and install the tendon in post-tensioning duct
Fill the ducts with grout, and trigger the tendons using the
heat of hydrationSTEP 3
10
tendons will lose their recovery stress due to a phase transformation to martensite. This requirement for Ms coupled with the aforementioned requirement for As necessitate the use of the current NiTiNb class of wide-hysteresis (i.e. ) SMAs. The ternary alloying with Nb facilitates hysteresis 130 – 150 °C compared to 30 °C in binary NiTi alloys (Zhang et. al., 1990; Zhao, 2000). Furthermore, the Af should be as close as possible to the As, which requires minimizing the differential ∆TR=Af - As, to complete the phase transformation using the hydration heat. When the temperature rises over the As, the SMA tendons start to transform to austenite, and thus recovery stresses are induced. However, the maximum recovery stress will not be obtained until the microstructure is completely austenitic, at a temperature over the Af.
Figure 2. Phase transformation temperatures of SMAs.
SHAPE MEMORY ALLOY MATERIALS CHARACTERIZATION Phase I: One-Way Shape Memory Effect During Temperature Cycling in Cast versus Deformation-Processed NiTiNb Alloys
The transformation temperatures of NiTiNb alloys are well-suited for operating temperature ranges that are required for civil engineering applications, e.g., pre-stressing concrete beams (Choi et. al., 2010; Li et al., 2007). NiTi has been the most commercially successful SMA to date. Alloying NiTi with Nb has been shown to nearly double the thermal hysteresis (Siegert et al., 2002). A comparison of NiTiNb and NiTi thermal hysteresis (=ΔTH) is illustrated in Figure 3. The NiTiNb alloys are typically thermo-mechanically processed (e.g. rolling) after casting.
Af
As
Ms
Mf
Temperature
Martensite fraction
100%
0%
AusteniteMartensite
Should be over maximum ambient temperature
Should be below minimum ambient temperature
Service Temperature Should be close
to the As

11
The shape memory effect (SME)
response of deformation-processed NiTiNb shape memory alloys (SMAs) is benchmarked against the response of a cast alloy. The insoluble Nb element ternary addition is known to widen the hysteresis with respect to the binary NiTi alloy. Cast microstructures naturally consist of a cellular arrangement of characteristic eutectic microconstituents surrounding primary matrix regions. Deformation processing typically aligns the microconstituents such that the microstructure resembles discontinuous fiber reinforced composites. Processed alloys are typically characterized for heat-to-recover applications and thus deformed at constant temperature and subsequently heated for SME recovery, and the critical stress levels are expected to facilitate plastic deformation of the microconstituents. The current work employs thermal cycling under constant bias stresses below those critical levels. This comparative study of cast versus deformation processed NiTiNb alloys contrasts the strain-temperature responses in terms of forward ΔTF =Ms - Mf and reverse ΔTR =Af - As temperature intervals, the thermal hysteresis and the recovery ratio. The results underscore that the deformation-processed microstructure inherently promotes irreversibility and differential forward and reverse transformation pathways.
The NiTiNb alloys are typically cast and subsequently thermomechanically deformation-processed into useful forms such as wires, rods, or sheets for practical application (Otsuka et. al. 1998). As cast microstructures generally consists of β-Nb + eutectic NiTi (with dissolved Nb) in a cellular configuration surrounding primary NiTi (with dissolved Nb) matrix material, consistent with characteristic eutectic microconstituent phases (Zhao et. al. 1991; Zhao et. al. 1990; Zhao LC, 2000; Piao et. al. 1992; Sherif et. al. 2014; Xiao et. al. 2007; Prima et. al. 1996; Siegert et. al. 2002; Ying et. al. 2011; Wang et. al. 2012; Shi et. al. 2013; Schryvers et. al. 2013; Shi et. al. 2014; Tosetti et. al. 2014). Several investigations characterize the impact of deformation processing conditions on the microstructure (Wang et. al. 2014; Siegert et. al. 2002; Tosetti et. al. 2014; Kim et. al. 2014; Yan et. al. 2012; Yin et. al. 2012; Tong et. al. 2014). Ultimately, the findings show that the deformation-processed microstructure is made up of oriented β-Nb particles that are dispersed throughout the matrix similar to aligned discontinuous fiber reinforced composites.
Figure 3. Strain-temperature response of as-processed Ni47.7Ti43.5Nb8.8 (at%) material at constant stresses of 150 and 300 MPa. A Ni49.4Ti50.2 (at%) result loaded to 120 MPa is included for comparison.

12
The functionality of deformation-processed NiTiNb materials is primarily investigated via isothermal pre-straining deformation of an initially martensitic or austenitic microstructure and subsequent assessment of SME recovery via heating ( Duerig et. al. 1989; Zhang et. al. 1990; Zhao LC, 2000; Piao et. a. 1993; Sherif et. al. 2014; Ying et. al. 2011; Wang et. al. 2012; Liu et. al. 2014). Either transformation strain recovery during heating are typically characterized without load or under displacement constraint to assess the recovery stresses. The β-Nb particles are presumably soft and the critical stresses during isothermal pre-straining deformation are expected to plastically deform them, presuming that their flow stress matches that for pure Nb which is estimated between 150-200 MPa (Duerig et. al. 1989; Melton et. al. 1988; Otsuka et. al. 1998). Plastic deformation of microconstituents as martensite deforms necessitates an increased thermal driving force for the reverse transformation that results in elevated As and Af temperatures and the wide hysteresis (Duerig et. al. 1989; Melton et. al. 1988; Zhang et. al. 1990; Piao et. al. 1993; Kusagawa et. al. 2001), commonly referred to as a stabilization effect (Zhang et. al. 1990; Zhao et. al. 2006; Hao et. al. 2011; Hao et. al. 2013; Kusagawa et. al. 2001).
The current work is an original investigation of the one-way strain-temperature (ε−T) response. Constant bias load levels are applied during thermal cycling and the levels are incrementally increased up to those reported to facilitate plastic deformation of particles. Moreover, this is the first comparative study of cast versus deformation processed NiTiNb alloy. Only the matrix undergoes the martensitic transformation (MT) and hence exhibits SME. In the cast alloy, large matrix regions exist without the obvious appearance of microconstituent phases within the regions. However, within the composite-like deformation processed microstructure, β-Nb particles are dispersed throughout the matrix and presumably can interact differently with the MT morphology compared to the cast microstructure. The aim of this comparative study is to gain insights into the impact of β-Nb particles using the cast material ε−T response as a benchmark for the deformation processed material response, which is the prototypical NiTiNb SMA microstructure.
The compositions of both alloys are nearly equal to Ni47Ti44Nb9 at.%, which is the recommended ternary composition for wide hysteresis applications (Otsuka et. al. 1998). Atlantic Metals and Alloys LLC supplied a cast alloy with the composition Ni47.3Ti44.1Nb8.6 at.%. Medical Metals LLC supplied a deformation-processed sheet with the composition Ni47.7Ti43.5Nb8.8 at.%. The thermo-mechanical processing methods for the strip are multiple thickness reductions using cold work via rolling and annealing near the recrystallization temperature (850 °C). Tensile specimens with dog-bone geometry were electrical discharge machined (EDM) from the cast materials. The gage dimensions were length (l) = 10 mm, width (w) = 3 mm, and thickness (t) = 1 mm. The thickness of

13
the deformation-processed sheet material was t = 0.25 mm and EDM was utilized to micromachine dog-bone specimens with l = 10 mm and w = 3 mm.
Specimens were mechanically polished for scanning electron microscopy (SEM) and atomic force microscopy (AFM) analysis. The materials were polished via SiC paper with the grit size decreasing from 180 to 1200 and finally polished using 0.02 μm colloidal silica. Microstructural images were taken at room temperature using a Philips XL30 ESEM scanning electron microscope. For higher magnification imaging, a FEI NanoSEM 630 scanning electron microscope was employed. SEM imaging was performed in back-scattered electron mode. A Veeco Metrology Autoprobe M5 AFM atomic force microscope was used in contact mode and in air. The contact force was maintained around 10~ 20 nN with an imaging frequency of 1 Hz and a minimum detectable surface feature height of 10-4Å.
Load-biased thermal cycling experiments were conducted using a MTS 810 servo-hydraulic load frame equipped with a customized temperature cycling set-up. Temperature gradients within the specimen were minimized and the heating and cooling rates were within 5 to 10 °C/min. The specimens were first heated to 150 °C, to ensure that the specimens were in the austenitic state. The desired bias load was then applied and held constant. The specimens were cooled to -90 °C and then heated to 150 °C. The external load for successive thermal cycles was increased incrementally between 10 and 300 MPa. The strain was calculated based on the displacement of the actuator.
Figures 4-6 show the SEM images of the cast and deformation-processed microstructures. The microstructure in Figures 4(a) and 4(b) exhibits the hypoeutectic character; the characteristic eutectic microconstituent is arranged in a cellular configuration as boundaries encompassing regions of NiTiNb matrix. The AFM image in Figure 4(c) reveals topography of the matrix and cellular eutectic microconstituent. Locally between the matrix and eutectic well-defined boundaries exist and the cellular region are raised. The centers of NiTiNb matrix regions are the lowest height. Moving outward towards the eutectic, the height rises approaching the eutectic-matrix boundary. The height within the eutectic is relatively uniform. Figure 5(a) illustrates that the Nb-rich particles are dispersed throughout the matrix and oriented in the processing directions, thus they appear as striations. The AFM images of the deformation-processed material are shown in Figure 5(b). The images reveal markedly refined topography that is relatively smooth compared to 4(c). Figure 5(c) shows the cross-section in which particles appear as speckles with spacing on the order of 100 nm. Figure 6(a) exposes the characteristic eutectic microconstituent with the lamellar and globular mixture of Nb-rich β-particles and α-NiTiNb that is typical of dissolved Nb (Zhao et. al. 1991; Zhao et. al. 1990; Zhao LC, 2000; Piao et. al. 1992; Sherif et. al. 2014; Xiao et. al. 2007; Prima et. al. 1996; Siegert et. al. 2002; Ying et. al. 2011; Wang et. al. 2012; Shi et. al. 2013; Schryvers et. al. 2013; Shi et. al. 2014; Tosetti et. al. 2014). The particles in the deformation-

14
processed material are shown in Figure 6(b). They are aligned and discontinuous yet the sizes of the particles remain consistent with those in Figure 6(a).
Figure 4. SEM images of the cast showing (a) an overview of the cellular arrangement, (b) the matrix encompassed by the eutectic in the region within the box in (a), and (c) is a 3D AFM image showing the varying surface topology.
.
Figure 5. SEM images showing (a) the deformation-processed microstructure with the Nb-rich particles oriented in the rolling direction, (b) a 3D AFM image of the smooth surface and (c) the cross-sectional view which is perpendicular to (a).
Figure 6. High-magnification SEM images showing the Nb-rich particles in (a) cast and (b) deformation-processed microstructures.
The thermal induced martensitic transformation (TIMT) during thermal cycling without load was evident for the cast material in Figure 7. The TIMT brings about exothermic and endothermic events during cooling and heating, respectively, and thus peaks arise in the heat flow versus temperature thermo-grams measured using differential

15
scanning calorimetry (DSC) analysis. TIMT temperatures were Ms = -63.6 °C, Mf = -106.4 °C, As = -81.3 °C and Af = 11.4 °C. For the deformation-processed material, however, evidence for the TIMT is not apparent in the DSC analysis.
Figure 7. Normalized heat flow vs temperature curves (i.e. thermo-grams)
The strain-temperature (ε-T) responses in Figure 8 show the one-way shape
memory effect behavior for cast and deformation-processed alloys at increasing constant bias stress levels. A ε-T response for the 100 MPa bias load level is evident for the cast material in Figure 8(a). A bias load of 150MPa was needed for the processed material in Figure 8(b). Those bias stress levels were the minimum levels that brought about measurable transformation strain. The Ms temperatures for those bias stress levels for both materials are equivalent and approximately equal to - 67 °C. For 100 and 150 MPa bias stress levels applied to the cast materials, the slopes for the heating and cooling segments of the ε-T curves are nearly equal. At 300 MPa, the slope for the heating segment differs from the cooling segment in Figure 8(a). For the deformation-processed alloy loaded at 150 MPa in Figure 8(b), the slopes for both curves are equivalent. The slopes of the 300 MPa cooling and heating ε-T curves, however, exhibit differential slopes. Moreover, each curve exhibits two slopes. An initial slope appears vertical and the stage is seemingly isothermal. A second different slope follows in the cooling ε-T curve. The heating curve exhibits multiple slopes albeit an isothermal stage is indiscernible.

16
Figure 8. Strain-temperature responses for thermal cycling under constant stress for (a) the cast alloy and (b) the deformation-processed alloy. The single and double arrows depict the slopes during cooling and heating respectively. The symbols are defined within the text.
Metrics that characterize the ε-T response are plotted with increasing bias load in Figure 9. Figure 9(a) captures the effect of bias stress on the forward transformation temperature interval ΔTF =Ms - Mf and the reverse interval ΔTR =Af - As. For each material condition, the ΔTF is less than ΔTR. The deformation-processed material exhibits the narrowest ΔTF. The ΔTF for the cast material is over 30 °C higher. The reverse transformation finish temperature Af exhibits a marked increase (greater than 80 °C) when the bias load is increased from 150 to 300 MPa (see Figure 8). Consequently, for both materials, the ΔTR increases (by nearly 60 °C) from the lowest to highest bias load. The dependencies of thermal hysteresis and recovery ratio on bias stress level are illustrated in Figure 9(b). The thermal hysteresis ΔTH is determined as the temperature differential at half the recovered strain during heating (see Figure 8). The hysteresis widens most when the stress is increased from 150 to 300 MPa. The recovery ratio equals [(εtr – εirr)/εtr x 100], where εtr is the tensile strain accrued in the cooling ε-T curve and εirr is the unrecovered strain after heating (see Figure 8). The 150 MPa bias stress level facilitates a maximum recovery ratio for both materials and the ratio drops for the 300 MPa level.

17
Figure 9. Characteristics parameters (a) forward ∆TF and reverse ∆TR transformation temperature intervals and (b) thermal hysteresis ∆TH and recovery ratio for different levels of bias stress in Figure 8.
The current findings demonstrate that despite vastly different microconstituent morphologies, plastic deformation of β-Nb particles can have similar impacts on the strain-temperature characteristic metrics for cast and deformation-processed materials. In the NiTiNb class of NiTi-based SMAs, the NiTi composition is expected to dictate the transformation temperatures (Duerig et. al. 1989; Melton et. al. 1988; Zhang et. al. 1991; Zhang et. al. 1990; Otsuka et. al. 1998). Indeed the current results for similar Ni47.3Ti44.1Nb8.6 at.% (cast) and Ni47.7Ti43.5Nb8.8 at.% (deformation-processed) compositions exhibit equivalent Ms temperatures, albeit only the cast alloy exhibits the MT during stress-free thermal cycling. A bias stress during thermal cycling was required to bring about measurable shape memory behavior for the deformation-processed material. The yield stress of the Nb-rich particles has been estimated around 200 MPa [23] and thus impacts on the metrics become apparent when the bias load is increased from 150 to 300 MPa. There is a drastic increase in Af for both alloys. Consequently, the reverse transformation temperature intervals ΔTR increase starkly (by comparison the forward transformation intervals ΔTF are relatively consistent). Though the cast material exhibits the largest hysteresis levels, the most marked increase in hysteresis with bias load occurs for the deformation-processed material. For both materials, a maximum is apparent in the recovery ratios and the ratios drop with that increase in hysteresis.
In as-cast materials, microstructure analysis shows that the matrix regions are apparently free of particles whereas the particles are dispersed throughout the matrix for the deformation-processed materials. The matrix regions in the cellular cast microstructure can readily transform unabated by non-transforming β-particles. For the deformation-processed composite-like microstructure, the β-particles exist as closely spaced reinforcements within the matrix. The composite arrangement can constrain the MT. Hence, an external bias load is required to facilitate the one-way shape memory response and a measurable strain-temperature (ε-T) response. Note that recent studies observe sparsely distributed Nb-rich “nano-precipitates” with characteristic dimensions

18
on the order of 10 nanometers within the matrix of cast materials (Shi et. al. 2013; Lin et. al. 1991). Those particles do not exhibit orientation as shown for the deformation-processed alloys.
The slopes of the heating and cooling ε-T curves for cast and deformation-processed materials underscore that impact of the differential microconstituent morphologies on the energetics of the martensitic phase transformation. The ε-T cooling and heating curves exhibit differential slopes with increasing tensile bias load. The heating and cooling ε-T curves of the cast material exhibit a single slope, and thus a single stage at each stress level. When the heating and cooling ε-T segments exhibit similar slopes at the lower bias stresses, the responses are in accordance with crystallographic reversibility (Liu et. al. 1997; Liu et. al. 2000). At the highest stresses, the heating and cooling curves for the cast or deformation-processed alloy no longer exhibit equivalent slopes. The slope of the cooling curve reflects continuous undercooling, which overcomes elastic energy that otherwise resists the forward MT (Liu et. al. 1997). The cooling curves exhibit the steepest slopes for the deformation-processed material and hence elastic energy storage is not predominant. During the initial stage in the cooling curves for the process alloy, elastic energy storage is compromised which apparently facilitates the nearly isothermal growth of martensite (Liu et. al. 1997).
The thermal hysteresis is directly related to energy that is irreversibly dissipated during the MT (Liu et. al. 1997; Liu et. al. 2000; Hamilton et. al. 2004). Stored elastic energy can be irreversibly dissipated during the forward MT due to plastic deformation and thus the hysteresis widens, as the stored elastic energy is not available to assist the reverse transformation (Piao et. al. 1993; Liu et. al. 1997). The drastic increase in Af, for both cast and deformation-process alloys reflects a martensite stabilization effect (Zhang et. al. 1990; Zhao et. al. 2006; Hao et. al. 2011; Hao et. al. 2013; Kusagawa et. al. 2001). Martensite can be stabilized when it is pinned or heavily dislocated such that the reverse transformation requires a higher driving force (Hao et. al. 2013; Kusagawa et. al. 2014; Salzbrenner et. al. 1979). It has been postulated that the β-phase can “lock” the martensitic phase in NiTiNb alloys (Lanba et. al. 2004). For the current results, the reverse transformation temperatures must increase greatly beyond the Af temperature for stress-free thermal cycling, as well as the temperatures at the lowest bias stress levels.
The absences of a corresponding isothermal stage in the heating ε-T curves reveal differential transformation paths for the forward versus reverse MTs for the deformation-processed alloys. Differential transformation paths can suggest non-thermoelastic MTs occur at the higher stress levels (Liu et. al. 2000; Lanba et. al. 2004; Liu et. al. 1998). The stark differential between forward and reverse transformation temperatures intervals can further point to a non-thermoelastic MT for both deformation-processed NiTiNb alloys as well as cast alloys (Liu et. al. 1997; Liu et. al. 2000; Shi et. al. 2012; Liu et. al.

19
1998). The widening thermal hysteresis and diminished recovery ratio at the highest bias stress imply marked irreversibility that is common for non-thermoelastic MTs.
This comparative study of load biased thermal cycling of cast and deformation-processed NiTiNb alloy microstructures supports the following conclusions
• Close inter-particle spacing and narrow spacing between the aligned reinforcements brings about a microstructure constraint that can suppress the thermal-induced MT. A minimum biasing stress overcomes the constraint.
• In the processed microstructure, the elastic energy storage is relaxed. At the highest levels of constant stress, the strain-temperature response of the deformation-processed alloys reflects that the forward and reverse MTs in processed alloys takes place in two stages. A single stage is observed in the MTs in the cast alloys. The slopes of the strain-temperature curves are steepest and the initial stage is seemingly isothermal for the processed alloy.
• The deformation-processed as well as the cast microstructures facilitate a stabilization effect that impacts the reverse transformation by increasing Af and diminishes the recovery ratio. The slopes of the heating and cooling segments are not equivalent. Plastic deformation associated with Nb-rich particles can readily occur at the 300 MPa bias stress level, considering that it exceeds the reported flow stress of Nb. Hence, the transformation may become non-thermoelastic.
Phase II: Characterization of Martensitic Transformation Morphology for Pre-strain Deformation and One-way Shape Memory Effect Recovery
Authors have rationalized the wider hysteresis in the as- processed materials by assessing the impact of the deforming microstructure on the reverse transformation temperatures. Zhang et. al. (1990) proposed that plastic deformation of Nb-rich particles during the stress-induced martensitic transformation relaxes strain energy of martensite interfaces. This is accompanied by plastic deformation of the parent phase. Kusagawa et. al. (2001) found that after heating specimens that had been deformed in the austenitic state between Ms and As, residual strain was always present. Recently, Schryvers et. al. (2013)found evidence of plastic deformation in Nb-rich nano-precipitates after it had interacted with a growing martensite plate. A few works report on the fundamental thermo-mechanical deformation in order to understand microstructure-property relationships (Zhang et. al. 1990; kasagawa et. al. 2001; Schryvers et. al. 2013; Piao et. al. 1992; Wang et. al. 2012; Zheng et. al. 1997). The current work utilizes in-situ digital image correlation analysis in order to ascertain the surface morphology during the stress-induced MT and expound on the impacts of microstructure changes.

20
Fundamental thermo-mechanical characterization of SMAs reports on the shape memory effect, i.e. deformation of thermal induced martensite and subsequent recovery during heating, which is illustrated in Figures 4 and 8. The characterization may also report on the superelastic/pseudoelastic effect as a result of the stress-induced reversible A⇔M transformation at a constant temperature. The digital image correlation (DIC) analysis has primarily been used to characterize the superelastic effect in-situ, i.e. throughout deformation (Hamilton et. al. 2008; Hamilton et. al. 2011; Daly et. al. 2007). The authors have observed general trends as DIC strain contours evolve during the pseudoelastic shape memory response. A summary of the trends with respect to the macro-scale measurements for the stress-strain response follows. The elastic response facilitates homogeneous strain fields and localization is not observed in the full-field DIC strain maps. Upon further loading, a critical value of stress is reached, the stress-strain response deviates from linearity, and a stress plateau develops. That critical stress brings about the stress-induced A→M transformation and transformation strain is accrued over a constant stress plateau. DIC measurements illustrate the transformation morphology by delineating a boundary between high strains that appear in local regions corresponding to martensite from strikingly lower strain levels corresponding to not yet transformed austenite. Multiple and differently oriented boundaries may exist. Single bands of transforming material may be evident between boundaries or multiple bands can interact and overlap. After the plateau, the stress-strain response may transition to a second linear-elastic type response, which corresponds to elastic deformation of a fully martensitic microstructure. The high, local strain regions are no longer present and the appearance of the contours is similar to the initial linear-elastic response of austenite, albeit the strain levels are much higher. An ideal pseudoelastic stress-strain unloading curve will follow the elastic loading curve. However, the reverse transformation A←M, takes place over a lower constant stress plateau and thus a hysteresis exists. Finally, the initial deformed austenite recovers elastically. It is well understood that the reverse A←M MT morphology is the reverse of that for the forward A→M. Hence, the DIC strain fields during unloading disappear in the reverse sequence that they appear during loading.
Based on the aforementioned fundamental understandings, the reversible pseudoelastic shape memory alloy response can be related to the martensitic transformation morphology using DIC surface strain measurements. Utilizing in-situ DIC, the current work elucidates the martensitic transformation morphology of a Ni47.7Ti43.5Nb8.8 (at%) SMA. The bulk material was supplied after thermo-mechanical deformation into a rolled strip. Compared to the as-cast material, the microstructure becomes highly oriented after rolling. The evolution of full-field strains is assessed throughout the stress-strain response with the temperature held constant. Furthermore, after unloading the strains are assessed during heating under null load. It is well known that the transformation stress is temperature dependent. The dependence is modeled

21
using a Clausius-Clapeyron relationship and the stress increases with increasing constant temperature. Thus we contrast DIC measurements for different test temperatures. The influence of microstructure is studied by characterizing the thermo-mechanical response for material in the as-processed (or rolled strip) state and after solution annealing.
A NiTiNb rolled strip with composition Ni47.7Ti43.5Nb8.8 (at%) was obtained from Medical Metals LLC. The strip was 6 mm wide and 0.25 mm thick. Dog-bone specimens with a gage length of 10 mm and gage width of 3 mm were micro-machined from this strip. Some specimens were solution annealed at 900 °C for 1 hr in an Ar atmosphere within a Lindberg/blue-box furnace (BF51732 series) and then quenched in room temperature water. Scanning electron microscopy (SEM) was performed at room temperature in a Philips XL30 ESEM in back-scattered mode. Alloying NiTi with Nb leads to the formation of Nb-rich precipitates embedded in the NiTi matrix. The lower magnification image of an as-cast Ni47.3Ti44.1Nb8.6 (at%) material is shown in Figure 10(a). The constituents are a eutectic-like microstructure (light inclusions) and matrix (darker background). Zooming into an area reveals that the eutectic structure consists of lighter Nb-rich particles, which are shown in Figure 10(b). Processing leads to deformation of these particles. For the Ni47.7Ti43.5Nb8.8(at%) rolled strip investigated in this work, the microstructure is shown in Figure 10(c). The lighter striations along the rolling direction (direction the white arrow) result from the particles elongated in the rolling direction. The micrograph in Figure 10(e) shows a cross-section view and these particles speckle the matrix. Only the matrix material participates in the MT. SEM micrographs of the as-processed material in Figure 10(d) and (e) can be compared to the annealed material in Figure 11. Figure 11(a) shows the rolling direction and the cross-section is in Figure 11(b). After annealing, the long striations of Nb-rich particles break up into particles that are aligned in the rolling direction. The cross-sectional images reveal that the Nb-rich particles are larger after solution annealing.

22
Figure 10. Scanning electron micrographs showing white Nb-rich particles in an as-cast microstructure of Ni47.3Ti44.1Nb8.6(at%) material in (a) at 500 X magnification and (b) at 5000X magnification. (c) The microstructure of the as-processed material Ni47.7Ti43.5Nb8.8 (at%), investigated in this work, shown in the rolling direction at 500X magnification and (d) at 5000X magnification. (e) The cross-section view of the rolled strip material at 10000X magnification. In the text, (d) and (e) are contrasted with the solution annealed microstructure in Figure 11.
The thermo-
mechanical experiments were conducted on an MTS 810 servo hydraulic load frame. The heating was accomplished via induction heating of the grips and the specimen. The average strain is based on actuator displacement. The temperature was measured via a thermocouple attached to the specimen. For the mechanical loading/unloading at a constant temperature, the specimen was first heated under zero load to the test temperature. It was then loaded in displacement control 0.0028 mm/s, which corresponds to an average strain rate of 1.7 X 10⁻⁴ /s. After loading, the specimen was unloaded in force control at an equivalent stress rate of 1.2 MPa/s. After unloading, the specimen was heated in force control at a rate of 10-15 °C/min with the load set to zero in order to try and recover residual deformation.
Figure 11: SEM micrographs showing the white Nb-rich particles of the annealed material (900 °C for 1hr) in the (a) rolling direction at 5000X and (b) cross-section at 10000X. These images are compared to the as-processed microstructure in Figure 10 (d) and (e).

23
In-situ full-field deformation fields were obtained along the gage length using digital image correlation (DIC). DIC is an optical technique that measures displacement fields by tracking a high intensity pattern on the specimen surface. This pattern is applied by painting a thin, uniform white coating of Golden Airbrush Titanium White (#8380) on the surface, followed by a speckle pattern of Golden Airbrush Carbon Black (#8040). The
pattern was applied using an IWATA Micron-CMB airbrush in order to paint micron size speckles. In-situ images of the specimen surface were captured using a Grasshopper GRAS-20S4M/C CCD camera (1600X1200 pixels). The image capture was synched with the data capture and was collected using Vic-Snap software from Correlated Solutions. The images and data were captured at a frequency of 1 Hz. The images that were captured have a spatial resolution of 18 μm/pixel. The correlation is performed in an region of interest (ROI) that is selected in a reference image. The definition of the ROI is shown in Figure 12. This region is divided into subsets and the pixel intensity of each subset is calculated and tracked in deformed images by optimizing the displacements and displacements gradients (strains). Each subset is a square region that is approximately 450 μm2 in size. The DIC was performed via the software Vic-2D from Correlated Solutions, Inc. The general theory of DIC is explained in the works of Sutton et al. (1983, 1986) and Chu et al. (1985).
Figure 13(a) shows the stress-strain response for the as-processed Ni47.7Ti43.5Nb8.8 (at%) specimen. The specimen is deformed to 8% average strain at room temperature (RT=21°C). Inset images show strain contours (calculated based on full-field DIC measurements) at selected points. The contours are the normal component of strain, which coincides with the loading direction. Initially, the specimen exhibits a linear elastic response. At an average strain of 1.4%, the stress drops and the response transitions onto a stress plateau. At an average strain of 5.8%, the response becomes linear, with the stress increasing until the average strain reaches the 8% target value.
Figure 12: Region of interest covering the speckle pattern on the specimen surface. The ROI dimensions used in the DIC analysis are included. The dashed ovals at the top and bottom mark that the ROI extends into the specimen grip section. Consequently, those regions remain unchanged during deformation in Figures 13-15.

24
The inset DIC strain contours show that during the stress drop, a localized band of high strain appears at the top of the image. As the specimen is further deformed, the lower boundary of the band travels towards the bottom of the image and the localized region of strain grows across the gage length. The maximum localized (or micro-scale) strains within the band remain unchanged at around 9.5% as it grows across the gage length. Note that serrations appear in the plateau, which are delineated within a dashed box. At the onset of the serrations, the distinct local small bands appear which are circled: one with the same orientation as the original band and another with a different orientation. The original band and two auxiliary bands grow together until the average strain reaches 5.8%. Within the bands the DIC strain measurements approach 10%. The band stops growing throughout the image at the end of the plateau and the onset of the increase in load. Throughout the linear hardening-like response, the length of the corresponding DIC strain contour remains uniform. The results stress-strain curve exhibits a strain hardening like increase while the load increases; however, the slope is nearly linear as opposed to the non-linear strain hardening response observed in conventional ductile metals. Though the length of the DIC strain contour remains uniform, the strain reaches around 11% despite the average strain only reaching the 8% target value. The DIC strain fields during unloading indicate that the length of the high strain contours does not shrink. Instead, localized strain values within the region decrease to around 7%.
Once the specimen is completely unloaded, it is heated under null load. Figure 13(b) shows the strain-temperature response of the specimen during heating. Upon heating, average strain recovery ensues immediately at 21 °C and recovers 2.6% until the temperature reaches 51 °C and average recovery strain saturates. Inset DIC images illustrate that strain recovery is highly localized. During this recovery, the length of the region of high strain does not decrease in size. Locally, however strains decrease from 7% to nearly 2.5%. The recovery of strains reflects that stress-induced martensite is stabilized during loading. Heat input was necessary to facilitate the reversion of that martensite via the shape memory effect. As permanent residual strain remains after heating, we presume that it is due to irreversible plastic deformation.

25
Figure 13. (a) The stress-strain response of as-processed material deformed at RT up to 8% average target strain and unloaded. (b) The strain-temperature response after unloading and during heating at null load. DIC strain contours are inset at selected points. The strain in the deformation fields is measured in the loading direction. In part (b), the scale has been adjusted to highlight the changes in strain contours during heating.
The stress-strain response for a specimen deformed to 8% average strain at a
constant temperature of 60 °C is shown in Figure 14. Initially, the stress-strain response exhibits a linear elastic type of response. Upon reaching an average strain of 1.7%, there is a transition from linearity to a non-linear response, similar to a strain-hardening type response. At 2.7% average strain, there is a stress-drop. Relative the room temperature response in Figure 13(a), the slope of the stress-strain curve rises linearly. The accompanying DIC strain contour measurement that corresponds to the transition from the initial linear elastic response (i.e., at the average strain of 1.7%) exhibits a uniform blue color that implies a uniform increase in strain. When the stress drops, a local region (outlined with a dashed white circle) of high strain appears at the center of the full-field contour. In the following image, the local strain within the dashed boundary increases further. As the specimen is further loaded, the upper and lower boundaries of the central region, respectively, grow in the upward and downward vertical directions. The bold black arrow mark when the length of the deformed region becomes constant. In subsequent images the local strains increase in a diffuse manner. As the specimen is further loaded to 8% average strain, the length of the high strain region does not grow in size, however, the strains increase uniformly to around 12.5%. The DIC strain fields during unloading indicate that the length of the high strain contours does not shrink. Instead, localized strain values within the region decrease from about 13% to around a minimum of 8%.
26
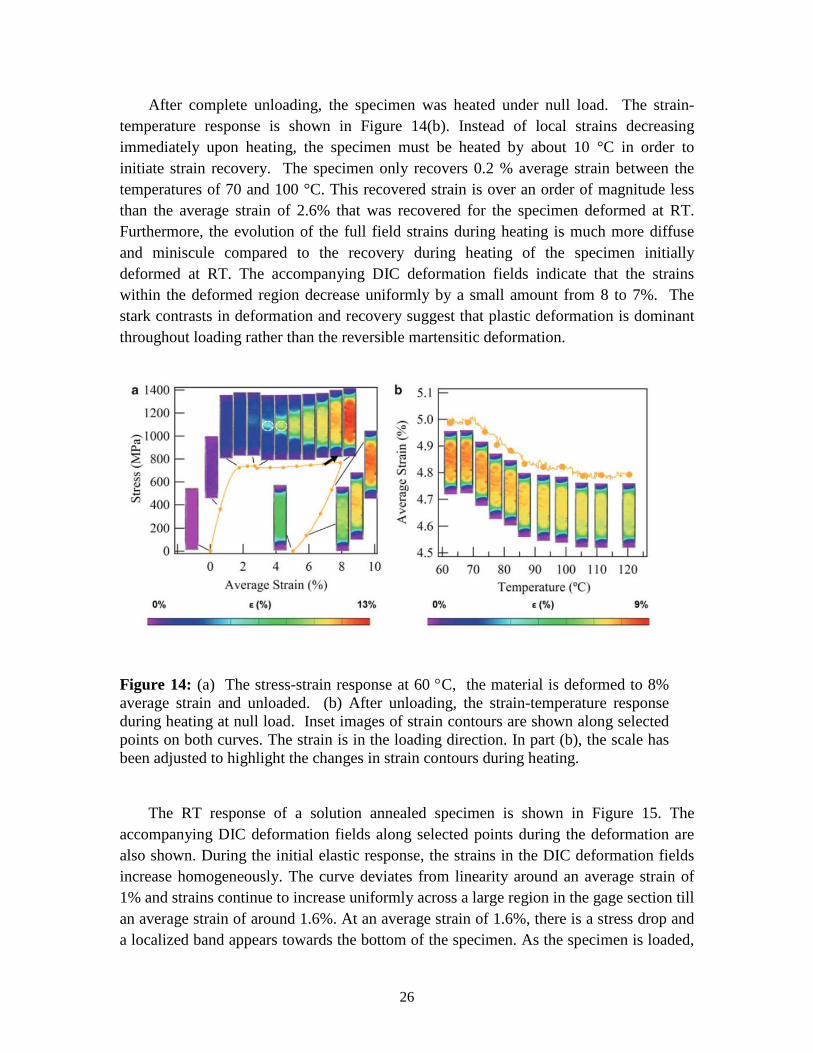
After complete unloading, the specimen was heated under null load. The strain-temperature response is shown in Figure 14(b). Instead of local strains decreasing immediately upon heating, the specimen must be heated by about 10 °C in order to initiate strain recovery. The specimen only recovers 0.2 % average strain between the temperatures of 70 and 100 °C. This recovered strain is over an order of magnitude less than the average strain of 2.6% that was recovered for the specimen deformed at RT. Furthermore, the evolution of the full field strains during heating is much more diffuse and miniscule compared to the recovery during heating of the specimen initially deformed at RT. The accompanying DIC deformation fields indicate that the strains within the deformed region decrease uniformly by a small amount from 8 to 7%. The stark contrasts in deformation and recovery suggest that plastic deformation is dominant throughout loading rather than the reversible martensitic deformation.
Figure 14: (a) The stress-strain response at 60 °C, the material is deformed to 8% average strain and unloaded. (b) After unloading, the strain-temperature response during heating at null load. Inset images of strain contours are shown along selected points on both curves. The strain is in the loading direction. In part (b), the scale has been adjusted to highlight the changes in strain contours during heating.
The RT response of a solution annealed specimen is shown in Figure 15. The accompanying DIC deformation fields along selected points during the deformation are also shown. During the initial elastic response, the strains in the DIC deformation fields increase homogeneously. The curve deviates from linearity around an average strain of 1% and strains continue to increase uniformly across a large region in the gage section till an average strain of around 1.6%. At an average strain of 1.6%, there is a stress drop and a localized band appears towards the bottom of the specimen. As the specimen is loaded,
27
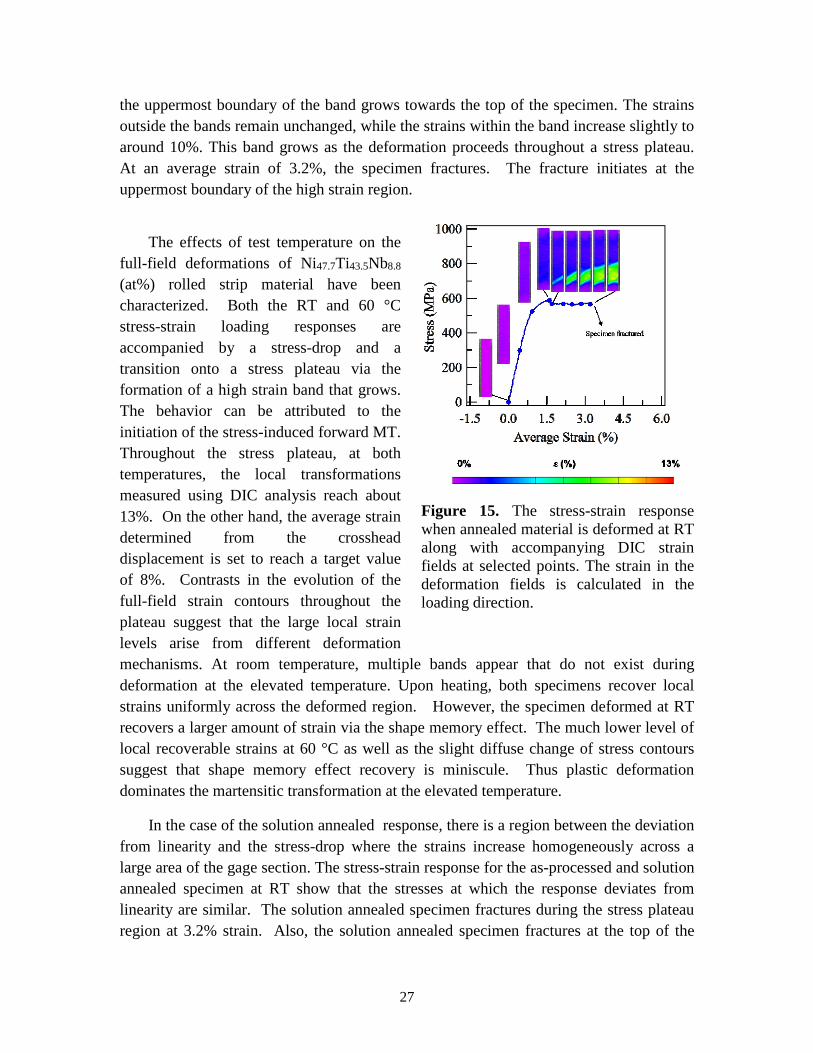
the uppermost boundary of the band grows towards the top of the specimen. The strains outside the bands remain unchanged, while the strains within the band increase slightly to around 10%. This band grows as the deformation proceeds throughout a stress plateau. At an average strain of 3.2%, the specimen fractures. The fracture initiates at the uppermost boundary of the high strain region.
The effects of test temperature on the
full-field deformations of Ni47.7Ti43.5Nb8.8 (at%) rolled strip material have been characterized. Both the RT and 60 °C stress-strain loading responses are accompanied by a stress-drop and a transition onto a stress plateau via the formation of a high strain band that grows. The behavior can be attributed to the initiation of the stress-induced forward MT. Throughout the stress plateau, at both temperatures, the local transformations measured using DIC analysis reach about 13%. On the other hand, the average strain determined from the crosshead displacement is set to reach a target value of 8%. Contrasts in the evolution of the full-field strain contours throughout the plateau suggest that the large local strain levels arise from different deformation mechanisms. At room temperature, multiple bands appear that do not exist during deformation at the elevated temperature. Upon heating, both specimens recover local strains uniformly across the deformed region. However, the specimen deformed at RT recovers a larger amount of strain via the shape memory effect. The much lower level of local recoverable strains at 60 °C as well as the slight diffuse change of stress contours suggest that shape memory effect recovery is miniscule. Thus plastic deformation dominates the martensitic transformation at the elevated temperature.
In the case of the solution annealed response, there is a region between the deviation from linearity and the stress-drop where the strains increase homogeneously across a large area of the gage section. The stress-strain response for the as-processed and solution annealed specimen at RT show that the stresses at which the response deviates from linearity are similar. The solution annealed specimen fractures during the stress plateau region at 3.2% strain. Also, the solution annealed specimen fractures at the top of the
Figure 15. The stress-strain response when annealed material is deformed at RT along with accompanying DIC strain fields at selected points. The strain in the deformation fields is calculated in the loading direction.

28
high strain region that grows during the stress plateau. Recalling the microstructures of the as-processed and annealed specimens in Figures 10 and 11, the deformation results suggest that the breaking up of the elongated particles and the increase in size of the particles after annealing weakens the material.
Phase III: Microstructure Characterization and Thermo-mechanical Experimentation for Feasibility of Self-Prestressing Concrete Members Using NiTiNb Shape Memory Alloys
For materials characterization, the microstructure is reported along with the characteristic thermally-induced martensitic transformation temperatures and the mechanical properties. Then, the NiTiNb SMAs are pre-strained and subsequently heated in order to assess them for the self-post-tensioning application. The SME recovery during heating without constraint is described with respect to the influence of pre-strain/pre-stress on the reverse transformation temperatures ( *
sA and *fA ). The recovery is
constrained during heating in order to assess the influence of pre-strain/pre-stress on stress generation as well as the reverse transformation temperatures ( *
sA and *fA ).
The phase transformation temperatures As and Af and their differential ∆TR=Af - As depend on the microstructure of the NiTiNb alloy, i.e. the composition and the micro-constituent morphology. The influence of Nb addition has been systematically investigated with respect to the microstructure and transformation temperatures (Piao et al., 1992; Siegert et al., 2002). A common ternary alloy composition for widening the thermal hysteresis (Ms - As) while providing useful shape memory effect recovery behavior is Ni47Ti44Nb9 (at%) (Otsuka and Wayman, 1998). Tailoring the micro-constituent morphology via deformation processing is the fundamental means to control the phase transformation temperatures (Siegert et al., 2002). The alloys are typically cast and further cold- or hot-worked into final forms for practical application.
In this work, the microstructure of a cast and deformation-processed (sheet) alloy with similar compositions are reported. Atlantic Metals and Alloys LLC supplied a cast alloy with the composition Ni47.3Ti44.1Nb8.6 at.%. Medical Metals LLC supplied a deformation-processed sheet that was 6 mm wide and 0.25 mm thick with the composition Ni47.7Ti43.5Nb8.8 at.%. The compositions of both alloys are nearly equal to Ni47Ti44Nb9 at.%, which is the recommended ternary composition for wide hysteresis applications above. The grain sizes for the cast and sheet material were determined as 300 μm and 300 nm respectively using the Intercept Procedure from ASTM E112-12. Texture is rarely reported (Yan et. al., 2012) and it is likewise beyond the scope of this work. The impact of differential thermo-mechanical processing was contrast by studying an extruded rod material (3.45 mm diameter) provided by. Memry Corporation with the composition Ni44.6Ti42.8Nb12.6 (at%). Specimens for mechanical testing and

29
microstructure analysis were wire electro-discharge machined from the rod material with an 8 mm gage length and 1.1 x 0.5 mm2 cross-section and from the sheet material with a 10 mm gage length and 3 x 0.25 mm2 cross-section.
The microstructure is characterized along with the characteristic thermally-induced martensitic transformation temperatures and mechanical properties. The cast microstructure consists of a net-like arrangement of a characteristic eutectic micro-constituent encompassing a NiTiNb matrix and a scanning electron microscopy (SEM) image is shown in Figure 16(a). The martensitic transformation occurs in the matrix regions. The as-cast microstructure is representative of the microstructure prior to thermo-mechanical processing. The SEM image in Figure 16(b) shows the typical eutectic micro-constituent, which is made up of β Nb-rich particles and α-NiTiNb matrix (Zhao 2000; Siegert et al., 2002; Wang et al., 2014). Deformation processing breaks up the net-like structure (Siegert et al., 2002; Wang et al., 2014; Yan et al., 2012). The micro-constituent morphology for the sheet material is shown in Figures 16(c). The image reveals a composite-like microstructure with β Nb-rich particles (appearing as the lighter streaks) that are elongated and discontinuous fiber-like reinforcements aligned in the primary processing direction within the NiTiNb matrix.
It is well known that the unique stabilization of martensite, which is the cornerstone of NiTiNb shape memory behavior, is attributed to the microconstituent morphologies (Melton et. al., 1988; Duerig et. al., 1989; Cai et. al., 1994; Zhao, 2000; Kusagawa et. al., 2001; Seigert et. al., 2002; Yan et. al., 2012; Wang et. al., 2014). The microstructure images in Figure 16(c) and 16(d) underscore differential microconstituent morphologies resulting from different thermomechanical processing done by the different companies, which show the sheet and rod materials respectively. The images reveal a composite-like microstructure with β Nb-rich particles (appearing as the lighter streaks) that are elongated and discontinuous fiber-like reinforcements aligned in the primary processing direction within the NiTiNb matrix. The area fractions of the second particles were estimated using a digital image pixel thresholding technique (Sahoo et. al., 1988; Pal and Pal, 1993), which takes advantage of the dark and light contrasts of the matrix and particles respectively, and uses the average of several SEM images. The particle average area fraction for the rod microstructure was 18%. Consistent with the similar compositions, the fractions for the cast and sheet materials were 10%. The average inter-particle spacings were determined from cross-sectional SEM images. For the sheet material, the inter-particle spacing was about 100 nm and it was 500 nm for the rod material. These findings convey a refined microconstituent morphology for the sheet compared to the rod. Moreover, the microstructure characterization illustrates that deformation-processing after castings affords the ability to tailor the microstructure, via orienting the microconstituents and inter-particle spacing.

30
Figure 16. SEM images showing (a) the microstructure and (b) the micro-constituents in a cast Ni47.3Ti44.1Nb8.6 (at%) alloy and the microstructures of (c) the Ni47.7Ti43.5Nb8.8 (at%) alloy sheet (d) theNi44.6Ti42.8Nb12.6 (at%) alloy rod materials.
Differential scanning calorimetry (DSC) analysis was carried out to determine
transformation temperatures. DSC was carried out using a power compensated Perkin-Elmer DSC8500. The temperature scan rate was 40 °C/min. The methodology was as follows: (i) heat from 50 °C to 100 °C, (ii) hold for 1 minute at 100°C, (iii) cool to -120 °C, (iv) hold at -120 °C for 1 minute, (v) reheat to 200°C, (vi) hold at 200°C for 1 minute, (vii) cool to 50 °C. The transformation temperatures for the cast alloy were Ms = -64 °C, Mf = -106 °C, As = -81 °C and Af = 11 °C. For deformation-processed NiTiNb alloys endothermic and exothermic events did not arise in DSC measurements down to liquid nitrogen temperature.
Thermal cycling under constant bias load is typically employed to determine characteristic transformation temperatures for processed NiTiNb materials (Melton et al., 1988; Kim et al., 2011). Constant bias loads were increased from 10 MPa up to a load that facilitated measurable transformation strain. Biasing with a constant stress of 150 MPa did reveal the thermally-induced transformation. The transformation temperatures for the sheet were Ms = -64 °C, Mf = -75 °C, As = -29 °C and Af = -6 °C, and those for the rod were Ms = -52 °C, Mf = -71 °C, As = -29 °C and Af = -1 °C.
The strength properties were determined from uniaxial tension loading until failure and the stress-strain responses are shown in Figure 17. The uniaxial tension test for each material was determined at room temperature (~23 °C) with the material in the austenite state and thus the martensitic transformation is stress-induced. The tests were conducted

31
in displacement control using an equivalent strain rate of 2.0 x10⁻⁴ /s. Strain was measured via a miniature extensometer within the gauge length and computed via digital image correlation (DIC), using the ‘Inspect Extensometer (IE)’ tool from the DIC software Vic-2D®. The IE gage length of the matches the gage lengths of the specimens. The material properties are summarized in Table 1. The moduli for the deformation-processed materials are greater than that for the cast material. Deformation processing improves ductility and the fracture strain increases compared to the cast material. For the cast and rolled sheet materials with similar composition, deformation processing improves the mechanical strength.
Stress-strain curves for processed composite microstructures evolve as follows: austenite linear-elastic response, stress drop/softening and plateau (indicative of the phase transformation), linear-elastic response of martensite, non-linear strain-hardening response, and fracture. Upper critical stress (referred to as “Austenite Critical Stress” in Table 1) levels for the rod and sheet materials reach about 500 and 640 MPa respectively and lower plateau stress levels are 460 and 590 MPa. The strain throughout the plateau response is slightly larger for the rod (7.5 %) compared to the sheet (7.0 %). The cast net-like microstructure facilitates an initial linear-elastic slope followed by a deviation from linearity, and then a critical stress that precedes the transformation. Moreover, a plateau is apparent for the processed materials with strain accruing throughout the plateau. Rather than a plateau, the transformation for the cast material exhibits a hardening-like response. The martensitic sheet exhibits higher strength properties and failure strain.
Figure 17. The tensile stress-strain response of the NiTiNb alloys.
Table 1. Mechanical properties for the NiTiNb alloys. Note that the critical and yield stresses are based on a 0.2% offset.

32
Composition (at%)
Modulus (GPa)
Austenite Critical Stress (MPa)
Martensite Yield Stress (MPa)
Ultimate Tensile Strength (MPa)
Failure Strain (%)
Cast Ni47.3Ti44.1Nb8.6 63 330 - - 9.4
Sheet Ni47.7Ti43.5Nb8.8 70 640 740 980 42.2
Rod Ni44.6Ti42.8Nb12.6
54 500 600 710 29.1
The pre-strain experiments were conducted on an MTS 810 servo hydraulic load
frame and at room temperature, which averaged about 23°C and was well above the Af temperatures so the starting microstructure was austenitic. Pre-strain for binary NiTi SMAs is typically carried out in the martensitic state and martensite reorientation takes place rather than the stress-induced austenite-to-martensite transformation (Duering and Melton, 1989; Cai et al., 1994; Zhao, 2000; Wang et al., 2014). In this work, the martensite was stress-induced, which is made possible by the Nb addition in the ternary NiTiNb SMAs. The specimens were loaded in displacement control at an average strain rate of about 2.0 x10⁻⁴ /s and they were unloaded upon reaching the desired pre-strain level. Residual strain remained after unloading. To assess the recovery ratio of residual strain, specimens were heated at zero load (referred to as free recovery). Thermo-mechanical experiments were conducted for the current work on an MTS 810 servo hydraulic load frame equipped with a custom thermal-cycling set-up. The specimens were heated via induction heating. The temperature was measured via a thermocouple affixed to the specimen. The induction coil design (Semiatin and Zinn, 1988) minimized thermal gradients in the specimen. Heating and cooling rates were controlled so that they were maintained around 10-15 °C/min. Specimens were allowed to cool in the ambient back to room temperature. Preliminary free-recovery experiments were conducted on both deformation-processed material in order to assess the material response of the differential composite-like microstructures.
For the sheet and rod materials, free recovery is contrast for the pre-straining
stress-strain response shown in Figure 18(a). After unloading, there is residual strain .
The strain recovery begins at the *sA temperature in Figure 18(b). The strain saturates at a
temperature *fA when the reverse transformation is complete. Since saturation is achieved,
the reverse transformation temperature interval * * *R f sT A A∆ = − fully activates the shape
memory effect. As shown in Figure 18(b), not all the strain is recovered during heating
resε

33
and there is permanent irrecoverable strain . The strain that is recovered during
heating is shown as . The percentage of residual strain that is recovered via free SME
recovery is defined as the recovery ratio ( ). The recovery ratio (58%)
for the sheet material is higher than that of the rod (49%). The recovery will be
incomplete if the temperature is raised by a fraction of *
RT∆ ; therefore, the material will be partially activated. In order to achieve full activation, as well as maximize the recovery ratio, the material microstructure must be designed such that *
RT∆ matches the heat of hydration of the grout.
(a) (b)
Figure 18. (a) The stress-strain curves for pre-straining of sheet and rod; (b) the subsequent strain-temperature (�−�) response during shape memory recovery for sheet and rod materials.
The recovery behavior can be further characterized based on the heating strain-
temperature (ε-T) curves. A dotted line is drawn tangent to the curves in Figure 18(b) and demonstrates the extent of strain recovery within a select temperature range. The strains for the sheet and rod respectively recover with temperature at 0.12 %/°C and 0.09 %/°C. Contrasting the initial slopes, the sheet exhibits a higher recovery ratio over a smaller temperature interval, which may better match the possible heat of hydration. After the initial slope the strain recovers gradually and the sheet alloy exhibits a *
RT∆ = 49 °C and
permε
*100%full
rec
res
εε
34
*RT∆ = 57 °C for the rod. However, it can be seen that when the temperature is increased
to 50°C, which corresponds to a 26°C increase from the pre-straining temperature, 91% of for the sheet and 77% of for the rod is achieved. The lower temperature interval and higher recovery ratio of the sheet as compared to the rod confirms that extent of deformation experienced by sheet material resulted in a more promising microstructure for activation via heat of hydration of the grout. Thus, understanding the microstructure property relationships can enable tailoring the eutectic microconstituent orientation (giving rise to an apparent elongation in Figures 16(d) compared to 16(c)) and inter-particle spacing in order to tune the activation strain and * * *
R f sT A A∆ = − . The following
section focuses on stress generation during heating with a fixed displacement constraint for the sheet material, as the martensite exhibited higher strength and fracture strain and the recovery ratio is substantial over a lower temperature interval.
The stress-strain responses for the pre-straining of the sheet material are shown in Figure 18. Pre-strain levels of more than 12% are commonly suggested (Otsuka and Wayman, 1998) and in this work pre-strain levels approach that value and exceed it. The pre-strain levels were 5.4, 8.8, 10.1, 12.2 and 16.1% in order to deform martensite to different extents of the stress-strain response. During loading, the curve exhibits an initial linear-elastic response up to a stress peak, followed by a stress drop. Then a stress plateau indicative of the phase transformation is observed. The evolution of the morphology depends on whether the pre-strain in Figure 18 is within the plateau region, at the completion of the plateau, within the linear elastic response of martensite after the plateau, or within the strain-hardening type behavior of martensite after the elastic response. For the 5.4% pre-strain level, the microstructure is a mixture of martensite and austenite. The martensite volume fraction increases throughout the plateau and the material should be completely martensitic at the 8.8% pre-strain. Beyond the plateau, the martensite deforms for the 10.1% pre-strain and the stress-strain response exhibits a linear-elastic type response. The highest pre-strain levels (12.2 and 16.1%) are within the non-linear response and the martensite likely yields.

35
Figure 19. The tensile stress-strain curves for the sheet pulled to increasing pre-strain levels at room temperature.
Residual strain remains after unloading in Figure 19 and the corresponding
displacement is fixed during heating which constrains shape memory effect recovery and generates recovery stresses. The stress generation experiments utilize the heating set-up described in the previous section. The displacement sensor of the MTS machine measures the change in actuator position and thus the change in length of the specimen and the grips. For the experiments in this work, an extensometer would not easily mount to the thin sheet specimens. Hence, the displacement was used for stable feedback that maintained the constant constraint and avoided damaging the extensometer. Note that ASTM standard E328 outlines Standard Test Methods for Stress Relaxation for Materials and Structures at constant temperature and recommends mounting an extensometer within the gage section to fix/constrain the strain. Using the extensometer measurement to maintain a fixed strain constraint can fix the sample length, as the grips would be excluded from the constraint, and the impact on the results will be considered in future work. The current experiments best represent the constraining conditions for pre-stressing via heat of hydration of the grout. During heating, the displacement was programmed so that is was fixed at the residual strain after pre-straining and the stress generation results are expected to be reliable for the context of the discussion in this work.
In Figure 20, the recovery stress is plotted as it evolves throughout heating. The stress generation begins at the onset of heating and thus close to the test temperature. For the lowest pre-strain in Figure 20(a), the recovery stress reaches a maximum (or peak) and drops. For the higher pre-strain levels in Figures 20(b) and 20(c), the recovery stress increases to a maximum and decreases slightly up to the maximum temperature. The

36
temperature at the maximum stresses generated during heating should correspond to the temperature at which martensite reversion ceases. Hence, in Figure 20, that temperature
is designated as**fA (associated with constrained residual strain recovery). Recovery
stresses reaching maximums during heating have been observed for NiTiNb (Wang et al., 2014) and a Fe-based SMA (Dong et al., 2005) For each pre-strain level, recovery stress accrues after heating is complete as the temperature decreases to room temperature. Recovery stresses increased during cooling for the Fe-based SMA (Dong et al., 2005). The observations that the generated stress reaches a maximum during heating and that it increases during cooling merit further study beyond the scope of the current work. The findings pertinent to the pre-stressing application, which are discussed later in the discussion, are that the maximum recovery stresses are generated under constraint after straining to 12.2% and the resulting transformation temperature interval
** ** **R f sT A A∆ = − .
Figure 20. The stress-temperature response during constrained heating and cooling of specimens that have been pre-strained to (a) 5.4%, (b) 10.1% and (c) 12.2%. The double arrows indicate heating, and the single arrows cooling. GROUT CHARACTERIZATION
Portland cement, potable water along with any admixtures to obtain required properties are the basic grout materials. The chemical reaction between Portland cement and water is exothermic, i.e. producing heat. This heat is called the heat of hydration. In order to determine the temperature increase during grouting post-tensioning ducts, four commercially available tendon grouts were tested. All grouts were prepackaged and approved by Virginia Department of Transportation for post-tensioning applications. The water-to-grout ratios for each commercial grout were set per manufacturer’s direction and given in Table 2. To prepare test specimens with each grout, a mixing cylinder was

37
cleaned and a bag of selected grout and the required water were placed in the cylinder. The contents were mixed in the cylinder for 3 minutes using a high shear Jiffler mixer attached to a Milwaukee Magnum Drill at 2500 RPM. Timing started as soon as water was added into the mixing cylinder. The resulting grout mixture was poured into a
mm ( inch) cylinder with a thermocouple attached to a single tendon placed in the center. The thermocouple was then connected to a Campbell Scientific data logger which monitored the temperature of the curing grout every minute for 48 hours. This process, which is illustrated in Figure 21, was completed for each grout brand.
(a) (b)
(c) (d)
Figure 21. (a) Mixing grout with high shear Jiffler mixer. (b) Thermocouple attached to steel tendon. (c) Thermocouples on steel tendons and the data logger (d) Completed sample during temperature collection period

38
The time versus grout temperature plots for each specimen as well as ambient temperature are given in Figure 22. Three specimens were prepared and tested for Grout I and Grout II on three different days. The results for Grout I are consistent for each specimen. The highest temperature recorded during curing is 41°C, which indicates a temperature increase of 19°C to 20°C from initial temperature of 21°C to 22°C due to the heat produced by the cement hydration. The temperature of Grout II reaches 48°C for two specimens and 51°C for one specimen. At three different tests of Grout II, the average temperature increase is 28°C. The peak temperature and average increase in temperature for Grout III and Grout IV are similar to the results obtained from Grout I. For Grout IV, two samples at two different water-to-grout ratios were tested. It is observed that the peak temperature is slightly higher and occurs a few hours earlier when a lower water-to-grout ratio is used (Figure 22d). The grout temperature reaches its peak value at 10 to 18 hour after casting for Grout I, Grout II and Grout IV whereas the peak temperature occurs at 2.5 hour after casting for Grout III. For all specimens, the grout temperature reduces to values between 22°C and 24°C near 30 hour after casting and remained almost constant thereafter.
(a)
(b)

39
(c)
(d)
Figure 22. Temperature measured in different commercially available grouts during curing.
The results of experimental tests conducted to characterize the grout temperature during curing are summarized in Table 2. These results suggest that a commercially available tendon grout (Grout II) can provide an average of 28°C increase in temperature during the hydration, process, which can be used to activate SMA tendons.
Table 2. Summary of grout temperature test results
Specimen Grout Water-to-
Grout Ratio
Initial Temperature
(°C)
Maximum Temperature
(°C)
Temperature Increase
(°C) S1 Grout I 0.25 21 41 20 S2 Grout I 0.25 22 41 19 S3 Grout I 0.25 21 41 20 S4 Grout II 0.24 21 48 27 S5 Grout II 0.24 22 53 31 S6 Grout II 0.24 21 48 27 S7 Grout III 0.25 22 41 19 S8 Grout III 0.25 22 41 19 S9 Grout IV 0.27 22 41 19
S10 Grout IV 0.27 22 41 19 S11 Grout IV 0.32 22 40 18 S12 Grout IV 0.32 22 40 18

40
PULL-OUT TESTS
To investigate the bond behavior of SMA bars with grout, pull-out tests were conducted. SMA bars with a diameter of 3.5 mm were cut into 220 mm segments using a cutoff wheel. Two mm ( inch) cylindrical molds were used to manufacture pull-out specimens. Holes with a diameter of 3.5 mm were drilled at the center of the top and bottom of the molds to allow SMA to pass through. The SMA bar was secured at the bottom hole of each mold and Grout II was poured inside the mold. The specimens were left to cure for 3 days. Figure 23(a) shows a schematic diagram of the specimen used for the pull-out test.
Since it is difficult for standard grips to fully hold on to SMA bars because of their small diameter size, special aluminum sleeves were fabricated. Two 50 mm-long sections were cut from a 10-mm aluminum rod. These sections were then placed on a lathe, and a 3.5-mm hole was drilled all the way through. The sleeve was then attached to the specimen by means of twisting since the aluminum sleeve hole was a little bit smaller than the diameter of the SMA bar. The tight fit was useful to establish a mechanical interlock to help the SMA resist slippage out of the sleeve during testing.
The pull-out tests of the SMA bar conducted using an MTS servo-hydraulic load frame. The specimen was held in place by a testing cage attached to the top head of the load frame by a large bolt. The load was applied to the SMA bar at a rate of 0.075 mm/s and measured by a built-in load cell of the load frame. The slip of the SMA bar relative to grout were measured using Digital Image Correlation (DIC) method at the loaded and free ends of the specimen. Two cards with a speckle pattern were attached to the loaded and free ends of the SMA bar. The bottom card was attached directly at the end of the grout cylinder to reduce any errors in the calculation of slippage due to strains in the SMA. The optical system capture the movement of speckle patterns on the cards and provide an output of the average vertical movements at each time step. Figure 23(b) shows pull out test set-up.

41
(a)
(b)
Figure 23. (a) Pull-out test specimen and (b) test-set-up.
Two specimens were tested and the applied tensile force and the slip of the bar were recorded. Bond strength is defined as the shear force per unit surface area of the bar and calculated by the following equation:
where T is the tensile load on the SMA bar, db is the nominal bar diameter, and lb is the embedment length of the bar. Figure 24 illustrates bond stress-slip curves both at the loaded and free ends of the SMA bar. The bond behavior is characterized by an initial increase in the bond stress up to 1.2 MPa for the first specimen and up to 1.4 MPa for the second specimen, and with insignificant slippage and a softening thereafter. Since SMA bars had a very smooth surface, mechanical bearing forces were very low and the load transfer was primarily provided by friction.

42
(a)
(b) Figure 24. Bond stress-slip relationship for SMA bars at free end and loaded end for (a) Specimen 1 and (b) Specimen 2.
DISCUSSION OF RESULTS
The comparison of the rod and sheet material demonstrates the importance of microstructure to tailor ∆TR to the thermal inputs that the heat of hydration can provide. It has been postulated that the increase in reverse transformation temperatures after pre-straining in these alloys is related to the interaction of the martensitic transformation with

43
the β Nb-rich particles (Duerig and Melton, 1989; Piao et al., 1993; Shi et al., 2012). The deformation of these particles could lead to the stabilization of transformed martensite in the surrounding matrix. Stabilization refers to the reverse martensitic transformation requiring a higher thermal driving force, which facilitates an increase of the reverse transformation temperatures (Liu and Favier, 2000). Pre-strain for NiTi-based SMAs is typically carried out at temperatures between Ms and As; the stress-induced austenite-to-martensite transformation is expected to remain after unloading and thus heating facilitates recovery via SME (Duerig and Melton, 1989; Cai et. al., 1994; Zhao, 2001; Kusagawa et. al., 2001; Wang et. al., 2014). This work demonstrates stress-induced martensite that remains after pre-strain deformation at a constant room temperature, which is well above Af determined via the thermal cycling, can be partially recovered. The sheet microconstituent morphology appears refined in SEM images compared to the rod and the results reflect that the sheet exhibits the highest activation strain and improved martensite strength properties. Hence, the findings confirm that the material response can be tuned via tailoring Nb concentration and deformation-processing after casting in order refine the inter-particle spacing and volume fraction of the microconstituent morphology.
The grout temperature characterization tests reveal that it is possible to increase the temperature of a post-tensioning tendon up to about 50°C when a post-tensioning duct is filled with a commercially available grout. When the SMA sheet material is pre-strained at different levels, the strain remained after unloading, the strain recovered upon a temperature increase to 50°C, which can be reached through hydration heat, and the strain recovered after fully activating the material (heating above *
fA are provided in
Table 3. Note that *fA is stress dependent and it increase under applied stress as shown in
Table 3. The material should be heated above the *fA under generated stress to achieve
maximum strain recovery. It can be seen that a great percentage of the maximum recoverable strain can be activated when the temperature reaches 50°C. For instance, for an SMA tendon with a 10.1% pre-strain, a temperature increase to 50°C increase will achieve 91% of recoverable strain during free recovery experiments.

44
Table 3. Characteristic metrics for pre-strain deformation of NiTiNb alloy sheet material.
Figure 25 shows the dependence of the reverse transformation temperature interval ** ** **
R f sT A A∆ = − and recovery ratio on the pre-strain for the free recovery experiments.
Figure 26 shows the variation of the **RT∆ and recovery stress with the pre-strain for the
constrained recovery experiments. The ∆TR values continually increase while the recovery ratio reaches maximum for the 10.1% pre-strain and decreases thereafter. The increasing *
RT∆ and the pre-strain reaching a maximum reflect the role of the Nb-rich particles in the composite-like microstructure. Particles can have a stabilizing effect and prohibit the reverse martensitic transformation and thus the thermal energy and Af must increase to complete (or fully activate) the recovery (Duerig and Melton, 1989).
For the pre-strain level of 10.1% and 12.2%, the stresses generated during constrained recovery are 530 MPa and 550 MPa, respectively. The temperature intervals under constrained recovery are in general larger than the *
RT∆ during free recovery, especially when the pre-strain level is greater than 8.8%. Presumably, the constraining stress augments the stabilization effect. This disparity needs to be considered when designing these alloys.
Pre-strain (%)
Applied Stress (MPa)
Strain remaining after unloading (%)
Strain recovered up to 50 °C (%)
Free Recovery
*fA
(°C)
Strain recovered
after heating to
*fA (%)
5.4 590 2.3 1.0 63 1.1 8.8 630 5.2 2.7 75 3.0
10.1 720 6.8 4.1 80 4.5 12.2 800 9.0 1.3 111 5.3 16.1 860 12.7 0.5 123 4.8

45
Figure 25. The variation of recovery ratio and recovery stress with pre-strain level for free and constrained recovery experiments
Figure 26. The variation of *
RT∆ and **RT∆ with pre-strain level for free and constrained
recovery experiments

46
The results obtained from free and constrained recovery tests show that pre-stressing significantly affects the transformation temperatures and shape recovery. Figure 27 shows the amount of strain and stress recovered per unit temperature increase for free and constrained recovery experiments at different pre-strain levels. It can be seen that the optimum pre-strain level that result in maximum strain recovery for a unit temperature increase is 10.1%. That pre-strain level also provides the maximum recovery ratio as can be seen from Figure 27.
On the other hand, for constrained recovery, the recovery stress per unit temperature increase is decreasing with increasing pre-strain level as shown in Figure 27. However, the maximum recovery stress increase with the pre-strain level up to 12.2% pre-strain, and decrease thereafter as shown in Figure 26. Therefore, if the SMA tendons will be activated partially with limited temperature increase, a relatively low level of pre-strain (6-9%) can be more favorable. If the SMA tendons will be fully activated with sufficient heat, then a pre-strain level that is just beyond the plateau region (10-12%) is more preferable.
Figure 27. Strain and stress recovered per unit temperature increase as a function of pre-strain level
It should also be noted that only four types of grouts approved by the state transportation agency are considered here. The hydration heat of grout is a result of a number of exothermic chemical reactions that can be influenced by several factors such as water/cement ratio, air entrainment, chemical admixtures, cement type, cement fineness, and ambient temperature (Ball and Camp, 2014). Therefore, further studies can be conducted to obtain larger hydration heat (i.e. higher increases in temperature) by

47
altering some of these factors. However, this needs to be done carefully since excessive hydration heat can cause other problems during grouting and adversely affect the performance of the grout.
Pull-out tests showed the bond between the SMA bars and the grout is low. However, it is comparable to the bond strength (less than 1 MPa) between a single steel bar and grout (Watanabe et al., 2012) and the bond strength (less than 2 MPa) between smooth prestressing bars and normal strength concrete (CEB-FIP, 2010). In self-post-tensioning with SMAs, the prestress is transferred to the concrete element by the end anchorages. Therefore, the recovery stresses in the SMA bar will be transferred through the anchorage system at the end of the beam despite the low bond strength. Nonetheless, as discusses earlier, good bonding is still favorable for better cracking behavior and ultimate strength response. The use of SMA strands instead of a single SMA bar can provide better bond performance as higher bond strength was reported for steel strands compared to steel bars in the literature. Superelastic SMAs in the strand or cable form have recently been developed and studied by several researchers (Reedlunn et al., 2013; Daghash et al., 2014). When SMA strands with shape memory effect properties are also developed, they can be used in prestressing applications with better bond characteristics.
CONCLUSIONS AND RECOMMENDATIONS
This study explores the feasibility of activating SMA tendons using heat of hydration of grout in order to develop self-post-tensioned concrete elements. Material characterization tests were conducted on NiTiNb SMAs. In particular, the influence of differential thermo-mechanical processing on shape memory behavior is assessed for a rolled sheet and extruded rod. The recovery behavior of the material was studied during free and constrained recovery experiments. The increase in temperature during the hydration of four commercially available grouts was evaluated. A typical cylinder specimen was filled with the grout and a thermocouple and a data acquisition system were employed to measure the temperature during 48 hours. In addition, two pullout tests were conducted on cylindrical specimens to investigate the bond between the grout and SMA bar. The major findings of this study can be summarized as follows:
• Tailoring deformation-processing after casting, such that the eutectic microconstituent is oriented and closely spaced, can facilitate tuning the activation strain and reverse transformation interval.
• Pre-strain level considerably influences the reverse transformation interval and recovery ratio or stress.

48
• For free recovery experiments, reverse transformation interval increases with the increasing pre-strain level while recovery ratio reaches a maximum value and then decreases.
• For constrained recovery experiments, both reverse transformation interval and recovery stress increase up to 12.2% strain and then slightly decrease with the increasing pre-strain. It is shown that a recovery stress more than 550 MPa could be achieved after cooling to ambient temperature.
• An average of 28°C temperature increase was observed during hydration of a pre-packaged grout material.
• The temperature increase due to heat of hydration of the grout can activate most substantial percentage of recoverable strain during a free recovery experiment. However, for constrained recovery, higher temperature increases are needed to fully activate the SMA material.
• Bond strength between plain SMA bars and grout material is found to be about 1.3 MPa. To achieve higher bond strength, the surface of SMA bars can be sand-blasted.
The use of SMA tendons, which possess high fatigue and corrosion resistance, in post-tensioning concrete elements will increase the service life of concrete strcutures. The replacement of steel tendons with SMA prestressing tendons will prevent corrosion-induced deterioration of tendons. The use of heat of hydration of grout to activate the shape memory effect of SMA tendons will provide self-stressing capability. This will greatly simplify the tendon installation. The need for jacking equipment or electrical source will be eliminated. This will also enable to form the reinforcement in any shape in two or three-dimensional space without special devices. The use of SMA tendons will lead to better control of the prestress and higher levels of effective prestress. During the service life of a structure, heat-triggering the SMA tendons can repair possible damage observed in the structure. Since the stressing is made from both ends of SMA tendon, friction losses will be reduced.
Although this feasibility study indicates that the concrete elements can be prestressed by partially activating NiTiNb shape memory alloy bars using hydration heat of the grout, pre-straining in the austenitic state via the stress-induced martensitic transformation has limited potential. Decreasing pre-strain deformation temperatures below room temperature down to Ms and below Mf can facilitate lower critical stress levels and differential reverse transformation intervals for SME recovery as well as higher recoverable strains and recovery stresses (Cai et. al., 1994; Zhao, 2000; Kusagawa et. al., 2001). Hence, a similar systematic study for pre-straining NiTiNb in the martensitic state

49
is warranted. Further research is needed to investigate other SMA materials that possess more favorable phase transformation ranges for self-stressing and higher recovery stresses. Potential of obtaining higher temperature increases during the hydration of grout can also be explored. Furthermore, long-term prestress losses, the use of larger size SMA tendons, and the effects of field conditions need to be examined.

50
REFERENCES Aguiar RA, Savi MA and Pacheco PM (2013) Experimental investigation of vibration reduction using shape memory alloys. Journal od Bridge Engineering 15(1): 81-89.
Andrawes B, Shin M and Wierschem N (2010) Active confinement of reinforced concrete bridge columns using shape memory alloys. Journal of Bridge Engineering 15(1): 81–89.
Ball RPA and Camp C (2014) Keeping your cool—backfill grout placement around carrier pipes. In: Davidson G, Howard A, Jacobs L, et al. (eds) North American Tunneling: 2014 Proceedings. Englewood, CO: Society for Mining, Metallurgy, and Exploration, pp. 218–226.
Bitaraf M, Ozbulut OE, Hurlebaus S, Barroso L. (2010). Application of semi-active control strategies for seismic protection of buildings with MR dampers. Engineering Structures, 32, 3040-3047
Cai W, Zhang CS, Zhao LC. (1994) Recovery stress of Ni-Ti-Nb wide-hysteresis shape memory alloy under constant strain and thermomechanical cycling. J Mater Sci Lett 13:8-9.
Choi E, Chung YS, Kim YW, et al. (2011) Monotonic and cyclic bond behavior of confined concrete using NiTiNb SMA wires. Smart Materials and Structures 20(7): 075016.
Choi E, Chung Y-S, Choi J-H, Kim H-T, Lee H (2010) The confining effectiveness of NiTiNb and NiTi SMA wire jackets for concrete. Smart Mater Struct 19(3):035024
Chu TC, Ranson WF, Sutton MA, Peters WH (1985) Applications of digital-image-correlation techniques to experimental mechanics. Exp Mech 25(3):232–244
Daghash S, Ozbulut OE and Sherif M (2014) Shape memory alloy cables for civil infrastructure systems. In: Proceedings of the ASME 2014 smart materials, adaptive structures and intelligent systems, Newport, RI, 8–10 September, pp. V001T01A017. New York: ASME.
Daly S, Ravichandran G, Bhattacharya K (2007) Stress-induced martensitic phase transformation in thin sheets of Nitinol. Acta Mater 55(10):3593–3600
DesRoches R, McCormick J, Delemont M (2004) Cyclic properties of superelastic shape memory alloy wires and bars. Journal of Structural Engineering 130(1): 38-46.

51
Dolce M., Cardone D. (2001) Mechanical behaviour of shape memory alloys for seismic applications 2. Austenite NiTi wires subjected to tension. International Journal of Mechanical Sciences 43: 2657-2677.
Duerig T, Melton K (1989) Wide hysteresis NiTiNb alloys. In: European Symposium on Martensitic Transformations: EDP Sciences, p. 191–198
Dwairi HM, Wagner MC, Kowalsky, et al. (2010) Behavior of instrumented prestressed high performance concrete bridge girders. Construction and Building Materials 24(11): 2294–2311.
El-Tawil S and Ortega-Rosales J (2004) Prestressing concrete using shape memory alloy tendons. ACI Structural Journal 101(6): 846–851.
Evans JO, Bollmann HT (2000) Detensioning an external prestressing tendon. Paper, Florida Department of Transportation, Tallahassee, Florida.
Hao SJ, Cui LS, Wang YD, Jiang DQ, Yu C, Jiang J et al (2011) The ultrahigh mechanical energy-absorption capability evidenced in a high-strength NbTi/NiTi nanocomposite. Appl Phys Lett 99:024102
Hao S, Cui L, Jiang D, Han X, Ren Y, Jiang J et al (2013) A transforming metal nanocomposite with large elastic strain, low modulus, and high strength. Science 339:1191–1194
Hamilton RF, Dilibal S, Sehitoglu H, Maier HJ (2011) Underlying mechanism of dual hysteresis in NiMnGa single crystals. Mater Sci Eng A 528(3):1877–1881
Hamilton RF, Sehitoglu H, Aslantas K, Efstathiou C, Maier HJ (2008) Inter-martensite strain evolution in NiMnGa single crystals. Acta Mater 56(10):2231–2236
Hamilton RF, Sehitoglu H, Chumlyakov Y, Maier HJ (2004) Stress dependence of the hysteresis in single crystal NiTi alloys. Acta Mater 52:3383–3402
Kim HY, Jinguu T (2011) Nam T-h, Miyazaki S. Cold workability and shape memory properties of novel Ti–Ni–Hf–Nb hightemperature shape memory alloys. Scripta Mater 65:846–849
Kusagawa M, Nakamura T, Asada Y (2001) Fundamental deformation and recovery behaviors of Ni-Ti-Nb shape memory alloy. JSME Int J A 44:57–63
Lanba A, Hamilton R (2004) Elastic and irreversible energies of a two-stage martensitic transformation in NiTi utilizing calorimetric measurements. Metall Mater Trans A 45:2732–2740

52
Lin HC, Wu SK, Chou TS, Kao HP (1991) The effects of cold rolling on the martensitic transformation of an equiatomic TiNi alloy. Acta Metall Mater 39:2069–2080
Liu Y, Favier D (2000) Stabilisation of martensite due to shear deformation via variant reorientation in polycrystalline NiTi. Acta Mater 48:3489–3499
Liu Y, Galvin SP (1997) Criteria for pseudoelasticity in nearequiatomic NiTi shape memory alloys. Acta Mater 45:4431–4439
Liu Y, Liu Y, Van Humbeeck J (1998) Two-way shape memory effect developed by martensite deformation in NiTi. Acta Mater 47:199–209
Liu Z, Cui L, Liu Y, Jiang D, Jiang J, Shi X et al (2014) Influence of internal stress coupling on the deformation behavior of NiTi–Nb nanowire composites. Scripta Mater 77:75–78
Li L, Li Q and Zhang F (2007) Behavior of smart concrete beams with embedded shape memory alloy bundles. Journal of Intelligent Material Systems and Structures 18(10): 1003–1014.
Maji A and Negret I (1998) Smart prestressing with shapememory alloy. Journal of Engineering Mechanics 124(10): 1121–1128.
McGavin G, Guerin G (2002) Real-time seismic damping and frequency control of steel structures using Nitinol wire. Proceeding SPIE 4696: 176-185.
Melton K, Proft J, Duerig T (1988) Wide hysteresis shape memory alloys based on the Ni–Ti–Nb system. In: Proceedings of the MRS International Meeting on Advanced Materials, p. 165–170
Otsuka K, Wayman CM (1998) Shape memory materials. Cambridge University Press, Cambridge.
Ozbulut OE, Hurlebaus S, Desroches R (2011a) Seismic response control using shape memory alloys: a review, Journal of Intelligent Materials and Structures 22(14): 1531-1549.
Ozbulut OE, Bitaraf M, Hurlebaus S (2011b). Adaptive control of base-isolated structures against near-field earthquakes using variable friction dampers. Engineering Structures, 33, 3143-3154
Ozbulut, OE, Hurlebaus S. (2011c). Re-centering variable friction device for vibration control of structures subjected to near-field earthquakes. Mechanical Systems and Signal Processing, 25, 2849-2862
53
Ozbulut OE, Hurlebaus S. (2011d). Energy-balance assessment of shape memory alloy-based seismic isolation devices. Smart Structures and Systems, 8, 399-412
Ozbulut OE., Hurlebaus S. (2011e). Optimal design of superelastic-friction base isolators for seismic protection of highway bridges against near-field earthquakes. Earthquake Engineering & Structural Dynamics, 40, 273-291
Ozbulut OE, Hurlebaus S (2011f). Seismic assessment of bridge structures isolated by a shape memory alloy/rubber-based isolation system. Smart Materials and Structures, 20, 015003, 1-12
Pal NR, Pal SK. (1993) A review on image segmentation techniques. Pattern Recognition, 26: 1277-1294.
Piao M, Miyazaki S, Otsuka K (1992) Characteristics of deformation and transformation in Ti44Ni47Nb9 shape memory alloy. Mater Trans JIM 33(4):346–353
Piao M, Miyazaki S, Otsuka K, Nishida N (1992) Effects of Nb addition on the microstructure of Ti–Ni alloys. Mater Trans JIM 33:337–345
Piao M, Otsuka K, Miyazaki S, Horikawa H (1993) Mechanism of the As temperature increase by pre deformation in thermoelastic alloys. Mater Trans JIM 34:919–929
Prima SB, Tret’yachenko LA, Petyukh VM (1996) Phase relations in the Ti-TiNi-NbNi-Nb region of the ternary system Ti-NbNi. Powder Metall Met Ceram 34:155–160
Reedlunn B, Daly S and Shaw J (2013) Superelastic shape memory alloy cables: part II—subcomponent isothermal responses. International Journal of Solids and Structures 50(20): 3027–3044.
Sahoo PK, Soltani S, Wong AKC (1988) A survey of thresholding techniques. Computer Vision, Graphics, and Image Processing 41: 233-60.
Saiidi SM, Wang H (2006) Exploratory study of seismic response of concrete columns with shape memory alloys reinforcement. ACI Structural Journal 103(3): 435-442.
Speicher MS, DesRoches R, and Leon RT (2011) Experimental results of a NiTi shape memory alloy (SMA)-based recentering beam-column connection Engineering Structures, 33, 9, 2011,2448-2457.
Salzbrenner RJ, Cohen M (1979) On the thermodynamics of thermoelastic martensitic transformations. Acta Metall 27:739–748

54
Sawaguchi T, Kikuchi T, Ogawa K, et al. (2006) Development of prestressed concrete using Fe-Mn-Si-based shape memory alloys containing NbC. Materials Transactions JIM 47(3): 580–583.
Schryvers D, Shi H, Martinez GT, Van Aert S, Frenzel J, Van Humbeeck J (2013) Nano-and microcrystal investigations of precipitates, interfaces and strain fields in Ni-Ti-Nb by various TEM techniques. Materials Science Forum, Trans Tech Publ, Zu ¨rich, pp 65–71
Sherif M, Ozbulut O, Lanba A, Hamilton RF (2014) Self-posttensioning for concrete beams using shape memory alloys. In: ASME 2014 conference on smart materials, adaptive structures and intelligent systems: American Society of Mechanical Engineers, p. V002T04A14–VT04A14
Shi H, Frenzel J, Martinez GT, Van Rompaey S, Bakulin A, Kulkova S et al (2014) Site occupation of Nb atoms in ternary Ni–Ti–Nb shape memory alloys. Acta Mater 74:85–95
Shi H, Frenzel J, Schryvers D (2013) EM, characterization of precipitates in as-cast and annealed Ni45.5Ti45.5Nb9 shape memory alloys. Mater Sci Forum 738–739:113–117
Shi H, Pourbabak S, Van Humbeeck J, Schryvers D (2012) Electron microscopy study of Nb-rich nanoprecipitates in Ni–Ti–Nb and their influence on the martensitic transformation. Scripta Mater 67:939–942
Shook DA, Roschke PN, Ozbulut, OE (2008). Superelastic semi-active damping of a base-isolated structure. Structural Control & Health Monitoring, 15, 746-768
Siegert W, Neuking K, Mertmann M, Eggeler GF (2002) Influence of Nb content and processing conditions on microstructure and functional properties of NiTiNb shape-memory alloys. Mater Sci Forum 394–395:361–364
Speicher MS, DesRoches R, Leon RT (2011) Experimental results of a NiTi shape memory alloy (SMA)-based reentering beam-column connection. Engineering Structures 33(9): 2448-2457.
Sutton MA, Walters WJ, Peters WH, Ranson WF, Mcneil SR (1983) Determination of displacements using an improved digital correlation method. Image Vis Comput 1(3):133–139
Sutton M, Mingqi C, Peters W, Chao Y, McNeill S (1986) Application of an optimized digital correlation method to planar deformation analysis. Image Vis Comput 4(3):143–150
Tong YX, Jiang PC, Chen F, Tian B, Li L, Zheng YF et al (2014) Microstructure and martensitic transformation of an ultrafinegrained TiNiNb shape memory alloy processed by equal channel angular pressing. Intermetallics 49:81–86

55
Tosetti JP, da Silva GA, Otubo J (2014) Microstructure evolution during fabrication of Ni-Ti Nb SMA wires. Materials Science Forum, Trans Tech Publ, Zu ¨rich, pp 534–537
Wang EM, Hong QH, Ni ZM, Han J (2014) Influence of processing state on recovery stress in NiTiNb shape memory alloy. Adv Mater Res 875:1525–1528
Wang M, Jiang M, Liao G, Guo S, Zhao X (2012) Martensitic transformation involved mechanical behaviors and wide hysteresis of NiTiNb shape memory alloys. Prog Nat Sci 22:130–138
Watanabe K, Tadokoro T and Tanimura Y (2013) Strengthening of prestressed concrete girders having sheath partially filled with grout. In: Third international conference on sustainable construction materials and technologies, Kyoto, Japan, 19–21 August.
Xiao F, Ma G, Zhao X, Xu H, Jiang H, Rong L (2007) A novel TiNiNb shape memory alloy with high yield strength and high damping capacity, p. 64232L-L-6
Yan Y, Jin W, Li XW (2012) Texture development in the Ni47Ti44Nb9 shape memory alloy during successive thermomechanical processing and its effect on shape memory and mechanical properties. Metall Mater Trans A 44:978–989
Ying C, Hai-chang J, Li-jian R, Li X, Xin-qing Z (2011) Mechanical behavior in NiTiNb shape memory alloys with low Nb content. Intermetallics 19:217–220
Yin X, Mi X, Li Y, Gao B (2012) Microstructure and properties of deformation processed polycrystalline Ni47Ti44Nb9 Shape memory alloy. J Mater Eng Perform 21:2684–2690
Yuyama S, Yokoyama K, Niitani K, Ohtsu M, Uomoto T. (2007). Detection and evaluation of failures in high-strength tendon of prestressed concrete bridges by acoustic emission. Construction and Building Materials, 21(3), 491-500.
Zhang C, Wang Y, Chai W, Zhao L (1991) The study of constitutional phases in a Ni47Ti44Nb9shape memory alloy. Mater Chem Phys 28:43–50
Zhang CS, Zhao LC, Duerig TW, et al. (1990) Effects of deformation on the transformation hysteresis and shape memory effect in a Ni47Ti44Nb9 alloy. Scripta Metallurgica et Materialia 24: 1807–1812.
Zheng Y, Cai W, Luo Y, Zhao L (1997) Effects of heat treatment on tensile properties and shape memory effects of Ni-Ti-Nb alloy. Trans Nonferrous Met Soc China 7(4):92–96
Zhao LC (2000) Study of Ti-Ni-Nb shape memory alloys with a wide hysteresis. Materials Science Forum 327–328: 23–30.

56
Zhao L, Duerig T, Justi S, Melton K, Proft J, Yu W et al (1990) The study of niobium-rich precipitates in a Ni-Ti-Nb shape memory alloy. Scr Metall Mater 24:221–225
Zhao X, Yan X, Yang Y, Xu H (2006) Wide hysteresis NiTi(Nb) shape memory alloys with low Nb content (4.5at.%). Mater Sci Eng A 438–440:575–578