Smart City Use Cases and Requirementsict-citypulse.eu/page/sites/default/files/citypulse_d2.1... ·...
37
D2.1 Smart City Use Cases and Requirements– Dissemination Level: Confidential Page 1 GRANT AGREEMENT No 609035 FP7-SMARTCITIES-2013 Real-Time IoT Stream Processing and Large-scale Data Analytics for Smart City Applications Collaborative Project Smart City Use Cases and Requirements Document Ref. D2.1 Document Type Report (including excel sheet annex and website) Workpackage WP2 Lead Contractor AI Author(s) Mirko Presser, Lasse Vestergaard, Sorin Ganea Contributing Partners ERIC, NUIG, SIE, UASO, UNIS, WSU Planned Delivery Date M08 Actual Delivery Date M08 Dissemination Level Confidential Status In Progress Version V1.0 Reviewed by SIE
Transcript of Smart City Use Cases and Requirementsict-citypulse.eu/page/sites/default/files/citypulse_d2.1... ·...

D2.1 Smart City Use Cases and Requirements– Dissemination Level: Confidential Page 1
GRANT AGREEMENT No 609035 FP7-SMARTCITIES-2013
Real-Time IoT Stream Processing and Large-scale Data Analytics for Smart City Applications
Collaborative Project
Smart City Use Cases and Requirements
Document Ref. D2.1
Document Type Report (including excel sheet annex and website)
Workpackage WP2
Lead Contractor AI
Author(s) Mirko Presser, Lasse Vestergaard, Sorin Ganea
Contributing Partners ERIC, NUIG, SIE, UASO, UNIS, WSU
Planned Delivery Date M08
Actual Delivery Date M08
Dissemination Level Confidential
Status In Progress
Version V1.0
Reviewed by SIE

D2.1 Smart City Use Cases and Requirements– Dissemination Level: Confidential Page 2
Executive Summary This report provides with its ANNEX 101 Smart City scenarios, collected from three different sources literature, stakeholder need based and crowdsourcing. The target was surpassed and after combining and discarding scenarios the target of 101 was reached and provides a comprehensive list of smart city scenarios. Scenarios were described with a short title and a narrative as well as meta-‐data including sector, actor and data sources involved and several fictitious voices to make the scenarios feel more “alive”. The report also provides a method for evaluation of the scenarios based on five high level criteria each composed out of several specific criteria each encoding a requirement. The table below is the final metric for evaluation.
User diff. (1) City relevance (1) Data streaming (2)
Decision support (2)
Big data (2)
How strong is the expected impact in providing value (e.g. economical, social, etc.)?
Is the scenario culturally relevant?
Is the data accessible (pull/push/subscribe/broadcast)?
How complex is the scenario? (0=simple 3=med 5=high)
Is the data available?
What is the expected uptake?
Is the scenario relevant for citizens?
Is this scenario using a live stream? (Yes/No)
How many data modalities are used? (1=few 3=med 5=high)
Is the scenario scalable?
What is the expected attractiveness and usability?
Is the scenario generally applicable in other cities?
Is there capability in the network to deliver this data stream?
Are there control loops in the scenario? (Yes/No)
What level of privacy consideration does the scenario require?
Is the required data readily and available with the necessary quality and granularity?
Is the scenario relevant for municipalities?
Does the scenario require security (e.g. encryption)?
Is automation included in the scenario? (Yes/No)
Does the scenario increase public safety?
Does the scenario require reliability (e.g. data loss)?
Is actuation included in the scenario? (0=no 3=simple 5=complex)
All of the scenarios are made available online (http://www.ict-‐citypulse.eu/scenarios) and the above metric is available as an online questionnaire for the wider community to rank the scenarios. To speed up the process of down-‐selecting the scenarios to a more manage 21, the project has made an initial selection of 10 scenarios that will later be complemented by 11 additional top ranked scenarios. The table below shows the initial 10 selected scenarios.

D2.1 Smart City Use Cases and Requirements– Dissemination Level: Confidential Page 3
ID A short title
2 Public parking space availability prediction 25 Real time 3D maps 21 Interconnectivity of GIS systems in the Brasov Municipality 27 Vote a lamppost 29 Open Data Toolkit 1 Context-‐aware multimodal real time travel planner 10 Air pollution countermeasures (City authority perspective) 3 Stimulating green behavior 19 “What is my route?” Mobility management 20 Efficient public transport The scenarios provide a representative, yet realistic challenge to the CityPulse project. The figure below provides the evaluation of the 10 scenarios based on the metric defined by the project. Through the encoded requirements in this evaluation the project is ensured to develop a representative approach to the implementation activities.
0"
0.5"
1"
1.5"
2"
2.5"
3"
3.5"
4"
4.5"
5"User"differen1a1on"
City"relevance"
Data"streaming"Decision"support"
Big"data"
Scenario"1"
Scenario"2"
Scenario"3"
Scenario"10"
Scenario"19"
Scenario"20"
Scenario"21"
Scenario"25"
Scenario"27"
Scenario"29"

D2.1 Smart City Use Cases and Requirements– Dissemination Level: Confidential Page 4
Finally, this report also discusses at an early stage the privacy implications of the different scenario. A list of concerns is given in the table below. ID Scenario title Potential privacy issues
9 Air pollution countermeasures (Citizen perspective)
Potential location tracking
13 Pollution monitoring Personal behavior monitoring; energy consumption tracking 19 What is my route? Potential location tracking 27 Vote a lamppost Potential location tracking; personal behavior monitoring
41 Smart Fit Navigation Potential location tracking; personal data concerning health (special category of personal data, according to the EU law)
48 Smart commuting Potential location tracking
51 Dynamic routing of vehicles Potential location tracking; personal behavior monitoring
52 Save energy with friends Personal behavior monitoring; energy consumption tracking
58 Intelligent public transport Potential location tracking
59 Mobile payment Potential location tracking
74 Personal emergency response Potential location tracking; personal behavior monitoring
75 Social car parking Potential location tracking
80 Continuous care Personal data concerning health (special category of personal data, according to the EU law)

D2.1 Smart City Use Cases and Requirements– Dissemination Level: Confidential Page 5
Contents 1. Introduction ................................................................................................................................... 8
2. Methodology .................................................................................................................................. 9
2.1 Scenario Collection ................................................................................................................... 9
2.1.1 Stakeholder Need Based .................................................................................................... 10 2.1.2 Projects and Literature ........................................................................................................ 10 2.1.3 Crowdsourcing .................................................................................................................... 12
2.2 Selection Criteria, Metrics and Requirement Analysis ........................................................... 15
2.2.1 Raw Selection Criteria ..................................................................................................... 15 2.2.2 Quantitative metric for CityPulse consortium ................................................................... 18 2.2.3 Apply metric on an Example scenario ............................................................................. 19 2.2.4 Quantitative metric for city stakeholder group ................................................................. 20
3. 101 Scenarios ............................................................................................................................... 22
3.1 Scenario .................................................................................................................................. 22
3.1.1 List of Scenarios .............................................................................................................. 22 3.1.2 Scenario Meta Data ......................................................................................................... 25 3.1.3 Scenario Visualisation ..................................................................................................... 25
3.2 Scenario Statistics .................................................................................................................. 28
4. 21 Scenarios ................................................................................................................................. 30
4.1 Selected Scenarios ................................................................................................................. 30 4.1.1 Project Partner Selection ................................................................................................ 30 4.1.2 City Stakeholders and Wider Community ....................................................................... 30
4.2 Analysis of Scenarios .............................................................................................................. 30 4.2.1 Analysis of Project Partner Selected Scenarios .............................................................. 30 4.2.2 Analysis of Scenarios from the wider community ............................................................ 31
5. Continued analysis of the scenarios by the public ....................................................................... 32
5.1 Online Evaluation ................................................................................................................... 32
5.2 Plan for wider community involvement ................................................................................. 33
6. Privacy analysis ............................................................................................................................. 34
7. References .................................................................................................................................... 37
D2.1 Smart City Use Cases and Requirements– Dissemination Level: Confidential Page 6
Figures Figure 1: Scenario Collection and Selection Methodology .................................................................... 9 Figure 2 a) and b): Images from Stockholm workshop ........................................................................ 10 Figure 3: Citizen Design Competition .................................................................................................. 13 Figure 4: myTown concept .................................................................................................................. 14 Figure 5: myTown user interface mock-‐up .......................................................................................... 15 Figure 6: Selection criteria, metrics and requirement analysis ........................................................... 15 Figure 7: Wide-‐angle image of the 3D world ....................................................................................... 26 Figure 8: Example of the online scenarios – screenshot of visuals and voices .................................... 27 Figure 9: Example of the online scenarios – screenshot of narrative and meta-‐data ......................... 27 Figure 10: 101 Scenario statistics by sector ......................................................................................... 28 Figure 11: 101 Scenario statistics by Actor .......................................................................................... 29 Figure 12: 101 Scenario statistics by Data Sources .............................................................................. 29 Figure 13: Scenario Requirement Evaluation by Category .................................................................. 31 Figure 14: Online evaluation form -‐ prototype .................................................................................... 32 Figure 15: Online diagram providing feedback and ranking -‐ prototype ............................................. 32 Figure 16: Scenarios affected by privacy issues ................................................................................... 34 Figure 17: Distribution of scenarios according to the concerned personal data ................................. 35

D2.1 Smart City Use Cases and Requirements– Dissemination Level: Confidential Page 7
Tables Table 1: Stakeholder Need based scenario collection meetings ......................................................... 10 Table 2: Selection Categories ............................................................................................................... 16 Table 3: Selection Category: User Differentiation ............................................................................... 16 Table 4: Selection Category: Data Stream ........................................................................................... 17 Table 5: Selection Category: Decision Support .................................................................................... 17 Table 6: Selection Category: City Relevance ........................................................................................ 18 Table 7: Selection Category: Big Data .................................................................................................. 18 Table 8: Selection Criteria and Requirements ..................................................................................... 19 Table 9: Example evaluation ................................................................................................................ 20 Table 10: City Stakeholder Evaluation Metric ...................................................................................... 21 Table 11: List of 101 Scenarios ............................................................................................................ 22 Table 12: Meta-‐Data of the scenarios ................................................................................................. 25 Table 13: Example of Meta-‐Data for Scenario 1 .................................................................................. 25 Table 14: Partner selected scenarios (10 out of 21) ............................................................................ 30 Table 15: Requirement Matrix of the project partner selected scenarios .......................................... 31 Table 16: Evaluation Targets ................................................................................................................ 33 Table 17: Scenarios with “hidden” privacy concerns ........................................................................... 35

D2.1 Smart City Use Cases and Requirements– Dissemination Level: Confidential Page 8
1. Introduction This report provides the Smart City use case portfolio and requirements that were collected by the project. The report in conjunction with the ANNEX and online presence provides the results for Activity 2.1 of the CityPulse project.
Activity 2.1 identified as such 101 smart city scenarios and related use cases in cooperation with partner cities and city cooperation (City Stakeholder Group) and derived a set of requirements for a smart city framework based on proposed use cases, references in the field and “on site” workshops together with city partners. The requirements are encoded in an evaluation metric that has been made available online for the wider community to rank the 101 scenarios. To speed up the process of developing smart city application examples, the project partners already selected 10 scenarios for further evaluation by the other work packages and specifically WP6 for implementation.
The report is structured as follows:
Section 2 focuses on the methodology for the scenario collection and selection process, including the metric and requirement analysis.
Section 3 list the 101 scenarios that were collected and provides information about the structuring and meta data as well as the online visualisation of the scenarios.
Section 4 currently only provides information about the project internally 10 selected scenarios and evaluation. This will be later (expected M12) accompanied by the evaluation of the scenarios by the wider community and selection of an additional 11 scenarios.
Section 5 focuses on the online evaluation method for the scenarios.
Section 6 gives insights into the privacy concerns regarding the 101 scenarios and initiates the discussion on the topic by highlighting concerns at an early stage.
Section 7 provides the references for this report.
D2.1 Smart City Use Cases and Requirements– Dissemination Level: Confidential Page 9
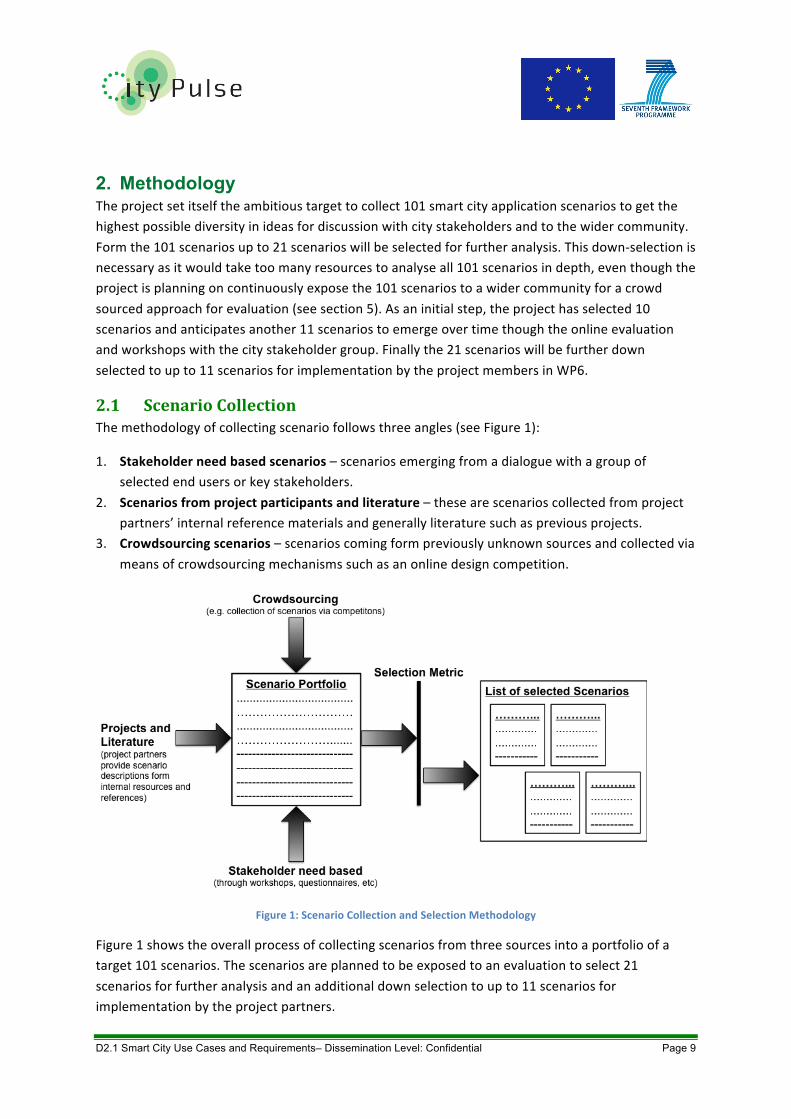
2. Methodology The project set itself the ambitious target to collect 101 smart city application scenarios to get the highest possible diversity in ideas for discussion with city stakeholders and to the wider community. Form the 101 scenarios up to 21 scenarios will be selected for further analysis. This down-‐selection is necessary as it would take too many resources to analyse all 101 scenarios in depth, even though the project is planning on continuously expose the 101 scenarios to a wider community for a crowd sourced approach for evaluation (see section 5). As an initial step, the project has selected 10 scenarios and anticipates another 11 scenarios to emerge over time though the online evaluation and workshops with the city stakeholder group. Finally the 21 scenarios will be further down selected to up to 11 scenarios for implementation by the project members in WP6.
2.1 Scenario Collection The methodology of collecting scenario follows three angles (see Figure 1):
1. Stakeholder need based scenarios – scenarios emerging from a dialogue with a group of selected end users or key stakeholders.
2. Scenarios from project participants and literature – these are scenarios collected from project partners’ internal reference materials and generally literature such as previous projects.
3. Crowdsourcing scenarios – scenarios coming form previously unknown sources and collected via means of crowdsourcing mechanisms such as an online design competition.
Figure 1: Scenario Collection and Selection Methodology
Figure 1 shows the overall process of collecting scenarios from three sources into a portfolio of a target 101 scenarios. The scenarios are planned to be exposed to an evaluation to select 21 scenarios for further analysis and an additional down selection to up to 11 scenarios for implementation by the project partners.

D2.1 Smart City Use Cases and Requirements– Dissemination Level: Confidential Page 10
2.1.1 Stakeholder Need Based The stakeholder need based scenarios were collected in a series of workshops with members of the City Stakeholder Group (CSG). Ericsson hosted the first workshop of this series in Stockholm and participants from Linköping, Stockholm Royal Seaport as well as Brasov joined. In addition, smaller workshops were organised by the project members, a full list can be found below.
Collecting scenarios from city stakeholders is a key activity to building a relevant portfolio. It is only through the engagement with the stakeholders that real needs can be identified and innovative scenarios developed.
In total the workshops resulted in over 60 relevant scenarios.
Table 1: Stakeholder Need based scenario collection meetings
ID Date Location Participants 1 24/09/2013 Brasov Siemens, Brasov Metropolitan Agency, The Environment
Agency of Brasov County 2 17/10/2013 Brasov Siemens, Brasov Metropolitan Agency, Brasov City Hall 3 22/10/2013 Stockholm CSG and project partners 4 22/11/2013 Aarhus Alexandra Institute and Aarhus Municipality 5 10/12/2013 Aarhus Alexandra Institute and Aarhus Municipality 6 18/12/2013 Vienna CSG, City of Vienna – MA 18, ASCR Vienna, Siemens AG
Austria, INSIGHT Galway, University of Surrey 7 21/03/2014 Brasov Siemens, Brasov Metropolitan Agency, Brasov City Hall 8 09/04/2014 Aarhus Alexandra Institute, CISCO, Aarhus University and Aarhus
Municipality
Figure 2 a) and b): Images from Stockholm workshop
2.1.2 Projects and Literature The project consortium analysed several projects and the literature for relevant smart city scenarios. One of the best sources was the FP7 IoT-‐i coordination action [1], which processed already over 150 different scenarios from several projects:
FP7 FI-‐PPP OUTSMART contributed to the Future Internet (FI) by aiming at the development of five innovation ecosystems. These ecosystems facilitated the creation of a large variety of pilot services and technologies that contribute to optimised supply and access to services and resources in urban
D2.1 Smart City Use Cases and Requirements– Dissemination Level: Confidential Page 11
areas. This contributed to more sustainable utility provision and, through increased efficiency, lowers strain on resources and on the environment. Reaching this goal required the whole value chain, namely city authorities, utilities operators, ICT companies as well as knowledge institutions in order to have an industry-‐driven approach when developing advanced services and technologies [2]. FP7 ICT IoT-‐A has addressed for three years the Internet-‐of-‐Things Architecture, and created the proposed architectural reference model together with the definition of an initial set of key building blocks. Together they are envisioned as foundations for fostering the emerging Internet of Things. Using an experimental paradigm, IoT-‐A combined top-‐down reasoning about architectural principles and design guidelines with simulation and prototyping in exploring the technical consequences of architectural design choices [3]. FP7 ICT SmartSantander proposed a unique in the world city-‐scale experimental research facility in support of typical applications and services for a smart city. This unique experimental facility is sufficiently large, open and flexible to enable horizontal and vertical federation with other experimental facilities and stimulates development of new applications by users of various types including experimental advanced research on IoT technologies and realistic assessment of users’ acceptability tests. The project deployed 20,000 sensors in Belgrade, Guildford, Lübeck and Santander (12,000), exploiting a large variety of technologies [4]. FP7 ICT SENSEI -‐ In order to realise the vision of Ambient Intelligence in a future network and service environment, heterogeneous wireless sensor and actuator networks (WS&AN) have to be integrated into a common framework of global scale and made available to services and applications via universal service interfaces. SENSEI creates an open, business driven architecture that fundamentally addresses the scalability problems for a large number of globally distributed WS&A devices. It provides necessary network and information management services to enable reliable and accurate context information retrieval and interaction with the physical environment. By adding mechanisms for accounting, security, privacy and trust it enables an open and secure market space for context-‐awareness and real world interaction [5]. FP6 IST e-‐SENSE -‐ Ambient Intelligence is a key component for future beyond 3G mobile and wireless communication systems. However, the enabling technology that provides systems with information to allow for Ambient Intelligence has been neglected and currently consists of many independent modes of input, mainly relying on active user interactions or specialised sensor systems gathering information. e-‐SENSE proposes a context capturing framework that enables the convergence of many input modalities, mainly focusing on energy efficient wireless sensor networks that are multi-‐sensory in their composition, heterogeneous in their networking, either mobile or integrated in the environment e.g. from single sensors to thousands or millions of sensors collecting information about the environment, a person or an object. This framework will be able to supply ambient intelligent systems with information in a transparent way hiding underlying technologies thus enabling simple integration [6]. FP7 ICT EXALTED -‐ The primary focus of EXALTED is to layout the foundations of a new scalable network architecture supporting most challenging requirements for future wireless communication systems, whilst providing secure, energy-‐efficient and cost-‐effective Machine-‐to-‐Machine (M2M) communications for low-‐end devices. From EXALTED point of view, M2M communications between capillary networks will be supported by a new LTE-‐M backbone, which will be a 3GPP Release 8 compatible extension of LTE. The LTE-‐M extension aims to fulfil the specific energy, spectrum, cost,

D2.1 Smart City Use Cases and Requirements– Dissemination Level: Confidential Page 12
efficiency constraints of M2M communications, whilst not hindering current LTE devices to operate normally on the LTE network [7]. FP7 ICT LOLA -‐ The focus of LOLA is on access-‐layer technologies targeting low-‐latency robust and spectrally-‐efficient transmission in a set of emerging application scenarios. We consider two basic types of wireless networks, namely long-‐range LTE-‐Advanced Cellular Networks and medium-‐range rapidly-‐deployable mesh networks. Research on low-‐latency transmission in cellular networks is focused firstly on transmission technologies in support of gaming services, which will undoubtedly prove to be a strategic revenue area for operators in the years to come. Secondly, we also consider machine-‐to machine (M2M) applications in mobile environments using sensors connected to public infrastructure (in trains, busses, train stations, utility metering, etc.). M2M is an application area of extremely high growth potential in the context of future LTE-‐Advanced networks. A primary focus of the M2M research is to provide recommendations regarding PHY/MAC procedures in support of M2M to the 3GPP standardization process. The rapidly deployable mesh topology component addresses M2M applications such as remote control and personnel/fleet tracking envisaged for future broadband civil protection networks. This work builds upon on-‐going European research in this important area. Fundamental aspects of low-‐latency transmission are considered in addition to validation on real-‐time prototypes for s subset of the considered application scenarios. The cellular scenario validation is carried out using both live measurements from an HSPA test cell coupled with large-‐scale real-‐time emulation using the OpenAirInterface.org emulator for both high-‐performance gaming and M2M application. In addition, a validation test bed for low-‐layer (PHY/MAC) low latency procedures will be developed. The rapidly deployable wireless mesh scenario validation makes use of the real-‐time OpenAirInterface.org RF platform and the existing FP6 CHORIST demonstrator interconnected with commercial M2M equipment [8]. FP6 IST MIMOSA -‐ In the MIMOSA vision, the personal mobile phone is chosen as the trusted intelligent user interface to Ambient Intelligence and a gateway between the sensors, the network of sensors, the public network and the Internet. MIMOSA develops an open technology platform for implementing ambient intelligence in different application areas. The well-‐defined platform allows a fast and focused development of both basic technology solutions as well as system-‐level applications and services. MIMOSA focuses to develop micro-‐ and Nano systems in several areas of the MIMOSA open platform (indicated using framed boxes in the figure below). Examples of micro and Nano systems developments by MIMOSA are (Environment domain) wireless remote-‐powered and autonomous sensors exploiting RFID, low-‐power radios exploiting RFMEMS, (User domain) microsystem-‐based intuitive user interfaces, MEMS based user-‐activity and physiological sensors, (Phone domain) MEMS-‐based inertial, magnetic and audio sensors [9]. The original list that later lead to the IoT comic book [10] was analysed for relevant scenarios and 80 scenarios were selected for further down selection to the target 101 scenarios for CityPulse; this was done by combining scenarios that were similar in nature or were seen as outside the scope of smart cities.
2.1.3 Crowdsourcing The project set itself the ambitious goal of crowdsourcing application scenarios from the wider community. The full call text is available here:
http://www.ict-‐citypulse.eu/page/sites/default/files/fp7citypulsecitizendesigncompetition_en.pdf

D2.1 Smart City Use Cases and Requirements– Dissemination Level: Confidential Page 13
The text was publicised in the local media in Aarhus and Brasov as well as via the newsletters of several of the partners. And although we had significant interest both via email and at meetings (e.g. a Gatesense hackathon [11]) we only received one submission that by default also became the winner of the competition.
Figure 3: Citizen Design Competition
MyTown – competition winner
myTown is a map generator which uses live streamed data to generate a customised map according to user requirements.
In its purest form, the model reduces urban space to smaller gridded components. Local data from each component is then evaluated in comparison to all the other components within the urban grid, providing a cityscape of ranking of user chosen data streams to identify the locale most appropriate to the users requirements.

D2.1 Smart City Use Cases and Requirements– Dissemination Level: Confidential Page 14
Figure 4: myTown concept
The locator model offers users an accessible interface to a range of urban data and rates it most appropriately to individual needs.
Unlike similar devices employed by, among others, estate agents, myTown is integral to the process of identifying urban regions that best fit user requirements.
Data streams can be included or excluded where appropriate to the user, as can the scale of their influence. Typical examples include housing prices, council tax bands, crime levels, educational facilities, proximity to local services, retail etc. but the system utilised at an international or national level can provide guidance for travellers, indication of prime opportunities for international study or even locations for international business development.
The success of the system is in the ability to feedback and prioritise only the information that is relevant to the user. The data, its significance, scope, context are all user defined.

D2.1 Smart City Use Cases and Requirements– Dissemination Level: Confidential Page 15
Figure 5: myTown user interface mock-‐up
2.2 Selection Criteria, Metrics and Requirement Analysis In this section the selection criteria, metrics and requirement analysis are presented.
Figure 6: Selection criteria, metrics and requirement analysis
2.2.1 Raw Selection Criteria During a workshop in Vienna 16/12/2013 between the project participants, a set of criteria were developed that both encode a set of technical and user requirements as well as stakeholder needs and wants.
On the high level 5 categories were established:

D2.1 Smart City Use Cases and Requirements– Dissemination Level: Confidential Page 16
Table 2: Selection Categories
Category
Description
User differentiation
How much does the scenario impact the citizens/city both in relation to aesthetics, functionality, relevance and obstruction in daily life? Additionally, in what degree would the scenario be accepted into the society at large?
Data Stream
What is the quality of access to data in the specific scenario? This is in relation to frequency of data, speed of data transport, security, trustworthiness, etc.?
Decision Support
How well is the scenario fitted for making qualified decisions in response to the amount of information produced by the implementation of the scenario?
City Relevance
To what extend will the scenario affect the everyday life in the city (citizens and municipality) -‐ what is the level of providing answers to actual issues within the city?
Big Data
Will the scenario leverage existing data sources and/or provide access to new types of data? Furthermore, will the scenario be scalable in response to expanding demands from growing cities (both in relation to technical issues but also human issues like privacy)?
Each of these high level categories was established through a bottom up approach of investigating importance and relevance of selection criteria. The tables below provide the details of establishing the criteria. A set of weights was give (1-‐5) to establish the importance of certain criteria for the practicality of the project, as well as a set of quantifiable evaluation criteria.
Specifically the following selection criteria were weighted higher:
How many actors are involved? – A weight of 3 was given to this criterion, as the impact will be much higher if there are more users involved in the scenario.
What is the availability of relevant data for the use case? -‐ A weight of 4 was given to this criterion, as only scenario with available data can be realistically pursued by the project.
Is the scenario feasible? – A weight of 5 was given to this criterion, as similar to the previous criterion; the scenario has to be realistically feasible for further implementation.
Table 3: Selection Category: User Differentiation
Category
Selection Criteria Quantification Weight
User differentiation
What is the Economic and Social impact?
Estimate the number of users.
1
What is the direct usefulness/impact for the user?
Estimate the time/energy/CO2 saved.
1

D2.1 Smart City Use Cases and Requirements– Dissemination Level: Confidential Page 17
What is the cultural relevance? Qualitative scale 1-‐5 1 What is the benefit for the citizen? Uptake, success rate,
success factors, barriers
1
Is the use case intrusive? Qualitative scale 1-‐5 1 Does the use case provide feedback? Yes/No 1 How many actors are involved? Estimate the number
of users. 3
What is the diversity of the actors (Citizen, Public, Private)?
Qualitative scale 1-‐5 1
What is the availability of relevant data for the use case?
Qualitative scale 1-‐5 4
Table 4: Selection Category: Data Stream
Category
Selection Criteria Quantification Weight
Data Stream
Is the data used real-‐time? Yes/No 1 Is the data accessible? Yes/No 1 Is the network able to deliver the stream? Qualitative scale 1-‐5 1 How big is the data stream? Qualitative scale 1-‐5 1 What is the complexity of the data stream?
Qualitative scale 1-‐5 1
Is there a requirement on data security? Qualitative scale 1-‐5 1 What is the nature of the data stream? Low data rate to high
data rate (1-‐5) 1
How reliable is the data stream? Qualitative scale 1-‐5 1
Table 5: Selection Category: Decision Support
Category
Selection Criteria Quantification Weight
Decision Support
How complex is the overall system? Qualitative scale simple = 0, medium = 3 and complex = 5
1
How many sensor modalities are involved? Types: 0-‐5 rating 1 5-‐8 rating 2 8-‐10 rating 5 10-‐15 rating 4 15-‐20 rating 3
1
Are there any control loops? Yes/No 1 Is the use case automated? Yes/No 1 Is actuation included? Yes/No (complexity? 1

D2.1 Smart City Use Cases and Requirements– Dissemination Level: Confidential Page 18
Table 6: Selection Category: City Relevance
Category
Selection Criteria Quantification Weight
City Relevance
Does the scenario have cultural relevance? Qualitative scale 1-‐5 1
Is the scenario relevant for citizens? Qualitative scale 1-‐5 1
Is the scenario relevant for other cities than just one?
Qualitative scale 1-‐5 1
Do cities prioritise this scenario? Qualitative scale 1-‐5 1 Does the scenario increase public safety? Qualitative scale 1-‐5 1
Table 7: Selection Category: Big Data
Category
Selection Criteria Quantification Weight
Big Data
Are there several types of data involved? Few = 1, Many = 5. 1 Is the scenario feasible? 60% data availability,
25 % law issues, 15 % algorithm availability, if not available, them we cannot implement
5
Is the data available? Infrastructure and technical feasibility? As Open data?
1
Can we use citizen-‐generated data? Yes/No 1 Can the data be correlated with other sets?
Yes/No 1
Is privacy a concern? Yes/No 1 Does data need to be anonymised? Yes/No 1
2.2.2 Quantitative metric for CityPulse consortium The below table is the abbreviated metric for qualifying a scenario, and comparing it to others. The number in the category parenthesis is the category multiplier. Each category consists of three to five measurable. Each of the measurable points can be rated from 0 to 5. 0 is the lowest/least preferable and 5 is the highest/best.
Table 8: Selection Criteria and Requirements summarises the 5 high level categories and their respective criteria and weights as was decided by the consortium partners.

D2.1 Smart City Use Cases and Requirements– Dissemination Level: Confidential Page 19
Table 8: Selection Criteria and Requirements
User diff. (1)
City relevance (1) Data streaming (2)
Decision support (2)
Big data (2)
How strong is the expected impact in providing value (e.g. economical, social, etc.)?
Is the scenario culturally relevant?
Is the data accessible (pull/push/subscribe/broadcast)?
How complex is the scenario? (0=simple 3=med 5=high)
Is the data available?
What is the expected uptake?
Is the scenario relevant for citizens?
Is this scenario using a live stream? (Yes/No)
How many data modalities are used? (1=few 3=med 5=high)
Is the scenario scalable?
What is the expected attractiveness and usability?
Is the scenario generally applicable in other cities?
Is there capability in the network to deliver this data stream?
Are there control loops in the scenario? (Yes/No)
What level of privacy consideration does the scenario require?
Is the required data readily and available with the necessary quality and granularity?
Is the scenario relevant for municipalities?
Does the scenario require security (e.g. encryption)?
Is automation included in the scenario? (Yes/No)
Does the scenario increase public safety?
Does the scenario require reliability (e.g. data loss)?
Is actuation included in the scenario? (0=no 3=simple 5=complex)
For doing the actual rating of a scenario, use the following calculation:
𝑚𝑒𝑎𝑠𝑢𝑟𝑎𝑏𝑙𝑒! ∗ 𝑐𝑎𝑡𝑒𝑔𝑜𝑟𝑦 𝑚𝑢𝑙𝑡𝑖𝑝𝑙𝑖𝑒𝑟!
!
!!!
The resulting value from the calculation should be compared to the other scenarios, and the highest number results in the highest relevance for CityPulse. The rating value is relative to the other scenarios, and therefore the single calculated value doesn’t mean anything on it’s own.
2.2.3 Apply metric on an Example scenario In this section we apply the metric on the template scenario “vote a lamppost”. The result is shown in below table (the bold values, in the measurable text, are the ratings of the specific scenario).

D2.1 Smart City Use Cases and Requirements– Dissemination Level: Confidential Page 20
Table 9: Example evaluation
User diff. (1)
City relevance (1)
Data streaming (2)
Decision support (2)
Big data (2)
How strong is the expected impact in providing value in terms of economics, social, cultural etc. 4
Cultural relevance 5
Level of data accessibility (ex. push/pull, publish/subscribe, broadcast) 2
System complexity. Simple (0), medium (3), high (5) 3
Data availability 2
Level of uptake in general 3
Relevance for the citizens 4
Is this live stream (no=0, yes=5) 5
Sensor modality (types). 0-‐5 types = 1, 5-‐8 = 2, 8-‐10= 5, 10-‐15=4,15-‐20=3 3
Scalability (ex. of the system) 3
Expected attractiveness and usability 5
Relevance across cities (generic relevance) 2
Network capability for delivering real-‐time data 3
Control loops. Implemented (5), not implemented (0) 5
Privacy (accessibility, anonymity) 3
Relevant and timely availability of info at the right level of detail 5
Municipal relevance 2
Level of security (ex. encryption) 3
Automation (no=0, yes=5) 0
Increase in public safety 1
Reliability (how critical is data loss) 2
Inclusion of actuation. No (0), simple (3), complex (5) 3
The rating of the scenario is:
(1*4+1*3+1*5+1*5)+(1*5+1*4+1*2+1*2+1*1)+(2*2+2*5+2*3+2*3+2*2)+(2*3+2*3+2*5+2*0+2*3) +(2*2+2*3+2*3)=105
2.2.4 Quantitative metric for city stakeholder group We want to have two quantitative metrics for scenarios. This is because the one in the previous section is/can be very complex, and it is mostly relevant for the CityPulse project. Furthermore, we want to do scenario evaluation, and thereby be able to qualify a specific scenario from different perspectives, and we want to have a metric that is more understandable/easy to use for the city stakeholder group. Therefore we have simplified/shortened the original metric to only encapsulate the city relevance and user differentiation qualifications of a scenario.

D2.1 Smart City Use Cases and Requirements– Dissemination Level: Confidential Page 21
Table 10: City Stakeholder Evaluation Metric
User differentiation (1) City relevance (1) How strong is the expected impact in providing value (e.g. economical, social, etc.)?
Is the scenario culturally relevant?
What is the expected uptake? Is the scenario relevant for citizens? What is the expected attractiveness and usability?
Is the scenario generally applicable in other cities?
Is the required data readily and available with the necessary quality and granularity?
Is the scenario relevant for municipalities?
Does the scenario increase public safety?

D2.1 Smart City Use Cases and Requirements– Dissemination Level: Confidential Page 22
3. 101 Scenarios This section lists the 101 scenarios, including the description of the meta-‐data and additional information voices. The section also gives an overview of the type of scenarios that were collected based on the meta-‐data analysis.
The full list of the scenarios can be found online (http://www.ict-‐citypulse.eu/scenarios) or in the ANNEX to this report.
3.1 Scenario
3.1.1 List of Scenarios The table below lists all of the 101 scenarios.
Table 11: List of 101 Scenarios
ID Title 1 Context-‐aware multimodal real time travel planner 2 Public parking space availability prediction 3 Stimulating green behavior 4 Green urban ecosystem, micro planet 5 Urban crowd sourced collective micro agriculture 6 Energy performance of buildings 7 Efficient lighting 8 Operation center of everything 9 Air pollution countermeasures (Citizen perspective) 10 Air pollution countermeasures (City authority perspective) 11 Hazardous material transport accident 12 Water utility pipe leak management 13 Pollution monitoring 14 The green browser 15 Is Linköping CO2 neutral now? 16 Efficiency in delivering the “Pastry & Milk” program 17 Parking management through video surveillance 18 “I need to get to…” 19 “What is my route?” Mobility management 20 Efficient public transport 21 Interconnectivity of GIS systems in the Brasov Municipality 22 Improvement of GIS real time information through smartphone apps 23 Development of new GIS layers 24 Parking spaces real time management 25 Real time 3D maps 26 Made with Aarhus 27 Vote a lamppost 28 The Freemium Smart City 29 Open Data Toolkit 30 Managing household waste (City administrators)

D2.1 Smart City Use Cases and Requirements– Dissemination Level: Confidential Page 23
31 Improving cycling safety (City administrators) 32 Event and traffic management 33 Housing guide for new students 34 Crime map 35 Resource index 36 User satisfaction 37 Smart elderly care system 38 Pay it forward 39 Smart car parking system 40 Smart/green buildings 41 SmartFit navigation 42 Route planning for logistic companies 43 Energy efficient building 44 Impact of public utilities works 45 Reserve parking place for electronic vehicles 46 Optimizing bus departure, pull bus out into traffic 47 Shopping tour in Osnabrück 48 Smart commuting 49 Smart shopping platform 50 e-‐Neighborhood 51 Dynamic routing of vehicles in a city 52 Save energy with friends 53 Tourist grouping service 54 Smart metering data for planning and optimizing the low voltage grid 55 Intelligent commuter 1 56 Intelligent commuter 2 57 Autopilot 58 Intelligent public transport 59 Mobile payment 60 Smart parking 61 Smart rail network 62 Home Central Control 63 Green you 64 City Information Model 65 Commuter information model 66 Smart irrigation in the city 67 Smart waste management 68 Cultural information 69 Smart drums 70 Remote water network monitoring 71 Smart pallets 72 Smart events 73 Smart evacuation and robotic monitoring 74 Personal emergency response 75 Social Car Parking

D2.1 Smart City Use Cases and Requirements– Dissemination Level: Confidential Page 24
76 Emergency response corridor 77 Chronic disease 78 Aging population – Alzheimer’s disease 79 Support for depression 80 Continuous care 81 Smart sun protection 82 Aging population – home monitoring 83 Personal trainer 84 Automated social networking 85 Smart Running Track 86 Smart golf trainer 87 Mobile fitness application 88 Intelligent shopping application 89 Product information 90 Smart product management 91 Smart orchard 92 Smart herding 93 Digital DJ 94 M2M gaming 95 Digital museum 96 Interactive Street Sensing 97 Pollution monitoring 98 Sustainable urban planning 99 Green city 100 Wind farms 101 Mobile application for smart meters
Apart form the titles, each scenarios was described in a short narrative, such as for example scenario 1, Context-‐aware multimodal real time travel planner:
Narrative: A person needs to travel from A to B for whatever purpose (business, work commuting, leisure). Different means of transportation are generally available and include walking, biking (own, shared), moped/scooter (own, shared, electric/petrol), car (own, pooling, ride sharing, taxi/shared taxi), public transportation (bus, metro, commuter train, ferry/boat). Transportation can be optimized on a case-‐by-‐case basis according to preferred travel time, convenience (comfort, seating, crowdedness, safety, environmental quality like air, humidity, temperature in the metro), total cost, environmental impacts, scenic route or personal health. Factors that impact the optimization include conditions of the different transport modes (road, weather, maintenance works, traffic intensity, people density, parking availability, charging pole availability, current environmental conditions like pollution, air quality, etc., irregularities in traffic schedules, road tolls, seating availability, accidents, charging level of EV, availability of city bikes, ...). The ideal route and selection of each leg of the journey from A to B can be done based on concurrent as well as projected aggregated conditions, and recalculation of the proposed route(s) can happen if conditions or preferences change and will follow and adapt to any detour of own choice.

D2.1 Smart City Use Cases and Requirements– Dissemination Level: Confidential Page 25
The fill table is available as an excel sheet annex (CityPulse_101_Scenarios.v1.1.xlsx).
3.1.2 Scenario Meta Data Each scenario was analysed according to high-‐level meta-‐data. Including 3 voices, i.e. something that a stakeholder might say when asked about the scenario, high-‐level data sources, image features for visualisations and the high-‐level actors and sectors that are involved in the scenarios. The table below describes each of the meta-‐data.
Table 12: Meta-‐Data of the scenarios
Meta-‐Data Title Description Voice 1: Citizen How will private citizen experiences the scenario? Voice 2: Public How will a public organisation such as the city hall experiences the scenario? Voice 3: Private How will a private organisation experiences the scenario? Voice 4: Privacy Privacy concerns an actor might voice. Image Features What key words can be used to describe the narrative in images? This was
used to establish a set of images for the narratives. Data Sources What kind of data would be needed to realise the scenario? Actors Who participates directly to the scenario? Sector What sectors are involved?
As an example, scenario 1, Context-‐aware multimodal real time travel planner has the following meta-‐data:
Table 13: Example of Meta-‐Data for Scenario 1
Meta-‐Data Title Description Voice 1: Citizen (Citizen on a bike) This was so much easier than being stuck in traffic. Voice 2: Public (Municipality employee) We have reduced congestion by 20% as well as
carbon emissions. Voice 3: Private N/A Voice 4: Privacy My location is being tracked. Image Features Bus, train, bike, taxi, car, people Data Sources Transport, mobile Actors Public, citizen Sector Transport
3.1.3 Scenario Visualisation To make the 101 scenarios look more appealing and encourage city stakeholders and the wider community to engage with the project and specifically the evaluation of the scenarios, it was decided to visualise the scenarios.
To get a visual representation of each of the scenarios a 3D model of a city was created including image elements as described in the Meta-‐Data (Image Features). This allows for a large number of custom images to be created using a uniform graphical charter.

D2.1 Smart City Use Cases and Requirements– Dissemination Level: Confidential Page 26
The 3D world includes a large number of scenes, ranging from rural to industrial areas and features such as traffic, pedestrians, cyclists, a harbour, etc. Features were added according to needs with an overall backdrop creating the illusion of a functioning city.
All of the visualisation are currently available as a prototype online: http://www.ict-‐citypulse.eu/prototypes/testing/ and will be migrated for the public to http://www.ict-‐citypulse.eu/scenarios.
Figure 7: Wide-‐angle image of the 3D world
Each scenario was then allocated a specific location and angle in the city providing an image that had the relevant features included. The images were then setup to include the title and voices and a secondary description that includes the data sources, actors and sectors meta-‐data.

D2.1 Smart City Use Cases and Requirements– Dissemination Level: Confidential Page 27
Figure 8: Example of the online scenarios – screenshot of visuals and voices
Figure 9: Example of the online scenarios – screenshot of narrative and meta-‐data

D2.1 Smart City Use Cases and Requirements– Dissemination Level: Confidential Page 28
3.2 Scenario Statistics The below charts show the high level meta-‐data statistics of the scenarios by:
1. Sector – industry sectors including: Transport, Energy, Environment, Agriculture, Public Authority, Health and Retail.
2. Actor – including: Public Organisations, Private Organisations and Citizens. 3. Data Source – including: Transport, Mobile, Environment, Energy, Crowd and Health.
Figure 10: 101 Scenario statistics by sector
The sectors indicate a bias toward the key services of a city administration: transport, energy, environment and public services. Some additional scenarios from retail, health and agriculture are also present. Note that several of the scenarios that are contained under the “Public” category are cultural and related to entertainment and arts as well.
Transport)25%)
Energy)18%)
Environment)20%)
Agriculture)4%)
Public)29%)
Health)3%)
Retail)1%)
101#Scenarios#by#Sector#

D2.1 Smart City Use Cases and Requirements– Dissemination Level: Confidential Page 29
Figure 11: 101 Scenario statistics by Actor
Figure 11 shows that the scenarios are well balanced between the 3 main actors in the smart city.
Figure 12: 101 Scenario statistics by Data Sources
Figure 12 shows the overview of the data sources that the scenarios require. Generally this follows the same trend as the sectors and seems balanced. Significantly fewer scenarios require health data and only very few crow based data – possibly because crowd sourcing and sensing is still a relatively novel concept in cities.
Public'36%'
Private'24%'
Ci3zen'40%'
101#Scenarios#by#Actor#
Transport)23%)
Mobile)29%)
Environment)28%)
Energy)18%)
Crowd)1%) Health)
1%)
101#Scenarios#by#Data#Sources#

D2.1 Smart City Use Cases and Requirements– Dissemination Level: Confidential Page 30
4. 21 Scenarios The project decided to follow a down selection process of the 101 scenarios to limit the complexity of the analysis and implication this might have for the project. It was decided to select 21 scenarios using the metric defined in section 2.2. This should ensure a representative sample of scenarios to be further investigates while maintaining a relatively simple analysis process.
4.1 Selected Scenarios Rather than relying on a community of evaluators to select the scenarios for the project, the process of selecting was balanced (split 10/11) between the project partners and the wider community.
4.1.1 Project Partner Selection The initial selection of the scenarios was made by the project partners. Rather than waiting for a statistically significant enough sample of evaluators producing a meaningful assessment of the 101 scenarios using the defined metric, the project decided to speed the process up and select an initial 10 scenarios based on interest and knowledge gained from workshops with the project city stakeholders. The resulting selection is listed in the table below.
Table 14: Partner selected scenarios (10 out of 21)
ID A short title 2 Public parking space availability prediction 25 Real time 3D maps 21 Interconnectivity of GIS systems in the Brasov Municipality 27 Vote a lamppost 29 Open Data Toolkit 1 Context-‐aware multimodal real time travel planner 10 Air pollution countermeasures (City authority perspective) 3 Stimulating green behavior 19 “What is my route?” Mobility management 20 Efficient public transport
4.1.2 City Stakeholders and Wider Community [This section will be completed at a later stage in the project (expected before M12).]
4.2 Analysis of Scenarios This subsection contains the analysis of the selected scearnios.
4.2.1 Analysis of Project Partner Selected Scenarios The table below encodes the evaluation of the project partners selected scenarios using Table 8: Selection Criteria and Requirements. Each of the categories: User Differentiation, City Relevance, Data Streaming, Decision Support and Big Data as a subset of criteria that encode a requirement. The table below summarises this based on average inputs evaluated b the project partners. Figure 13 complements this graphically by visualising this.

D2.1 Smart City Use Cases and Requirements– Dissemination Level: Confidential Page 31
Table 15: Requirement Matrix of the project partner selected scenarios
ID User Differentiation
City Relevance Data Streaming Decision Support Big Data
1 2 3 4 1 2 3 4 5 1 2 3 4 5 1 2 3 4 5 1 2 3 1 5 4 4 4 4 5 5 5 2 3 5 4 4 4 5 5 5 5 0 4 4 4 2 3 4 4 3 3 4 4 4 2 3 5 4 3 4 3 3 5 5 3 4 4 4 3 4 4 4 4 4 4 4 4 3 2 5 4 4 1 5 5 5 0 0 5 5 0
10 4 4 4 4 4 4 4 4 5 2 5 4 4 1 5 5 5 0 3 5 5 5 19 4 3 3 4 3 4 2 4 4 3 5 3 2 3 3 2 5 0 0 3 4 4 20 4 4 3 4 1 4 0 4 2 4 5 2 3 2 3 3 0 0 3 4 3 3 21 3 2 3 3 3 2 4 4 1 3 5 2 5 4 3 3 0 0 0 4 1 4 25 4 3 4 5 4 3 3 4 1 5 5 5 2 3 3 5 0 0 0 4 4 1 27 3 3 4 4 4 4 4 4 2 3 0 0 3 3 3 3 5 5 5 2 4 4 29 5 4 4 5 4 5 5 5 2 4 5 3 5 3 5 5 5 5 5 3 5 5
Figure 13: Scenario Requirement Evaluation by Category
From the graph it can be noted that the scenarios selected y the project partners score in general high on the technical requirements (Big Data, Decision Support and Data Streaming) as well as on the user requirements (User Differentiation and City Relevance). This provides confidence that the initial selection will drive a representative development of the CityPulse project.
4.2.2 Analysis of Scenarios from the wider community [This section will be completed at a later stage in the project (expected before M12).]
0"
0.5"
1"
1.5"
2"
2.5"
3"
3.5"
4"
4.5"
5"User"differen1a1on"
City"relevance"
Data"streaming"Decision"support"
Big"data"
Scenario"1"
Scenario"2"
Scenario"3"
Scenario"10"
Scenario"19"
Scenario"20"
Scenario"21"
Scenario"25"
Scenario"27"
Scenario"29"

D2.1 Smart City Use Cases and Requirements– Dissemination Level: Confidential Page 32
5. Continued analysis of the scenarios by the public The online version of the scenarios has an evaluation questionnaire embedded that will be kept open for the duration of the project to continuously obtain feedback on the scenario selection.
5.1 Online Evaluation The online evaluation of the scenarios follows Table 8: Selection Criteria and Requirements and is implemented in a way that it provides feedback to the evaluator almost instantaneously.
The figures below show a screenshot of the version as it was available at the writing of this report (a prototype) – usability updates are expected.
Figure 14: Online evaluation form -‐ prototype
Figure 15: Online diagram providing feedback and ranking -‐ prototype

D2.1 Smart City Use Cases and Requirements– Dissemination Level: Confidential Page 33
5.2 Plan for wider community involvement The project is planning on engaging further with the City Stakeholder Group that was already mobilised in the process of collecting scenarios. This group will be used to evaluate the scenarios further using the online evaluation method described in the previous subsection.
The table below sets some ambitious targets to be fulfilled by M12 (August 2014).
Table 16: Evaluation Targets
Target title Target description Target Percentage of evaluated scenarios
The wider community will see not all scenarios as relevant so a target lower than 100% is realistic. However we aim for at least 60% of the scenarios being evaluated by more than 2 evaluators.
>60% by at least 2 evaluators.
Number of participants Anyone. 100 Number of cities Embodies as an employee
representing a city. 10

D2.1 Smart City Use Cases and Requirements– Dissemination Level: Confidential Page 34
6. Privacy analysis The 101 scenarios defined by the consortium had to meet, according to the project proposal, a set of predefined criteria: the scenarios were developed based on real city needs and taking into account the availability of appropriate data, observing in the same time the principles of privacy and personal data protection.
Accordingly, the provisions of the Convention 108 for the Protection of Individuals with regard to Automatic Processing of Personal Data (Council of Europe) and other relevant EU laws guided the 101 scenarios development process. Under the European Union law as well as under the Council of Europe law, information contains data about a person if:
• an individual is identified in this information; or • if an individual, while not identified, is described in this information in a way which makes it
possible to find out who the data subject is by conducting further research1.
In order to comply with the above mentioned legal regulations, the consortium applied several filters for an early identification of possible constraints on the privacy and protection of personal data. Each of the 101 scenarios was subjected to a preliminary scrutiny assured by all the partners that implied the identification of the privacy issues which may affect the future data colection. This first analysis revealed the fact that, out of a total number of 101 scenarios, 66 do not raise any problems regarding the data to be collected and used.
Figure 16: Scenarios affected by privacy issues
The 35 scenarios which are raising potential privacy problems can be clasiffied, according to the type of personal data concerned as follows:
1 Handbook on European data protection law, European Union Agency for Fundamental Rights, Council of
No privacy issues 65%
With concerns over privacy
35%

D2.1 Smart City Use Cases and Requirements– Dissemination Level: Confidential Page 35
Figure 17: Distribution of scenarios according to the concerned personal data
In the analysis of the graph presented above, it must be stated that personal data covers information pertaining to the private life of a person as well as information about his or her professional or public life. Accordingly, all of the 35 scenarios identified with possible privacy concerns are involving elements related to the private life of the subjects and must be carrefully treated in the future development phases.
Moreover, a second more thorough analysis revealed the fact that even some of the scenarios initially classified as without privacy concerns are hiding in fact potential threats related to the protection of private date. These “hidden” privacy issues and the related scenarios are shown in the table below:
Table 17: Scenarios with “hidden” privacy concerns
ID Scenario title Potential privacy issues
9 Air pollution countermeasures (Citizen perspective)
Potential location tracking
13 Pollution monitoring Personal behavior monitoring; energy consumption tracking
19 What is my route? Potential location tracking 27 Vote a lamppost Potential location tracking; personal behavior monitoring
41 Smart Fit Navigation Potential location tracking; personal data concerning health (special category of personal data, according to the EU law)
48 Smart commuting Potential location tracking 51 Dynamic routing of vehicles Potential location tracking; personal behavior monitoring
52 Save energy with friends Personal behavior monitoring; energy consumption tracking
58 Intelligent public transport Potential location tracking 59 Mobile payment Potential location tracking 74 Personal emergency response Potential location tracking; personal behavior
No privacy issues, 65%
Locawon tracking, 10%
Behavior/personal preferences
monitoring, 16%
Resource/energy consumpwon tracking, 6%
Other type of personal data, 3%

D2.1 Smart City Use Cases and Requirements– Dissemination Level: Confidential Page 36
monitoring 75 Social car parking Potential location tracking
80 Continuous care Personal data concerning health (special category of personal data, according to the EU law)
In order to ensure an early and thoroughly identification of the potential privacy issues that may arise, the consortium applied a further filter by including a specialised question (What level of privacy consideration does the scenario require?) in the metrics used for the final 21 scenarios selection.
Besides the above mentioned filters, it must by stated that the consortium will comply in the future development of the selected use cases with the relevant legislation in the field of personal data protection. The principles of anonymisation will by applied, according to the Data Protection Directive and Convention 108, which are stating that: “Data are anonymised if all identifying elements have been eliminated from a set of personal data. No element may be left in the information, which could, by exercising reasonable effort, serve to re-‐identify the person(s) concerned. Where data have been successfully anonymised, they are no longer personal data”
If personal data no longer serve their initial purpose, but are to be kept in a personalised form for the purpose of historical, statistical or scientific use, the Data Protection Directive and Convention 108 allow this possibility on condition that appropriate safeguards against misuse are applied (see the Handbook on European data protection law)
Last but not least, according to the statements made in the application form, all the operations, processing and analytics over the collected data will be performed in full compliance with the "Terms of Use and Privacy Policy" the users will agree with at the registration time (opt-‐in) and the collection and processing of user’s personal information will be treated in compliance with privacy legislation.

D2.1 Smart City Use Cases and Requirements– Dissemination Level: Confidential Page 37
7. References [1] http://www.iot-‐i.eu/, D.2.3 Final Report on IoT Applications of Strategic Interest
[2] http://fi-‐ppp-‐outsmart.eu/en-‐uk/publications/Publications/Pages/Showcases.aspx
[3] http://www.iot-‐a.eu/, D.6.6 Report on Stakeholder opinions
[4] http://smartsantander.eu, D.4.2 Description of implemented IoT services
[5] http://www.sensei-‐project.eu/, D.1.1 SENSEI Scenario Portfolio, User and Context
Requirements
[6] http://www.ist-‐esense.org/, D.1.2.1 Scenarios and audio visual concepts
[7] http://www.ict-‐exalted.eu/, D.2.1 Description of baseline reference systems, scenarios,
technical requirements & evaluation methodology
[8] http://www.ict-‐lola.eu/, D.2.1 Target Application Scenarios
[9] http://www.mimosa-‐fp6.com/, D.1.1 MIMOSA Usage Scenarios
[10] http://iotcomicbook.org/
[11] http://gatesense.com/news/citizen-‐design-‐competition