Smart Cities Urban Energy: Demand vs Sustainability ......Cities 12 Countries In total, Cities with...
20
® Smart Cities Urban Energy: Demand vs Sustainability Outcomes of the ESPRESSO project Bart De Lathouwer President, OGC 3 April 2019 Copyright © 2019 Open Geospatial Consortium
Transcript of Smart Cities Urban Energy: Demand vs Sustainability ......Cities 12 Countries In total, Cities with...

®
Smart Cities Urban Energy: Demand vs Sustainability
Outcomes of the ESPRESSO project
Bart De Lathouwer
President, OGC
3 April 2019
Copyright © 2019 Open Geospatial Consortium
OGC ®
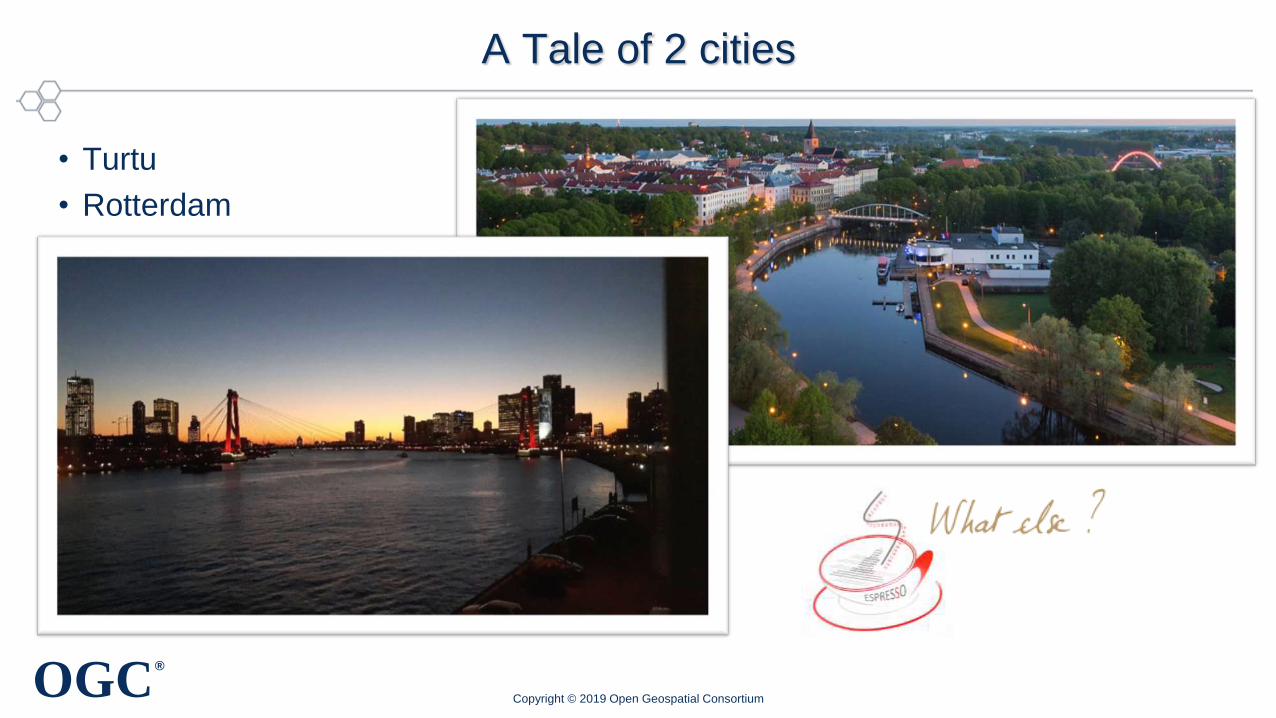
A Tale of 2 cities
• Turtu
• Rotterdam
Copyright © 2019 Open Geospatial Consortium

OGC ®
FROM HRUSTSOVKA TO SMARTOVKA

OGC ®
ESPRESSO Tartu
25 buildings with:
• Energy consumption and current energy class
• Heating demand live queried from an standardized service
• Solar radiation values
• Point cloud showing the solar radiation values for each point on the
building surface
• Presentation of the buildings in different styles and appearances
acc. to solar radiation, energy classification or energy class

OGC ®
USE CASE 1: ENERGY
For the SmartEnCity pilot area, the following is now avaliable as a result of the pilot:
• ENERGY CONSUMPTION AND CURRENT ENERGY CLASS
• HEATING DEMAND, live queried from an OGC - 3D Portrayal Service
• GENERAL SOLAR RADIATION VALUES (monthly + annual)
• POINT CLOUD - solar radiation values for each point on the building surface
• VISUALISATION ON MAP – easily understandable presentation of buildings styled to show the
above (OGC CityGML)

OGC ®
Conclusions from Tartu
• Various stakeholders can better understand the energy potential, both at the individual building
level – my house vs. the neighbor's house – as well as at city district level
• Facilitates mobilizing support and building momentum for Smart Energy Management among the
residents & general public via better visualization of unused potential / positive changes to take
place in the context of SmartEnCity
• Encourages better decision making, future development and pick-up by other buildings as well
as supports city planning (city government)
• Serves as basis for potential future third party engagement (e.g. tech startups) to build
new products/services based on different datasets
• Standards allowed for transition from legacy data to multiple new systems
• No tooling/software dependency!
Copyright © 2019 Open Geospatial Consortium

OGC ®
VALUE & IMPACT ANALYSIS: ECONOMIC IMPACT
PWC study in D6.3 Report on Economic and Business Impacts, p 34
http://espresso-project.eu
OGC ®
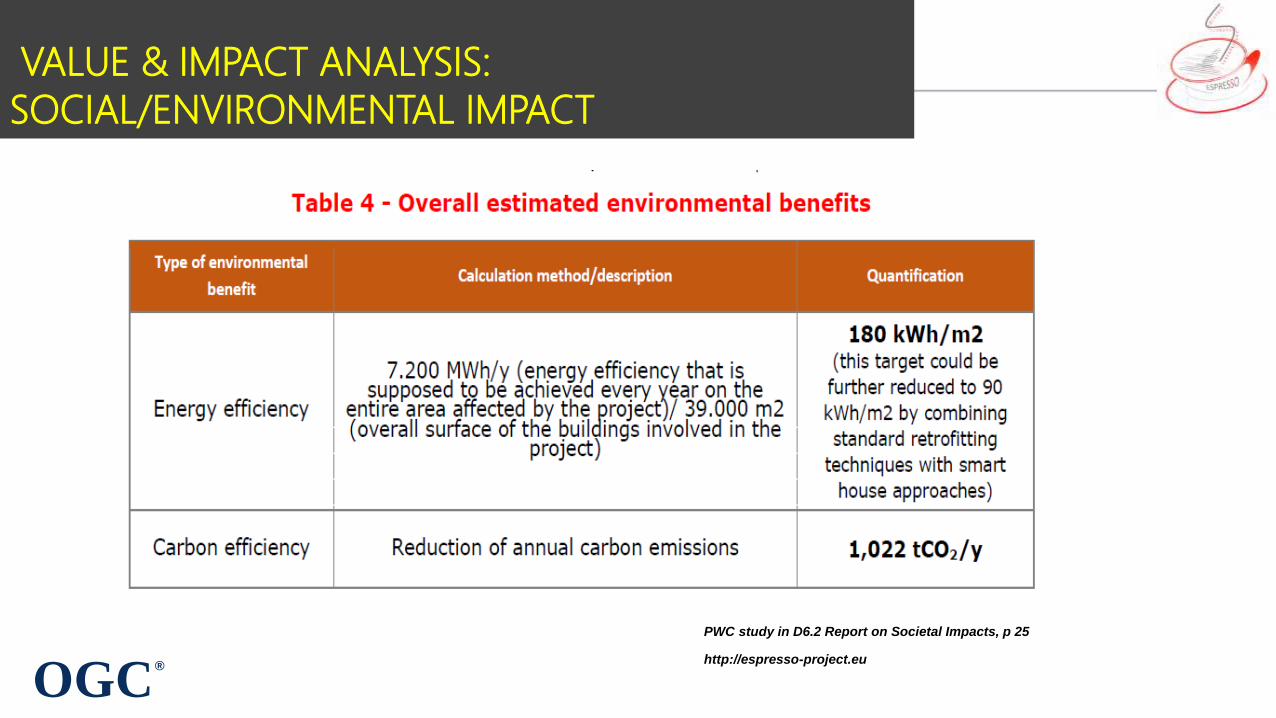
VALUE & IMPACT ANALYSIS:
SOCIAL/ENVIRONMENTAL IMPACT
PWC study in D6.2 Report on Societal Impacts, p 25
http://espresso-project.eu

OGC ®
Rotterdam
Copyright © 2019 Open Geospatial Consortium

OGC ®
Use case: Waste Paper Containers
– Sensors registring the fullness of the containers for different
purposes:
• optimizing the collection routes
• Registring defects
• Registring demolition

OGC ®
Use case: Ground Water Level
– Approximately 2000 wells in the city
manually measured.
– More accurate, frequent, flexibel
measurements, less manual labour.

OGC ®
Use case: Parking lot availability
– Small pilot area
– Sensorinformation already available as Open Data

OGC ®
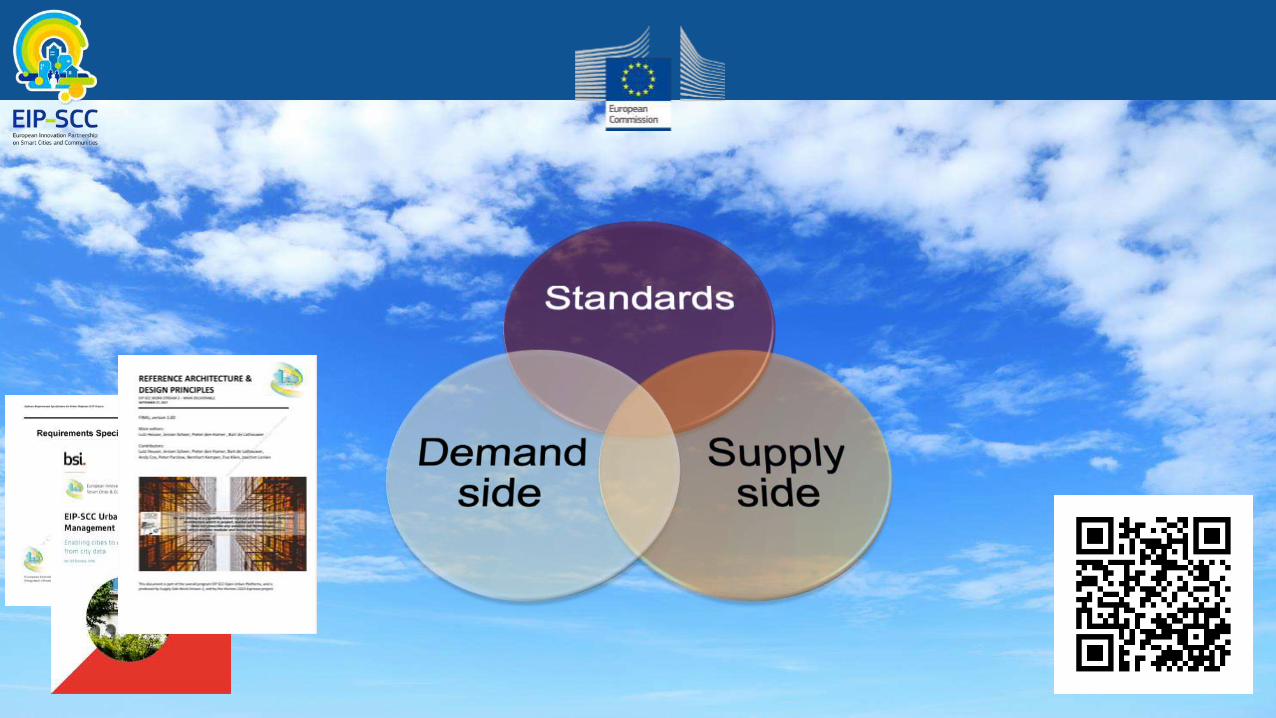
= connections
based on (open) standards:
PPI’s (pivotal points of
interoperability
Basic design Digital City
Data services hub Digital City
Information and communication layer
(applications, dashboards, services and data marketplace)
Others Companies Visitors Citizens
D
W
A
R
S
S
O
M
G
.
W
E
T
A
P
P
L
I
C
.
S
E
N
S
O
R
3
D
m
o
d
e
l
3D visualisations
External data sources RT & non-RT
(K.I.’s, companies, citizens, others)
Data hub municipality
(datafabriek, DAP)
Applications
Data services
hub/
generic data
collection
& disclosure
Data sources

OGC ®
Information Systems Architecture The MIM approach
IOT/CPS
Access Services and
Domain Services
Data Lake
Data Zone
Device Zone
Other
Appl Zone

OGC ®
MIM and PPI
IOT/CPS
Access Services and
Domain Services
Data Lakes Data Zones
Device Zone
Appl Zone
Other
Pivotal Points of Interoperability (PPI)
PPI
LoRa, IP, 6LowPan
IP, REST, JSON, …
HTTP, MQTT
Bluetooth, ZigBee
CSV, … OneM2M
SQL, SPARQL
LoD, ERD
JS, Python
CityGML
SensorThingsAPI, MQTT, WMS
Oracle Database
Client Apps
NoSQL

OGC ®
OGC ®

OGC ®
ESPRESSO Reference architecture (DIN Standard 91357)

OGC ®
Demand-Side Engagement
4/22/2019 EIP Urban Platform Governance
A Q1,‘15 City Survey revealed some useful insights
Q: What will it take to help speed cities in deploying solutions that help digitize their services, and connect across them to extract the benefits of modern ICTs?
29 Cities
12
Countries
In total, Cities with 28million citizens
Cities appear to be “Sitting on the fence” 75% of cities have not as yet acted on an Urban Platform
Feedback Suggests 1. Poor knowledge of the landscape & lack of confidence
and capacity within cities 2. Cities struggle to get the silos to work together, thus
prohibiting effective action 3. Cities suffer budget / funding constraints
The principal focus for urban platforms is on ‘place’ related services
1
2
3
3 Key Findings

OGC ®
Conclusion
• Tartu and Rotterdam have a better understanding of the problem domain
• Standards helped in using the data
– Pick the best tool
– Vendor independence
• Standards don’t make themselves
– Join the process now ! http://www.opengeospatial.org
– Upcoming TC meeting in Leuven, see http://ogcmeet.org
• Thank you!
– bdelathouwer [at] opengeospatial.org
Copyright © 2019 Open Geospatial Consortium