
SMART 2019 Proceedings - ThinkMind
46
SMART 2019 The Eighth International Conference on Smart Cities, Systems, Devices and Technologies ISBN: 978-1-61208-730-6 July 28 – August 2, 2019 Nice, France SMART 2019 Editors Lasse Berntzen, University of South-Eastern Norway, Norway 1 / 46
Transcript of SMART 2019 Proceedings - ThinkMind

SMART 2019
The Eighth International Conference on Smart Cities, Systems, Devices and
Technologies
ISBN: 978-1-61208-730-6
July 28 – August 2, 2019
Nice, France
SMART 2019 Editors
Lasse Berntzen, University of South-Eastern Norway, Norway
1 / 46

SMART 2019
Forward
The Eighth International Conference on Smart Cities, Systems, Devices and Technologies (SMART2019), held between July 28, 2019 and August 02, 2019 in Nice, France, continued a series of eventscovering tendencies towards future smart cities, specialized technologies and devices, environmentalsensing, energy optimization, pollution control and socio-cultural aspects.
Digital societies take rapid developments toward smart environments. More and more social servicesare digitally available to the citizens. The concept of ‘smart cities’ including all devices, services,technologies and applications associated with the concept sees a large adoption. Ubiquity and mobilityadded new dimensions to smart environments. Adoption of smartphones and digital finder maps, andincreasing budgets for technical support of services to citizens settled a new behavioral paradigm of cityinhabitants.
The conference included academic, research, and industrial contributions. It had the followingtracks:
Mobility monitoring and control in smart environments
Digital citiesWe take here the opportunity to warmly thank all the members of the SMART 2019 technical
program committee, as well as all the reviewers. The creation of such a high quality conference programwould not have been possible without their involvement. We also kindly thank all the authors whodedicated much of their time and effort to contribute to SMART 2019. We truly believe that, thanks toall these efforts, the final conference program consisted of top quality contributions.
We also thank the members of the SMART 2019 organizing committee for their help in handling thelogistics and for their work that made this professional meeting a success.
We hope that SMART 2019 was a successful international forum for the exchange of ideas andresults between academia and industry and to promote further progress in the area of smart cities,systems, devices and technologies. We also hope that Nice, France provided a pleasant environmentduring the conference and everyone saved some time to enjoy the charm of the city.
SMART 2019 Chairs
SMART Steering Committee
Wolfgang Leister, Norsk Regnesentral, NorwayChristine Perakslis, Johnson & Wales University, USABrendan O'Flynn, Tyndall National Institute | University College Cork, IrelandSanja Lazarova-Molnar, University of Southern Denmark, DenmarkLasse Berntzen, University of South-Eastern Norway, NorwayMarkus Taumberger, VTT Technical Research Center of Finland Ltd., FinlandJianguo Ding, University of Skövde, Sweden
2 / 46

SMART Industry/Research Advisory Committee
Steffen Fries, Siemens AG, GermanyAndrea Vinci, CNR - National Research Council of Italy | Institute for High Performance Computing andNetworking (ICAR), Italy
3 / 46

SMART 2019
Committee
SMART Steering Committee
Wolfgang Leister, Norsk Regnesentral, NorwayChristine Perakslis, Johnson & Wales University, USABrendan O'Flynn, Tyndall National Institute | University College Cork, IrelandSanja Lazarova-Molnar, University of Southern Denmark, DenmarkLasse Berntzen, University of South-Eastern Norway, NorwayMarkus Taumberger, VTT Technical Research Center of Finland Ltd., FinlandJianguo Ding, University of Skövde, Sweden
SMART Industry/Research Advisory Committee
Steffen Fries, Siemens AG, GermanyAndrea Vinci, CNR - National Research Council of Italy | Institute for High Performance Computing andNetworking (ICAR), Italy
SMART 2019 Technical Program Committee
Lounis Adouane, Institut Pascal / Université Clermont Auvergne, FranceSukaina Al-Nasrawi, Beirut Arab University, LebanonCristina Alcaraz, University of Malaga, SpainRyosuke Ando, TTRI (Toyota Transportation Research Institute), JapanGeorg Aumayr, Johanniter, AustriaPetko Bakalov, Environmental Systems Research Institute (ESRI), USAJie Bao, Microsoft Research, ChinaKarolina Baras, Madeira Interactive Technologies Institute (M-ITI) - University of Madeira, PortugalKashinath Basu, Oxford Brookes University, UKMohammed Bennamoun, The University of Western Australia, AustraliaLasse Berntzen, University of South-Eastern Norway, NorwayChongguang Bi, Michigan State University, USARamon F. Brena, Tecnologico de Monterrey, MexicoDavid Brosset, Naval Academy Research Institute, FranceNélio Cacho, Federal University of Rio Grande do Norte, BrazilVicente Carabias-Hütter, ZHAW Zurich University of Applied Sciences, SwitzerlandJuan-Carlos Cano, Universitat Politecnica de Valencia, SpainRaffaele Carli, Politecnico di Bari, ItalyRosa Cervera, Universidad de Alcalá, SpainDimitris Chatzopoulos, The Hong Kong University of Science and Technology, Hong KongYuen Chau, Singapore University of Technology and Design, SingaporeDeJiu Chen, KTH Royal Institute of Technology, SwedenSeyed Ali Cheraghi, Wichita State University, USA
4 / 46

Yao-Yi Chiang, University of Southern California, USAPatrizio Dazzi, ISTI-CNR,María del Mar Gómez Zamora, Universidad Rey Juan Carlos, SpainJianguo Ding, University of Skövde, SwedenKarim Djemame, University of Leeds, UKMariagrazia Dotoli, Politecnico di Bari, ItalyAbdelali El Bouchti, Institute for Forecasting and Futuristics (I2F) - Bournemouth University, UK / Hassan2nd University, Casablanca, MoroccoMarkus Endler, PUC-Rio, BrazilAva Fatah gen Schieck, The Bartlett School of Architecture | University College London, UKAdrian Florea, 'Lucian Blaga' University of Sibiu, RomaniaLidia Fotia, University Mediterranea of Reggio Calabria, ItalySteffen Fries, Siemens AG, GermanyAngelo Furno, Université de Lyon, FranceIvan Ganchev, University of Limerick, Ireland / Plovdiv University "Paisii Hilendarski", BulgariaMariusz Giergiel, AGH University of Science and Technology, Krakow, PolandYann Glouche, INRIA, Caen, France, FranceKatie Goeman, KU Leuven - University of Leuven, BelgiumJorge J. Gomez-Sanz, Universidad Complutense de Madrid, SpainCarlos Guerrero, University of Balearic Islands, SpainMarco Antonio Gutiérrez Giraldo, Universidad de Extremadura, SpainCarlos Henggeler Antunes, University of Coimbra, PortugalPascal Hirmer, University of Stuttgart, GermanyGerold Hölzl, University of Passau, GermanyTzung-Pei Hong, National University of Kaohsiung, TaiwanJavier Ibanez-Guzman, Renault, FranceMaysoun Ibrahim, Higher Council for Innovation and Excellence, PalestineSergio Ilarri, University of Zaragoza, SpainShallari Irida, Mid Sweden University, SwedenMing Jin, UC Berkeley / LBNL, USAMarius Rohde Johannessen, Universty of South-Eastern Norway, NorwayEleni Kaplani, University of East Anglia-Norwich Research Park, UKBilal Kartal, University of Minnesota, USAMd Abdullah Al Hafiz Khan, Philips Research North America, USAAbdelmajid Khelil, Landshut University of Applied Sciences, GermanyPinar Kirci, Istanbul University, TurkeyFrancine Krief, Bordeaux INP, FranceKirill Krinkin, Saint-Petersburg Electrotechnical University, RussiaSanja Lazarova-Molnar, University of Southern Denmark, DenmarkWolfgang Leister, Norsk Regnesentral, NorwayDan Lin, Missouri University of Science and Technology, USAGiovanni Livraga, Università degli Studi di Milano, ItalyGabriel Luque, University of Malaga, SpainTatiana K. Madsen, Aalborg University, DenmarkGiuseppe Mangioni, University of Catania, ItalyFrancisco Martins, University of Lisbon, PortugalRenato Martins, INRIA | Sophia Antipolis, FranceManuel Mastrofini, LAST Horizon / University of Rome Tor Vergata, Italy
5 / 46

Natarajan Meghanathan, Jackson State University, USAZahéra Mekkioui, University of Tlemcen, AlgeriaJolanta Mizera-Pietraszko, Institute of Mathematics and Informatics | Opole University, PolandYoung Moon, Syracuse University, USAMatteo Mordacchini, IIT-CNR,Helena Nadais, CESAM - Centre for Environmental and Marine Studies | University of Aveiro, PortugalDmitry Namiot, Lomonosov Moscow State University, RussiaUlrich Norbisrath, University of Applied Sciences Upper Austria (FH UA) Linz, Austria / George MasonUniversity, USACarlo Alberto Nucci, University of Bologna, ItalyBrendan O'Flynn, Tyndall National Institute | University College Cork, IrelandEdoardo Patti, Politecnico di Torino, ItalyLuis Paulo Reis, University of Minho, PortugalJun Peng, University of Texas - Rio Grande Valley, USAWilma Penzo, DISI - University of Bologna, ItalyCathryn Peoples, The Open University, UKChristine Perakslis, Johnson & Wales University, USANuno Pereira, School of Engineering of the Polytechnic of Porto, PortugalJorge Luis Perez Medina, Universidad de Las Americas at Quito, EcuadorDavide Pinzan, Cardiff University, UKMarco Polignano, University of Bari Aldo Moro, ItalySherif S. Rashad, Morehead State University, USADaniele Riboni, University of Cagliari, ItalyFrancesca Righetti, University of Pisa, ItalyHeng Qi, Dalian University of Technology, ChinaJose M. Reyes Alamo, CUNY - New York City College of Technology, USAMichele Risi, University of Salerno, ItalyEnrique Romero-Cadaval, University of Extremadura, SpainAlessandra Russo, Imperial College London, UKDemetrios Sampson, Curtin University, AustraliaSaiph Savage, West Virginia University, USAClaudio Savaglio, University of Calabria, ItalyMichael Sheng, Macquarie University, AustraliaRongye Shi, Carnegie Mellon University, USAFarhan Siddiqui, Walden University, USASteffen Späthe, Friedrich Schiller University Jena, GermanyGeorgios Stylianou, Accenture, NetherlandsYoung-Joo Suh, POSTECH, KoreaMarkus Taumberger, VTT Technical Research Center of Finland Ltd., FinlandAthanasios Tsanas, University of Edinburgh / University of Oxford, UKAndrea Vinci, CNR - National Research Council of Italy | Institute for High Performance Computing andNetworking (ICAR), ItalyKonstantinos Votis, Information Technologies Institute | Centre for Research and Technology Hellas,Thessaloniki, GreeceMichael Wittmann, Technical University of Munich, GermanyOuri Wolfson, University of Illinois, USAPete Woznowski, University of Bristol, UKMudasser F. Wyne, National University, USA
6 / 46

Xinggang Yan, University of Kent, UKChia-Hung Yeh, National Sun Yat-sen University, TaiwanWuyi Yue, Konan University, Kobe, JapanSherali Zeadally, University of Kentucky, USAPetros Zerfos, IBM T.J. Watson Research Center, USABo Zhou, German Research Center for Artificial Intelligence, Kaiserslautern, GermanyYanmin Zhu, Shanghai Jiao Tong University, ChinaSotirios Ziavras, New Jersey Institute of Technology, USA
7 / 46

Copyright Information
For your reference, this is the text governing the copyright release for material published by IARIA.
The copyright release is a transfer of publication rights, which allows IARIA and its partners to drive the
dissemination of the published material. This allows IARIA to give articles increased visibility via
distribution, inclusion in libraries, and arrangements for submission to indexes.
I, the undersigned, declare that the article is original, and that I represent the authors of this article in
the copyright release matters. If this work has been done as work-for-hire, I have obtained all necessary
clearances to execute a copyright release. I hereby irrevocably transfer exclusive copyright for this
material to IARIA. I give IARIA permission or reproduce the work in any media format such as, but not
limited to, print, digital, or electronic. I give IARIA permission to distribute the materials without
restriction to any institutions or individuals. I give IARIA permission to submit the work for inclusion in
article repositories as IARIA sees fit.
I, the undersigned, declare that to the best of my knowledge, the article is does not contain libelous or
otherwise unlawful contents or invading the right of privacy or infringing on a proprietary right.
Following the copyright release, any circulated version of the article must bear the copyright notice and
any header and footer information that IARIA applies to the published article.
IARIA grants royalty-free permission to the authors to disseminate the work, under the above
provisions, for any academic, commercial, or industrial use. IARIA grants royalty-free permission to any
individuals or institutions to make the article available electronically, online, or in print.
IARIA acknowledges that rights to any algorithm, process, procedure, apparatus, or articles of
manufacture remain with the authors and their employers.
I, the undersigned, understand that IARIA will not be liable, in contract, tort (including, without
limitation, negligence), pre-contract or other representations (other than fraudulent
misrepresentations) or otherwise in connection with the publication of my work.
Exception to the above is made for work-for-hire performed while employed by the government. In that
case, copyright to the material remains with the said government. The rightful owners (authors and
government entity) grant unlimited and unrestricted permission to IARIA, IARIA's contractors, and
IARIA's partners to further distribute the work.
8 / 46

Table of Contents
Design of Non-Destructive Evaluation Robot Using Magnetic Flux Leakage for Main Water PipeJaekyu An, Soeun Son, Jongho Bae, Yong Sub Kwon, Eui-Jung Jung, and Goobong Chung
1
Sequencing Intelligent Components Through Releases as a Risk Reduction Strategy: a Smart-city ExamplePablo Valenzuela-Toledo and Carlos Cares
6
A Strategy for Drone Traffic Planning - Dynamic Flight-paths for Drones in Smart CitiesLasse Berntzen, Adrian Florea, Cristian Molder, and Noureddine Bouhmala
12
Citizen Participation Through Digital Platforms: the Challenging Question of Data Processing for Cities.Noemie Lago, Marianne Durieux, Jean-Alexandre Pouleur, Chantal Scoubeau, Catherine Elsen, and ClementineSchelings
19
WiFi and LoRa Energy Consumption Comparison in IoT ESP 32/ SX1278 DevicesLaura Garcia, Jose M. Jimenez, Jaime Lloret, and Pascal Lorenz
26
Predicting Incidents of Crime Through LSTM Neural Networks in Smart City DomainUlises M. Ramirez-Alcocer, Edgar Tello-Leal, and Jonathan A. Mata-Torres
32
Powered by TCPDF (www.tcpdf.org)
1 / 1 9 / 46
Design of Non-Destructive Evaluation Robot Using Magnetic Flux Leakage forMain Water Pipe
Jaekyu AnManufacturing Robotics R&D DivisionKorea Institute of Robot Convergence
Pohang, Republic of Koreaemail: [email protected]
Soeun SonManufacturing Robotics R&D DivisionKorea Institute of Robot Convergence
Pohang, Republic of Koreaemail: [email protected]
Jongho BaeManufacturing Robotics R&D DivisionKorea Institute of Robot Convergence
Pohang, Republic of Koreaemail: [email protected]
Yong Sub KwonManufacturing Robotics R&D DivisionKorea Institute of Robot Convergence
Pohang, Republic of Koreaemail: [email protected]
Eui-Jung JungManufacturing Robotics R&D DivisionKorea Institute of Robot Convergence
Pohang, Republic of Koreaemail: [email protected]
Goobong ChungManufacturing Robotics R&D DivisionKorea Institute of Robot Convergence
Pohang, Republic of Koreaemail: [email protected]
Abstract—Many infrastructures in the world include pipesystems, e.g., gas, oil, water, electricity, air circulation, etc.Using a pipe system for the delivery of such materials allowsfor easy human control. However, if the pipe is broken orcontaminated, the process is disturbed and the risk cost for thesociety can increase substantially. For instance, contaminationsin fluids like air and water may result in spreading of diseases.Therefore, maintenance of the pipe is crucial. For a long periodof time, identification of a pipe requiring a repair onlydepended on its installation time because its condition was notexposed until the pipe was destructed or cut. Recently, non-destructive evaluation technology and robotics are changingthe paradigm of the identification process. Maintenancetechnicians can identify faulty pipes from reliable data,collected directly from the pipes, instead of relying on thepipe’s installation period. In this paper, we propose a robotdesign with Non-Destructive Evaluation (NDE) for waterworkpipes.
Keywords-main water pipe; waterworks; pipe; robot; NDE;MFL.
I. INTRODUCTION
A well-founded infrastructure plays a major role in citydevelopment. The infrastructure is composed of systemssuch as roads, electrical grids and water supply pipes. Thesesystems are the power sources running the society. If one ofthe systems malfunctions, the society suffers frominconvenience and the productivity drops. Therefore,monitoring the conditions and maintenance of theinfrastructure are directly correlated with the functionality ofthe society.
This paper discusses a design of NDE in-pipe robot formain water pipe. Many robots have already been used in
water pipes [1] with various inspection technologies [2].Among the various attributes of such robots, this researchfocuses on mobility using the Magnetic Flux Leakage (MFL)method [3].
The majority of existing NDE systems attempt to coverthe whole pipe surface at the same time [4]. In order to coverthe entire inner surface of the pipe, the system often requiresa large number of attached sensors through the entire pipe.Our proposed design decreases the complexity by movingthe sensors along the direction of the robot’s movement.Also, to reduce the weight of the robot, our team considereda moving sensor as in the Diakont robot [7], which usesElectromagnetic Acoustic Transducer (EMAT). While thistype of sensor increases the difficulty of the signalprocessing, our robot can still benefit in mobility by areduction in the number of sensors. The robot can alsosmoothly carry the NDE modules at an inclined pipe, vertical
pipe, elbow, and miter type pipe.
Additionally, there are two advantages using the MFLmethod. First, it is radiation free. Second, the method can beused to sense the magnetic field without the medium. Thesecharacteristics minimize possible water pollution that canoccur during the pipe inspection.
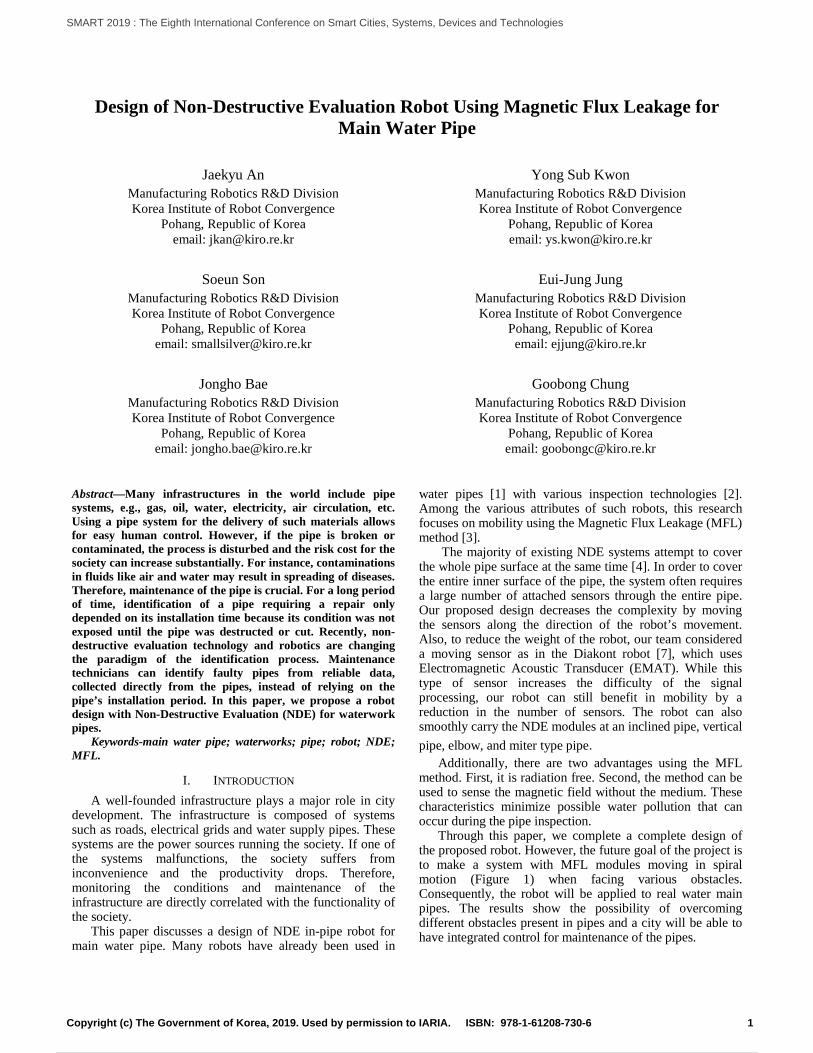
Through this paper, we complete a complete design ofthe proposed robot. However, the future goal of the project isto make a system with MFL modules moving in spiralmotion (Figure 1) when facing various obstacles.Consequently, the robot will be applied to real water mainpipes. The results show the possibility of overcomingdifferent obstacles present in pipes and a city will be able tohave integrated control for maintenance of the pipes.
1Copyright (c) The Government of Korea, 2019. Used by permission to IARIA. ISBN: 978-1-61208-730-6
SMART 2019 : The Eighth International Conference on Smart Cities, Systems, Devices and Technologies
10 / 46
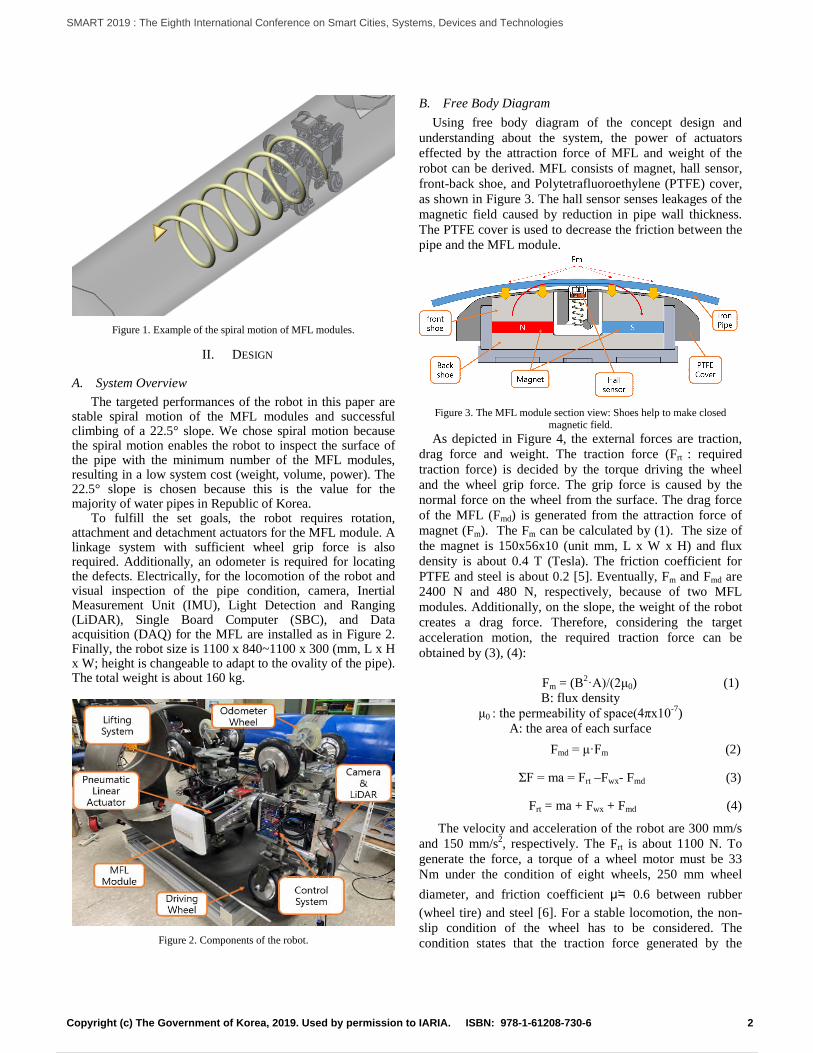
Figure 1. Example of the spiral motion of MFL modules.
II. DESIGN
A. System Overview
The targeted performances of the robot in this paper arestable spiral motion of the MFL modules and successfulclimbing of a 22.5° slope. We chose spiral motion becausethe spiral motion enables the robot to inspect the surface ofthe pipe with the minimum number of the MFL modules,resulting in a low system cost (weight, volume, power). The22.5° slope is chosen because this is the value for themajority of water pipes in Republic of Korea.
To fulfill the set goals, the robot requires rotation,attachment and detachment actuators for the MFL module. Alinkage system with sufficient wheel grip force is alsorequired. Additionally, an odometer is required for locatingthe defects. Electrically, for the locomotion of the robot andvisual inspection of the pipe condition, camera, InertialMeasurement Unit (IMU), Light Detection and Ranging(LiDAR), Single Board Computer (SBC), and Dataacquisition (DAQ) for the MFL are installed as in Figure 2.Finally, the robot size is 1100 x 840~1100 x 300 (mm, L x Hx W; height is changeable to adapt to the ovality of the pipe).The total weight is about 160 kg.
Figure 2. Components of the robot.
B. Free Body Diagram
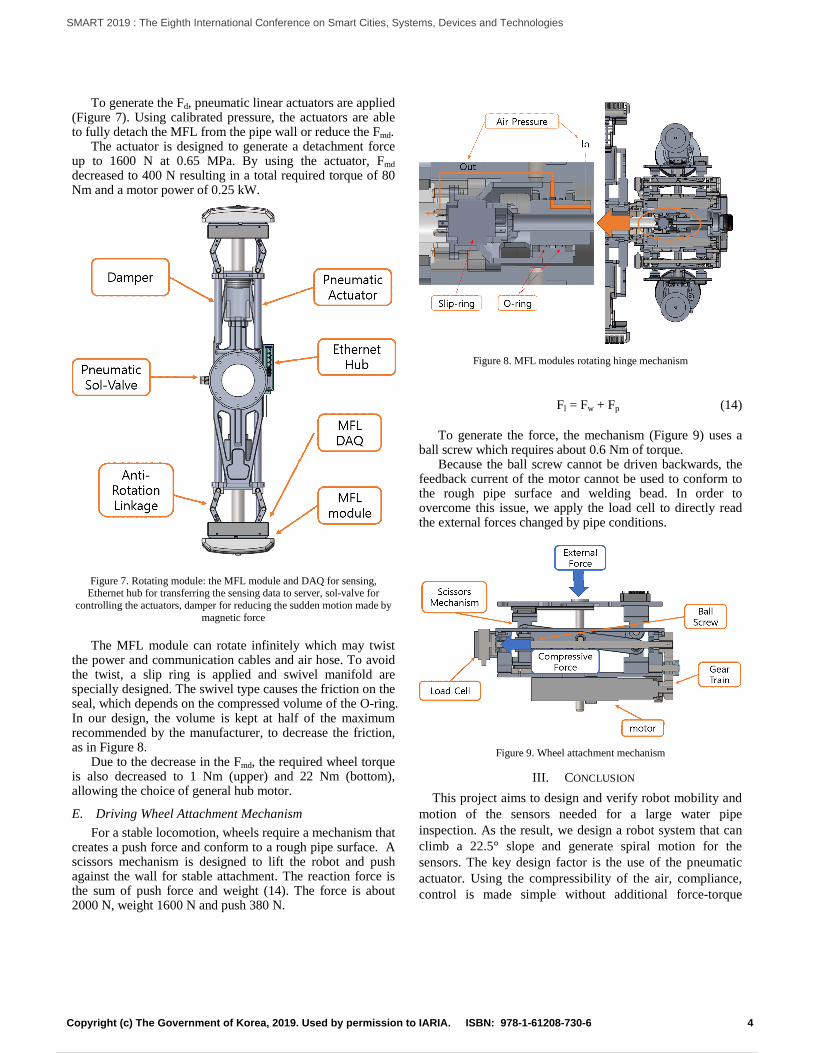
Using free body diagram of the concept design andunderstanding about the system, the power of actuatorseffected by the attraction force of MFL and weight of therobot can be derived. MFL consists of magnet, hall sensor,front-back shoe, and Polytetrafluoroethylene (PTFE) cover,as shown in Figure 3. The hall sensor senses leakages of themagnetic field caused by reduction in pipe wall thickness.The PTFE cover is used to decrease the friction between thepipe and the MFL module.
Figure 3. The MFL module section view: Shoes help to make closedmagnetic field.
As depicted in Figure 4, the external forces are traction,drag force and weight. The traction force (Frt : requiredtraction force) is decided by the torque driving the wheeland the wheel grip force. The grip force is caused by thenormal force on the wheel from the surface. The drag forceof the MFL (Fmd) is generated from the attraction force ofmagnet (Fm). The Fm can be calculated by (1). The size ofthe magnet is 150x56x10 (unit mm, L x W x H) and fluxdensity is about 0.4 T (Tesla). The friction coefficient forPTFE and steel is about 0.2 [5]. Eventually, Fm and Fmd are2400 N and 480 N, respectively, because of two MFLmodules. Additionally, on the slope, the weight of the robotcreates a drag force. Therefore, considering the targetacceleration motion, the required traction force can beobtained by (3), (4):
Fm = (B2·A)/(2μ0) (1)B: flux density
μ0 : the permeability of space(4πx10-7)A: the area of each surface
Fmd = μ·Fm (2)
ΣF = ma = Frt –Fwx- Fmd (3)
Frt = ma + Fwx + Fmd (4)
The velocity and acceleration of the robot are 300 mm/sand 150 mm/s2, respectively. The Frt is about 1100 N. Togenerate the force, a torque of a wheel motor must be 33Nm under the condition of eight wheels, 250 mm wheel
diameter, and friction coefficient μ≒ 0.6 between rubber
(wheel tire) and steel [6]. For a stable locomotion, the non-slip condition of the wheel has to be considered. Thecondition states that the traction force generated by the
2Copyright (c) The Government of Korea, 2019. Used by permission to IARIA. ISBN: 978-1-61208-730-6
SMART 2019 : The Eighth International Conference on Smart Cities, Systems, Devices and Technologies
11 / 46

wheel torque should be smaller than the friction force of thetire (Fnt) created by the weight (refer to (5)). The current Fnt
(680 N) is smaller than Frt from (6). For a non-slip motion,Fwy can be increased by pushing on the pipe wall.
Fnt ≥ Frt (5)
Fnt =μ· Fwy (6)
Therefore, the minimum non-slip traction force is Frt,which can be calculated from (7). Equations (8), (9)represent the traction force of the bottom and upper wheel,respectively.
Fnt =μ· (Fwy + F’p) + μ·Fp (7)
Fbt =μ· (Fwy + F’p) (8)
Fut = μ·Fp (9)
Fp = F’p (10)
Fp ≥ (Frt - μ·Fwy) / (2·μ) (11)
By using Fp (380 N), upper (6 Nm) and bottom (27 Nm),the wheel torque is also calculated.
Figure 4. The free body diagram for understanding applied forces
C. Simulation for Driving Wheel Torque
To verify the result from the Free Body Diagram (FBD),we use a multibody dynamic analysis simulation tool:DAFUL [8]. Conditions used in DAFUL are equal to thevalues from the FBD, such as weight (1600 N), push force
(380 N), drag force by MFL (480 N), and slope (22.5°), as
in Figure 5. We are interested in the required torque in awheel. Under these conditions, by substituting the targetvelocity of the wheel, DAFUL shows the resulting torqueabout the wheel. The average values for upper and bottomwheel are 20 Nm and 110 Nm, respectively. The robotsystem has eight wheels in total, 4 at the top and 4 at thebottom. Therefore, one top wheel needs about 5 Nm and one
bottom wheel needs about 27 Nm, see Figure 6. Thesimulated values are shown to be very similar to our FBDresults.
Figure 5. Simple modeling at the DAFUL
Figure 6. Results of Time (s) – Torque (Nm): the average of blue chart isabout 27 Nm and red chart is about 5 Nm
D. MFL Rotation and Attachment Mechanism
MFL sensor modules have spiral motion with attachingcondition on the pipe wall. It creates the friction force to bein a distracting rotational direction, as shown in the free bodydiagram section. The rotational torque can be found usingequation (12):
τ = d x Fmd (12)
Fmd from the two MFL modules is about 480 N and thetorque is about 240 Nm. The pipe diameter is 1000 mm andthe axis of rotation of the MFL is at the center of the pipe.
To sustain the torque and rotational velocity (30 rpm), amotor has to generate about 0.75 kW of power.
However, due to the large power source and motorvolume, we try to generate detachment force (Fd) rather thanturning to high power motors. The detachment force reducesthe total MFL drag force from (13).
Fmd = μ·(Fm - Fd) (13)
3Copyright (c) The Government of Korea, 2019. Used by permission to IARIA. ISBN: 978-1-61208-730-6
SMART 2019 : The Eighth International Conference on Smart Cities, Systems, Devices and Technologies
12 / 46
To generate the Fd, pneumatic linear actuators are applied(Figure 7). Using calibrated pressure, the actuators are ableto fully detach the MFL from the pipe wall or reduce the Fmd.
The actuator is designed to generate a detachment forceup to 1600 N at 0.65 MPa. By using the actuator, Fmd
decreased to 400 N resulting in a total required torque of 80Nm and a motor power of 0.25 kW.
Figure 7. Rotating module: the MFL module and DAQ for sensing,Ethernet hub for transferring the sensing data to server, sol-valve for
controlling the actuators, damper for reducing the sudden motion made bymagnetic force
The MFL module can rotate infinitely which may twistthe power and communication cables and air hose. To avoidthe twist, a slip ring is applied and swivel manifold arespecially designed. The swivel type causes the friction on theseal, which depends on the compressed volume of the O-ring.In our design, the volume is kept at half of the maximumrecommended by the manufacturer, to decrease the friction,as in Figure 8.
Due to the decrease in the Fmd, the required wheel torqueis also decreased to 1 Nm (upper) and 22 Nm (bottom),allowing the choice of general hub motor.
E. Driving Wheel Attachment Mechanism
For a stable locomotion, wheels require a mechanism thatcreates a push force and conform to a rough pipe surface. Ascissors mechanism is designed to lift the robot and pushagainst the wall for stable attachment. The reaction force isthe sum of push force and weight (14). The force is about2000 N, weight 1600 N and push 380 N.
Figure 8. MFL modules rotating hinge mechanism
Fl = Fw + Fp (14)
To generate the force, the mechanism (Figure 9) uses aball screw which requires about 0.6 Nm of torque.
Because the ball screw cannot be driven backwards, thefeedback current of the motor cannot be used to conform tothe rough pipe surface and welding bead. In order toovercome this issue, we apply the load cell to directly readthe external forces changed by pipe conditions.
Figure 9. Wheel attachment mechanism
III. CONCLUSION
This project aims to design and verify robot mobility andmotion of the sensors needed for a large water pipeinspection. As the result, we design a robot system that canclimb a 22.5° slope and generate spiral motion for thesensors. The key design factor is the use of the pneumaticactuator. Using the compressibility of the air, compliance,control is made simple without additional force-torque
4Copyright (c) The Government of Korea, 2019. Used by permission to IARIA. ISBN: 978-1-61208-730-6
SMART 2019 : The Eighth International Conference on Smart Cities, Systems, Devices and Technologies
13 / 46
sensor, complex system modeling and control strategiescompared to motor based systems. Additionally, because ofreduced magnetic attractive force, the system’s weight,volume and power consumption can be decreased with alow powered motor.
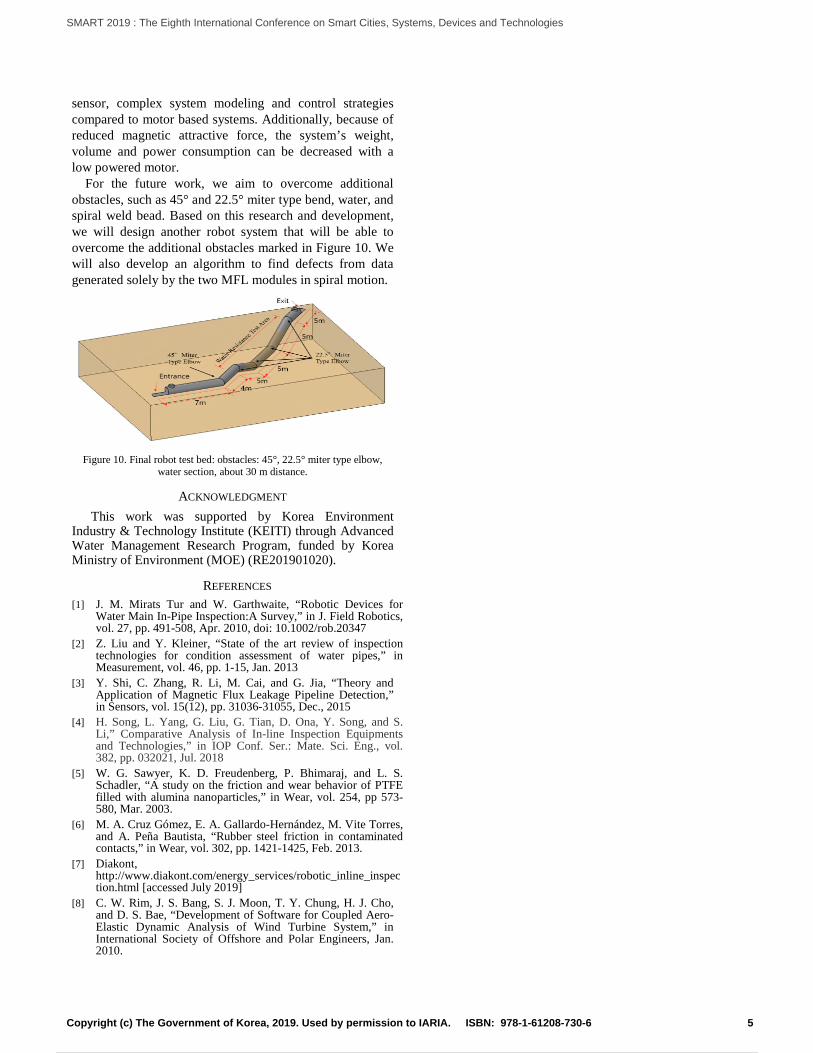
For the future work, we aim to overcome additionalobstacles, such as 45° and 22.5° miter type bend, water, andspiral weld bead. Based on this research and development,we will design another robot system that will be able toovercome the additional obstacles marked in Figure 10. Wewill also develop an algorithm to find defects from datagenerated solely by the two MFL modules in spiral motion.
Figure 10. Final robot test bed: obstacles: 45°, 22.5° miter type elbow,water section, about 30 m distance.
ACKNOWLEDGMENT
This work was supported by Korea EnvironmentIndustry & Technology Institute (KEITI) through AdvancedWater Management Research Program, funded by KoreaMinistry of Environment (MOE) (RE201901020).
REFERENCES
[1] J. M. Mirats Tur and W. Garthwaite, “Robotic Devices forWater Main In-Pipe Inspection:A Survey,” in J. Field Robotics,vol. 27, pp. 491-508, Apr. 2010, doi: 10.1002/rob.20347
[2] Z. Liu and Y. Kleiner, “State of the art review of inspectiontechnologies for condition assessment of water pipes,” inMeasurement, vol. 46, pp. 1-15, Jan. 2013
[3] Y. Shi, C. Zhang, R. Li, M. Cai, and G. Jia, “Theory andApplication of Magnetic Flux Leakage Pipeline Detection,”in Sensors, vol. 15(12), pp. 31036-31055, Dec., 2015
[4] H. Song, L. Yang, G. Liu, G. Tian, D. Ona, Y. Song, and S.Li,” Comparative Analysis of In-line Inspection Equipmentsand Technologies,” in IOP Conf. Ser.: Mate. Sci. Eng., vol.382, pp. 032021, Jul. 2018
[5] W. G. Sawyer, K. D. Freudenberg, P. Bhimaraj, and L. S.Schadler, “A study on the friction and wear behavior of PTFEfilled with alumina nanoparticles,” in Wear, vol. 254, pp 573-580, Mar. 2003.
[6] M. A. Cruz Gómez, E. A. Gallardo-Hernández, M. Vite Torres,and A. Peña Bautista, “Rubber steel friction in contaminatedcontacts,” in Wear, vol. 302, pp. 1421-1425, Feb. 2013.
[7] Diakont,http://www.diakont.com/energy_services/robotic_inline_inspection.html [accessed July 2019]
[8] C. W. Rim, J. S. Bang, S. J. Moon, T. Y. Chung, H. J. Cho,and D. S. Bae, “Development of Software for Coupled Aero-Elastic Dynamic Analysis of Wind Turbine System,” inInternational Society of Offshore and Polar Engineers, Jan.2010.
5Copyright (c) The Government of Korea, 2019. Used by permission to IARIA. ISBN: 978-1-61208-730-6
SMART 2019 : The Eighth International Conference on Smart Cities, Systems, Devices and Technologies
14 / 46

Sequencing Intelligent Components through Releases as a Risk Reduction Strategy:a Smart-city Example
Pablo Valenzuela-Toledo
Department of Computer Sciences and InformaticsUniversity of La FronteraTemuco - Chile 4811230
email: [email protected]
Carlos Cares
Center of Studies in Software EngineeringUniversity of La FronteraTemuco - Chile 4811230
email: [email protected]
Abstract—In Component-Based Software Engineering, the pro-cess of selecting software components is under several riskfactors. Traditionally, these have been identified or mitigatedwith software project management techniques. However, the newdemand for intelligent systems has added complexity to theprocess. Despite the success and technological advances of thistype of systems, their development in an environment ready forproduction remains a challenge. There is a considerable numberof technical issues that limit their adoption, and their selectiondetermines the introduction of new risk factors, different fromtraditional ones. In this paper, we present the following idea:given a set of requirements for one component - intelligentbehaviour, for example - we propose to sequence and replacedifferent components through evolving releases as a risk reductiontechnique, instead of choosing the option of only one “right”component. Using a systematic mapping literature review, wegather the main risks of intelligent components. Then, we presenta formalization of the risk-based component selection technique.Finally, we offer an example to illustrate our approach using asequence of intelligent software components in the context of anair pollution forecasting system.
Keywords–Intelligent components; Component Selection;Component-Based Software Engineering; Risk Management.
I. INTRODUCTIONThe Component-Based Software Engineering approach is
based on the idea that software systems can evolve by selectingand aggregating appropriate software components [1]. Some ofthe recognized advantages of this approach are: (1) faster de-velopment, since assembling new applications through existingcomponents reduces development time; (2) easier to maintain,since managing one component at a time makes maintenanceeasier; (3) improved quality, since each component is testedbefore releasing it; (4) easier to create applications variantsand upgrades, since changing or upgrading each componentseparately is simpler; and (5) lower overall development cost,since the development cost is reduced by handling or upgradinginformation systems separately [2].
When a software-intensive system is evolving, the pro-cess of deciding which component to use involves differentavailable sourcing options, such as internal development, out-sourcing, buying a commercial component or adopting someopen source component [3]. Several factors have already beenidentified, in order to select a specific component: size, cost,maturity (years, versions), compatibility, and adherence tostandards, among many other nonfunctional requirements [3]–[5].
Risk management is a classical area in Project Managementdiscipline covering not only projects but also programs and
portfolios [6]. Risk management implies to manage potentialevents which would (negatively) impact long-term strategicobjectives and projects’ objectives, i.e., cost, time and scope.In software engineering, risk management has been a topicof growing relevance through time, and different risk fac-tors have been identified, such as analysis, design, coding,testing, planning, control, contracts, teams, clients, policiesand structure [7]. In relation to Component-Based SoftwareEngineering, the risk is moved from classical waterfall stagesand their management to component-based stages and theirmanagement, i.e., to component seeking, selecting, and testing.
While the field of Component-Based Software Engineeringhas identified ways to help select a software componentusing prioritization factors, there are new considerations andchallenges to overcome due to the intelligence software era[8]. This intelligence software era brings systems that areknown as systems that can automatically improve throughexperience [9]. The successes of the artificial intelligence fieldare visible, for example, in domains such as computer vision(e.g., object recognition [10]), natural language processing(e.g., information extraction [11]), and sound analysis (e.g.,voice recognition [12]). Diverse applications became part ofproducts of big and famous companies, such as Facebook,Google, and Apple, producing a closeness effect betweenpeople and artificial intelligence which has brought a new setof demands to software production.
Therefore, despite the success and technical advances inintelligence systems, its development in a production-readysetting still remains challenging. There is a lack of toolsand software engineering practices for building such systems,especially if the company/organization does not have an expe-rienced machine-learning research group and a data-orientedsupporting infrastructure [13]. For example, let us considerthe selection of a machine learning component to enable aweather forecasting functionality. This component may includespecifications about hardware (e.g., Graphics Processing Unit(GPU) models), platforms (e.g., machine learning, deep learn-ing library dependencies), source code (e.g., prepossessing,glue code), configuration (e.g., model features configuration),training data (e.g., sample period), or model state (e.g., versionof training model) [14]. This set of attributes differs fromtraditional prioritization factors, adding complexity to theselection process, and therefore risks.
To address the challenges presented above, in this arti-cle, we present an approach based on software components,which allows managing the risk involved in selecting complexsoftware components, such as those that provide intelligent
6Copyright (c) IARIA, 2019. ISBN: 978-1-61208-730-6
SMART 2019 : The Eighth International Conference on Smart Cities, Systems, Devices and Technologies
15 / 46
behaviour. The contributions of this work are the following:(1) we identify the intelligent component risks by conductinga systematic mapping literature review; (2) we introduce aformalization of the problem of risk in the process of softwarecomponents selection; (3) we present a selection sequencetechnique, from low to high risk, with a growing scenario ofrequirements; and (4) we illustrate the proposal by presentingthe case of a plan for implementing an air pollution forecastingsystem as part of a Smart-city project.
The remainder of this paper is organized as follows. In Sec-tion 2, we collect information for establishing the risky pointsof intelligent components, by applying the systematic mappingprotocol. In Section 3, we present a general framework forselecting a sequence of components in place of only one andthe constraints for this choice. In Section 4, we apply thegeneral proposal by showing a scenario of the selection of anintelligent component that enables an air pollution forecastingfunctionality. Finally, in Section 5, we conclude with benefitsand limitations.
II. OPEN ISSUES ON SELECTING AND ADAPTINGINTELLIGENT COMPONENTS
To investigate the risky points when developing, selectingor adapting intelligent software components, we analyze thestate-of-the-art of related software engineering challenges. Ourgoal was to understand what are the software engineeringchallenges, how they have been addressed, as well as thecontext where they occur. To achieve that, we perform asystematic mapping review (following the guidelines of [15][16]).
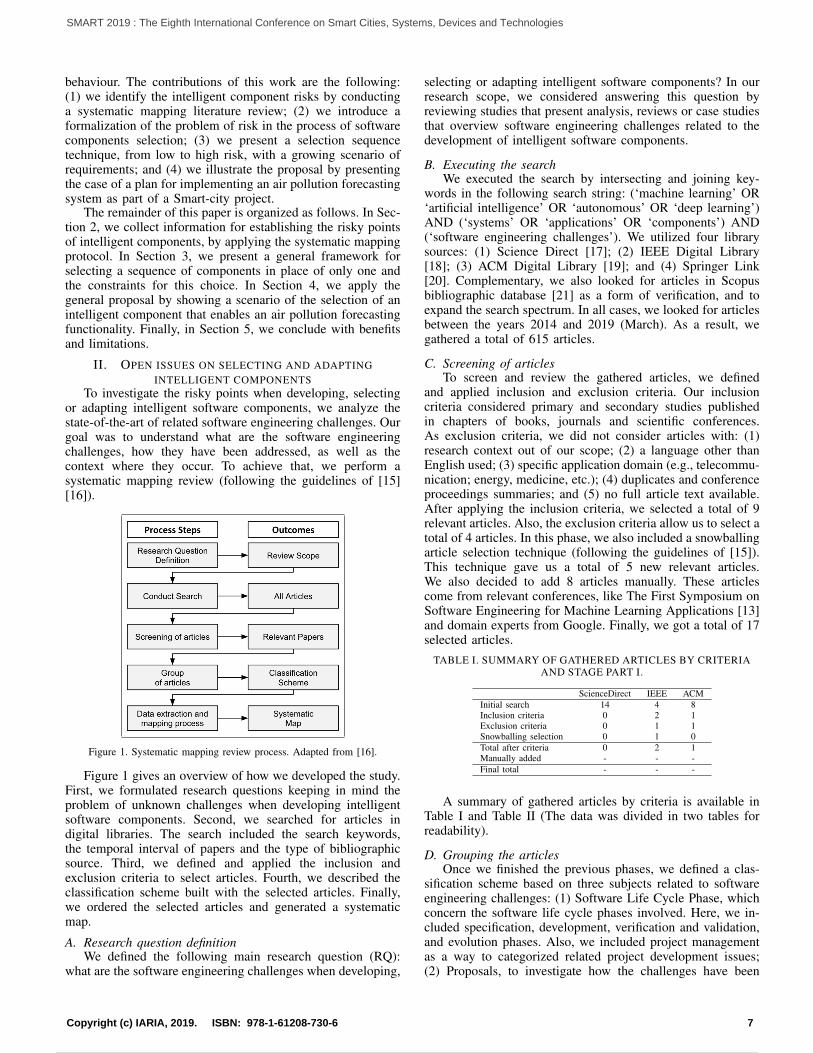
Figure 1. Systematic mapping review process. Adapted from [16].
Figure 1 gives an overview of how we developed the study.First, we formulated research questions keeping in mind theproblem of unknown challenges when developing intelligentsoftware components. Second, we searched for articles indigital libraries. The search included the search keywords,the temporal interval of papers and the type of bibliographicsource. Third, we defined and applied the inclusion andexclusion criteria to select articles. Fourth, we described theclassification scheme built with the selected articles. Finally,we ordered the selected articles and generated a systematicmap.
A. Research question definitionWe defined the following main research question (RQ):
what are the software engineering challenges when developing,
selecting or adapting intelligent software components? In ourresearch scope, we considered answering this question byreviewing studies that present analysis, reviews or case studiesthat overview software engineering challenges related to thedevelopment of intelligent software components.
B. Executing the searchWe executed the search by intersecting and joining key-
words in the following search string: (‘machine learning’ OR‘artificial intelligence’ OR ‘autonomous’ OR ‘deep learning’)AND (‘systems’ OR ‘applications’ OR ‘components’) AND(‘software engineering challenges’). We utilized four librarysources: (1) Science Direct [17]; (2) IEEE Digital Library[18]; (3) ACM Digital Library [19]; and (4) Springer Link[20]. Complementary, we also looked for articles in Scopusbibliographic database [21] as a form of verification, and toexpand the search spectrum. In all cases, we looked for articlesbetween the years 2014 and 2019 (March). As a result, wegathered a total of 615 articles.
C. Screening of articlesTo screen and review the gathered articles, we defined
and applied inclusion and exclusion criteria. Our inclusioncriteria considered primary and secondary studies publishedin chapters of books, journals and scientific conferences.As exclusion criteria, we did not consider articles with: (1)research context out of our scope; (2) a language other thanEnglish used; (3) specific application domain (e.g., telecommu-nication; energy, medicine, etc.); (4) duplicates and conferenceproceedings summaries; and (5) no full article text available.After applying the inclusion criteria, we selected a total of 9relevant articles. Also, the exclusion criteria allow us to select atotal of 4 articles. In this phase, we also included a snowballingarticle selection technique (following the guidelines of [15]).This technique gave us a total of 5 new relevant articles.We also decided to add 8 articles manually. These articlescome from relevant conferences, like The First Symposium onSoftware Engineering for Machine Learning Applications [13]and domain experts from Google. Finally, we got a total of 17selected articles.
TABLE I. SUMMARY OF GATHERED ARTICLES BY CRITERIAAND STAGE PART I.
ScienceDirect IEEE ACMInitial search 14 4 8Inclusion criteria 0 2 1Exclusion criteria 0 1 1Snowballing selection 0 1 0Total after criteria 0 2 1Manually added - - -Final total - - -
A summary of gathered articles by criteria is available inTable I and Table II (The data was divided in two tables forreadability).
D. Grouping the articlesOnce we finished the previous phases, we defined a clas-
sification scheme based on three subjects related to softwareengineering challenges: (1) Software Life Cycle Phase, whichconcern the software life cycle phases involved. Here, we in-cluded specification, development, verification and validation,and evolution phases. Also, we included project managementas a way to categorized related project development issues;(2) Proposals, to investigate how the challenges have been
7Copyright (c) IARIA, 2019. ISBN: 978-1-61208-730-6
SMART 2019 : The Eighth International Conference on Smart Cities, Systems, Devices and Technologies
16 / 46
addressed. That includes development approach, project man-agement, adjustment, measurement strategy, tool development,team diversity or no strategy; (3) Context, to investigate wherethe challenges have happened. We considered the academy, bigindustry (e.g., Google or Apple) or small industry (e.g., onlineor startup companies).
TABLE II. SUMMARY OF GATHERED ARTICLES BY CRITERIAAND STAGE PART II.
Springer Scopus TotalInitial search 45 544 615Inclusion criteria 0 6 9Exclusion criteria 0 2 4Snowballing selection 0 4 5Total after criteria 0 6 9Manually added - - 8Final total - - 17
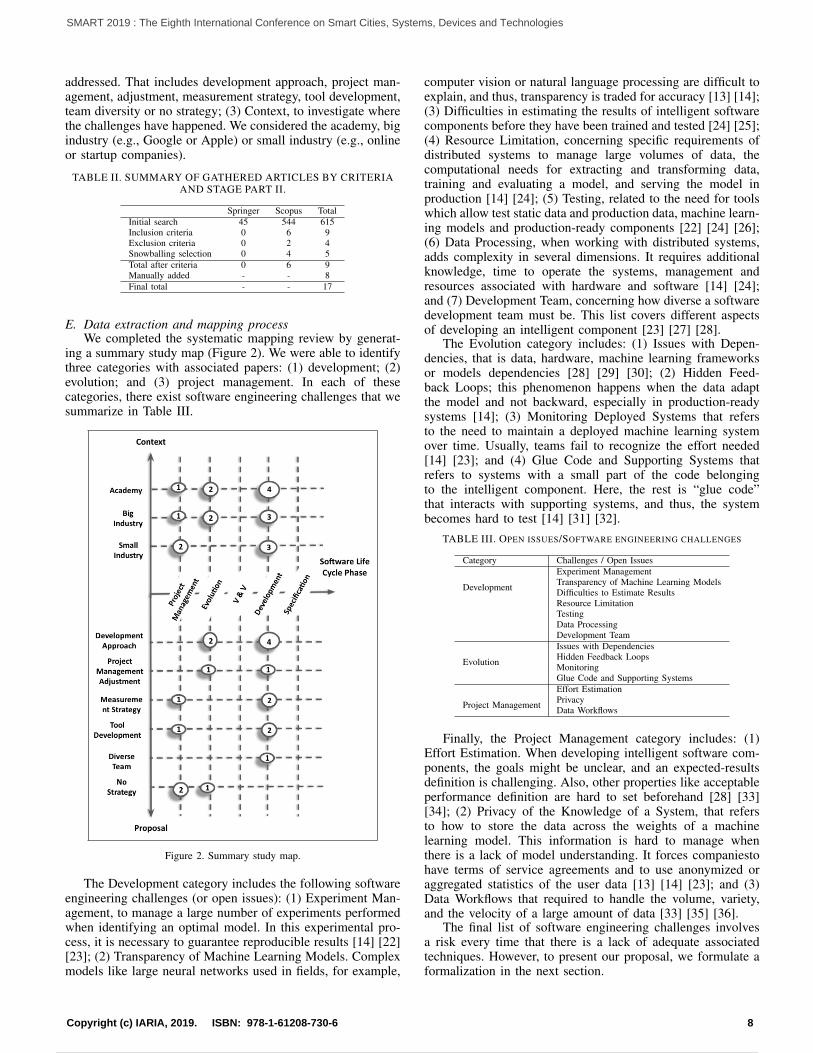
E. Data extraction and mapping processWe completed the systematic mapping review by generat-
ing a summary study map (Figure 2). We were able to identifythree categories with associated papers: (1) development; (2)evolution; and (3) project management. In each of thesecategories, there exist software engineering challenges that wesummarize in Table III.
Figure 2. Summary study map.
The Development category includes the following softwareengineering challenges (or open issues): (1) Experiment Man-agement, to manage a large number of experiments performedwhen identifying an optimal model. In this experimental pro-cess, it is necessary to guarantee reproducible results [14] [22][23]; (2) Transparency of Machine Learning Models. Complexmodels like large neural networks used in fields, for example,
computer vision or natural language processing are difficult toexplain, and thus, transparency is traded for accuracy [13] [14];(3) Difficulties in estimating the results of intelligent softwarecomponents before they have been trained and tested [24] [25];(4) Resource Limitation, concerning specific requirements ofdistributed systems to manage large volumes of data, thecomputational needs for extracting and transforming data,training and evaluating a model, and serving the model inproduction [14] [24]; (5) Testing, related to the need for toolswhich allow test static data and production data, machine learn-ing models and production-ready components [22] [24] [26];(6) Data Processing, when working with distributed systems,adds complexity in several dimensions. It requires additionalknowledge, time to operate the systems, management andresources associated with hardware and software [14] [24];and (7) Development Team, concerning how diverse a softwaredevelopment team must be. This list covers different aspectsof developing an intelligent component [23] [27] [28].
The Evolution category includes: (1) Issues with Depen-dencies, that is data, hardware, machine learning frameworksor models dependencies [28] [29] [30]; (2) Hidden Feed-back Loops; this phenomenon happens when the data adaptthe model and not backward, especially in production-readysystems [14]; (3) Monitoring Deployed Systems that refersto the need to maintain a deployed machine learning systemover time. Usually, teams fail to recognize the effort needed[14] [23]; and (4) Glue Code and Supporting Systems thatrefers to systems with a small part of the code belongingto the intelligent component. Here, the rest is “glue code”that interacts with supporting systems, and thus, the systembecomes hard to test [14] [31] [32].
TABLE III. OPEN ISSUES/SOFTWARE ENGINEERING CHALLENGES
Category Challenges / Open Issues
Development
Experiment ManagementTransparency of Machine Learning ModelsDifficulties to Estimate ResultsResource LimitationTestingData ProcessingDevelopment Team
Evolution
Issues with DependenciesHidden Feedback LoopsMonitoringGlue Code and Supporting Systems
Project Management
Effort EstimationPrivacyData Workflows
Finally, the Project Management category includes: (1)Effort Estimation. When developing intelligent software com-ponents, the goals might be unclear, and an expected-resultsdefinition is challenging. Also, other properties like acceptableperformance definition are hard to set beforehand [28] [33][34]; (2) Privacy of the Knowledge of a System, that refersto how to store the data across the weights of a machinelearning model. This information is hard to manage whenthere is a lack of model understanding. It forces companiestohave terms of service agreements and to use anonymized oraggregated statistics of the user data [13] [14] [23]; and (3)Data Workflows that required to handle the volume, variety,and the velocity of a large amount of data [33] [35] [36].
The final list of software engineering challenges involvesa risk every time that there is a lack of adequate associatedtechniques. However, to present our proposal, we formulate aformalization in the next section.
8Copyright (c) IARIA, 2019. ISBN: 978-1-61208-730-6
SMART 2019 : The Eighth International Conference on Smart Cities, Systems, Devices and Technologies
17 / 46

III. SEQUENCING COMPONENTS AS RISK REDUCTIONSTRATEGY
In this section, we present a theoretical point of view ofthe problem of the selection of several components in place ofselecting only one. Regarding this topic, the main focus of theliterature is on how to select one component for a specificset of requirements. Here, the methods and techniques fordecision making are qualitative approaches [5] [37] [38]. To thebest of our knowledge, there are no proposals considering theredundancy of components for the same set of requirements,and there are not proposals considering components’ risks.In this context, we consider that most of the quality factorsare uncertain factors because the expected quality occurs inthe best case, once the component has been successfullyintegrated. This perspective manages not only quality factorsbut traditional uncertainties, such as total time and budget.
In this proposal, we keep one of the main assumptionsof other authors, that is, we decide what components toselect before the test and try cycle. Risk perspective acceptsthat the uncertainty of a project is higher at the beginningand diminishes as it progresses due to proactive planningand pertinent decision-taking [6]. Therefore, the focus of theproposal is on the worst high risks case scenario, i.e., at thebeginning of the project.
In the following, we present a set of definitions for buildinga conceptual framework which enables the consideration ofrisks as a manifestation of uncertainties associated with com-ponents.
Definition 1: The nth-dimension Risk of Using a Compo-nent c, as part of a software solution s, or simply RUC, is avector ~r cs = (r1, r2, ..., rn) where ri ∈ [0, 1] ⊆ IR.
Definition 2: The nth-dimension risk-evaluation of a set ofcomponents C = {c1, c2, ..., cm} for a software solution s isdenoted as the relationship RCs ⊆ C × [0, 1]m:
RCs = {(c1, ~r c1s ), (c2, ~rc2s ), ..., (cm, ~r
cms )} (1)
where the second element ~r cis is the nth dimension RUCcorresponding to the component ci in the software solution s.
Definition 3: A risk-based prioritization function over aset of components C = {c1, c2, ..., cm} is a function ρ :[0, 1]n −→ [0, 1] ⊆ IR. The resulting value of ρ(~r cis ) willbe called the total risk of a the component ci under ρ.
Definition 4: The functionality of a software componentrespecting the set of requirements Req = {r1, r2, ..., rF } isa vector ~f cReq = (f1, f2, ..., fk) where fi ∈ {0, 1}. It will besaid that the component c accomplishes the functionality fi ifffi = 1. In contrast, it will be said that the component c doesnot accomplish the functionality fi iff fi = 0.
Definition 5: The functionalities of two components c1 andc2 respecting the set of requirements Req = {r1, r2, ..., rF }are the same iff ~f c1Req = ~f c2Req and it will be said that c1 andc2 have different functionality iff ~f c1Req 6= ~f c2Req .
Definition 6: Given two components c1 and c2, the set ofrequirements Req = {r1, r2, ..., rF }, the functionality of c1 as~f c1Req = (f1, f2, ..., fm) and the functionality of c2 as ~f c1Req =(g1, g2, ..., gm) , then it will be said that c1 has less or equalfunctionality than c2, denoted as ~f c1Req � ~f c2Req iff fk ≤ gk∀k.
Lemma 1: Given a set of components C, the binary re-lation � for functionalities of components imposes a partialorder on C. Therefore, C is posed under �.
Definition 7: The functional impact of a RUC ~r c is a
function λ : [0, 1]n −→ {0, 1}k. The resulting value λ(~r c)will be called the loss of functionality of ~r c. It will be saidthat there is no loss of functionality iff: λ(~r c) = ~f c and it willbe said that there is a total loss of functionality iff λ(~r c) = ~0.
Definition 8: Given a component c, its RUC ~r c, its cor-responding evaluation of its loss of functionality λ(~r c) andρ a risk-based prioritization function, then the probability ofoccurrence of that loss of functionality will be ρ(~r c)λ(~r c).
Definition 9: A risk-appraised situation for a componentselection stage, as part of a component-based software pro-cess for developing the software s, is a quintuple As =<C,Req,Rsk, ρ, λ>, where, C is a non empty set of com-ponents, Req is a non empty set of requirements, Rsk is aparticular nth-dimension risk-evaluation RCs , ρ is a risk-basedprioritization function over C, and λ is a functional impactfunction applicable to risks in RCs .
Definition 10: A risk-appraised situation for a componentselection stage, as part of a component-based software processAs = <C,Req,Rsk, ρ, λ>, is called coherent iff
~f ciReq � ~fcjReq ⇒ ρ(~r cis ) ≤ ρ(~r cjs ) ∀ci, cj ∈ C, (2)
When this constraint is not satisfied, then it is called anincoherent risk-appraised situation.
Lemma 2: Any risk-appraised situationAs =<C,Req,Rsk, ρ, λ>, having just one element inC, is coherent.
The proof is trivial because there is only one element in Cand ρ is a function. Therefore, the total risk of the componentci is equal to itself.
Definition 11: A set of components D is called dis-posable by risk of a risk-appraised situation A′
s =<C ∪ D,Req,Rsk, ρ, λ> iff A′
s is incoherent, As =<C,Req,Rsk, ρ, λ> is coherent and both situations accom-plish the condition of equal functionality, i.e.,⋃
ci∈C
~f ciReq =⋃
ck∈C∪D
~f ckReq (3)
Lemma 3: Given an incoherent risk-appraised situationAs =<C,Req,Rsk, ρ, λ> then, by definition
∃ci, cd ∈ C ~f cdReq ≺ ~f ciReq (4)
andρ(~r cd) ≥ ρ(~r cd) (5)
then {cd} is disposable-by-risk of As.Lemma 4: Given a coherent risk-appraised situation
As =<C,Req,Rsk, ρ, λ> and ∃ci, cd ∈ C~f cdReq ≺ ~f ciReq (6)
andρ(~r cd) ≥ ρ(~r ci) (7)
then {cd} is disposable-by-risk of As.
IV. THE ARAUCANIA DIGITAL SMART-CITY EXAMPLEIn order to illustrate our proposal, we present an exam-
ple using the Araucanıa Digital Smart-city Project (ADSP)context, that includes air pollution forecasting functionality.The ADSP goal is to develop smart cities systems in theregion of La Araucana, Chile. The project is funded by theInter-American Development Bank (BID) and is executed byindustry and academy actors [39].
9Copyright (c) IARIA, 2019. ISBN: 978-1-61208-730-6
SMART 2019 : The Eighth International Conference on Smart Cities, Systems, Devices and Technologies
18 / 46
First, we define our risk vector, following Definition 1, thatconsiders the risk associated with intelligent components andwith traditional software development projects (we present ascenario with already evaluated risks, and thus, we do notreview how the values were generated). The risks for the in-telligent components are those already identified in Section II:(1) Experiment Management (EM), p = 0.05; (2) Difficultiesto Estimate Results (DER), p = 0.1; (3) Development Team(DT), p = 0.15; (4) Glue Code (GC), p = 0.15; and (5) DataWorkflows (DW), p = 0.05. We also include the following 2risks related to traditional software development: (6) BudgetLimitations (BL), p = 0.15; and (7) Timeline Restriction (TR),p = 0.15 [40].
Second, we define a set of software components thatprovide air pollution forecasting functionality. Each componentconsiders an associated algorithm previously used in anothercontext for this purpose [41]. We name every component basedon the associated algorithm-name as follows: (1) Support Vec-tor Machine (SVM); (2) Artificial Neural Networks (ANN);(3) K-Means (KM); (4) K-Nearest Neighbors (KNN); and (5)Regression Models (RM).
Third, we present a resume of the seven risks evaluationrelated to the five intelligent software components (all men-tioned above) (Table IV). Also, we set the values according tothe context that the software development team and the projectgive us (we stand that we do not consider the methodology tocalculate the risk value, and thus, we assume that this exampledoes not represent a case study with appropriate empiricalrigour). Here, the team is one project manager, two seniorsoftware developers, one junior data analyst, and one seniorsoftware engineering scientist. It is crucial to notice that wedo not have a machine learning specialist in our team (thiscontext represents a particular case that may change with adifferent team or a different project).
TABLE IV. RISK EVALUATION OF AN INTELLIGENT COMPONENTS SET
RCs EM DER DT GC DW BL TR ρ
SVM 0.5 0.5 0.6 0.5 0.6 0.5 0.4 0.41ANN 0.4 0.6 0.6 0.5 0.8 0.6 0.6 0.47KM 0.3 0.4 0.4 0.5 0.6 0.4 0.3 0.47KNN 0.3 0.4 0.4 0.6 0.6 0.4 0.3 0.34RM 0.2 0.2 0.2 0.6 0.6 0.3 0.1 0.24
In order to evaluate how many software requirementsaccomplish the functionalities of a set of software components,we present a resume in Table V. The collection of softwarerequirements is defined as follows [26]: (1) Air Pollution IndexForecasting (APF), i.e., the prediction of the future value ofthe polluting particle; (2) Interpolation of the Current Pollutionvalue (ICP), i.e., constructing new data points within somegeographical areas; (3) Automatic Fail Identification (AFI),i.e., automatic identification of “not a number”(NaNs) valuesor infinities appearing in the model during the execution ofthe system; (4) Editable Model (EM), that is, the compo-nent supports hyper-parameters updating; and (5) Stale ModelAware (SMA), that is, the model allows an automatic staleidentification.
In Table VI, we present the loss of functionality of compo-nents due to the risks mentioned above. To do this, we use theλ function on each functionality defined in the previous step.
Following the definitions, we have a risk-appraised situa-tion as we describe in Definition 9. Additionally, there exists anincoherent risk-appraised scenario because, for example, SVM
TABLE V. THE FUNCTIONALITY OF AN INTELLIGENT SOFTWARECOMPONENT WITH RESPECT TO A SET OF REQUIREMENTS
~f cReq APF CCD AFI EM SMA ρ
SVM 1 0 0 0 0 0.41ANN 1 1 1 1 0 0.47KM 0 1 0 1 0 0.47KNN 1 1 0 1 0 0.34RM 1 1 1 0 0 0.24
TABLE VI. LOSS OF FUNCTIONALITY OF COMPONENTS
λ λ(APF ) λ(CCD) λ(AFI) λ(EM) λ(SMA) ρSVM 1 0 0 0 0 0.41ANN 1 1 1 1 1 0.47KM 0 1 0 1 0 0.47KNN 1 1 0 1 0 0.34RM 1 1 0 0 0 0.24
provides less functionality than RM, and its risk is higher thanRM. Therefore, SVM is risk disposable. Similarly, KNN offersbetter functionality than KM, and its risk is lower than the riskof KM. Therefore, KM is risk disposable too. Removing thedisposable components, we have the following situation that� imposes to the component set:
~f RMReq � ~f ANNReq ; ~f KNNReq � ~f ANNReq (8)
Finally, we selected these three components for the fore-casting functionalities (RM, KNN, ANN). The potential loss offunctionality due to risks, by using the logic operator “AND”,gives us additional security on functionality AFI. To selecta sequence, we first select the less risky component to ensuresome functionality on early releases. But, due to the team size,we may support only prototype development at the moment.Therefore, we first plan RM and KNN then ANN. Note thatrisks are going down from 0.47 to 0.24*0.34*0.47.
V. CONCLUSIONIn this paper, we have presented a solution proposal to
the problem of intelligent software component selection. First,we have conducted a systematic literature review that allowsus to identify a collection of risks that we classified intothree main categories: (1) Development; (2) Evolution; and(3) Project Management. This review differs from previousrelated ones because our goal has been found lack of softwareengineering, instead of identifying a specific way to deployintelligent systems. Second, we have formalized our proposalby presenting a conceptual framework and risk reduction strat-egy to support the component selection process. To the bestof our knowledge, there is no work addressing the selectionproblem in the way that we have been presenting it. Third,we present the scenario of risks and how to select more thanone component instead of just the best one. In this way, theadvantage of this proposal is that it allows looking for not onlythe optimal option but a set of available best ones. Fourth, wehave illustrated this scenario with a case of software planningin the context of an air pollution forecasting functionality aspart of a Smart-city project. Fifth, as a limitation, while weconsidered that our presented example illustrates our proposal,under no circumstances we pretend to present this as a casestudy or an empirical evaluation. Thus, our future work is:(1) update our systematic literature review; (2) improve theproposal by formulating the component selection problem as asearch based problem. With this approach, we expect to provethe methodological framework supporting our idea; and (3)
10Copyright (c) IARIA, 2019. ISBN: 978-1-61208-730-6
SMART 2019 : The Eighth International Conference on Smart Cities, Systems, Devices and Technologies
19 / 46
conduct a study case, using the frame of The Araucanıa DigitalSmart-city Project.
ACKNOWLEDGMENTThe authors would like to thank to ATNME16393CH
SMART CITY IN A BOX project 2019, Temuco, Chile.
REFERENCES[1] G. Pour, “Component-based software development approach: new op-
portunities and challenges,” in Proceedings. Technology of Object-Oriented Languages. TOOLS 26 (Cat. No. 98EX176). IEEE, 1998,pp. 376–383.
[2] H.-I. Jeong, C.-S. Lee, C.-H. Kim, C. Park, and H.-C. Woo, “Designof a software component bank for distribution,” Journal of systemsintegration, vol. 10, no. 3, 2001, pp. 223–237.
[3] P. Chatzipetrou et al., “Component selection in software engineering-which attributes are the most important in the decision process?” in 201844th Euromicro Conference on Software Engineering and AdvancedApplications (SEAA). IEEE, 2018, pp. 198–205.
[4] M. Borg et al., “Selecting component sourcing options: A survey ofsoftware engineerings broader make-or-buy decisions,” Information andSoftware Technology, vol. 112, 2019, pp. 18–34.
[5] C. Alves, X. Franch, J. P. Carvallo, and A. Finkelstein, “Using goalsand quality models to support the matching analysis during cots selec-tion,” in International Conference on COTS-Based Software Systems.Springer, 2005, pp. 146–156.
[6] H. Sanchez, B. Robert, M. Bourgault, and R. Pellerin, “Risk manage-ment applied to projects, programs, and portfolios,” International journalof managing projects in Business, vol. 2, no. 1, 2009, pp. 14–35.
[7] H. R. Costa, M. d. O. Barros, and G. H. Travassos, “Evaluating softwareproject portfolio risks,” Journal of Systems and Software, vol. 80, no. 1,2007, pp. 16–31.
[8] E. Woods, “Software architecture in a changing world,” IEEE Software,vol. 33, no. 6, 2016, pp. 94–97.
[9] M. Jordan and T. M. Mitchell, “Machine learning: Trends, perspectives,and prospects,” Science, vol. 349, no. 6245, 2015, pp. 255–260.
[10] B. Kehoe, A. Matsukawa, S. Candido, J. Kuffner, and K. Goldberg,“Cloud-based robot grasping with the google object recognition engine,”in 2013 IEEE International Conference on Robotics and Automation.IEEE, 2013, pp. 4263–4270.
[11] A. Conneau, H. Schwenk, L. Barrault, and Y. Lecun, “Very deepconvolutional networks for natural language processing,” arXiv preprintarXiv:1606.01781, vol. 2, 2016, pp. 1107–116.
[12] J. R. Bellegarda, “Spoken language understanding for natural interac-tion: The siri experience,” in Natural Interaction with Robots, Knowbotsand Smartphones. Springer, 2014, pp. 3–14.
[13] F. Khomh, B. Adams, J. Cheng, M. Fokaefs, and G. Antoniol, “Softwareengineering for machine-learning applications: The road ahead,” IEEESoftware, vol. 35, no. 5, 2018, pp. 81–84.
[14] A. Arpteg, B. Brinne, L. Crnkovic-Friis, and J. Bosch, “Softwareengineering challenges of deep learning,” in 2018 44th Euromicro Con-ference on Software Engineering and Advanced Applications (SEAA).IEEE, 2018, pp. 50–59.
[15] C. Wohlin, “Guidelines for snowballing in systematic literature studiesand a replication in software engineering,” in Proceedings of the18th international conference on evaluation and assessment in softwareengineering, Citeseer. ACM, 2014, p. 38.
[16] K. Petersen, S. Vakkalanka, and L. Kuzniarz, “Guidelines for conduct-ing systematic mapping studies in software engineering: An update,”Information and Software Technology, vol. 64, 2015, pp. 1–18.
[17] “Science direct,” 2019, (Accessed on 13/06/2019). [Online]. Available:https://www.sciencedirect.com/
[18] “Ieee digital library,” 2019, (Accessed on 13/06/2019). [Online].Available: https://ieeexplore.ieee.org/Xplore/home.jsp
[19] “Acm digital library,” 2019, (Accessed on 13/06/2019). [Online].Available: https://dl.acm.org/
[20] “Springer link,” 2019, (Accessed on 13/06/2019). [Online]. Available:https://link.springer.com/
[21] “Scopus,” 2019, (Accessed on 13/06/2019). [Online]. Available:https://www.scopus.com/home.uri
[22] E. Breck, S. Cai, E. Nielsen, M. Salib, and D. Sculley, “The mltest score: A rubric for ml production readiness and technical debtreduction,” in 2017 IEEE International Conference on Big Data (BigData). IEEE, 2017, pp. 1123–1132.
[23] J. Bosch, H. H. Olsson, and I. Crnkovic, “It takes three to tango:Requirement, outcome/data, and ai driven development,” in Proceedingsof the International Workshop on Software-intensive Business: Start-ups, Ecosystems and Platforms, vol. 2018, 2018, pp. 177–192.
[24] O. Hummel, H. Eichelberger, A. Giloj, D. Werle, and K. Schmid, “Acollection of software engineering challenges for big data system de-velopment,” 2018 44th Euromicro Conference on Software Engineeringand Advanced Applications (SEAA), 2018, pp. 362–369.
[25] M. Felderer, B. Russo, and F. Auer, “On testing of data-intensivesoftware systems,” CoRR, vol. abs/1903.09413, 2019, in press.
[26] E. Breck, S. Cai, E. Nielsen, M. Salib, and D. Sculley, “Whats yourml test score? a rubric for ml production systems.” IEEE, 2016, pp.19–26.
[27] M. Kim, T. Zimmermann, R. DeLine, and A. Begel, “The emergingrole of data scientists on software development teams,” in Proceedingsof the 38th International Conference on Software Engineering. ACM,2016, pp. 96–107.
[28] P. Bailis, K. Olukotun, C. Re, and M. Zaharia, “Infrastructure for usablemachine learning: The stanford dawn project,” 2017.
[29] T. Menzies, C. Bird, T. Zimmermann, W. Schulte, and E. Kocaganeli,“The inductive software engineering manifesto: principles for industrialdata mining,” in MALETS ’11. ACM, 2011, pp. 19–26.
[30] E. Breck, N. Polyzotis, S. Roy, S. E. Whang, and M. Zinkevich, “Datainfrastructure for machine learning,” 2018, (Accessed on 13/06/2019).[Online]. Available: http://www.sysml.cc/doc/9.pdf
[31] D. Morgenthaler, M. Gridnev, R. Sauciuc, and S. Bhansali, “Searchingfor build debt: Experiences managing technical debt at google,” in 2012Third International Workshop on Managing Technical Debt (MTD).IEEE, 2012, pp. 1–6.
[32] K. M. Anderson, “Embrace the challenges: Software engineering in abig data world,” 2015 IEEE/ACM 1st International Workshop on BigData Software Engineering, 2015, pp. 19–25.
[33] T. Menzies, C. Bird, T. Zimmermann, W. Schulte, E. Kocaganeli,and T. Zimmermann, “The inductive software engineering manifesto:principles for industrial data mining,” 2011, pp. 19–26.
[34] D. Sculley et al., “Machine learning: The high interest credit card oftechnical debt,” in SE4ML: Software Engineering for Machine Learning(NIPS 2014 Workshop), 2014.
[35] H. H. Olsson and J. Bosch, “Towards data-driven product development:A multiple case study on post-deployment data usage in software-intensive embedded systems,” in International Conference on LeanEnterprise Software and Systems. Springer, 2013, pp. 152–164.
[36] G. Yenni et al., “Developing a modern data workflow for regularlyupdated data,” in PLoS biology. Public Library of Science, 2019.
[37] R. Land, L. Blankers, M. Chaudron, and I. Crnkovic, “Cots selectionbest practices in literature and in industry,” in International Conferenceon Software Reuse. Springer, 2008, pp. 100–111.
[38] A. Mohamed, G. Ruhe, and A. Eberlein, “Cots selection: past, present,and future,” in 14th Annual IEEE International Conference and Work-shops on the Engineering of Computer-Based Systems (ECBS’07).IEEE, 2007, pp. 103–114.
[39] “Ufro smart city,” 2019, (Accessed on 13/06/2019). [Online]. Available:http://smartcity.ufro.cl/
[40] L. Wallace, M. Keil, and A. Rai, “Understanding software project risk:a cluster analysis,” Information & management, vol. 42, no. 1, 2004,pp. 115–125.
[41] C. Bellinger, M. S. M. Jabbar, O. R. Zaıane, and A. R. Osornio-Vargas,“A systematic review of data mining and machine learning for airpollution epidemiology,” in BMC public health. BMC Public Health,2017, p. 907.
11Copyright (c) IARIA, 2019. ISBN: 978-1-61208-730-6
SMART 2019 : The Eighth International Conference on Smart Cities, Systems, Devices and Technologies
20 / 46

A Strategy for Drone Traffic Planning Dynamic Flight-paths for Drones in Smart Cities
Lasse Berntzen School of Business
University of South-Eastern Norway Kongsberg, Norway
email: [email protected]
Adrian Florea Faculty of Engineering
Lucian Blaga University of Sibiu Sibiu, Romania
email: [email protected]
Cristian Molder Center of Excellence in Robotics and Autonomous Systems
Military Technical Academy “Ferdinand I” Bucharest, Romania
email: [email protected]
Noureddine Bouhmala Faculty of Engineering and Maritime Sciences
University of South-Eastern Norway Kongsberg, Norway
email: [email protected]
Abstract—This paper presents a solution for creating dynamic flight plans for drones. The number of drones is expected to increase dramatically, and there will be a demand for drone traffic planning solutions. The approach used here is based on a multidimensional grid with fixed top-level paths and lower-level paths used for local traffic between the departure and arrival points and the top-level paths. Flight plans may change dynamically if disruptions happen. The proposed solution includes the establishment of temporary no-fly zones and priority traffic.
Keywords-unmanned aerial vehicles; drones; flight planning; smart cities; routing algorithms; scheduling algorithms.
I. INTRODUCTION “Smart cities” is a concept that uses information and
communication technology to improve the quality of life for its citizens by delivering better services, reducing environmental footprint and improving citizen participation. One aspect of smart cities is to make transport smarter [1]. This paper focuses on how to meet the challenges of drone traffic for delivery and other applications.
Some of the leading information and communication technology companies (Google and Amazon) are currently exploring new delivery services using unmanned aerial vehicles (drones). Drone technology has also attracted the attention of traditional logistics companies like DHL, UPS and Deutsche Post AG, as well as big retailers like Walmart.
Drones are becoming increasingly important in agriculture, medical sector, civil engineering, insurance, security, and energy. According to Goldman Sachs, the future drone market is predicted to be $100 billion by the year 2020 [2] where the defense sector remains the largest consumer with around 70%. However, Business Insider Intelligence researchers are less optimistic and expect sales of drones to surpass $12 billion in 2021 [3]. The lift capacity
and operating distance are improving, mainly due to advances in battery technology.
Drones are particularly of great interest for last mile delivery applications in smart cities. Last mile delivery is the end part of the delivery chain, which deals with the distribution of goods from long haul to the end user, being the most expensive part of the delivery chain. As part of the upcoming Industry 4.0 revolution, the autonomy of drones plays an essential role in the evolution of logistics. Drones are becoming commonly used in the early stages of logistics (commonly called first-mile) as well as in its last stages.
Intralogistics operations deal with the optimization, integration, automatization, and management of data flow and goods inside a distribution center. Drones can be smartly used for transportation inside factories, spare parts delivery, goods storing and delivering.
Use of drones for city infrastructures surveillance is of great interest as they can be used for building inspections and maintenance.
In 2013, Amazon announced Prime Air [4], a service that utilizes multirotor drones to deliver packages from Amazon to customers. The German logistics company Deutsche Post DHL started its Parcelcopter project in 2014. One application of the Parcelcopter [5] has been to transport medicine to the German island of Juist in the North Sea.
Google revealed Project Wing [6] in 2014 to produce drones that can deliver larger items than Prime Air and Parcelcopter. Recently, in April 2019, Project Wing has received regulatory approval to start making last-mile commercial drone deliveries in Australia, according to the American technology news channel - The Verge [7].
In 2014, the US company PINC launched the PINC Air service, using its drones to follow goods in transports, vehicles and more. These drones are equipped with cameras, Radio-Frequency Identification (RFID) and barcode readers, and have software for real-time 3D mapping, navigation, goods identification and localization [8].
12Copyright (c) IARIA, 2019. ISBN: 978-1-61208-730-6
SMART 2019 : The Eighth International Conference on Smart Cities, Systems, Devices and Technologies
21 / 46

In 2014, the United Arab Emirates announced its plan to use drones to distribute official government documents such as permits and identification cards [9].
A startup company, Matternet has partnered with Swiss Post to test a lightweight package delivery drone [10].
Recently, the UNICEF Innovation labs [11] explored the use of drones for search and rescue operations. The drones could be useful in emergency situations, such as rescuing victims of natural disasters (floods, extreme temperature events, earthquakes, mudslides, storms and wildfires) when roads are no longer usable. Drones may be used to transport life-saving materials in both humanitarian and development contexts [12]. Deliveries of emergency medical supplies and kits can reduce the response time in multiple humanitarian contexts that require the provision of life-saving immunization materials, biological samples, transfusion plasma or organs. UNICEF has used drones for such operation in African countries and Vanuatu isle in the Pacific Ocean [13].
A kidney scheduled for transplant was delivered by a drone for the first time on April 19th, 2019, in Baltimore, United States [14]. A specially tailored drone having the size of a washing machine carried a healthy human kidney to hospital. The doctors successfully transplanted the organ. The operation took place at night, and the drone traveled 4.5 km in 10 minutes. The whole operation was the result of a three-year collaboration of a team of doctors, researchers, engineers and plane experts who worked together at the Maryland Medical Center and the Living Legacy Foundation. The transport of transplant organs using the drones reduces costs, reduces transport time and improves the quality of medical services. Conventional transport methods, including the use of cars, helicopters and planes, have significant drawbacks: airplanes are too expensive, commercial flights take too long, and small aircraft are dangerous to medical teams.
The increase in drone traffic calls for a traffic management system to make sure that drones operate in a regulated environment to avoid collisions and improve the safety of drone operations. The aim of this paper is to present an idea for how drone flight management can be implemented in urban areas.
The rest of the paper is organized as follows: The next section addresses some current challenges related to the commercial use of drones. Section III provides an overview of related work. Section IV discusses drone flight planning. Section V presents an idea for an algorithm. Section VI concludes and provides ideas for further research.
II. CURRENT CHALLENGES The use of drones for professional purposes introduces a
set of challenges that must be observed and addressed: • Most drones use electrical motors. The battery capacity
is proportional to the weight of the battery. The capacity of the batteries becomes a limiting factor in how far a drone can travel before needing to be recharged. Battery technology is improving and will increase both travel distance and payload weight.
• Flying distance and payload weight depends on battery capacity. A larger battery will increase flying distance, but also decrease the payload capacity. Balancing payload weight, battery weight, and flight time are important considerations when attempting to minimize the cost or the delivery time for drone deliveries [15].
• The flight planning for drones is a multi-objective optimization problem. The solution needs to take into account the existence of no-fly zones and dedicated paths for drones to follow.
• Drones may be difficult to maneuver in tight spaces. • Scalability: How does a fleet of drivable drones might
be organized so that they do not crash into one another implemented in the complex reality of real city streets and the surrounding airspace. This calls for implementation of traffic planning and collision avoidance systems as more and more drones enter the airspace.
• Algorithmic path-planning taking into account of urban-like landscape with buildings, roads, parking areas, landing pads and no-fly zones.
• Since the law regarding the use of drones is still not fully developed, other challenges or restrictions are currently being regulated by the European Union [16], e.g., drone weight, maximum possible flying altitude, no-fly zones over "crowds", minimum safe distance, etc.
III. RELATED WORK Mok [17] presents the prototypes of drones developed at
MIT´s Computer Science and Artificial Intelligence Laboratory (CSAIL), located in Cambridge, Massachusetts, USA. These drones, equipped with wheels, represent a mix between a drone and a tiny car that can not only fly but are capable of driving on the ground, making a tradeoff related to energy consumption and speed (time of delivery). Their tests included eight drones deployed at the same time and following autonomously their own path revealed the machines could fly for 90 meters or drive for 252 meters before needing to recharge their batteries, a relatively short distance.
Schermer et al. [18] used a heuristic algorithm to extend the original Vehicle Routing Problem (VRP) [18] to the Vehicle Routing Problem with Drones (VRPD), where a drone works in tandem with a vehicle to reduce delivery times. The authors emphasize qualitative differences between trucks and drones and highlight the usefulness of incorporating drones in last-mile logistics.
The limitations of existing VRP solutions applied for planning drone deliveries are illustrated by Dorling, Heinrichs, Messier and Magierowski [15]: multiple trips to the depot are not permitted leading to solutions with excess drones, or the effect of battery and payload weight on energy consumption is not considered, leading to costly or infeasible routes. The authors solve drone delivery problems with a Multi-Trip VRP (MTVRP) that compensates for each drone’s limited carrying capacity by reusing drones when possible. The authors used a model based on the
13Copyright (c) IARIA, 2019. ISBN: 978-1-61208-730-6
SMART 2019 : The Eighth International Conference on Smart Cities, Systems, Devices and Technologies
22 / 46
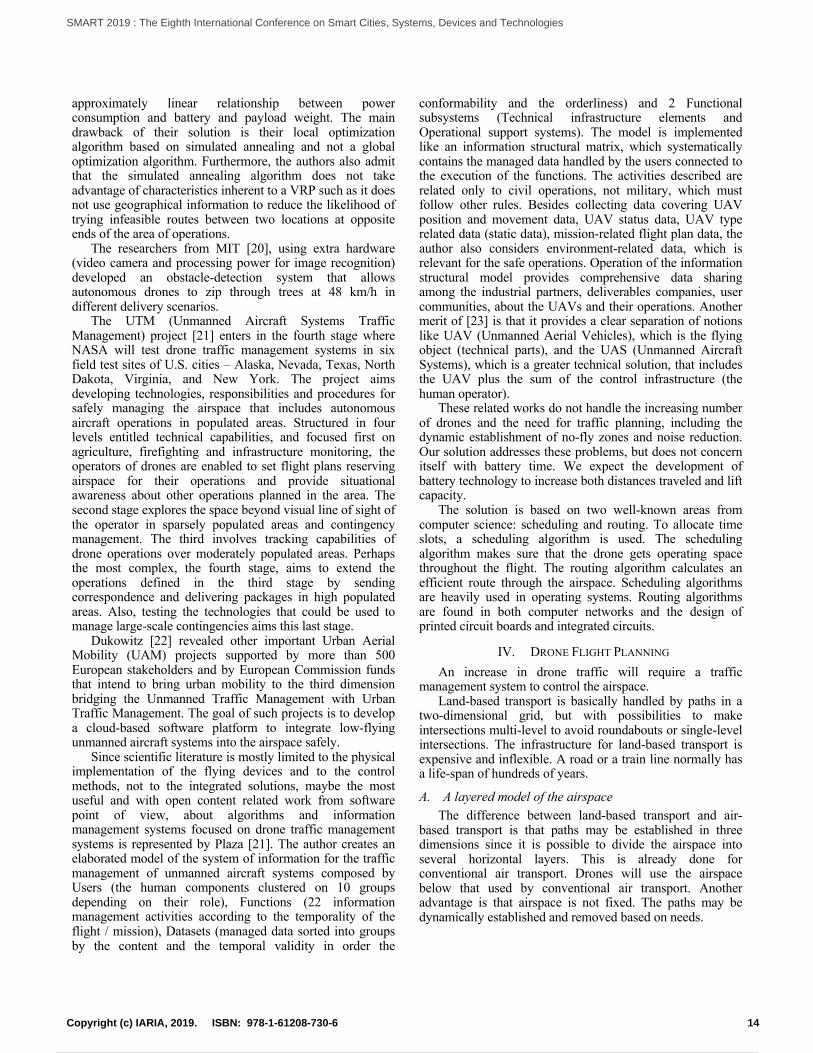
approximately linear relationship between power consumption and battery and payload weight. The main drawback of their solution is their local optimization algorithm based on simulated annealing and not a global optimization algorithm. Furthermore, the authors also admit that the simulated annealing algorithm does not take advantage of characteristics inherent to a VRP such as it does not use geographical information to reduce the likelihood of trying infeasible routes between two locations at opposite ends of the area of operations.
The researchers from MIT [20], using extra hardware (video camera and processing power for image recognition) developed an obstacle-detection system that allows autonomous drones to zip through trees at 48 km/h in different delivery scenarios.
The UTM (Unmanned Aircraft Systems Traffic Management) project [21] enters in the fourth stage where NASA will test drone traffic management systems in six field test sites of U.S. cities – Alaska, Nevada, Texas, North Dakota, Virginia, and New York. The project aims developing technologies, responsibilities and procedures for safely managing the airspace that includes autonomous aircraft operations in populated areas. Structured in four levels entitled technical capabilities, and focused first on agriculture, firefighting and infrastructure monitoring, the operators of drones are enabled to set flight plans reserving airspace for their operations and provide situational awareness about other operations planned in the area. The second stage explores the space beyond visual line of sight of the operator in sparsely populated areas and contingency management. The third involves tracking capabilities of drone operations over moderately populated areas. Perhaps the most complex, the fourth stage, aims to extend the operations defined in the third stage by sending correspondence and delivering packages in high populated areas. Also, testing the technologies that could be used to manage large-scale contingencies aims this last stage.
Dukowitz [22] revealed other important Urban Aerial Mobility (UAM) projects supported by more than 500 European stakeholders and by European Commission funds that intend to bring urban mobility to the third dimension bridging the Unmanned Traffic Management with Urban Traffic Management. The goal of such projects is to develop a cloud-based software platform to integrate low-flying unmanned aircraft systems into the airspace safely.
Since scientific literature is mostly limited to the physical implementation of the flying devices and to the control methods, not to the integrated solutions, maybe the most useful and with open content related work from software point of view, about algorithms and information management systems focused on drone traffic management systems is represented by Plaza [21]. The author creates an elaborated model of the system of information for the traffic management of unmanned aircraft systems composed by Users (the human components clustered on 10 groups depending on their role), Functions (22 information management activities according to the temporality of the flight / mission), Datasets (managed data sorted into groups by the content and the temporal validity in order the
conformability and the orderliness) and 2 Functional subsystems (Technical infrastructure elements and Operational support systems). The model is implemented like an information structural matrix, which systematically contains the managed data handled by the users connected to the execution of the functions. The activities described are related only to civil operations, not military, which must follow other rules. Besides collecting data covering UAV position and movement data, UAV status data, UAV type related data (static data), mission-related flight plan data, the author also considers environment-related data, which is relevant for the safe operations. Operation of the information structural model provides comprehensive data sharing among the industrial partners, deliverables companies, user communities, about the UAVs and their operations. Another merit of [23] is that it provides a clear separation of notions like UAV (Unmanned Aerial Vehicles), which is the flying object (technical parts), and the UAS (Unmanned Aircraft Systems), which is a greater technical solution, that includes the UAV plus the sum of the control infrastructure (the human operator).
These related works do not handle the increasing number of drones and the need for traffic planning, including the dynamic establishment of no-fly zones and noise reduction. Our solution addresses these problems, but does not concern itself with battery time. We expect the development of battery technology to increase both distances traveled and lift capacity.
The solution is based on two well-known areas from computer science: scheduling and routing. To allocate time slots, a scheduling algorithm is used. The scheduling algorithm makes sure that the drone gets operating space throughout the flight. The routing algorithm calculates an efficient route through the airspace. Scheduling algorithms are heavily used in operating systems. Routing algorithms are found in both computer networks and the design of printed circuit boards and integrated circuits.
IV. DRONE FLIGHT PLANNING An increase in drone traffic will require a traffic
management system to control the airspace. Land-based transport is basically handled by paths in a
two-dimensional grid, but with possibilities to make intersections multi-level to avoid roundabouts or single-level intersections. The infrastructure for land-based transport is expensive and inflexible. A road or a train line normally has a life-span of hundreds of years.
A. A layered model of the airspace The difference between land-based transport and air-
based transport is that paths may be established in three dimensions since it is possible to divide the airspace into several horizontal layers. This is already done for conventional air transport. Drones will use the airspace below that used by conventional air transport. Another advantage is that airspace is not fixed. The paths may be dynamically established and removed based on needs.
14Copyright (c) IARIA, 2019. ISBN: 978-1-61208-730-6
SMART 2019 : The Eighth International Conference on Smart Cities, Systems, Devices and Technologies
23 / 46
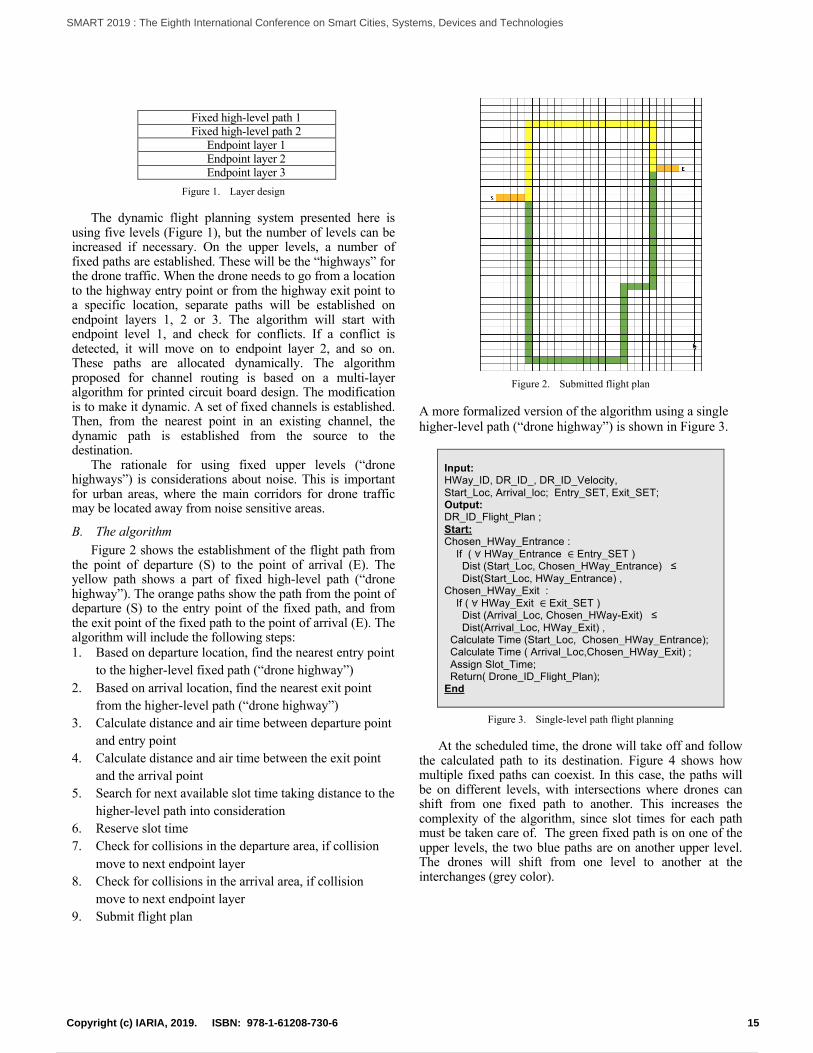
Fixed high-level path 1 Fixed high-level path 2 Endpoint layer 1 Endpoint layer 2 Endpoint layer 3
Figure 1. Layer design
The dynamic flight planning system presented here is using five levels (Figure 1), but the number of levels can be increased if necessary. On the upper levels, a number of fixed paths are established. These will be the “highways” for the drone traffic. When the drone needs to go from a location to the highway entry point or from the highway exit point to a specific location, separate paths will be established on endpoint layers 1, 2 or 3. The algorithm will start with endpoint level 1, and check for conflicts. If a conflict is detected, it will move on to endpoint layer 2, and so on. These paths are allocated dynamically. The algorithm proposed for channel routing is based on a multi-layer algorithm for printed circuit board design. The modification is to make it dynamic. A set of fixed channels is established. Then, from the nearest point in an existing channel, the dynamic path is established from the source to the destination.
The rationale for using fixed upper levels (“drone highways”) is considerations about noise. This is important for urban areas, where the main corridors for drone traffic may be located away from noise sensitive areas.
B. The algorithm Figure 2 shows the establishment of the flight path from
the point of departure (S) to the point of arrival (E). The yellow path shows a part of fixed high-level path (“drone highway”). The orange paths show the path from the point of departure (S) to the entry point of the fixed path, and from the exit point of the fixed path to the point of arrival (E). The algorithm will include the following steps: 1. Based on departure location, find the nearest entry point
to the higher-level fixed path (“drone highway”) 2. Based on arrival location, find the nearest exit point
from the higher-level path (“drone highway”) 3. Calculate distance and air time between departure point
and entry point 4. Calculate distance and air time between the exit point
and the arrival point 5. Search for next available slot time taking distance to the
higher-level path into consideration 6. Reserve slot time 7. Check for collisions in the departure area, if collision
move to next endpoint layer 8. Check for collisions in the arrival area, if collision
move to next endpoint layer 9. Submit flight plan
Figure 2. Submitted flight plan
A more formalized version of the algorithm using a single higher-level path (“drone highway”) is shown in Figure 3.
Input: HWay_ID, DR_ID_, DR_ID_Velocity, Start_Loc, Arrival_loc; Entry_SET, Exit_SET; Output: DR_ID_Flight_Plan ; Start: Chosen_HWay_Entrance : If ( ∀ HWay_Entrance ∈ Entry_SET ) Dist (Start_Loc, Chosen_HWay_Entrance) ≤ Dist(Start_Loc, HWay_Entrance) , Chosen_HWay_Exit : If ( ∀ HWay_Exit ∈ Exit_SET ) Dist (Arrival_Loc, Chosen_HWay-Exit) ≤ Dist(Arrival_Loc, HWay_Exit) , Calculate Time (Start_Loc, Chosen_HWay_Entrance); Calculate Time ( Arrival_Loc,Chosen_HWay_Exit) ; Assign Slot_Time; Return( Drone_ID_Flight_Plan); End
Figure 3. Single-level path flight planning
At the scheduled time, the drone will take off and follow the calculated path to its destination. Figure 4 shows how multiple fixed paths can coexist. In this case, the paths will be on different levels, with intersections where drones can shift from one fixed path to another. This increases the complexity of the algorithm, since slot times for each path must be taken care of. The green fixed path is on one of the upper levels, the two blue paths are on another upper level. The drones will shift from one level to another at the interchanges (grey color).
15Copyright (c) IARIA, 2019. ISBN: 978-1-61208-730-6
SMART 2019 : The Eighth International Conference on Smart Cities, Systems, Devices and Technologies
24 / 46

Figure 4. Multiple fixed paths on the upper levels
The enhanced algorithm is shown in Figure 5.
Input: HWay_ID[I], DR_ID[J]_, DR_ID[J]_Velocity, I ∈ {1…….K} /* number of highways */ J ∈ {1……..M} /* number of drones */ Start_Loc[J], Arrival_loc[J]; Entry_SET[I], Exit_SET[I]; Departure_Collision[J] = False; Arrival _Collision[J] = False ; Output: Flight plan for all drones; Start: Stop = False; While (Not Stop) { For all drones: J: 1 to M: Chosen_HWay_Entrance [J] : If ( ∀ HWay_Entrance [I] ∈ Entry_SET[I] ) Dist(Start_Loc[J], Chosen_HWay_Entrance[J]) ≤ Dist(Start_Loc[J], HWay_Entrance[I]) , Chosen_HWay_Exit [J] : If ( ∀ HWay_Exit [I] ∈ Exit_SET[I] ) Dist (Arrival_Loc[J], Chosen_HWay-Exit[J]) ≤ Dist(Arrival_Loc[J], HWay_Exit[I]) , Calculate Time [J] (Start_Loc[J], Chosen_HWay_Entrance[J]); Calculate Time [J] ( Arrival_Loc[J],Chosen_HWay_Exit[J]) ; Assign Slot_Time[J]; If ( ∀ x ∈ {1…..M} , Departure-Collision[x] = False and Arrival_Collision[x] = False) Stop = True; Else If ( ∀ x ∈ {1…..M} , Departure-Collision[x] = True OR Arrival_Collision[x] = True) Remove collision by moving to next endpoint layer ; Stop = True; } Return( Drone_ID_Flight_Plan[J]); End;
Figure 5. Multiple level paths flight planning
C. Disruptions Disruptions may happen. In particular, disruptions may
be caused by the establishment of temporary no-fly zones. This can be above areas that either represents a danger for people on the ground, like large gatherings, or accidents where drone traffic could disrupt emergency service operations.
Disruptions may also be caused by priority traffic, e.g., for delivering a heart defibrillator.
If drones have communication capabilities, it is possible to upload new flight instructions if something happens. Figure 6 shows the establishment of a no-fly zone marked in red. The top-level path needs to be reconfigured.
In this case, it is possible to change the path to not conflict with the no-fly zone. The distance will be one grid unit larger, so original slots can be reused.
Figure 6. Temporary no-fly zone established
Figure 7. Dynamic rerouting
16Copyright (c) IARIA, 2019. ISBN: 978-1-61208-730-6
SMART 2019 : The Eighth International Conference on Smart Cities, Systems, Devices and Technologies
25 / 46

Figure 7 shows the reconfigured high-level path, and also introduces a no-fly zone close to the arrival point. The last stretch is recalculated to not interfere with the no-fly zone.
Since drones always have a limitation on flying distance, it is necessary to plan for situations where the drone will run out of battery before accomplishing its mission, e.g., due to the establishment of no-fly zones or priority traffic. The problem can be solved by establishing some locations where drones can land and later be picked up by the operator.
V. CONCLUSIONS AND FUTURE WORK As drone lift capacity is growing and travel distance
increases, drones will be used for commercial purposes. Drone traffic, especially in cities, will increase dramatically. This calls for a drone traffic management solution to keep the air space safe. In this paper, we have shown one possible solution to drone traffic management using multiple layers where some layers contain fixed paths (“drone highways”) and other layers are used for traffic from departure points to the highways and from the highways to the arrival point. A flight plan is submitted before the flight, and the system will find the best possible schedule.
However, an important issue regarding drones refers to governing laws of flying. According to [24], every country has specific laws. Thus, our algorithm would not be applied in regions like the State of Alabama, USA, where a city ordinance ban flight over city properties, parks and recreational areas or any other area specified by the police.
Future research includes developing a simulator for the flight scheduling system. The simulator should allow for a large number of submitted flight plans in order to prove the concept. The simulator should have a visualization module to show drones moving in the airspace.
Since, as far as we know, no fully functional and available UTM solution is known, the business model and operating methods of the system are not known at present. Future research should find answers to these questions and address the development of such measures. In this sense we will also include developing a business model for the flight planning system.
Blockchain is an immutable distributed ledger. Cryptographic techniques make sure that it is not possible to change the content of an entry when it is put on the blockchain. All entries are recorded in blocks that are distributed to many computers. If one or more computers fail, the data is still obtainable from the network. If there should be an inconstancy, the majority will win. Essentially, blockchain makes it possible to do transactions without an intermediary. Since a traffic planning system will handle many different actors, the use of blockchain technology and smart contracts may be explored as a possible repository for flight plans.
ACKNOWLEDGMENT The research presented here was partially financed by the
Research Council of Norway (RCN) as part of the project AUTOSTRIP, project number 280865. The idea for this paper was discussed in a meeting with Indra Navia AS, a global company with more than 20 years’ experience in the
field of air traffic control systems. The meeting inspired the authors to develop the ideas presented here.
REFERENCES [1] U. Fiore, A. Florea, and L. G. Pérez, “An Interdisciplinary
Review of Smart Vehicular Traffic and Its Applications and Challenges,” Journal of Sensor and Actuator Networks, vol. 8(13), pp. 1-19, 2019.
[2] Goldman Sachs Research, “Drones Reporting for Work,” [Online]. Available from: https://www.goldmansachs.com/insights/technology-driving-innovation/drones/, 2019.06.10
[3] A. Meola, “Drone market shows positive outlook with strong industry growth and trends,” Business Insider, 2017.07.13, [Online]. Available from: https://www.businessinsider.com/drone-industry-analysis-market-trends-growth-forecasts-2017-7, 2019.06.10
[4] Amazon, “Amazon Prime Air,” [Online]. Available from: https://www.amazon.com/b?node=8037720011, 2019.06.10
[5] Aircargo News, “DHL Parcelcopter launches initial operations for research purposes,” 2015.02.27 [Online]. Available from: https://www.aircargonews.net/sectors/express/dhl-parcelcopter-launches-initial-operations-for-research-purpose/ 2019.06.10
[6] J. Stewart, “Google tests drone deliveries in Project Wing trials,” BBC, 2014.08.28, [Online]. Available from: http://www.bbc.com/news/technology-28964260, 2019.06.10
[7] J. Porter, “Google’s Wing drones approved to make public deliveries in Australia,” The Verge, 2019.04.09, [Online]. Available from: https://www.theverge.com/2019/4/9/18301782/wing-drone-delivery-google-alphabet-canberra-australia-public-launch 2019.06.10
[8] M. Williams, “PINC Solutions to launch aerial drones for inventory management,” Automotive Logistics, 2014.11.18 [Online]. Available from: https://www.automotivelogistics.media/pinc-solutions-to-launch-aerial-drones-for-inventory-management/11871.article 2019.06.10
[9] Aljazeera, “UAE to use drones for citizen services,” 2014.02.12, [Online]. Available from: https://www.aljazeera.com/news/middleeast/2014/02/uae-use-drones-government-services-20142121717319272.html 2019.06.10
[10] C. Dillow, “Meet Matternet, the drone delivery startup that´s actually delivering,” Fortune, 2015.05.01, [Online]. Available from: http://fortune.com/2015/05/01/matternet-drone-delivery/ 2019.06.10
[11] Unicef, “Unicef and the Government of Kazakhstan Begin Test Flights for Emergency Response. [Online] Available from: https://www.unicef.org/innovation/stories/unicef-and-government-kazakhstan-begin-test-flights-emergency-response 2019.06.10
[12] Unicef, “Drones – Addressing transport, connectivity and better emergency preparedness,” 2019.01.23, [Online]. Available from: https://www.unicef.org/innovation/drones 2019.06.10
[13] Unicef, “Drones take to the Vanuatu sky to test ‘last mile’ vaccine delivery to children,” 2019.12.06, [Online]. Available from: https://www.unicef.org/eap/press-releases/drones-take-vanuatu-sky-test-last-mile-vaccine-delivery-children 2019.06.10
[14] B. Molina, “A kidney for transplant was delivered by drone for the first time ever,” MSN News. 2019.04.29, [Online] Available from: https://www.msn.com/en-
17Copyright (c) IARIA, 2019. ISBN: 978-1-61208-730-6
SMART 2019 : The Eighth International Conference on Smart Cities, Systems, Devices and Technologies
26 / 46
za/news/techandscience/a-kidney-for-transplant-was-delivered-by-drone-for-the-first-time-ever/ar-BBWp5iP 2019.06.10
[15] K. Dorling, J. Heinrichs, G. Messier, and S. Magierowski, “Vehicle routing problems for drone delivery,” IEEE Transactions on Systems, Man, and Cybernetics: Systems, 47(1), pp. 70-85, 2017.
[16] N. Nader and G. Reicher, “Drones in European Airspace, Initial regulatory steps by the EU,” cepInput, March 2016. [Online]. Available: https://www.cep.eu/fileadmin/user_upload/cep.eu/Studien/cepInput_Drohnen/cepInput_Drones.pdf
[17] K. Mok, “Drones That Fly and Drive Using Path Planning Algorithms,” The New Stack, 2017.07.16, [Online] Available from: https://thenewstack.io/drones-fly-drive-using-path-planning-algorithms/ 2019.10.06
[18] D. Schermer, M. Moeini, and O. Wendt, “Algorithms for solving the vehicle routing problem with drones,” 10th Asian Conference on Intelligent Information and Database Systems (ACIIDS), Lecture Notes in Computer Science 10751, pp. 352-361, Springer, 2018.
[19] B. Eksioglu, A. V. Vural and A. Reisman, “The vehicle routing problem: A taxonomic review,” Computers & Industrial Engineering, vol. 57, Issue 4, pp. 1472-1483, 2009.
[20] A. Conner-Simons, “Self-flying drone dips, darts and dives through trees at 30 mph,” 2015.10.26, [Online]. Available from: https://www.csail.mit.edu/news/self-flying-drone-dips-darts-and-dives-through-trees-30-mph 2019.06.10
[21] Z. Dukowitz, “NASA Will Test Drone Traffic Management Systems in U.S. Cities as Final Phase of UTM Project,” UAV Coach, 2019.02.22, [Online]. Available from: https://uavcoach.com/nasa-utm/ 2019.06.10
[22] J. Plaza, Unifly Set to Define the Future of Drone Traffic Management for Europe, Commercial UAV News, 2019.01.28 [Online]. Available from: https://www.expouav.com/news/latest/unifly-future-drone-traffic-management-europe/ 2019.06.10
[23] S. Zsolt, “Model of the System of Information for the Traffic Management of Unmanned Aircraft Systems,” Journal of Unmanned Aerial Systems, 4(1), pp. 18-31, 2019.
[24] UAV Coach, “Master List of Drone Laws” [Online] Available from: https://uavcoach.com/drone-laws/ 2019.16.10
18Copyright (c) IARIA, 2019. ISBN: 978-1-61208-730-6
SMART 2019 : The Eighth International Conference on Smart Cities, Systems, Devices and Technologies
27 / 46
Citizen Participation through Digital Platforms: the Challenging Question ofData Processing for Cities
Noémie Lago, Marianne Durieux, Jean-AlexandrePouleur and Chantal Scoubeau
Research Center URBAInE, Research Institute HumanOrgUniversity of Mons
Mons, Belgiume-mail: {noemie.lago; marianne.durieux; jean-
alexandre.pouleur; chantal.scoubeau}@umons.ac.be
Catherine Elsen and Clémentine SchelingsLUCID Lab for User Cognition and Innovative Design
University of LiègeLiège, Belgium
e-mail: {catherine.elsen; clementine.schelings}@uliege.be
Abstract—This paper focuses on digital platforms supportingcitizen participation in the era of Smart Cities. Our studypresents and analyses two examples of online participationplatforms, implemented by two Walloon cities: Mons andLiège (Belgium). These two cases highlight the differences andthe similarities between both cities’ interpretation of digitalparticipation, as well as the difficulties they faced, especiallyconsidering the data processing by city officials. In light of thechallenges observed through those two cases, we suggest thatdigital platforms might potentially be misused, and somehowbias the whole digital participatory process. We therefore issuerecommendations about how to design, launch and managesuch platforms and, moreover, suggest that platforms shouldbe supplemented by other digital or traditional participatoryprocesses in order to reach higher levels of participation.
Keywords-citizen participation; digital platform; dataprocessing; Smart City; Belgium.
I. INTRODUCTION
Facing demographic and environmental issues [1], manycities worldwide are looking for a new urban ideal and aremoving towards a development strategy based on the SmartCity concepts [2]. This “smart” phenomenon gives rise tocitizens’ participation, which is a crucial dimension to ensuresocial sustainability of Smart Cities [3]. Cities consequentlyface the challenge of organizing such participation asefficiently as possible, which in turn leads to the proliferationof digital platforms for citizen participation. This researchaims at studying those popular digital platforms, through theanalysis and the comparison of two platforms implementedin two Belgian cities, namely Mons and Liège. How are suchdigital platforms administered and exploited? What are theassets and the limits of those platforms? How could suchdigital participatory process be enhanced?
This paper is structured in four additional sections.Section II provides a short literature review about theemergence of citizen participation as a key aspect of theSmart City and summarizes new interpretations ofparticipatory processes in the digital era, including digitalplatforms. Section III then gives a global overview of bothWalloon platforms, while Section IV delves into the resultsof the two initiatives. Our methodology is briefly mentionedin Subsection A, followed by our analysis of both platformsregarding the topics (Subsection B), the “likes” (Subsection
C) and the priority actions (Subsection D) as implemented byone of the two cities. Finally, Section V focuses on the mainlimits of both digital platforms and providesrecommendations to improve such participatory process.
II. STATE OF THE ART
Citizen participation has always been an important partof urban governance, this concept being inextricably andintrinsically linked to the very essence of democracy [4].Participation of the civic society is therefore much older thanwould appear at first sight, considering that the appeal forparticipatory action dates back to the events of May 1968[5]. Since then, recurrent limits (regarding “true”participation) have been continuously reported in the state ofthe art, and among them tokenism has been considered asone of the main risks for participation, i.e., symbolicallyhearing the citizens’ voice rather than concretely taking theircomments into account or giving them real decision power[6]. Over the past 50 years, the public participation hasgrown in popularity and citizens are nowadays more andmore empowered to take part in decision-making processesin their city, especially regarding current issues, such asenvironmental and technological developments [7]. Whilstdesigners and architects integrate their users’ needs and ideasthrough co-design processes [8], policy makers graduallyrealize the importance of involving residents in participatoryprocesses in order to collect their citizen expertise, i.e., anintertwined body of knowledge built on their pastexperiences, local perceptions and field understanding [9].
In the Smart City context, this collective intelligence isnow recognized as the main source of smartness, ex-aequowith digital technologies [1]. Until recently, Smart Citieslacked citizen perspective and were essentially focused onthe introduction of new technologies [10][11]. Thistechnocentric approach has the disadvantage to imposesolutions to the city users, without knowing if those usersreally want or need them, and thus without ensuring that theywill eventually use them [3]. Consequently, citizens haverecently been more and more considered as key stakeholdersregarding the overall success or failure of the Smart City,since they can choose to accept or reject smart solutions andtechnologies [10]. The sustainability of the global smartmodel thus relies on the active involvement of the residents,through citizen participation and co-design processes [3].
19Copyright (c) IARIA, 2019. ISBN: 978-1-61208-730-6
SMART 2019 : The Eighth International Conference on Smart Cities, Systems, Devices and Technologies
28 / 46
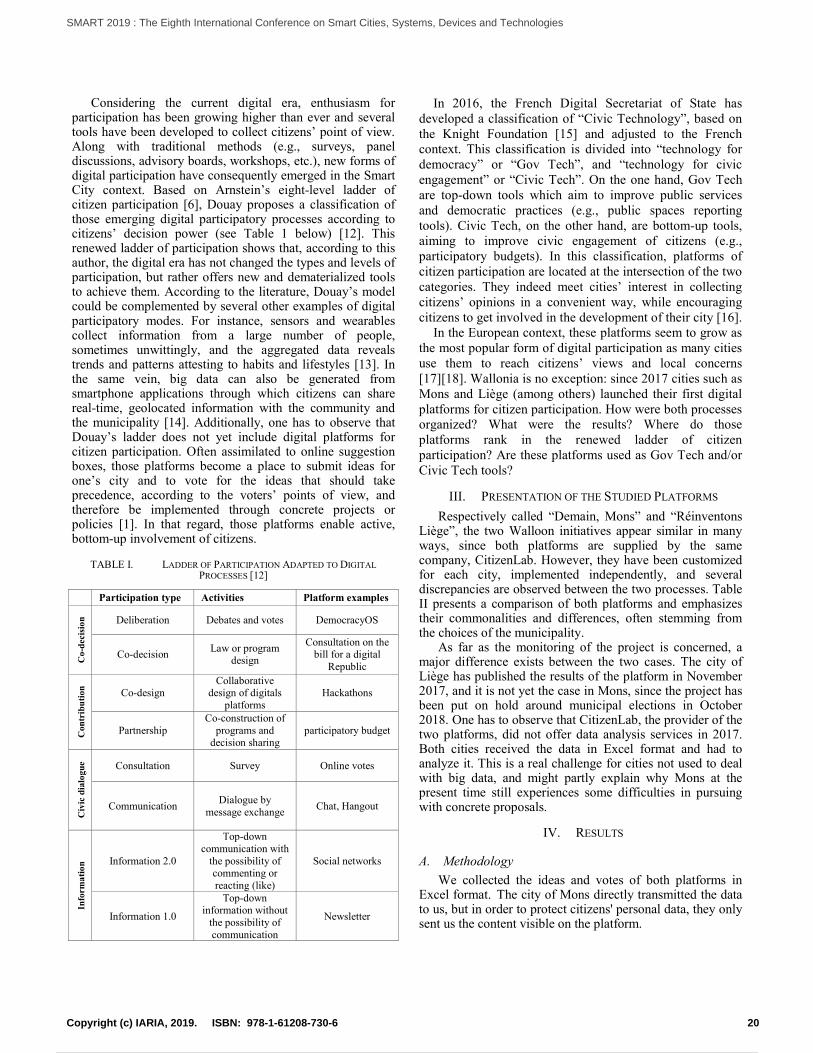
Considering the current digital era, enthusiasm forparticipation has been growing higher than ever and severaltools have been developed to collect citizens’ point of view.Along with traditional methods (e.g., surveys, paneldiscussions, advisory boards, workshops, etc.), new forms ofdigital participation have consequently emerged in the SmartCity context. Based on Arnstein’s eight-level ladder ofcitizen participation [6], Douay proposes a classification ofthose emerging digital participatory processes according tocitizens’ decision power (see Table 1 below) [12]. Thisrenewed ladder of participation shows that, according to thisauthor, the digital era has not changed the types and levels ofparticipation, but rather offers new and dematerialized toolsto achieve them. According to the literature, Douay’s modelcould be complemented by several other examples of digitalparticipatory modes. For instance, sensors and wearablescollect information from a large number of people,sometimes unwittingly, and the aggregated data revealstrends and patterns attesting to habits and lifestyles [13]. Inthe same vein, big data can also be generated fromsmartphone applications through which citizens can sharereal-time, geolocated information with the community andthe municipality [14]. Additionally, one has to observe thatDouay’s ladder does not yet include digital platforms forcitizen participation. Often assimilated to online suggestionboxes, those platforms become a place to submit ideas forone’s city and to vote for the ideas that should takeprecedence, according to the voters’ points of view, andtherefore be implemented through concrete projects orpolicies [1]. In that regard, those platforms enable active,bottom-up involvement of citizens.
TABLE I. LADDER OF PARTICIPATION ADAPTED TO DIGITAL
PROCESSES [12]
Participation type Activities Platform examples
Co-
dec
isio
n Deliberation Debates and votes DemocracyOS
Co-decisionLaw or program
design
Consultation on thebill for a digital
Republic
Co
ntr
ibu
tio
n Co-designCollaborative
design of digitalsplatforms
Hackathons
PartnershipCo-construction of
programs anddecision sharing
participatory budget
Civ
icd
ialo
gu
e Consultation Survey Online votes
CommunicationDialogue by
message exchangeChat, Hangout
Info
rma
tio
n Information 2.0
Top-downcommunication with
the possibility ofcommenting orreacting (like)
Social networks
Information 1.0
Top-downinformation without
the possibility ofcommunication
Newsletter
In 2016, the French Digital Secretariat of State hasdeveloped a classification of “Civic Technology”, based onthe Knight Foundation [15] and adjusted to the Frenchcontext. This classification is divided into “technology fordemocracy” or “Gov Tech”, and “technology for civicengagement” or “Civic Tech”. On the one hand, Gov Techare top-down tools which aim to improve public servicesand democratic practices (e.g., public spaces reportingtools). Civic Tech, on the other hand, are bottom-up tools,aiming to improve civic engagement of citizens (e.g.,participatory budgets). In this classification, platforms ofcitizen participation are located at the intersection of the twocategories. They indeed meet cities’ interest in collectingcitizens’ opinions in a convenient way, while encouragingcitizens to get involved in the development of their city [16].
In the European context, these platforms seem to grow asthe most popular form of digital participation as many citiesuse them to reach citizens’ views and local concerns[17][18]. Wallonia is no exception: since 2017 cities such asMons and Liège (among others) launched their first digitalplatforms for citizen participation. How were both processesorganized? What were the results? Where do thoseplatforms rank in the renewed ladder of citizenparticipation? Are these platforms used as Gov Tech and/orCivic Tech tools?
III. PRESENTATION OF THE STUDIED PLATFORMS
Respectively called “Demain, Mons” and “RéinventonsLiège”, the two Walloon initiatives appear similar in manyways, since both platforms are supplied by the samecompany, CitizenLab. However, they have been customizedfor each city, implemented independently, and severaldiscrepancies are observed between the two processes. TableII presents a comparison of both platforms and emphasizestheir commonalities and differences, often stemming fromthe choices of the municipality.
As far as the monitoring of the project is concerned, amajor difference exists between the two cases. The city ofLiège has published the results of the platform in November2017, and it is not yet the case in Mons, since the project hasbeen put on hold around municipal elections in October2018. One has to observe that CitizenLab, the provider of thetwo platforms, did not offer data analysis services in 2017.Both cities received the data in Excel format and had toanalyze it. This is a real challenge for cities not used to dealwith big data, and might partly explain why Mons at thepresent time still experiences some difficulties in pursuingwith concrete proposals.
IV. RESULTS
A. Methodology
We collected the ideas and votes of both platforms inExcel format. The city of Mons directly transmitted the datato us, but in order to protect citizens' personal data, they onlysent us the content visible on the platform.
20Copyright (c) IARIA, 2019. ISBN: 978-1-61208-730-6
SMART 2019 : The Eighth International Conference on Smart Cities, Systems, Devices and Technologies
29 / 46
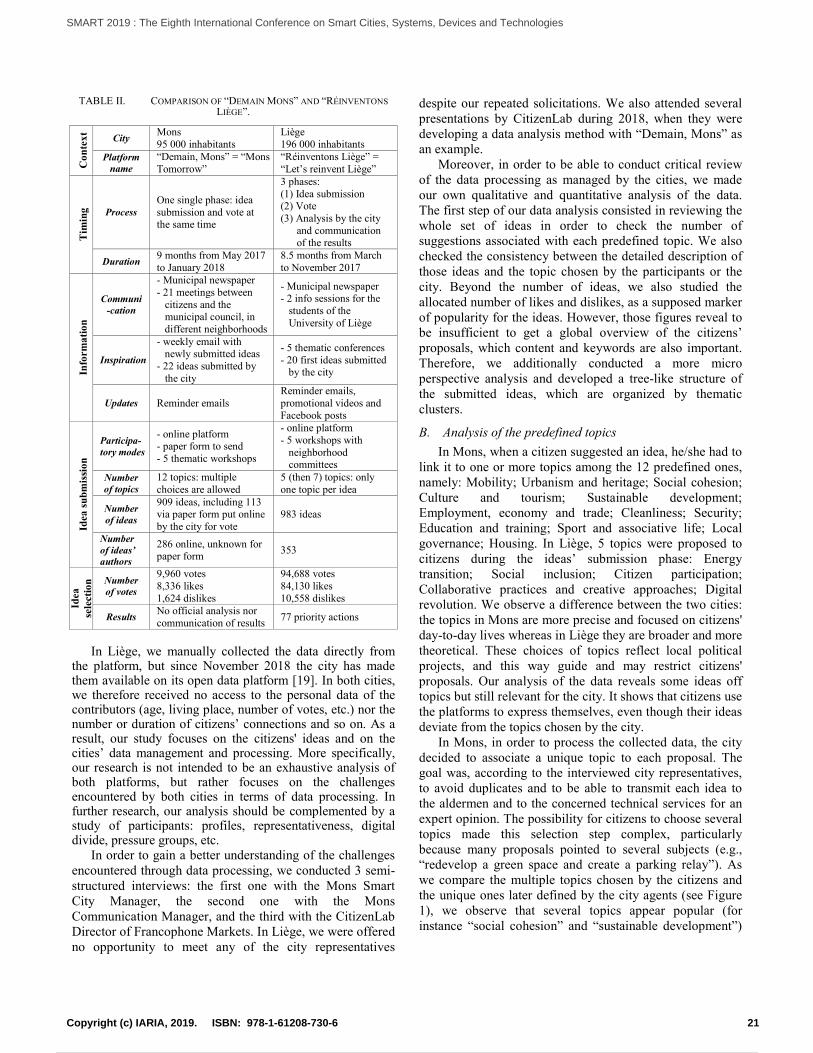
TABLE II. COMPARISON OF “DEMAIN MONS” AND “RÉINVENTONS
LIÈGE”.
Co
nte
xt
CityMons95 000 inhabitants
Liège196 000 inhabitants
Platformname
“Demain, Mons” = “MonsTomorrow”
“Réinventons Liège” =“Let’s reinvent Liège”
Tim
ing Process
One single phase: ideasubmission and vote atthe same time
3 phases:(1) Idea submission(2) Vote(3) Analysis by the city
and communicationof the results
Duration9 months from May 2017to January 2018
8.5 months from Marchto November 2017
Info
rma
tio
n
Communi-cation
- Municipal newspaper- 21 meetings between
citizens and themunicipal council, indifferent neighborhoods
- Municipal newspaper- 2 info sessions for the
students of theUniversity of Liège
Inspiration
- weekly email withnewly submitted ideas
- 22 ideas submitted bythe city
- 5 thematic conferences- 20 first ideas submitted
by the city
Updates Reminder emailsReminder emails,promotional videos andFacebook posts
Idea
sub
mis
sio
n
Participa-tory modes
- online platform- paper form to send- 5 thematic workshops
- online platform- 5 workshops with
neighborhoodcommittees
Numberof topics
12 topics: multiplechoices are allowed
5 (then 7) topics: onlyone topic per idea
Numberof ideas
909 ideas, including 113via paper form put onlineby the city for vote
983 ideas
Numberof ideas’authors
286 online, unknown forpaper form
353
Idea
sele
ctio
n Numberof votes
9,960 votes8,336 likes1,624 dislikes
94,688 votes84,130 likes10,558 dislikes
ResultsNo official analysis norcommunication of results
77 priority actions
In Liège, we manually collected the data directly fromthe platform, but since November 2018 the city has madethem available on its open data platform [19]. In both cities,we therefore received no access to the personal data of thecontributors (age, living place, number of votes, etc.) nor thenumber or duration of citizens’ connections and so on. As aresult, our study focuses on the citizens' ideas and on thecities’ data management and processing. More specifically,our research is not intended to be an exhaustive analysis ofboth platforms, but rather focuses on the challengesencountered by both cities in terms of data processing. Infurther research, our analysis should be complemented by astudy of participants: profiles, representativeness, digitaldivide, pressure groups, etc.
In order to gain a better understanding of the challengesencountered through data processing, we conducted 3 semi-structured interviews: the first one with the Mons SmartCity Manager, the second one with the MonsCommunication Manager, and the third with the CitizenLabDirector of Francophone Markets. In Liège, we were offeredno opportunity to meet any of the city representatives
despite our repeated solicitations. We also attended severalpresentations by CitizenLab during 2018, when they weredeveloping a data analysis method with “Demain, Mons” asan example.
Moreover, in order to be able to conduct critical reviewof the data processing as managed by the cities, we madeour own qualitative and quantitative analysis of the data.The first step of our data analysis consisted in reviewing thewhole set of ideas in order to check the number ofsuggestions associated with each predefined topic. We alsochecked the consistency between the detailed description ofthose ideas and the topic chosen by the participants or thecity. Beyond the number of ideas, we also studied theallocated number of likes and dislikes, as a supposed markerof popularity for the ideas. However, those figures reveal tobe insufficient to get a global overview of the citizens’proposals, which content and keywords are also important.Therefore, we additionally conducted a more microperspective analysis and developed a tree-like structure ofthe submitted ideas, which are organized by thematicclusters.
B. Analysis of the predefined topics
In Mons, when a citizen suggested an idea, he/she had tolink it to one or more topics among the 12 predefined ones,namely: Mobility; Urbanism and heritage; Social cohesion;Culture and tourism; Sustainable development;Employment, economy and trade; Cleanliness; Security;Education and training; Sport and associative life; Localgovernance; Housing. In Liège, 5 topics were proposed tocitizens during the ideas’ submission phase: Energytransition; Social inclusion; Citizen participation;Collaborative practices and creative approaches; Digitalrevolution. We observe a difference between the two cities:the topics in Mons are more precise and focused on citizens'day-to-day lives whereas in Liège they are broader and moretheoretical. These choices of topics reflect local politicalprojects, and this way guide and may restrict citizens'proposals. Our analysis of the data reveals some ideas offtopics but still relevant for the city. It shows that citizens usethe platforms to express themselves, even though their ideasdeviate from the topics chosen by the city.
In Mons, in order to process the collected data, the citydecided to associate a unique topic to each proposal. Thegoal was, according to the interviewed city representatives,to avoid duplicates and to be able to transmit each idea tothe aldermen and to the concerned technical services for anexpert opinion. The possibility for citizens to choose severaltopics made this selection step complex, particularlybecause many proposals pointed to several subjects (e.g.,“redevelop a green space and create a parking relay”). Aswe compare the multiple topics chosen by the citizens andthe unique ones later defined by the city agents (see Figure1), we observe that several topics appear popular (forinstance “social cohesion” and “sustainable development”)
21Copyright (c) IARIA, 2019. ISBN: 978-1-61208-730-6
SMART 2019 : The Eighth International Conference on Smart Cities, Systems, Devices and Technologies
30 / 46
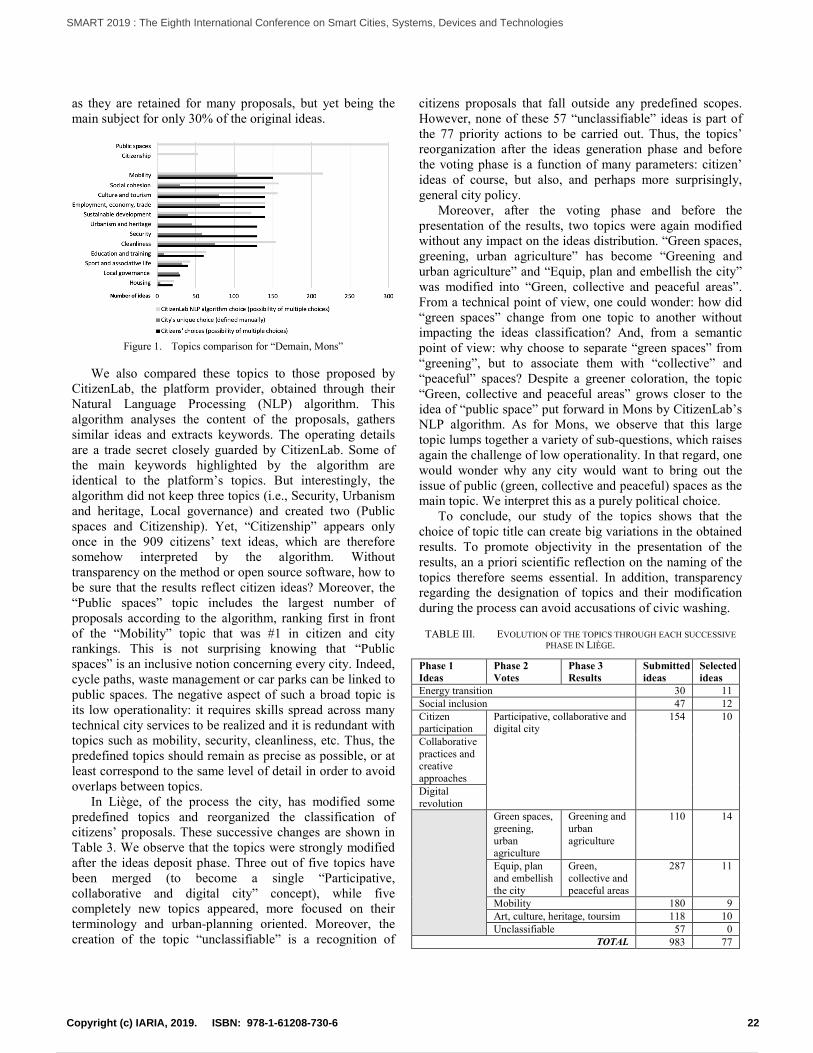
as they are retained for many proposals, but yet being themain subject for only 30% of the original ideas.
Figure 1. Topics comparison for “Demain, Mons”
We also compared these topics to those proposed byCitizenLab, the platform provider, obtained through theirNatural Language Processing (NLP) algorithm. Thisalgorithm analyses the content of the proposals, gatherssimilar ideas and extracts keywords. The operating detailsare a trade secret closely guarded by CitizenLab. Some ofthe main keywords highlighted by the algorithm areidentical to the platform’s topics. But interestingly, thealgorithm did not keep three topics (i.e., Security, Urbanismand heritage, Local governance) and created two (Publicspaces and Citizenship). Yet, “Citizenship” appears onlyonce in the 909 citizens’ text ideas, which are thereforesomehow interpreted by the algorithm. Withouttransparency on the method or open source software, how tobe sure that the results reflect citizen ideas? Moreover, the“Public spaces” topic includes the largest number ofproposals according to the algorithm, ranking first in frontof the “Mobility” topic that was #1 in citizen and cityrankings. This is not surprising knowing that “Publicspaces” is an inclusive notion concerning every city. Indeed,cycle paths, waste management or car parks can be linked topublic spaces. The negative aspect of such a broad topic isits low operationality: it requires skills spread across manytechnical city services to be realized and it is redundant withtopics such as mobility, security, cleanliness, etc. Thus, thepredefined topics should remain as precise as possible, or atleast correspond to the same level of detail in order to avoidoverlaps between topics.
In Liège, of the process the city, has modified somepredefined topics and reorganized the classification ofcitizens’ proposals. These successive changes are shown inTable 3. We observe that the topics were strongly modifiedafter the ideas deposit phase. Three out of five topics havebeen merged (to become a single “Participative,collaborative and digital city” concept), while fivecompletely new topics appeared, more focused on theirterminology and urban-planning oriented. Moreover, thecreation of the topic “unclassifiable” is a recognition of
citizens proposals that fall outside any predefined scopes.However, none of these 57 “unclassifiable” ideas is part ofthe 77 priority actions to be carried out. Thus, the topics’reorganization after the ideas generation phase and beforethe voting phase is a function of many parameters: citizen’ideas of course, but also, and perhaps more surprisingly,general city policy.
Moreover, after the voting phase and before thepresentation of the results, two topics were again modifiedwithout any impact on the ideas distribution. “Green spaces,greening, urban agriculture” has become “Greening andurban agriculture” and “Equip, plan and embellish the city”was modified into “Green, collective and peaceful areas”.From a technical point of view, one could wonder: how did“green spaces” change from one topic to another withoutimpacting the ideas classification? And, from a semanticpoint of view: why choose to separate “green spaces” from“greening”, but to associate them with “collective” and“peaceful” spaces? Despite a greener coloration, the topic“Green, collective and peaceful areas” grows closer to theidea of “public space” put forward in Mons by CitizenLab’sNLP algorithm. As for Mons, we observe that this largetopic lumps together a variety of sub-questions, which raisesagain the challenge of low operationality. In that regard, onewould wonder why any city would want to bring out theissue of public (green, collective and peaceful) spaces as themain topic. We interpret this as a purely political choice.
To conclude, our study of the topics shows that thechoice of topic title can create big variations in the obtainedresults. To promote objectivity in the presentation of theresults, an a priori scientific reflection on the naming of thetopics therefore seems essential. In addition, transparencyregarding the designation of topics and their modificationduring the process can avoid accusations of civic washing.
TABLE III. EVOLUTION OF THE TOPICS THROUGH EACH SUCCESSIVE
PHASE IN LIÈGE.
Phase 1Ideas
Phase 2Votes
Phase 3Results
Submittedideas
Selectedideas
Energy transition 30 11Social inclusion 47 12Citizenparticipation
Participative, collaborative anddigital city
154 10
Collaborativepractices andcreativeapproachesDigitalrevolution
Green spaces,greening,urbanagriculture
Greening andurbanagriculture
110 14
Equip, planand embellishthe city
Green,collective andpeaceful areas
287 11
Mobility 180 9Art, culture, heritage, toursim 118 10Unclassifiable 57 0
TOTAL 983 77
22Copyright (c) IARIA, 2019. ISBN: 978-1-61208-730-6
SMART 2019 : The Eighth International Conference on Smart Cities, Systems, Devices and Technologies
31 / 46

C. Analysis of the “likes” and “dislikes”
The voters had the opportunity to “like” the ideas thatthey wanted to see implemented, but also to “dislike” somein order to demonstrate their rejection against someproposals. Analyzing the “likes” and “dislikes”, a largediscrepancy is observed between the two platforms: there arealmost 10 times fewer votes in Mons (around 10,000) than inLiège (around 100,000), while it has been possible to votefor 9 months in Mons and only for one month in Liège. InLiège, the voting phase took place distinctively after thesubmission phase, while these two phases were concomitantin Mons. Thereby, Liège did two distinct communicationcampaigns (about ideas submission then about votes), whilein Mons, communication was all along centered on ideassubmission. We suggest the discrepancy is a consequence ofthe temporal organization of each process, but is alsoprobably linked to the potential number of voters (around200,000 inhabitants in Liège; less than 100,000 in Mons).
In Mons, out of 910 proposals, only 360 received morethan 5 cumulative likes, and only 15 proposals (i.e., 1.6%)got more than 50. The “cumulative likes” here correspondsto the total number of votes, each “dislike” subtracting onepoint from the total number of “likes”, each counting for onepoint. In Liège, 882/983 proposals received more than 5cumulative likes, and 514 ideas (i.e., 52%) obtained morethan 50. Therefore, the study of “likes” as a legitimizationmarker of ideas has limited interest for "Demain, Mons" butmore meaning for "Réinventons Liège".
To deepen our analysis, we compared the likes to thenumber of propositions on the same topic. For "RéinventonsLiège", as shown in Table 4 below, this radically changes theranking. In terms of the number of proposals, the category"Green spaces, collective spaces, peaceful spaces" gatherstwice as many proposals as other topics. When we look atthe cumulative number of likes, yet, the mobility categorybecomes the priority concern of citizens, with twice as muchlikes as the second topic. Finally, when we look at the ratioof likes to the number of proposals, it is the “Energytransition” topic that becomes the main concern, with a ratio40% higher than the second topic.
TABLE IV. COMPARISON OF LIKES AND NUMBER OF IDEAS BY TOPICS
FOR “RÉINVENTONS LIÈGE”.
Liège/ topics Numberof ideas
Cumulativelikes
Ratiolikes/ideas
Green, collective and peaceful areas 287 12664 (#3) 44 (#7)Mobility 180 26446 (#1) 136 (#2)Participative, collaborative anddigital city
154 7760 (#5) 57 (#6)
Art, culture, heritage, tourism 118 10073 (#4) 85 (#5)Greening and urban agriculture 110 13497 (#2) 126 (#3)Social inclusion 47 4781 (#7) 106 (#4)Energy transition 30 6025 (#6) 194 (#1)
In that regard, one would wonder which ranking bestreflects the citizens’ expectations. Our hypothesis is that toomany similar proposals lead to the distribution of votes, andas a consequence generate a bias effect in terms of (varietyof possible) ranking. To improve the process, it would beinteresting for a citizen to be informed of the existence of
proposals close to his/her own idea, in order to avoidcreating duplicates. Then, before the voting phase, theplatform could submit to the citizens an aggregated versionof similar ideas, in order to avoid scattering the votes. Asmaller number of proposals could also allow each citizen tobrowse through all the proposals, which was almostimpossible to proceed with considering the 1000 proposalsof “Demain, Mons” and “Réinventons Liège”.
D. Analysis of the priority actions
The city of Liège was the only one to go through thewhole process and to identify 77 priority actions. Thosepriority actions have been selected out from every topic,except from the “unclassifiable” one. None of these 57 “outof the box” ideas have indeed been kept as priority actions.Considering the twenty-first ideas submitted by the city,nineteen of them have become priority actions. This pseudosuccess may reflect two phenomena. On the one hand, thetwenty ideas supposed to encourage and inspire participantswere projected actions that would probably have beenimplemented even without the digital platform and thecitizen participation. Indeed, those ideas are not necessarilythe ones with the highest like-scores: only three of them arein the top 77, but almost all of them will be realized.Furthermore, there is even one proposal that got more“dislikes” than “likes” but still remains a priority action. Onthe other hand, those twenty ideas impacted the nextproposals, which are sometimes similar or even duplicates.Therefore, the number of cumulative “likes” increased andenabled some ideas submitted by the city to rank higher. Inaddition, even if it was not intended, the first twentyproposals might have put on blinders rather than opened thediscussion with the participants, which have certainly beeninfluenced by the twenty-first interpretations of the fiveimposed topics. This snowball effect testifies either to theimportance and the interest related to those ideas apparentlyreflecting actual citizens’ concerns, or to the potential misuseof those digital platforms in a manipulative way.
Moreover, when comes time to determine the priorityactions, logic would dictate to select the ideas with thehighest number of votes and to transform them into concreteprojects. However, considering the dilution effect of thevotes between several similar or even identical ideas, thisobvious choice would not exactly reflect the citizens’ voice.Therefore, in order to rank the submitted ideas (and theirassociated votes) in a clearer way, we established our ownthematic clusters by gathering ideas in subtopics (sometimesassociating close, or identical ideas), then organizing them ina tree-like structure and thickening the branches according tothe associated cumulative number of likes. At the end ofevery branch, we also noted the identification code of eachrelated idea in order to ease going back to the fulldescriptions when needed. Figure 2 is an example of a tree-like structure for the Liège platform, which more preciselystructures the ideas generated in regard of the most populartopic, i.e., “Green, collective and peaceful areas”. Forreasons of scale and readability, we simplify this tree byindicating here the number of ideas for each subtopic ratherthan the identification codes of all corresponding projects.
23Copyright (c) IARIA, 2019. ISBN: 978-1-61208-730-6
SMART 2019 : The Eighth International Conference on Smart Cities, Systems, Devices and Technologies
32 / 46
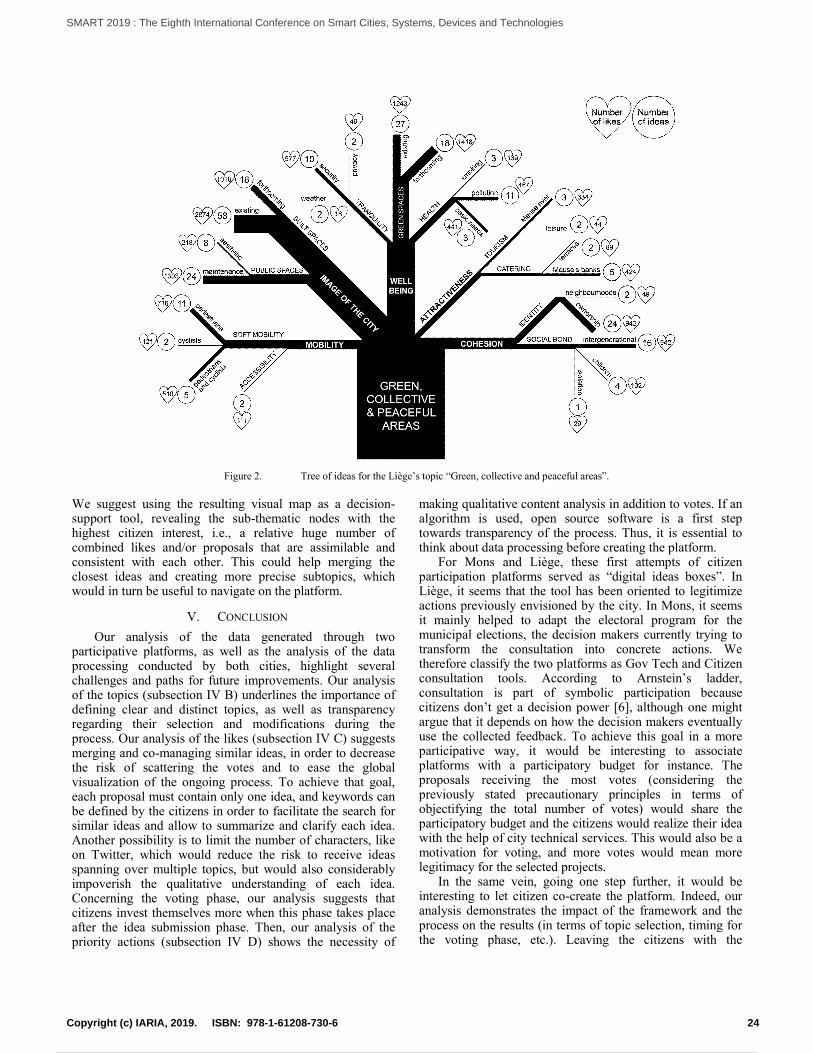
Figure 2. Tree of ideas for the Liège’s topic “Green, collective and peaceful areas”.
We suggest using the resulting visual map as a decision-support tool, revealing the sub-thematic nodes with thehighest citizen interest, i.e., a relative huge number ofcombined likes and/or proposals that are assimilable andconsistent with each other. This could help merging theclosest ideas and creating more precise subtopics, whichwould in turn be useful to navigate on the platform.
V. CONCLUSION
Our analysis of the data generated through twoparticipative platforms, as well as the analysis of the dataprocessing conducted by both cities, highlight severalchallenges and paths for future improvements. Our analysisof the topics (subsection IV B) underlines the importance ofdefining clear and distinct topics, as well as transparencyregarding their selection and modifications during theprocess. Our analysis of the likes (subsection IV C) suggestsmerging and co-managing similar ideas, in order to decreasethe risk of scattering the votes and to ease the globalvisualization of the ongoing process. To achieve that goal,each proposal must contain only one idea, and keywords canbe defined by the citizens in order to facilitate the search forsimilar ideas and allow to summarize and clarify each idea.Another possibility is to limit the number of characters, likeon Twitter, which would reduce the risk to receive ideasspanning over multiple topics, but would also considerablyimpoverish the qualitative understanding of each idea.Concerning the voting phase, our analysis suggests thatcitizens invest themselves more when this phase takes placeafter the idea submission phase. Then, our analysis of thepriority actions (subsection IV D) shows the necessity of
making qualitative content analysis in addition to votes. If analgorithm is used, open source software is a first steptowards transparency of the process. Thus, it is essential tothink about data processing before creating the platform.
For Mons and Liège, these first attempts of citizenparticipation platforms served as “digital ideas boxes”. InLiège, it seems that the tool has been oriented to legitimizeactions previously envisioned by the city. In Mons, it seemsit mainly helped to adapt the electoral program for themunicipal elections, the decision makers currently trying totransform the consultation into concrete actions. Wetherefore classify the two platforms as Gov Tech and Citizenconsultation tools. According to Arnstein’s ladder,consultation is part of symbolic participation becausecitizens don’t get a decision power [6], although one mightargue that it depends on how the decision makers eventuallyuse the collected feedback. To achieve this goal in a moreparticipative way, it would be interesting to associateplatforms with a participatory budget for instance. Theproposals receiving the most votes (considering thepreviously stated precautionary principles in terms ofobjectifying the total number of votes) would share theparticipatory budget and the citizens would realize their ideawith the help of city technical services. This would also be amotivation for voting, and more votes would mean morelegitimacy for the selected projects.
In the same vein, going one step further, it would beinteresting to let citizen co-create the platform. Indeed, ouranalysis demonstrates the impact of the framework and theprocess on the results (in terms of topic selection, timing forthe voting phase, etc.). Leaving the citizens with the
24Copyright (c) IARIA, 2019. ISBN: 978-1-61208-730-6
SMART 2019 : The Eighth International Conference on Smart Cities, Systems, Devices and Technologies
33 / 46

opportunity to co-construct the framework would help toorient the platform towards citizens’ concerns rather thanreflect political projects. Hackathons or Living Labs wouldbe appropriate ecosystems to conduct such co-creation.Hackathons, as well as participatory budgets are classified byDouay (see Table 1) as co-design tools and constitute formsof “contribution” in regard of the ladder of citizenparticipation. Involving citizens in every step would promoteempowerment and civic engagement, which would makedigital platforms a Civic Tech tool. Thus, digital platformsfor citizens participation could serve different levels in theladder of participation, depending on their framework, theirunderlying process and the goal pursued by the projectmanagers.
Side-by-side with such digital platforms, we suggest thatface-to-face exchanges would foster additional debates andoffer complementary richness through dialogue. Given thecomplexity of smart urban challenges, participants indeedoften need some support in order to extract and produceconcrete ideas from their citizen expertise, based on theirpast experiences, actual needs and perceptions. We thereforesuggest that more “traditional” participatory modes,especially co-design workshops with lay people andprofessional experts, offers additional added values in regardof digital platforms and enable participants to move fromconcerns to projects. Moreover, in-person participation givesdepth to an idea, does not limit to a one-shot onlinesubmission and this way can be enhanced and justifiedthrough the workshop
Eventually, we emphasize here that it is normal toencounter difficulties when setting up a new tool, and thatour neutral, remote assessment should nurture a process ofcontinuous improvement. In that regard, we particularlyinsist on the fact that technical and administrative support isessential to ensure that the citizens understand the feasibilitycriteria before making suggestions that would anyway beautomatically rejected by the city officials during theanalysis phase. Such technical and administrative supportcould be administered through the various meetings, infosessions and conferences organized prior and during thewhole idea generation process. Additionally, communicatingthe results of this evaluation to the citizens would be arecognition of their commitment and an encouragement topursue participation in the future.
In terms of future work, analysis should be conductedabout the participants (their age, gender, profession, socio-economic profile, etc.) in order to reach a betterunderstanding of the citizens’ representativity, and possibledigital divide, and thus analyze the impact such digitalparticipation platforms might have on the representativityissues.
ACKNOWLEDGMENT
This research is part of the “Wal-e-Cities” project, fundedby the FEDER and the Walloon region. We would like tothank the funding authorities, as well as the interviewed cityrepresentatives of Mons and the CitizenLab Director ofFrancophone Markets.
REFERENCES
[1] D. Gooch, A. Wolff, G. Kortuem, and R. Brown,“Reimagining the role of citizens in smart city projects,”Adjunct Proceedings of the 2015 ACM International JointConference on Pervasive and Ubiquitous Computing andProceedings, New York, pp. 1587–1594, 2015.
[2] M. Bulu, “Upgrading a city via technology,” TechnologicalForecasting and Social Change, vol. 89, pp. 63–67, 2014.
[3] T. Monfaredzadeh and R. Krueger, “Investigating socialfactors of sustainability in a smart city,” ProcediaEngineering, vol. 118, pp. 1112-1118, 2015.
[4] J. le Maire, La grammaire participative. Architectural andurban theories and pratices 1904-1968. University Paris IPanthéon-Sorbonne, 2009.
[5] M.-H. Bacqué and M. Gauthier, "Participation, urbanism andurban studies. Four decades of debate and experience since S.R. Arnstein's A ladder of citizen participation”, Participations,vol. 1, no. 1, pp. 36–66, 2011.
[6] S. R. Arnstein, “A Ladder Of Citizen Participation,” Journalof the American Planning Association, vol. 35, no. 4, pp.216–224, 1969.
[7] G. Rowe and L. J. Frewer, “Public participation methods: aframework for evaluation,” vol. 25, no. 1, pp. 3-29, 2000.
[8] E. B.-N. Sanders and P. J. Stappers, “Co-creation and the newlandscapes of design,” CoDesign, vol. 4, pp. 1–16, 2008.
[9] Y. Sintomer, “From the user knowledge to the citizen job ? ”,Political Reasons, vol. 31, no. 3, pp. 115–133, 2008
[10] H. Chourabi et al., “Understanding smart cities: an integrativeframework,” 45th Hawaii International Conference on SystemSciences, HICSS, Maui, 2012, pp. 2289-2297.
[11] T. Guelzim, M. S. Obaidat, and B. Sadoun, “Introduction andoverview of key enabling technologies for smart cities andhomes,” in Smart Cities and Homes: Key EnablingTechnologies, Elsevier, pp. 1–16, 2016.
[12] N. Douay. Urban Planning in the Digital Age [Online].Available from:www.researchgate.net/publication/315782172_Planifier_a_l'heure_du_numerique [retrieved: 06, 2019]
[13] J. Bohn, M. Langheinrich, F. Mattern, and M. Rohs, “Livingin a world of smart everyday objects - Social, economic andethical implications,” Human and Ecological RiskAssessment, 2007.
[14] A. Vanolo, “Is there anybody out there? The place and role ofcitizens in tomorrow’s smart cities,” Futures, vol. 82, pp. 26-36, 2016.
[15] Knight Foundation. What does the civic tech landscape looklike? [Online]. Available from:https://knightfoundation.org/features/civictech/ [retrieved: 06,2019]
[16] C. Mabi, “Citizen hacker,” in Life of ideas [Online].Available from: www.laviedesidees.fr/Citoyen-hackeur.html[retrieved: 06, 2019]
[17] S. Niederer and R. Priester, “Smart citizens: exploring thetools of the urban bottom-up movement,” ComputerSupported Cooperative Work, vol. 25, no. 2–3, pp. 137–152,2016.
[18] J. Willems, J. Van den Bergh, and S. Viaene, “Smart cityprojects and citizen participation: the case of London,” inPublic sector management in a globalized world, R.Andeßner, D. Greiling and R. Vogel, Eds. Wiesbaden:NPOManagement, Springer Gabler, pp. 249-266, 2017.
[19] City of Liège, Open data platform [Online]. Available from:opendata.liege.be [retrieved: 04, 2019]
25Copyright (c) IARIA, 2019. ISBN: 978-1-61208-730-6
SMART 2019 : The Eighth International Conference on Smart Cities, Systems, Devices and Technologies
34 / 46
WiFi and LoRa Energy Consumption Comparison in IoT ESP 32/ SX1278 Devices
Laura García, Jose M. Jimenez, Jaime Lloret Integrated Management Coastal Research Institute
Universitat Politècnica de València Valencia, Spain
e-mail: [email protected], [email protected], [email protected]
Pascal Lorenz Network and Telecommunication Research Group
University of Haute Alsace Colmar, France
e-mail: [email protected]
Abstract—The use of Internet of Things (IoT) devices has spread through many different fields. Transport, health, and energy management of farming are some of the areas where IoT systems are being utilized. The selection of the wireless communication technology for the IoT system is paramount for its optimal performance. However, factors such as desired coverage or energy consumption must be considered for this selection. In this paper, several tests to determine the battery life that can be obtained after performing WiFi and LoRa Low Power Wide Area Networks (LPWAN) transmissions with a low-cost IoT device has been performed. With a 5 second transmission interval and default settings, similar results were obtained for both WiFi and LoRa. Furthermore, WiFi outperformed LoRa with the default settings and a 30 second transmission interval. Lastly, LoRa did outperform WiFi when the settings where changed so as the transmission power of LoRa was that of 10 dBm.
Keywords-Energy consumption; battery life; WiFi; LoRa; transmission power.
I. INTRODUCTION Currently, IoT devices are used in a wide variety of
areas. According to IoT Analytics [1] the areas where IoT was most used in 2018 are Smart homes, Wearables, Smart Cities, Smart grids, Industrial internet, Connected cars, Connected Health (Digital health / Telehealth / Telemedicine), Smart retail, Smart Supply chain and Smart farming. In order to improve the performance of the implanted systems, it is necessary for the results observed by the sensors to be sent to other systems. The processing and storage capacities of IoT devices are generally very limited. Usually, in the case of wanting to correct an error or wanting to optimize the performance of the observed elements or environments, after processing the data, the appropriate corrective measures are taken to optimize the observed functions. To transmit the information, which is captured by the sensors connected to the nodes, both wired and wireless technology are used depending on the ease of installation of the physical infrastructure in the observed areas.
In a large number of cases, the sensors used to monitor the IoT devices need to establish a wireless communication to transmit the observed data. Garcia et al. [2] presented a review of wireless technologies that were employed in Smart
cities, their comparison and the problems that make their coexistence difficult.
One of the areas in which the use of wireless technology becomes more evident is in Smart farming. Currently, it is very difficult to connect IoT devices that are located in large tracts of land through a wired network. In addition, when using agricultural machinery, which is often heavy vehicles, it is very difficult not to deteriorate or break the copper or fiber optic wires deployed in the fields. It is very easy for situations to appear where the tools attached to the vehicles can drag the cables. For this reason, Smart farming is one of the ideal areas where wireless technology should be used. Aspects such as foliage density, which can change according to the seasons or depending on the growth state of the plant, should be considered as they can affect the wireless transmission. These types of smart systems for agriculture monitor parameters such as irrigation, the humidity and temperature of the soil or the environmental conditions.
There is a wide range of wireless technologies, among which we can highlight those that comply with the IEEE wireless standards such as IEEE 802.11 [3], IEEE 802.15 [4], and IEEE 802.16 [5]; we also find mobile technologies such as 3G [6], 4G, 5G. In addition, we can find other proprietary technologies such as LoRa [8], NB-IoT [9], and Sigfox [10].
In some situations, it is necessary to use a large number of sensor nodes. Obviously, the cost of the nodes, if they are used in large numbers, can be prohibitive. In addition, if mobile technologies are used to establish transmissions, such as 4G or any other, the cost of the node is significantly increased, and maintenance is also expensive. Furthermore, it would be necessary to hire the services of a mobile operator that has coverage in the space that will be monitored.
We have observed that inexpensive nodes that include wireless technologies are available on the market. Among the most currently employed we can find nodes that include IEEE 802.11n interfaces, Bluetooth Low Energy (BLE) and LoRaWan.
One of the main problems that we found when implementing a solution is the energy consumption of the nodes. If the nodes remain active in real time, to know at any moment the parameters that are considered necessary, they will consume a large amount of energy. Assuming that the nodes are distributed in dispersed locations, where it is not
26Copyright (c) IARIA, 2019. ISBN: 978-1-61208-730-6
SMART 2019 : The Eighth International Conference on Smart Cities, Systems, Devices and Technologies
35 / 46

possible to bring the energy at reasonable costs, the supply of electrical power can become a big problem. Depending on the needs of different crops, the observation time may vary, but if the difference in energy consumption of the nodes is based fundamentally on the employed wireless technology, our interest is focused on selecting the most appropriate technology, so that energy consumption is minimal.
For all the reasons described previously, we have carried out some tests to identify which of the two wireless technologies considered in this paper can be used in such a way that it extends the transmission capacity as much as possible, provided that the transmitted data are identical. In our work we have studied WiFi and LoRaWan technologies, which are supported by our sensor nodes.
The rest of the paper is organized as follows. Section 2 presents the related work. A background in WiFi and LoRa technologies is presented in Section 3. The testbed is explained in Section 4. Section 5 depicts the obtained results. Lastly, the conclusion and future work are presented in Section 6.
II. RELATED WORK In this section, the related work on energy consumption
studies for WiFi and LoRa is going to be presented. When selecting the communication technology for an
IoT deployment, the energy consumption is one of the most considered factors. Several papers focus on determining the energy consumption of LoRa and WiFi.
Ayele et al. [11] performed a simulated comparison of the energy consumption of BLE and LoRa in a Wildlife Monitoring System. The authors proposed a dual radio network model. The nodes were deployed on the collars of the animals. The communication between the nodes was performed over BLE until it reached a cluster head. Then, the cluster head communicated through LoRa to a Lora gateway. The energy consumed by the LoRa star topology increased as the nodes increased, due to the overhead. However, the proposed solution eliminated the energy consumption caused by the overhead. The results showed a reduction of energy consumption of 97% compared to LoRaWAN. Bor et al. [12] presented an analysis of the parameters of LoRa transmissions. The authors focused on the effects of parameter selection in energy consumption and communication performance. The authors stated that an Spreading Factor (SF) of 8, a bandwidth of 500 MHz, 4/5 coding rate and 8dBm of transmission power (tx power) consumed 2.31 mJ and the optimal settings were a SF of 7, a bandwidth of 500 MHz, a coding rate of 4/5 and a tx power of 11 dBm which had an energy consumption of 1.60 mJ. Furthermore, the authors proposed an algorithm that was able to probe different settings and selected the best option in order to balance the energy consumption. Several experiments on the Carrier Sense Multiple Access (CSMA) channel access mechanisms of LoRa were performed by Phan [13]. The author presented an adaptation of the 802.11 CSMA protocol for LoRa and a new CSMA protocol. The energy consumption of the adaptation and the new proposal with different settings was compared as well. The results showed the new proposal had a lower energy consumption
for all settings compared to the adaptation from 802.11. Moreover, Pötsch et al. [14] discussed the limitations of LoRa gateway deployment. The overhead caused by the LoRa gateways is analyzed as well. The energy consumption was compared for different spreading factors and bandwidths of 125MHz, 250 MHz and 500 MHz. The results showed less energy consumption as the spreading factor decreased and the bandwidth increased. Furthermore, the energy consumption increased as the tx power increased, being 50 mA approximately for a tx power of 5 dBm and slightly above 120 dBm for a tx power of 19 dBm.
The energy consumption of WiFi nodes has been studied as well. Mesquita et al. [15] performed a study on the performance of ESP8266 WiFi modules which are branded as ultra-low power. The authors performed several experiments to measure the energy consumption with sleep modes and different transmission configurations. The authors stated that the usual configuration of a Delivery Traffic Indication Message (DTIM) period of 3 and a 100 ms beacon interval had the lowest average current consumption, namely 14.71 mA. They also stated that ESP8266 modules were able to operate for 2 to 4 days with a small battery of 1000mAh of capacity. Montori et al. [16] presented a performance study on WiFi for IoT systems. The authors utilized ESP-12 SoC modules to study their energy consumption under variations of the connectivity settings. Tests were performed with Lo-Po, alkaline and NiMH batteries. The results showed similar performances for all batteries with the same configurations. Furthermore, the difference in energy consumption between awake and sleep mode was less than that stated on datasheets. Lastly, Putra et al. [17] performed an energy consumption comparison between BLE and WiFi with different settings for the beacons. Tests were performed for an iPhone device. The results showed BLE had a 30% more energy efficiency than WiFi. Furthermore, the battery life of the smartphone was of 14 hours and 46 minutes for WiFi and 16 hours and 38 minutes for BLE.
To the best of our knowledge, no comparison between the energy consumption of WiFi and LoRa in IoT devices has been performed before. Therefore, in this paper, we compare the effects of WiFi and LoRa transmissions on battery life.
III. WIFI AND LORA TECHNOLOGIES The two wireless technologies on which we have done
our work are IEEE 802.11 (also known as WiFi) and LoRa. Next, we will describe the main characteristics of both technologies.
A. IEEE 802.11 technology In this subsection, a background on the IEEE 802.11
standards is going to be provided. The 802.11 standards use the 2.4 GHz and 5 GHz bands.
These bands are known as Industrial, Scientific and Medical (ISM) radio bands. They are defined in Article 5 of the Radio Regulations of the International Telecommunication Union (ITU) [18]. These bands do not need a license for their operation, but they differ according to the regulations of each country. The problem that can arise when using them is that
27Copyright (c) IARIA, 2019. ISBN: 978-1-61208-730-6
SMART 2019 : The Eighth International Conference on Smart Cities, Systems, Devices and Technologies
36 / 46
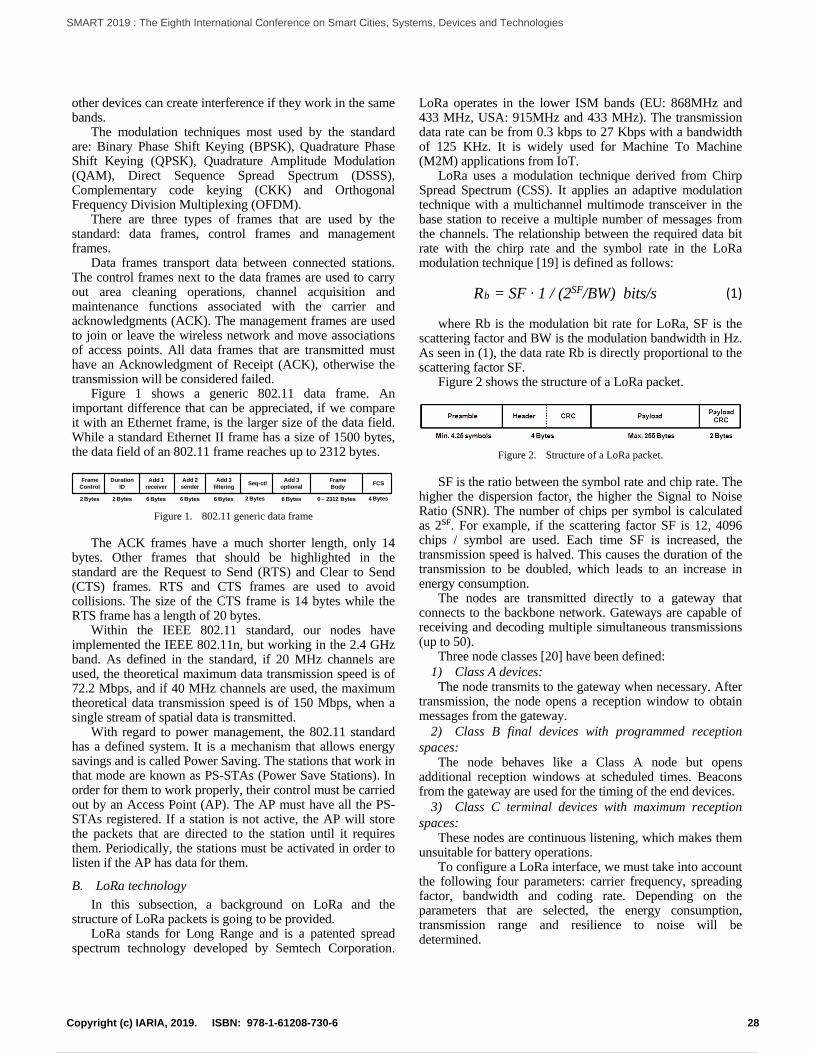
other devices can create interference if they work in the same bands.
The modulation techniques most used by the standard are: Binary Phase Shift Keying (BPSK), Quadrature Phase Shift Keying (QPSK), Quadrature Amplitude Modulation (QAM), Direct Sequence Spread Spectrum (DSSS), Complementary code keying (CKK) and Orthogonal Frequency Division Multiplexing (OFDM).
There are three types of frames that are used by the standard: data frames, control frames and management frames.
Data frames transport data between connected stations. The control frames next to the data frames are used to carry out area cleaning operations, channel acquisition and maintenance functions associated with the carrier and acknowledgments (ACK). The management frames are used to join or leave the wireless network and move associations of access points. All data frames that are transmitted must have an Acknowledgment of Receipt (ACK), otherwise the transmission will be considered failed.
Figure 1 shows a generic 802.11 data frame. An important difference that can be appreciated, if we compare it with an Ethernet frame, is the larger size of the data field. While a standard Ethernet II frame has a size of 1500 bytes, the data field of an 802.11 frame reaches up to 2312 bytes.
Frame
ControlDuration
IDAdd 1
receiverAdd 2sender
Add 3filtering Seq-ctl Add 3
optional FCSFrame Body
2 Bytes 2 Bytes 6 Bytes 6 Bytes 6 Bytes 6 Bytes 0 – 2312 Bytes2 Bytes 4 Bytes Figure 1. 802.11 generic data frame
The ACK frames have a much shorter length, only 14 bytes. Other frames that should be highlighted in the standard are the Request to Send (RTS) and Clear to Send (CTS) frames. RTS and CTS frames are used to avoid collisions. The size of the CTS frame is 14 bytes while the RTS frame has a length of 20 bytes.
Within the IEEE 802.11 standard, our nodes have implemented the IEEE 802.11n, but working in the 2.4 GHz band. As defined in the standard, if 20 MHz channels are used, the theoretical maximum data transmission speed is of 72.2 Mbps, and if 40 MHz channels are used, the maximum theoretical data transmission speed is of 150 Mbps, when a single stream of spatial data is transmitted.
With regard to power management, the 802.11 standard has a defined system. It is a mechanism that allows energy savings and is called Power Saving. The stations that work in that mode are known as PS-STAs (Power Save Stations). In order for them to work properly, their control must be carried out by an Access Point (AP). The AP must have all the PS-STAs registered. If a station is not active, the AP will store the packets that are directed to the station until it requires them. Periodically, the stations must be activated in order to listen if the AP has data for them.
B. LoRa technology In this subsection, a background on LoRa and the
structure of LoRa packets is going to be provided. LoRa stands for Long Range and is a patented spread
spectrum technology developed by Semtech Corporation.
LoRa operates in the lower ISM bands (EU: 868MHz and 433 MHz, USA: 915MHz and 433 MHz). The transmission data rate can be from 0.3 kbps to 27 Kbps with a bandwidth of 125 KHz. It is widely used for Machine To Machine (M2M) applications from IoT.
LoRa uses a modulation technique derived from Chirp Spread Spectrum (CSS). It applies an adaptive modulation technique with a multichannel multimode transceiver in the base station to receive a multiple number of messages from the channels. The relationship between the required data bit rate with the chirp rate and the symbol rate in the LoRa modulation technique [19] is defined as follows:
Rb = SF · 1 / (2SF/BW) bits/s (1)
where Rb is the modulation bit rate for LoRa, SF is the
scattering factor and BW is the modulation bandwidth in Hz. As seen in (1), the data rate Rb is directly proportional to the scattering factor SF.
Figure 2 shows the structure of a LoRa packet.
Figure 2. Structure of a LoRa packet.
SF is the ratio between the symbol rate and chip rate. The higher the dispersion factor, the higher the Signal to Noise Ratio (SNR). The number of chips per symbol is calculated as 2SF. For example, if the scattering factor SF is 12, 4096 chips / symbol are used. Each time SF is increased, the transmission speed is halved. This causes the duration of the transmission to be doubled, which leads to an increase in energy consumption.
The nodes are transmitted directly to a gateway that connects to the backbone network. Gateways are capable of receiving and decoding multiple simultaneous transmissions (up to 50).
Three node classes [20] have been defined: 1) Class A devices:
The node transmits to the gateway when necessary. After transmission, the node opens a reception window to obtain messages from the gateway.
2) Class B final devices with programmed reception spaces:
The node behaves like a Class A node but opens additional reception windows at scheduled times. Beacons from the gateway are used for the timing of the end devices.
3) Class C terminal devices with maximum reception spaces:
These nodes are continuous listening, which makes them unsuitable for battery operations.
To configure a LoRa interface, we must take into account the following four parameters: carrier frequency, spreading factor, bandwidth and coding rate. Depending on the parameters that are selected, the energy consumption, transmission range and resilience to noise will be determined.
28Copyright (c) IARIA, 2019. ISBN: 978-1-61208-730-6
SMART 2019 : The Eighth International Conference on Smart Cities, Systems, Devices and Technologies
37 / 46
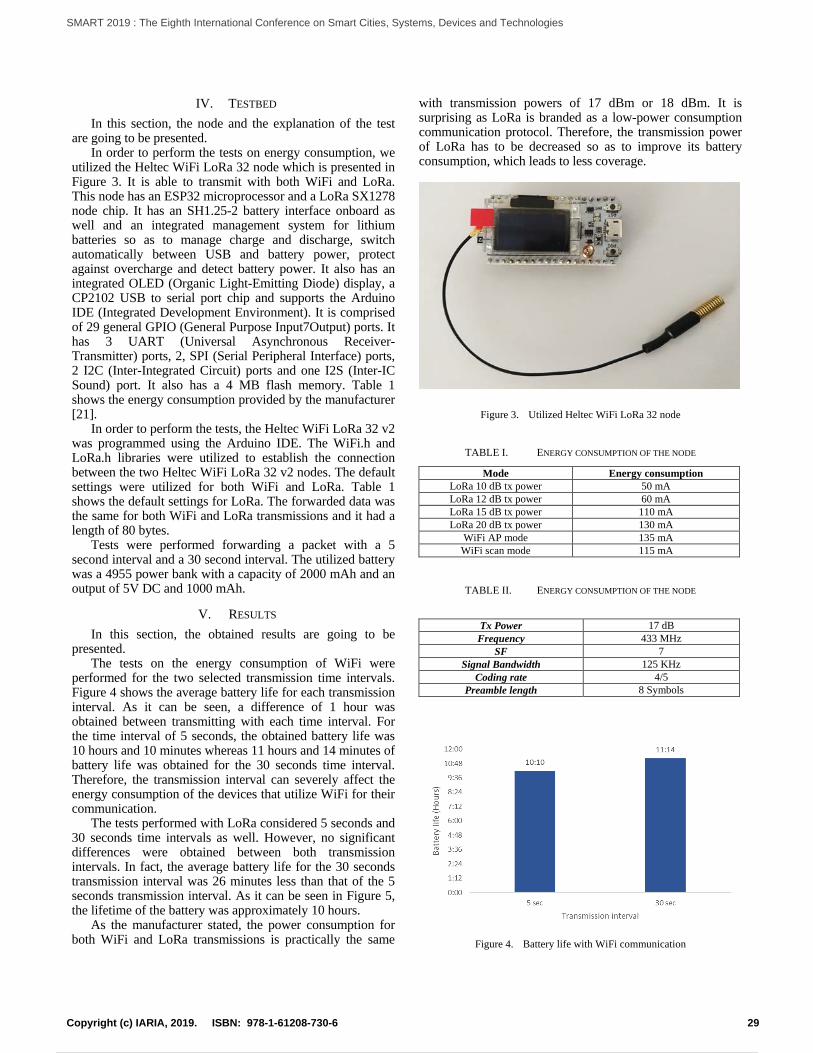
IV. TESTBED In this section, the node and the explanation of the test
are going to be presented. In order to perform the tests on energy consumption, we
utilized the Heltec WiFi LoRa 32 node which is presented in Figure 3. It is able to transmit with both WiFi and LoRa. This node has an ESP32 microprocessor and a LoRa SX1278 node chip. It has an SH1.25-2 battery interface onboard as well and an integrated management system for lithium batteries so as to manage charge and discharge, switch automatically between USB and battery power, protect against overcharge and detect battery power. It also has an integrated OLED (Organic Light-Emitting Diode) display, a CP2102 USB to serial port chip and supports the Arduino IDE (Integrated Development Environment). It is comprised of 29 general GPIO (General Purpose Input7Output) ports. It has 3 UART (Universal Asynchronous Receiver-Transmitter) ports, 2, SPI (Serial Peripheral Interface) ports, 2 I2C (Inter-Integrated Circuit) ports and one I2S (Inter-IC Sound) port. It also has a 4 MB flash memory. Table 1 shows the energy consumption provided by the manufacturer [21].
In order to perform the tests, the Heltec WiFi LoRa 32 v2 was programmed using the Arduino IDE. The WiFi.h and LoRa.h libraries were utilized to establish the connection between the two Heltec WiFi LoRa 32 v2 nodes. The default settings were utilized for both WiFi and LoRa. Table 1 shows the default settings for LoRa. The forwarded data was the same for both WiFi and LoRa transmissions and it had a length of 80 bytes.
Tests were performed forwarding a packet with a 5 second interval and a 30 second interval. The utilized battery was a 4955 power bank with a capacity of 2000 mAh and an output of 5V DC and 1000 mAh.
V. RESULTS In this section, the obtained results are going to be
presented. The tests on the energy consumption of WiFi were
performed for the two selected transmission time intervals. Figure 4 shows the average battery life for each transmission interval. As it can be seen, a difference of 1 hour was obtained between transmitting with each time interval. For the time interval of 5 seconds, the obtained battery life was 10 hours and 10 minutes whereas 11 hours and 14 minutes of battery life was obtained for the 30 seconds time interval. Therefore, the transmission interval can severely affect the energy consumption of the devices that utilize WiFi for their communication.
The tests performed with LoRa considered 5 seconds and 30 seconds time intervals as well. However, no significant differences were obtained between both transmission intervals. In fact, the average battery life for the 30 seconds transmission interval was 26 minutes less than that of the 5 seconds transmission interval. As it can be seen in Figure 5, the lifetime of the battery was approximately 10 hours.
As the manufacturer stated, the power consumption for both WiFi and LoRa transmissions is practically the same
with transmission powers of 17 dBm or 18 dBm. It is surprising as LoRa is branded as a low-power consumption communication protocol. Therefore, the transmission power of LoRa has to be decreased so as to improve its battery consumption, which leads to less coverage.
Figure 3. Utilized Heltec WiFi LoRa 32 node
TABLE I. ENERGY CONSUMPTION OF THE NODE
Mode Energy consumption LoRa 10 dB tx power 50 mA LoRa 12 dB tx power 60 mA LoRa 15 dB tx power 110 mA LoRa 20 dB tx power 130 mA
WiFi AP mode 135 mA WiFi scan mode 115 mA
TABLE II. ENERGY CONSUMPTION OF THE NODE
Tx Power 17 dB Frequency 433 MHz
SF 7 Signal Bandwidth 125 KHz
Coding rate 4/5 Preamble length 8 Symbols
Figure 4. Battery life with WiFi communication
29Copyright (c) IARIA, 2019. ISBN: 978-1-61208-730-6
SMART 2019 : The Eighth International Conference on Smart Cities, Systems, Devices and Technologies
38 / 46
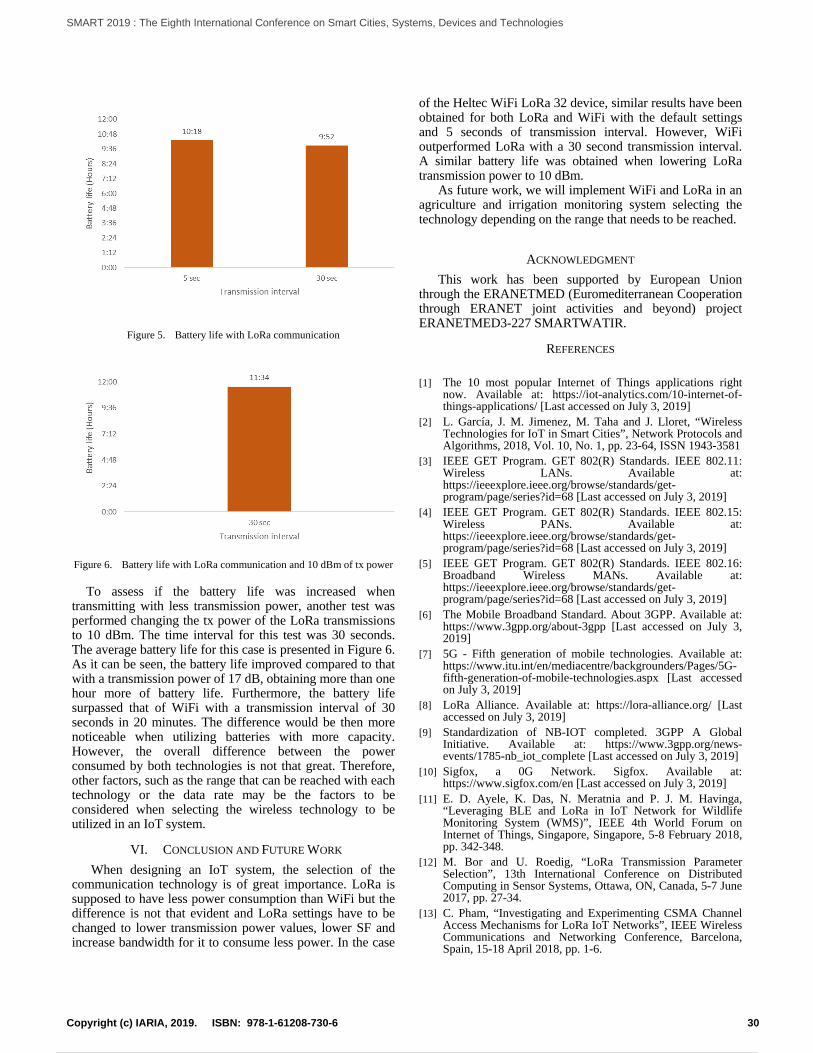
Figure 5. Battery life with LoRa communication
Figure 6. Battery life with LoRa communication and 10 dBm of tx power
To assess if the battery life was increased when transmitting with less transmission power, another test was performed changing the tx power of the LoRa transmissions to 10 dBm. The time interval for this test was 30 seconds. The average battery life for this case is presented in Figure 6. As it can be seen, the battery life improved compared to that with a transmission power of 17 dB, obtaining more than one hour more of battery life. Furthermore, the battery life surpassed that of WiFi with a transmission interval of 30 seconds in 20 minutes. The difference would be then more noticeable when utilizing batteries with more capacity. However, the overall difference between the power consumed by both technologies is not that great. Therefore, other factors, such as the range that can be reached with each technology or the data rate may be the factors to be considered when selecting the wireless technology to be utilized in an IoT system.
VI. CONCLUSION AND FUTURE WORK When designing an IoT system, the selection of the
communication technology is of great importance. LoRa is supposed to have less power consumption than WiFi but the difference is not that evident and LoRa settings have to be changed to lower transmission power values, lower SF and increase bandwidth for it to consume less power. In the case
of the Heltec WiFi LoRa 32 device, similar results have been obtained for both LoRa and WiFi with the default settings and 5 seconds of transmission interval. However, WiFi outperformed LoRa with a 30 second transmission interval. A similar battery life was obtained when lowering LoRa transmission power to 10 dBm.
As future work, we will implement WiFi and LoRa in an agriculture and irrigation monitoring system selecting the technology depending on the range that needs to be reached.
ACKNOWLEDGMENT This work has been supported by European Union
through the ERANETMED (Euromediterranean Cooperation through ERANET joint activities and beyond) project ERANETMED3-227 SMARTWATIR.
REFERENCES
[1] The 10 most popular Internet of Things applications right now. Available at: https://iot-analytics.com/10-internet-of-things-applications/ [Last accessed on July 3, 2019]
[2] L. García, J. M. Jimenez, M. Taha and J. Lloret, “Wireless Technologies for IoT in Smart Cities”, Network Protocols and Algorithms, 2018, Vol. 10, No. 1, pp. 23-64, ISSN 1943-3581
[3] IEEE GET Program. GET 802(R) Standards. IEEE 802.11: Wireless LANs. Available at: https://ieeexplore.ieee.org/browse/standards/get-program/page/series?id=68 [Last accessed on July 3, 2019]
[4] IEEE GET Program. GET 802(R) Standards. IEEE 802.15: Wireless PANs. Available at: https://ieeexplore.ieee.org/browse/standards/get-program/page/series?id=68 [Last accessed on July 3, 2019]
[5] IEEE GET Program. GET 802(R) Standards. IEEE 802.16: Broadband Wireless MANs. Available at: https://ieeexplore.ieee.org/browse/standards/get-program/page/series?id=68 [Last accessed on July 3, 2019]
[6] The Mobile Broadband Standard. About 3GPP. Available at: https://www.3gpp.org/about-3gpp [Last accessed on July 3, 2019]
[7] 5G - Fifth generation of mobile technologies. Available at: https://www.itu.int/en/mediacentre/backgrounders/Pages/5G-fifth-generation-of-mobile-technologies.aspx [Last accessed on July 3, 2019]
[8] LoRa Alliance. Available at: https://lora-alliance.org/ [Last accessed on July 3, 2019]
[9] Standardization of NB-IOT completed. 3GPP A Global Initiative. Available at: https://www.3gpp.org/news-events/1785-nb_iot_complete [Last accessed on July 3, 2019]
[10] Sigfox, a 0G Network. Sigfox. Available at: https://www.sigfox.com/en [Last accessed on July 3, 2019]
[11] E. D. Ayele, K. Das, N. Meratnia and P. J. M. Havinga, “Leveraging BLE and LoRa in IoT Network for Wildlife Monitoring System (WMS)”, IEEE 4th World Forum on Internet of Things, Singapore, Singapore, 5-8 February 2018, pp. 342-348.
[12] M. Bor and U. Roedig, “LoRa Transmission Parameter Selection”, 13th International Conference on Distributed Computing in Sensor Systems, Ottawa, ON, Canada, 5-7 June 2017, pp. 27-34.
[13] C. Pham, “Investigating and Experimenting CSMA Channel Access Mechanisms for LoRa IoT Networks”, IEEE Wireless Communications and Networking Conference, Barcelona, Spain, 15-18 April 2018, pp. 1-6.
30Copyright (c) IARIA, 2019. ISBN: 978-1-61208-730-6
SMART 2019 : The Eighth International Conference on Smart Cities, Systems, Devices and Technologies
39 / 46
[14] A. Pötsch and F. Haslhofer, “Practical Limitations for Deployment of LoRa Gateways”, IEEE International Workshop on Measurement and Networking, Naples, Italy, 27-29 September 2017, pp. 1-6.
[15] J. Mesquita, D. Guimaraes, C. Pereira, F. Santos and L. Almeida, “Assessing the ESP8266 WiFi module for the Internet of Things”, IEEE 23rd International Conference on Emerging Technologies and Factory Automation, Turin, Italy, 4-7 September 2018, pp. 784-791.
[16] F. Montori, R. Contigiani and L. Bedgoni, “Is WiFi suitable for energy efficient IoT deployments? A performance study”, IEEE 3rd International Forum on Research and Technologies for Society and Industry, Modena, Italy, 11-13 September 2017, pp. 1-5.
[17] G. D. Putra, A. R. Pratama, A. Lazovik and M. Aiello, “Comparison of Energy Consumption in WiFi and Bluetooth Communication in a Smart Building”, IEEE 7th Annual
Computing and Communication Workshop and Conference, Las Vegas, NV, USA, 9-11 January 2017, pp. 1-6.
[18] About International Telecommunication Union (ITU). Available at: https://www.itu.int/en/about/Pages/default.aspx. [Last accessed on July 3, 2019]
[19] Semtech, AN 120022, LoRa Modulation Basics, May, 2015. Available: https://www.semtech.com/uploads/documents/an1200.22.pdf [Last accessed on July 3, 2019]
[20] R. S. Sinha, Y. Wei and S. Hwang, “A survey on LPWA technology: LoRa and NB-IoT”, ICT Express, Vol. 3, No. 1, pp. 14-21, March 2017.
[21] Specifications of the Heltec WiFi LoRa 32. Available at https://heltec.org/project/wifi-lora-32/ [Last accessed on July 3, 2019]
31Copyright (c) IARIA, 2019. ISBN: 978-1-61208-730-6
SMART 2019 : The Eighth International Conference on Smart Cities, Systems, Devices and Technologies
40 / 46

Predicting Incidents of Crime through LSTM Neural Networks in Smart CityDomain
Ulises M. Ramirez-AlcocerFaculty of Engineering and Science
Autonomous University of TamaulipasVictoria, Tamaulipas, Mexico
email:[email protected]
Edgar Tello-LealFaculty of Engineering and Science
Autonomous University of TamaulipasVictoria, Tamaulipas, Mexico
email: [email protected]
Jonathan A. Mata-TorresReynosa-Rodhe Multidisciplinary UnitAutonomous University of Tamaulipas
Reynosa, Tamaulipas, Mexicoemail:
Abstract—Crimes are common social problems that affect thequality of life, economic growth and reputation of a country. Insmart cities, the aim is to reduce crime rates using Informationand Communication Technologies (ICT), specifically with theuse of Internet of Things (IoT) technology in combination withlegacy information systems, in order to obtain dataautomatically. In this paper, we propose an approach based ondeep learning for the classification of incidents of a crime ofpublic safety through predictive analysis. The predictive modelis based on a neural network Long Short-Term Memory(LSTM), trained with a small group of attributes, enabling theprediction of the class label in the validation stage, with a highpercentage of prediction accuracy. The proposed approach isevaluated through a big data set (real data) of type open data,which contains historical information about the crimes of asmart city.
Keywords-LSTM; Prediction; Neural Network; DataClassification; Smart City.
I. INTRODUCTION
Nowadays, smart city approaches are developed in orderto improve the economy, mobility, environment, people life,living standards, and governance of cities [1], supported bythe design, implementation, management, and monitoring ofprojects based on Information and CommunicationTechnologies (ICT). The main smart city characteristicsinclude sustainability, resilience, governance, enhancedquality of life and intelligent management of naturalresources and city facilities [2]. In this way, for thedevelopment of the services deployed in the complexsystems of intelligent cities, the Internet of Things (IoT)technologies have emerged as a new computationalparadigm.
The IoT consists of a large number of objects (physicaland virtual things) with pervasive sensing, detection,actuation, and computational capabilities, allowing thesedevices to generate, exchange, and consume data withminimal human intervention [3]. Contributions from theimplementation of IoT technologies can be found in smartcities, smart homes, e-health, smart grids, intelligenttransportation systems, crime prevention systems, andintelligent use of water, among others. The extensive use of
information systems (smart type) in various domains of thecity, as well as the use of smart devices in people’s daily life,have as a consequence the production of massive volumes ofdata [4], known as big data. These data are generated byhuman-to-human, human-to-machine, and machine-to-machine interactions. The big data volumes consist of amixture of complex data characterized by large and fast-growing data sets [2], which exceed the analysis capabilitiesof the current data management systems. Therefore, there arerequirements related to the acquisition and storage of data,the processing of information, and the development ofalgorithms for intelligent decision support systems. Inaddition, the monitoring, understanding, and analysis of thedata generated by the information systems using algorithmsbased on data mining and machine learning, can be used toadvance their contribution to the goals of sustainabledevelopment in a smart city [5]. The public safety data set ofsmart cities holds a large amount of crime data that could beexploited to discover patterns and predict future crime trends[6]. The predictive analysis aims to optimize the exploitationof these data in order to use knowledge discovery toanticipate criminal events [6] [7].
Deep learning techniques have demonstrated theircapability of the discriminative power compared with othermachine learning methods. Recurrent Neural Network(RNN) architecture has become a model of the deep learningtechniques most successfully implemented in differentdomains, due to its natural ability to process sequentialentries and to know their long-term dependencies [8]. Thatis, RNN is designed to utilize sequential information of inputdata with cyclic connections among building blocks. In theRNN, neurons are connected to each other in the samehidden layer and a training function is applied to the hiddenstates repeatedly [8]. The Long Short-Term Memory(LSTM) neural network is an extension of the RNN, whichhas achieved excellent performance in various tasks,especially for sequential problems [9]-[11]. Theimplementation of LSTM neural networks for the predictionof the class label (classification) from a set of instancesthrough predictive analysis can be considered an importantstrategy as a technique in the context of supervised machinelearning and data mining.
32Copyright (c) IARIA, 2019. ISBN: 978-1-61208-730-6
SMART 2019 : The Eighth International Conference on Smart Cities, Systems, Devices and Technologies
41 / 46
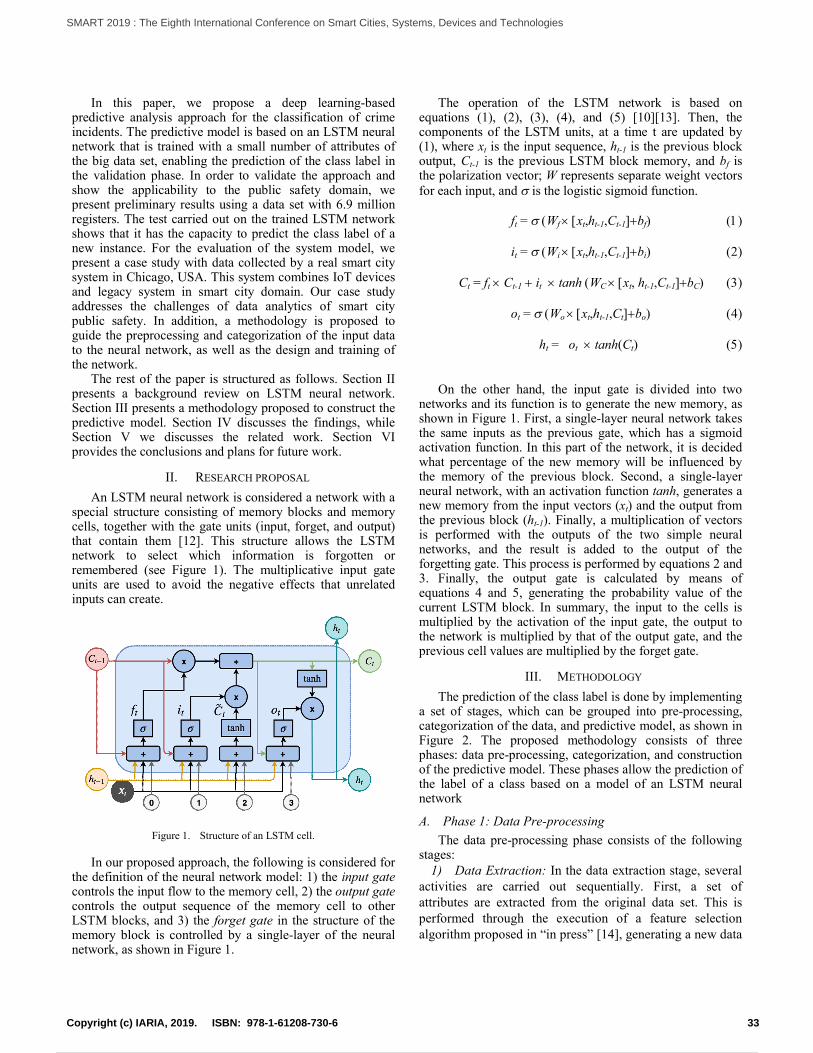
In this paper, we propose a deep learning-basedpredictive analysis approach for the classification of crimeincidents. The predictive model is based on an LSTM neuralnetwork that is trained with a small number of attributes ofthe big data set, enabling the prediction of the class label inthe validation phase. In order to validate the approach andshow the applicability to the public safety domain, wepresent preliminary results using a data set with 6.9 millionregisters. The test carried out on the trained LSTM networkshows that it has the capacity to predict the class label of anew instance. For the evaluation of the system model, wepresent a case study with data collected by a real smart citysystem in Chicago, USA. This system combines IoT devicesand legacy system in smart city domain. Our case studyaddresses the challenges of data analytics of smart citypublic safety. In addition, a methodology is proposed toguide the preprocessing and categorization of the input datato the neural network, as well as the design and training ofthe network.
The rest of the paper is structured as follows. Section IIpresents a background review on LSTM neural network.Section III presents a methodology proposed to construct thepredictive model. Section IV discusses the findings, whileSection V we discusses the related work. Section VIprovides the conclusions and plans for future work.
II. RESEARCH PROPOSAL
An LSTM neural network is considered a network with aspecial structure consisting of memory blocks and memorycells, together with the gate units (input, forget, and output)that contain them [12]. This structure allows the LSTMnetwork to select which information is forgotten orremembered (see Figure 1). The multiplicative input gateunits are used to avoid the negative effects that unrelatedinputs can create.
Figure 1. Structure of an LSTM cell.
In our proposed approach, the following is considered forthe definition of the neural network model: 1) the input gatecontrols the input flow to the memory cell, 2) the output gatecontrols the output sequence of the memory cell to otherLSTM blocks, and 3) the forget gate in the structure of thememory block is controlled by a single-layer of the neuralnetwork, as shown in Figure 1.
The operation of the LSTM network is based onequations (1), (2), (3), (4), and (5) [10][13]. Then, thecomponents of the LSTM units, at a time t are updated by(1), where xt is the input sequence, ht-1 is the previous blockoutput, Ct-1 is the previous LSTM block memory, and bf isthe polarization vector; W represents separate weight vectorsfor each input, and is the logistic sigmoid function.
ft = Wfxt,ht-1,Ct-1bf
it = Wixt,ht-1,Ct-1bi
Ct = ft Ct-1ittanh WCxt, ht-1,Ct-1bC
ot = Woxt,ht-1,Ctbo
ht = ottanh(Ct
On the other hand, the input gate is divided into twonetworks and its function is to generate the new memory, asshown in Figure 1. First, a single-layer neural network takesthe same inputs as the previous gate, which has a sigmoidactivation function. In this part of the network, it is decidedwhat percentage of the new memory will be influenced bythe memory of the previous block. Second, a single-layerneural network, with an activation function tanh, generates anew memory from the input vectors (xt) and the output fromthe previous block (ht-1). Finally, a multiplication of vectorsis performed with the outputs of the two simple neuralnetworks, and the result is added to the output of theforgetting gate. This process is performed by equations 2 and3. Finally, the output gate is calculated by means ofequations 4 and 5, generating the probability value of thecurrent LSTM block. In summary, the input to the cells ismultiplied by the activation of the input gate, the output tothe network is multiplied by that of the output gate, and theprevious cell values are multiplied by the forget gate.
III. METHODOLOGY
The prediction of the class label is done by implementinga set of stages, which can be grouped into pre-processing,categorization of the data, and predictive model, as shown inFigure 2. The proposed methodology consists of threephases: data pre-processing, categorization, and constructionof the predictive model. These phases allow the prediction ofthe label of a class based on a model of an LSTM neuralnetwork
A. Phase 1: Data Pre-processing
The data pre-processing phase consists of the followingstages:
1) Data Extraction: In the data extraction stage, severalactivities are carried out sequentially. First, a set ofattributes are extracted from the original data set. This isperformed through the execution of a feature selectionalgorithm proposed in “in press” [14], generating a new data
33Copyright (c) IARIA, 2019. ISBN: 978-1-61208-730-6
SMART 2019 : The Eighth International Conference on Smart Cities, Systems, Devices and Technologies
42 / 46
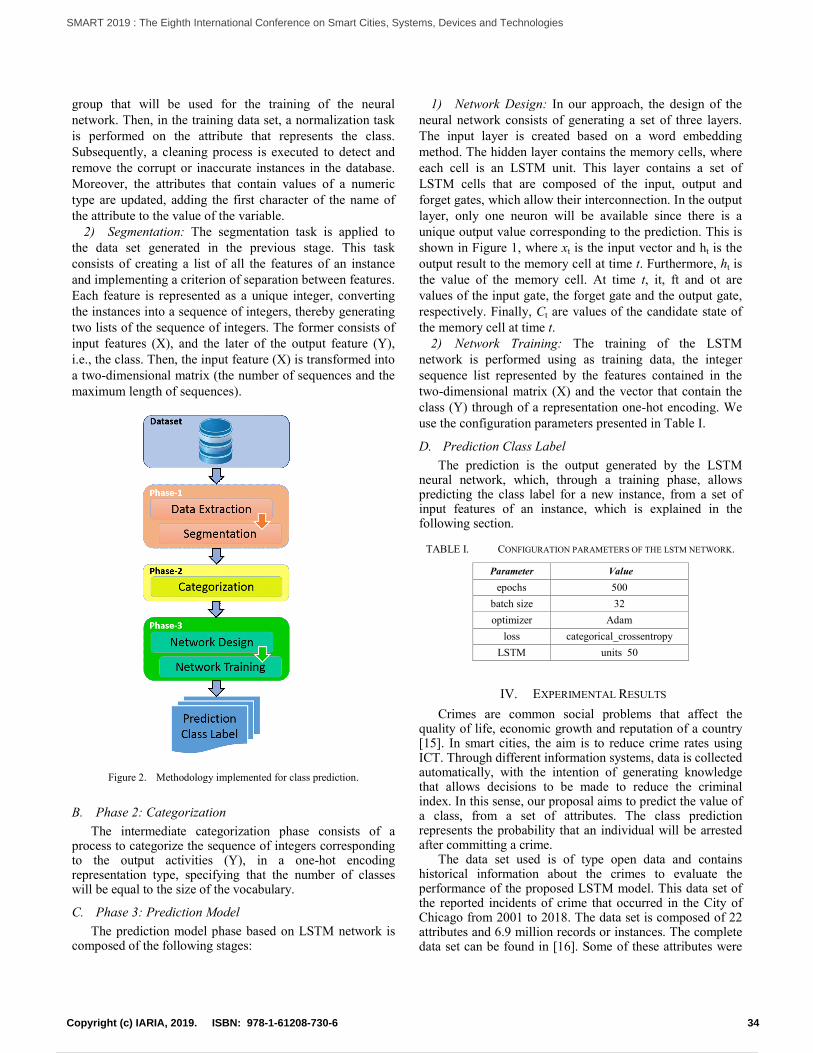
group that will be used for the training of the neuralnetwork. Then, in the training data set, a normalization taskis performed on the attribute that represents the class.Subsequently, a cleaning process is executed to detect andremove the corrupt or inaccurate instances in the database.Moreover, the attributes that contain values of a numerictype are updated, adding the first character of the name ofthe attribute to the value of the variable.
2) Segmentation: The segmentation task is applied tothe data set generated in the previous stage. This taskconsists of creating a list of all the features of an instanceand implementing a criterion of separation between features.Each feature is represented as a unique integer, convertingthe instances into a sequence of integers, thereby generatingtwo lists of the sequence of integers. The former consists ofinput features (X), and the later of the output feature (Y),i.e., the class. Then, the input feature (X) is transformed intoa two-dimensional matrix (the number of sequences and themaximum length of sequences).
Figure 2. Methodology implemented for class prediction.
B. Phase 2: Categorization
The intermediate categorization phase consists of aprocess to categorize the sequence of integers correspondingto the output activities (Y), in a one-hot encodingrepresentation type, specifying that the number of classeswill be equal to the size of the vocabulary.
C. Phase 3: Prediction Model
The prediction model phase based on LSTM network iscomposed of the following stages:
1) Network Design: In our approach, the design of theneural network consists of generating a set of three layers.The input layer is created based on a word embeddingmethod. The hidden layer contains the memory cells, whereeach cell is an LSTM unit. This layer contains a set ofLSTM cells that are composed of the input, output andforget gates, which allow their interconnection. In the outputlayer, only one neuron will be available since there is aunique output value corresponding to the prediction. This isshown in Figure 1, where xt is the input vector and ht is theoutput result to the memory cell at time t. Furthermore, ht isthe value of the memory cell. At time t, it, ft and ot arevalues of the input gate, the forget gate and the output gate,respectively. Finally, Ct are values of the candidate state ofthe memory cell at time t.
2) Network Training: The training of the LSTMnetwork is performed using as training data, the integersequence list represented by the features contained in thetwo-dimensional matrix (X) and the vector that contain theclass (Y) through of a representation one-hot encoding. Weuse the configuration parameters presented in Table I.
D. Prediction Class Label
The prediction is the output generated by the LSTMneural network, which, through a training phase, allowspredicting the class label for a new instance, from a set ofinput features of an instance, which is explained in thefollowing section.
TABLE I. CONFIGURATION PARAMETERS OF THE LSTM NETWORK.
Parameter Value
epochs 500
batch size 32
optimizer Adam
loss categorical_crossentropy
LSTM units 50
IV. EXPERIMENTAL RESULTS
Crimes are common social problems that affect thequality of life, economic growth and reputation of a country[15]. In smart cities, the aim is to reduce crime rates usingICT. Through different information systems, data is collectedautomatically, with the intention of generating knowledgethat allows decisions to be made to reduce the criminalindex. In this sense, our proposal aims to predict the value ofa class, from a set of attributes. The class predictionrepresents the probability that an individual will be arrestedafter committing a crime.
The data set used is of type open data and containshistorical information about the crimes to evaluate theperformance of the proposed LSTM model. This data set ofthe reported incidents of crime that occurred in the City ofChicago from 2001 to 2018. The data set is composed of 22attributes and 6.9 million records or instances. The completedata set can be found in [16]. Some of these attributes were
34Copyright (c) IARIA, 2019. ISBN: 978-1-61208-730-6
SMART 2019 : The Eighth International Conference on Smart Cities, Systems, Devices and Technologies
43 / 46

generated automatically by IoT devices, such as x-coordinate, y-coordinate, latitude, longitude, location. Theattributes can be of data type: string, numeric, date, locationor Boolean. The data is extracted from the Chicago PoliceDepartment’s CLEAR (Citizen Law Enforcement Analysisand Reporting) system. The data set contains data fromarrests, including data on Illinois Uniform Crime Reporting(IUCR), location description, domestic, date, ward, FederalBureau of Investigation (FBI) code and more data fields. Anextract from the data set is shown in Table II.
TABLE II. EXCERPT OF THE INCIDENTS OF CRIME DATA.
ID UICR District WardCom.Area
FBICode
50 479 001d 4w 32c 04B51 820 019d 44w 6c 652 820 008d 18w 70c 653 326 006d 6w 69c 354 031A 025d 31w 19c 355 041A 007d 20w 68c 04B56 1752 010d 12w 30c 1757 1750 003d 5w 43c 08B58 630 019d 2w 7c 559 553 022d 19w 74c 04A60 650 010d 24w 29c 561 1320 009d 15w 61c 1462 550 004d 7w 43c 04A63 1562 006d 21w 71c 1764 041A 017d 35w 14c 04B65 1130 018d 42w 8c 1166 5001 022d 19w 72c 2667 1195 025d 29w 25c 1168 1154 008d 13w 62c 1169 1153 018d 43w 7c 1170 620 018d 42w 8c 5
The feature selected to predict the label class are: UICR(Illinois Uniform Crime Reporting), District, Ward, Com.Area, and FBI Code. Table III shows a complete descriptionof the attributes and the number of cases that were identifiedwithin the data set. The class to predict is a Boolean type,that is, arrest = false or arrest = true.
TABLE III. DESCRIPTION OF THE FEATURES SELECTED OF THE DATA
SET.
Feature Description # cases
UICRIllinois Uniform Crime Reporting (IUCR)codes are four-digit codes that law enforcementagencies use to classify criminal incidents.
350
DistrictIndicates the police district where the incidentoccurred.
25
WardThe ward (City Council district) where theincident occurred.
50
Com.Area
Indicates the community area where theincident occurred.
77
FBICode
Indicates the crime classification as outlined inthe FBI’s National Incident-Based ReportingSystem (NIBRS).
26
ArrestBinary variable that indicates whether acriminal was arrested.
2
In our experiment, training data sets with 80% of theobservations of the original data set are used to train our
model. Instances of the training data set were selected by arandom method, automatically. The remaining 20% of theinstances are used to test our model prediction accuracy.
Table IV presents an extract of the results obtained in theprediction of the LSTM network using the crime data setpresented before. In the column “Input Features”, it ismentioned the group of the features used as a new input inthe LSTM network for the prediction stage. The values of the“Input Features” column are formed by the IUCR code,district and ward id’s, as well as the identifier of thecommunity area and the FBI code. The “Target Class” is theexpected label for the corresponding input instance, that is,the class label with the highest probability of prediction bythe neural network, based on the weights of each class label.Each row in the table shows a case of prediction of the classfrom the input one. The “Output Class” column presents thelabel or value that the LSTM neural network predicted fromthe input instance for the “arrest” class.
In the column “% of prediction” (see Table IV), theprobability of prediction for each instance is shown. It can beobserved that, in some cases, the neural network fails topredict the class (for example 3, 7, and 18). However, inmost cases, the neural network has a correct prediction of thevalue of the expected class. The global percentage of theprediction accuracy of the LSTM network for the completedata set is 0.87.
TABLE IV. AN EXTRACT OF THE PREDICTION FROM THE LSTM.
# Input FeaturesTargetClass
OutputClass
% ofprediction
1 0265, 011d, 28w, 29c, 02 false false 0.822 0620, 025d, 31w, 22c, 05 false false 0.973 0560, 005d, 34w, 53c, 08A true false 0.774 0430, 018d, 2w, 8c, 04B false false 0.905 0312, 010d, 28w, 31c, 03 false false 0.996 1754, 008d, 18w, 66c, 02 true true 0.507 0860, 018d, 27w, 8c, 06 true false 0.538 0281, 018d, 2w, 8c, 02 false false 0.999 1130, 012d, 11w, 28c, 11 false false 0.99
10 2825, 006d, 8w, 44c, 26 false false 0.9911 0890, 001d, 3w, 35c, 06 false false 0.9912 1153, 006d, 21w, 71c, 11 false false 0.9913 0910, 011d, 28w, 27c, 07 false false 0.9114 1150, 008d, 23w, 56c, 11 false false 0.9915 1120, 001d, 42w, 32c, 10 false false 0.9916 0890, 018d, 2w, 8c, 06 false false 0.9917 1150, 001d, 4w, 32c, 11 false false 0.9718 1330, 005d, 9w, 53c, 26 false true 0.7919 0281, 003d, 20w, 69c, 02 false false 0.9920 1153, 025d, 37w, 23c, 11 false false 0.9921 0560, 010d, 24w, 29c, 08A false false 0.8422 0820, 024d, 49w, 1c, 06 false false 0.9523 0110, 015d, 28w, 25c, 01A false false 0.8824 1150, 019d, 32w, 6c, 11 false false 0.9925 1130, 020d, 48w, 77c, 11 false false 0.9926 0486, 011d, 28w, 26c, 08B true false 0.7727 0454, 004d, 8w, 46c, 08B false false 0.5528 1752, 009d, 15w, 61c, 17 false false 0.9929 0454, 004d, 7w, 51c, 08B true true 0.9930 0454, 025d, 37w, 25c, 08B true true 0.9731 0281, 008d, 22w, 56c, 02 true false 0.6532 0910, 012d, 25w, 28c, 07 false false 0.82
35Copyright (c) IARIA, 2019. ISBN: 978-1-61208-730-6
SMART 2019 : The Eighth International Conference on Smart Cities, Systems, Devices and Technologies
44 / 46

33 1562, 003d, 7w, 43c, 17 true true 0.9734 1562, 025d, 36w, 19c, 17 true false 0.8635 0860, 001d, 25w, 28c, 06 false false 0.6136 0484, 012d, 27w, 28c, 08B false false 0.5437 0430, 008d, 17w, 66c, 04B false false 0.9438 1477, 014d, 26w, 24c, 15 true true 0.7739 1752, 007d, 16w, 67c, 17 false false 0.5440 0325, 025d, 36w, 19c, 03 false false 0.9941 0610, 025d, 31w, 19c, 05 true false 0.8242 0281, 008d, 17w, 66c, 02 false false 0.9843 1752, 006d, 17w, 44c, 17 false false 0.7644 0281, 018d, 42w, 8c, 02 false false 0.9945 1153, 018d, 42w, 8c, 11 false false 0.9546 0820, 016d, 41w, 9c, 06 false false 0.9847 1130, 012d, 28w, 28c, 11 false false 0.9948 1153, 008d, 14w, 63c, 11 false false 0.9949 1750, 022d, 34w, 75c, 08B false false 0.9850 0820, 019d, 44w, 6c, 06 true false 0.90
The LSTM network is trained using an optimizationprocess that requires a loss function to calculate the modelerror. The loss function allows to faithfully summarize allaspects of the model down into a single number in such away that improvements in that number depict a better model.Figure 3 visualizes the loss function and Figure 4 presentsthe accuracy of the training and validation data for the finalmodel. The final LSTM model achieves an average lossfunction of 0.0376 on the validation data and a validationpredictive accuracy of 0.87. Figure 4 shows the learningcurves, exhibiting how the model learned and suitably fit thetraining data set. These results align with the loss functionwe obtained on the testing data, which means our final modelgeneralizes well on new data.
Figure 3. Loss function in training and validation phases by epoch.
V. RELATED WORK
Crime as a problem has both spatial and temporaldimensions. The work by Catlett et al. [17] explores the useof spatial analysis and auto-regressive models toautomatically detect high-risk crime regions in urban areasand to reliably forecast crime trends in each region. Thealgorithm result is a spatio-temporal crime forecastingmodel, composed of a set of crime-dense regions withassociated crime predictors, each one representing apredictive model for estimating the number of crimes likely
to occur in its associated region. Also, in [18], the authorspropose the use of deep learning for the prediction of hourlycrime rates. In particular, their model is used in spatio-temporal problems, like crime forecasting. They detectedthat future crime rates depend on the trend set in theprevious week, the time of day and the nearby events, bothin space and in time. For each one of these contributingfactors, they use a separate model that offers a predictionbased on indicators of a weekly period, a daily period andan hourly period, respectively. The outputs of the 3 modelsare combined to form a common prediction.
Figure 4. Accuracy in training and validation phases by epoch.
In [19], a system for the visual analysis ofmultidimensional data on the macroscopic and microscopiclevels to show trajectories of crime based on their spatialand temporal characteristics is presented. The systemincorporates a novel algorithm for the crime trajectorysegmentation and uses LSTM network, generatingtrajectories from heterogeneous data sources, such as opendata and social media, with the aim to report incidents ofcrime. In [20], a neural network structure for crimeprediction and the appropriate inputs for crime predictionare performed through Gram-Schmidt orthogonalization forthe selection of network inputs and Virtual Leave-One-Outtest (VLOO) for the selection of the optimal number ofhidden neurons. Spatio-temporal distribution of the hot-spots is conducted and a methodology is developed forshort-term crime forecasting using the LSTM.
In [21], a context-aware attention framework ispresented based on LSTM to accurately predict the amountof unrest events news. The social event prediction modelconsists of three parts: 1) the LSTM encoder, to get thehidden representation of the input sequence, 2) the attentionlayer, to automatically learn the weights of the hiddenrepresentations, and 3) the context-aware fully connectedlayer used to combine near historical target data and theweighted representation vectors. In [22], a crime predictionframework based on deep neural network that uncoversdynamic crime patterns and carefully explores the evolvinginter-dependencies between crimes and other ubiquitousdata in urban space was developed. The model enablespredicting crime occurrences of different categories in each
36Copyright (c) IARIA, 2019. ISBN: 978-1-61208-730-6
SMART 2019 : The Eighth International Conference on Smart Cities, Systems, Devices and Technologies
45 / 46
region of a city, embedding all spatial, temporal, andcategorical signals into hidden representation vectors.
VI. CONCLUSION
The advances in Information and CommunicationsTechnologies and the excessive use of smart devices haveproduced a massive generation of data. This way, IoTtechnologies and their implementation on the smart citieshave caused a growing need for data analysis and big dataanalytics.
This paper investigated the effectiveness of LSTM neuralnetworks based deep learning approach for predicting thefuture class labels of a crime incidents instance. To evaluatethe predictive performance of our method, we use a data setthat collects the historical information of crime indices in asmart city. These data are generated, in most cases, by IoTdevices and managed by an information system of the policedepartment. Before applying the LSTM model, we used apre-processing and categorization of the data. Next, wedesigned and trained a neural network model in order toselect the model that presents the best performance. Thisprocess is described by the proposed methodology, whichguides the process of preparing input data for the LSTMneural network and its implementation.
From the original data set, 80% of the instances wereused for the training stage of our model, and the remaining20% for the validation stage of the model. The instancesused in the training stage were selected by a random methodautomatically. Our deep learning approach achieves highperformance in the final model with 87.84% accuracy basedon the validation data. Furthermore, the final LSTM modelachieves an average loss function of 0.0376 on validationdata, using 20% of the data set for the testing stage.
The research objective was to examine the feasibility andimpact of applying the proposed approach to classprediction. The experimental results suggest that theproposed method achieves good results on a big data set.
ACKNOWLEDGMENT
This work was supported by the National Council ofScience and Technology (CONACYT) and Basic ScienceResearch Project SEP-CONACYT of Mexico under Grant256922.
REFERENCES
[1] C. Lim, K.-J. Kim, and P. P. Maglio, “Smart cities with big data:Reference models, challenges, and considerations,” Cities, vol. 82,2018, pp. 86 – 99. [Online]https://doi.org/10.1016/j.cities.2018.04.011 [retrieved: June, 2019].
[2] E. Al Nuaimi, H. Al Neyadi, N. Mohamed, and J. Al-Jaroodi,“Applications of big data to smart cities,” Journal of Internet Servicesand Applications, vol. 6, no. 1, Dec 2015, p. 25. [Online]https://doi.org/10.1186/s13174-015-0041-5 [retrieved: June, 2019].
[3] C. M. Sosa-Reyna, E. Tello-Leal, and D. Lara-Alabazares,“Methodology for the model-driven development of service orientediot applications,” Journal of Systems Architecture, vol. 90, 2018, pp.15 – 22.
[4] I. A. T. Hashem et al., “The role of big data in smart city,”International Journal of Information Management, vol. 36, no. 5,2016, pp. 748 – 758.
[5] S. E. Bibri and J. Krogstie, “The core enabling technologies of bigdata analytics and context-aware computing for smart sustainablecities: a review and synthesis,” Journal of Big Data, vol. 4, no. 1, Nov2017, p. 38. [Online] https://doi.org/10.1186/s40537-017-0091-6[retrieved: May, 2019].
[6] A. Rummens, W. Hardyns, and L. Pauwels, “The use of predictiveanalysis in spatiotemporal crime forecasting: Building and testing amodel in an urban context,” Applied Geography, vol. 86, 2017, pp.255– 261.
[7] L. Vomfell, W. K. Hrdle, and S. Lessmann, “Improving crime countforecasts using twitter and taxi data,” Decision Support Systems, vol.113, 2018, pp. 73 – 85.
[8] W. Xia et al., “Novel architecture for long short-term memory used inquestion classification,” Neurocomputing, vol. 299, 2018, pp. 20–31.
[9] Y. Li and H. Cao, “Prediction for tourism flow based on lstm neuralnetwork,” Procedia Computer Science, vol. 129, 2018, pp. 277–283.[Online] https://doi.org/10.1016/j.procs.2018.03.076 [retrieved: May,2019].
[10] B. Cortez, B. Carrera, Y.-J. Kim, and J.-Y. Jung, “An architecture foremergency event prediction using lstm recurrent neural networks,”Expert Systems with Applications, vol. 97, 2018, pp. 315 – 324.
[11] C. Badii, P. Nesi, and I. Paoli, “Predicting available parking slots oncritical and regular services by exploiting a range of open data,” IEEEAccess, vol. 6, 2018, pp. 44059–44071. [Online]https://doi.org/10.1109/ACCESS.2018.2864157 [retrieved: May,2019].
[12] S. Haim, S. Andrew, and B. Franoise, “Long short-term memoryrecurrent neural network architectures for large scale acousticmodeling,” in 15th Annual Conference of the International SpeechCommunication Association, September 2014, pp. 338–342.
[13] S. Hochreiter and J. Schmidhuber, “Long short-term memory,”Neural computation, vol. 9, no. 8, 1997, pp. 1735–1780.
[14] J.A. Mata-Torres, E. Tello-Leal, U.M. Ramirez-Alcocer, and G.Romero-Galvan, “A novel feature selection method based on aclustering algorithm,” Proc. 9th International Conference on Advancesin Information Mining and Management (IMMM 2019) , in press.
[15] C. Kadar and I. Pletikosa, “Mining large-scale human mobility datafor long-term crime prediction,” EPJ Data Science, vol. 7, no. 1, Jul2018, p. 26.
[16] Chicago Police Department, “Reported Crime - Public Safetydataset,” [Online] https://data.cityofchicago.org/Public-Safety/Crimes-2001-topresent/ijzp-q8t2/data [retrieved: May, 2019].
[17] C. Catlett, E. Cesario, D. Talia, and A. Vinci, “Spatio-temporal crimepredictions in smart cities: A data-driven approach and experiments,”Pervasive and Mobile Computing, vol. 53, 2019, pp. 62-74. [Online]https://doi.org/10.1016/j.pmcj.2019.01.003 [retrieved: May, 2019].
[18] B. Wang et al., “Deep Learning for Real Time Crime Forecasting,”arXiv Numerical Analysis, pp- 1-4, 2017. [Online] arXiv:1707.03340[retrieved: May, 2019].
[19] A. Morshed et al., “VisCrimePredict: a system for crime trajectoryprediction and visualisation from heterogeneous data sources,” inProc. 34th ACM/SIGAPP Symposium on Applied Computing(SAC19). ACM, 2019, pp. 1099-1106.https://doi.org/10.1145/3297280.3297388
[20] Z. M. Wawrzyniak et al., “Data-driven models in machine learningfor crime prediction,” in Proc. 26th International Conference onSystems Engineering (ICSEng), 2018, pp. 1-8. doi:10.1109/ICSENG.2018.8638230
[21] W. Xiuling et al., “Unrest News Amount Prediction with Context-Aware Attention LSTM”, in Proc. Trends in Artificial Intelligence(PRICAI 2018), Springer, 2018", pp. 369-377.
[22] C. Huang, J. Zhang, Y. Zheng, and N. V. Chawla, “DeepCrime:Attentive Hierarchical Recurrent Networks for Crime Prediction,” inProc. 27th ACM International Conference on Information andKnowledge Management (CIKM '18). ACM, 2018, pp. 1423-1432.https://doi.org/10.1145/3269206.327179
37Copyright (c) IARIA, 2019. ISBN: 978-1-61208-730-6
SMART 2019 : The Eighth International Conference on Smart Cities, Systems, Devices and Technologies
Powered by TCPDF (www.tcpdf.org)
46 / 46


![Augmenting Smart Object Interactions with Smart AudioVertegaal. 2003. eyecook: A gaze and speech enabled attentive cookbook. Video Proceedings of Ubiquitous Computing (2003). [7] Jeffrey](https://static.fdocuments.net/doc/165x107/5f70248739abd50076639217/augmenting-smart-object-interactions-with-smart-vertegaal-2003-eyecook-a-gaze.jpg)


