SMAM stock market outlook monthly · Japanese stock market is expected to move in an ... Diffusion...
19
Japanese Stock Market Outlook SMAM monthly comments & views - February 2018 -
-
Upload
truongdieu -
Category
Documents
-
view
218 -
download
3
Transcript of SMAM stock market outlook monthly · Japanese stock market is expected to move in an ... Diffusion...
Japanese Stock Market Outlook
SMAM monthly comments & views - February 2018 -
Japanese Economy SMAM upgraded GDP growth forecast for FY2017 from 1.8 % to 2.0% on the back of recent strong economic readings. Forecast for FY2018 and FY2019 was also raised from 1.1% to 1.4% and 0.7% to 0.8% respectively. • BOJ slightly raised its assessment of inflationary environment and outlook in the latest announcement made after a
Monetary Policy Committee Meeting ended on January 23rd. BOJ said, current inflation is “around 1%” rather than “in the latter half between 0 and 1%”. Inflationary expectation is “keeping the same level” rather than “on a little weak tone”.
• Japanese people are feeling better as latest economy watcher survey showed. Favorable job opportunity is one of the supporting factors behind this good sentiment. If significant wage increase is achieved on the back of tight labor market and robust corporate earnings, virtuous cycle with higher inflation could be ignited.
Japanese Stock Markets Japanese stock market is expected to move in an upward trend supported by robust corporate earnings, especially manufacturing companies, and favorable demand & supply condition after TOPIX broke a resistance level around 1800 lasted for 26 years. Major risk factors could be conflicts surrounding North Korea after PyeongChan Winter Olympic Games. • Net money flow via investment trust funds is worth watching for a long-term effect. Tax exempt accumulation savings
scheme for individuals began in January 2018. Individuals are eligible for tax exemption for 20 years on profits earned on accumulating investments via approved investment trust funds up to 400 thousands yen per year.
• Major risks will be such as geo-political risks and unexpectedly hawkish monetary policy by central banks.
Executive summary
1
Notes: Macro and market views are as of Jan. 19th 2018, and subject to updates thereafter without notice.
Outlook for Japanese Economy
2
3
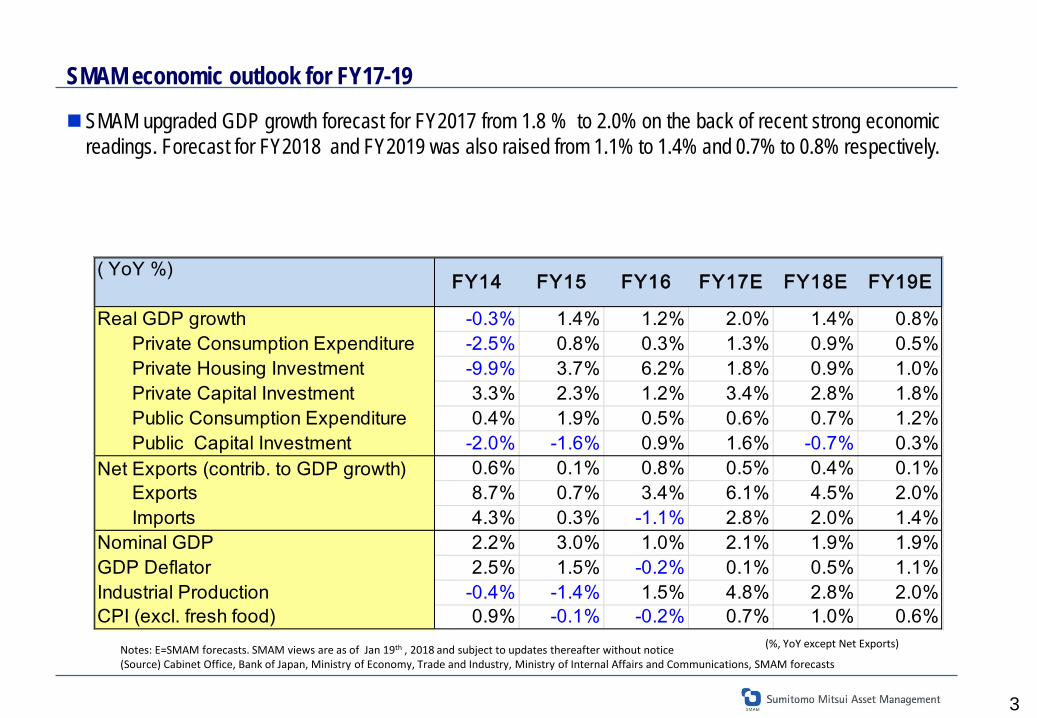
SMAM upgraded GDP growth forecast for FY2017 from 1.8 % to 2.0% on the back of recent strong economic readings. Forecast for FY2018 and FY2019 was also raised from 1.1% to 1.4% and 0.7% to 0.8% respectively.
Notes: E=SMAM forecasts. SMAM views are as of Jan 19th , 2018 and subject to updates thereafter without notice (Source) Cabinet Office, Bank of Japan, Ministry of Economy, Trade and Industry, Ministry of Internal Affairs and Communications, SMAM forecasts
(%, YoY except Net Exports)
SMAM economic outlook for FY17-19
( YoY %)
Real GDP growth -0.3% 1.4% 1.2% 2.0% 1.4% 0.8% Private Consumption Expenditure -2.5% 0.8% 0.3% 1.3% 0.9% 0.5% Private Housing Investment -9.9% 3.7% 6.2% 1.8% 0.9% 1.0% Private Capital Investment 3.3% 2.3% 1.2% 3.4% 2.8% 1.8% Public Consumption Expenditure 0.4% 1.9% 0.5% 0.6% 0.7% 1.2% Public Capital Investment -2.0% -1.6% 0.9% 1.6% -0.7% 0.3%Net Exports (contrib. to GDP growth) 0.6% 0.1% 0.8% 0.5% 0.4% 0.1% Exports 8.7% 0.7% 3.4% 6.1% 4.5% 2.0% Imports 4.3% 0.3% -1.1% 2.8% 2.0% 1.4%Nominal GDP 2.2% 3.0% 1.0% 2.1% 1.9% 1.9%GDP Deflator 2.5% 1.5% -0.2% 0.1% 0.5% 1.1%Industrial Production -0.4% -1.4% 1.5% 4.8% 2.8% 2.0%CPI (excl. fresh food) 0.9% -0.1% -0.2% 0.7% 1.0% 0.6%
FY17E FY19EFY14 FY15 FY16 FY18E
4
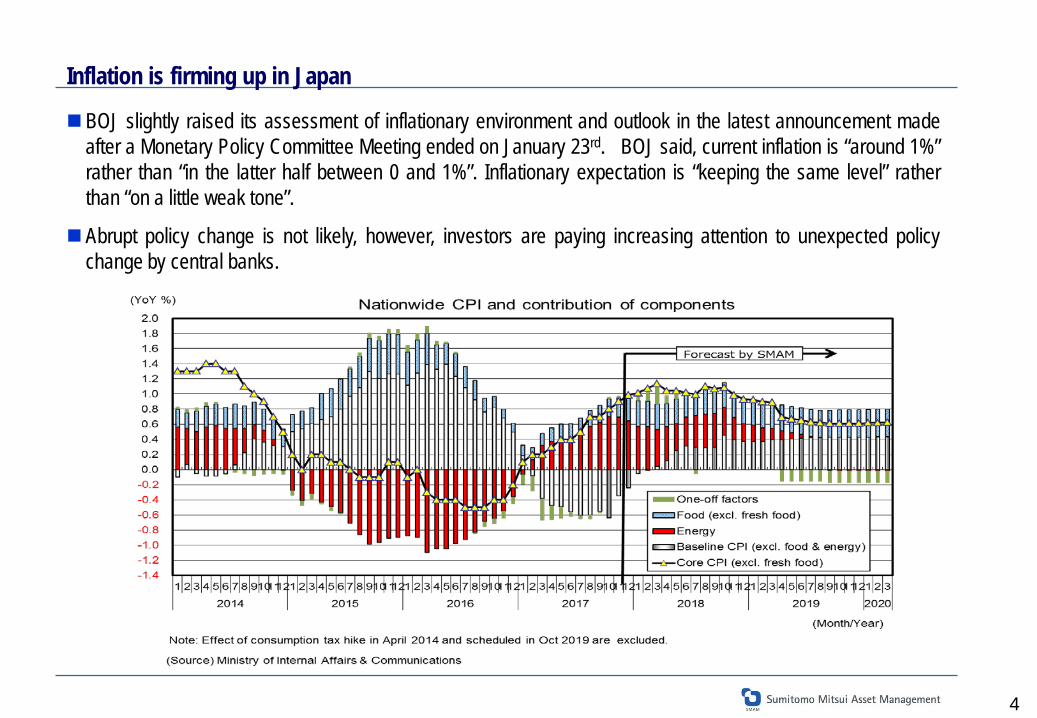
BOJ slightly raised its assessment of inflationary environment and outlook in the latest announcement made after a Monetary Policy Committee Meeting ended on January 23rd. BOJ said, current inflation is “around 1%” rather than “in the latter half between 0 and 1%”. Inflationary expectation is “keeping the same level” rather than “on a little weak tone”.
Abrupt policy change is not likely, however, investors are paying increasing attention to unexpected policy change by central banks.
Inflation is firming up in Japan
Export volume to Asia
3000
3200
3400
3600
3800
4000
4200
2010
2011
2012
2013
2014
2015
2016
2017
(Year)
Export volume to China
800
1000
1200
1400
1600
2010
2011
2012
2013
2014
2015
2016
2017 (Year)
Export volume to US
600
750
900
1050
1200
1350
1500
2010
2011
2012
2013
2014
2015
2016
2017 (Year)
Total export volume (seasonally adjusted, yen billion)
5400
5600
5800
6000
6200
6400
6600
6800
7000
7200
7400
2010
2011
2012
2013
2014
2015
2016
2017 (Year)
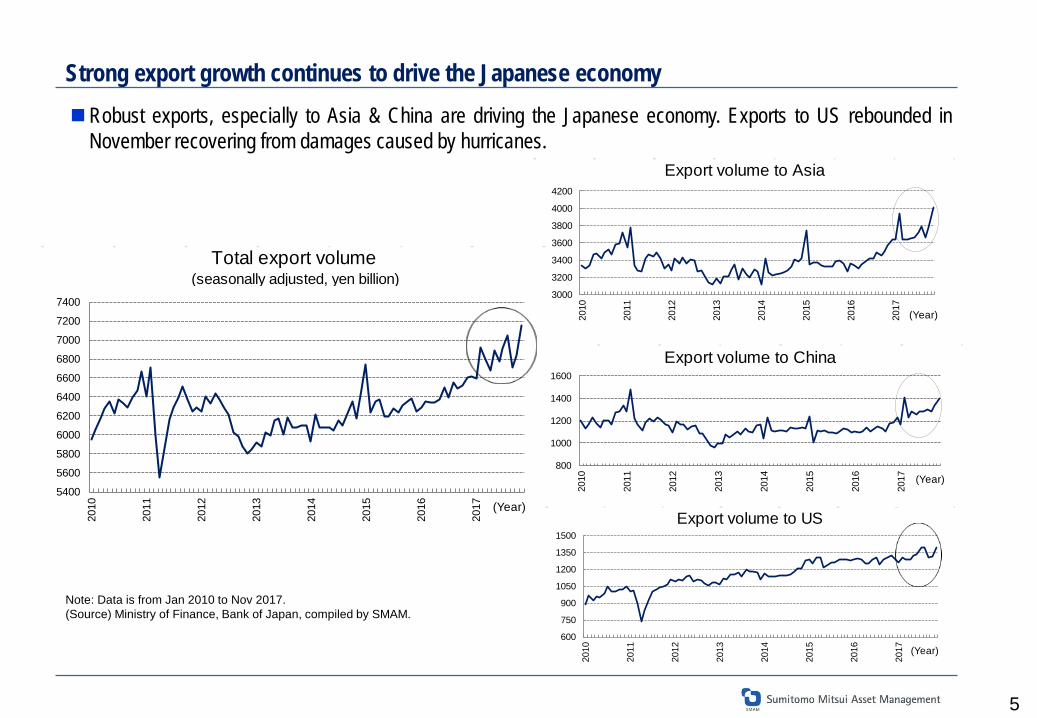
Strong export growth continues to drive the Japanese economy Robust exports, especially to Asia & China are driving the Japanese economy. Exports to US rebounded in
November recovering from damages caused by hurricanes.
5
Note: Data is from Jan 2010 to Nov 2017. (Source) Ministry of Finance, Bank of Japan, compiled by SMAM.
6
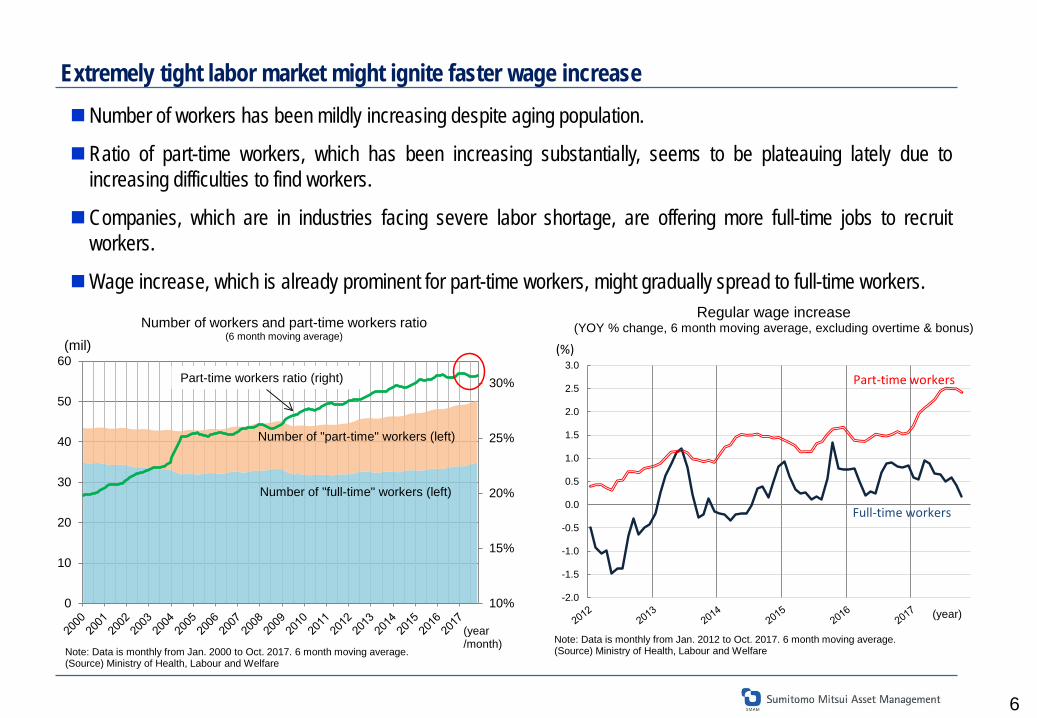
Extremely tight labor market might ignite faster wage increase Number of workers has been mildly increasing despite aging population.
Ratio of part-time workers, which has been increasing substantially, seems to be plateauing lately due to increasing difficulties to find workers.
Companies, which are in industries facing severe labor shortage, are offering more full-time jobs to recruit workers.
Wage increase, which is already prominent for part-time workers, might gradually spread to full-time workers.
-2.0
-1.5
-1.0
-0.5
0.0
0.5
1.0
1.5
2.0
2.5
3.0
Regular wage increase (YOY % change, 6 month moving average, excluding overtime & bonus)
Part-time workers
Full-time workers
(%)
Note: Data is monthly from Jan. 2012 to Oct. 2017. 6 month moving average.(Source) Ministry of Health, Labour and Welfare
(year)10%
15%
20%
25%
30%
0
10
20
30
40
50
60Part-time workers ratio (right)
Number of "part-time" workers (left)
Number of "full-time" workers (left)
(mil)Number of workers and part-time workers ratio
(6 month moving average)
Note: Data is monthly from Jan. 2000 to Oct. 2017. 6 month moving average.(Source) Ministry of Health, Labour and Welfare
(year/month)
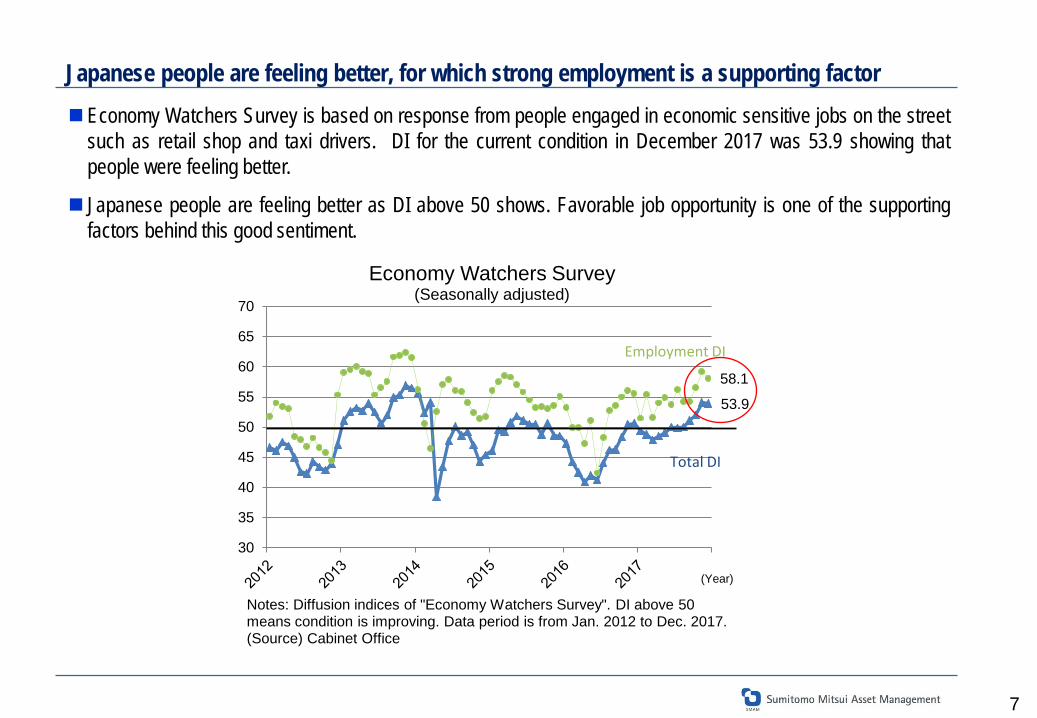
53.9
58.1
30
35
40
45
50
55
60
65
70
Economy Watchers Survey(Seasonally adjusted)
(Year)
Notes: Diffusion indices of "Economy Watchers Survey". DI above 50 means condition is improving. Data period is from Jan. 2012 to Dec. 2017.(Source) Cabinet Office
Employment DI
Total DI
Japanese people are feeling better, for which strong employment is a supporting factor Economy Watchers Survey is based on response from people engaged in economic sensitive jobs on the street
such as retail shop and taxi drivers. DI for the current condition in December 2017 was 53.9 showing that people were feeling better.
Japanese people are feeling better as DI above 50 shows. Favorable job opportunity is one of the supporting factors behind this good sentiment.
7
8
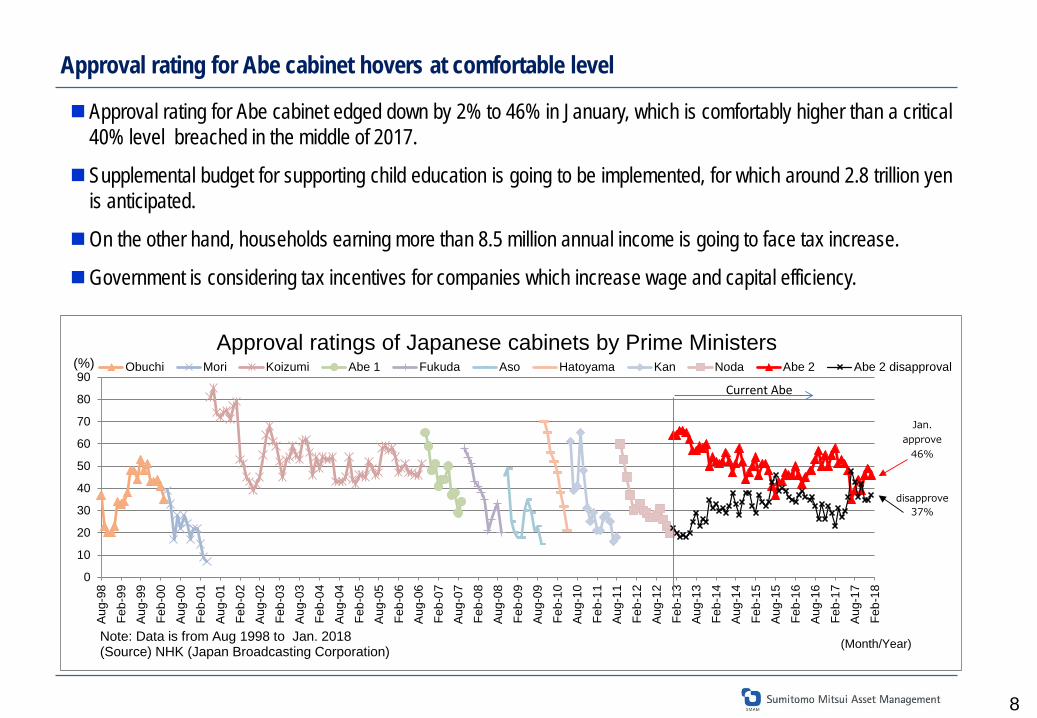
Approval rating for Abe cabinet hovers at comfortable level
Approval rating for Abe cabinet edged down by 2% to 46% in January, which is comfortably higher than a critical 40% level breached in the middle of 2017.
Supplemental budget for supporting child education is going to be implemented, for which around 2.8 trillion yen is anticipated.
On the other hand, households earning more than 8.5 million annual income is going to face tax increase.
Government is considering tax incentives for companies which increase wage and capital efficiency.
0
10
20
30
40
50
60
70
80
90
Aug
-98
Feb-
99A
ug-9
9Fe
b-00
Aug
-00
Feb-
01A
ug-0
1Fe
b-02
Aug
-02
Feb-
03A
ug-0
3Fe
b-04
Aug
-04
Feb-
05A
ug-0
5Fe
b-06
Aug
-06
Feb-
07A
ug-0
7Fe
b-08
Aug
-08
Feb-
09A
ug-0
9Fe
b-10
Aug
-10
Feb-
11A
ug-1
1Fe
b-12
Aug
-12
Feb-
13A
ug-1
3Fe
b-14
Aug
-14
Feb-
15A
ug-1
5Fe
b-16
Aug
-16
Feb-
17A
ug-1
7Fe
b-18
Obuchi Mori Koizumi Abe 1 Fukuda Aso Hatoyama Kan Noda Abe 2 Abe 2 disapproval
Approval ratings of Japanese cabinets by Prime Ministers(%)
Note: Data is from Aug 1998 to Jan. 2018(Source) NHK (Japan Broadcasting Corporation)
Jan.approve
46%
disapprove37%
Current Abe
(Month/Year)
9
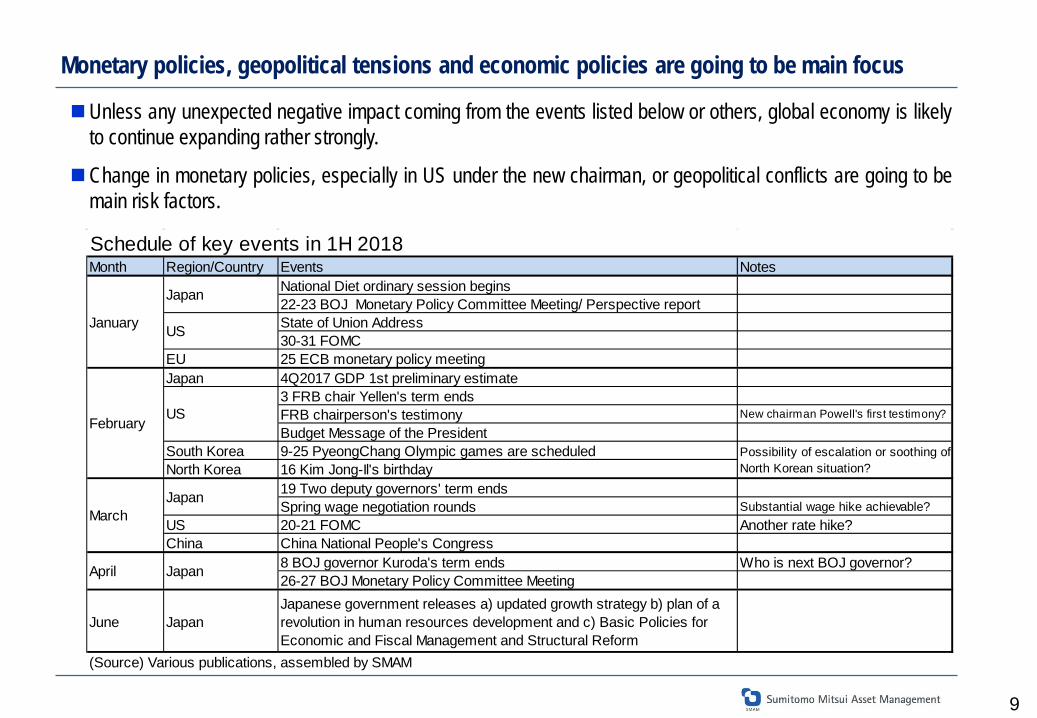
Monetary policies, geopolitical tensions and economic policies are going to be main focus
Unless any unexpected negative impact coming from the events listed below or others, global economy is likely to continue expanding rather strongly.
Change in monetary policies, especially in US under the new chairman, or geopolitical conflicts are going to be main risk factors.
Schedule of key events in 1H 2018Month Region/Country Events Notes
National Diet ordinary session begins22-23 BOJ Monetary Policy Committee Meeting/ Perspective reportState of Union Address30-31 FOMC
EU 25 ECB monetary policy meetingJapan 4Q2017 GDP 1st preliminary estimate
3 FRB chair Yellen's term ends FRB chairperson's testimony New chairman Powell's first testimony?
Budget Message of the PresidentSouth Korea 9-25 PyeongChang Olympic games are scheduledNorth Korea 16 Kim Jong-Il's birthday
19 Two deputy governors' term ends Spring wage negotiation rounds Substantial wage hike achievable?
US 20-21 FOMC Another rate hike?China China National People's Congress
8 BOJ governor Kuroda's term ends Who is next BOJ governor?26-27 BOJ Monetary Policy Committee Meeting
June JapanJapanese government releases a) updated growth strategy b) plan of arevolution in human resources development and c) Basic Policies forEconomic and Fiscal Management and Structural Reform
(Source) Various publications, assembled by SMAM
JapanMarch
April Japan
USJanuary
US
Possibility of escalation or soothing ofNorth Korean situation?
February
Japan
Outlook for Japanese Stock Markets
10
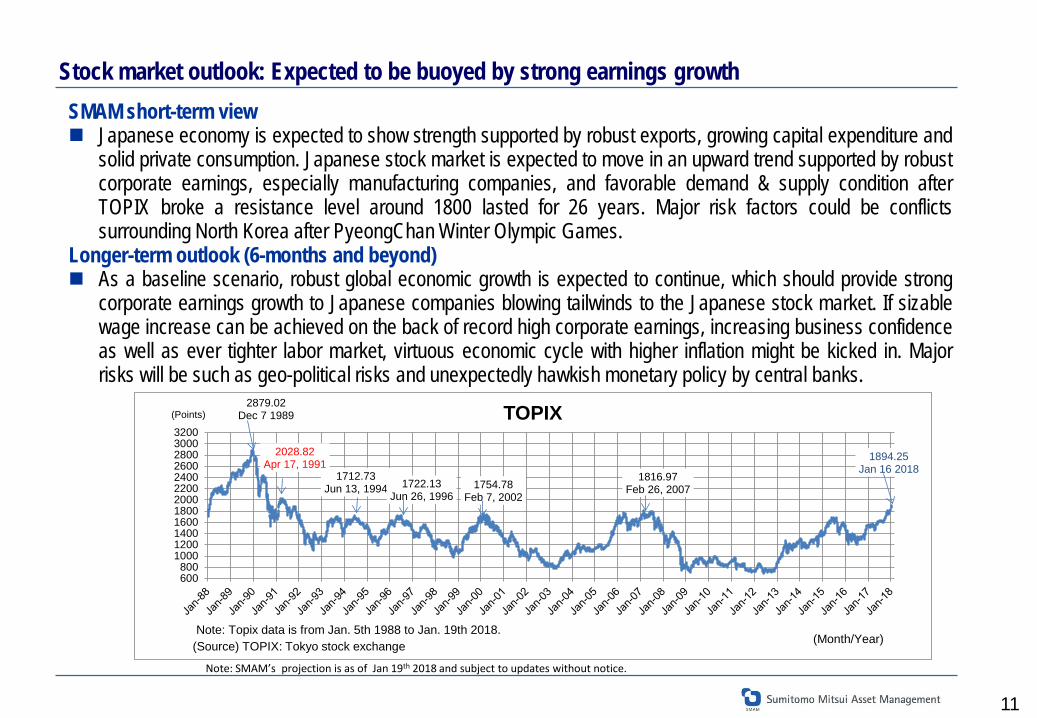
Stock market outlook: Expected to be buoyed by strong earnings growth SMAM short-term view Japanese economy is expected to show strength supported by robust exports, growing capital expenditure and
solid private consumption. Japanese stock market is expected to move in an upward trend supported by robust corporate earnings, especially manufacturing companies, and favorable demand & supply condition after TOPIX broke a resistance level around 1800 lasted for 26 years. Major risk factors could be conflicts surrounding North Korea after PyeongChan Winter Olympic Games.
Longer-term outlook (6-months and beyond) As a baseline scenario, robust global economic growth is expected to continue, which should provide strong
corporate earnings growth to Japanese companies blowing tailwinds to the Japanese stock market. If sizable wage increase can be achieved on the back of record high corporate earnings, increasing business confidence as well as ever tighter labor market, virtuous economic cycle with higher inflation might be kicked in. Major risks will be such as geo-political risks and unexpectedly hawkish monetary policy by central banks.
11
Note: SMAM’s projection is as of Jan 19th 2018 and subject to updates without notice.
2879.02Dec 7 1989
2028.82Apr 17, 1991
1712.73Jun 13, 1994 1722.13
Jun 26, 19961754.78
Feb 7, 2002
1816.97Feb 26, 2007
1894.25Jan 16 2018
600800
100012001400160018002000220024002600280030003200
TOPIX
(Source) TOPIX: Tokyo stock exchange
(Points)
(Month/Year)Note: Topix data is from Jan. 5th 1988 to Jan. 19th 2018.
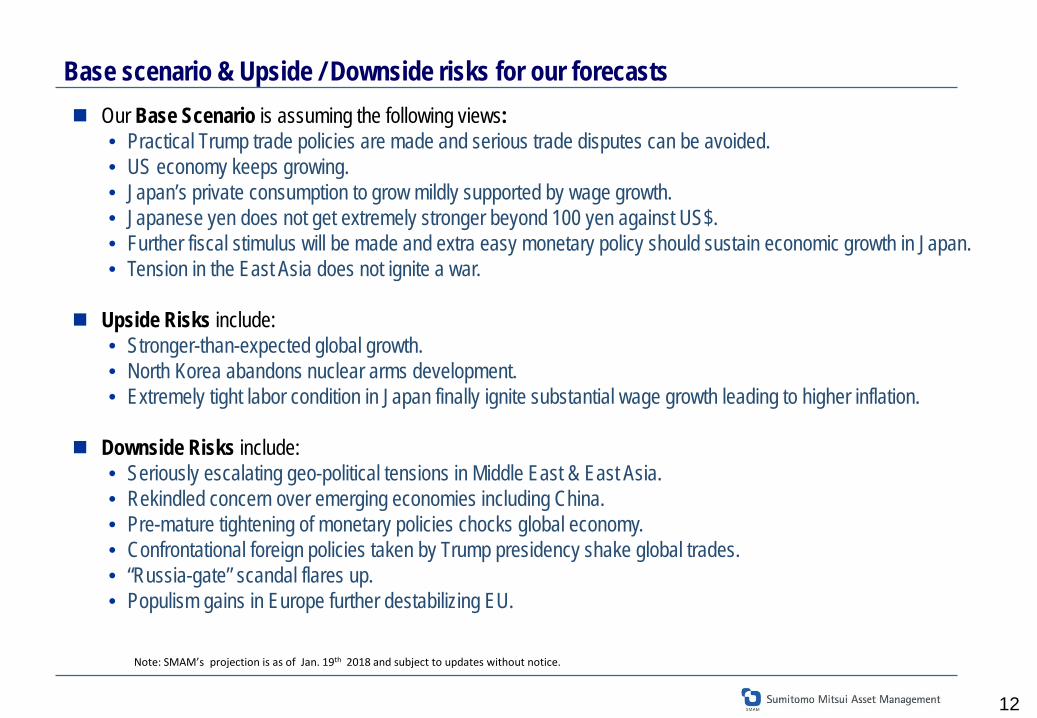
Base scenario & Upside / Downside risks for our forecasts Our Base Scenario is assuming the following views:
• Practical Trump trade policies are made and serious trade disputes can be avoided. • US economy keeps growing. • Japan’s private consumption to grow mildly supported by wage growth. • Japanese yen does not get extremely stronger beyond 100 yen against US$. • Further fiscal stimulus will be made and extra easy monetary policy should sustain economic growth in Japan. • Tension in the East Asia does not ignite a war.
Upside Risks include: • Stronger-than-expected global growth. • North Korea abandons nuclear arms development. • Extremely tight labor condition in Japan finally ignite substantial wage growth leading to higher inflation.
Downside Risks include: • Seriously escalating geo-political tensions in Middle East & East Asia. • Rekindled concern over emerging economies including China. • Pre-mature tightening of monetary policies chocks global economy. • Confrontational foreign policies taken by Trump presidency shake global trades. • “Russia-gate” scandal flares up. • Populism gains in Europe further destabilizing EU.
12
Note: SMAM’s projection is as of Jan. 19th 2018 and subject to updates without notice.
13
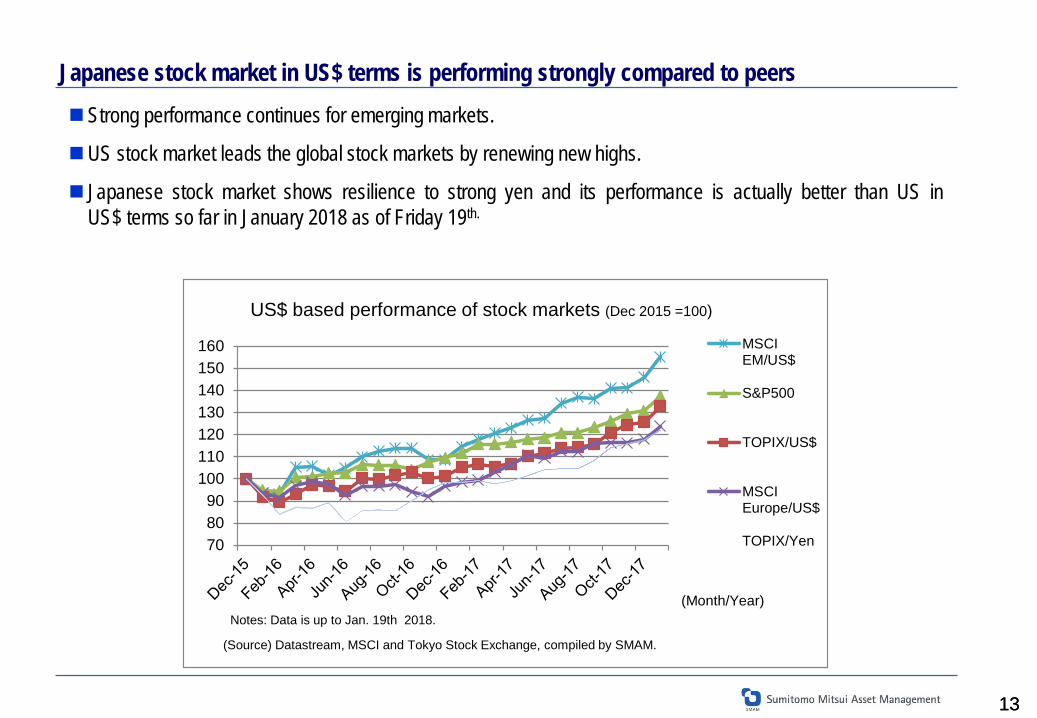
Japanese stock market in US$ terms is performing strongly compared to peers
13
Strong performance continues for emerging markets.
US stock market leads the global stock markets by renewing new highs.
Japanese stock market shows resilience to strong yen and its performance is actually better than US in US$ terms so far in January 2018 as of Friday 19th.
708090
100110120130140150160 MSCI
EM/US$
S&P500
TOPIX/US$
MSCIEurope/US$
TOPIX/Yen
US$ based performance of stock markets (Dec 2015 =100)
(Source) Datastream, MSCI and Tokyo Stock Exchange, compiled by SMAM.
Notes: Data is up to Jan. 19th 2018.(Month/Year)
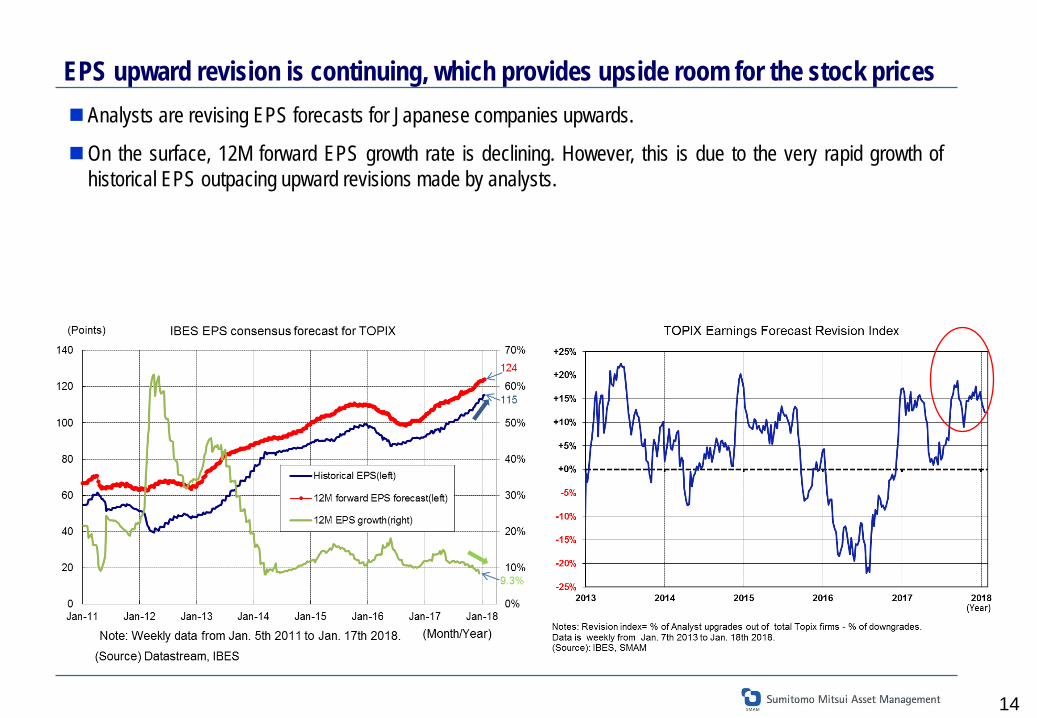
EPS upward revision is continuing, which provides upside room for the stock prices
14
Analysts are revising EPS forecasts for Japanese companies upwards.
On the surface, 12M forward EPS growth rate is declining. However, this is due to the very rapid growth of historical EPS outpacing upward revisions made by analysts.
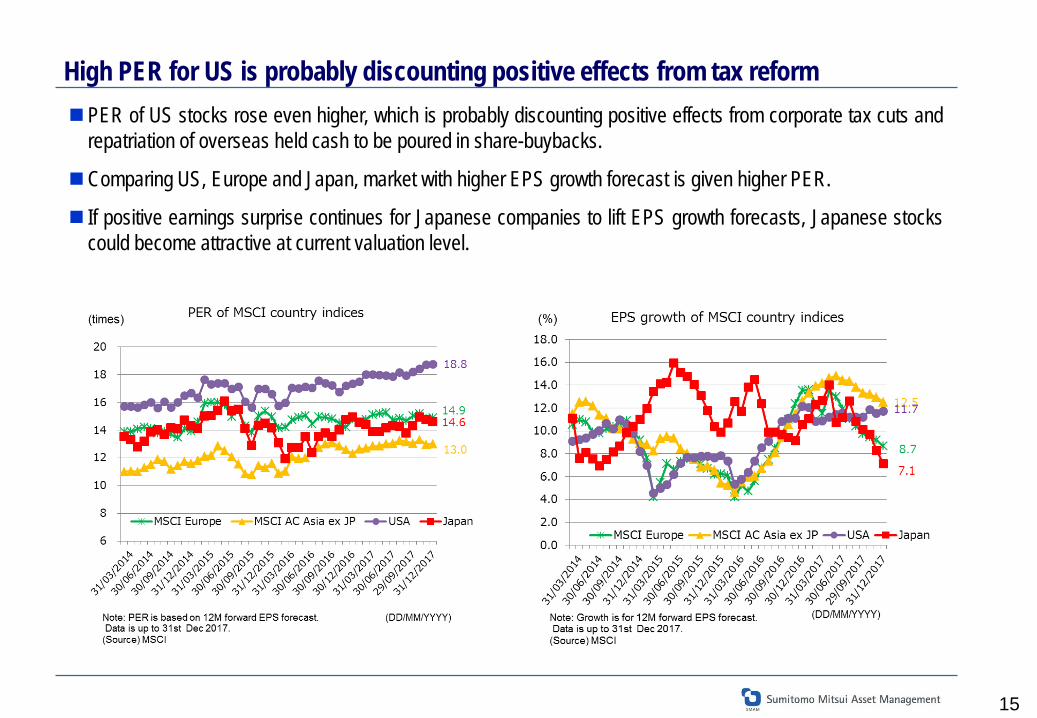
High PER for US is probably discounting positive effects from tax reform
15
PER of US stocks rose even higher, which is probably discounting positive effects from corporate tax cuts and repatriation of overseas held cash to be poured in share-buybacks.
Comparing US, Europe and Japan, market with higher EPS growth forecast is given higher PER.
If positive earnings surprise continues for Japanese companies to lift EPS growth forecasts, Japanese stocks could become attractive at current valuation level.
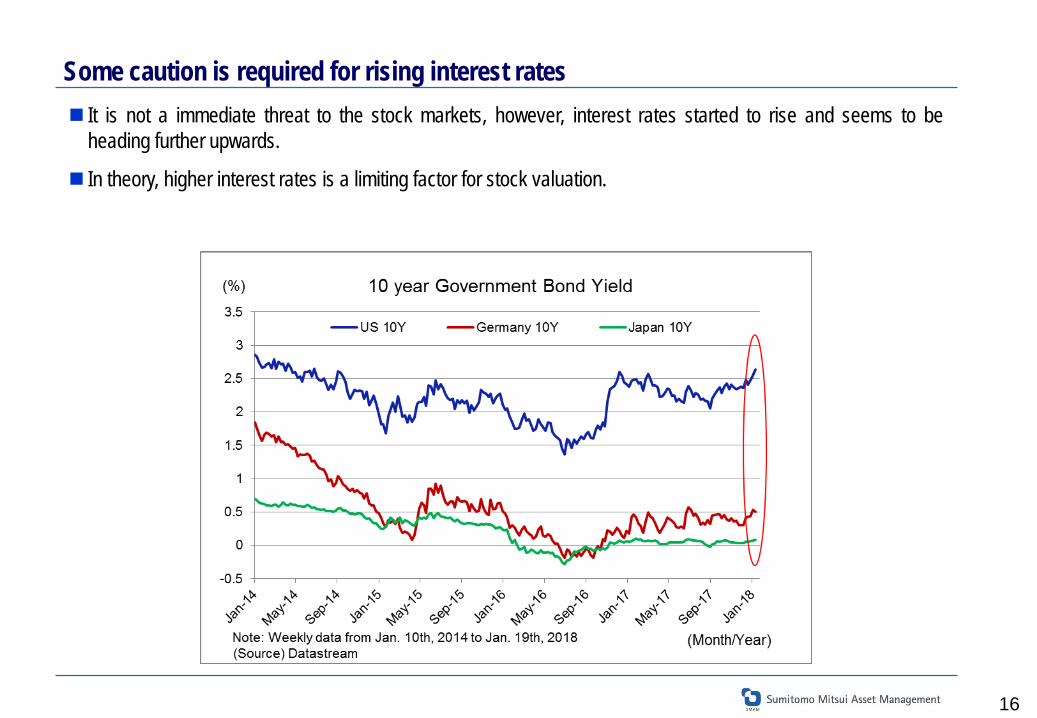
Some caution is required for rising interest rates
16
It is not a immediate threat to the stock markets, however, interest rates started to rise and seems to be heading further upwards.
In theory, higher interest rates is a limiting factor for stock valuation.
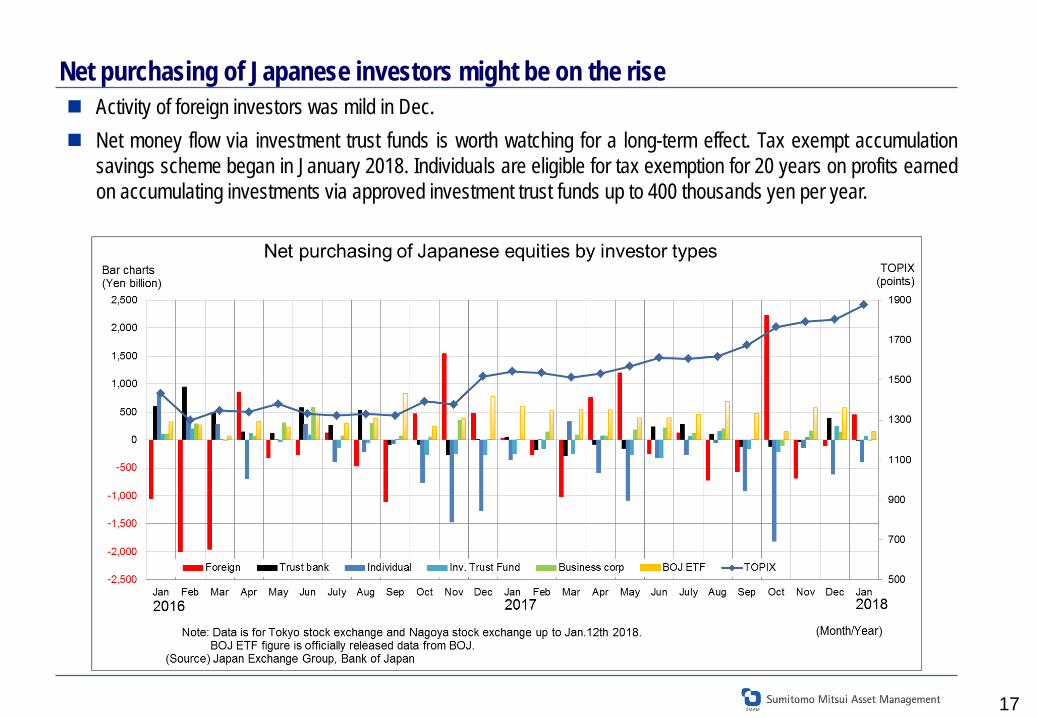
Net purchasing of Japanese investors might be on the rise Activity of foreign investors was mild in Dec. Net money flow via investment trust funds is worth watching for a long-term effect. Tax exempt accumulation
savings scheme began in January 2018. Individuals are eligible for tax exemption for 20 years on profits earned on accumulating investments via approved investment trust funds up to 400 thousands yen per year.
17
18
Disclaimer
Please read this disclaimer carefully. This material is for non-Japanese institutional investors only. The research and analysis included in this report, and those opinions or judgments as outcomes thereof, are intended to introduce or
demonstrate capabilities and expertise of Sumitomo Mitsui Asset Management Company, Ltd. (hereinafter “SMAM”), or to provide information on investment strategies and opportunities. Therefore this material is not intended to offer or solicit investments, provide investment advice or service, or to be considered as disclosure documents under the Financial Instruments and Exchange Law of Japan.
The expected returns or risks in this report are calculated based upon historical data and/or estimated upon the economic outlook at present, and should be construed no warrant of future returns and risks.
Past performance is not necessarily indicative of future results. The simulated data or returns in this report besides the fund historical returns do not include/reflect any investment management fees,
transaction costs, or re-balancing costs, etc. The investment products or strategies do not guarantee future results nor guarantee the principal of investments. The investments may suffer
losses and the results of investments, including such losses, belong to the client. The recipient of this report must make its own independent decisions regarding investments. The opinions, outlooks and estimates in this report do not guarantee future trends or results. They constitute SMAM’s judgment as of the date of
this material and are subject to change without notice. The awards included in this report are based on past achievements and do not guarantee future results. The intellectual property and all rights of the benchmarks/indices belong to the publisher and the authorized entities/individuals. This material has been prepared by obtaining data from sources which are believed to be reliable but SMAM can not and does not guarantee its
completeness or accuracy. All rights, titles and interests in this material and any content contained herein are the exclusive properties of SMAM, except as otherwise stated.
It is strictly prohibited from using this material for investments, reproducing/copying this material without SMAM’s authorization, or from disclosing this material to a third party.
Registered Number: Kanto Local Finance Bureau (KINSHO) No.399 Member of Japan Investment Advisers Association, The Investment Trusts Association, Japan and Type Ⅱ Financial Instruments Firms Association © Sumitomo Mitsui Asset Management Company, Limited